Abstract
This paper proposes and investigates a novel multilevel thin-walled energy-absorbing structure. The proposed design demonstrates superior energy absorption capability compared to conventional single-stage structures through its additional energy-absorbing mechanism that activates after the initial peak force. Based on the Super Folding Element (SFE) theory, we derive theoretical calculation expressions to characterize the structure’s behavior. Dynamic impact experiments validate the theoretical model. Furthermore, we introduce an innovative allowable criterion for structural optimization and implement multi-objective crashworthiness optimization to identify the optimal configuration. The optimization results exhibit remarkable consistency with both numerical simulations and theoretical predictions, confirming the effectiveness of our approach.
1. Introduction
Thin-walled structures have been widely applied in vehicle crashworthiness components [1,2] to absorb impact energy because of their high lightweight efficiency. There are numerous studies [3,4,5], concerning the energy absorption characteristics of thin-walled structures under various loading conditions via theoretical, experimental, and numerical approaches. Square tube is one of the most common thin-walled structure [6]. The deformation mechanism of square tubes under axial compression is primarily governed by the behavior of their corner-folding elements. These structural components typically exhibit two distinct progressive collapse modes [7]: an extensional mode, characterized by significant material stretching, and an inextensional mode, dominated by bending deformation without substantial mid-surface extension. A mixed mode, combining features of both, may also occur depending on geometric and material conditions. Crashing analysis and multi-objective optimization for thin-walled structures with functionally graded thickness were performed by Sun et al. [4]. Song [8] studied the windowed tubes under oblique impact loading and proposed a new method for the design of obliquely loaded tubes. G.M. Nagel [9,10] systematically investigated the energy absorption characteristics of straight versus tapered thin-walled rectangular tubes under both quasi-static and dynamic axial impact conditions. The study examined the influence of key parameters, including wall thickness, taper angle, number of tapered sides, impact mass, and impact velocity, on the structural response.
There are many researchers studying the theoretical expression about thin-walled structures. The Super Folding Element (SFE) theory is the most widely used by researchers, proposed by Wierzbicki and Abramowicz [11]. Wierzbicki and Abramowicz [11,12] concluded that the number of corner elements in tubular cross-sections significantly influences energy absorption efficiency, which motivated subsequent research on thin-walled multi-cell tubular structures. Chen et al. [13] developed a simplified super folding element (SFE) theory to analyze the axial crushing behavior of multi-cell columns, including single-, double-, and triple-cell configurations. The theoretical predictions demonstrated good agreement with numerical simulation results. Zhang [14] studied square tubes with various thicknesses under axial impact loading and proposed two theoretical methods to predict the mean crushing force of the corner elements with nonuniform wall thickness.
To seek the optimal parameters of thin-walled structures, optimization techniques have been applied to the crashworthiness design. Surrogate modeling techniques, such as the response surface method (RSM), are often used to establish the relationship between design objectives and optimal parameters. The design objectives in these crashworthiness optimizations usually include the specific energy absorption (SEA, absorbed energy per unit structural mass) and the peak crushing force (PCF). To address these competing objectives, the multi-objective optimization design (MOD) method has been widely adopted in crashworthiness design. Jusuf et al. [15] conducted a comprehensive numerical and experimental investigation comparing the energy absorption performance of various multi-cell column configurations against single- and double-walled counterparts under dynamic axial crushing. Subsequently, they implemented structural optimization based on their findings. A. Baroutaji et al. [16] studied quasi-static response and multi-objective crashworthiness optimization of oblong tubes under lateral loading.
Despite the extensive research on thin-walled energy absorbers, there remains a lack of unified optimization criteria applicable to multilevel geometries. In this paper, multilevel thin-walled structures under axial dynamic impact tests were performed. Meanwhile, theoretical expression of the multilevel thin-walled structure was proposed. In the end, an optimization design with the allowable criterion was performed to maximize the energy absorption. The optimization result well coincides with the numerical simulation result and the theoretical prediction result.
2. Methods
2.1. Crashworthiness Indicator
To evaluate the crashworthiness of structures, it is essential to define the crashworthiness indicator. Among all the crashworthiness indicators, energy absorption (EA) has been widely used to evaluate the energy absorption capabilities of thin-walled structures; it can be calculated as follows [4]:
where P(x) is the instantaneous crushing force and l denotes the crushing displacement.
To evaluate energy-absorbing efficiency, the specific energy absorption (SEA) is defined as energy absorbed per unit mass of structure, as formulated below [17]:
where m is the total mass of multilevel thin-walled structure, and EA is the total absorbed energy during crushing process.
Meanwhile, the mean crushing force
is also defined as another crashworthiness indicator. Mean crushing force can be formulated as follows:
where l is the crushing displacement of tubes at a specific time.
The crash load efficiency (CLE) [18]: can be calculated as the ratio of the mean crushing force
to the peak crushing force
.
Higher CLE means high energy-absorbing ability.
In addition, initial peak crushing force () also can evaluate the energy-absorbing characteristics.
2.2. Optimization Criterion
In mechanical design or engineering design, the mechanical parts are always subjected to greater stress. It is necessary to determine the standard in advance to judge whether the stress of the part is too high or too low.
This design concept is a reference for the crashworthiness optimization in this paper. Thin-walled tubes are always used in passenger cars to absorb collision energy. To verify the safety of the passenger car, manufacturers will be more inclined to pass the New Car Assessment Program (NCAP). NCAP has contributed greatly reducing accidental tolls and has been implemented in several countries or markets, for instance, USA, Europe, China, Japan, and Australia. NCAP has a variety of crash tests, including front, side, and pole impacts, and impacts with pedestrians. The testing criterion is based on the injury of the dummy during the crash test. The injured parts include head, neck, chest, stomach, and so on. The injury criterion is not more than the allowable value in general. Engineering is essential to optimize the structures and safety features to reduce the dummy’s injury value.
Based on this concept, if crashworthiness design for all parts is performed, that is to say, all parts have their crashworthiness criterion, respectively, and none of them should exceed the criterion during the dynamic impact process. It could confirm that the injury value of the dummy is lower than the injury criterion. This paper proposes a new criterion for thin-walled tubes from crashworthiness. Obviously, the initial peak crushing force () is one of the most important factors in collision progress. The crushing force could transfer the force to the passenger. The larger the initial peak force, the larger force transfer to the passenger. So it should be lower than the allowable value.
where
is the allowable initial peak crushing force.
Similarly, a higher crash load efficiency (CLE) value indicates higher capacity of energy absorption. CLE should lower than the allowable value [CLE]. So, the allowable
is defined to judge the structure’s energy absorption ability.
where
is the allowable crash load efficiency.
Lightweight structure is another important factor for designers. Higher SEA means it could absorb more energy in the same weight condition. Similarly, the allowable
is defined as follows:
where is the allowable specific energy absorption.
2.3. Theoretics
The structure considered in this paper is a multilevel concentric thin-walled tube. The model is shown in Figure 1, where L and D denote the total length and width of the tube, respectively. The single tube for the multilevel tube could be a square tube, a circle tube, or another cross-sectional tube. For simplicity, the single tube in this paper is a square tube.
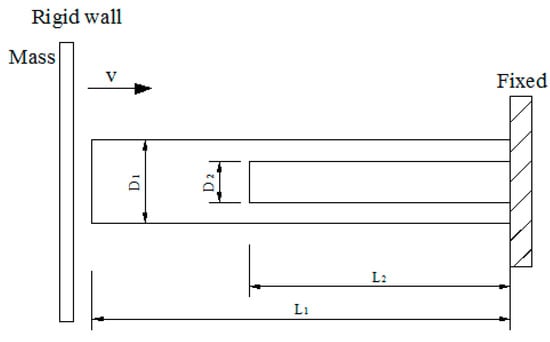
Figure 1.
Geometry of multilevel thin-walled structure.
2.3.1. Theoretical Prediction of Square Tube
Super folding element theory was proposed by Wierzbicki and Abramowicz [11] to analyze the meaning of the crushing force of thin-walled structures. Under the axial compression, collapse deformation of thin-walled square tube is shown in Figure 2. The tube was discretized into a series of large-angle folding elements, named super folding element; the deformation mode is shown in Figure 3.
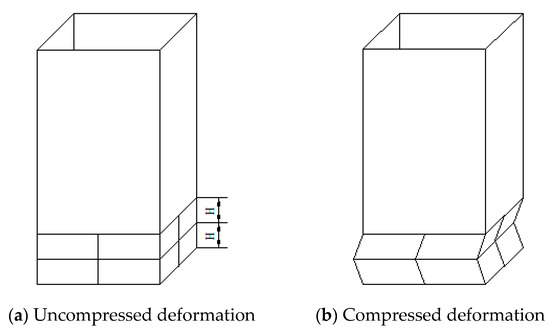
Figure 2.
Deformation of square tube under axial compression.

Figure 3.
Deformation model of Super Folding Element.
According to the law of conservation of energy, to a super folding element, it has the following:
where is the mean crushing force, 2H is the length of folding and is the dissipation energy of plastic deformation in the process of folding.
Meanwhile, the dissipation energy includes three parts [11] as follows:
, respectively, is the plastic energy of extensional deformation in the toroidal region, rolling at moving plastic hinge lines and bending along stationary hinge lines, as shown in Figure 4. Substituting [11] into Equation (10), we obtain the following:
where , are known and depend on the type of problem, t is the thickness, r is the radius of the toroidal surface and d is the width.
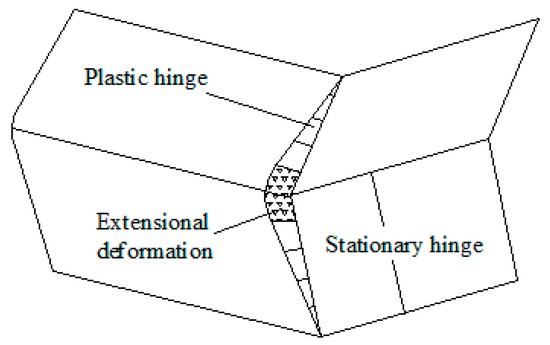
Figure 4.
Plastic deformation area of the Super Folding Element.
In the process of compression, the structure will be deformed in the easiest way so that the structure will deform with the minimum of the axial compression force.
The mean force can be determined on the condition of the following:
Then,
Substituting Equations (12) and (13) into Equation (10), we obtain the following:
For a square tube with the width is d and the wall thickness is t, the mean force [11] under axial compression is as follows:
where is the flow stress of material, which is calculated as follows [19]:
where is the yield strength and is the ultimate strength of the material and n is the strain hardening exponent.
In fact, in the compression process, the flange of the folding element is not completely flattened. That is to say, the available crushing distance is less than 2H [11]. The effective crushing distance coefficient is taken as 0.73. So, the expression is as follows:
2.3.2. Theoretical Prediction of Multilevel Thin-Walled Structures
Although the mean crushing force of a single square tube has been studied by various researchers, there is still no theoretical expression for the mean force of a multilevel thin-walled square tube in the open literature. For the prediction of the meaning force of a multilevel thin-walled tube, the distance difference in the length direction between two tubes has to be considered. The distance difference must be considered in the theoretical expression of mean force.
For the first level, the second tube is not compressed and the first is compressed, the first meaning crushing force is as follows:
And for the second level, two tubes are all compressed, the theoretical expression of meaning force is introduced below.
Because the mean force of tubes can be obtained from Equation (3), so the expression could translate into the following:
Substituting Equation (17) into Equation (20), under quasi-static loading the final expression of meaning crushing force for multilevel thin-walled square tube is as follows:
2.3.3. Dynamic Theoretical Prediction of Multilevel Thin-Walled Structures
The theoretical solution for mean crushing force was originally developed for multilevel tubes under quasi-static loading conditions. However, these analytical expressions neglected dynamic crushing effects. For dynamic loading scenarios, theoretical solutions must account for dynamic amplification effects, including both inertial and strain rate effects. Notably, AA6-series aluminum alloys exhibit limited strain rate sensitivity [20]. To address inertial effects, a dynamic enhancement coefficient (λ) was introduced [21]. Determining an accurate value for λ is non-trivial, as this coefficient varies with geometric parameters, as demonstrated by Langseth et al. [21,22], and Hanssen et al. [21]. For AA6060-T4 extruded tubes under axial impact loading, these studies proposed λ values ranging from 1.3 to 1.6, which aligns with the findings of Tarigopula et al. [23]. In the present study, a λ value of 1.3 was adopted for multilevel tubes, consistent with this established range.
For multilevel structure in this paper, the solution could be divided into two parts. The first part is that only the outer tube compressed. The expression is as follows:
The second part is that the outer and inner tubes are all compressed. The expression is as follows:
3. Results
3.1. Experimental Setup
3.1.1. Experimental Specimens and Material Properties
The cross-section geometry of the multilevel concentric thin-walled tube is shown in Figure 5. The structure consists of two different-sized square tubes. In order to avoid stress concentration, the edges of the specimens had been rounded. The rounding of the specimen is very small compared to the length, and the difference between the outer and inner rounding radius is very small. It is difficult to affect the impact of the performance.
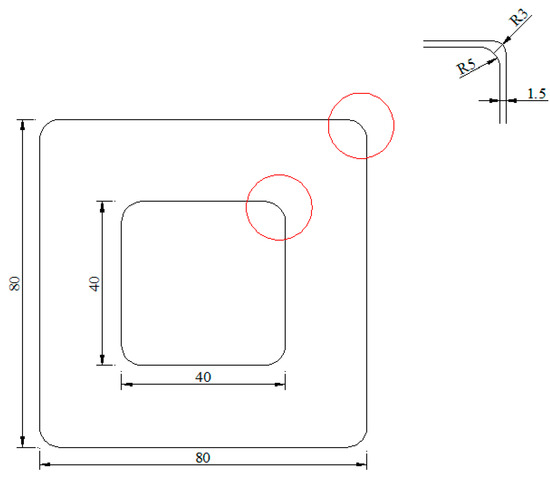
Figure 5.
Cross-section geometry of multilevel concentric thin-walled tube.
The specimens considered in this paper were fabricated by the Wire cut Electrical Discharge Machining (WEDM) technique. The length and is 250 mm and 160 mm, respectively, while and are 80 mm and 40 mm, respectively. The thickness of all tubes is 1.5 mm. The specimen is shown in Figure 6.
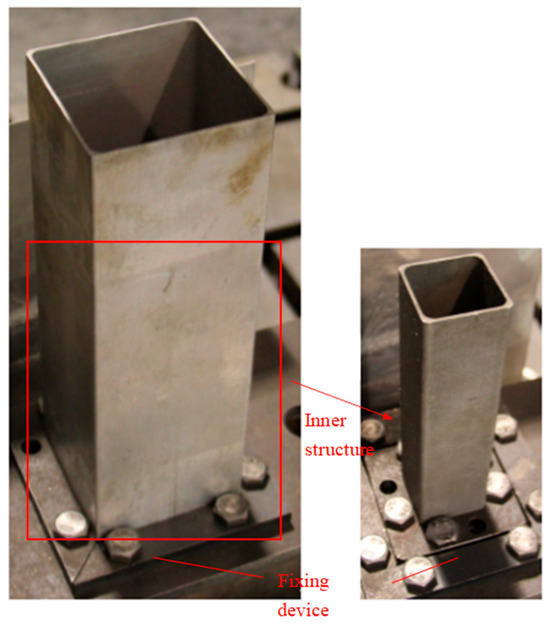
Figure 6.
Specimens for experimental test.
In this dynamic impact test, the specimen needs to be fixed for safety. The fixing device was made of steel plate (10 mm thick). The specimen was embedded in the fixing device to restrain the specimen against displacement and rotation.
The specimens were fabricated from AA6061-O aluminum alloy. Quasi-static tensile tests were conducted using standard specimens on a universal testing machine to obtain the stress–strain curve, as presented in Figure 7. The mechanical properties include: Young’s modulus E = 68.0 GPa, initial yield stress , the ultimate stress , the rupture strain , the power law exponent , Poisson’s ratio and density .
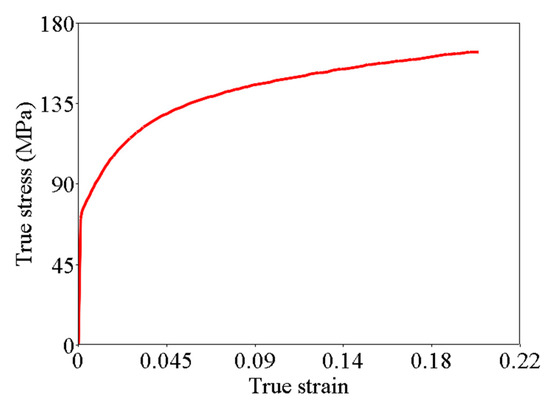
Figure 7.
Tensile specimen and true stress–strain curve of AA6061 O.
3.1.2. Dynamic Impact Experimental Apparatus
The dynamic impact tests for the multilevel thin-walled tube were conducted using a drop-weight apparatus shown in Figure 8. The impactor mass was 171.1 kg, and the initial impact velocity, corresponding to a drop height of 2000 mm, was controlled by adjusting the release height. Impact velocity was measured using a laser velocity sensor positioned near the impact zone. The high-speed camera was set for measuring the displacement of the specimen.
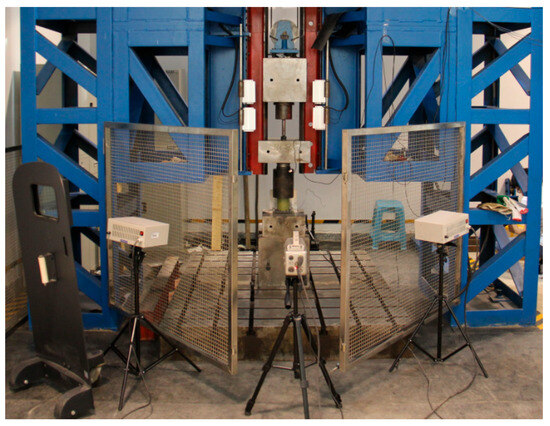
Figure 8.
Drop-weight apparatus for dynamic impact.
3.1.3. Experimental Results
The deformation mode of the specimen under the impact loading condition is presented in Figure 9. It is seen that the deformation mode is the asymmetric mode. The first folding element started at the top of the specimen. And then the later element was folded as the previous one. The fold of the specimen was well distributed. The crushing force–displacement curve, the mean crush force–displacement curve, and the energy absorption–displacement curve for the dynamic impact loading are shown in Figure 10.
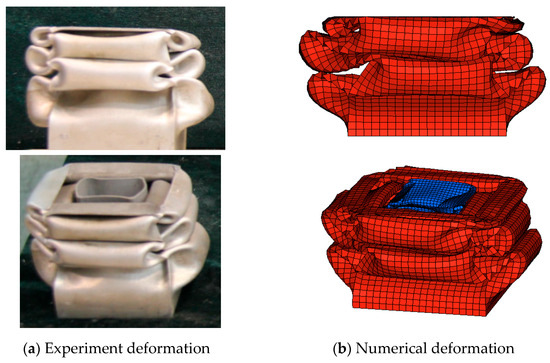
Figure 9.
Experimental and numerical deformation modes of multilevel tubes under dynamic loading conditions.

Figure 10.
Experimental and numerical curves of multilevel tubes under dynamic loading conditions. (a) Force–displacement length curves. (b) Mean crushing force–displacement length curves. (c) Energy absorbed–displacement length curves.
3.2. Numerical Simulation
3.2.1. FE Model
In order to investigate the crashworthiness of multilevel tubes, an FE model was performed by using LS-DYNA 971. The experimental results were then compared with the FE simulation results to validate the FE models.
The multilevel tube was loaded by a rigid plane with an initial velocity and an additional mass in the axial direction. A fixed boundary condition was applied directly at the bottom of the elements. The interface between the big tube and the small tube was modeled with an automatic surface-to-surface contact algorithm. The automatic single-surface contact algorithm was used in single-tube self-contact. The node-to-surface contact algorithm modeled the contact between the rigid wall and the crushed components. A friction coefficient of among all surfaces in contact was used. The material used in this paper is aluminum alloy AA6061 O. Since the aluminum is insensitive to the strain rate effect, the effect is neglected in the finite element analysis. The material model used in the finite element simulation is the MAT_24 model (*MAT_PIECEWISE_LINEAR__PLASTICTIY, provided in LS-DYNA) to describe its mechanical behavior. The model studied in this paper is a thin-walled structure, which is modeled using the Belytschko-Tsay 4-node shell element. The model adopts stiffness hourglass control to suppress hourglass deformation, with a coefficient of 0.1. The size of the element affects the accuracy of simulation results. In this paper, the mesh size of the external tube is 5 mm, and the internal tube is 3 mm. When the mesh size is further reduced, the accuracy of the results hardly improves.
According to the above description, the finite element model is shown in Figure 11.
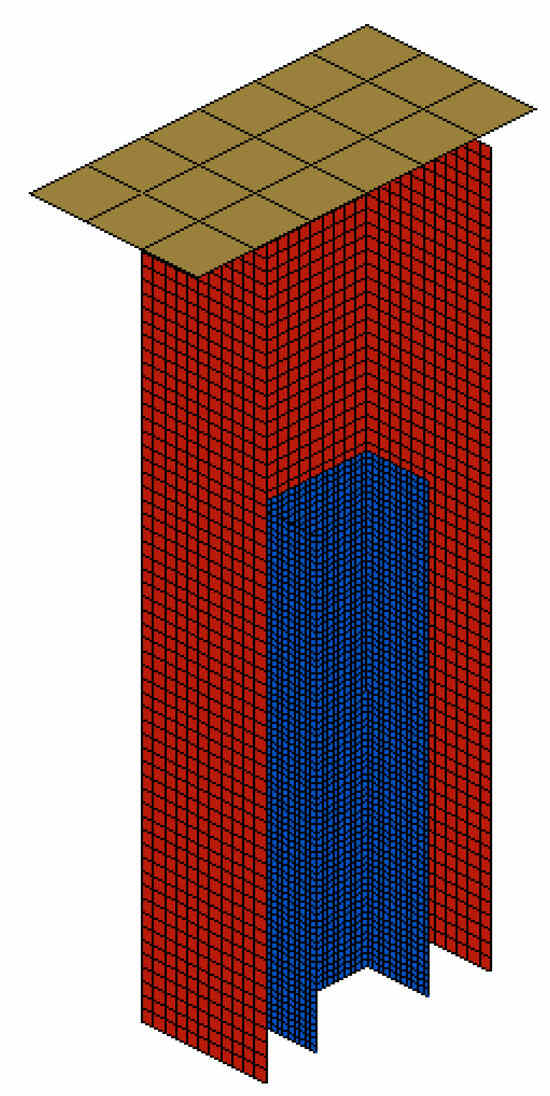
Figure 11.
Cutaway view of FE model.
3.2.2. Validation of FE Model
The FE model requires validation to demonstrate its effectiveness. This section presents a comparative analysis between numerical simulations and experimental results for the multilevel tube. Figure 9 illustrates the deformation modes obtained from FE simulation under dynamic impact conditions, showing close agreement with experimental observations. Furthermore, Figure 10 compares the force-displacement responses from FE simulations with experimental data under dynamic loading conditions.
It is seen that the absolute errors between experimental and FEA results are small. The numerical results are in great agreement with the experimental testing generally. This satisfactory correlation provides considerable confidence for the following study. In practical conditions, the energy of the collision process is often larger. Therefore, more energy is needed for later studies. The initial velocity of the rigid wall was added to 10 m/s, and the additional mass was 200 kg.
In order to better verify the accuracy of simulation; nevertheless, , , , and were also considered to compare the mean crushing force of the multilevel thin-walled tube with the theoretical solutions as in Table 1. It was found that the FE results were in good agreement with the theoretical results.

Table 1.
Comparison of theoretical results and simulation results with different thickness.
The numerical analyses give a good prediction for dynamic impact testing. The absolute errors between experimental, theoretical, and FEA results are small. Such a satisfactory correlation provides adequate confidence for us to extend the model to the other conditions for the discussion and the optimization study in this paper.
4. Discussion
4.1. The Comparison BETWEEN Multilevel Thin-Walled Tube and Single Level Thin-Walled Tube
Single-level thin-walled square tubes are widely used on various occasions. In this section, single-level thin-walled square tubes and multilevel tubes with equal mass were investigated. The mass of structures is 0.207 kg, 0.311 kg, 0.415 kg, 0.518 kg, and 0.622 kg, and the thickness of single-level and multilevel thin-walled square tubes are 1 mm, 1.5 mm, 2 mm, 2.5 mm, 3 mm, 0.762 mm, 1.143 mm, 1.524 mm, 1.905 mm, and 2.286 mm, respectively. Figure 12 shows energy absorption characteristics of single-level thin-walled square tubes and multilevel tubes with equal mass.

Figure 12.
The energy absorption characters with equal mass.
As observed from this figure, the initial peak force, CLE, and SEA increase with the increase in the thickness of structures. With the equal mass, for initial peak force and SEA, single-level thin-walled square tube is larger than multilevel tubes. But for CLE, the single-level tube is larger. Comparison of the results with equal mass showed that single-level thin-walled square tube has a large SEA, but the multilevel tube performs better in initial peak force and CLE.
4.2. The Effect of Different Length
In multilevel thin-walled structures, the inner tube plays an important role in the whole collision process. The length of the inner tube determines the location of the second peak force. Taking the thickness of the structure as 1.5 mm as an example, this section analyzes the effect of different lengths for multilevel tubes. The distance difference in the length direction is zero, 30 mm, 60 mm, 90 mm, and 120 mm. Figure 13 shows the crushing force-displacement curve of the multilevel structure with different lengths. It could be seen from the figure that the location of the second peak force is the length of the inner tube.
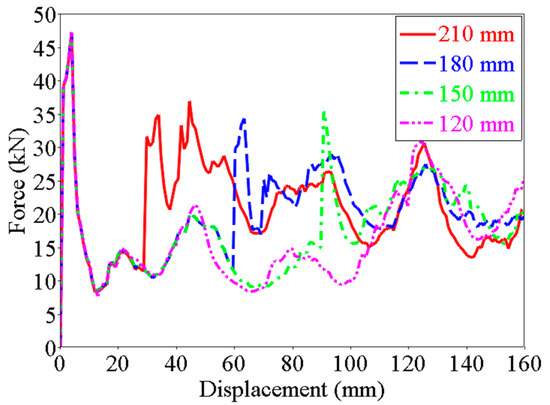
Figure 13.
Crushing force–displacement curve of different length of inner tube.
The theory proposed in this paper also could be used in the different length. For the distance difference in length direction is smaller, it only discusses the second meaning of the crushing force in this section. Figure 14 shows the mean crushing force of the multilevel structure obtained from the FE model and Equation (23). From the figure, the error between simulation results and theoretical results is small. The simulation results show good agreement with theoretical results.
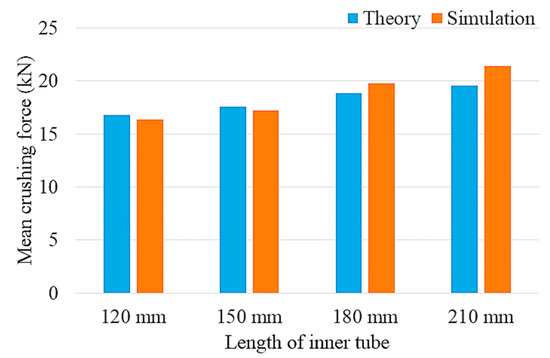
Figure 14.
Mean crushing force comparison for simulation results and theoretical results.
4.3. The Effect of Different Width
In the collision process, the outer tube and inner tube are more likely to interact with each other. It all depends on the difference in distance in the width direction between two tubes. This section will give an example to study the influence of the width. The width of the inner tube is from 40 mm to 70 mm, and the thickness of the structure is a constant value, 1.5 mm. Figure 15 shows the crushing force-displacement curve of different widths.
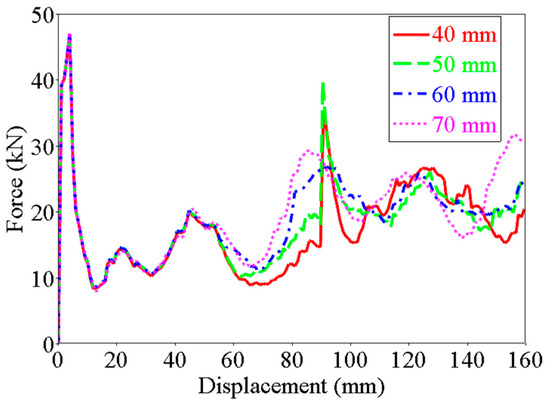
Figure 15.
Crushing force–displacement curve of different width of multilevel tubes.
The results show that the crushing force of some structures will have a sudden growth, like 40 mm and 50 mm, and others will increase gently, like 70 mm, when the inner tube begins to absorb energy. It depends on whether the folding element of the outer tube interacts with the inner tube. Figure 16 shows the deformations of different widths of inner tubes. When the width of the inner tube is 40 mm, the interaction between two tubes is less, but with the increase in the width, the interaction is more and more. When the width is 70 mm, two tubes interact with each other frequently, so the second peak crushing force increases gently compared to the smaller tubes.

Figure 16.
The deformations of different width of inner tube.
5. Crashworthiness Optimization
5.1. Description of the Crashworthiness Optimization Problem
From the point of view of practicality, it was indicated that these two objectives of CLE and SEA compete against each other. In this paper, the aim of multi-objective optimization design was to maximize CLE and maximize SEA while the second peak force was smaller than the first peak force and the allowable criterion was satisfied. The thickness of the outer tube, the thickness of the inner tube, and the width of the inner tube were taken as the design variables, which range from 1 to 2.5 mm, from 1 to 2.5 mm, and from 40 to 70 mm, respectively.
The optimization problem could be written as the following multi-objective optimization form the following:
5.2. Surrogate Model
Deriving analytical objective functions for CLE and SEA proves mathematically challenging due to the highly nonlinear contact-impact phenomena and large deformation mechanics inherent in crashworthiness problems [24]. As a computationally efficient alternative, surrogate modeling techniques can effectively approximate the complex relationship between design variables and system responses. This study employs response surface methodology (RSM) as the surrogate modeling approach.
To estimate the fitting accuracy of the surrogate model, three different fitting indicators, namely Relative Average Absolute Error (RAAE), Relative Maximum Absolute Error (RMAE), Root Mean Squared Error (RMSE), and R-square (R2),are adopted in Equations (25)–(28) [25].
where p is the number of non-constant terms in the RS model, SSE is the sum of square errors, and SST is the total sum of squares. SSE and SST are calculated as follows:
where fi is the value of the measured function at the design sampling point; fi′ is the value from the polynomial at the design sampling point and f is the mean value of fi. It should be pointed out that these values may not be completely independent of each other.
To construct high-accuracy surrogate models, design of experiments (DOE) is typically employed for efficient sampling of the design space. Among various DOE methodologies, optimal Latin hypercube sampling (OLHS) was selected to generate training points due to its space-filling properties. In this study, 30 training points were generated to adequately capture the highly nonlinear system responses, as shown in Table 2.

Table 2.
Design matrix of initial sample points.
The approximate RS models of the 4 responses with 30 design sampling points are given in Table 3. It shows the accuracy assessment of surrogate models according to these error criteria in Equations (25)–(28). The larger it is, the smaller RAAE, RMAE, and RMSE are, and the better the RS fitting is [26]. It was indicated that the accuracy of the RS model was good. So it is appropriate to use this model to solve the optimization problem.

Table 3.
Accuracy assessment for surrogate model.
5.3. Optimization Results
The problem considered in this paper is a multi-objective optimization problem. The Non-dominated Sorting Genetic Algorithm (NSGA-II), proposed by Deb et al. [27], is used to search for the optimal result of several conflicting objectives. This algorithm has proven effective at solving multi-objective optimization problems [28]. The optimization results are listed in Table 4. These parameters were used to establish the FE model. The simulation results showed that the initial peak force is 79.95 kN and the second peak force is 74.10 kN. The difference in two peak forces is 5.85 kN. The error between the simulation result and the optimization result is larger. And the other results all show a great agreement. The curve of crushing force-displacement for the optimal result is shown in Figure 17.

Table 4.
Comparison of the optimization and simulation results.
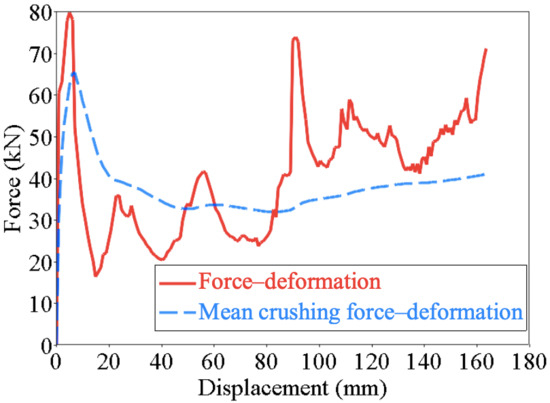
Figure 17.
The curve of crushing force–displacement for the optimal result.
The values of mean crushing force obtained from FE simulation were 32.07 kN and 38.66 kN, respectively. The parameters of this case were t1 = 2.35 mm, t2 = 2.50 mm and d2 = 50.02 mm and substituting these into Equations (23) and (24), a comparison for the FE simulation and theoretical prediction is shown in Table 5.

Table 5.
Optimization result FEA result and theoretical result.
The difference between the optimization result and the FEA value, the theoretical result, was 4.56% and 2.00%, respectively, all less than 5%. All these show a strong agreement between the proposed theoretical method and the numerical simulation optimization result.
6. Conclusions
The energy absorption characteristics of multilevel thin-walled tubes were studied in the present paper, which can be used for the passenger car. Compared to single-level, multilevel tubes have additional energy-absorbing structures after the initial peak force, which means higher crash load efficiency. Based on the Super Folding Element theory, a theoretical prediction for the mean crushing force of a multilevel thin-walled tube was proposed. An experimental study about multilevel thin-walled tubes was investigated with a dynamic impact loading condition.
Meanwhile, a new optimization criterion, allowable criterion, was proposed, and crashworthiness optimization design for multilevel thin-walled tubes was performed. The RS models between design variables and responses were constructed, and the accuracy of the RS model was good. The Non-dominated Sorting Genetic Algorithm (NSGA-II) was applied for its optimal structure. In the end, the optimization results agreed well with the FE simulation result and theoretical prediction, with an error of less than 5%.
Author Contributions
Conceptualization, Z.D.; data curation, Z.D.; methodology, Z.D.; investigation, Z.D.; supervision, Z.Z.; writing—original draft, Z.D., M.L. and J.F. All authors have read and agreed to the published version of the manuscript.
Funding
This research received no external funding.
Institutional Review Board Statement
Not applicable.
Informed Consent Statement
Not applicable.
Data Availability Statement
Data are contained within the article.
Conflicts of Interest
Author Jianghua Feng was employed by the company CRRC Zhuzhou Institute Co., Ltd. The remaining authors declare that the research was conducted in the absence of any commercial or financial relationships that could be construed as a potential conflict of interest.
References
- Abramowicz, W. Thin-walled structures as impact energy absorbers. Thin-Walled Struct. 2003, 41, 91–107. [Google Scholar] [CrossRef]
- Hou, S.; Dong, D.; Ren, L.; Han, X. Multivariable crashworthiness optimization of vehicle body by unreplicated saturated factorial design. Struct. Multidiscip. Optim. 2012, 46, 891–905. [Google Scholar] [CrossRef]
- Zhang, X.; Zhang, H. Numerical and theoretical studies on energy absorption of three-panel angle elements. Int. J. Impact Eng. 2012, 46, 23–40. [Google Scholar] [CrossRef]
- Sun, G.; Xu, F.; Li, G.; Li, Q. Crashing analysis and multiobjective optimization for thin-walled structures with functionally graded thickness. Int. J. Impact Eng. 2014, 64, 62–74. [Google Scholar] [CrossRef]
- Hou, S.; Li, Q.; Long, S.; Yang, X.; Li, W. Multiobjective optimization of multi-cell sections for the crashworthiness design. Int. J. Impact Eng. 2008, 35, 1355–1367. [Google Scholar] [CrossRef]
- Abramowicz, W.; Jones, N. Dynamic axial crushing of square tubes. Int. J. Impact Eng. 1984, 2, 179–208. [Google Scholar] [CrossRef]
- Reid, S. Plastic deformation mechanisms in axially compressed metal tubes used as impact energy absorbers. Int. J. Mech. Sci. 1993, 35, 1035–1052. [Google Scholar] [CrossRef]
- Song, J. Numerical simulation on windowed tubes subjected to oblique impact loading and a new method for the design of obliquely loaded tubes. Int. J. Impact Eng. 2013, 54, 192–205. [Google Scholar] [CrossRef]
- Nagel, G.; Thambiratnam, D. A numerical study on the impact response and energy absorption of tapered thin-walled tubes. Int. J. Mech. Sci. 2004, 46, 201–216. [Google Scholar] [CrossRef]
- Nagel, G.; Thambiratnam, D. Computer simulation and energy absorption of tapered thin-walled rectangular tubes. Thin-Walled Struct. 2005, 43, 1225–1242. [Google Scholar] [CrossRef]
- Wierzbicki, T.; Abramowicz, W. On the crushing mechanics of thin-walled structures. J. Appl. Mech. 1983, 50, 727–734. [Google Scholar] [CrossRef]
- Abramowicz, W.; Wierzbicki, T. Axial crushing of multicorner sheet metal columns. J. Appl. Mech. 1989, 56, 113–120. [Google Scholar] [CrossRef]
- Chen, W.; Wierzbicki, T. Relative merits of single-cell, multi-cell and foam-filled thin-walled structures in energy absorption. Thin-Walled Struct. 2001, 39, 287–306. [Google Scholar] [CrossRef]
- Zhang, X.; Zhang, H. Crush resistance of square tubes with various thickness configurations. Int. J. Mech. Sci. 2016, 107, 58–68. [Google Scholar] [CrossRef]
- Jusuf, A.; Dirgantara, T.; Gunawan, L.; Putra, I.S. Crashworthiness analysis of multi-cell prismatic structures. Int. J. Impact Eng. 2015, 78, 34–50. [Google Scholar] [CrossRef]
- Baroutaji, A.; Morris, E.; Olabi, A.E. Quasi-static response and multi-objective crashworthiness optimization of oblong tube under lateral loading. Thin-Walled Struct. 2014, 82, 262–277. [Google Scholar] [CrossRef]
- Kim, H.-S. New extruded multi-cell aluminum profile for maximum crash energy absorption and weight efficiency. Thin-Walled Struct. 2002, 40, 311–327. [Google Scholar] [CrossRef]
- Deng, X.; Qin, S.; Huang, J. Crashworthiness analysis of gradient hierarchical multicellular columns evolved from the spatial folding. Mater. Des. 2022, 215, 110435. [Google Scholar] [CrossRef]
- Tam, L.; Calladine, C. Inertia and strain-rate effects in a simple plate-structure under impact loading. Int. J. Impact Eng. 1991, 11, 349–377. [Google Scholar] [CrossRef]
- Chen, Y.; Clausen, A.; Hopperstad, O.; Langseth, M. Stress–strain behaviour of aluminium alloys at a wide range of strain rates. Int. J. Solids Struct. 2009, 46, 3825–3835. [Google Scholar] [CrossRef]
- Hanssen, A.; Langseth, M.; Hopperstad, O.S. Static and dynamic crushing of circular aluminium extrusions with aluminium foam filler. Int. J. Impact Eng. 2000, 24, 475–507. [Google Scholar] [CrossRef]
- Langseth, M.; Hopperstad, O.; Hanssen, A. Crash behaviour of thin-walled aluminium members. Thin-Walled Struct. 1998, 32, 127–150. [Google Scholar] [CrossRef]
- Tarigopula, V.; Langseth, M.; Hopperstad, O.S.; Clausen, A.H. Axial crushing of thin-walled high-strength steel sections. Int. J. Impact Eng. 2006, 32, 847–882. [Google Scholar] [CrossRef]
- Wu, S.; Zheng, G.; Sun, G.; Liu, Q.; Li, G.; Li, Q. On design of multi-cell thin-wall structures for crashworthiness. Int. J. Impact Eng. 2016, 88, 102–117. [Google Scholar] [CrossRef]
- Jin, R.; Chen, W.; Simpson, T. Comparative studies of metamodelling techniques under multiple modelling criteria. Struct. Multidiscip. Optim. 2001, 23, 1–13. [Google Scholar] [CrossRef]
- Montgomery, D.C. Design and Analysis of Experiments; John Wiley & Sons: Hoboken, NJ, USA, 2008. [Google Scholar]
- Deb, K.; Pratap, A.; Agarwal, S.; Meyarivan, T. A fast and elitist multiobjective genetic algorithm: NSGA-II. IEEE Trans. Evol. Comput. 2002, 6, 182–197. [Google Scholar] [CrossRef]
- Murugan, P.; Kannan, S.; Baskar, S. NSGA-II algorithm for multi-objective generation expansion planning problem. Electr. Power Syst. Res. 2009, 79, 622–628. [Google Scholar] [CrossRef]
Disclaimer/Publisher’s Note: The statements, opinions and data contained in all publications are solely those of the individual author(s) and contributor(s) and not of MDPI and/or the editor(s). MDPI and/or the editor(s) disclaim responsibility for any injury to people or property resulting from any ideas, methods, instructions or products referred to in the content. |
© 2025 by the authors. Licensee MDPI, Basel, Switzerland. This article is an open access article distributed under the terms and conditions of the Creative Commons Attribution (CC BY) license (https://creativecommons.org/licenses/by/4.0/).