Article

Self-Repairing Polyurethane–Urea Coating for Wind Turbine Blades: Modeling and Analysis

1
Department of Wind and Energy Systems, Technical University of Denmark, 4000 Roskilde, Denmark
2
Fraunhofer Institute for Manufacturing Technology and Advanced Materials IFAM, 28359 Bremen, Germany
*
Authors to whom correspondence should be addressed.
Coatings 2025, 15(9), 1059; https://doi.org/10.3390/coatings15091059
Submission received: 12 August 2025 / Revised: 2 September 2025 / Accepted: 4 September 2025 / Published: 10 September 2025

Abstract

This study investigates a UDETA-modified polyurethane–urea (PUU) self-healing coating for wind turbine blades, focusing on its ability to autonomously repair surface erosion damage under realistic environmental conditions. A multiphysics finite element model was developed to couple temperature, moisture, and stress effects on crack healing, and a Gaussian process regression (GPR) model was trained on 35 experimental data points to predict the mobile fraction and healing thresholds with high accuracy (R2 = 0.79, MAE = 0.059). The diffusion coefficient of water in the PUU matrix was determined as 11.03 × 10⁻⁷ mm2/s, and stress-driven moisture accumulation at crack tips was shown to accelerate crack healing. Erichsen cupping test simulations were conducted to reproduce experimental crack patterns, demonstrating brittle behavior in dehydrated coatings with a Young’s modulus of 50 MPa and critical principal strains of 0.48. An exponential healing function was incorporated into the computational model and validated against experiments, predicting significant crack healing within 24 h of humidity exposure. These findings provide quantitative design criteria for self-healing coatings, enabling the selection of UDETA content, thickness, and curing strategies to extend wind turbine blade service life while reducing maintenance costs.

1. Introduction

Wind energy plays a vital role in the global shift toward cleaner, more sustainable energy sources and continues to expand at a rapid pace [1]. One of the main challenges to keeping renewable energy competitive is the high cost associated with wind turbine maintenance [2]. Our previous research [2] revealed that minor failures—primarily surface erosion—are responsible for unplanned repairs at a rate that is 12 times higher than that of structural failures. Harsh environmental conditions, such as rain, hail, and other airborne particles, contribute to gradual wear on turbine blades, resulting in leading-edge erosion (LEE). LEE not only reduces aerodynamic performance and energy production but also increases maintenance costs and shortens operational lifespans. To address these challenges, recent advances in material science have introduced self-healing coatings [3] as a novel solution. These advanced materials are designed to autonomously repair microdamage, thereby restoring the integrity of the blade surface and prolonging its operational life.
Numerous studies have been conducted to develop advanced leading-edge protection (LEP) coatings for wind turbine blades [4,5]. LEP coatings can be utilized as liquid applications, adhesive tapes, or bonded shells [6]. Polymeric protective coatings are typically used as top layers to protect the leading edge of approximately one-third of the outer blade from surface erosion, offering exceptional strength, durability, flexibility, cost-effectiveness, and ease of fabrication [7]. Polymeric resins, such as polyurethane (PU), epoxy, polyacrylate, and silicone, are widely used [7]. Considering the advantages of polymeric coatings, the wind turbine blade uses a multi-layer polymer coating method to address the issue of leading-edge erosion. An example of a typical LEP system structure is shown in Figure 1. A putty or filler layer is first applied to the laminate and sanded for surface smoothness [8], followed by a top coating that acts as the primary protective layer.
Among various polymeric materials, polyurethane–urea (PUU) self-healing polymers have gained significant attention [9,10,11,12] due to their versatility, tunable mechanical properties, and ability to integrate dynamic bonds for autonomous repair. Depending on their inherent self-healing mechanisms [13,14], self-healing materials can be classified as extrinsic or intrinsic. Extrinsic self-healing materials, also referred to as autonomous self-healing materials, rely on pre-filled healing agents encapsulated within containers embedded in the matrix to facilitate damage repair [15,16,17,18]. In contrast, intrinsic self-healing materials [19,20] rely on their own chemical bonds to reform when exposed to external stimuli. However, extrinsic self-healing materials, typically implemented through capsule-based or vascular systems, exhibit only one single healing occurrence per capsule [21]. In contrast, intrinsic self-healing materials are designed with built-in repair abilities that function without external agents, allowing for multiple healing cycles [22,23]. Intrinsic self-healing in PUU polymer materials can be achieved through the integration of dynamic covalent bonds (disulfide bonds [24] and Diels–Alder reactions [25]) or by utilizing non-covalent interactions (metal–ligand coordination, ionic interactions, and hydrogen bonding). In intrinsically self-healing PUU polymers, moisture can be effectively used as a plasticizer, specifically through 1-(2-aminoethyl) imidazolidinone (UDETA), which introduces a unique hydrogen-bonding nature essential to the self-healing mechanism. Polymers with higher UDETA content exhibit better water absorption and self-healing performance [26]. By leveraging supramolecular forces and hydrogen-bonding interactions, the UDETA-based PUU polymers achieve autonomous self-healing, making them promising candidates for applications in humid environments.
Various computational techniques have been developed to investigate self-healing materials. Molecular dynamics (MD) and density functional theory (DFT) atomistic simulations [27,28,29,30,31] allow for in-depth examination of reversible bond dynamics and molecular interactions pertinent to healing processes. Mesoscale approaches such as coarse-grained MD [32,33] and Monte Carlo methods [34] are employed to study diffusion processes and phase behavior in polymer systems. At the macroscale, finite element methods (FEMs) [35,36] are used to simulate mechanical damage, stress distribution, and healing kinetics in structural composites. However, each method has its limitations—atomistic simulations are computationally intensive for large systems, whereas mesoscale models may oversimplify chemical details. In intrinsic self-healing polymers, healing arises from reversible covalent or non-covalent interactions activated by environmental stimuli. FEM stands out for its ability to integrate thermal, mechanical, and moisture-driven effects into a unified framework. This enables the simulation of damage evolution and recovery under service-relevant conditions, making it a powerful predictive tool for evaluating and optimizing healing performance in coatings such as polyurethane–urea systems.
In this study, based on previous experimental data [26,37], predictive models using nonlinear interpolation and Gaussian process regression are first developed to estimate the critical conditions for healing, facilitating the evaluation and design of new material formulations under various environmental conditions. Furthermore, a multiphysics finite element model is developed to simulate the interplay of temperature, moisture, and stress in UDETA-based PUU coatings with a single crack. A damage-healing model is also developed to assess the autonomous crack-repair capability of coatings in humid environments, and its predictions are validated through Erichsen cupping tests. This computational framework provides a comprehensive understanding of the moisture-triggered self-healing mechanism, enabling optimization for real-world applications.

2. Materials

The synthesis path of the UDETA-based PUU is presented in Figure 2a. The detailed synthesis and characterization of self-healing polymers have been reported in our previous work [26] and will not be repeated here.
The self-healing capability of the UDETA-based PUU material is intrinsically driven by the incorporation of UDETA as a chain-terminating agent. UDETA plays a dual role—it contributes to the formation of a dynamic hydrogen-bonding network and enhances the material’s responsiveness to environmental moisture. The healing process is facilitated by the reversible disruption and reformation of hydrogen bonds within the polymer matrix, a mechanism that is significantly influenced by the uptake of water, as illustrated in Figure 2b.
Unlike temperature-responsive polymers, in which dynamic hydrogen bonds reversibly form and dissociate with temperature changes [38], moisture acts as a plasticizer in UDETA-based self-healing polymers by temporarily disrupting hydrogen-bond interactions, leading to a reduction in both the glass transition temperature and hardness [37]. This softening effect allows for increased molecular mobility, enabling the polymer chains to reorganize and close microcracks or scratches. Upon drying, the hydrogen bonds are re-established, restoring the mechanical integrity of the coating. This reversible modulation of the thermomechanical properties underpins the intrinsic self-healing capability of the UDETA-based PUU polymers.
Our previous experimental work [37] demonstrated that no self-healing occurred in the absence of moisture. The critical healing conditions indicated that healing occurs only when
M M threshold
where M is the mobile fraction and M threshold is the critical mobile fraction, reported to be between 0.59 and 0.68 [37] for effective healing. At high relative humidity, self-healing can occur at room temperature; however, under low-moisture conditions or with low UDETA content, the temperature must exceed the glass transition temperature ( T g ) to activate sufficient molecular mobility for healing [37]. The reader is referred to Refs. [26,37] for detailed molecular-level experimental results.

3. Methodology

3.1. Prediction of Mobile Fraction by Gaussian Process Regression

From experimental data presented in Figure 9 of Ref. [37], the mobile fraction (MF) depends on its governing parameters or inputs–temperature, UDETA content, and relative humidity in a complex, not easily separable way, which is difficult to model explicitly by simple expressions. Rather than seeking an analytical understanding of this dependence, one can describe it through existing data and observations. Interpolation and regression techniques [39] allow for a continuous function representation by filling gaps between data points, which can then be used in future research.
In this study, a Gaussian process regression (GPR) machine learning method [40] is employed to develop a predictive model of mobile fraction for the coating material. GPR is a non-parametric Bayesian approach that provides a probabilistic framework for regression tasks, which is known for its flexibility and ability to model complex relationships while also providing uncertainty estimates, making it suitable for situations with limited data where overfitting is a major concern [41]. The details of the GPR model used can be found in Appendix A.
The GPR model was implemented in Python 3.9.12 using scikit-learn 1.1.3 [42], with feature engineering. The implementation is based on Algorithm 2.1 of [40]. Through simulation, the optimal input features are [T, U, RH, T × RH, U × RH]. Figure 3b shows the flowchart of the GPR algorithm. First, LOOCV is used to choose the optimal data features for inputs and evaluate the performance of the selected model. Then, the GPR model is trained on the full dataset to obtain the final model for the prediction of new inputs. With this model, the mobile fraction of the coating material with new UDETA content under new temperature and relative humidity can be estimated.
The GPR model provides predictions of the mean mobile fraction along with uncertainty quantification. In our study, the model achieved strong LOOCV performance metrics— R 2 = 0.79 , MSE = 0.0059 , and MAE = 0.059 —indicating good predictive capability for experimental design optimization. A comparison between the predicted mobile fraction and experimental data across varying UDETA content, temperature, and relative humidity is presented in Table A1 in Appendix A.

3.2. Single-Crack Model

In order to investigate the interplay of temperature, moisture, and stress in the presence of cracks in the coating material, a two-dimensional multiphysics model with a single crack was developed. Both thermal stress and stress-driven diffusion are considered in the finite element model.

3.2.1. Temperature Effects

For temperature effects, a fully coupled thermal–stress analysis with transient response was conducted to simultaneously solve for the temperature distribution and the associated stress and displacement fields. During both the heating and cooling phases, surface thermal radiation was taken into account. The net radiative heat flux from the surface to the surroundings, denoted by q rad , is determined using the Stefan–Boltzmann law [43]:
q rad = ε e m σ ( T s 4 T sur 4 )
where T s and T sur denote ambient temperature and surface temperature, respectively. ε e m denotes thermal emissivity. σ is the Stefan-Boltzmann constant, σ = 5.67 × 10 8 W/(m2·K4). ε e m is the thermal emissivity.

3.2.2. Moisture Effects

Moisture transport within materials can be described by Fick’s second law [44], which models the time-dependent diffusion behavior in terms of concentration gradients. In its one-dimensional form, the equation is given by the following:
C t = D 2 C x 2
where D denotes the diffusion coefficient, C represents moisture concentration, x is the spatial coordinate in the diffusion direction, and t is time.
The general mass diffusion framework extends Fick’s law by accounting for spatially varying solubility and incorporates additional driving forces such as temperature and pressure gradients. The conservation of mass for the diffusing phase leads to the general governing equation:
V d c d t d V + S n · J d S = 0
where V is an arbitrary control volume bounded by surface S, c is the mass concentration of the diffusing material, n is the unit outward normal to S, J is the mass flux vector, and n · J is the outward flux through the surface S.
In this generalized model, diffusion is driven by gradients in the chemical potential, and the flux J is expressed as follows:
J = s D · ϕ x + κ s x ln ( θ θ z ) + κ p p x
where ϕ is the normalized concentration, with s being the solubility of the base material, and D the diffusivity. The term κ s is the coefficient associated with the Soret effect, which accounts for thermal diffusion, while θ is the temperature, and θ z denotes absolute zero (−273 °C). The coefficient κ p accounts for stress-driven diffusion, with the equivalent pressure stress defined as p = trace σ / 3 .
Stress-assisted diffusion accounts for the influence of mechanical stress on mass transport. This effect is incorporated by defining the pressure stress factor κ p , which quantifies the sensitivity of diffusion to gradients in mechanical pressure. The parameter κ p is defined as follows:
κ p = V ¯ H ϕ R ( θ θ z ) mm N 1 / 2
where R = 8.31432 J mol 1 K 1 , V ¯ H is the partial molar volume of water in a PUU-based polymer coating, which was estimated to be 18 cm3/mol [45], ϕ is the normalized concentration, θ is the current temperature, and θ z denotes absolute zero temperature.
The sequentially coupled mass diffusion procedure involves two main steps—a static stress analysis is performed first, followed by a mass diffusion analysis. In the initial step, the equivalent pressure stresses are computed and stored as nodal-averaged values in the results file. These stored pressure values are then accessed during the subsequent mass diffusion step, where they serve as a driving force, contributing to stress-assisted diffusion.
Equivalent pressure stress as a predefined field can be applied in a mass diffusion analysis, but it is not supported in Abaqus/CAE. ∗PRESSURE STRESS, FILE=filename should be added to the model keywords to specify a predefined equivalent pressure stress field.

3.3. Damage Model for Dehydrated Coating

In this section, a damage model is developed to simulate the mechanical behavior of the UDETA-based PUU coating sample during the Erichsen cupping test. PUU polymers exhibit hyperelasticity at standard room humidity. The polymer coatings used for the cupping test were dehydrated by drying them in a vacuum oven for at least 24 h at a pressure of 1–10 mbar. This drying procedure ensured that the films were free of moisture before subsequent testing. During this procedure, the samples became brittle, and brittle cracks were observed in the Erichsen cupping test [26]. Consequently, the coating is assumed to be a brittle material in the computational model.
Damage initiation in the coating is determined using the maximum strain criterion. For modeling damage progression, an exponential softening law is applied. The corresponding damage variable D for the brittle coating material is defined as follows [46]:
D ( ε ) = 1 ε 0 ε exp E ε 0 h e G c ( ε ε 0 ) ,
where the scalar variable D denotes the damage variable, which quantifies the extent of mechanical degradation and ranges from 0 (undamaged) to 1 (fully damaged). The equivalent elastic strain ε is defined as the maximum principal elastic strain during the loading history, which is max ( ε 1 , ε 2 , ε 3 ) for three-dimensional cases. G c is the fracture energy, ε 0 is the critical strain threshold for damage initiation, E is Young’s modulus, and h e denotes the characteristic element length in the damage zone. If the strain ε remains below ε 0 , the coating is considered undamaged. However, once ε ε 0 , damage initiates and progresses according to the specified evolution law.

3.4. Self-Healing Kinetics of UDETA-Based PUU Polymers
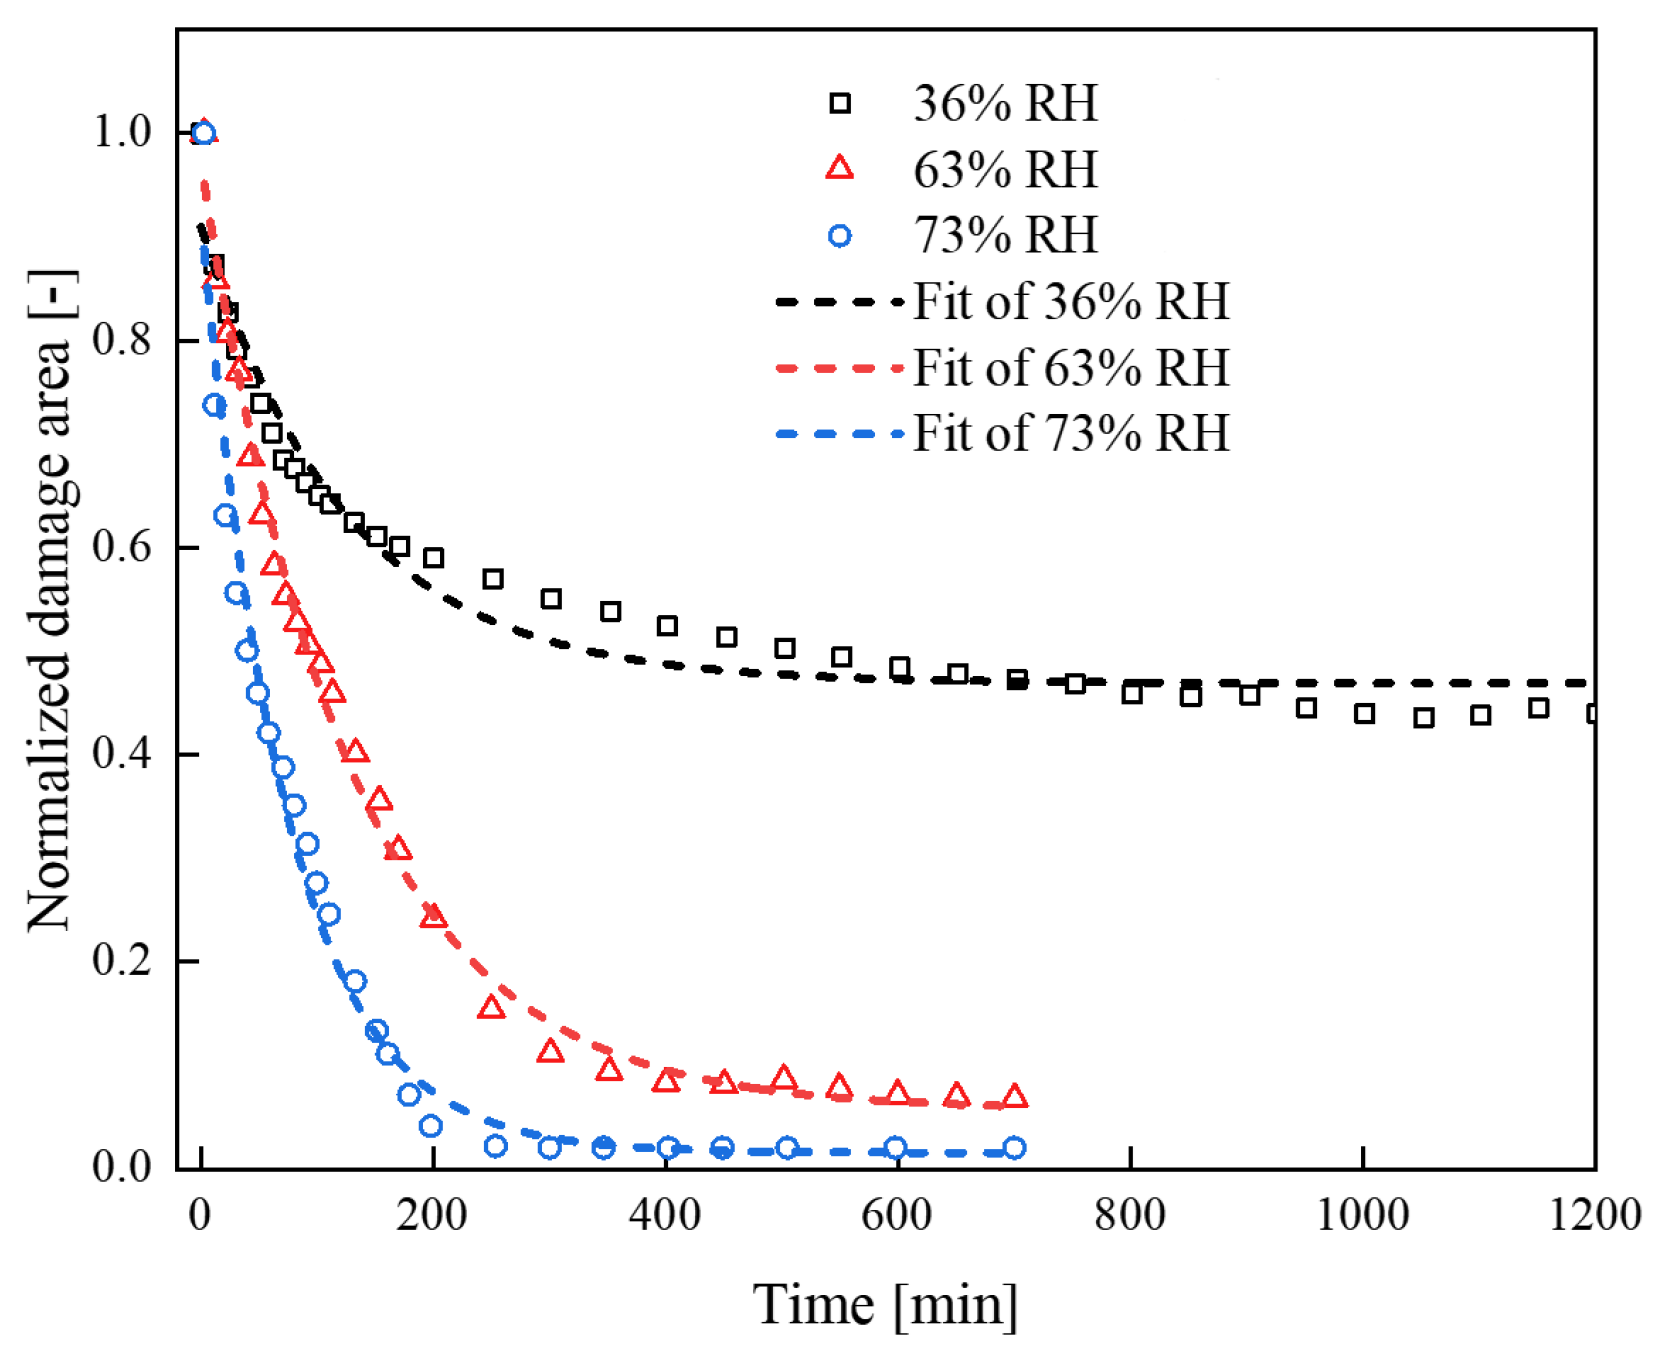
From the experiment [37], the damage variable ( D exp ) is defined as a normalized damage area:
D exp ( t ) = A ( t ) A 0
where A ( t ) denotes the damaged area at time t, and A 0 is the initial damaged area.
The time evolution of the damage variable is illustrated in Figure A1. The healing behavior of the damage variable D exp over time follows an exponential decay, which can be expressed by the following:
D exp ( t ) = D s exp e k t + D min exp
where D 0 exp is the initial normalized damage area D exp ( t = 0 ) . D s exp is a scaling factor. k is the healing rate constant dependent on room humidity, UDETA content, and temperature. D s exp , k, and D min exp are fitted to experimental data.

4. Results and Discussion

4.1. Single-Crack Model

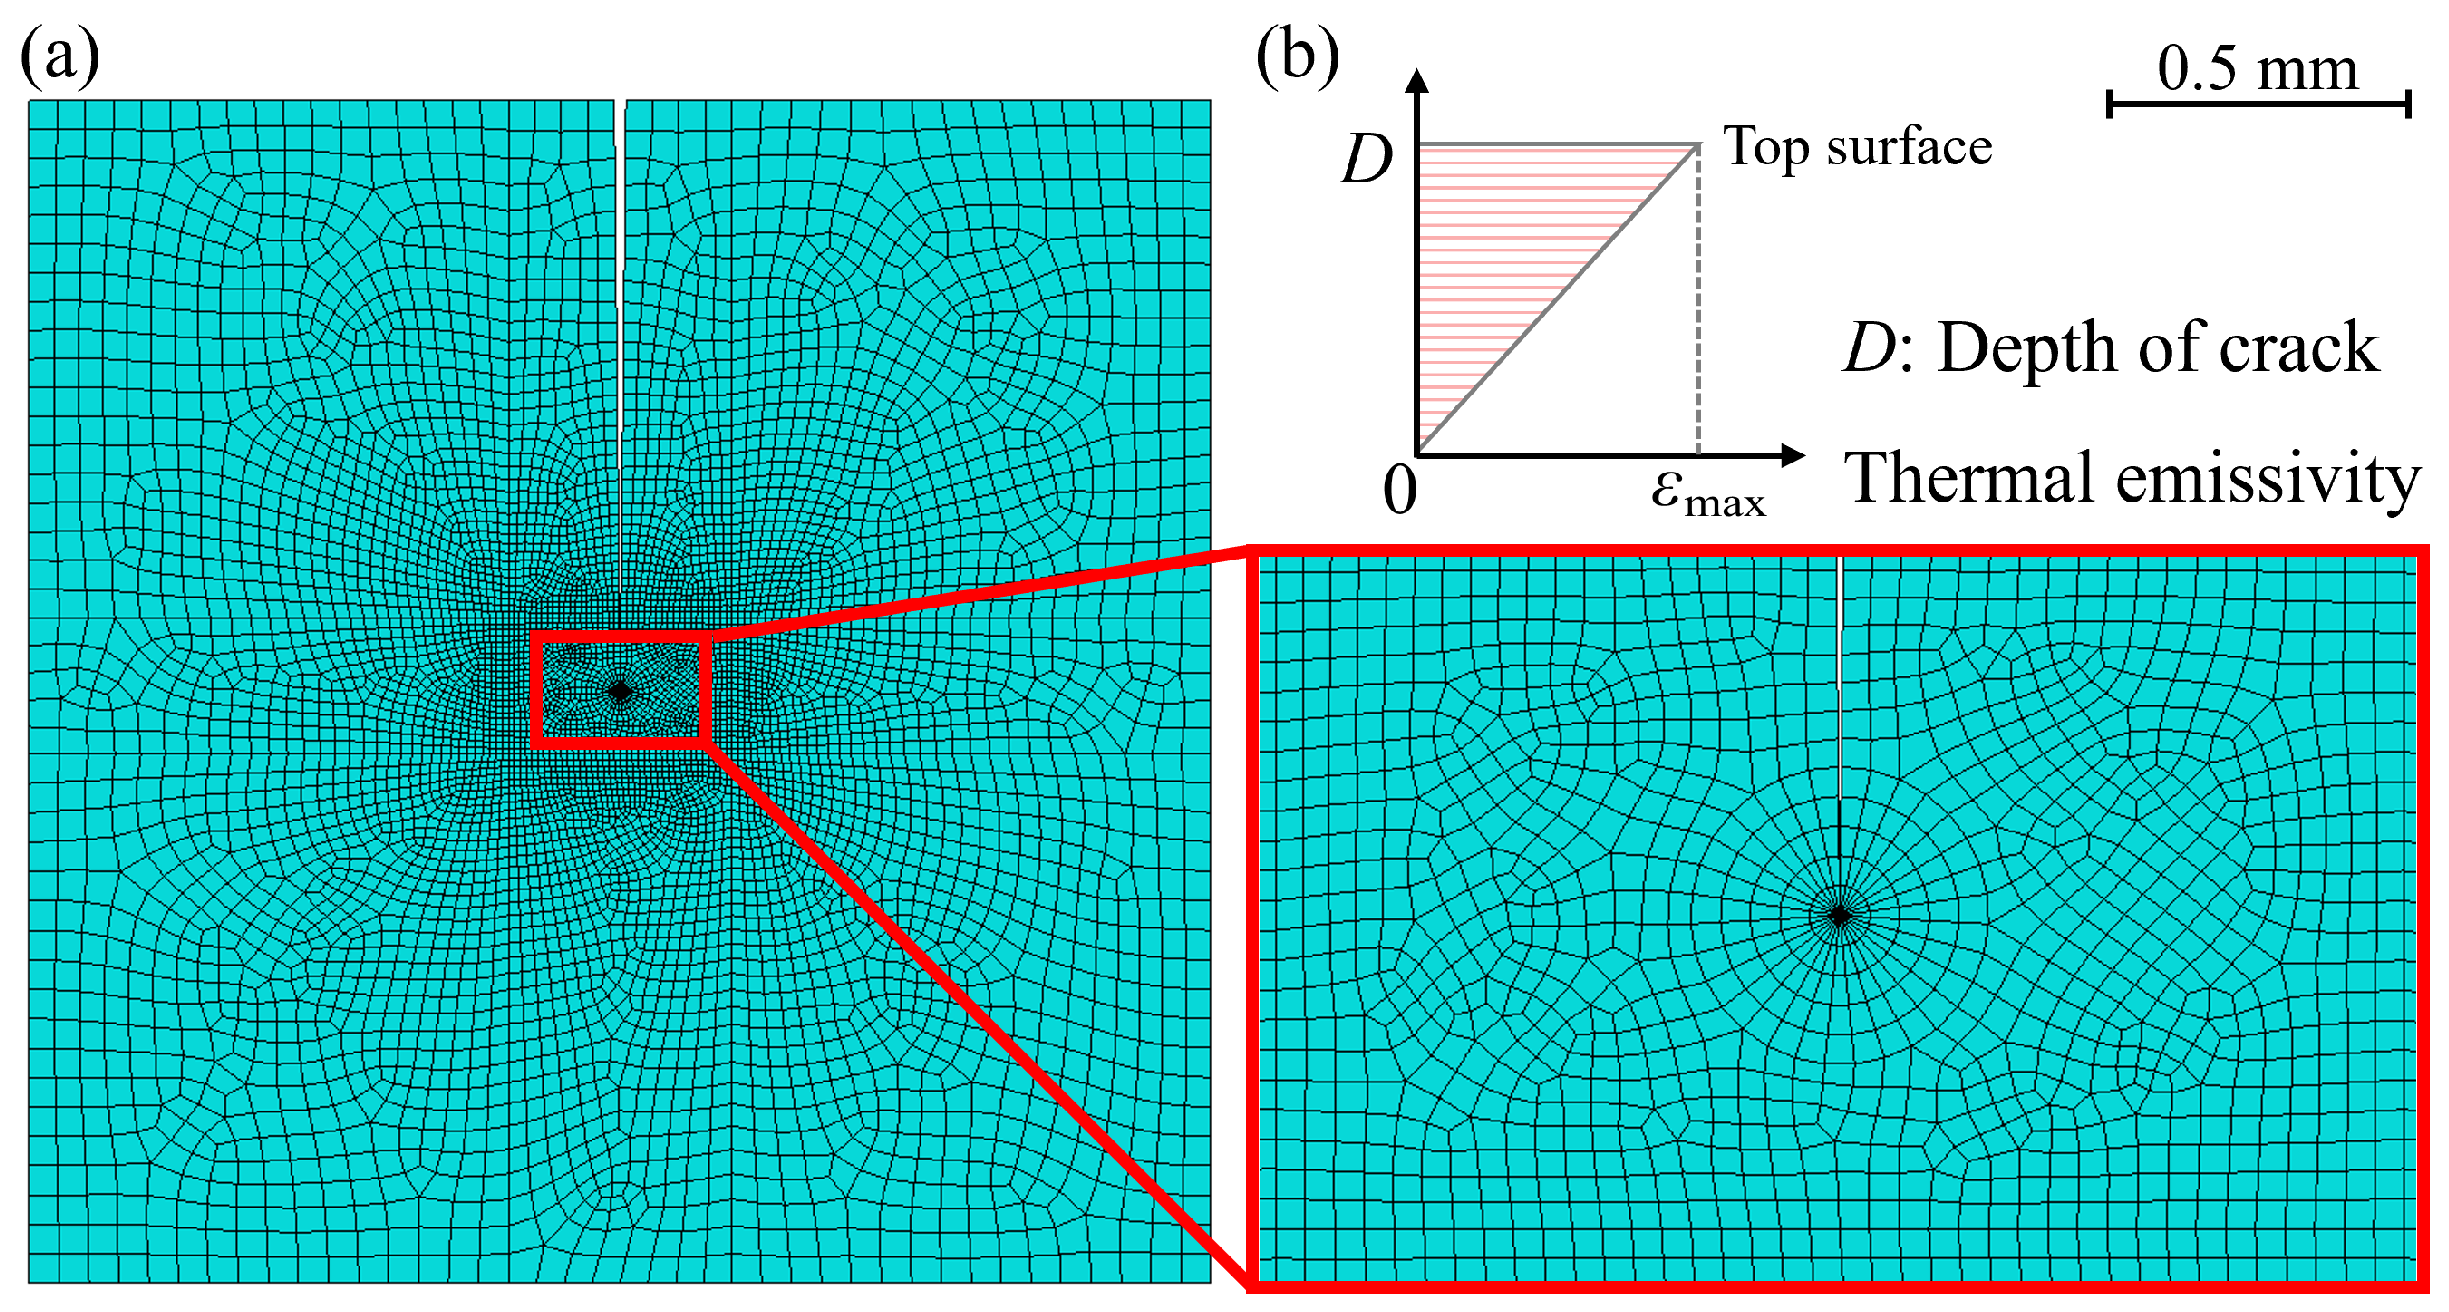
As presented in Figure 4a, a two-dimensional finite element model containing a single surface crack is established. Meshes are refined around the crack tip to capture the concentration effects. The dimension of the substrate is 2 mm × 2 mm with a crack depth of 1 mm. According to [26], the room temperature and the ambient temperature are 23 °C and 75 °C, respectively. The coating has a Young’s modulus of 5 MPa [47], a Poisson’s ratio of 0.41 [48], and a density of 1100 kg/m3 [49]. In the thermomechanical model, the thermal emissivity ( ε e m ) on the boundaries was set equal to ε max = 0.9 , and the thermal emissivity along the crack depth was assumed to change linearly with the distance to the top surface from zero to ε max , as shown in Figure 4b.

4.1.1. Interplay of Temperature and Thermal Stress

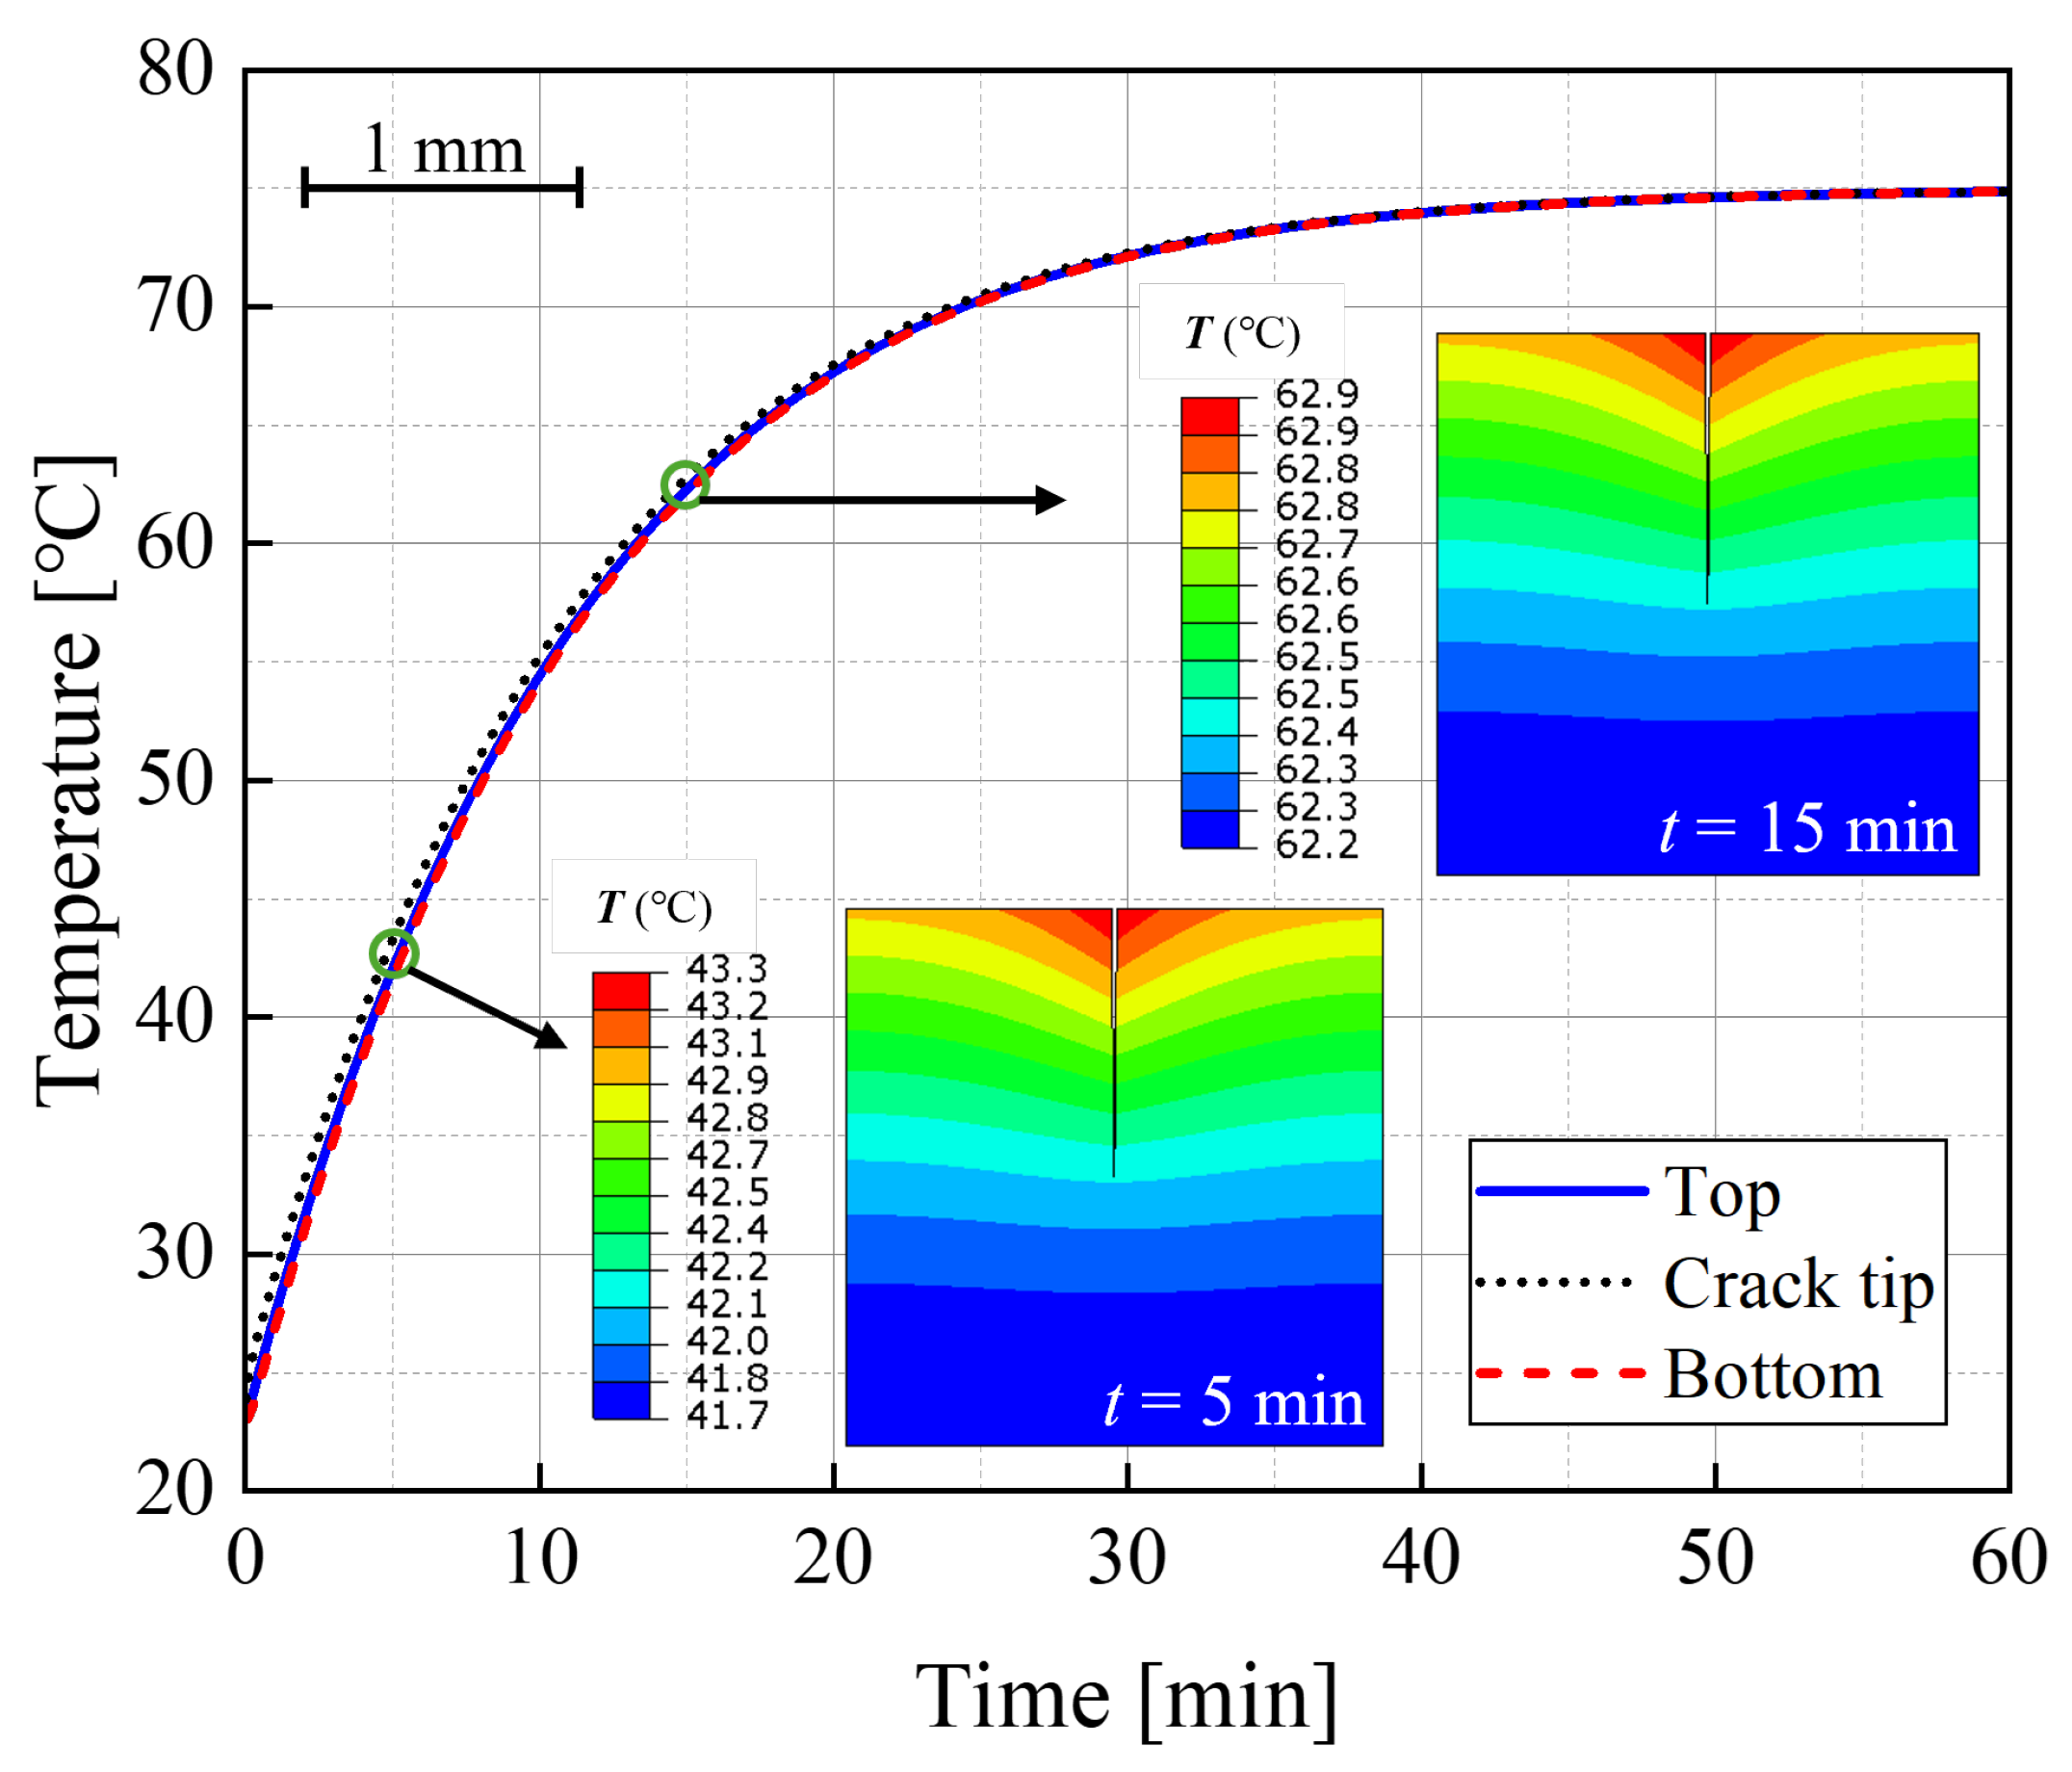
A fully coupled thermal–stress procedure was performed to analyze temperature and thermal stress simultaneously. Figure 5 demonstrates the temperature history of the three different locations of the single-crack model (top, crack tip, and bottom). In addition, thermal maps of the single-crack model at t = 5 min and t = 15 min are presented. Through thermal radiation, the temperature increases from room temperature to ambient temperature in about 45 min. It can be seen that the temperature gradient across the thickness is negligible due to the small thickness of the coating and, thus, can be ignored in the following simulation.
It is widely known that thermal stress occurs when a material undergoes a temperature change by heating or cooling, but is constrained from freely expanding or contracting, which leads to internal forces and stress within the material. Figure 6 presents the von Mises stress distribution in the single-crack model at different times. In the early stages, stress concentration occurs around the tip of the crack. As time progresses, the stress singularity at the crack tip diminishes, while stresses increase close to the boundary area due to boundary constraints.

4.1.2. Influence of Pressure Stress on Moisture Distribution

In the mass diffusion model, the stress distribution obtained from thermomechanical analysis, as shown in Figure 6, is applied to the single-crack model as predefined pressure stress. The highest relative humidity, 73% RH, is considered. The stress factor κ p can be calculated by Equation (6). The diffusion coefficient of water in the coating material is 11.03 × 10 7 mm2/s [50].
Since ABAQUS utilizes mass concentration for the input of the boundary condition, the relative humidity of the surrounding environment should be converted to moisture content (mass concentration) in parts per million (ppm), which can be derived by the following:
c n = R H P sat P tot × 10 6
where c n denotes mass concentration in ppm; R H P sat denotes the actual vapor pressure; R H is relative humidity; and P sat is the saturation vapor pressure at a given temperature. At standard atmospheric conditions, the total pressure P tot is 101.325 kPa. The saturation vapor pressure of water can be achieved via the Antoine equation [51]:
log 10 ( P sat ) = A B T + C
where P sat is in mmHg, T is the temperature in degrees Celsius, and A, B, and C are constants. For water [52], A = 7.79375 , B = 1576.129 , C = 220.56868 . P s a t for 75 °C is approximately 38.56 kPa. Thus, the mass concentration c n = 2.778 × 10 5 ppm is applied at the top of the single-crack model.
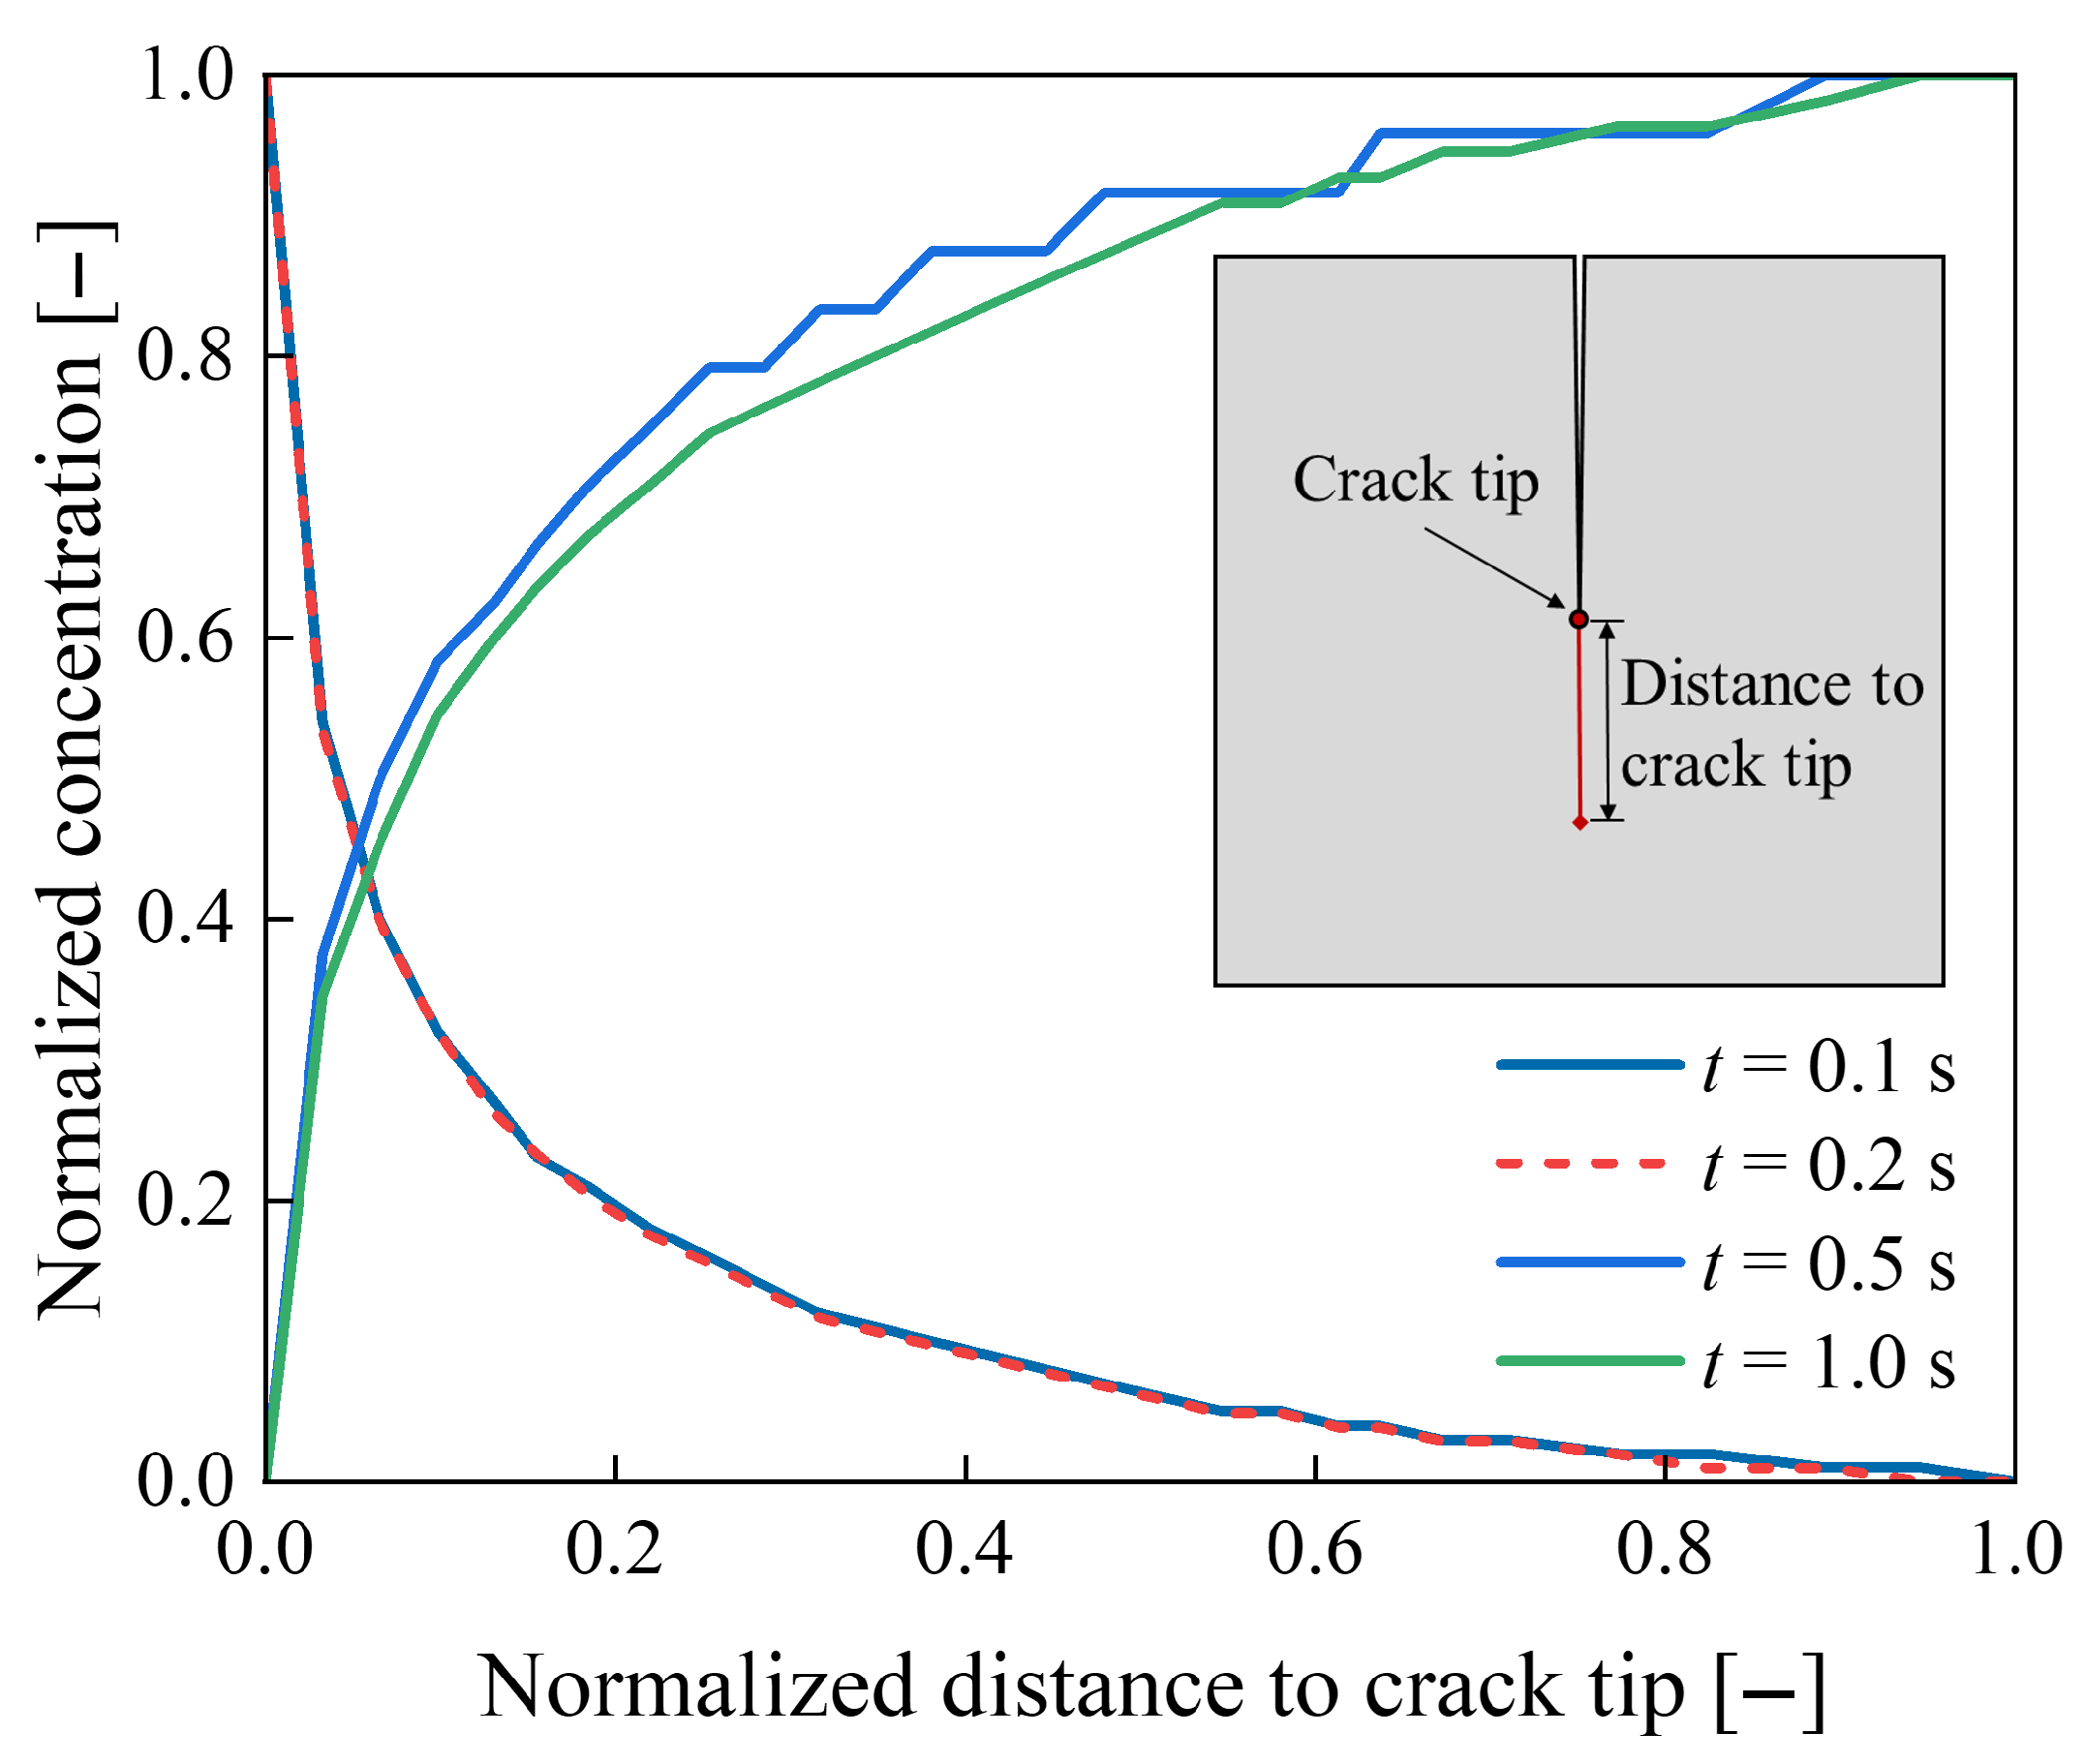
A steady-state mass diffusion procedure is performed. Figure 7 demonstrates the mass concentration of water in the coating at different times. In the beginning, the mass concentration around the crack tip is higher than in the surrounding area, which results from the stress concentration at the crack tip. As time progresses, the high mass concentration around the crack disappears as the stress rises close to the boundary area. The results indicate that the mass concentration distribution is strongly correlated to the stress field, as shown in Figure 6.
In order to compare the mass concentration distribution at different times, the mass concentration is normalized between 0 and 1. Figure 8 presents the normalized concentrations ahead of the crack tip for all four cases in Figure 7. A similar distribution can be observed in the crack tip region. Consequently, stressed regions are more prone to moisture concentration.

4.2. Damage Model of the Self-Healing Coating

The Erichsen cupping test conducted by Wittmer et al. [26] (as illustrated in Figure 9) was modeled using ABAQUS software. The Erichsen cupping test typically operates at low speed, which is regarded as a quasi-static process in the computational model [53,54]. However, in this study, the dried coating exhibits brittleness, which can lead to a dynamic response upon brittle damage. The experiment [26] clearly indicated that brittle damage occurred in the coating layer. In order to capture the dynamic damage evolution, an explicit dynamic solver was utilized to simulate the Erichsen cupping test with a step time of 0.1 s.
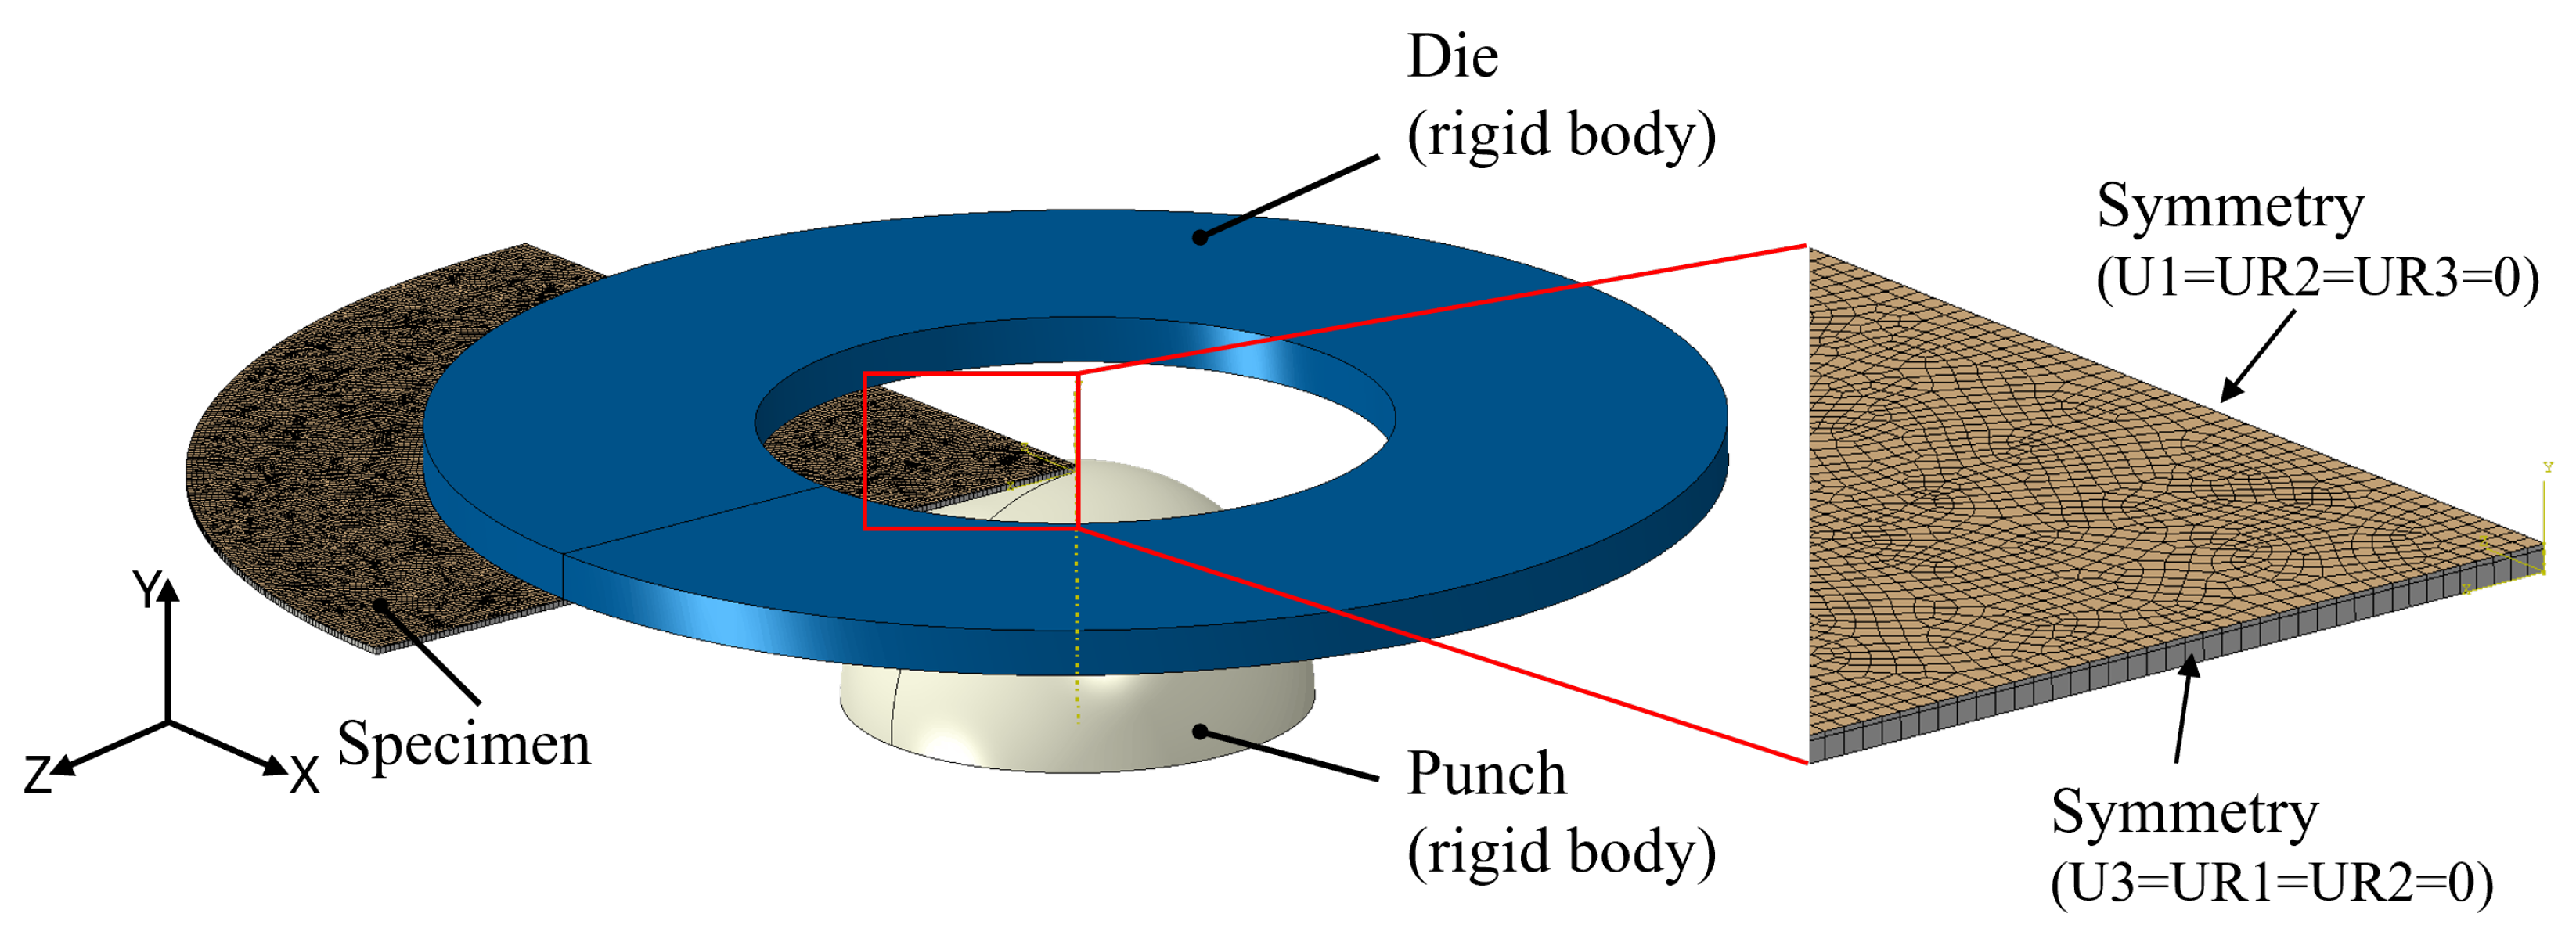
The geometry and mesh distribution of the finite element model are demonstrated in Figure 10. The aluminum [55] has a Young’s modulus of 70 GPa, a Poisson’s ratio of 0.33, and a density of 2700 kg/m3. According to [56], the elastic modulus increases significantly during dehydration. The Young’s modulus of the dried coating is determined to be 10 times that of the normal coating used in Section 4.1, which corresponds to 50 MPa in this case. The thickness of the coating used in the experiment is 60 μ m, and the thickness of the aluminum sheet is 0.25 mm. Due to the symmetry of the geometry, only a quarter of the sample is established as cylinders with a diameter of 75 mm. Symmetrical boundary conditions are applied to both sides of the specimen.
To balance efficiency and accuracy, the sample was meshed using C3D8R elements with a global mesh size of 0.25 mm. The model consists of a total of 44,286 elements. The total time period was set to 0.1 s to keep the loading rate closer to the conditions of the actual experimental setup. The nonlinear effects of large deformations were taken into account. The die and punch are modeled as analytical rigid surfaces with resolution, which may result in reduced computational time because of the intrinsic two-dimensional descriptions of the analytical surfaces. The degrees of freedom of the rigid bodies are connected to the rigid body reference nodes. A displacement of 1.7 mm was applied to the punch in the y direction, increasing linearly with time. The simulation was performed on a computing cluster using a single node with 16 CPUs.
The simulated results of maximum principal strain and von Mises stress in the coating material are shown in Figure 11 and Figure 12, respectively. The onset of damage was determined by comparing the maximum principal strain with the critical strain. As shown in Figure 11, the maximum principal strain reaches 0.48 within 0.1 s during the simulation, corresponding to a strain rate of 4.8 s−1. Due to the loading position, the maximum principal strain initially reaches its highest value in the center. As the simulation progresses, dynamic stress waves propagate and interact with reflected waves from the boundaries, resulting in a ring of stress concentration at a certain distance from the center. It can also be observed that both the strain and stress distributions exhibit a radial pattern.
Figure 13 shows the damage evolution in the coating layer and the experimentally observed damage pattern reported by Wittmer et al. [26]. The damage variable D defined in Equation (7) is used to quantify the extent of damage, where a value of 0 indicates an intact, undamaged state, and a value of 1 represents complete damage or failure. The damage initiates at the center of the sample, accumulates in a circular pattern at a certain distance from the center, and subsequently propagates radially outward. The final damage pattern aligns well with the experimental observation.

4.3. Healing Model of the Self-Healing Coating

In this section, we establish a direct relationship between the damage variable defined by stiffness degradation, D, and the damage variable defined by normalized damage area, D exp , as given in Equations (7) and (8), respectively. The exponential decay function, as given in Equation (9), is used in the computational model to characterize the healing evolution of the damage variable D. The healing process of damage in the coating material is demonstrated in Figure 14. Both the experimental results and the computational model demonstrate that healing progresses from the outer regions to the interior. Therefore, it is feasible to relate the evolution of the normalized damage area to the evolution of the stiffness degradation damage variable.
This healing behavior can be attributed to two primary factors. First, the initial damage in the outer region is generally less severe than that in the interior, which allows for faster healing. Second, according to the single-crack model, the moisture concentration is higher around crack tips, which enhances the healing process in those regions.

5. Conclusions and Future Work

In this study, we investigate a self-healing PUU polymer coating modified with UDETA through mathematical modeling and simulation. This coating leverages dynamic hydrogen bonding to enable autonomous crack repair under humid conditions. A Gaussian process regression (GPR) model is trained on 35 experimental data points (R2 = 0.79, MAE = 0.059) to quantify critical healing parameters. In addition, a multiphysics finite element model is developed to study the interplay of temperature, moisture, and stress in the presence of a single crack, aiming to better understand the healing mechanism. Our results reveal that the temperature gradient across the coating thickness is negligible due to its small thickness. Initially, stress concentrations occur around the crack tip, but over time, the stress singularity diminishes, while stresses increase near the boundary due to mechanical constraints. We also find that the mass concentration distribution within the coating is closely related to the stress field, with stressed regions showing a tendency to accumulate moisture. In addition, a damage and healing model was developed and validated with Erichsen cupping tests. We have established a direct relationship between the damage variable defined by the normalized damaged area and by stiffness degradation, which demonstrates good agreement with experimental data. Simulations revealed that stress-assisted moisture diffusion accelerates crack-tip hydration, while Erichsen cupping test models demonstrated brittle failure at a Young’s modulus of 50 MPa and a critical strain of 0.48. Incorporating an exponential decay function into the healing model accurately predicted >80% crack closure within 24 h at 50% relative humidity. By integrating experimental validation with computational modeling, this work presents a comprehensive framework for designing next-generation self-healing coating materials for wind turbine blades.
This work contributes novel insights into moisture-mediated self-healing mechanisms by linking supramolecular hydrogen-bonding interactions to macroscopic stiffness recovery and demonstrating that stress-assisted diffusion accelerates healing kinetics. The integration of machine learning with nonlinear interpolation allows the prediction of healing-relevant parameters over a wide environmental range, offering a robust pathway for tailoring coating formulations. These findings enable the systematic selection of UDETA content, coating thickness, and curing strategies to deliver coatings capable of restoring mechanical integrity multiple times over a turbine blade’s lifecycle, thus reducing maintenance interventions and extending service life. While this study is motivated by wind energy applications, the modeling framework is broadly applicable to other polyurethane- and polyurea–urethane-based coatings. The approach can therefore be extended to various industrial applications, including corrosion protection, waterproofing, and high-performance surfaces such as pipelines, storage tanks, marine hulls, and automotive components.
Future work should focus on scaling the self-healing model to full-blade geometries and validating its performance under cyclic rain erosion and UV exposure, which would support the selection of optimal materials and enable industry adoption of self-healing protective coatings to extend blade lifetimes.

Author Contributions

Conceptualization, Y.S. and L.M.J.; methodology, Y.S., L.M.J. and K.K.; software, Y.S.; validation, Y.S. and L.M.J.; formal analysis, Y.S.; investigation, Y.S., L.M.J. and K.K.; resources, L.M.J., K.K., F.S. and Y.S.; writing—original draft preparation, Y.S., L.M.J., K.K. and F.S.; writing—review and editing, Y.S., L.M.J., K.K. and F.S.; visualization, Y.S.; supervision, L.M.J.; project administration, L.M.J.; funding acquisition, L.M.J. All authors have read and agreed to the published version of the manuscript.

Funding

This research was funded by the European Commission via the Horizon project “Blades2Build: Recycle, repurpose and reuse end-of-life wind blades composites: A coupled pre- and co-processing demonstration plant, grant agreement 101096437, the Innovation Foundation of Denmark in the framework of project “WiseWind: New generation of sustainable wind turbine blades” (wisewind.dtu.dk), No. 2079-00004B, and the Velux Foundation via the project PREMISE “Preventing MIcroplastics pollution in SEa water from offshore wind” (https://premise.dtu.dk (accessed on 3 September 2025)).

Institutional Review Board Statement

Not applicable.

Informed Consent Statement

Not applicable.

Data Availability Statement

The original contributions presented in this study are included in the article. Further inquiries can be directed to the corresponding authors.

Conflicts of Interest

The authors declare no conflicts of interest.

Appendix A. Predicted Mobile Fraction Using the GPR Model

In GPR, we use a combined kernel function, k, which is defined as follows:
k = k RBF + k White
where k RBF denotes the radial basis function (RBF) kernel and k White denotes the white noise kernel.
The RBF kernel (or the Gaussian kernel) is one of the most commonly employed kernel functions used in machine learning [57]. It measures the similarity between two data points based on their Euclidean distance in a high-dimensional space. The RBF kernel projects data into an infinite-dimensional feature space, enabling non-linear modeling in algorithms. The equation of the RBF kernel is as follows:
k RBF = exp 1 2 x x 2 2
where > 0 is the characteristic length scale, determining how quickly correlations decay with distance between inputs. x x 2 represents the Euclidean distance between the input vectors x and x .
In addition, the white noise kernel describes independent, identically distributed noise that is introduced in the Gaussian process distribution:
k White = σ n 2 δ
where δ denotes the Kronecker delta, which evaluates to 1 when x = x and to 0 otherwise, and σ n 2 represents the variance of the noise, often referred to as the noise level.
The combined kernel k ( x , x ) incorporates both smooth functional behavior and observation noise.

Appendix A.1. Feature Engineering

In addition to the original input variables—temperature (T), UDETA content (U), and relative humidity (RH)—we also consider their synergistic effects by including interaction terms such as T × RH (thermal–humidity synergy) and U × RH (hydrophilicity dependence). To enhance model interpretability and performance, raw input features were transformed based on principles from polymer physics. Specifically, the inverse absolute temperature, 1/(T + 273), was used to account for Arrhenius-type temperature dependence. A quadratic term of UDETA content, U2, was included to capture potential nonmonotonic effects. Additionally, a Langmuir-type transformation, RH/(1 + RH), was applied to relative humidity to reflect adsorption behavior. The code performs feature standardization using the StandardScaler, which normalizes numerical input features by subtracting the mean and dividing by the standard deviation, resulting in features with a mean of zero and a standard deviation of one.

Appendix A.2. Model Validation

There are only 35 measured data points in previous experiments [37]. Consequently, leave-one-out cross-validation (LOOCV) can be used to evaluate the selected GPR model and to identify the optimal data features, as illustrated in Figure 3. As shown in Figure 3a, LOOCV is a specific form of k-fold cross-validation where the number of folds k is equal to the total number of data points N. Each iteration of LOOCV involves training the GPR model on N 1 data points and testing it on the single data point left out. This process is repeated N times so that each data point is used once as the test set. The advantage of LOOCV, especially in cases with limited data such as this study, lies in its ability to provide an unbiased estimate of the model’s generalization performance while maximizing the use of training data in each fold [58].
The following metrics are used to evaluate the performance of the model: mean squared error (MSE), mean absolute error (MAE), and the coefficient of determination ( R 2 ):
MSE = 1 n i = 1 n ( y i y ^ i ) 2
MAE = 1 n i = 1 n | y i y ^ i |
R 2 = 1 i = 1 n ( y i y ^ i ) 2 i = 1 n ( y i y ¯ ) 2
where n denotes the total number of observations, y i denotes the true value of the i-th data point, y ^ i denotes the corresponding predicted value, and y ¯ represents the average of the observed values, computed as y ¯ = 1 n i = 1 n y i .
The coefficient of determination, denoted as R2 [59], takes values between 0 and 1. A value of R2 close to 1 implies that the input features explain a large portion of the variance in the response variable, whereas a value near 0 indicates that the model captures very little of the observed variability.
Table A1. Experimental and predicted mobile fractions of UDETA-based PUU coatings.
No.TemperatureAmount of UDETARHMobile Fraction
(°C)(mol%)(%)ExperimentPredicted
140000.000 0.088 ± 0.160
2401100.144 0.141 ± 0.153
3402200.207 0.223 ± 0.154
4403400.322 0.294 ± 0.168
5400360.102 0.143 ± 0.151
64011360.298 0.238 ± 0.145
74022360.330 0.352 ± 0.147
84034360.378 0.478 ± 0.148
9400730.216 0.209 ± 0.165
104011730.304 0.359 ± 0.152
114022730.635 0.443 ± 0.140
124034730.609 0.620 ± 0.173
1375000.001 0.193 ± 0.140
1475600.298 0.180 ± 0.145
15751100.320 0.222 ± 0.145
16752200.313 0.311 ± 0.151
17753400.369 0.405 ± 0.163
18750180.049 0.207 ± 0.137
19756180.324 0.233 ± 0.142
207511180.348 0.278 ± 0.143
217534180.539 0.457 ± 0.151
22750360.289 0.217 ± 0.144
23756360.323 0.280 ± 0.143
247511360.342 0.330 ± 0.144
257522360.361 0.442 ± 0.141
267534360.482 0.556 ± 0.147
27750630.251 0.277 ± 0.151
28756630.378 0.340 ± 0.146
297511630.400 0.401 ± 0.146
307534630.692 0.640 ± 0.156
31750730.284 0.293 ± 0.157
32756730.340 0.369 ± 0.150
337511730.366 0.433 ± 0.147
347522730.590 0.549 ± 0.150
357534730.653 0.702 ± 0.166

Appendix B. Self-Healing Kinetics of UDETA-Based PUU Polymers

Figure A1. Fit of damage evolution in the PUU coating with 34 mol% UDETA during the healing process at 23 °C [37].
Coatings 15 01059 g0a1

References

  1. Mishnaevsky, L. Root Causes and Mechanisms of Failure of Wind Turbine Blades: Overview. Materials 2022, 15, 2959. [Google Scholar] [CrossRef]
  2. Mishnaevsky, L., Jr.; Thomsen, K. Costs of Repair of Wind Turbine Blades: Influence of Technology Aspects. Wind Energy 2020, 23, 2247–2255. [Google Scholar] [CrossRef]
  3. Jones, S.M.; Rehfeld, N.; Schreiner, C.; Dyer, K. The Development of a Novel Thin Film Test Method to Evaluate the Rain Erosion Resistance of Polyaspartate-Based Leading Edge Protection Coatings. Coatings 2023, 13, 1849. [Google Scholar] [CrossRef]
  4. Mishnaevsky, L.; Hasager, C.B.; Bak, C.; Tilg, A.M.; Bech, J.I.; Doagou Rad, S.; Fæster, S. Leading Edge Erosion of Wind Turbine Blades: Understanding, Prevention and Protection. Renew. Energy 2021, 169, 953–969. [Google Scholar] [CrossRef]
  5. Cortés, E.; Sánchez, F.; O’Carroll, A.; Madramany, B.; Hardiman, M.; Young, T.M. On the Material Characterisation of Wind Turbine Blade Coatings: The Effect of Interphase Coating–Laminate Adhesion on Rain Erosion Performance. Materials 2017, 10, 1146. [Google Scholar] [CrossRef] [PubMed]
  6. Hoksbergen, T.H.; Akkerman, R.; Baran, I. Fatigue Lifetime Prediction Model for Leading Edge Protection Coating Systems of Wind Turbine Blades. Tribol. Int. 2023, 189, 108901. [Google Scholar] [CrossRef]
  7. Bera, P.; Lakshmi, R.V.; Pathak, S.M.; Bonu, V.; Mishnaevsky, L., Jr.; Barshilia, H.C. Recent Progress in the Development and Evaluation of Rain and Solid Particle Erosion Resistant Coatings for Leading Edge Protection of Wind Turbine Blades. Polym. Rev. 2024, 64, 639–689. [Google Scholar] [CrossRef]
  8. Bech, J.I.; Hasager, C.B.; Bak, C. Extending the Life of Wind Turbine Blade Leading Edges by Reducing the Tip Speed during Extreme Precipitation Events. Wind Energy Sci. 2018, 3, 729–748. [Google Scholar] [CrossRef]
  9. Eling, B.; Tomović, Ž.; Schädler, V. Current and Future Trends in Polyurethanes: An Industrial Perspective. Macromol. Chem. Phys. 2020, 221, 2000114. [Google Scholar] [CrossRef]
  10. Finnegan, W.; Flanagan, M.; Ó Coistealbha, R.; Dasan Keeryadath, P.; Meier, P.; Chi Hung, L.; Flanagan, T.; Goggins, J. A Novel Solution for Preventing Leading Edge Erosion in Wind Turbine Blades. J. Struct. Integr. Maint. 2021, 6, 136–147. [Google Scholar] [CrossRef]
  11. Yu, K.; Zhang, Y.; OuYang, H.; Ahmad, H.A.; Ren, Z.H.; Guan, Z.H. Degradable, Self-Healing, Humidity-Driven Poly(Urethane-Urea) Film. Polymer 2024, 308, 127358. [Google Scholar] [CrossRef]
  12. Engels, H.W.; Pirkl, H.G.; Albers, R.; Albach, R.W.; Krause, J.; Hoffmann, A.; Casselmann, H.; Dormish, J. Polyurethanes: Versatile Materials and Sustainable Problem Solvers for Today’s Challenges. Angew. Chem. Int. Ed. 2013, 52, 9422–9441. [Google Scholar] [CrossRef]
  13. Hia, I.L.; Vahedi, V.; Pasbakhsh, P. Self-Healing Polymer Composites: Prospects, Challenges, and Applications. Polym. Rev. 2016, 56, 225–261. [Google Scholar] [CrossRef]
  14. Nik Md Noordin Kahar, N.N.F.; Osman, A.F.; Alosime, E.; Arsat, N.; Mohammad Azman, N.A.; Syamsir, A.; Itam, Z.; Abdul Hamid, Z.A. The Versatility of Polymeric Materials as Self-Healing Agents for Various Types of Applications: A Review. Polymers 2021, 13, 1194. [Google Scholar] [CrossRef]
  15. Shen, R.; Amano, R.S.; Lewinski, G.; Matt, A.K.K. A New Vascular System Highly Efficient in the Storage and Transport of Healing Agent for Self-Healing Wind Turbine Blades. J. Energy Resour. Technol. 2019, 141, 051212. [Google Scholar] [CrossRef]
  16. Choi, K.; Noh, A.; Kim, J.; Hong, P.H.; Ko, M.J.; Hong, S.W. Properties and Applications of Self-Healing Polymeric Materials: A Review. Polymers 2023, 15, 4408. [Google Scholar] [CrossRef] [PubMed]
  17. Wan, P.; Wu, S.; Liu, Q.; Wang, H.; Gong, X.; Zhao, Z.; Xu, S.; Jiang, J.; Fan, L.; Tu, L. Extrinsic Self-Healing Asphalt Materials: A Mini Review. J. Clean. Prod. 2023, 425, 138910. [Google Scholar] [CrossRef]
  18. Xu, Y.; Shen, R.; Tang, J.; Zou, X.; Wan, W.; Guo, H. Optimizing Mechanical Properties and Corrosion Resistance in Core-Shell Nanofiber Epoxy Self-Healing Coatings: Impact of Shell Material Variation. Polym. Eng. Sci. 2024, 64, 1770–1785. [Google Scholar] [CrossRef]
  19. Li, B.; Cao, P.F.; Saito, T.; Sokolov, A.P. Intrinsically Self-Healing Polymers: From Mechanistic Insight to Current Challenges. Chem. Rev. 2023, 123, 701–735. [Google Scholar] [CrossRef]
  20. Mohd Sani, N.F.; Yee, H.J.; Othman, N.; Talib, A.A.; Shuib, R.K. Intrinsic Self-Healing Rubber: A Review and Perspective of Material and Reinforcement. Polym. Test. 2022, 111, 107598. [Google Scholar] [CrossRef]
  21. Jin, H.; Mangun, C.L.; Griffin, A.S.; Moore, J.S.; Sottos, N.R.; White, S.R. Thermally stable autonomic healing in epoxy using a dual-microcapsule system. Adv. Mater. 2014, 26, 282–287. [Google Scholar] [CrossRef]
  22. Cohades, A.; Manfredi, E.; Plummer, C.J.G.; Michaud, V. Thermal Mending in Immiscible Poly(ε-Caprolactone)/Epoxy Blends. Eur. Polym. J. 2016, 81, 114–128. [Google Scholar] [CrossRef]
  23. Cordier, P.; Tournilhac, F.; Soulié-Ziakovic, C.; Leibler, L. Self-Healing and Thermoreversible Rubber from Supramolecular Assembly. Nature 2008, 451, 977–980. [Google Scholar] [CrossRef] [PubMed]
  24. Eom, Y.; Kim, S.M.; Lee, M.; Jeon, H.; Park, J.; Lee, E.S.; Hwang, S.Y.; Park, J.; Oh, D.X. Mechano-Responsive Hydrogen-Bonding Array of Thermoplastic Polyurethane Elastomer Captures Both Strength and Self-Healing. Nat. Commun. 2021, 12, 621. [Google Scholar] [CrossRef]
  25. Wei, Y.; Ma, X. The Self-healing Cross-linked Polyurethane by Diels–Alder Polymerization. Adv. Polym. Technol. 2018, 37, 1987–1993. [Google Scholar] [CrossRef]
  26. Wittmer, A.; Brinkmann, A.; Stenzel, V.; Hartwig, A.; Koschek, K. Moisture-Mediated Intrinsic Self-Healing of Modified Polyurethane Urea Polymers. J. Polym. Sci. Part A Polym. Chem. 2018, 56, 537–548. [Google Scholar] [CrossRef]
  27. Chen, X.; Shen, Z.; Jia, H.; Gao, Y.; Zhang, M.; Luo, Y.; Luo, Z. Understanding the Self-Healing Mechanism of Polyurethane Elastomer Based on Hydrogen Bonding Interactions through Molecular Dynamics Simulation. Macromol. Theory Simulations 2022, 31, 2100051. [Google Scholar] [CrossRef]
  28. Chen, X.; Zhu, J.; Luo, Y.; Chen, J.; Ma, X.; Bukhvalov, D.; Liu, H.; Zhang, M.; Luo, Z. Molecular Dynamics Simulation Insight into the Temperature Dependence and Healing Mechanism of an Intrinsic Self-Healing Polyurethane Elastomer. Phys. Chem. Chem. Phys. 2020, 22, 17620–17631. [Google Scholar] [CrossRef]
  29. Zheng, X.; Yang, H.; Sun, Y.; Zhang, Y.; Guo, Y. A Molecular Dynamics Simulation on Self-Healing Behavior Based on Disulfide Bond Exchange Reactions. Polymer 2021, 212, 123111. [Google Scholar] [CrossRef]
  30. Casillas, G.E.; Vazquez, A.E.; Gomez, F.J.R.; Vásquez, A.P.; Mata, R.; Miralrio, A.; Castro, M.; Martínez, R.G.; Cruz, R.O. Corrosion inhibition with a perezone-impregnated Mg/Al hydrotalcite coating in AS21 alloy. Electrochim. Acta 2023, 456, 142428. [Google Scholar] [CrossRef]
  31. Wu, S.; Wang, J.; Liu, T.; Guo, X.; Ma, L. Sulfosalicylic acid modified carbon dots as effective corrosion inhibitor and fluorescent corrosion indicator for carbon steel in HCl solution. Colloids Surfaces A: Physicochem. Eng. Asp. 2023, 661, 130951. [Google Scholar] [CrossRef]
  32. Fang, Y.; Yue, T.; Li, S.; Zhang, Z.; Liu, J.; Zhang, L. Molecular dynamics simulations of self-healing topological copolymers with a comblike structure. Macromolecules 2021, 54, 1095–1105. [Google Scholar] [CrossRef]
  33. Tang, J.; Wang, H. Compatibility and Self-Healing Properties of Asphalt Binder with Polyethylene Plastics: Observations from Coarse-Grained Molecular Simulation. J. Mater. Civ. Eng. 2023, 35, 04023412. [Google Scholar] [CrossRef]
  34. Wen, J.; Xu, G.; Liang, Z.; Li, S.; Wang, Y.; Yang, J.; Nie, Y. Combing experimental methods and molecular simulations to study self-healing behaviors of polyurethane elastomers containing multiple hydrogen bond networks and flexible blocks. Phys. Chem. Chem. Phys. 2023, 25, 28162–28179. [Google Scholar] [CrossRef]
  35. Sun, Y.; Simonini, L.; Xing, C.; Mishnaevsky, L. Self-Healing Interfaces in Fiber Reinforced Polymers: Computational Modeling. Compos. Sci. Technol. 2025, 270, 111269. [Google Scholar] [CrossRef]
  36. Sun, Y.; Mishnaevsky, L., Jr. Healable polymer blends: Computational analysis of damage and healing mechanisms. Int. J. Mech. Sci. 2025, 287, 109938. [Google Scholar] [CrossRef]
  37. Wittmer, A.; Wellen, R.; Saalwächter, K.; Koschek, K. Moisture-Mediated Self-Healing Kinetics and Molecular Dynamics in Modified Polyurethane Urea Polymers. Polymer 2018, 151, 125–135. [Google Scholar] [CrossRef]
  38. Stetsyshyn, Y.; Ohar, H.; Budkowski, A.; Lazzara, G. Molecular Design and Role of the Dynamic Hydrogen Bonds and Hydrophobic Interactions in Temperature-Switchable Polymers: From Understanding to Applications. Polymers 2025, 17, 1580. [Google Scholar] [CrossRef]
  39. Lepot, M.; Aubin, J.B.; Clemens, F.H.L.R. Interpolation in Time Series: An Introductive Overview of Existing Methods, Their Performance Criteria and Uncertainty Assessment. Water 2017, 9, 796. [Google Scholar] [CrossRef]
  40. Rasmussen, C.E.; Williams, C.K.I. Gaussian Processes for Machine Learning, 3rd print ed.; Adaptive Computation and Machine Learning; MIT Press: Cambridge, MA, USA, 2008. [Google Scholar]
  41. Esmaeilbeigi, M.; Chatrabgoun, O.; Cavoretto, R.; De Rossi, A.; Shafa, M. Sparse Gaussian Process Regression via Compactly Supported Kernels: A Trade-off between Accuracy and Computational Efficiency. Inf. Sci. 2025, 717, 122306. [Google Scholar] [CrossRef]
  42. Pedregosa, F.; Varoquaux, G.; Gramfort, A.; Michel, V.; Thirion, B.; Grisel, O.; Blondel, M.; Prettenhofer, P.; Weiss, R.; Dubourg, V.; et al. Scikit-Learn: Machine Learning in Python. J. Mach. Learn. Res. 2011, 12, 2825–2830. [Google Scholar]
  43. Incropera, F.P.; DeWitt, D.P.; Bergman, T.L.; Lavine, A.S. (Eds.) Principles of Heat and Mass Transfer, 7th ed.; International Student Version ed.; Wiley: Hoboken, NJ, USA, 2013. [Google Scholar]
  44. Fick, A. Ueber Diffusion. Ann. Der Phys. 1855, 170, 59–86. [Google Scholar] [CrossRef]
  45. De Nevers, N. Physical and Chemical Equilibrium for Chemical Engineers, 2nd ed.; Wiley: Hoboken, NJ, USA, 2012. [Google Scholar]
  46. Kurumatani, M.; Terada, K.; Kato, J.; Kyoya, T.; Kashiyama, K. An Isotropic Damage Model Based on Fracture Mechanics for Concrete. Eng. Fract. Mech. 2016, 155, 49–66. [Google Scholar] [CrossRef]
  47. Bian, X.; He, J.; He, M.; Liu, B.; Zhang, Y. Study on the Properties of Polyurethane–Urea Elastomers Prepared by TDI/MDI Mixture. Int. J. Polym. Sci. 2024, 2024, 9248135. [Google Scholar] [CrossRef]
  48. Karpiesiuk, J. Young’s Modulus and Poisson’s Ratio of Polyurethane Adhesive in Lightweight Floor System. Mod. Approaches Mater. Sci. 2020, 2, 251–255. [Google Scholar] [CrossRef]
  49. Pugar, J.A.; Gang, C.; Huang, C.; Haider, K.W.; Washburn, N.R. Predicting Young’s Modulus of Linear Polyurethane and Polyurethane–Polyurea Elastomers: Bridging Length Scales with Physicochemical Modeling and Machine Learning. ACS Appl. Mater. Interfaces 2022, 14, 16568–16581. [Google Scholar] [CrossRef]
  50. Wittchen, S.; Kahl, H.; Waltschew, D.; Shahzad, I.; Beiner, M.; Cepus, V. Diffusion Coefficients of Polyurethane Coatings by Swelling Experiments Using Dielectric Spectroscopy. J. Appl. Polym. Sci. 2020, 137, 49174. [Google Scholar] [CrossRef]
  51. Thomson, G.W. The Antoine Equation for Vapor-pressure Data. Chem. Rev. 1946, 38, 1–39. [Google Scholar] [CrossRef] [PubMed]
  52. Zaoui-Djelloul-Daouadji, M.; Negadi, A.; Mokbel, I.; Negadi, L. (Vapor-liquid) Equilibria and Excess Gibbs Free Energy Functions of (Ethanol + Glycerol), or (Water + Glycerol) Binary Mixtures at Several Temperatures. J. Chem. Thermodyn. 2014, 69, 165–171. [Google Scholar] [CrossRef]
  53. Sorce, F.S.; Ngo, S.; Lowe, C.; Taylor, A.C. Quantification of Coating Surface Strains in Erichsen Cupping Tests. J. Mater. Sci. 2019, 54, 7997–8009. [Google Scholar] [CrossRef]
  54. Eom, J.H.; Jeon, H.J.; Babu, J.S.S.; Kang, N.S.; Lim, O.D.; Kim, C.; Lee, M.S. Experimental and Simulation Studies of Erichsen Cupping Test on Aluminum(7075) Sheet Using Damage Theory. Int. J. Precis. Eng. Manuf. 2024, 25, 1639–1649. [Google Scholar] [CrossRef]
  55. Sun, Y.; Xing, C.; Zhang, C.; Tao, C.; Ji, H.; Qiu, J. A 3D Homogenized Model for Nonlinear Wave Interaction with Randomly Distributed Microcracks. Acta Mech. Solida Sin. 2022, 35, 961–971. [Google Scholar] [CrossRef]
  56. Li, Z.; Liu, Z.; Ng, T.Y.; Sharma, P. The Effect of Water Content on the Elastic Modulus and Fracture Energy of Hydrogel. Extrem. Mech. Lett. 2020, 35, 100617. [Google Scholar] [CrossRef]
  57. Vásquez, J.C.G.; Kumral, M. Artificial Neural Networks and Support Vector Machines for More Accurate Cost Estimation in Underground Mining: A Contractor’s Viewpoint. Mach. Learn. Appl. 2025, 21, 100689. [Google Scholar] [CrossRef]
  58. Arlot, S.; Celisse, A. A Survey of Cross-Validation Procedures for Model Selection. Stat. Surv. 2010, 4, 40–79. [Google Scholar] [CrossRef]
  59. Ramachandran, K.M.; Tsokos, C.P. (Eds.) Chapter 7—Linear Regression Models. In Mathematical Statistics with Applications in R, 3rd ed.; Academic Press: Cambridge, MA, USA, 2021; pp. 301–341. [Google Scholar] [CrossRef]
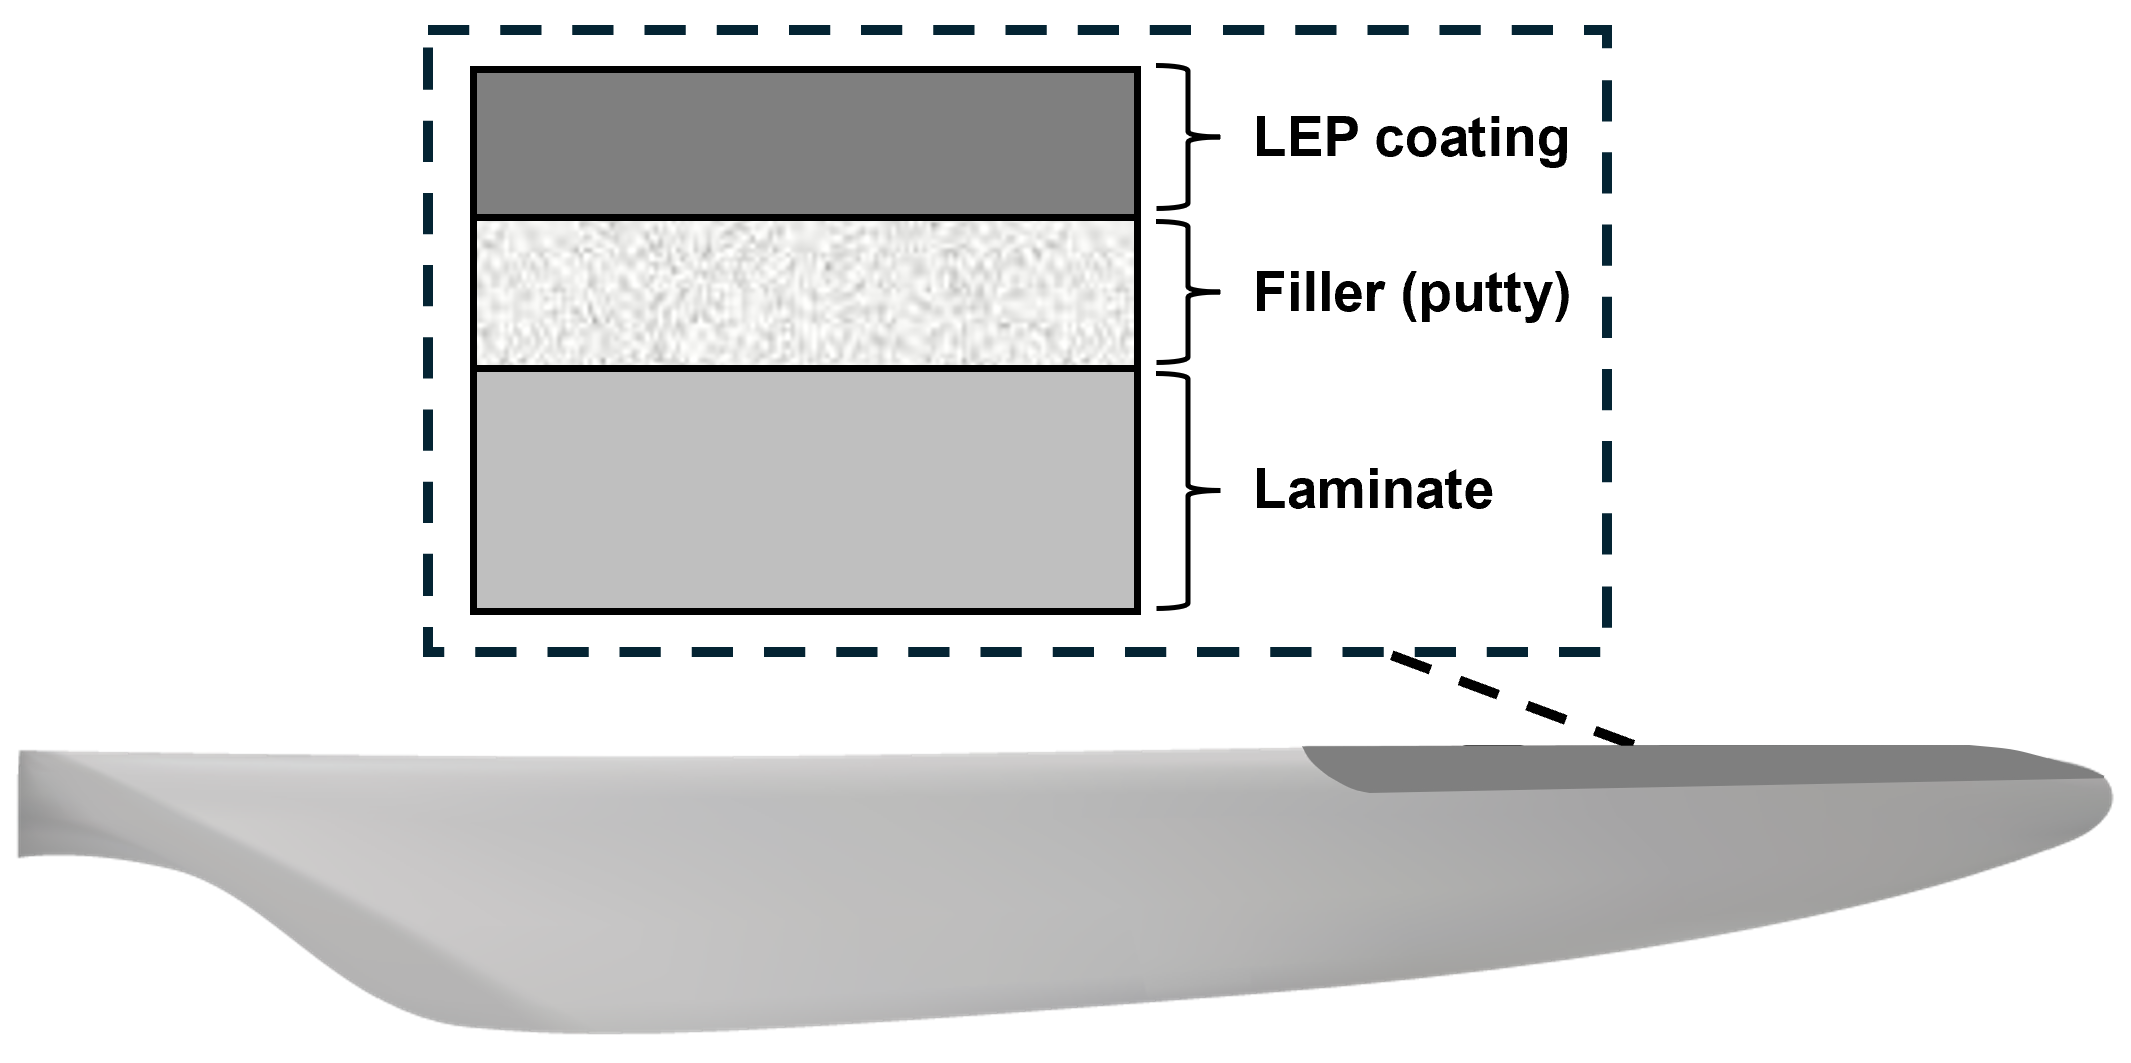
Figure 1. Typical structure of the leading-edge protection (LEP) system for wind blades.
Coatings 15 01059 g001
Figure 2. (a) Self-healing mechanism and (b) synthesis of UDETA-based PUU coatings.
Coatings 15 01059 g002
Figure 3. (a) Leave-one-out cross-validation (LOOCV). (b) Gaussian process regression (GPR) algorithm for mobile fraction prediction.
Coatings 15 01059 g003
Figure 4. Coupled thermal–stress model of a single crack: (a) mesh distribution. (b) Thermal emissivity along the crack surface.
Coatings 15 01059 g004
Figure 5. Temperature history and distribution in the single-crack model.
Coatings 15 01059 g005
Figure 6. von Mises stress distribution in the single-crack model at: (a) t = 0.8 min; (b) t = 5.0 min; (c) t = 7.0 min; (d) t = 37.8 min.
Coatings 15 01059 g006
Figure 7. Water mass concentration distribution in the single-crack model at: (a) Step time = 0.1 s; (b) Step time = 0.2 s; (c) Step time = 0.5 s; (d) Step time = 1.0 s.
Coatings 15 01059 g007
Figure 8. Water normalized concentration distribution ahead of the crack tip.
Coatings 15 01059 g008
Figure 9. Schematic diagram of Erichsen cupping test.
Coatings 15 01059 g009
Figure 10. Finite element model of Erichsen cupping test.
Coatings 15 01059 g010
Figure 11. Maximum principal strain distribution in the coating layer after Erichsen cupping test at: (a) t = 0.01 s; (b) t = 0.025 s; (c) t = 0.0045 s; (d) t = 0.1 s.
Coatings 15 01059 g011
Figure 12. von Mises stress distribution in the coating layer after the Erichsen cupping test at: (a) t = 0.01 s; (b) t = 0.025 s; (c) t = 0.0045 s; (d) t = 0.1 s.
Coatings 15 01059 g012
Figure 13. Damage evolution in the coating layer compared with experimental results: (ae) Simulation results of damage evolution at different times; (f) Experimental result of final damage pattern [26].
Coatings 15 01059 g013
Figure 14. (a) Self-healing of radial cracks in 34 mol% UDETA coating induced by Erichsen cupping at 23 °C and 50% RH (adapted from Wittmer et al. [26]). (b) Self-healing of cracks in the computational model (crack healing progression from outer region to inside (left to right)).
Coatings 15 01059 g014
Disclaimer/Publisher’s Note: The statements, opinions and data contained in all publications are solely those of the individual author(s) and contributor(s) and not of MDPI and/or the editor(s). MDPI and/or the editor(s) disclaim responsibility for any injury to people or property resulting from any ideas, methods, instructions or products referred to in the content.