Article

A Study of HiPIMS Process Characteristics in SiO2 Deposition

1
Institute for Technical Physics and Materials Science, HUN-REN Centre for Energy Research, H-1121 Budapest, Hungary
2
Department of Materials Physics, Eötvös Loránd University, H-1117 Budapest, Hungary
*
Author to whom correspondence should be addressed.
Coatings 2025, 15(9), 1023; https://doi.org/10.3390/coatings15091023
Submission received: 5 August 2025 / Revised: 25 August 2025 / Accepted: 27 August 2025 / Published: 2 September 2025
(This article belongs to the Section Thin Films)

Abstract

In this study, SiO2 thin films were sputtered from a Si target using reactive HiPIMS (high-power impulse magnetron sputtering) in an argon–oxygen process gas. In order to understand the behavior of HiPIMS, the deposition process was studied by systematically varying the sputtering parameters and monitoring the current waveforms. A decaying transient was observed at the leading edge of the pulse, caused by the L-C term of the HiPIMS generator, the cable, and the target. To investigate the periodic transient, we used, to the best of our knowledge, for the first time, a standing wave ratio meter (SWR). In order to be able to deposit films with the desired properties, the target voltage and its associated current characteristics were also investigated. The formation of a distinct step-like shape in the current–voltage characteristics is observed during reactive sputtering. A simple physical model was used to determine the position and length of the plateau. The appearance of hysteresis, which is typical of reactive sputtering, was also observed. These findings may help us to better understand the mechanism of reactive HiPIMS deposition of SiO2.

Graphical Abstract

1. Introduction

Silicon dioxide layers have a wide range of applications in electronics and optoelectronics, such as anti-reflection coatings [1], protective coatings [2], low-refractive index layers in optical devices [3], surface passivation layers [4], gate dielectrics for thin-film transistors [5], and wafer bonding and masking layers used in micro-electromechanical systems (MEMSs) [6]. SiO2 films can also be used in biomedical applications [7] and as superhydrophobic, wear-resistant layers [8].
Of the many available thin-film deposition techniques, reactive sputtering is of great importance because it can be performed at ambient temperatures. Quite a few articles have already been published on the topic of the radio-frequency (RF), direct current (DC), and pulsed DC sputtering of a Si target [9,10,11]. Although it is one of the most widely used materials in semiconductor thin-film technology and currently also in photonics, relatively few publications have been published on SiO2 deposition by HiPIMS [12,13,14].
A high degree of stability of reactive sputtering is required for the deposition of high-quality coatings [15,16,17], with properly chosen process parameters (e.g., sputtering power, reactive gas pressure, etc.). The correct process parameters ensure the deposition of coatings with the desired stoichiometry. However, an unintentional transition of the target surface from the so-called metallic to the poisoned state (or vice versa) can occur if a parameter set is chosen that causes the system to operate near the transition region [18]. Using an appropriate feedback control can stabilize the reactive sputtering process [19]. In addition, arc formation can also be a serious problem that degrades the properties of the deposited layers. During arcing, the current density increases locally, which can lead to the melting of the target and, consequently, the ejection of clusters and droplets. Strategies used to suppress arc formation—ultrashort HiPIMS pulses [14] or the use of appropriate reverse pulses as demonstrated by Oniszczuk and co-workers [20]—have been shown to improve the optical properties of the deposited SiO2 layers.
Despite some previous studies on this subject, there is limited knowledge about the HiPIMS deposition process of SiO2, and there are still some aspects of this process that need to be addressed. For example, the ignition mechanism of the discharge is not clearly understood. In this work, we approach the HiPIMS deposition of SiO2 from a technological viewpoint. Our aim is to investigate the electrical characteristics of the HiPIMS process, during which we pay special attention to monitoring the electrical matching between the generator and the Si target.

2. Materials and Methods

The experiments were performed in a stainless steel ultra-high vacuum (UHV) chamber at a base pressure of 2 × 10⁻⁶ Pa, which was evacuated by a Pfeiffer TMU 521 turbomolecular pump. An Edwards NXDS 15i dry scroll pump created the forevacuum. HiPIMS (high-power impulse magnetron sputtering) experiments were carried out by using a HiPSTER 1 power supply unit by Ioanautics AB (Linköping, Sweden). Sputtering was carried out using an AJA International A 320 magnetron source. The magnets of the source were arranged to provide unbalanced plasma configuration, as well as maximal sputtering rate. The sputtering target was a 2″ diameter and 6 mm thick, undoped Si target (99.999% purity) (Kurt J. Lesker Company, Jefferson Hills, PA, USA). The target-substrate distance was 10 cm. During the experiments, the pumping speed of the pump was reduced to 40% by using a throttle valve. The flow of oxygen gas was controlled by an EL-FLOW Prestige mass flow meter (Bronkhorst High-Tech B.V., Ruurlo, The Netherlands), while Ar working gas was introduced through a needle valve. SiO2 layers were sputtered with different discharge current densities. The oxygen flow was set to 2 sccm (which translates to 0.073 Pa of partial pressure). The total pressure, the pulse frequency, the pulse length, and the deposition time were 1 Pa, 10 kHz, 10 µs, and 20 min, respectively, for all deposition experiments. Ge single crystals were used as the substrate material.
The current–voltage characteristics were measured in a power-controlled mode, i.e., the power was decreased step by step, while the corresponding average current and voltage values (these were not limited) were recorded as displayed by the HiPIMS generator. The characteristics created with the obtained data exactly match those recorded, for example, in voltage-controlled mode. Consequently, the internal resistance of the generator does not change during the different operating modes. We installed a 100-fold resistance divider in order to examine the effect of the feed line (connectors and coaxial cable) on the pulse shape. This monitoring output is provided by the generator to measure the voltage and the current of the pulses over time. We have also integrated an SWR (standing wave ratio) meter (BIRD, Solon, OH, USA) into the power line between the target and the HiPIMS generator (see Figure 1); its measurement range is limited to 2–30 MHz frequency. The purpose of the instrument was to verify the propagation properties of the frequency components in the 2–30 MHz range. The modes, i.e., electromagnetic waves with a specific frequency that generate the pulses, travel simultaneously in opposite directions in the coaxial cable, i.e., the waves traveling from the generator towards the target and reflected waves from the target to the generator. Waves of the same frequency traveling in opposite directions result in standing waves in the coaxial cable. The ratio of forward traveling and reflected waves (the standing wave ratio, SWR) characterizes the impedance matching between the target-plasma system and the generator.
The standing wave ratio (SWR) is the ratio of the highest and lowest voltages occurring along the feed line: (Uforward + Ureflected)/(UforwardUreflected). If the termination is matched, there is no reflected voltage, therefore SWR = 1. In the case of a mismatch, SWR is greater than 1. At extreme termination (open circuit or short circuit) Uforward = Ureflected; therefore, the value of SRW is infinite. It can be shown that if the base resistance of the target-plasma system is Zt and the impedance of the generator is Zo, then the standing wave ratio SWR = Zt/Zo. Knowing the standing wave ratio allows us to determine the ratio of reflected (inactive) power to total power; this ratio can be calculated as (SWR − 1)2/(SWR + 1)2 in the 2–30 MHz frequency region.
The optical properties of the deposited films were determined by spectroscopic ellipsometry using an M2000 (WOOLLAM, Lincoln, NE, USA) spectroscopic ellipsometer in the wavelength range of 190–1690 nm at an incidence angle of 70°. The layer thickness and refractive index of the specimens were evaluated using the CompleteEase software (version number 5.15). The atomic composition of the films was measured by energy dispersive spectroscopy (EDS) using a Scios 2 dual beam scanning electron microscope with an electron beam of 4.2 keV energy and 3.2 nA current.

3. Results

Deposition of the silicon oxide layers was carried out at fixed current densities that are presented in Table 1 along with the measured film thickness, refractive index (at 632.8 nm), and O/Si atomic concentration ratio. It can be seen that the layers have a composition close to the SiO2 stoichiometry (O/Si at% ratio = 2), with a small variation of up to 10%, depending on the current density used during sputtering. Consistent with this, the refractive indices are also close to the refractive index of fused silica glass (1.457) [21].

3.1. Electrical Characterization of the Discharge

Our experiments demonstrated that the discharge can be maintained using a Si target in the system described above. This indicates that coupling of the DC component and/or some of the frequency components composing the pulses is sufficient to maintain the discharge. The successful sputtering experiment also means that the target surface is regularly neutralized during the sputtering process. In some earlier reports this neutralization of the accumulating charges was assisted by a small positive pulse on the target after the HIPIMS pulse (see, e.g., [20,22,23]).
As we did not apply such positive pulses, it seems necessary to clarify the ignition and maintenance mechanism of the discharge required for sputtering. In the case of RF sputtering, the operating mechanism is understandable; a displacement current is created in the target (which can be considered as a capacity) and it is also responsible for feeding electrical energy to the discharge. Charge build-up is prevented by the alternating ion and electron bombardment of the target surface. However, for HiPIMS, further systematic studies are needed to fully understand the sputtering mechanism. For this purpose, we compared the current waveforms generated by our HiPIMS generator connected to the Si target or a 50 Ω termination (Figure 2). Figure 2b shows that a 50 Ω termination does not distort the waveform; the current rises quickly and remains stable throughout the pulse duration. In contrast, the pulse shape on Si (Figure 2a) is significantly different, as a decaying sinusoidal transient with a frequency of approximately 5 MHz can be observed at the leading edge of the pulse. This value appears to be realistic when we take the capacitance (80 pF) of the target (based on geometry and material) and the inductance (14 µH) of the 5 m long coaxial cable into consideration as resonant circuit elements. This suggests that the 5 MHz modes are determined by the dimension of the feed line responsible for the pulse coupling, and these modes should also participate in the sputtering process. In order to confirm that this transient does not represent the reflection of power, the SWR meter was integrated into the measurement setup. The SWR meter (measuring in the 2–30 MHz range) usually (see exception below) measured only 0.5% reflected power, so this frequency range can be considered to be matched.
Based on Figure 2a, the pulse voltage can be written in terms of the complex Ohm’s law, so that the current is taken as the sum of two components. One component is a negative pulse assisted by the generator, which reaches its nominal value with a rise time τ. The other is an exponentially decaying, 5 MHz sinusoidal transient. The characteristic time of τ is estimated to be 1–2 µs based on the oscilloscope measurement. Thus, the voltage is
U t = I g e n R 1 e t τ I g e n i ω C e t τ
where R = dU/dI is the differential resistance, X = 1/ωC is the impedance of the target, and Igen is the peak current of the pulse.
The time average of the pulse voltage ( U ¯ ) is the product of the time average of the current ( I ¯ ) and the complex impedance Zt:
U ¯ = Z t I ¯ = R i X I ¯
The values of U ¯ and I ¯ are displayed by the generator and can also be changed by the user.
The actual pulse is a superposition of the two components. The ratio of the 5 MHz RF and DC components in it depends on the chosen pulse length and amplitude. In the case of a short (3.5 µs) pulse and small amplitude, the RF is dominant, while for longer (>15 µs) and larger pulses, the power coupled by the RF is practically negligible (see Figure 3).
It is known from the literature [24] that RF discharges have two characteristic ranges of behavior that are very different from an electrical point of view. The boundary layers are capacitive, while the quasi-neutral field can be modeled as a sum of a resistive and an inductive term. It is obvious from the available evidence that the discharge can be characterized by a complex impedance. The components of this impedance are functions of the operating parameters (e.g., gas pressure, voltage, etc.). The agreement of the conclusions drawn from the pulse shape measured on the Si target (Figure 2a and Figure 3) and the physics of RF plasma excitation indicates a definite analogy between HiPIMS and RF plasma excitation at the initial stage of the pulses. It is evident that this analogous behavior is attributable to the specific configuration of the feed line and the target.
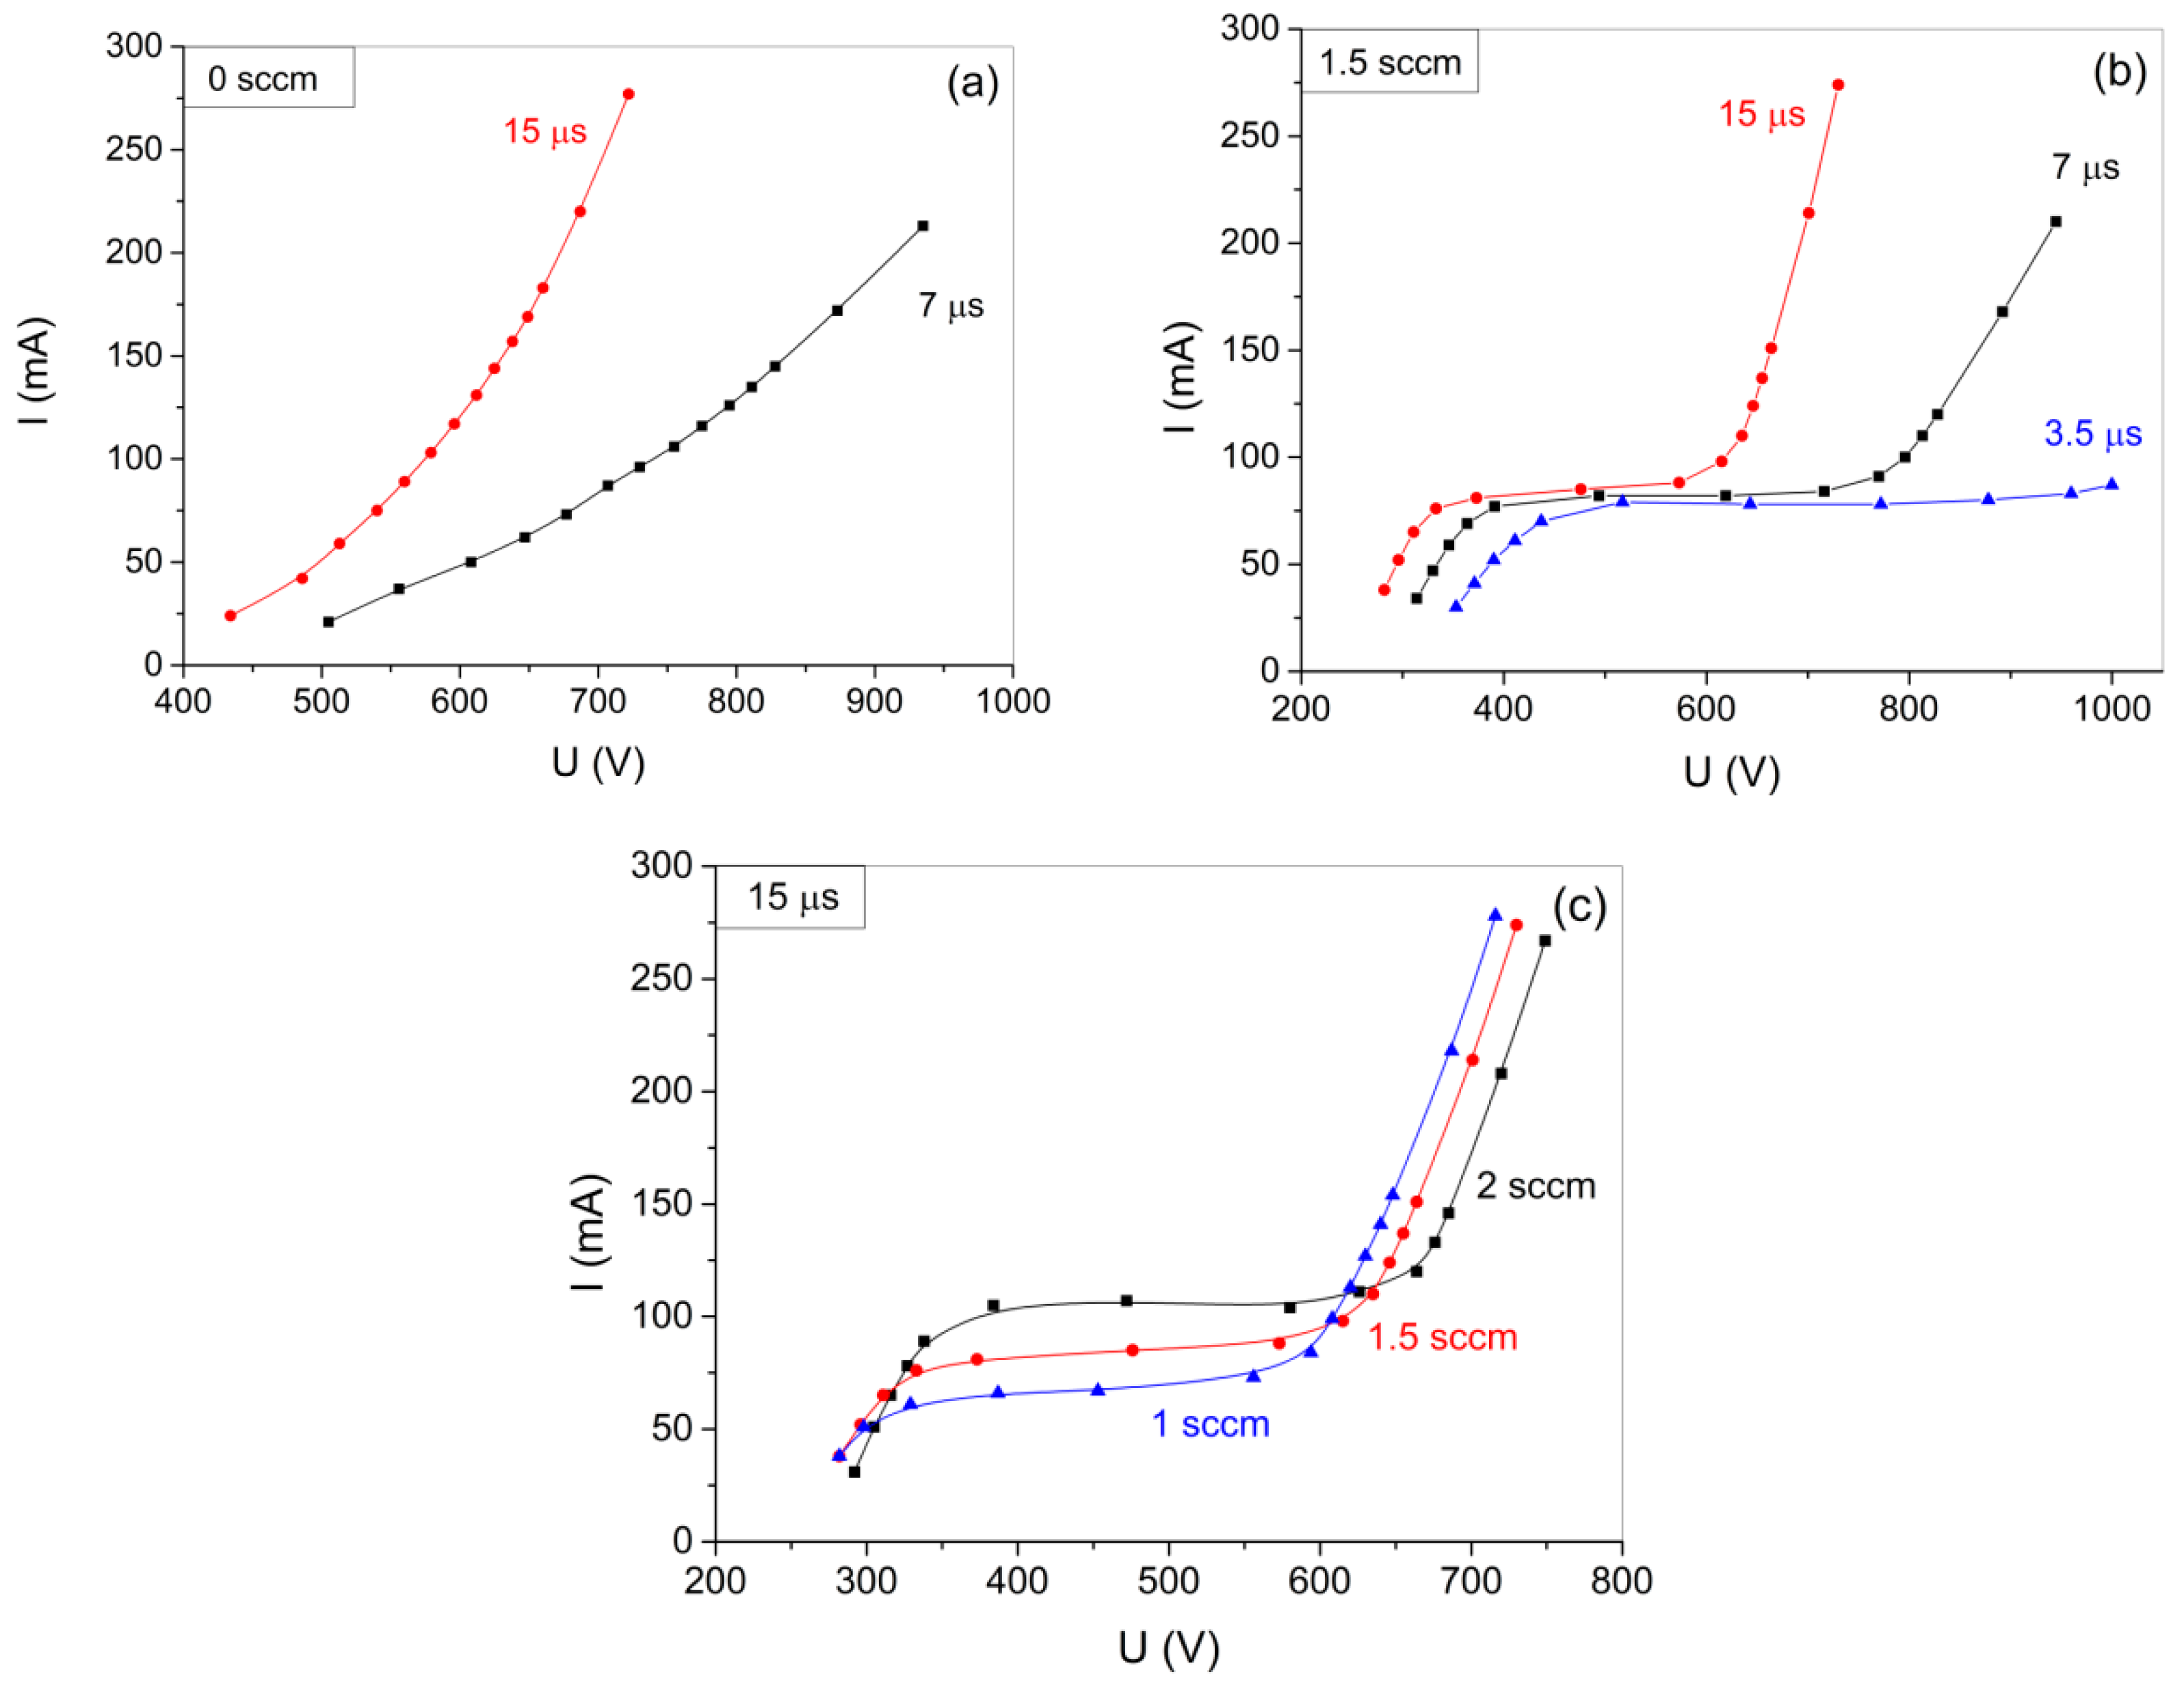
The current–voltage characteristics (see Figure 4) were measured by recording the current and voltage values while gradually reducing the applied sputtering power. Figure 4a shows the characteristics measured using only Ar, without any reactive gas, at varying pulse lengths. The Westwood function is a good fit for describing the characteristics [25]:
I = β U U w 2
where β is a constant and Uw is the initial discharge voltage. The measurements using a mixture of Ar and O2 gases show a completely different picture; a plateau appears in the characteristic, which is strongly dependent on the pulse length, i.e., longer plateaus were found for shorter pulse lengths (Figure 4b). However, if the pulse length is fixed and the oxygen flow rate is increased, the plateau occurs at higher currents, while only a small increase in the length of the plateau can be seen (Figure 4c). Even in case of a plateau, the low voltage region of the curve can be described by Equation (3). β parameters of 0.0042 mA/V2, 0.0033 mA/V2, and 0.0022 mA/V2 could be determined for pulse lengths of 15 µs, 7 µs, and 3.5 µs, respectively, while for the Uw, 185 V, 211 V, and 234 V were found, respectively, (for 1.5 sccm of O2). It should be noted that the change in β values is only roughly proportional to the associated pulse duration data and in the plateau region the current practically does not change, its derivative is close to zero. Consequently, the electrical resistance of the plasma is close to infinite in this region. However, according to our measurements with the SWR meter, in the region of the plateau the reflected RF power increases only by a little, but not more than 1.5%. This means that in this region, the DC component of the input pulses is practically reflected (close to infinite real resistance), at the same time the RF components are coupled with good efficiency and are responsible for the maintenance of the discharge.
From the comparison of Figure 4a and Figure 4b, it is evident that the appearance of the plateau is associated with the presence of oxygen. At high sputtering power (high voltage–high current section of the curve), it is assumed that ion bombardment effectively removes the oxide layer, so that the target is in the so-called metallic mode. As the sputtering power is decreased, the sputtering removes less material and the target becomes increasingly poisoned by the reactive gas. The change in the target surface is also accompanied by the change in the secondary electron emission yield. Since the secondary electron emission coefficient of SiO2 is 3 times higher than that of Si [26], a lower voltage is sufficient to maintain the same discharge current. Thus, the plateau of the current–voltage characteristic represents the transition of the target from the metal mode to the poisoned mode. A striking phenomenon of the characteristics shown in Figure 4b is that the magnitude of the step-like change is dependent on the pulse length. Since such clear, step-like transition was not observed in the case of sputtering without a magnetron, it seems that the above considerations need to be supplemented.
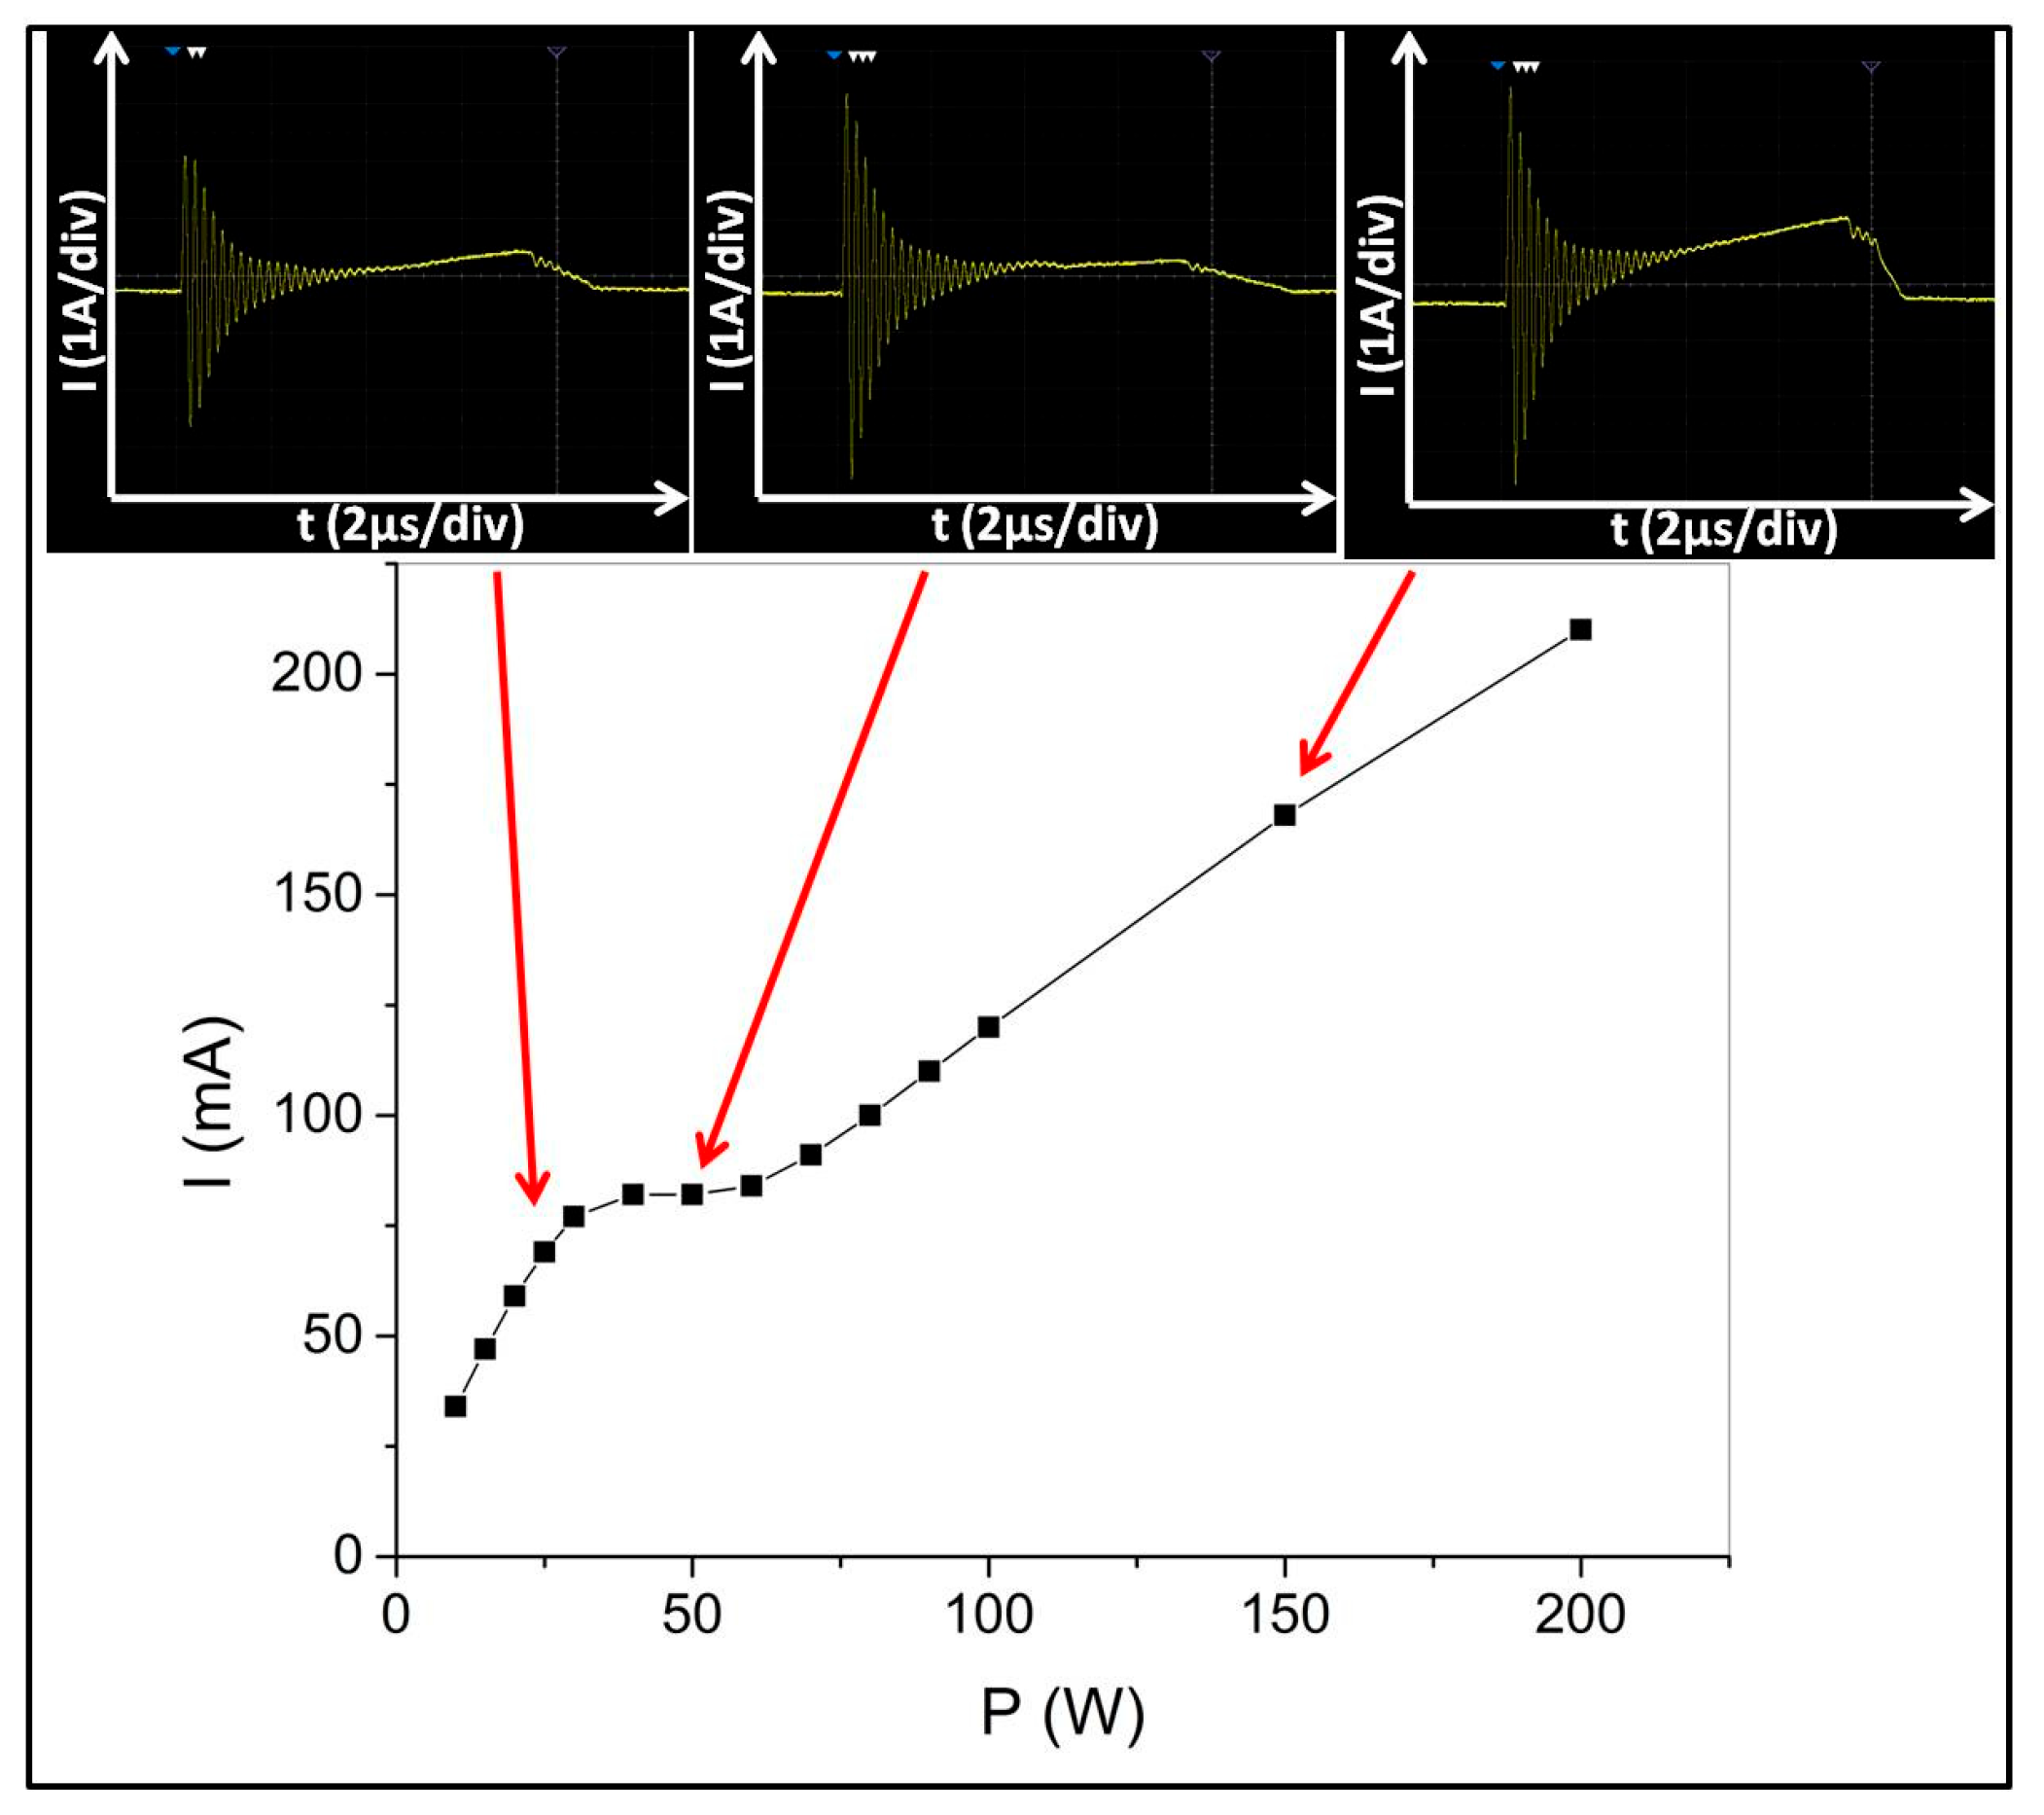
The plot of the current as a function of the sputtering power also shows a plateau region (see Figure 5). The insets of Figure 5 show the current pulse shapes at different sputtering powers. By comparing the image of the pulses at different points of the current-power characteristic, we can make the few observations. In the low power region, the RF component makes up a significant part of the pulse, and the DC component is relatively small. At the observed excitation frequency of 5 MHz, the electrons can follow the electric field variation, while the ions—due to their significantly larger mass—can only respond to these variations to a small degree. In the often-used terminology, a DC bias is formed, while the electrons attracted by the positive peaks of the RF transient neutralize the positive charge of the bombarding ions, as mentioned earlier. The result is a typical RF sputtering (with a small DC component), which can be considered as reactive sputtering due to the presence of O2. As the sputtering power is increased, the amplitude of the RF component increases. However, the DC component does not follow the change; rather, it decreases slightly. This observation is in agreement with the conclusions drawn from the measurements made with the SWR meter. Upon further increase in the power, the DC component increases significantly, while the RF component changes only a small amount. Thus, in this high power region, the sputtering effect of the DC part becomes dominant.
At this stage in our argumentation, we take into further consideration the fact that the target is mounted on an unbalanced magnetron, which is surrounded by a grounded cup. As the power increases, the DC component of the pulse slowly increases. However, if the effective value of the positive periods of the RF component exceeds the DC component, the majority of electrons will travel along the magnetic field lines between the target, i.e., the anode, and the grounded shield. Simultaneously, the ions with low mobility are directed towards the target during the negative periods. A more detailed description of the mechanism is possible with the plasma physics approach [27,28]. In the present case, the physical model is simplified so that electrons are able to escape from the confinement region created by the magnetic field. This occurs when the momentary value of the electrostatic force and the Lorentz force are equal. The electrons that reach the target are responsible for shunting the ion current. This phenomenon ensures that the change in ion current can compensate for the change in the electron current. The current under consideration in this study is analogous to the current described by the Child–Langmuir law [29]. Thus, we assume that this shunt current is not limited by the supply of electrons coming from the target, but by the space charge that builds up between the target and the grounded shield of the target. A similar idea and its detailed mathematical description can be found in the work of Mu et al. [30]. The anode voltage in the Child–Langmuir formula used here is given by the effective value of the RF component, i.e., proportional to the amplitude of the pulse. The associated current can be written as
I C L ~ α U 3 2
During the calculation, α = 4.6   ×   10 2 m A V 3 2   was used for pulse length of 7 µs. It is important to note that this α value was chosen so that the calculated characteristic matches the measured values, so it can be considered a fitting parameter. The exact electrode configuration it corresponds to, however, is beyond the objectives of this work. It should also be noted that the shunting effect only occurs during the periodic transient of duration τ, as defined in Equation (1).
Based on the above, the physical picture can be modified so that the sheath in front of the target, which remains constant over time, is built up while the U-I characteristic is in the plateau phase. In the pre-plateau phase, the position of the sheath varies with the frequency characteristic of the RF-coupled plasma. If the negative DC component of the pulses reaches a critical value, the positive period of the RF is overcome and the increase in the ion current towards the target begins. From here on, the compound layer is removed, which is confirmed by the fact that the hysteresis is not visible (see Section 3.3). If we do not increase the power any further, we can avoid the unpleasant surface damage caused by sparking, as reported in Ref. [20]. In the following section, a simple mathematical description is presented that follows the changes in the U-I characteristic well.

3.2. Model of the Discharge Characteristic

In the calculation, the different pulse lengths are taken into account through the fitted β values, while for the effective voltage and current, the values displayed by the instrument are used. The oxygen flow rate is taken into consideration only through the secondary electron emission (SEE) factor, as was presented in Ref. [31]. This work proposes the consideration of two aspects: (i) secondary electron emission from the target with a coefficient γ and (ii) ionization of neutral gas atoms by secondary electrons with an efficiency of δ. If the secondary electron emission is considered as a function of the target oxidation, the number of generated ions can be written as follows [31]:
γ δ = U D C U 0 γ m 1 θ t + γ c θ t
where θt is the fraction of the target surface covered by the oxide, γ m and γ c are the secondary electron emission coefficients for the pure and the oxide covered target surface, and U0 is a reference voltage to keep the expression dimensionless. The validity of this heuristic derivation is supported by experimental evidence, including the observation that increasing the flow rate of the reactive gas results in a larger target voltage change. To adapt the results of the above considerations to a pulsed process, it is necessary to take the probability of ionization of neutral gas atoms by secondary electrons into account. Consequently, when utilizing pulses, it is plausible to take the duty cycle k of the pulse train into consideration:
γ δ = U · k γ m U 0 1 + σ θ t
where σ indicates γ c γ m γ m and U is the pulse voltage. The current dependence of the target voltage is neglected in the following discussion.
The discharge current (Id) has two components (the ion and electron current) and its measured value can be written as follows:
I d = I i I e = I i γ δ I i I C L
where Ii is the ion current and Ie is the electron current. The ion current is described by Equation (3) and the electron shunt current ICL is defined by Equation (4). In addition, it is necessary to incorporate the γδ factor, to take the change in secondary electron emission of the target (resulting from the presence of oxygen and varying sputtering power) into account. The plateau in the U-I graph can be determined by the following equation:
U ( β U 2 U 3 k γ m U 0 1 + σ θ t   α U 3 2 ) = 0
At this point, for simplicity, the coordinate system is shifted in the positive direction by the value Uw. Equation (8) is a cubic equation in canonical form, the roots of which can be calculated using Cardano’s formula. In order to make the solutions more clear, we make a formal simplification; we simply replace Ii with an Ohm’s law, using the real part of the plasma impedance R as defined in Equation (2). It should be mentioned that in reality, R is not constant, but depends on the voltage. With this modification, Equation (7) can be written as
I d = I i I e = I i γ δ U R I C L
Equation (9) after the derivation:
U 3 α 4 β U γ m 2 β R k 1 + σ θ t = 0
Equation (10) has two solutions, U1 and U2. The solution of U1 indicates the beginning of the plateau (actual, not shifted). By using the approximation of 1 + x 1 + x 2 ,
U 1 = U w + 2 β 3 α 2 k γ m 2 β R 1 + σ θ t 2
The plateau starting from U1 is parallel to the voltage axis. Its length (Up) is the difference between the two solutions (U2 − U1):
U p = 3 α 4 β 2 + k γ m β R 1 + σ θ t
The adequacy of the model can be verified by comparing the results with the characteristics presented in Figure 4. The characteristics under consideration are as follows; (i) the plateaus are shorter for larger β values (e.g., for longer pulses) and (ii) higher θt values, indicative of larger oxygen input, have longer plateaus and higher U1 values. It is noteworthy that by omitting the ICL term, the equation becomes first-degree, indicating that there is only one inflection point in the characteristic instead of a plateau.
The appearance of similar U-I characteristics was also reported for a rotating cylindrical magnetron [18]. The authors of that study, examining the U-I characteristics of Al and Ti targets, observed a similar stair-like behavior in a relatively poor vacuum environment. The interesting thing is that in the case of Ti, the change occurred in the direction of lower voltage. The secondary emission of Ti oxide is smaller than that of the metallic state; thus, according to the notation we use, it would appear in our equations with a negative σ value.

3.3. Investigation of the Hysteresis

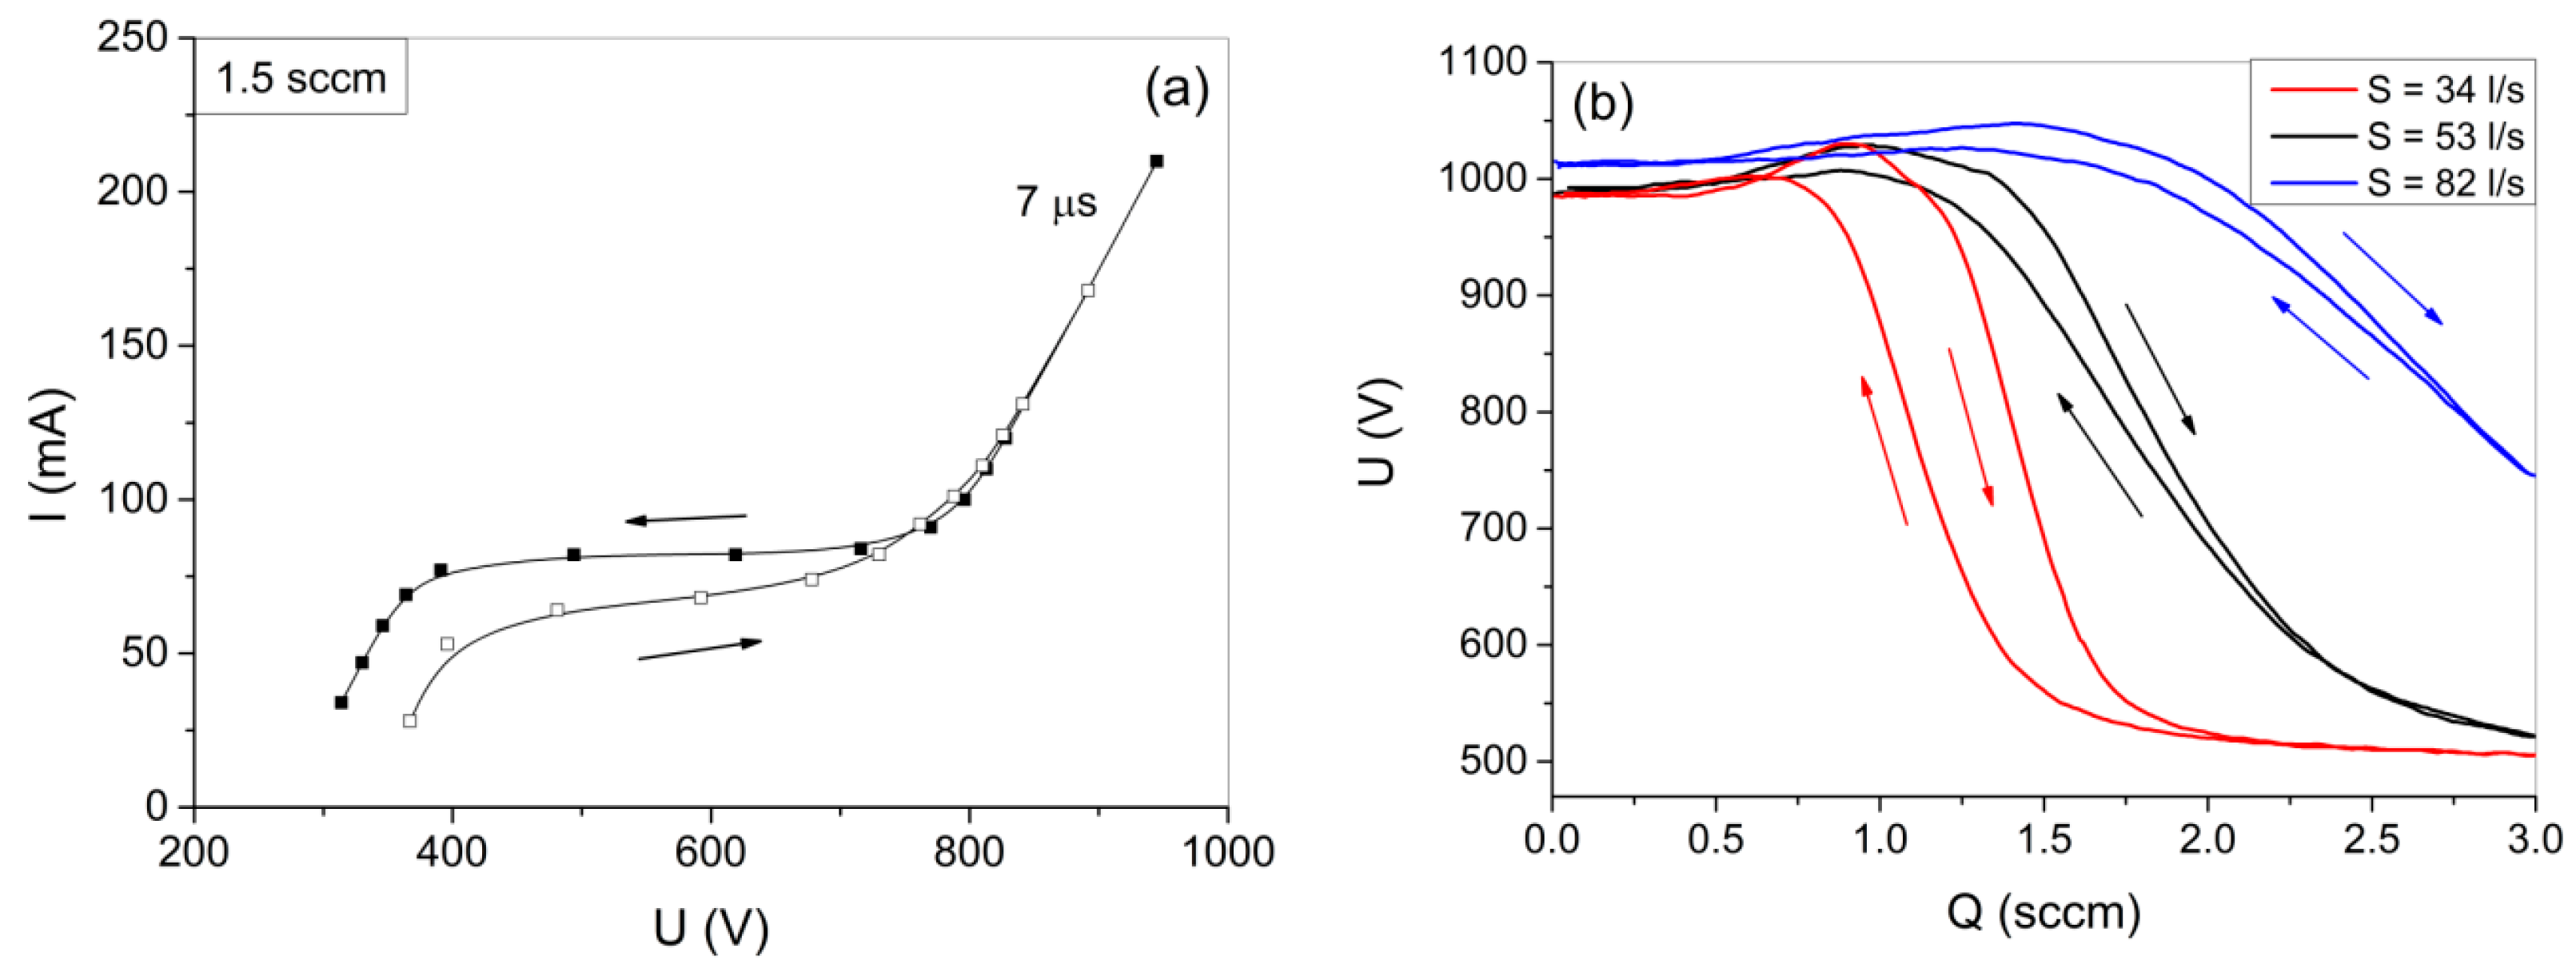
Figure 6a illustrates the measured current–voltage characteristic for decreasing and increasing sputtering powers (voltages). It can be seen that at high voltages, the two curves overlap each other, while in the plateau region, they are separated. This indicates that the system has hysteresis behavior. To gain further evidence, measurements of the discharge voltage were performed while the oxygen flow rate was varied (see Figure 6b). Different pumping speeds were used (by throttling the intake of the vacuum pump), and the curves show evident hysteresis behavior in all the cases. It is also seen that at higher pumping speed, the hysteresis is quite small; however, at lower pumping speed, the hysteresis region widens significantly. It has been reported that in certain cases, the use of HiPIMS can lead to practically hysteresis-free operation [32]. In other cases, the hysteresis does not disappear completely, but it is reduced compared to DC sputtering [33,34,35]. In the case of SiO2 deposition by reactive HiPIMS, the absence of hysteresis was reported [12]. However, it should be noted that the process conditions (pulse parameters and Ar pressure) used in that work were significantly different from the parameters used in this study. It therefore appears that the appearance of hysteresis in the reactive HiPIMS of a Si target is highly dependent on the process conditions, such as the pumping speed, as shown in Figure 6b.
The hysteresis behavior of reactive sputtering has been described on multiple occasions in the past [36,37]. In a previous paper, we have presented an approximate analytical solution of the Berg model and have used it to construct a stability state diagram for the reactive sputtering of Al2O3 [38]. For the present case of SiO2, it would also be interesting to determine the stable sputtering regions. Although the classical Berg model for HiPIMS is a relatively rough approximation of the reactive sputtering process, we applied a relatively low sputtering power for our measurements in order to limit the effect of ion implantation.
Figure 7 shows the boundaries of the hysteresis region determined by numerical (solid curves) and analytical (dashed lines) calculations based on the model presented in Ref. [38]. The experimentally measured boundaries of the hysteresis curves (see Figure 6b) are also shown in Figure 7. The calculated curves clearly indicate that the hysteresis region narrows with the increase in the pumping speed and this agrees well with the experimentally observed behavior. The small discrepancy between the calculated and the measured data may originate from the limitations of the relatively simple model; however, it can still be used as a first approximation and to identify the general behavior.

4. Conclusions

In this work, we investigated the reactive HiPIMS process during the deposition of stoichiometric SiO2 films. The pulse shapes and discharge characteristics were studied for different sputtering parameters. An exponentially decaying periodical transient of the short pulse series has been shown to be responsible for the successful sputtering of the Si target. This finding indicates that the ignition mechanism of low-power HiPIMS using a Si target is analogous to that of medium frequency or RF sputtering. By integrating an SWR meter into the experimental setup for the first time, we showed that the components with frequencies between 2 and 30 MHz are matched and do not reflect. Thus, we can conclude that the components with frequencies lower than 2 MHz are responsible for the presence of the low-conductivity region observed in the U-I characteristic. This distinct step-like behavior is related to the transition of the target from the metal mode to the poisoned mode. The duration of the applied pulse significantly influences the length of the plateau. Hysteresis was observed by either varying the sputtering power or the oxygen flow rate. These observations help to form an understanding of the reactive HiPIMS process of SiO2 and can be useful in determining the appropriate sputtering parameters. It is also plausible that the above findings can be applied to other low-conductivity targets as well.

Author Contributions

Conceptualization, M.S.; methodology, M.S.; formal analysis, M.S.; investigation, M.S., D.O., and M.G.; writing—original draft preparation, M.S. and M.G.; writing—review and editing, G.S.; visualization, M.G. All authors have read and agreed to the published version of the manuscript.

Funding

Project no. C1792954 has been implemented with the support provided by the Ministry of Culture and Innovation of Hungary from the National Research, Development and Innovation Fund, financed under the KDP-2021 funding scheme. The funding provided by the Hungarian Scientific Research Fund OTKA, Grant number K143216, is greatly acknowledged.

Data Availability Statement

All data that support the findings of this study are included within the article and Appendix A.

Acknowledgments

The authors are thankful to Noémi Szász for the EDS measurements.

Conflicts of Interest

The authors declare no conflicts of interest. The funders had no role in the design of the study; in the collection, analyses, or interpretation of data; in the writing of the manuscript; or in the decision to publish the results.

Appendix A

Table A1. The parameters used in Section 3.3.
Ym0.6
Yc0.02
αt = αs0.007
X50
ry0.033
At20 cm2
As1160 cm2
Ar58

References

  1. Li, S.; Liu, C.; Zhu, T.; Wang, Y.; He, J.; Yang, G.; Sun, P.; Li, H.; Liu, H.; Jiang, N. Effects of the Thermal Treatments on the Optical Properties of SiO2 Anti-Reflective Coatings on Sapphire Windows. Infrared Phys. Technol. 2024, 137, 105151. [Google Scholar] [CrossRef]
  2. Mazur, M.; Wojcieszak, D.; Kaczmarek, D.; Domaradzki, J.; Song, S.; Gibson, D.; Placido, F.; Mazur, P.; Kalisz, M.; Poniedzialek, A. Functional Photocatalytically Active and Scratch Resistant Antireflective Coating Based on TiO2 and SiO2. Appl. Surf. Sci. 2016, 380, 165–171. [Google Scholar] [CrossRef]
  3. Ruud, C.J.; Cleri, A.; Maria, J.-P.; Giebink, N.C. Ultralow Index SiO2 Antireflection Coatings Produced via Magnetron Sputtering. Nano Lett. 2022, 22, 7358–7362. [Google Scholar] [CrossRef] [PubMed]
  4. Li, S.; Xu, J.; Wang, L.; Yang, N.; Ye, X.; Yuan, X.; Xiang, H.; Liu, C.; Li, H. Effect of Post-Deposition Annealing on Atomic Layer Deposited SiO2 Film for Silicon Surface Passivation. Mater. Sci. Semicond. Process. 2020, 106, 104777. [Google Scholar] [CrossRef]
  5. Aktas, S.; Caglar, M. Effect of SiO2 Gate Insulator on Electrical Performance of Solution Processed SnO2-Based Thin Film Phototransistor. Phys. B Condens. Matter 2023, 670, 415337. [Google Scholar] [CrossRef]
  6. Bhatt, V.; Chandra, S. Silicon Dioxide Films by RF Sputtering for Microelectronic and MEMS Applications. J. Micromech. Microeng. 2007, 17, 1066. [Google Scholar] [CrossRef]
  7. Cannon, P.; McGlynn, E.; O’Neill, D.; Darcy, C.; Rouse, E.; O’Connor, R.; Freeland, B.; O’Connell, B.; Gaughran, J. Deposition of High-Quality, Nanoscale SiO2 Films and 3D Structures. Appl. Mater. Today 2024, 38, 102175. [Google Scholar] [CrossRef]
  8. Zheng, J.; Yang, J.; Cao, W.; Huang, Y.; Zhou, Z.; Huang, Y.-X. Fabrication of Transparent Wear-Resistant Superhydrophobic SiO2 Film via Phase Separation and Chemical Vapor Deposition Methods. Ceram. Int. 2022, 48, 32143–32151. [Google Scholar] [CrossRef]
  9. Rebib, F.; Tomasella, E.; Dubois, M.; Cellier, J.; Sauvage, T.; Jacquet, M. SiOxNy Thin Films Deposited by Reactive Sputtering: Process Study and Structural Characterisation. Thin Solid Film. 2007, 515, 3480–3487. [Google Scholar] [CrossRef]
  10. Waite, M.M.; Shah, S.I. Target Poisoning during Reactive Sputtering of Silicon with Oxygen and Nitrogen. Mater. Sci. Eng. B 2007, 140, 64–68. [Google Scholar] [CrossRef]
  11. Carneiro, J.O.; Machado, F.; Rebouta, L.; Vasilevskiy, M.I.; Lanceros-Méndez, S.; Teixeira, V.; Costa, M.F.; Samantilleke, A.P. Compositional, Optical and Electrical Characteristics of SiOx Thin Films Deposited by Reactive Pulsed DC Magnetron Sputtering. Coatings 2019, 9, 468. [Google Scholar] [CrossRef]
  12. Hála, M.; Vernhes, R.; Zabeida, O.; Klemberg-Sapieha, J.-E.; Martinu, L. Reactive HiPIMS Deposition of SiO2/Ta2O5 Optical Interference Filters. J. Appl. Phys. 2014, 116, 213302. [Google Scholar] [CrossRef]
  13. Kim, K.; Kim, S.; An, S.; Lee, G.-H.; Kim, D.; Han, S. Anti-Reflection Porous SiO2 Thin Film Deposited Using Reactive High-Power Impulse Magnetron Sputtering at High Working Pressure for Use in a-Si:H Solar Cells. Sol. Energy Mater. Sol. Cells 2014, 130, 582–586. [Google Scholar] [CrossRef]
  14. Tiron, V.; Velicu, I.-L.; Matei, T.; Cristea, D.; Cunha, L.; Stoian, G. Ultra-Short Pulse HiPIMS: A Strategy to Suppress Arcing during Reactive Deposition of SiO2 Thin Films with Enhanced Mechanical and Optical Properties. Coatings 2020, 10, 633. [Google Scholar] [CrossRef]
  15. Arif, M.; Eisenmenger-Sittner, C. In Situ Assessment of Target Poisoning Evolution in Magnetron Sputtering. Surf. Coat. Technol. 2017, 324, 345–352. [Google Scholar] [CrossRef]
  16. Fekete, M.; Bernátová, K.; Klein, P.; Hnilica, J.; Vašina, P. Influence of Sputtered Species Ionisation on the Hysteresis Behaviour of Reactive HiPIMS with Oxygen Admixture. Plasma Sources Sci. Technol. 2020, 29, 025027. [Google Scholar] [CrossRef]
  17. Boivin, D.; Najah, A.; Jean-Marie-Désirée, R.; Noël, C.; Henrion, G.; Cuynet, S.; De Poucques, L. Towards Control of TiO2 Thickness Film in R-HiPIMS Process with a Coupled Optical and Electrical Monitoring of Plasma. Surf. Coat. Technol. 2022, 433, 128073. [Google Scholar] [CrossRef]
  18. Depla, D.; Mahieu, S.; De Gryse, R. Magnetron Sputter Deposition: Linking Discharge Voltage with Target Properties. Thin Solid Film. 2009, 517, 2825–2839. [Google Scholar] [CrossRef]
  19. Wang, Q.; Fang, L.; Liu, Q.; Chen, L.; Wang, Q.; Meng, X.; Xiao, H. Target Voltage Hysteresis Behavior and Control Point in the Preparation of Aluminum Oxide Thin Films by Medium Frequency Reactive Magnetron Sputtering. Coatings 2018, 8, 146. [Google Scholar] [CrossRef]
  20. Oniszczuk, A.W.; Owen, D.S.; Loch, D.A.L.; Hovsepian, P.E.; Ehiasarian, A.P. Reverse Pulse Strategies for Silicon Dioxide Thin Films Deposition by High Power Impulse Magnetron Sputtering. Surf. Coat. Technol. 2025, 505, 132117. [Google Scholar] [CrossRef]
  21. Arosa, Y.; de la Fuente, R.; Lobato, Y. Refractive Index Spectroscopy and Material Dispersion in Fused Silica Glass. Opt. Lett. 2020, 45, 4268–4271. [Google Scholar] [CrossRef]
  22. Jonsson, L.B.; Nyberg, T.; Katardjiev, I.; Berg, S. Frequency Response in Pulsed DC Reactive Sputtering Processes. Thin Solid Film. 2000, 365, 43–48. [Google Scholar] [CrossRef]
  23. Kelly, P.J.; Arnell, R.D. Magnetron Sputtering: A Review of Recent Developments and Applications. Vacuum 2000, 56, 159–172. [Google Scholar] [CrossRef]
  24. Lieberman, M.A.; Lichtenberg, A.J. Principles of Plasma Discharges and Materials Processing; Wiley-Interscience: New York, NY, USA, 2005; ISBN 978-0-471-72001-0. [Google Scholar]
  25. Westwood, W.D.; Maniv, S.; Scanlon, P.J. The Current-voltage Characteristic of Magnetron Sputtering Systems. J. Appl. Phys. 1983, 54, 6841–6846. [Google Scholar] [CrossRef]
  26. Takagi, S.; Nakaegawa, T.; Hsiao, S.-N.; Sekine, M. Estimations of Secondary Electron Emission Coefficients of Si, SiO2, and Polyimide Electrodes in Dual-Frequency Capacitively Coupled Discharge. Jpn. J. Appl. Phys. 2022, 62, SA1009. [Google Scholar] [CrossRef]
  27. Anders, A. Tutorial: Reactive High Power Impulse Magnetron Sputtering (R-HiPIMS). J. Appl. Phys. 2017, 121, 171101. [Google Scholar] [CrossRef]
  28. Gudmundsson, J.T.; Lundin, D. 1—Introduction to Magnetron Sputtering. In High Power Impulse Magnetron Sputtering; Lundin, D., Minea, T., Gudmundsson, J.T., Eds.; Elsevier: Amsterdam, The Netherlands, 2020; pp. 1–48. ISBN 978-0-12-812454-3. [Google Scholar]
  29. Gudmundsson, J.T. Physics and Technology of Magnetron Sputtering Discharges. Plasma Sources Sci. Technol. 2020, 29, 113001. [Google Scholar] [CrossRef]
  30. Mu, Z.; Li, G.; Che, L.; Huang, K.; Liu, C. Studies of the Discharge Properties of Unbalanced Magnetron Sputtering System. Surf. Coat. Technol. 2005, 193, 46–49. [Google Scholar] [CrossRef]
  31. Pflug, A.; Siemers, M.; Szyszka, B.; Kappertz, O.; Nyberg, T.; Berg, S.; Severin, D.; Wuttig, M. Modeling of the Plasma Impedance in Reactive Magnetron Sputtering for Various Target Materials. In Proceedings of the Annual Technical Conference—Society of Vacuum Coaters, Denver, CO, USA, 23–28 April 2005; pp. 298–301. [Google Scholar]
  32. Wallin, E.; Helmersson, U. Hysteresis-Free Reactive High Power Impulse Magnetron Sputtering. Thin Solid Film. 2008, 516, 6398–6401. [Google Scholar] [CrossRef]
  33. Aiempanakit, M.; Kubart, T.; Larsson, P.; Sarakinos, K.; Jensen, J.; Helmersson, U. Hysteresis and Process Stability in Reactive High Power Impulse Magnetron Sputtering of Metal Oxides. Thin Solid Film. 2011, 519, 7779–7784. [Google Scholar] [CrossRef]
  34. Čapek, J.; Kadlec, S. Return of Target Material Ions Leads to a Reduced Hysteresis in Reactive High Power Impulse Magnetron Sputtering: Experiment. J. Appl. Phys. 2017, 121, 171911. [Google Scholar] [CrossRef]
  35. Strijckmans, K.; Moens, F.; Depla, D. Perspective: Is There a Hysteresis during Reactive High Power Impulse Magnetron Sputtering (R-HiPIMS)? J. Appl. Phys. 2017, 121, 080901. [Google Scholar] [CrossRef]
  36. Kadlec, S.; Musil, J.; Vyskocil, H. Hysteresis Effect in Reactive Sputtering: A Problem of System Stability. J. Phys. D Appl. Phys. 1986, 19, L187. [Google Scholar] [CrossRef]
  37. Berg, S.; Nyberg, T. Fundamental Understanding and Modeling of Reactive Sputtering Processes. Thin Solid Film. 2005, 476, 215–230. [Google Scholar] [CrossRef]
  38. Gajdics, M.; Hegedűs, N.; Olasz, D.; Serényi, M. Assistance to Determine the Stability State of a Reactive Sputtering Process Based on the Analytical Solution of the Classical Berg Model. Coatings 2025, 15, 499. [Google Scholar] [CrossRef]
Figure 1. Schematic drawing of the experimental setup showing the sputtering chamber, the generator, and the SWR meter.
Coatings 15 01023 g001
Figure 2. Comparison of current waveforms generated on a Si target (a) and on a 50 Ω termination (b), showing significantly different current rise for a 7 µs long pulse.
Coatings 15 01023 g002
Figure 3. Comparison of current waveforms generated on a Si target using a 3.5 µs (a) and a 15 µs (b) long pulse, showing the superposition of the two pulse components.
Coatings 15 01023 g003
Figure 4. Current–voltage characteristics measured at different pulse lengths while sputtering a Si target without any oxygen (a), with 1.5 sccm oxygen flow rate (b), and for different oxygen flow rates using a fixed pulse length of 15 µs (c).
Coatings 15 01023 g004
Figure 5. Current–power characteristic measured using constant oxygen flow of 1.5 sccm, pulse frequency of 10 kHz, and pulse length of 7 µs. The insets show the corresponding current pulse shapes of the different regions.
Coatings 15 01023 g005
Figure 6. Hysteresis behavior of the current–voltage characteristics (a) and the discharge voltage as a function of oxygen flow rate using different pumping speeds (b). For the current–voltage characteristics, an oxygen flow rate of 1.5 sccm, a frequency of 10 kHz, and a pulse length of 7 µs were used, while for the curves in (b), the sputtering power, the pulse frequency, and the pulse length were fixed at 70 W, 10 kHz, and 4 µs, respectively.
Coatings 15 01023 g006
Figure 7. Dimensionless critical pressures as a function of the dimensionless pumping speed by numerical calculation (solid curves) and from analytical calculation (dashed lines). The experimentally determined boundary of hysteresis (based on Figure 6b) is also shown by black and red points.
Coatings 15 01023 g007
Table 1. Layer thickness (d) and refractive index (n) measured at 632.8 nm and the O/Si atomic concentration ratio measured by EDS for four silicon oxide films prepared at different current densities (J). The oxygen flow rate and the pulse parameters were the same for all the samples (see Section 2).
J (A/m2)d (nm)nO/Si at Conc. Ratio
1001371.4651.85
1752821.4631.99
2003331.4622.01
2353921.4612.03
Disclaimer/Publisher’s Note: The statements, opinions and data contained in all publications are solely those of the individual author(s) and contributor(s) and not of MDPI and/or the editor(s). MDPI and/or the editor(s) disclaim responsibility for any injury to people or property resulting from any ideas, methods, instructions or products referred to in the content.