Article

Biocrusts Alter the Pore Structure and Water Infiltration in the Top Layer of Rammed Soils at Weiyuan Section of the Great Wall in China

1
Naiman Desertification Research Station, Northwest Institute of Eco-Environment and Resources, Chinese Academy of Sciences, Lanzhou 730000, China
2
College of Resources and Environment, University of Chinese Academy of Sciences, Beijing 100049, China
3
National Research Center for Conservation of Ancient Wall Paintings and Earthen Sites, Dunhuang Academy, Dunhuang 736200, China
4
Cultural Heritage Conservation and Design Consulting Co., Ltd. of Mogao Grottoes, Dunhuang 736200, China
5
College of Architecture, Taiyuan University of Technology, Taiyuan 030024, China
*
Author to whom correspondence should be addressed.
Coatings 2025, 15(8), 908; https://doi.org/10.3390/coatings15080908
Submission received: 24 June 2025 / Revised: 24 July 2025 / Accepted: 30 July 2025 / Published: 3 August 2025

Abstract

The surface of the Great Wall harbors a large number of non-vascular plants dominated by cyanobacteria, lichens and mosses as well as microorganisms, and form biocrusts by cementing with the soils and greatly alters the pore structure of the soil and the ecohydrological processes associated with the soil pore space, and thus influences the soil resistance to erosion. However, the microscopic role of the biocrusts in influencing the pore structure of the surface of the Great Wall is not clear. This study chose the Warring States Qin Great Wall in Weiyuan, Gansu Province, China, as research site to quantify thepore structure characteristics of the three-dimensional of bare soil, cyanobacterial-lichen crusts, and moss crusts at the depth of 0–50 mm, by using optical microscopy, scanning electron microscopy, and X-ray computed tomography and image analysis, and the precipitation infiltration process. The results showed that the moss crust layer was dominated by large pores with long extension and good connectivity, which provided preferential seepage channels for precipitation infiltration, while the connectivity between the cyanobacterial-lichen crust voids was poor; The porosity of the cyanobacterial-lichen crust and the moss crust was 500% and 903.27% higher than that of the bare soil, respectively. The porosity of the subsurface layer of cyanobacterial-lichen crust and moss crust was significantly lower than that of the biocrusts layer by 92.54% and 97.96%, respectively, and the porosity of the moss crust was significantly higher than that of the cyanobacterial-lichen crust in the same layer; Cyanobacterial-lichen crusts increased the degree of anisotropy, mean tortuosity, moss crust reduced the degree of anisotropy, mean tortuosity. Biocrusts increased the fractal dimension and Euler number of pores. Compared with bare soil, moss crust and cyanobacterial-lichen crust increased the isolated porosity by 2555% and 4085%, respectively; Biocrusts increased the complexity of the pore network models; The initial infiltration rate, stable infiltration rate, average infiltration rate, and the total amount of infiltration of moss crusted soil was 2.26 and 3.12 times, 1.07 and 1.63 times, respectively, higher than that of the cyanobacterial-lichen crusts and the bare soil, by 1.53 and 2.33 times, and 1.13 and 2.08 times, respectively; CT porosity and clay content are significantly positively correlated with initial soil infiltration rate (|r| ≥ 0.85), while soil type and organic matter content are negatively correlated with initial soil infiltration rate. The soil type and bulk density are directly positively and negatively correlated with CT porosity, respectively (|r| ≥ 0.52). There is a significant negative correlation between soil clay content and porosity (|r| = 0.15, p < 0.001). Biocrusts alter the erosion resistance of rammed earth walls by affecting the soil microstructure of the earth’s great wall, altering precipitation infiltration, and promoting vascular plant colonisation, which in turn alters the erosion resistance of the wall. The research results have important reference for the development of disposal plans for biocrusts on the surface of archaeological sites.

1. Introduction

Raw earth, as the main building material, occupies an important position in the history of China’s architectural development. Archaeological records show that the ancient people gradually formed the earth construction process about 6000 years ago, and improved and perfected it many times in the later production activities, and ultimately formed the earth construction techniques mainly based on palletizing mud, tamping and pressing the ground to raise the arches, etc., which were used in the construction of houses, temples, city walls and burial chambers, etc. [1]. As an important part of the “The Belt and Road Initiative”, there are a large number of earthen construction sites along the Silk Road, of which the Great Wall is a typical example. Of the 21,000 km of Great Wall and 43,000 sites in China, more than 70% is earthen structured. The Earth Great Wall, a typical raw earth construction, is mainly made of loess rammed with reeds and wheatgrass stalks, etc. The State Administration of Cultural Heritage (SACH) defined the cultural landscape attributes of the Great Wall for the first time in the Great Wall of China Conservation Report released in 2016 that “the Great Wall is the world’s largest and spectacular historical and cultural heritage, and at the same time a cultural landscape with unique aesthetic value, jointly composed of a variety of relics and the natural environment in which they are located”. They are not only precious historical materials for the study of ancient defense systems and architecture, but also important empirical evidence in response to global changes and human activities [2]. However, due to the fragile physical and mechanical properties of soil, the extreme open-air environment for a long period of time, temperature fluctuation, wind and sand erosion, rainwater erosion, and biological and human disturbances, seriously threaten the inheritance conservation and sustainable use of the Great Wall [3,4,5].
Due to the special requirements of heritage protection, leading to increasing difficulty of investigation, sampling and monitoring of the earth sites, researches on the deteriorated mechanism mainly focuses on physical and chemical factors [6,7,8], and the research on deteriorated prevention and control mainly focuses on chemical material reinforcement, exposed layer, protective shed, and backfill protection, etc. [5,9,10], with less attention to the biological factors and protection strategies [11]. Since the 20th century, especially after [12] proposed the concept of bioerosion, scientists from China and abroad have gradually carried out research on the relationship between organisms and cultural artefacts, and plant soft-covering has been regarded as a new type of site protection technology [13], but the relationship between plants and earthen sites is not clearly defined [14], and the soft capping technology, which is mainly based on vascular plants, is only adapted to the architectural buildings in a wetter climate [15], but not in the arid and semi-arid environment, with low precipitation, both plant establishment and protective effects are limited. Therefore, the screening of plant species with the advantages of strong resistance, long duration of protective effect, and small change in the surface morphology of cultural relics is a bottleneck and biological degradation and protection will be a long-lasting issue for cultural heritage preserved in the “biosphere” [16].
Biological soil crusts (biocrusts) is complex composed of cryptogamic plant and microorganism, such as cyanobacteria, green algae, lichens and mosses, as well as related other organisms glued to soil surface particles through mycelium, pseudo-root and secretion, etc. Which live within, or immediately on top of, the uppermost millimetres of soil. Soil particles are aggregated through the presence and activity of these often extremotolerant biota that desiccate regularly, and the resultant living crust covers the surface of the ground as a coherent layer. They account for more than 40% of the living surface cover in arid and semi-arid zones [17,18,19], and greatly change the surface structures and even terrestrial ecosystems. Through the on-site investigation of ancient sites, this group of earth surface of the Great Wall in Gansu has nurtured a large number of cyanobacteria, lichens and mosses as well as microorganisms, and the cover even reached more than 30%. They have long adapted to the adverse conditions along the Great Wall and has become a typical feature of the natural human-built composite ecosystems. Most of the research results on wind-sand control and soil resistance to wind erosion have reported positive effects on biocrusts. For example, it accelerates the formation of sand surface soil, improves soil physicochemical and biological properties [20]. With the succession of biocrusts, the water erosion resistance of their overlying soils significantly increases, which in turn affects the eco-hydrological processes, while biocrusts can significantly increase the critical sand uplift friction velocity and enhance the resistance of the soil surface to wind erosion [21]. However, there are some negative reports, for example, in windy environments, biocrusts destabilise soil structure by affecting vascular plant seed germination and growth [22] and providing suitable habitats and food for microfauna [23]. In summary, there may be two sides of biocrusts on the preservation of the Great Wall, biocrusts inhibit the occurrence of diseases such as weathering on the surface of the Great Wall to a certain extent due to strong resistance to wind erosion, but at the same time, biocrusts cover alters the water, heat, soil structure, and bio-composition of the surface of the Great Wall, loosening the originally strong rammed soil, which is more conducive to the invasion of herbaceous plants and animals, and accelerating the weathering of the surface. Although the biological degradation of cultural relics, such as cave temples caused by microorganisms, lichens and mosses, has attracted extensive attention from heritage conservation experts [24,25], the microscopic features of rammed earth sites as a special soil and habitat for biocrusts the micro features of the rammed earth-biotic crust interface interactions as well as the main controlling factors of precipitation infiltration have not been confirmed [26,27].
Soil water infiltration is affected by a variety of factors such as bulk density, pore space, water content, temperature and plant root system, and closely related to surface runoff and soil resistance to rainwater erosion [28]. Since the internal structure of soil pores and fissures provides preferential flow channels for rainfall, clarifying the diameter, morphological characteristics and connectivity of soil pores is crucial to the study of soil water infiltration. The study of soil structure has gradually become more refined with the updating instrumentation such as electron microscopes, optical microscopes, scanning electron microscopes and X-ray computed tomography (X-ray CT). CT is an inspection technique that uses the different attenuation of X-rays when they penetrate substances of different densities to reconstruct images of the internal structure of an object based on external projection data. Due to its non-destructive nature of detection and good rendering of microstructure, X-ray CT technology was used in the early 1990 s for the detection of rice roots and soil moisture content [29], and with the development of CT technology, its use in soil research has virtually encompassed the characterization of pore space geometries and fissures, involving bulk density [30], stratification detection [31], spatial correlation and tortuosity [32], and other different variables. At this stage, CT techniques have been widely used for the study of correlations between parameters such as soil spatial distribution, pore structure, water content and fractal properties, as well as for assessing soil pore network systems and obtaining fine-resolution 3 D soil reconstructions [33]. Traditional methods for porosity detection of biocrusts do not adequately characterise the geometric morphology (pore number, pore volume, pore shape and pore size distribution) and spatial distribution (connectivity, node density and pore path length) of biocrusts. The rapid turnover of CT technology has facilitated the study of non-destructive testing of test samples, which has brought a new opportunity for non-invasive characterisation of artefactual samples to determine the soil pore parameters and their spatial network structure are essential to clarify key processes such as soil mass and energy exchange and water transport.
Due to the long-term natural succession of biocrusts on the surface of the Great Wall, which results in the irregularity, instability and complexity of the structure of the artificially compacted soil, and there is an urgent need to quantify the microstructure of the biocrusts-compacted-soil interface, and revolutionise the knowledge of the mechanism of the biocrusts’ role in the pore network and the hydro-physical characteristics of the artificially compacted soil. Despite the fact that biocrusts distribute only within a few centimeters of the surface of the soil profile, they are critical for remodeling the surface soil structure [28]. Therefore, the objectives of this study were:
(1)
to characterise and quantify the effects of biocrusts on the pore characteristics of rammed soil at sampled sites, and to reconstruct and visualise the three-dimensional structure of the soil pore network;
(2)
to clarify the differences in the effects of biocrusts on the pore parameters of rammed soil at different stages of succession; and
(3)
to reveal the key factors affecting the water infiltration into the rammed soil. The results of the study have important value for selecting bio-protective species in the soil sites and guiding the development of site restoration engineerings.

2. Materials and Methods

2.1. Study Site

The sampling site was located in Weiyuan County, Gansu Province, China, in the section of Majiashan Village of the Warring States, Qin Great Wall, and the focus of the research is focusing on the Great Wall made with rammed soils (as a building material), (103°44′–104°20′ E, 34°53′–35°25′ N, elevation 2264.1 m, Figure 1), which is a typical loess landform area. Weiyuan County is located in the central part of Gansu Province, with a temperate continental monsoon climate, with rainfall mainly concentrated in July to October, and an average annual precipitation of about 600 mm, and an annual temperature of 10–12 °C.
The Warring States Qin Great Wall of Majiashan Village was constructed in the 28th year of King Zhaoxiang of Qin (279 B.C.), mainly made of loess, with a thickness of about 8 cm and some of the boundaries of the rammed layer exposed, and a height of 1–5 m. Biological weathering, physical weathering and salt accumulation are obvious, and the layers of rammed construction are clear, with a north-south orientation and farmland on the east-facing side, which cropped with maize, wheat, and potatoes. The village is on the west-facing side. Typical vegetation on the sites includes Caragana Korshinskii Kom, Potentilla bifurca, and Achnatherum inebrians, etc. biocrusts cover 20–30% of the sites, and biocrusts are dominated by cyanobacterial-lichen crust, lichen crust, and moss crust. The dominant moss crusts were dominated by the Bryum argenteum Hedw. and the Didymodon vinealis (Brid.) Zander, and the biocrusts were mainly distributed in the upper part and the top of the site walls.

2.2. Experimental Design and Sampling

Bare soil (in situ soil), cyanobacterial-lichen crust (lichen crust coverage area > 90%) and moss crust (moss crust coverage area > 90%) were sampled, due to the non renewability of cultural relics resources and the special requirements of laws and regulations such as the “Regulations on the Protection of the Great Wall” (State Council Decree No. 476) and the “Technical Specifications for Soil Site Protection Testing” (WW/T 0039–2012), with only 3 replicates for each sample site, at the top of the wall of a slope < 5°. Before collecting the samples, dual distilled water was sprayed on the surface of the sample points to keep the surface of the biocrusts moist and avoid fragmentation. A polyvinyl chloride cylinder (PVC, inner diameter 50 mm, height 50 mm) was pressed into the soil until the PVC pipe fufilled with soil and then the outsider was cleaned and the top and bottom of the PVC pipe were covered with plastic film to maintain the original moisture content of the soil. The plastic film wrapped around was fixed with adhesive tape and protected with foam board to prevent mechanical damage during transport. A ring cutting (5 cm high and 100 cm3 in volume) was used to collect in situ soil samples for the determination of bulk density, total porosity and other indicators. Plastic petri dishes (90 mm in diameter and 20 mm in height) were used to collect topsoil from biocrusts and brought back to the laboratory for determination of thickness, chlorophyll a and organic matter content.

2.3. Determination of Soil Physical and Chemical Properties

Biocrusts thickness was measured by vernier caliper, organic matter content (SOM) by potassium dichromate redox titration [34], total biomass by drying method [35], chlorophyll content by UV-V is spectrophotometer (DR 5000, Hash Corp., LoveLand, IA, USA) [28], roughness by the chain method [36], soil bulk density (BD), the total porosity (calculated based on bulk density and particle density, assuming a loess particle density of 2.65 g·cm−3) [28,37], saturated water content (SSWC), field water holding capacity (FC), saturated hydraulic conductivity (permeability coefficient) by the stainless steel rings (5 cm height, 100 cm3 volume) [28], and soil mechanical composition by a Malvern laser particle sizer (MS2000, Malvern Panalytical, Malvern Town, UK).

2.4. Characterisation of Soil Microstructure

A super depth-of-field digital microscope (VHX−1000, KEYENCE, Osaka, Japan) and a scanning electron microscope/energy spectrometer (SEM-EDS, JE-OLJSM−6610 LV, JEOL, Tokyo, Japan) were used to characterise the morphological features of moss crusted rhizines and the two-dimensional spatial microstructure of soil.

2.5. Determination of Ct Pore Characterisation Parameters

The pore structure study was conducted in the natural dry state of the Great Wall soil (no rainfall occurred in the month before the simulation test). The sample pores were scanned by a nanoVoxel 4000 CT scanner (Wuhan Sanying, resolution 0.5–100 μm, Wuhan, China) with the following scanning parameters: helical scanning, spatial resolution of 10 μm × 10 μm × 10 μm, voltage of 150 kV, current of 180 μA, layer thickness of 1 mm, layer spacing of 1 mm, 8 layers/revolution, and pitch of 5 mm/revolution. A total of 3000 images with a resolution of 10.4 μm were acquired for different angles of each sample, and all the slices were exported and saved as 8-bit grey scale images for the next analysis.
Image J(2) software was used to binarise the image, remove artifacts and other image corrections, and then segment the binarised image into soil and porosity to obtain a black and white binary image, with the white area representing the soil matrix and the black area representing the soil porosity. The three-dimensional quantitative structural spatial model of rammed soil was established through the process of image filtering and enhancement, threshold segmentation calculation, and three-dimensional visual reconstruction using Avizo software, and the geometric characteristics of soil-rhizoid pores (pore surface area, length, number, and volume), morphological characteristics of the pores (degree of anisotropy, fractal dimension, Euler number, and mean tortuosity), pore diameter and shape distribution (connected porosity, isolated porosity), and pore space network structure analyzed for each parameter [28].

2.6. Simulation Test of Soil Moisture Infiltration

Due to the special provisions of the heritage conservation guidelines, only Mini Disk (USA), which has less impact on the soil, was used for in situ simulation of precipitation to measure the process of water infiltration in bare soil, mixed algal crusts, and moss crusts, and a stopwatch was used to record the change of the water level scale line of the water storage of the infiltrometer over time, and the change was recorded once every 15 s. The test site was selected in the same area where the samples were collected, and three replicates were sampled from each test site, the infiltration study was conducted in the natural dry state of the Great Wall soil (no rainfall occurred in the month before the simulation test) and the water temperature was maintained at 18 ± 2 °C during the experiment. The initial infiltration rate (3 min from the beginning), the stable infiltration rate, the average infiltration rate, and the cumulative infiltration amount (30 min) were selected to analyse the soil infiltration characteristics. Initial infiltration rate = the amount of infiltration in the initial time period/infiltration time, stable infiltration rate = the infiltration rate when the infiltration amount per unit of time is stable, and average infiltration rate = the total amount of infiltration when the stable infiltration is reached/infiltration time.

2.7. Data Analysis and Mapping

SPSS 25.0 software was used to statistically analyse the data. The t-test and ANOVA were performed on the porosity, face porosity, fractal dimension, Euler number, physicochemical properties, and soil water infiltration parameters of each sample, and the significance was tested by the one-way ANOVA (p < 0.05), and pearson correlation analyses were carried out on each index. IBM SPSS AMOS 26.0 (Chicago, IL, USA) software was used to construct the structural equation model, and Origin Pro 2024 software was used for graphing.

3. Results

3.1. Characteristics of Biocrusts and Their Impact on Soil Properties

As shown in Table 1, there were significant differences (p < 0.05) in the physico-chemical properties of the soils of bare soil, moss crust and cyanobacterial-lichen crust cover. The thickness of moss crust was 14.47 ± 0.65 mm, the biomass 0.11 ± 0.02 g·cm–2, and the chlorophyll content 2.29 ± 0.21 μg·g−1. The thickness, biomass, and chlorophyll content of cyanobacterial-lichen crust are only 55.21%, 69.64%, and 6.63% of the moss crust. Compared with bare soil, moss crust conductivity, clay particle content, silt particle content, total porosity, organic matter content, and surface roughness increased by 35.72%, 15.54%, 10.56%, 46.33%, 519.25%, and 201.99%, respectively; And cyanobacterial-lichen crust silt particle content, total porosity, organic matter content, and surface roughness increased by 1.13%, 23.61%, 302.97%, and 373.58%, respectively; Moss crust sand content, soil bulk density and pH decreased by 5.11%, 23.74% and 8.75%, respectively; And cyanobacterial-lichen crust soil bulk density, pH, conductivity, and silt particles content decreased by 12.10%, 4.57%, 6.71%, and 2.79%, respectively, but sand content increased by 1.07%. Biocrusts also significantly changed the hydraulic parameters of the compacted soil, the saturated hydraulic conductivity of cyanobacterial-lichen crust and moss crust were 247.06% and 852.94% of that of the bare soil, and the saturated water content was 196.30% and 385.19% of that of the bare soil, respectively; The field capacity of the above two was 872.73% and 1281.82% of that of the bare soil, respectively.

3.2. Microscopic Morphological Differences Between Biocrusts and Rammed Earth

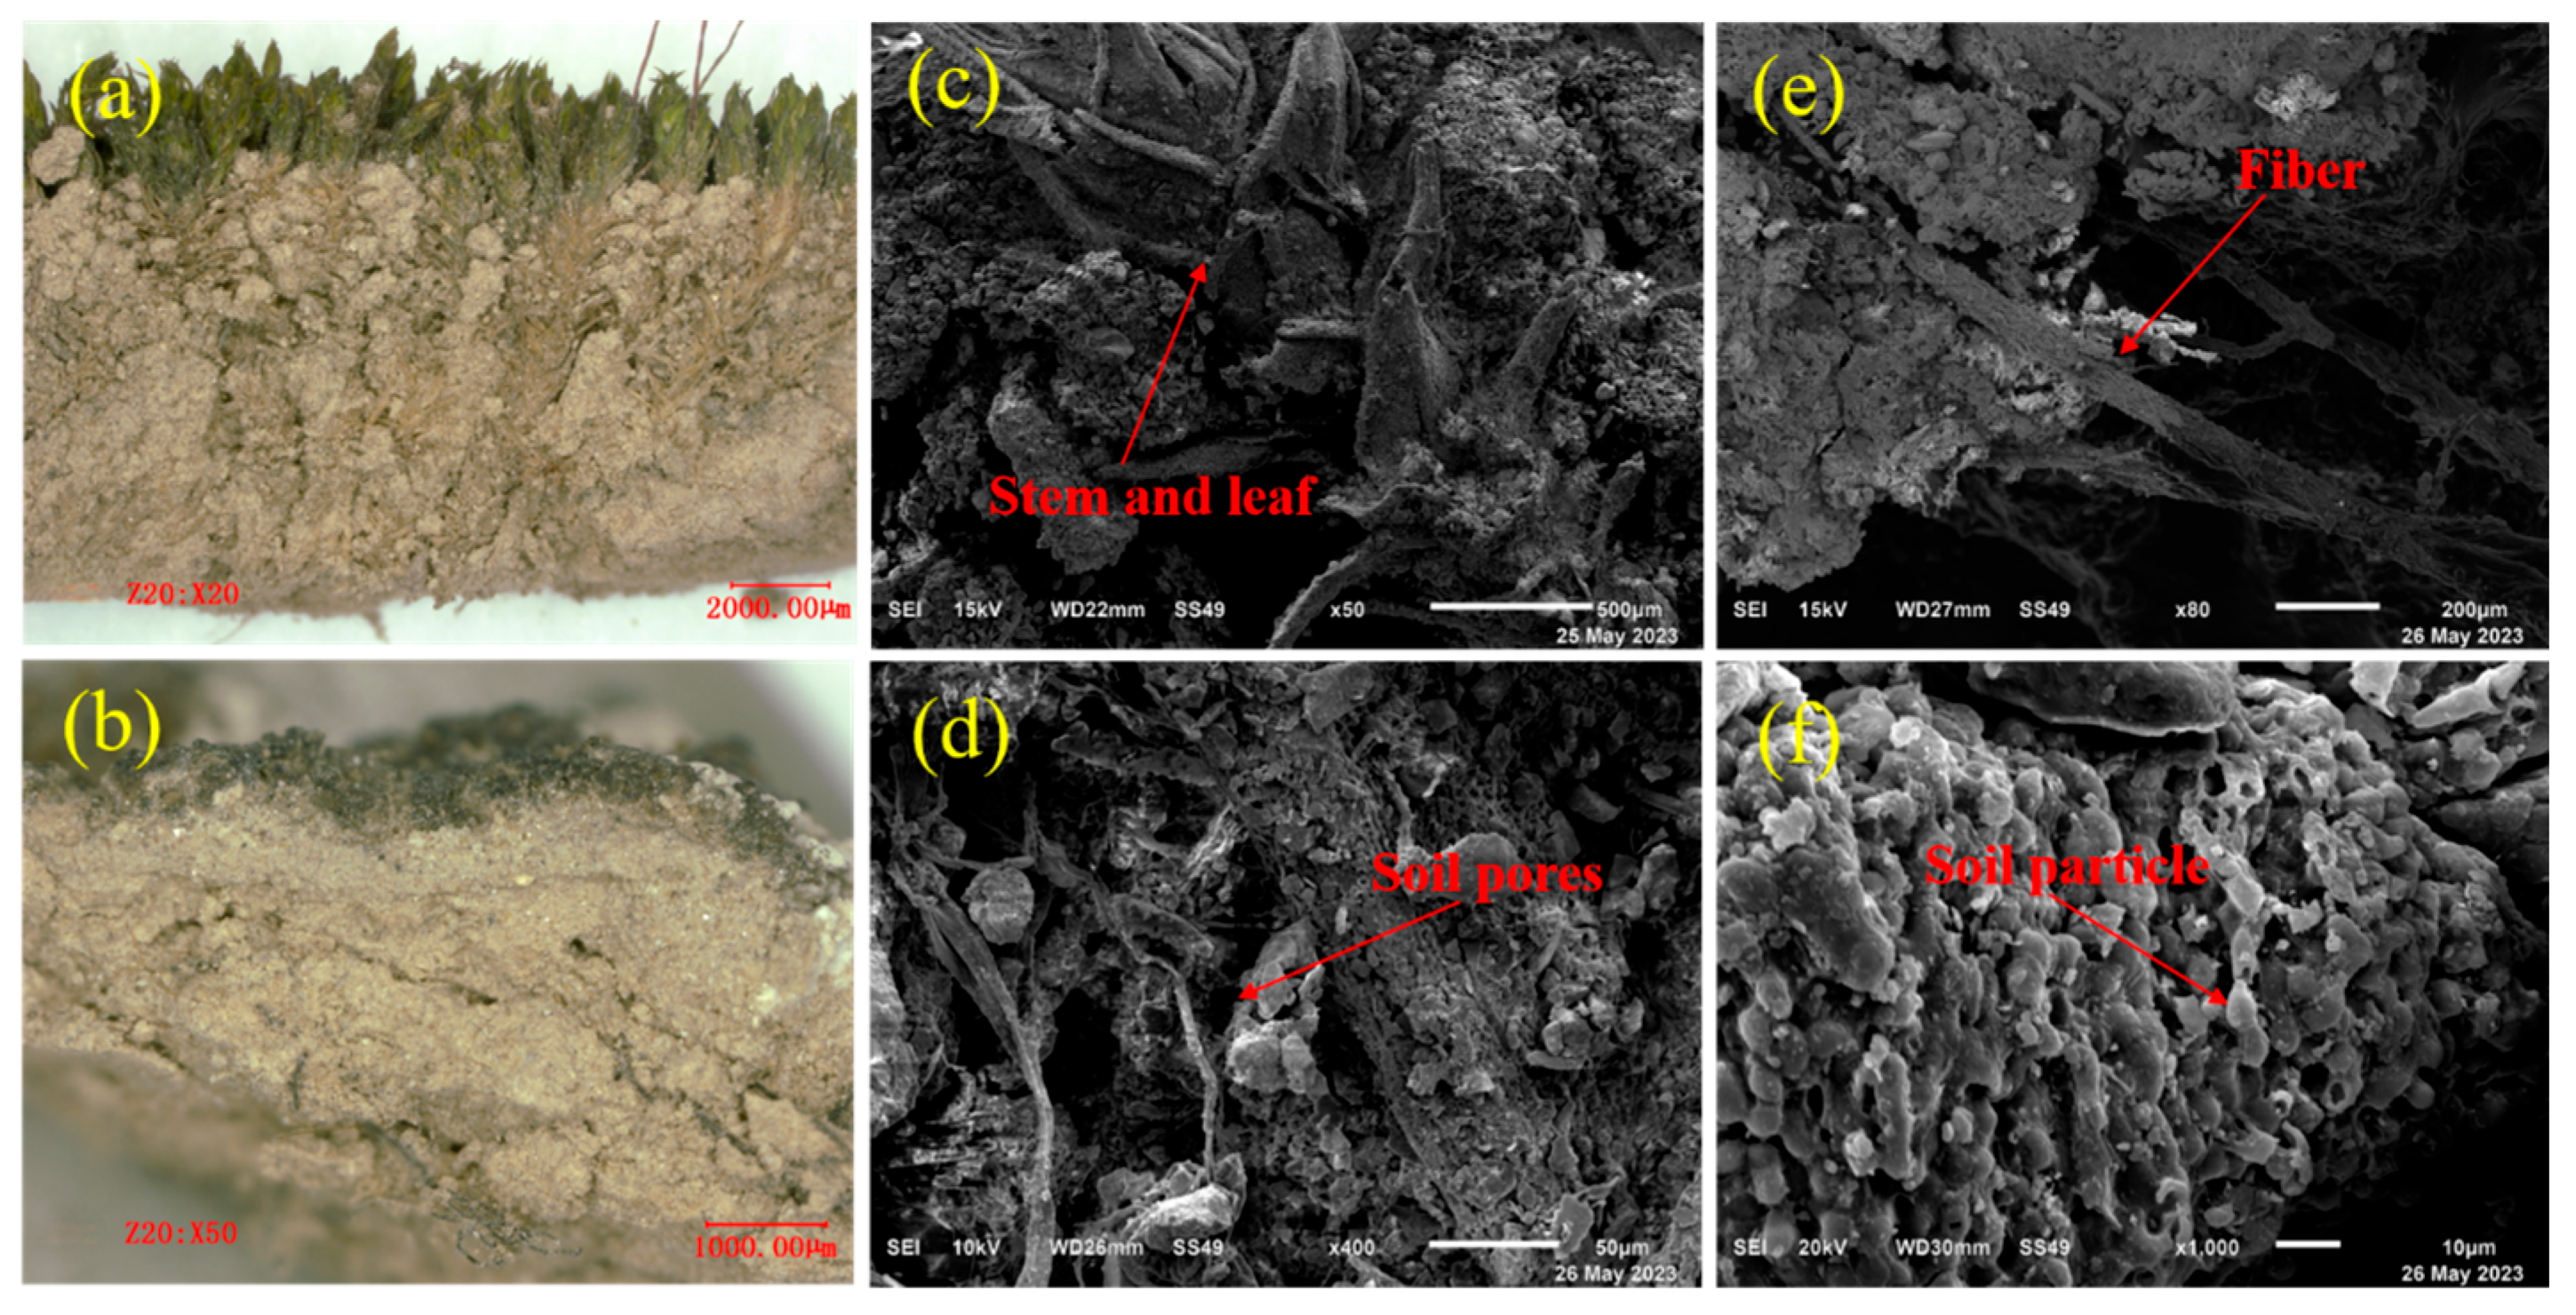
Digital microscope results showed (Figure 2a,b) that mosses had 5–8 mm stems and leaves buried in the soil, cemented with soil particles, and the moss crust was dominated by large pores, with distribution of worm pores, herbaceous root system and moss pseudo-root pores, and soil aggregate pores, which had long extensions, good connectivity, and provided preferential seepage pathways for precipitation infiltration; Algae-lichen crust was distributed in the shallow on the thin layer of the surface of soil of 0.5–1 mm, forming a clear boundary with the underlying soil, with no obvious changes in the pores. The pore size of large pores in the cyanobacterial-lichen crust was significantly smaller than that of the moss crust, and the connectivity between the voids was poor, with a large area of fracture penetration and connected to the pores (Figure 2b shows a number of profiles of fracture penetration in the soil samples), forming a pore-fracture network, and these larger fractures were likely to increase the depth of effective infiltration of precipitation and conduct to the pore channels connected to them to enlarge the area of water infiltration.
Under the scanning electron microscope (SEM) at different magnifications (Figure 2c–f), the size of soil particles around the moss pseudopods was smaller than that of the pseudopod-free area (Figure 2c showed pore spaces of globular soil aggregates), and the soil particles were closely associated with each other, with high porosity, and a large amount of flocculent material was wrapped on the surface of the particles or filled into the pore spaces, which had a clear “mesh-like” surface structure. Biocrusts algal filaments and moss pseudo-roots can extend through the pore space of soil particles to the neighbouring particles, and have the function of capturing and fixing soil particles. The surface of the bare soil area is not covered by biocrusts, but the site has been subjected to rainfall for a long period of time, and the surface layer of the bare rammed soil is very solid, and the soil particles are tightly arranged. There is a small difference in the compactness of the upper and lower particles, and the particles are tightly nested with each other and show a granular morphology and the boundaries are more obvious. There are a small number of pore fissures distributed on the surface, and the pores are mostly inter-particle mosaic pores and less intra-particle pores, with pore diameters smaller than those of the crust-covered area, and poor pore connectivity.

3.3. Effect of Biocrusts on Soil Pore Characteristic Parameters and Spatial Network Structure

3.3.1. Effect of Biocrusts on Porosity and Pore Size

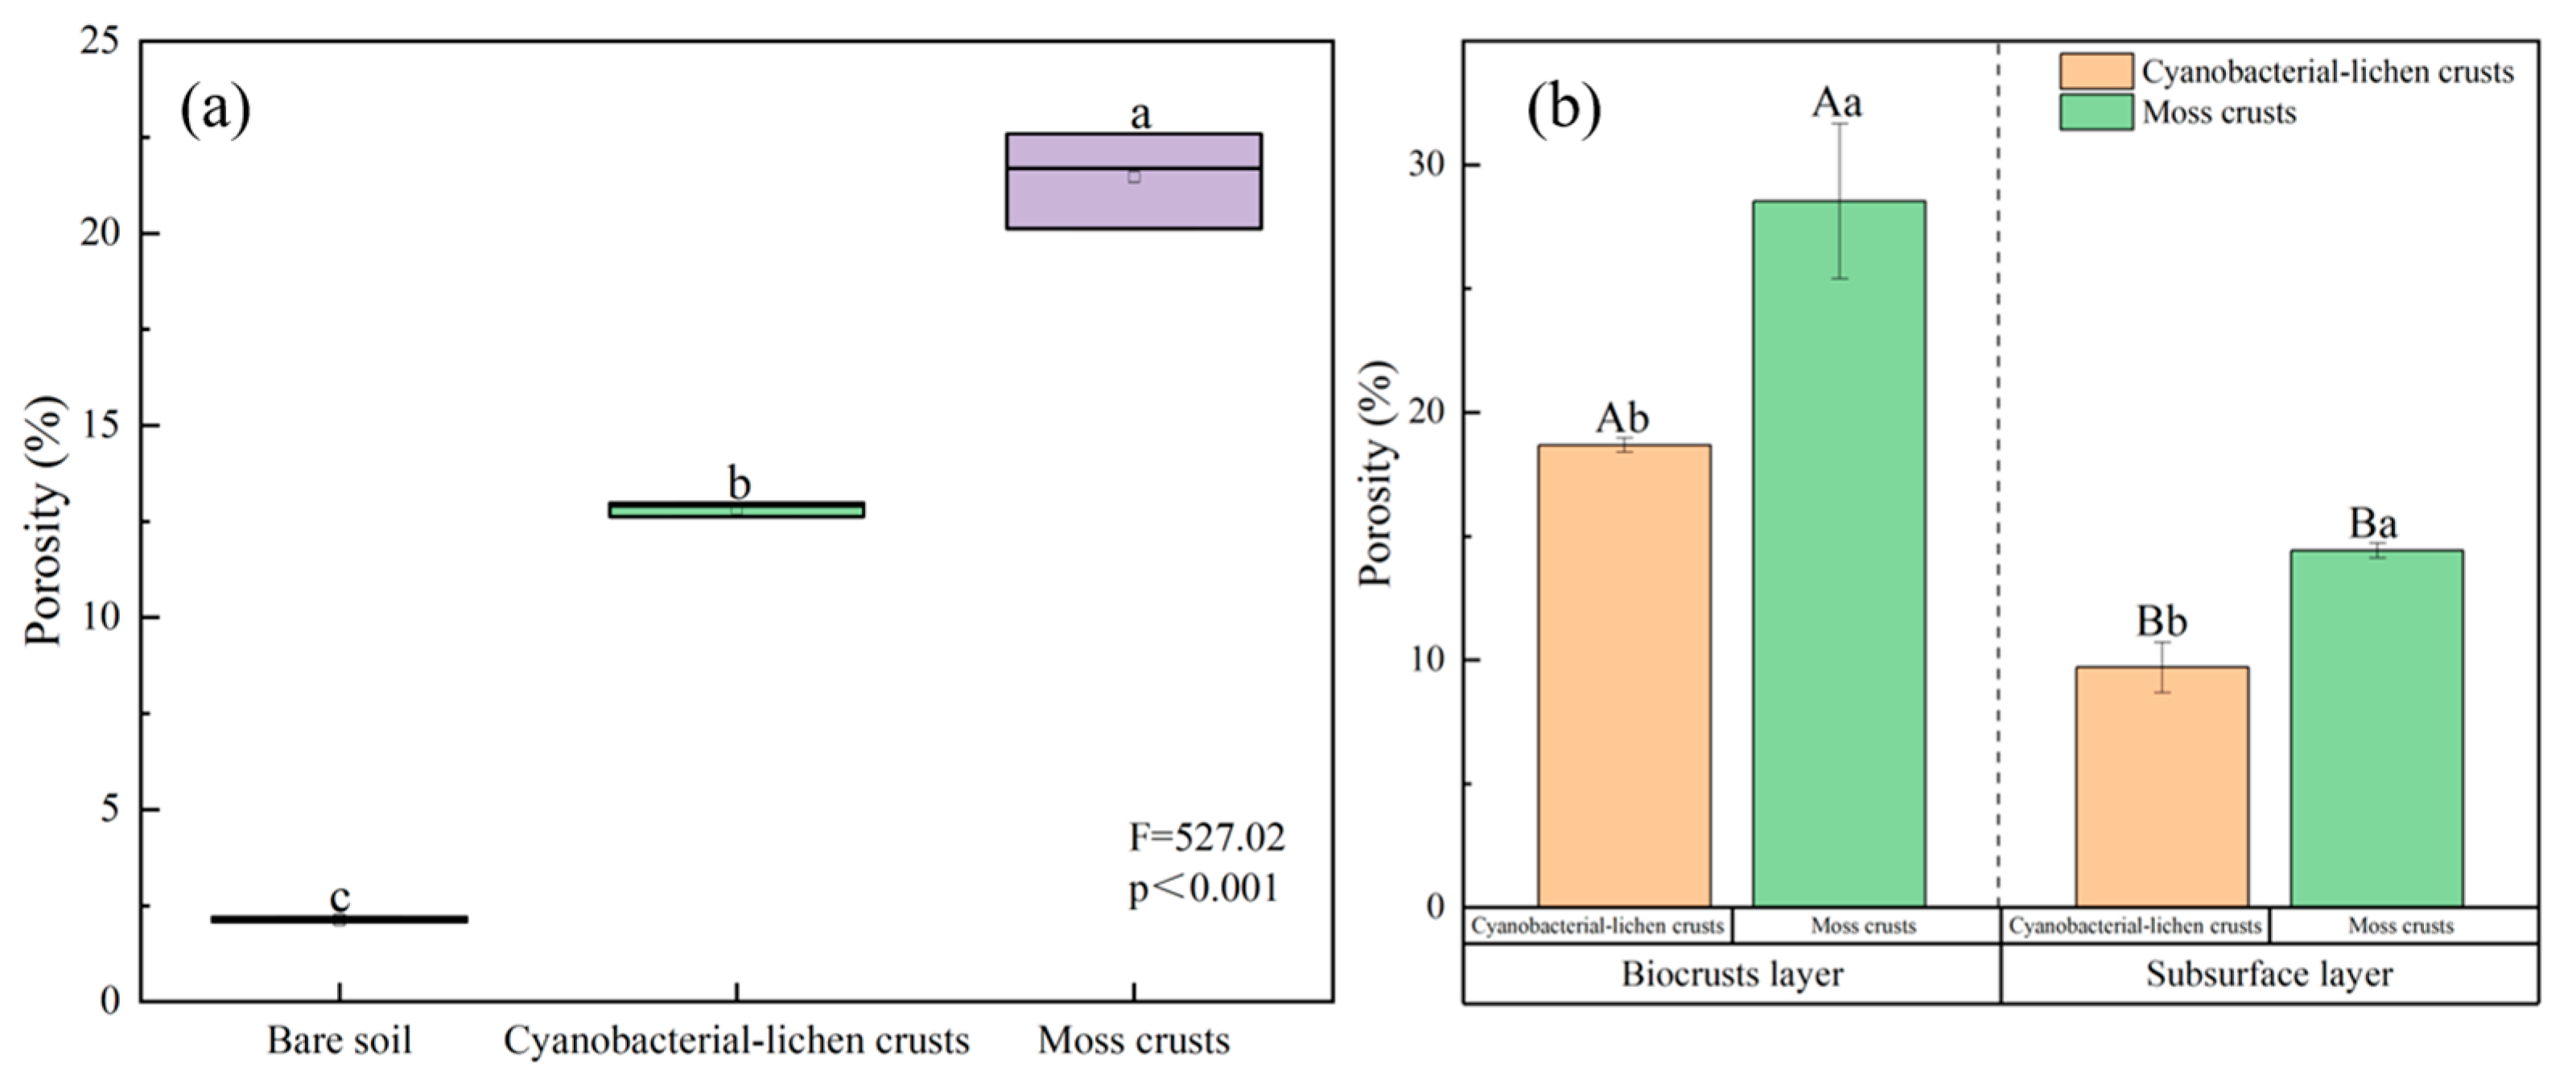
Due to the limitation of CT scanning resolution, the following pores all refer to the pores with equivalent diameter greater than 50 μm, therefore, there is a difference between the actual soil porosity and the actual soil porosity [28]. As shown in Figure 3a, the porosity of all three soil types showed moss crust > cyanobacterial-lichen crust > bare soil in the 0–50 mm depth range (p < 0.05), with the porosity of cyanobacterial-lichen crust and moss crust of 12.84% and 21.47%, respectively, 5 times and 9.03 times higher than bare soil (2.14%). The porosity of the biocrusts samples was significantly higher in the biocrusts layer than in the subsurface layers, and the porosity of the subsurface layers of cyanobacterial-lichen crust and moss crust was significantly lower than that of the biocrusts layer by 92.54% and 97.96%, respectively (p < 0.05), and the porosity of the moss crust was significantly higher than that of the cyanobacterial-lichen crust in all the same layers (p < 0.05) (Figure 3b).

3.3.2. Effect of Biocrusts on Three-Dimensional Soil Pore Characteristics

The surface area density reflects the size of the physically and chemically active surface of the soil, the length density reflects the branching of pores, the network density reflects the interaction ability of pores, the mean pore volume indicates the “size” distribution of pores, and the node density reflects the complexity of the pore network [28]. As shown in Table 2, the surface area density, average pore length density, network density, mean pore volume and node density of biocrusts were significantly higher than those of bare soil in the 0–50 mm depth range. The surface area density, mean pore volume and node density of cyanobacterial-lichen crust and moss crust was 6.54, 2.42, 303.69, 122.43, 105.13 and 5.04, 3.63, 79.13, 82, 44.70 times higher than those of bare soil, respectively. Algae-lichen crusts had a greater effect on soil pore characteristics than moss crusts, and the trend of the effect of the biocrusts layer and the lower layer on soil pore characteristics was basically the same as that of the overall soil column.

3.3.3. Effect of Biocrusts on Characterisation Parameters of Porosity

Anisotropy reflects the degree of difference in soil pore structure in different directions, fractal dimension quantifies the complexity and self similarity of pore structure parameters, Euler number describes the connectivity of pore networks, and mean tortuosity characterizes the degree of curvature of fluid migration paths [28]. The results in Table 3 show that in the 0–50 mm depth range, cyanobacterial-lichen crusts increased the degree of anisotropy, mean tortuosity of soil porosity and moss crusts decreased the degree of anisotropy, mean tortuosity of soil porosity compared to bare soil, but the differences were not significant. Fractal dimension was higher in biocrusts than in bare soil, but the differences were not significant. Cyanobacterial-lichen and moss crust Euler number were significantly (p < 0.05) higher than bare soil. Overall, cyanobacterial-lichen crusts had a greater effect on soil pore morphological parameters than moss crusts. Between different biocrusts layers, the effects of cyanobacterial-lichen crust and moss crust on soil pore morphological parameters were basically consistent with the trend of the whole soil profile.
The mean shape factor characterizes the complexity of pores, sphericity quantifies the degree to which pores approach an ideal sphere, flatness reflects the fluctuation of pore contours relative to a reference plane, and elongation describes the deviation of pore defects relative to a rectangular sample [28]. The mean shape factor is a descriptive statistic of the complexity of the shape of the soil pores after integrating the shape deviations of the sphericity and other parameters. The sphericity is used to describe whether the pores are close to a rounded sphere or not, the flatness can respond to the deviation of the pores above and below the same reference surface, and the elongation, compactness, and gap are descriptive of the deviation of the pore defects with respect to the rectangular samples. As shown in Table 4, the mean shape factor, flatness, and elongation of the pores of the biocrusts were significantly lower than those of the bare soil in the 0–50 mm depth range (p < 0.05). Compared with bare soil, the mean shape factor of pores of cyanobacterial-lichen crust and moss crust decreased by 67.54% and 74.19%, flatness by 126.67% and 120.00%, and elongation by 103.23% and 96.77%, respectively (p < 0.05). Meanwhile, the biocrusts also reduced soil pore sphericity and compactness, but the difference was not significant, compared to bare soil. The pore gap of cyanobacterial-lichen crust and moss crust increased by 0.44 times and 0.48 times, respectively (p < 0.05), respectively, compared with bare soil. The effect of different types of biocrusts surface layers on each shape parameter of the pore space was not significant, but there was a significant difference in the mean shape factor and elongation of the biocrusts lower layers (p < 0.05).

3.3.4. Effect of Biocrusts on Modelling of Soil Pore Networks

As in Table 5, each parameter differed significantly between bare soil and biocrusts. The connected porosity of cyanobacterial-lichen crust and moss crust was 1.33 and 2.75 times higher than that of bare soil, respectively. Compared with bare soil, Moss crust and cyanobacterial-lichen crust increased isolated porosity (by 40.85 and 25.55 times, respectively), node porosity (by 36.08 and 17.13 times, respectively), and channel number (by 16.64 and 7.71 times, respectively), respectively, but decreased the average throat area both by 99%, the length of channels by 68.71% and 76.24%. The coordination number of cyanobacterial-lichen crust increased by 0.64 times compared to bare soil and moss crust decreased by 61.73%, compared to bare soil. Porosity also varied significantly between the different layers of the biocrusts.
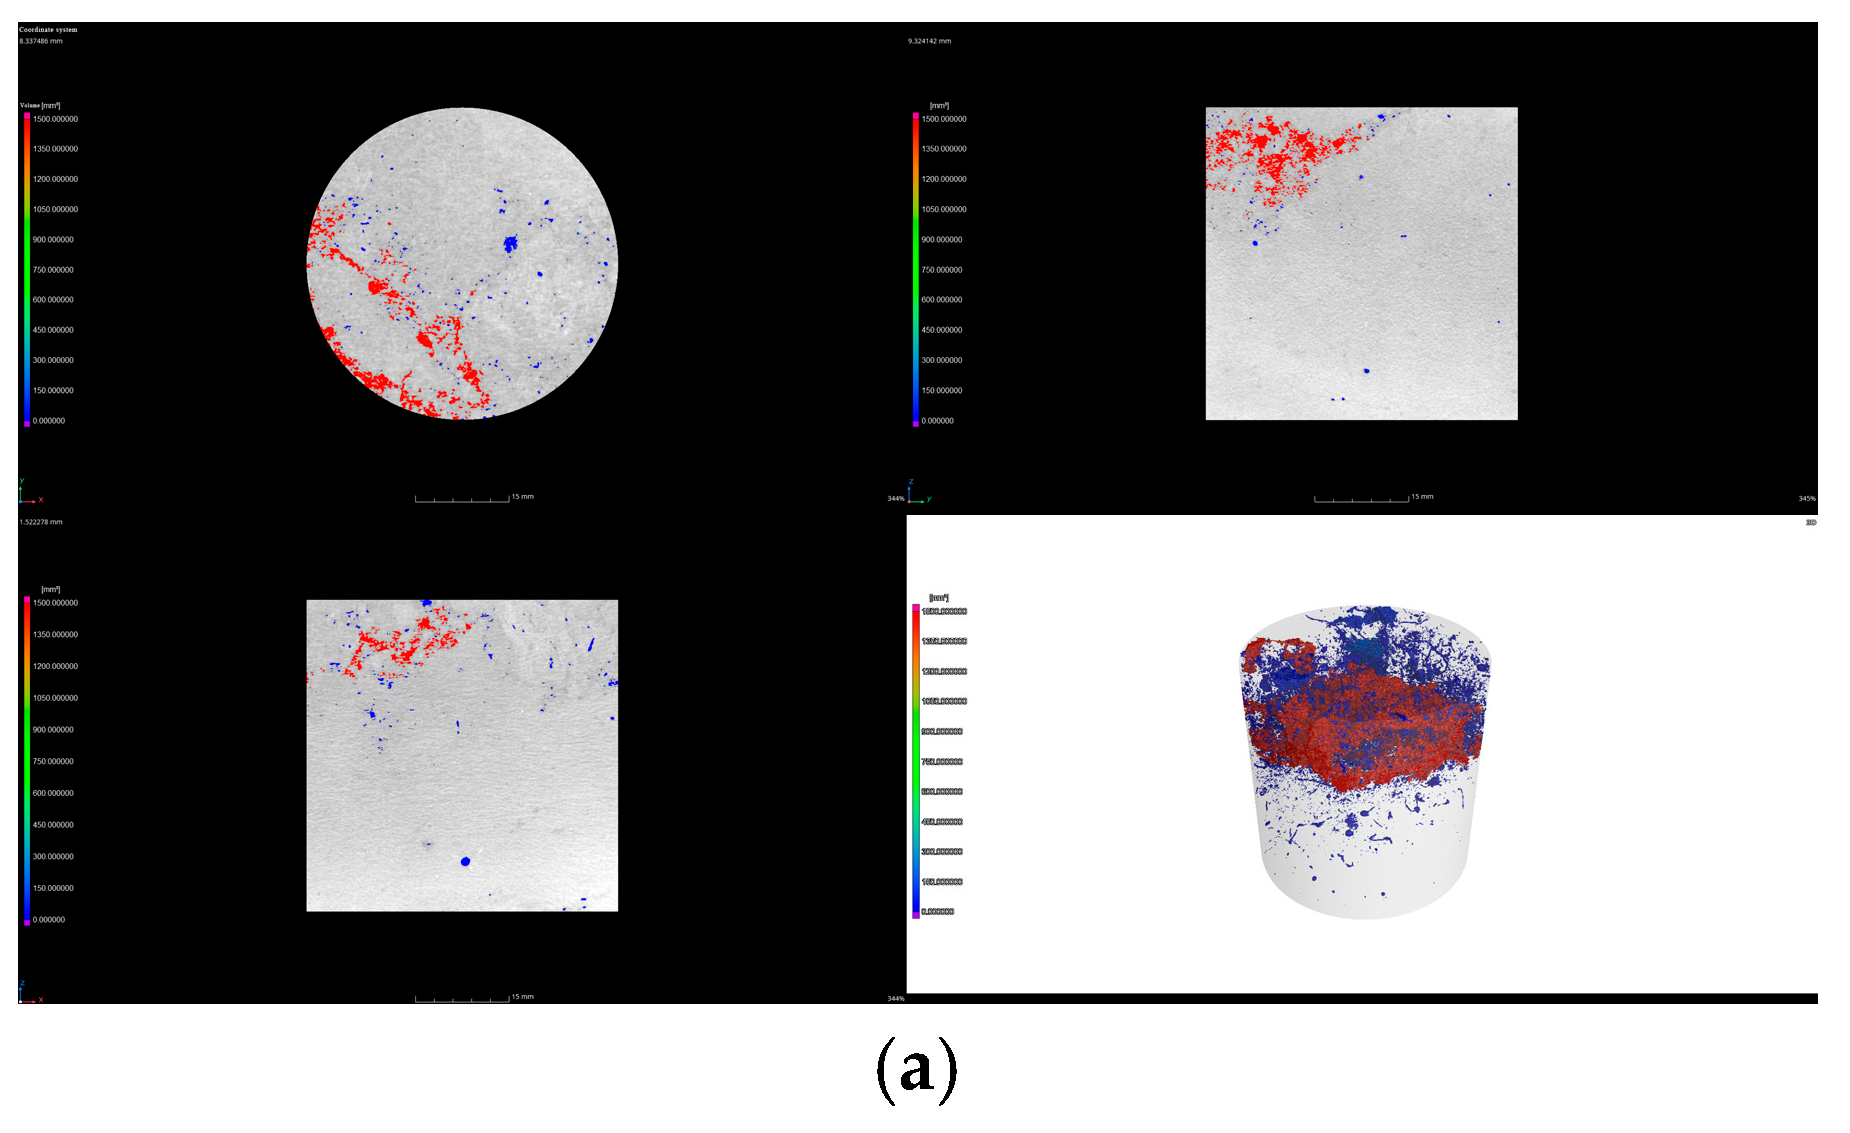
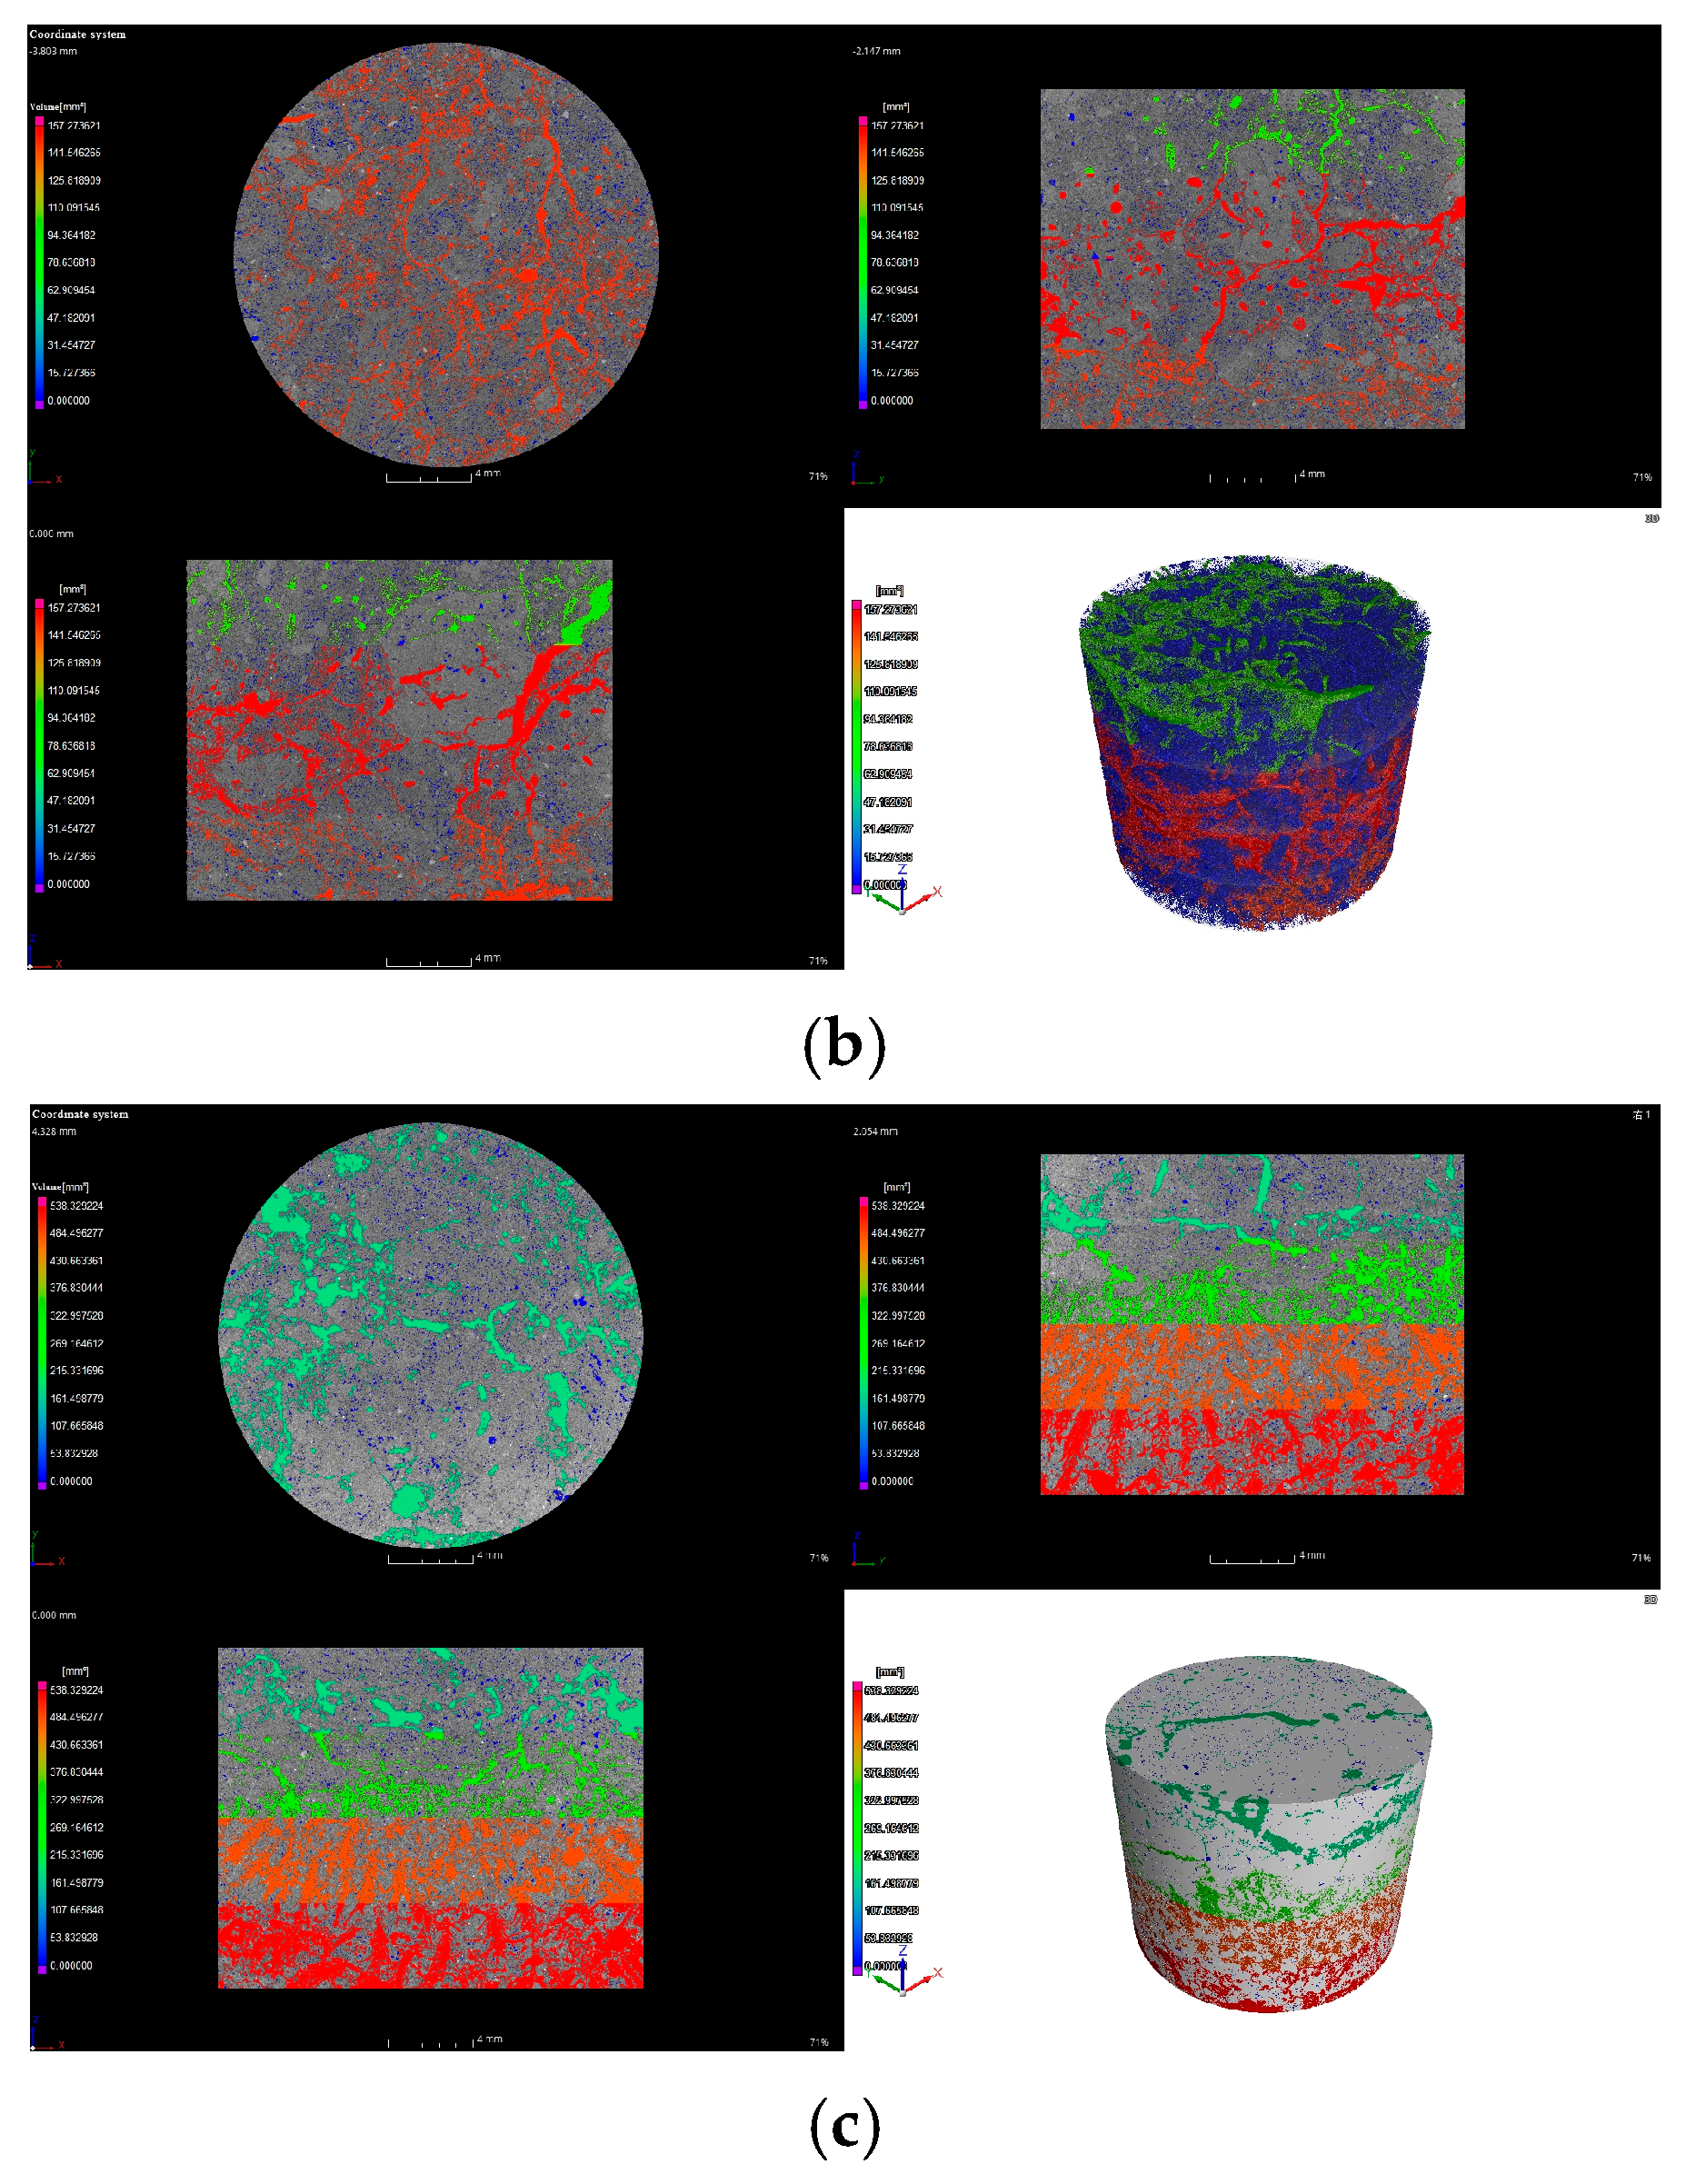
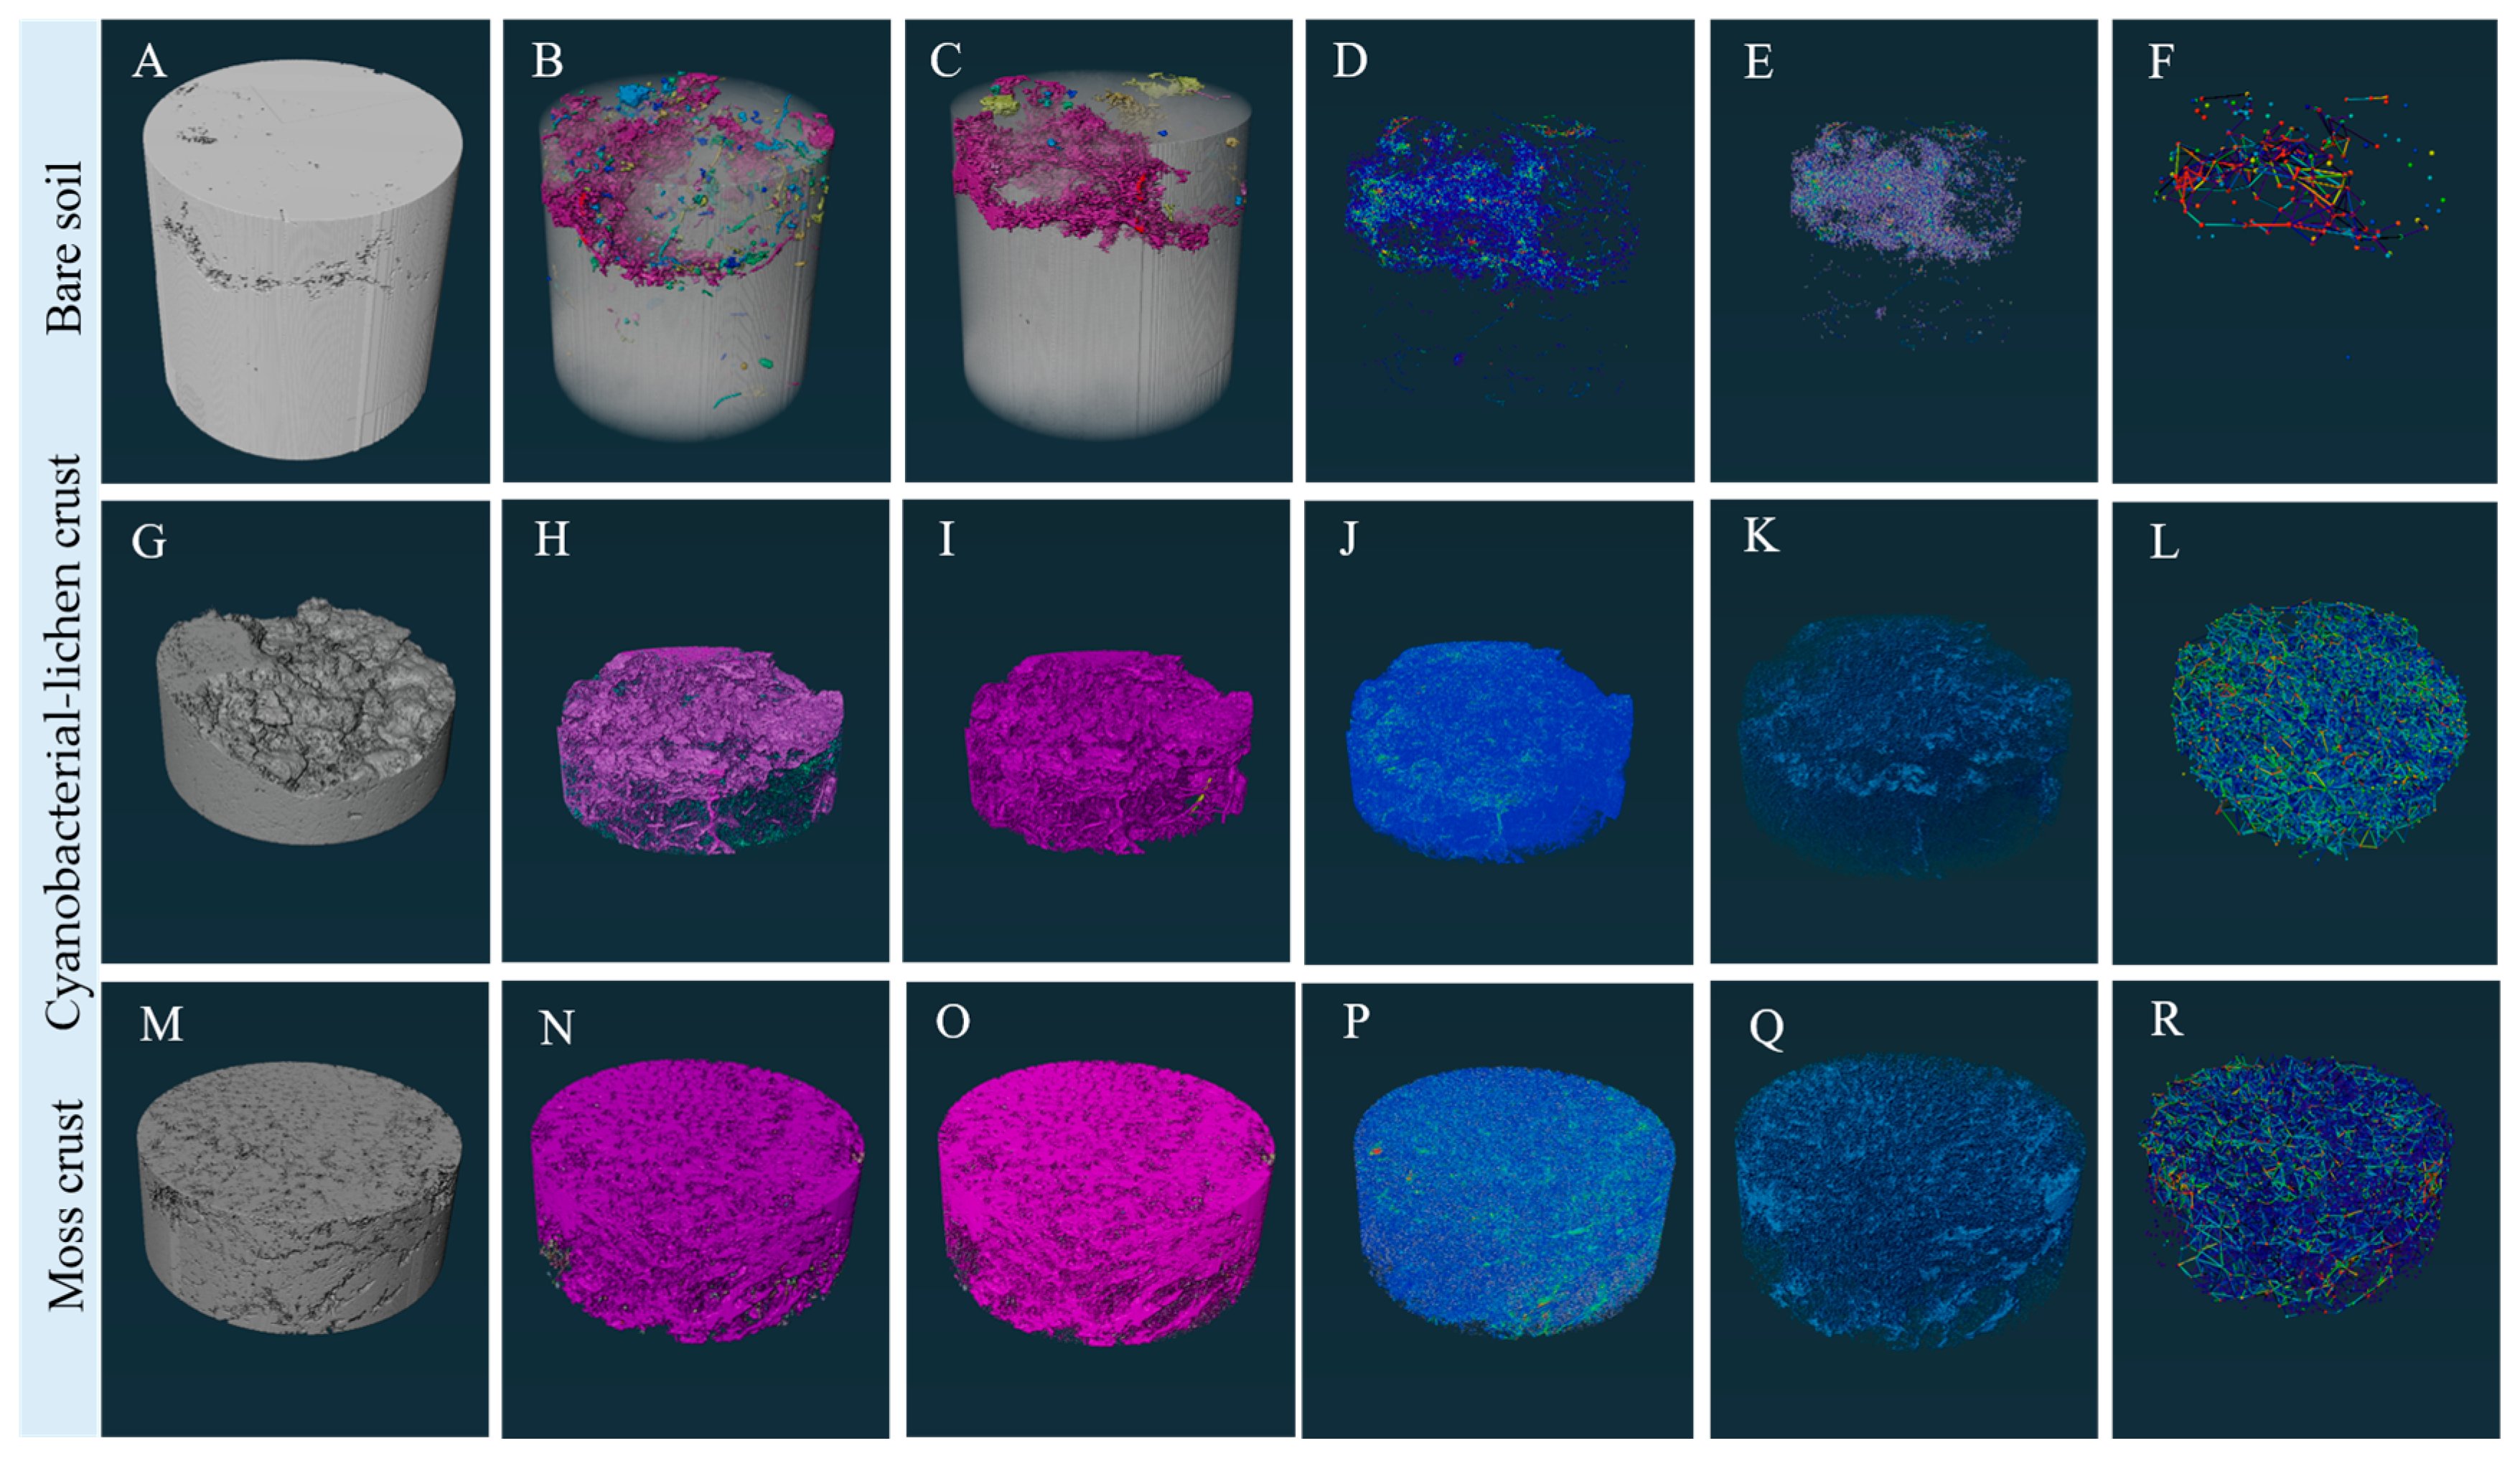
The 2 D and 3 D visualised structural models of the pores of the three soils are shown in Figure 4 and Figure 5, with significant differences in the pore structure of the samples, and the two types of biocrusts showing elongated pore systems at the connection with the ramified soil, which is more complex than the pore network model of the bare soil. The moss crust had the most complex connected pore network system, followed by the cyanobacterial-lichen crust and bare soil. The black areas are less dense and generally fissures, pores or plant roots, etc., while the light-coloured areas are more dense and mostly mineral particles. Through observation, it can basically show that there are more black areas in the image of moss crust, with more microstructures such as pores and cracks, showing complex pores connected or disconnected with cracks, presenting an obvious complex porous structure, and most of these pores and cracks come from moss pseudopetioles or other organic matter decay, indicating poorly soil densification at this time. The moss crust was dominated by the connected large pores formed by rhizines, with fewer medium and small pores, and obviously small aggregate structure could be observed inside the large aggregates. The soil aggregate structure was relatively loose, with a larger number of pores and better pore connectivity, and the difference in the three-dimensional pore structure in the middle portion of the agglomerates was even more significant, and the growth of the moss crust contributed to the development of the large soil pores. The moss rhizines filled in the shallow soil layer of 5–8 mm and the porosity increased with root development, the pore distribution was more uniform in areas without moss root distribution in the 20–40 mm soil depth range, in addition, a small number of larger pores were distributed around the edges of the soil columns, which could be cracks caused by sampling disturbance. The images of cyanobacterial-lichen crusts showed large differences in performance, with black areas being more numerous and unevenly distributed in the surface layer, indicating that their internal porosity and density showed an uneven distribution, dominated by fine pore structures and poor pore connectivity. The small pores are mainly distributed in the 0.5–1 mm of the soil surface layer, and the deep soil pores gradually decrease. The scanning image of bare soil was brighter overall, with a small number of black dots, showing clear homogeneity, with dense microstructure and a small number of internal isolated pores, the profile was more compact, the contours and boundaries of medium and small aggregates could not be observed inside the large aggregates, and the inter-pore connectivity was poor, with a small number of microcracks distributed and a lack of connecting channels, which was unfavourable for water transport, this indicates that the artificially compacted soil is highly dense. The total pores and connected macropores in biological crusts are significantly more than those in bare soil. Skeleton models, node skeleton models, and ball and stick models are more complex and diverse than bare soil. Fresh crusts exhibit higher diversity in three-dimensional pore structures than lichen crusts (Figure 5).

3.4. Impact of Biocrusts on Precipitation Infiltration

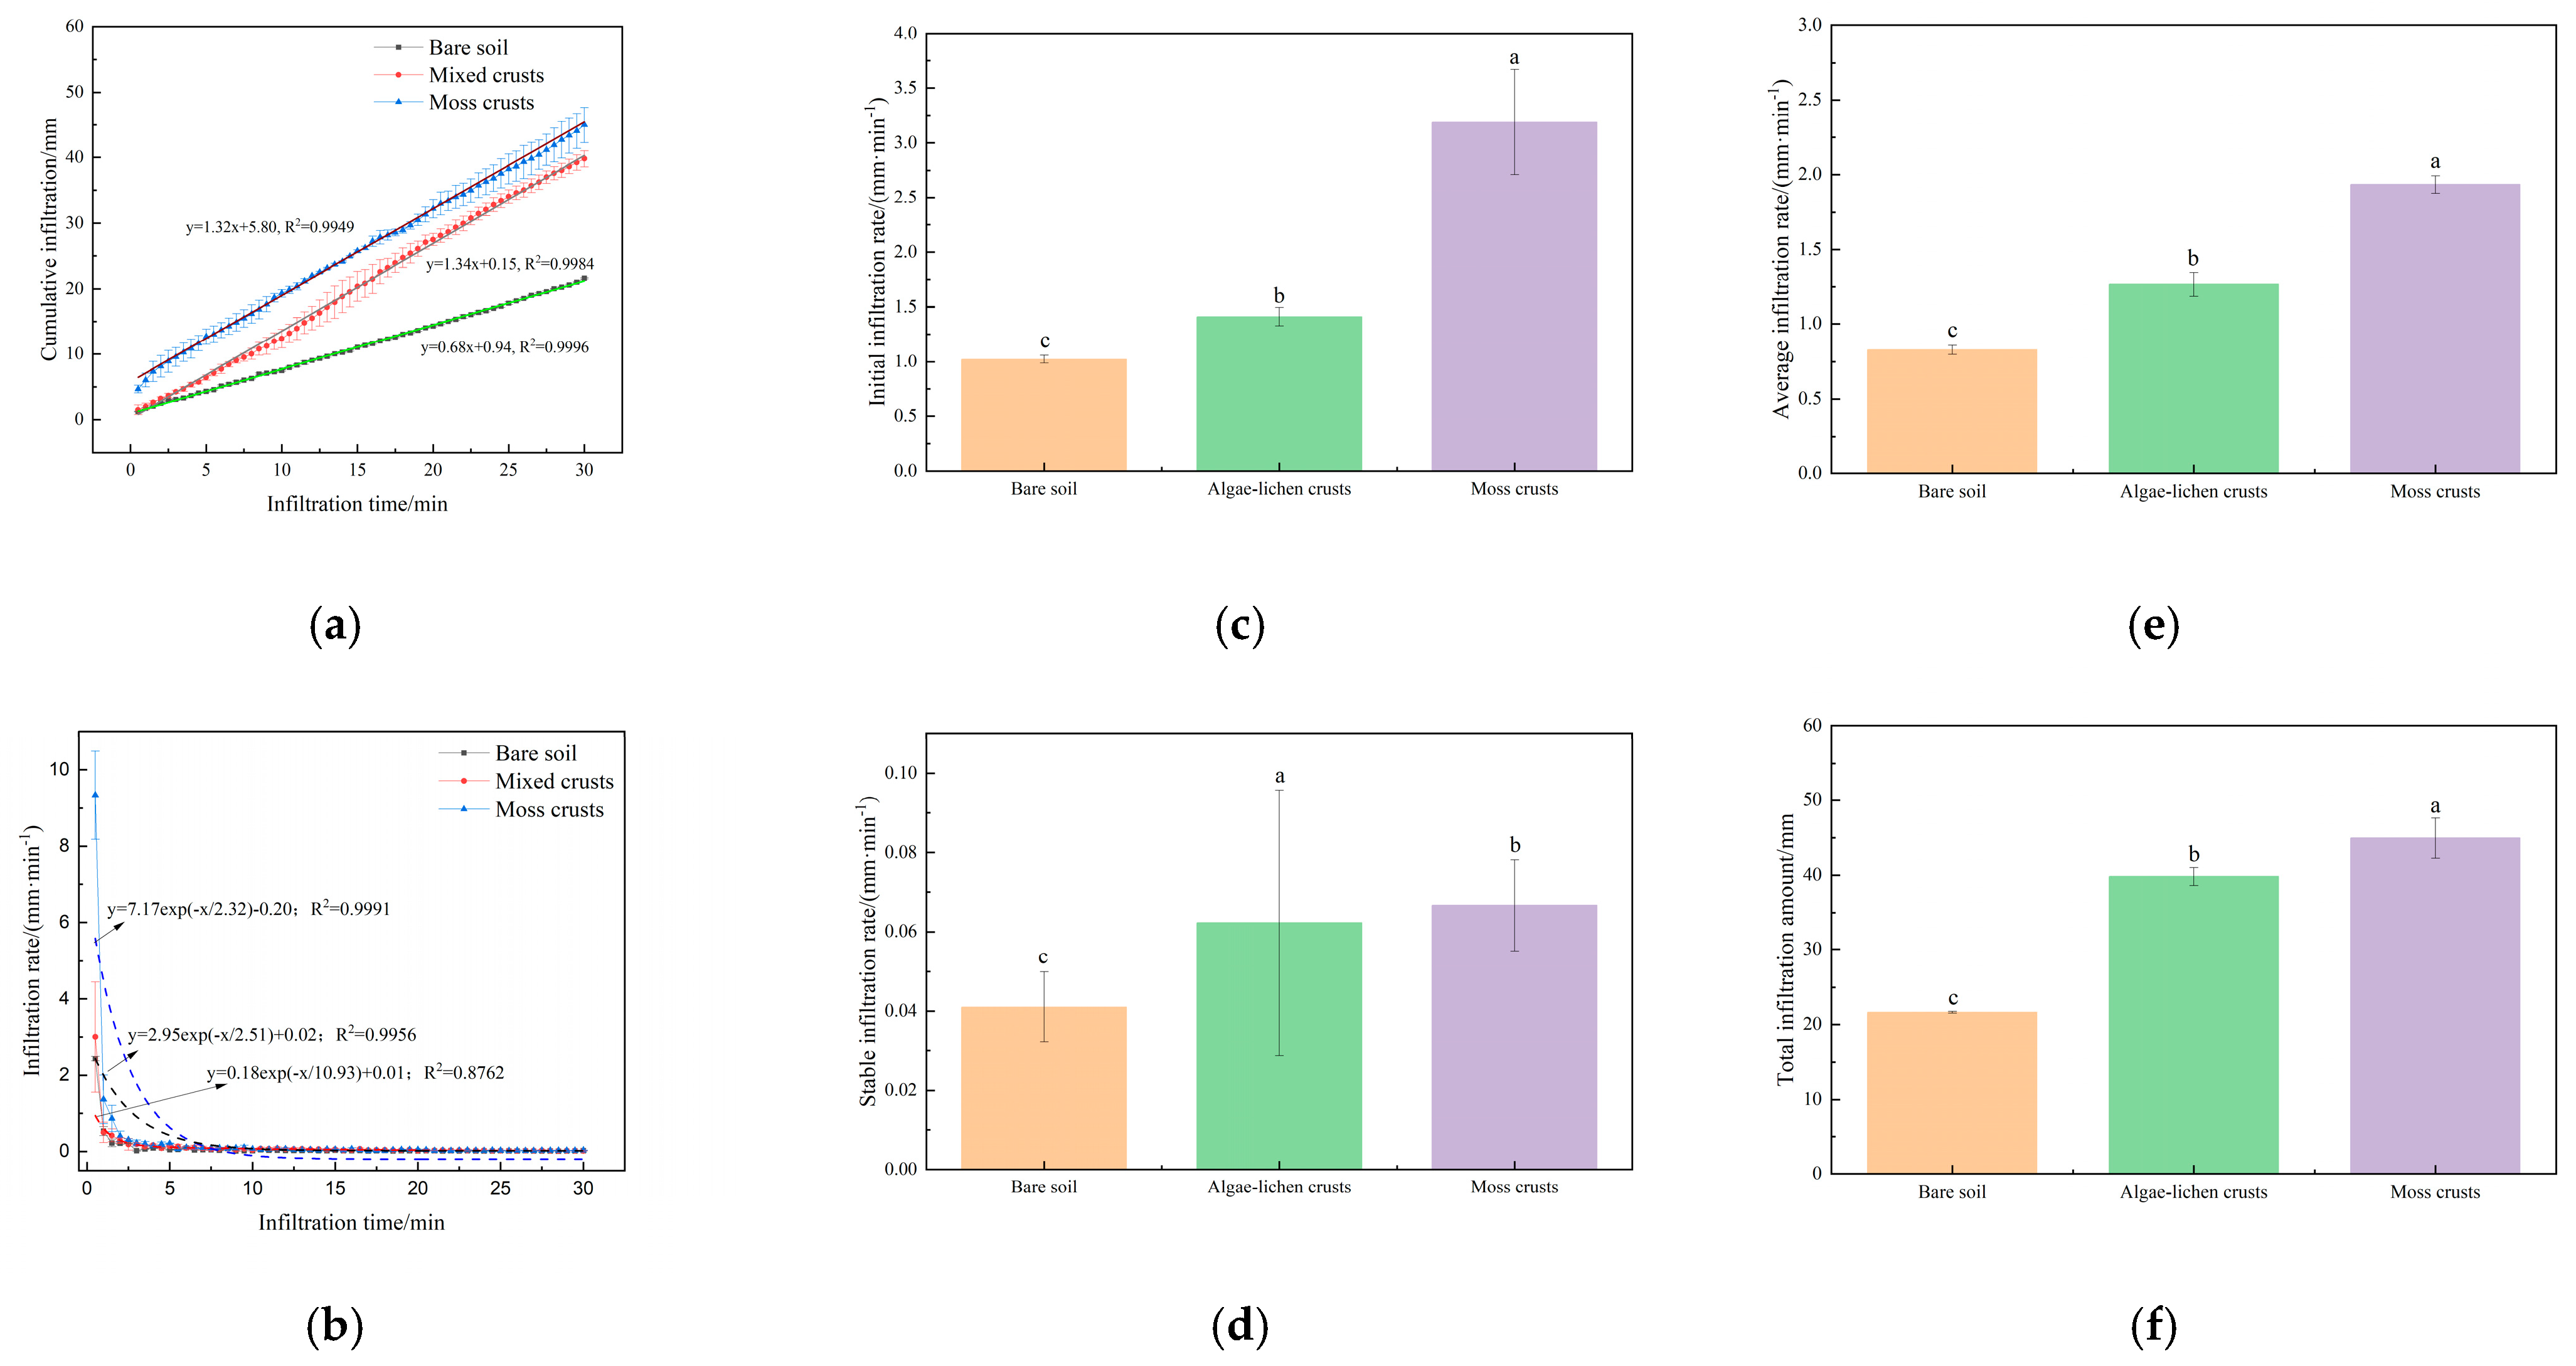
As a key indicator of soil precipitation infiltration, the surface infiltration capacity of soil reflects its ability to contain water. Comparison of water infiltration parameters was carried out by selecting the 30 min representative of the infiltration process, and it can be seen from Figure 6a,b that the cumulative infiltration curves of the biocrusts were basically the same, and all of them showed a steadily increasing trend, but the trend of bare soil changes is more gradual. The cumulative infiltration of bare soil, cyanobacterial-lichen crust, and moss crust shows a linear function relationship with time. Overall, the infiltration rates of the three types of soils decreased sharply in the first 1 min, with greater change between 2–4 min, after which the decreased rate rapidly became smaller and gradually levelled off. The cumulative infiltration rate of bare soil, cyanobacterial-lichen crust, and moss crust shows a power exponential function relationship with time. The initial infiltration rate of moss crust was 3.19 ± 0.48 mm·min−1 > cyanobacterial-lichen crust (1.41 ± 0.08 mm·min−1) > bare soil (1.02 ± 0.04 mm·min−1), and the stabilisation rate of moss crust was 0.07 ± 0.01 mm·min−1 > cyanobacterial-lichen crust (0.06 ± 0.03 mm·min−1) > bare soil (0.04 ± 0.03 mm·min−1). Bare soil (0.04 ± 0.01 mm·min−1), as infiltration proceeded, rammed soil reached the stabilised infiltration rate at the earliest and mosses the latest. The average infiltration rate of moss crust was (1.93 ± 0.06 mm·min−1) > cyanobacterial-lichen crust (1.27 ± 0.08 mm·min−1) > bare soil (0.83 ± 0.03 mm·min−1), and the total amount of infiltration of moss crust was 44.97 ± 2.70 mm > cyanobacterial-lichen crust (39.80 ± 1.21 mm) > bare soil (21.63 ± 0.12 mm). The differences between different types of crust soils were significant (p < 0.05) for all infiltration parameters. The initial infiltration rate, stable infiltration rate, average infiltration rate and total infiltration rate of the moss crust soil was 2.26 and 3.12, 1.07 and 1.63, 1.53 and 2.33, 1.13 and 2.08 times higher than those of the cyanobacterial-lichen crust and bare soil, respectively (Figure 6c–f), which showed that the biocrusts could significantly change the process of water infiltration traits in the surface compacted soil of the soil sites.

3.5. Influence of Soil Properties on Soil Pore Characteristics and Infiltration

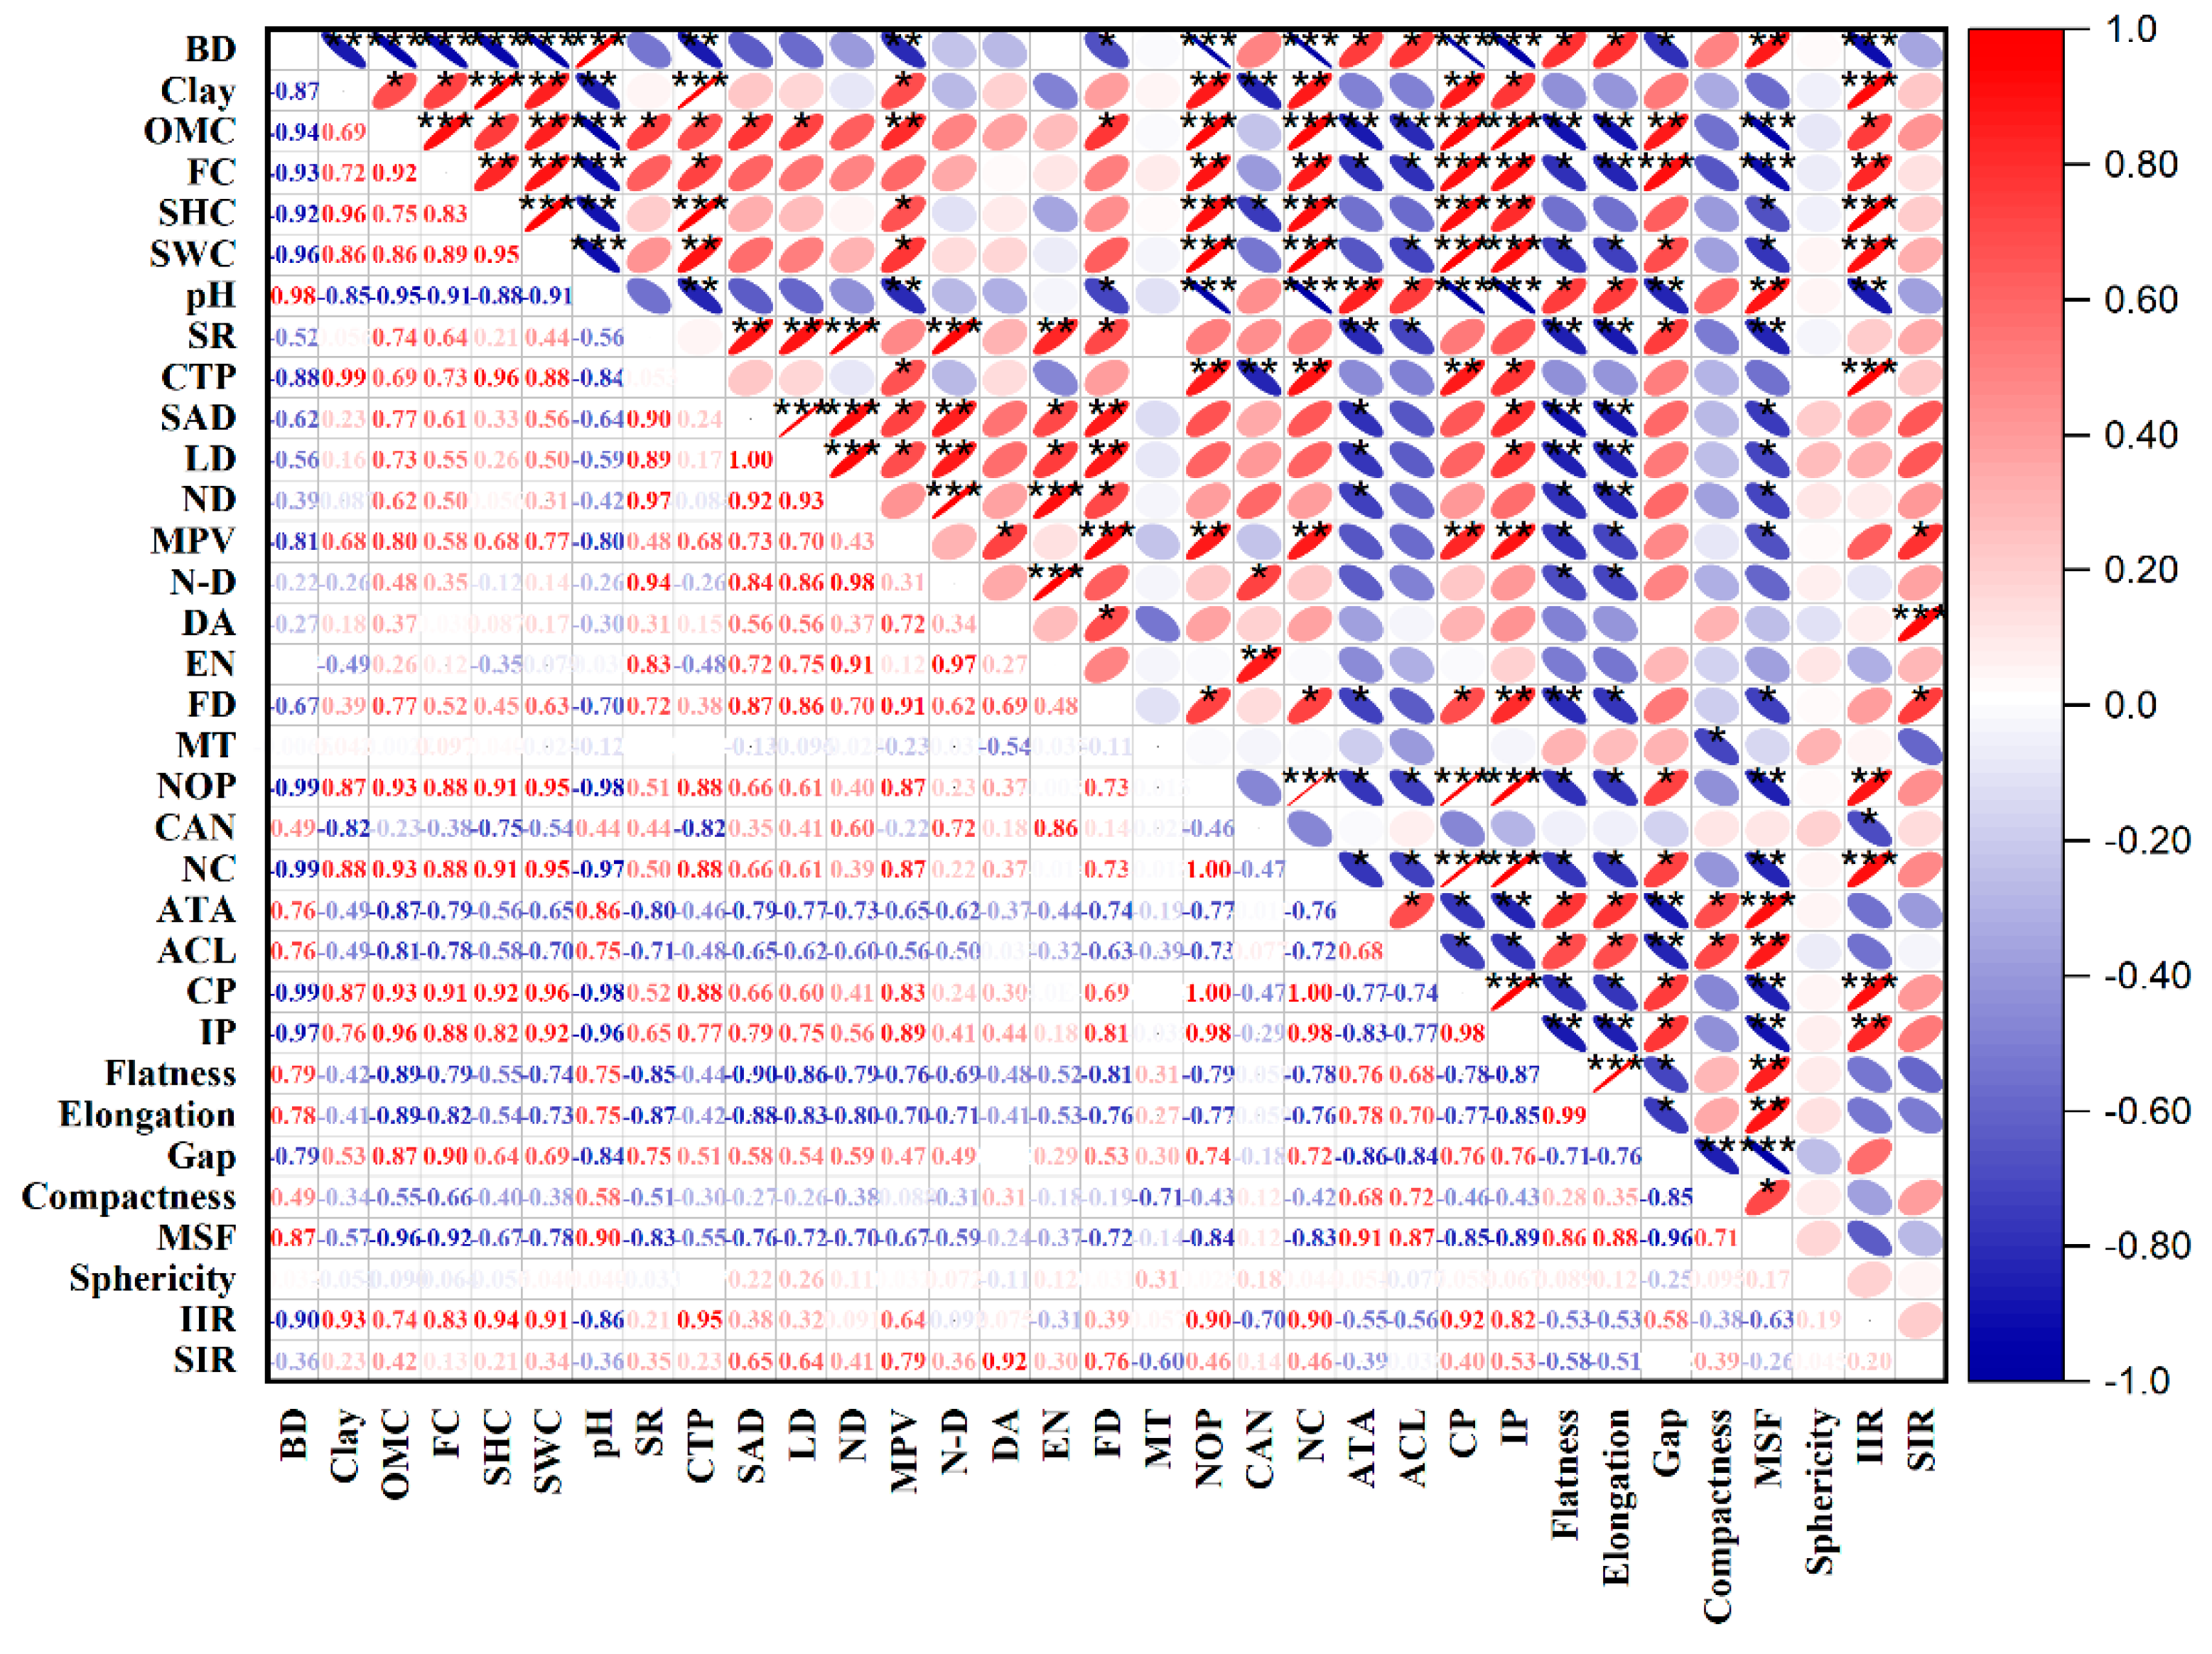
Soil properties have a significant impact on soil porosity and its morphological parameters. As shown in Figure 7, Pearson correlation showed that soil bulk density was negatively correlated with CT porosity (|r| = 0.88, p < 0.01); Soil clay content, organic matter content, field capacity, saturated hydraulic conductivity, and saturated water content were strongly and positively correlated with CT porosity (|r| ≥ 0.69, p < 0.05); And there was a non-significant correlation between CT porosity and soil pore geometry characteristics; Mean pore volume, number of node pores, average coordination number, number of channels, connected porosity, and isolated porosity were significantly correlated with CT porosity (|r| ≥ 0.69, p < 0.05); Except for fractal dimension, which was significantly correlated with PH, soil organic matter content, and soil bulk density (|r| ≥ 0.68, p < 0.05), soil pore characteristics (degree of anisotropy, Euler number, fractal dimension, mean tortuosity) were not significantly correlated with other soil properties; Initial infiltration rate was significantly correlated with soil properties (soil bulk density, clay particle content, soil organic matter content, field capacity, saturated hydraulic conductivity, saturated water content, pH) (|r| ≥ 0.74; p < 0.05), and significantly correlated with number of node pores, average coordination number, number of channels, connected porosity, and isolated porosity (|r| ≥ 0.70; p < 0.05), and stable infiltration rate showed significant correlation with mean pore volume, degree of anisotropy, and fractal dimension (|r| ≥ 0.76; p < 0.05).
The results of the SEM indicate that (Figure 8a), soil type, bulk density, clay particle content, organic matter content, and CT porosity could directly or indirectly affect the initial soil infiltration rate, and all the variables together explained 98% of the initial soil infiltration rate (R2 = 0.98). CT porosity and clay particle content had a significant positive effect on the initial soil infiltration rate (|r| ≥ 0.85, p < 0.001), soil type had a significant direct negative effect on the initial soil infiltration rate (|r| = 2.62, p < 0.001), and the direct negative effect of organic matter content on the initial soil infiltration rate was not significant. Soil type and bulk density had direct positive and negative effects (|r| ≥ 0.52) on CT porosity, respectively, but not significant. Although soil density did not have a direct effect on the initial soil infiltration rate, soil bulk density may have a direct effect on porosity and thus indirectly on soil infiltration. Soil clay particle content had a significant direct negative effect on porosity (|r| = 0.15, p < 0.001), with soil type, bulk density, and clay particle content explaining 99% (R2 = 0.99) of the variation in soil porosity. Crust types significantly affected bulk density, organic matter content, clay particle content, and initial soil infiltration rate (|r| ≥ 0.95, p < 0.001). The results of the total effects analysis showed that the initial infiltration rate was mainly affected by the indirect positive effect of crust type, the direct positive effect of CT porosity, and the indirect negative effect of soil bulk density (Figure 8b).
The graph shows the relationship between crust type (bare soil, cyanobacterial-lichen crust, moss crust) and organic matter content, bulk density, clay particle content, porosity and initial infiltration rate. Values next to arrows indicate standardised path coefficients, unidirectional arrows indicate direct effects of unidirectional causality, arrow widths indicate strength of correlation, and solid lines indicate positive path coefficients and dashed lines indicate negative path coefficients. *, **, and *** indicate statistically significant paths at p < 0.05, p < 0.01, and p < 0.001, respectively.

4. Discussion

4.1. Biocrusts on the Artificially Compacted Soils Alter Physical Properties

Biocrusts significantly alter the physical, chemical, and biological properties of topsoil through their complex biotic-soil interactions [38,39], which are important for both the functioning and the stability of the ecosystems of earth sites. Soil physicochemical properties differed significantly between biocrusts and bare soil, with sand content and bulk density showing moss crust < cyanobacterial-lichen crust < bare soil, and organic matter, silt, clay, total porosity, initial water content, and saturated water content showing opposite trends, suggesting that biocrusts increased the fine particle content of loess and reduced soil compactness during growth, which in turn affected water-holding capacity, this is consistent with previous research findings [28]. Biocrusts can also increase soil acidity, causing acid erosion of the site, and then form biodegradation, which may be the secretion of acidic metabolites by mosses, lichens, and microorganisms, etc. [16]. Biocrusts can also affects the wind profile owing to the increase in rough-ness length that affects the horizonal wind speed near the ground, and weaken soil wind erosion. The loess in Weiyuan area is mainly composed of particles smaller than 0.25 mm, with the silt content higher than 50%, but the content of sand particles only accounts for 1%. This type of loess in its natural state is very loose and permeable, and prone to disintegration by wind erosion and rain. The bulk density of the Great Wall soil compacted by several manual blows increased, the pore ratio decreased to 0.4–0.6, the maximum dry density increased by 40%−50% (1.8–1.94 g·cm−3), and the shear strength increased significantly [37]. As the particle size of the Great Wall rammed soil layer is mainly dominated by silt, the compressive and shear strengths are high in the dry state, but extremely easy to disintegrate when it meets water.
Soil physical and chemical properties are affected by a combination of factors. This study area is distributed in the upper and middle parts of the Great Wall of earth at a height of 2–3 m, with minimised human-disturbance, the physical properties of the soil are mainly affected by the physical, biological and chemical weathering of the surface of the sites. Soil bulk density and porosity are dominant factors affecting soil infiltration [40]). Multiple artificial tamping made the particles of the soil of the Great Wall tightly arranged, the soil pore structure deteriorated, and the bulk density increased.

4.2. Modification of Pore Structure of Artificially Compacted Soil by Biocrusts

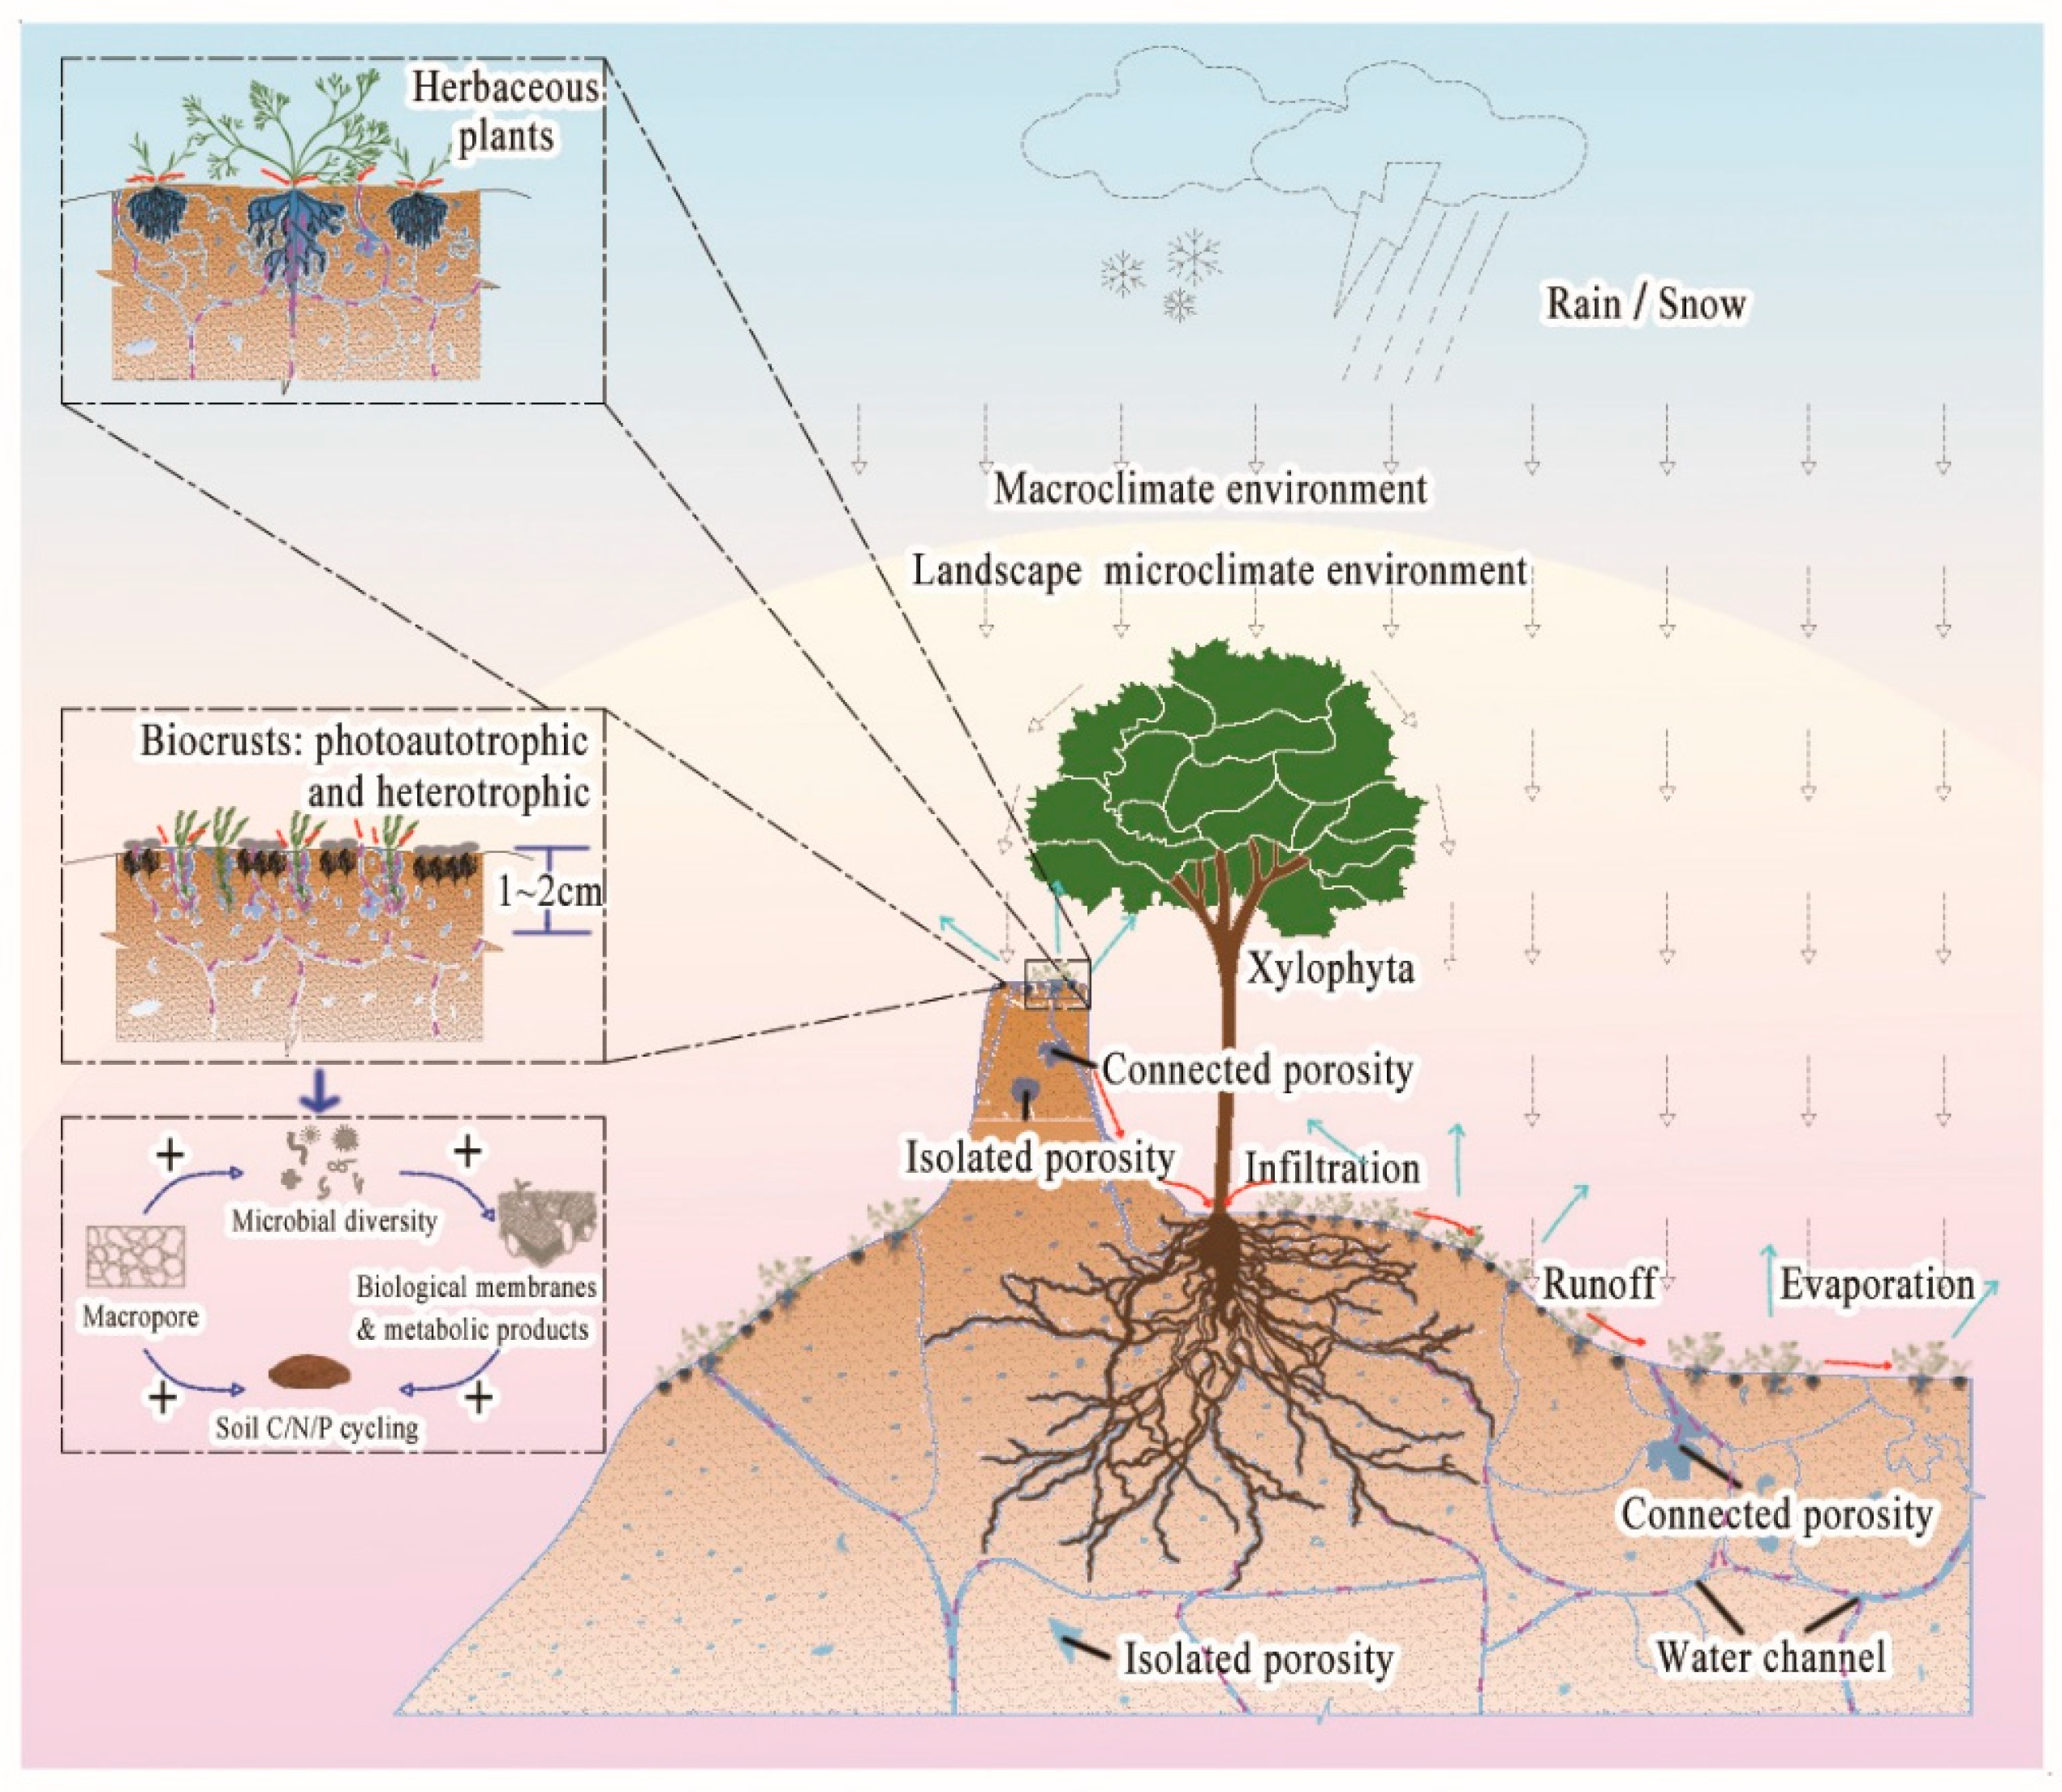
Bare soil in a long run of weathering process, the original structure of the larger agglomerate particles within the shallow surface site was damaged and disintegrated into smaller particles, and this change prolonged rain and wind erosion, water and salt transport, and temperature changes caused by drying, wetting, freezing, and thawing cycles, as a result of reduction of the adhesion between soil particles, increased roughness of the bare soil surface, at last decreased the mechanical properties of the soil, and friction between the soil particles, and accelerated the weathering of rammed soil, and caused site degradation [14]. The topography of biocrusts improves the soil microenvironment, leading to colonisation of the wall by shallow-rooted herbaceous plants, shrubs, and microscopic soil fauna, which causes a differential distribution of the internal pores of the wall, where the connecting pores are well ventilated and easily forms a pathway for infiltration of precipitation (Figure 9).
Study of the pore size, distribution morphological characteristics, connectivity and internal network structure of biocrusts is not only an effective way to reveal the ecological function of biocrusts through micro cognition of artificially compacted soil-biological interfaces [28], but also an important scientific issue for the study of biological degradation and protection of soil sites in arid and semi-arid areas. The weathering deterioration process of the Great Wall sites preserved in the open environment is the result of long-term coupling of multiple environmental and anthropogenic factors [41]. The plant-soil interface is a complex porous medium that exhibits a high degree of heterogeneity due to the presence of roots and other organic matter [42]. The heterogeneity of soil pore distribution in areas covered by biocrust is significant, with fine cracks of an important part of the pore space. The formation of the biocrusts changes the mechanical properties of the artificially rammed soil and the formation of the soil pore system, suggesting that the growth of the biocrusts and the process of soil contraction/expansion caused by water flow are the main mechanisms for the formation of the pore space in the artificially rammed soil of the Great Wall of Earth.
Through the vertical distribution of porosity, it was found that the moss crust had higher porosity (28.53%) above 10 mm in the surface layer of the soil column, and then rapidly decreased to about 14.41%, which was mainly because the moss rhizines was only within 10 mm in the surface layer, which significantly increased the macroporosity of the surface layer of the soil, and altered the soil permeability and air permeability. This “short and thick” root will gradually loosen the soil around the root so that the soil macroporosity near the root increased, the number of macroporosity decreased with the increase of depth, the relative increase of small pores, and the pore distribution being uniformed. This microscopic pore and fissure structure has a decisive effect on the macroscopic seepage and mechanical properties. The subsurface layer soil still retained the compactness of the rammed soil, which was opposite to the results of the study in the wind and water erosion area of the Loess Plateau [28], mainly due to the fact that the Great Wall of the earth was artificially rammed and had a very strong compactness; The lichen crust had a high porosity in the soil column of 10 mm (18.68%), and the porosity of the lower soil rapidly decreased to 9.7%, probably due to the fact that the lichen crusts were only distributed in the surface layer of the compacted soil about 10 mm depth, and fungal mycelium, extracellular polysaccharides, etc. and the formation of soil gels led to the increase in the porosity of the compacted soil; Due to the completion of the rammed soil and not subjected to external extrusion, the bare soil porosity is small (2.14%), and the distribution of pores is relatively uniform, the soil particles arranged as a dense stacked lamellar, the agglomerates dispersed into a smaller particle size and tightly arranged soil particles, and the degree of change in the microstructure is greater than that of the internal soil, and the porosity of the surface layer is slightly greater than that of the lower layer, which may be due to the increase in inter-particle distances caused by surface weathering, and the potential risk of shallow surface stripping at the macroscopic level [43]. Soil cross-sectional porosity can indirectly represent the changes in pore structure caused by plant root growth, root filling of pore space results in a decrease in porosity, and root growth produces external forces that loosen the soil and thus increase porosity [44]. The moss rhizines dominated the shallow compacted soil with loosening action, resulting in an increase in the cross-sectional porosity of the shallow soil. The overall porosity of the bare soil layer and the lower layer of the biocrusts is small because the Weiyuan Great Wall mainly used local loess when rammed, mixed with straw, glutinous rice, etc. to increase the bonding force. The loess has a large proportion of clay particles, and after manual sorting, hammering, and many times of tamping [37], the soil particles are nested with each other, tightly connected, and it is not easy to form a shelf structure between the soil bodies. This kind of dense soil structure is not conducive to precipitation infiltration of, but prone to the formation of surface runoff and causes development of wall cracks, gullies and slumps and other deterioration. Soil pore structure and internal pore distribution are complex and variable, and the use of pore network models to analyse soil pore structure and distribution is essential for describing water transport, solute transport and erosion resistance [45,46]. Fractal dimension, Euler number, tortuosity, sphericity, etc. can reflect the complexity of granular pores within the soil [47,48]. But in this study, the anisotropy and Euler number (interpreted as higher connectivity) of the surface layer of moss crusts are significantly lower than those of cyanobacterial-lichen, which is consistent with the findings of Sun et al. [28], but contrary to the study that “biocrusts reduce water permeability”. We speculate that this may be due to differences in the research subjects. Sun et al. [28] mainly focused on loess or sandy soil, which are generally loose. This study focuses on artificially compacted soil, where only the surface layer with biocrusts has a higher porosity, while the soil particles in the compacted soil layer (parent material layer) are very dense, hindering further infiltration of water. The connectivity porosity of moss crusts is significantly higher than that of cyanobacterial-lichen crusts, and the thickness of moss crusts is much greater than that of cyanobacterial-lichen crusts. Therefore, there are more pores inside the moss crusts to quickly accommodate water, while the thickness of cyanobacterial-lichen is smaller and closer to the parent material layer, reducing the rate of water infiltration. In this study, the distribution of pore spatial structure of bare soil was simple, and with the continuous succession of biocrusts, its profile soil pore reticulation tended to be more complex, with increasing mean tortuosity, pore connectivity, and degree of anisotropy in the profile, and the fractal dimension of soil pore in the biocrusts was higher than that in the bare soil, which indicated that the pore space structure was more complicated in the biocrusts. Moss crust soils had lower tortuosity than bare soil, but cyanobacterial-lichen crusts increased pore tortuosity, suggesting that mosses have better connectivity than cyanobacterial-lichen pore structures. If preferential flow is present, moss crusts can prolong the residence time of water in the soil and increase the risk of surface spalling. Moss crust rhizines also create precipitation pathways that allow water flow to act on the soil internal pores along root fissures, expanding the number of macroporous pore throats and further enhancing the connectivity between the soil internal macropores. The decaying root system increases the organic matter content within the soil, and the salinisation of the ramified soil surface (especially the Na+ content) promotes the development of macropores, the number of inter-porous connecting channels increases significantly, the connectivity between pore throats increases, and the pore network tends to be more complex [28].

4.3. Biocrusts Alters the Erosion Resistance of the Compacted Soil

The Great Wall sites are all preserved in the open air, and during the weathering process caused by long-term natural factors such as precipitation, wind, sand, light, the quality of the earthen building materials is degraded, the mechanical properties are reduced, and diseases such as physical crusting, shedding, gullies, and slumping are formed, all posing a serious threat to the stability and long term preservation of the site property [1,4,24]. The formation and development of these diseases are related to the soil microstructure [49]. Under the condition of heavy rainfall, the top layer of rammed earth disintegrates rapidly, the smaller particle size silt and clay particles block the capillary pores, and the physical crusts are formed on the surface, resulting in the decrease of the infiltration capacity of the soil and the formation of obvious runoff on the surface. It has been found that the V-shaped or herringbone-shaped root system of the moss crust can increase the migration resistance of the soil body, improve the resistance of the soil layer to slippage, and effectively enhance the resistance of the soil layer to rainfall scouring [27]. In this study, it was also found in the field investigation that grooves left by rainfall scouring were prevalent on the surface of the physical crust compared to the biocrusts covered area, and that shrinkage and cracking formed on the surface of the bare soil during continuous drying, and further accelerated the deterioration of the site soils.
Biocrusts have a significant effect on water infiltration, which in turn drives ecosystem function and the hydrological cycle [50]. Mosses, algae, and microorganisms form a cover that reduces direct erosion from the surface of compacted soils, reduces runoff formation, and prevents soil erosion [51,52]. Usually, the biocrusts develops on the soil surface and destroys the original structure of the soil, in which the mycelium of fungi occupies the soil matrix pores and fissures, while organic matter such as extracellular polysaccharides secreted by algae clogs the pores, which in turn hinders the transport of water through the soil pores, and it has also been demonstrated that, with the succession of biocrusts, the content of organic matter, microorganisms and secondary metabolites increases in the soil, which in turn increases the biological abundance of soil in the crust layer, impeding precipitation infiltration [53]. Water infiltration in moss crust with large total porosity is significantly greater than other soil types, which have a high capacity to store precipitation and contain water, the biocrusts become active after wet-ting, the organisms can swell and also can uptake water (by capiliary on rhizoid for moss for instance), while compacted soils with small total porosity are not favorable to precipitation infiltration, which in turn enhances surface runoff and leads to increased soil erosion. The amount of water held in the field not only represents the effective water available in the farmland, but also is the main index to characterise the water retention performance of the soil. In the case of loess and sands, biocrusts significantly reduced precipitation infiltration [28], which is contrary to the results of the present study, because the soil selected in this study was artificially compacted, and the precipitation infiltration of the compacted soil was very small, whereas the growth of biocrusts was able to loosen the soil texture and increase the infiltration. However, unlike ordinary soil, compacted rammed soil has a very small number of pores, and in contrast, the development of biocrusts is more likely to lead to pore loosening, which reveals the microstructural aspects of the mechanism by which biocrusts promote water infiltration in rammed soil.
With the downward growth of moss rhizines and the burial of some stems and leaves by soil, the mechanical action of the roots and stems led to changes in soil particle displacement, which in turn drove changes in air and nutrients in the soil pore spaces and altered the macroscopic mechanical and hydraulic properties of the soil. In this study, it was found that the relative infiltration capacity of the biocrusts soil layer was high, but the infiltration capacity rapidly diminished as water entered the subsoil interface of the artificially compacted soil. The initial infiltration rate, stable infiltration rate, and average infiltration rate of the moss crust soil were significantly greater than those of the rest two types (p < 0.05). The microstructure indicates that compared to the rammed earth layer (parent material layer), the porosity around moss artificial roots is higher, and the soil particle arrangement is loose. It is easier to form precipitation pathways within the range of 5–8 mm depth of moss crusts roots, storing more water in the pores and increasing water infiltration. The soil macroporosity in the moss crust was closely related to the growth of its rhizines, and the soil structure was loose with a high stable infiltration rate. With the growth of moss rhizines, the friction between roots and soil particles gradually increased, and the gap between particles decreased, leading to a decrease in soil porosity, while the soil water-holding capacity was slightly increased, which slowed down the decrease in water content and increased soil infiltration. Therefore, the infiltration capacity of moss crust-covered soil in the surface layer of rammed soil is significantly better than that of algae-lichen crust and bare soil, and it is more suitable for improving the erosion resistance of soil on the surface of the Great Wall and preventing soil erosion.
Soil physicochemical properties are important parameters in determining the rate of water infiltration, and soil mechanical composition, bulk density, organic matter content, saturated water content and total porosity all play an important role in water infiltration [54]. In this study, soil physical and chemical properties are one of the main factors affecting soil porosity and water infiltration. Structural equation modelling and analysis of the main influencing factors revealed that CT porosity and clay content significantly contributed to the initial infiltration rate of the soil (p < 0.001), while organic matter content (most likely also contains EPS and other gels) may uptake water and also swell, and not conducive to the initial infiltration rate of the soil, and bulk density was detrimental to the development of CT porosity. Soil bulk density can indirectly hinder precipitation infiltration by affecting porosity. It has been found that organic matter content effectively promotes the formation of soil aggregates, which in turn improves soil pore structure, reduces soil bulk density, and has less resistance to water flow within the soil body, increasing soil infiltration capacity [50]. Plant roots also have a significant effect on soil water transport [55], moss rhizines can loosen and compact the soil, leading to a reduction in soil bulk density and an increase in pore space, while moss rhizines or stems and leaves buried in the compacted soil layer decay, converting them into organic matter, which promotes the formation of soil aggregates, improves the structure of the soil and its physicochemical properties, and increases the infiltration capacity of the soil.
Small rainfall events occur frequently in Weiyuan area, and when the intensity of a single small rainfall is greater than the infiltration rate of the soil surface, it will form excessive seepage runoff on the slope of the Great Wall. When a single rainfall lasts for a long time, the surface moisture content of the biocrusts tends to be saturated, and the infiltration rate of the surface soil gradually decreases to that of the lower soil. Long duration and low rainfall intensity are conducive to the accumulation of water in the biocrusts layer, slow evaporation and loss of water, and increased weight of compacted soil, especially at the slope of the wall. However, whether the generated gravity is sufficient to cause patchy peeling on the surface of the wall remains to be further confirmed by introducing mechanical methods. The higher water holding capacity of biocrusts is beneficial for the growth of vascular plants in the later stage [56], causing the shallow surface of compacted soil to become more loose, providing favorable conditions for plant growth, especially at the junction of compacted soil, which is more susceptible to erosion by rainwater and shallow root vascular plants, further increasing the risk of biological weathering. Therefore, the biological weathering caused by the growth of biocrusts on the surface of cultural relics cannot be ignored [57].
From this, it can be seen that biocrust increases the porosity of rammed earth and leads to a more complex pore structure, promoting soil moisture infiltration. With the development of biocrust, the changes in pore structure and physicochemical properties of rammed earth become more pronounced. From the perspective of biological degradation, the rhizoid of moss or fungal hyphae of lichens may penetrate the surface layer of rammed earth, forming biological channels, increasing local porosity, and potentially damaging the integrity of the rammed earth layer (parent material layer) in the long run. From the perspective of ecological function, biocrusts can stabilize soil through the binding of extracellular polysaccharides and root entanglement, and can also inhibit the development of surface diseases on soil sites by increasing rainfall infiltration and reducing runoff. However, the definition of biocrust protection and destruction still needs to be further validated through mechanics, simulation experiments, and other methods.

5. Conclusions

Compared to bare soil, biocrusts improved the porosity of the Great Wall rammed soil, increased precipitation infiltration rate of the rammed soil, trapped more water in the shallow surface layer of the site wall, and formed a microhabitat conducive to the growth of vascular plants. biocrusts significantly increased surface area density, mean pore volume, node density, length density and network density, and cyanobacterial-lichen crusts had a greater effect on the internal structure of the pores; Cyanobacterial-lichen crusts increased the degree of anisotropy of porosity, mean tortuosity, resulting in pores with stronger irregularity, and moss crusts decreased the degree of anisotropy of porosity and the mean tortuosity. Compared with bare soil, mean shape factor of cyanobacterial-lichen crust and moss crust decreased by 67.54% and 74.19%, flatness by 126.67% and 120.00%, and elongation by 103.23% and 96.77%, respectively. Biocrusts development also decreased soil pore sphericity and compactness, and increased pore gap; Biocrusts increased the number of connected pores, isolated pores and the number of channels, but decreased the average pore throat area and the average channel length; Biocrusts significantly increased the initial infiltration rate, the stable infiltration rate, the average infiltration rate, and the total infiltration rate, and changed the process of water infiltration in the surface compacted soil of the soil site; CT porosity and clay content accelerated the initial infiltration rate of the soil, the soil type, and the organic matter content slowed down the initial infiltration rate of the soil. This study provides new insights into the bio-degradation and conservation of open-air earthen sites in arid and semi-arid regions of China. Based on the above conclusion, the study suggests that biocrusts play an important role in regulating the soil pore structure of rammed earth sites in natural-artificial composite ecosystems, which in turn influences the role of biocrusts in precipitation infiltration and drives the erosion resistance of earth sites. Improved understanding of the physical, biological and chemical processes of biocrusts in earth sites can help to grasp their important role in the biological degradation of artefacts. Future research should aim to the balance between conservation and destruction of biocrusts in cultural heritage in arid and semi-arid region in order to more accurately predict the ecological function of biocrusts on artefact surfaces under global climate change.

Author Contributions

Writing-original draft, X.Y.; formal analysis, F.W.; investigation L.L.; software, R.S.; software, D.L.; investigation, L.X.; data curation, J.C.; writing-review & editing, X.Z. All authors have read and agreed to the published version of the manuscript.

Funding

This study was supported by the National Natural Science Foundation of China (32260292), The Science and Technology Plan of Gansu Province, China (24 ZDFF001), Key Laboratory of Urban and Architectural Heritage Conservation, Ministry of Education, Southeast University (KLUAHC2404).

Institutional Review Board Statement

Not applicable.

Informed Consent Statement

Not applicable.

Data Availability Statement

The datasets used and analyzed during the current study are available from Xiaoju Yang (yangxiaoju@dha.ac.cn) on reasonable request.

Acknowledgments

We sincerely thank the staff who provided assistance during the on-site investigation. Thank you to student Zheng Xiaotong for providing assistance during the sample collection period.

Conflicts of Interest

The authors declare no conflict of interest. Author Long Li was employed by Cultural Heritage Conservation and Design Consulting Co., Ltd. of Mogao Grottoes. The remaining authors declare that the research was conducted in the absence of any commercial or financial relationships that could be construed as a potential conflict of interest.

References

  1. Li, Z.; Wang, X.; Sun, M.; Chen, W.; Guo, Q.; Zhang, H. Conservation of Jiaohe ancient earthen site in China. J. Rock Mech. Geotech. Eng. 2011, 3, 270–281. [Google Scholar] [CrossRef]
  2. Holtorf, C. Can less be more? Heritage in the age of terrorism. Public Archaeol. 2006, 5, 101–109. [Google Scholar] [CrossRef]
  3. Cao, Y.; Bowker, M.A.; Delgado-Baquerizo, M.; Xiao, B. Biocrusts protect the Great Wall of China from erosion. Sci. Adv. 2023, 9, eadk5892. [Google Scholar] [CrossRef]
  4. Chen, H.; Chen, W.; Li, X.; Jia, B.; Zhang, S. The effect of SH-lime composite material on capillary water rise resistance in the Great Wall. J. Build. Eng. 2024, 85, 108512. [Google Scholar] [CrossRef]
  5. Richards, J.; Guo, Q.; Viles, H.; Wang, Y.; Zhang, B.; Zhang, H. Moisture content and material density affects severity of frost damage in earthen heritage. Sci. Total Environ. 2022, 819, 153047. [Google Scholar] [CrossRef]
  6. Guo, Z.; Wu, C.; Zhang, S.; Chen, W.; Qi, Q.; Wu, H. Characterization on Flaking of Rammed Earthen Sites Using SMO Algorithm and Surface Topography Analysis: A Case Study of Jiaohe Ruins. ACM J. Comput. Cult. Herit. 2024, 17, 1–20. [Google Scholar] [CrossRef]
  7. Quagliarini, E.; Lenci, S.; Iorio, M. Mechanical properties of adobe walls in a Roman Republican domus at Suasa. J. Cult. Herit. 2010, 11, 130–137. [Google Scholar] [CrossRef]
  8. Shao, M.; Li, L.; Wang, S.; Wang, E.; Li, Z. Deterioration mechanisms of building materials of Jiaohe ruins in China. J. Cult. Herit. 2013, 14, 38–44. [Google Scholar] [CrossRef]
  9. Du, Y.; Chen, W.; Cui, K.; Gong, S.; Pu, T.; Fu, X. A model characterizing deterioration at earthen sites of the Ming Great Wall in Qinghai Province, China. Soil Mech. Found. Eng. 2017, 53, 426–434. [Google Scholar] [CrossRef]
  10. Parracha, J.L.; Silva, A.S.; Cotrim, M.; Faria, P. Mineralogical and microstructural characterisation of rammed earth and earthen mortars from 12 th century Paderne Castle. J. Cult. Herit. 2020, 42, 226–239. [Google Scholar] [CrossRef]
  11. Li, J.; He, Y.; He, C.; Xiao, L.; Wang, N.; Jiang, L.; Chen, J.; Liu, K.; Chen, Q.; Gu, Y. Diversity and composition of microbial communities in Jinsha earthen site under different degree of deterioration. Environ. Res. 2024, 242, 117675. [Google Scholar] [CrossRef]
  12. Hueck, H. The biodeterioration of materials as part of hylobiology. Mater. Und Org. 1965, 1, 5–34. [Google Scholar]
  13. Lim, A.B.; Matero, F.G.; Henry, M.C. Greening deterioration: Soft capping as preventive conservation for masonry ruin sites. APT Bull. J. Preserv. Technol. 2013, 44, 53–61. [Google Scholar]
  14. Hosseini, Z.; Caneva, G. Evaluating hazard conditions of plant colonization in Pasargadae World Heritage Site (Iran) as a tool of biodeterioration assessment. Int. Biodeterior. Biodegrad. 2021, 160, 105216. [Google Scholar] [CrossRef]
  15. Lee, Z.; Viles, H.A.; Wood, C.H. Soft Capping Historic Walls: A Better Way of Conserving Ruins? English Heritage: London, UK, 2009. [Google Scholar]
  16. Liu, X.; Koestler, R.J.; Warscheid, T.; Katayama, Y.; Gu, J.-D. Microbial deterioration and sustainable conservation of stone monuments and buildings. Nat. Sustain. 2020, 3, 991–1004. [Google Scholar] [CrossRef]
  17. Bettina Weber, B.; Belnap, J.; Büdel, B. What is a biocrust? A refined, contemporary definition for a broadening research community. Biol. Rev. 2022, 97, 1768–1785. [Google Scholar] [CrossRef]
  18. Eldridge, D.J.; Reed, S.; Travers, S.K.; Bowker, M.A.; Maestre, F.T.; Ding, J.; Havrilla, C.; Rodriguez-Caballero, E.; Barger, N.; Weber, B. The pervasive and multifaceted influence of biocrusts on water in the world’s drylands. Glob. Change Biol. 2020, 26, 6003–6014. [Google Scholar] [CrossRef]
  19. Li, X.; Hui, R.; Tan, H.; Zhao, Y.; Liu, R.; Song, N. Biocrust research in China: Recent progress and application in land degradation control. Front. Plant Sci. 2021, 12, 751521. [Google Scholar] [CrossRef]
  20. Zhang, J.; Wu, B.; Li, Y.; Yang, W.; Lei, Y.; Han, H.; He, J. Biological soil crust distribution in Artemisia ordosica communities along a grazing pressure gradient in Mu Us Sandy Land, Northern China. J. Arid Land 2013, 5, 172–179. [Google Scholar] [CrossRef]
  21. Gao, L.; Bowker, M.A.; Xu, M.; Sun, H.; Tuo, D.; Zhao, Y. Biological soil crusts decrease erodibility by modifying inherent soil properties on the Loess Plateau, China. Soil Biol. Biochem. 2017, 105, 49–58. [Google Scholar] [CrossRef]
  22. Xiao, B.; Hu, K. Moss-dominated biocrusts decrease soil moisture and result in the degradation of artificially planted shrubs under semiarid climate. Geoderma 2017, 291, 47–54. [Google Scholar] [CrossRef]
  23. Liu, L.; Liu, Y.; Hui, R.; Xie, M. Recovery of microbial community structure of biological soil crusts in successional stages of Shapotou desert revegetation, northwest China. Soil Biol. Biochem. 2017, 107, 125–128. [Google Scholar] [CrossRef]
  24. Richards, J.; Mayaud, J.; Zhan, H.; Wu, F.; Bailey, R.; Viles, H. Modelling the risk of deterioration at earthen heritage sites in drylands. Earth Surf. Process. Landf. 2020, 45, 2401–2416. [Google Scholar] [CrossRef]
  25. Wu, F.; Ding, X.; Zhang, Y.; Gu, J.-D.; Liu, X.; Guo, Q.; Li, J.; Feng, H. Metagenomic and metaproteomic insights into the microbiome and the key geobiochemical potentials on the sandstone of rock-hewn Beishiku Temple in Northwest China. Sci. Total Environ. 2023, 893, 164616. [Google Scholar] [CrossRef] [PubMed]
  26. Liu, Y.; Ren, J.; Wang, W.; Shi, Y.; Gao, Y.; Zhan, H.; Luo, Y.; Jia, R. Vascular plants and biocrusts ameliorate soil properties serving to increase the stability of the Great Wall of China. Sci. Total Environ. 2024, 951, 175506. [Google Scholar] [CrossRef]
  27. Wang, T.; Guo, Q.; Pei, Q.; Chen, W.; Wang, Y.; Zhang, B.; Yu, J. Destruction or protection? Experimental studies on the mechanism of biological soil crusts on the surfaces of earthen sites. Catena 2023, 227, 107096. [Google Scholar] [CrossRef]
  28. Sun, F.; Xiao, B.; Li, S.; Yu, X.; Kidron, G.J.; Heitman, J. Direct evidence and mechanism for biocrusts-induced improvements in pore structure of dryland soil and the hydrological implications. J. Hydrol. 2023, 623, 129846. [Google Scholar] [CrossRef]
  29. Grose, M.J.; Gilligan, C.A.; Spencer, D.; Goddard, B. Spatial heterogeneity of soil water around single roots: Use of CT-scanning to predict fungal growth in the rhizosphere. New Phytol. 1996, 133, 261–272. [Google Scholar] [CrossRef] [PubMed]
  30. Anderson, S.; Peyton, R.; Gantzer, C. Evaluation of constructed and natural soil macropores using X-ray computed tomography. Geoderma 1990, 46, 13–29. [Google Scholar] [CrossRef]
  31. Lipiec, J.; Hatano, R. Quantification of compaction effects on soil physical properties and crop growth. Geoderma 2003, 116, 107–136. [Google Scholar] [CrossRef]
  32. Perret, J.; Prasher, S.; Kantzas, A.; Langford, C. Three-dimensional quantification of macropore networks in undisturbed soil cores. Soil Sci. Soc. Am. J. 1999, 63, 1530–1543. [Google Scholar] [CrossRef]
  33. Zhou, H.; Fang, H.; Mooney, S.J.; Peng, X. Effects of long-term inorganic and organic fertilizations on the soil micro and macro structures of rice paddies. Geoderma 2016, 266, 66–74. [Google Scholar] [CrossRef]
  34. Carter, M.R.; Gregorich, E.G. Soil Sampling and Methods of Analysis; CRC Press: Boca Raton, FL, USA, 2007. [Google Scholar]
  35. Xiao, B.; Bowker, M.A. Moss-biocrusts strongly decrease soil surface albedo, altering land-surface energy balance in a dryland ecosystem. Sci. Total Environ. 2020, 741, 140425. [Google Scholar] [CrossRef]
  36. Jester, W.; Klik, A. Soil surface roughness measurement—Methods, applicability, and surface representation. Catena 2005, 64, 174–192. [Google Scholar] [CrossRef]
  37. Zhao, H.; Li, Z.; Han, W.; Sun, M.; Wang, X. Research on the major diseases and protection of the Great Wall Site in Gansu Province. Cult. Relics Prot. Archaeol. Sci. 2007, 19, 28–32. (In Chinese) [Google Scholar] [CrossRef]
  38. Komaei, A.; Soroush, A.; Fattahi, S.M.; Ghanbari, H. Influence of environmental stresses on the durability of slag-based alkali-activated cement crusts for wind erosion control. Sci. Total Environ. 2023, 902, 166576. [Google Scholar] [CrossRef] [PubMed]
  39. Miralles, I.; Domingo, F.; Cantón, Y.; Trasar-Cepeda, C.; Leirós, M.C.; Gil-Sotres, F. Hydrolase enzyme activities in a successional gradient of biological soil crusts in arid and semi-arid zones. Soil Biol. Biochem. 2012, 53, 124–132. [Google Scholar] [CrossRef]
  40. Aldughaishi, U.; Grattan, S.R.; Nicolas, F.; Peddinti, S.R.; Bonfil, C.; Ogunmokun, F.; Abou Najm, M.; Nocco, M.; Kisekka, I. Assessing the impact of recycled water reuse on infiltration and soil structure. Geoderma 2024, 452, 117103. [Google Scholar] [CrossRef]
  41. Pan, J.; Xu, N.; Tang, Y.; Cheng, M.; Zhang, L.; Wang, B.; Lan, J. Quantitative evaluation of plants on top surface of the Great Wall in Dazhuangke using the analytical hierarchy process. Herit. Sci. 2023, 11, 191. [Google Scholar] [CrossRef]
  42. Gregory, P.J. RUSSELL REVIEW Are plant roots only “in” soil or are they “of” it? Roots, soil formation and function. Eur. J. Soil Sci. 2022, 73, e13219. [Google Scholar] [CrossRef]
  43. Wang, X.; Zhang, B.; Guo, Q.; Pei, Q. Discussion on the environmental adaptability of weather-resistant measures for earthen sites in China. Built Herit. 2022, 6, 19. [Google Scholar] [CrossRef]
  44. Dhaliwal, J.K.; Kumar, S. 3 D-visualization and quantification of soil porous structure using X-ray micro-tomography scanning under native pasture and crop-livestock systems. Soil Tillage Res. 2022, 218, 105305. [Google Scholar] [CrossRef]
  45. Dorau, K.; Uteau, D.; Hövels, M.P.; Peth, S.; Mansfeldt, T. Soil aeration and redox potential as function of pore connectivity unravelled by X-ray microtomography imaging. Eur. J. Soil Sci. 2022, 73, e13165. [Google Scholar] [CrossRef]
  46. Wildenschild, D.; Vaz, C.; Rivers, M.; Rikard, D.; Christensen, B. Using X-ray computed tomography in hydrology: Systems, resolutions, and limitations. J. Hydrol. 2002, 267, 285–297. [Google Scholar] [CrossRef]
  47. Dal Ferro, N.; Charrier, P.; Morari, F. Dual-scale micro-CT assessment of soil structure in a long-term fertilization experiment. Geoderma 2013, 204, 84–93. [Google Scholar] [CrossRef]
  48. Katuwal, S.; Norgaard, T.; Moldrup, P.; Lamandé, M.; Wildenschild, D.; de Jonge, L.W. Linking air and water transport in intact soils to macropore characteristics inferred from X-ray computed tomography. Geoderma 2015, 237, 9–20. [Google Scholar] [CrossRef]
  49. Du, Y.; Dong, W.; Cui, K.; Chen, W.; Yang, W. Research progress on the development mechanism and exploratory protection of the scaling off on earthen sites in NW China. Sci. China Technol. Sci. 2023, 66, 2183–2196. [Google Scholar] [CrossRef]
  50. Chen, W.; Chen, H.; Jia, B.; Bi, J.; Li, X. Study of salt migration on the upper part of the Great Wall under the rainfall-radiation cycle. Bull. Eng. Geol. Environ. 2022, 81, 419. [Google Scholar] [CrossRef]
  51. Belnap, J. The potential roles of biological soil crusts in dryland hydrologic cycles. Hydrol. Process. Int. J. 2006, 20, 3159–3178. [Google Scholar] [CrossRef]
  52. Li, S.; Bowker, M.A.; Xiao, B. Biocrust impacts on dryland soil water balance: A path toward the whole picture. Glob. Change Biol. 2022, 28, 6462–6481. [Google Scholar] [CrossRef]
  53. Pande, S.; Kost, C. Bacterial unculturability and the formation of intercellular metabolic networks. Trends Microbiol. 2017, 25, 349–361. [Google Scholar] [CrossRef] [PubMed]
  54. Shao, Q.; Baumgartl, T. Field evaluation of three modified infiltration models for the simulation of rainfall sequences. Soil Sci. 2016, 181, 45–56. [Google Scholar] [CrossRef]
  55. Bodner, G.; Leitner, D.; Kaul, H.-P. Soil, Coarse and fine root plants affect pore size distributions differently. Plant 2014, 380, 133–151. [Google Scholar] [CrossRef]
  56. Tripathi, I.M.; Mahto, S.S.; Kushwaha, A.P.; Kumar, R.; Tiwari, A.D.; Sahu, B.K.; Jain, V.; Mohapatra, P.K. Dominance of soil moisture over aridity in explaining vegetation greenness across global drylands. Sci. Total Environ. 2024, 917, 170482. [Google Scholar] [CrossRef]
  57. Liu, Y.; Wang, W.; Ren, J.; Gao, Y.; Wu, F.; Shi, Y.; Zhan, H.; Chi, C.; Jia, R. Microtopography-induced hydrological heterogeneity promotes the co-assembly of vascular plant and biocrust communities, providing synergistic protective functions for the Great Wall. Sci. Total Environ. 2025, 963, 178513. [Google Scholar] [CrossRef] [PubMed]
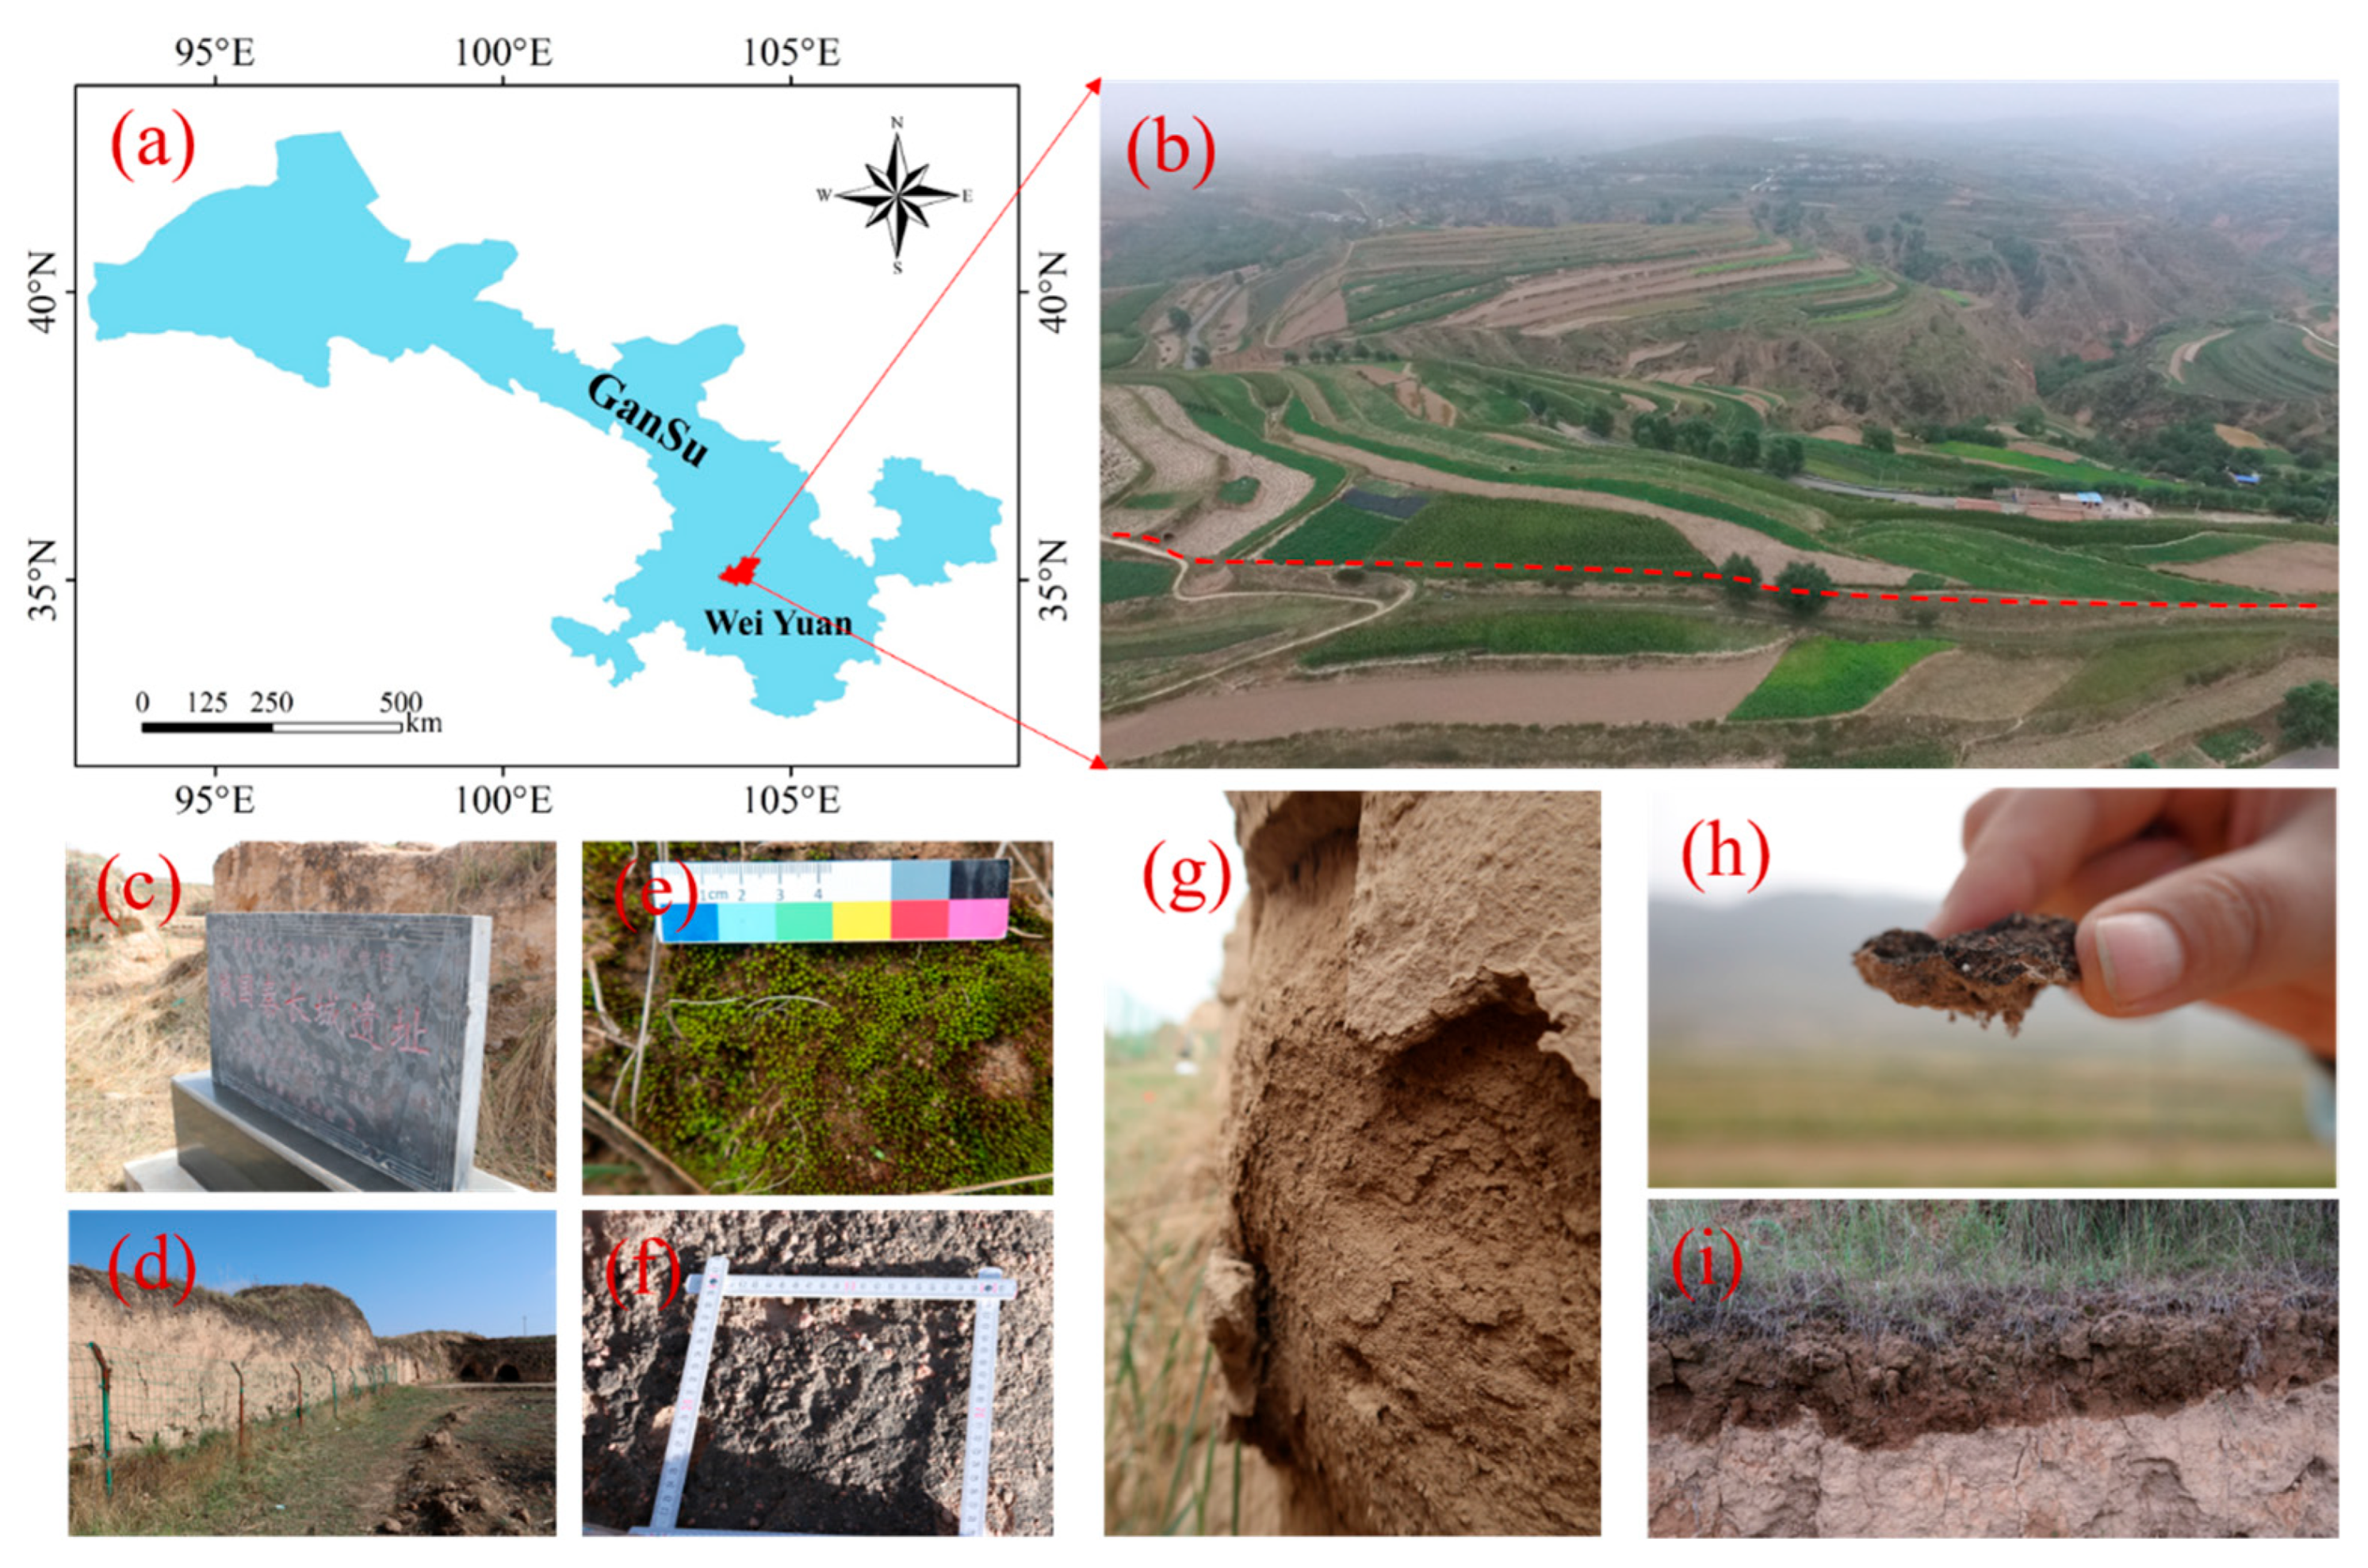
Figure 1. Geographical location of study areas. Location map of Weiyuan County (a), the Majiashan section of the Warring States Qin Great Wall (b), Great Wall site stele (c), distribution of biocrusts on the Great Wall (d), moss crusts (e), cyanobacterial-lichen mixed crust (f), surface weathering defects on the Great Wall (g), biocrusts characteristics (h) and distribution of moisture on the Great Wall after rainfall (i).
Coatings 15 00908 g001
Figure 2. Digital microscope and scanning electron microscope images of different types of biocrusts. Digital microscope: moss crust ×50 (a), cyanobacterial-lichen crust ×50 (b); Scanning electron microscopy: moss crust ×50 stem and leaf (c), moss crust ×400 (d), cyanobacterial-lichen crust ×80 fiber (e) and bare soil ×1000 (f).
Coatings 15 00908 g002
Figure 3. Porosity of bare soil, cyanobacterial-lichen crusts and moss crusts. Total porosity of the entire soil column (a), porosity of the biocrusts layer and subsurface layers of the biocrusts (b). Different lowercase letters (a and b) indicate significant differences in the porosity of different soil types in the same soil column (p < 0.05). Different uppercase letters (A and B) indicate significant differences in porosity between the biocrusts layer and subsurface layers of the same type of soil (p < 0.05).
Coatings 15 00908 g003
Figure 4. 2 D and 3 D spatial network pore structures of biocrusts and bare soil. Bare soil (a), cyanobacterial-lichen crust (b) and moss crust (c). Different colors represent the size of pore volume, and the closer it is to red, the larger the pore volume.
Coatings 15 00908 g004aCoatings 15 00908 g004b
Figure 5. 3 D visualization of bare soil (AF), cyanobacterial-lichen crust (GI), and moss crust (MR), including three-dimensional model (A,G,M), total pores (B,H,N), connected pores-macropores (C,I,O), skeleton models (D,J,P), node skeleton models (E,K,Q), and ball stick models (F,L,R).
Coatings 15 00908 g005
Figure 6. Water infiltration characteristics. Cumulative infiltration (a), infiltration rate (b), initial infiltration rate (c), stable infiltration rate (d), average infiltration rate (e) and total infiltration (f) of biocrusts and bare soil.
Coatings 15 00908 g006
Figure 7. Pearson correlation coefficients matrix of bulk density (BD), clay (Clay), organic matter content (OMC), field capacity (FC), saturated hydraulic conductivity (SHC), saturated water content (SWC), pH, surface roughness (SR), CT porosity (CTP), surface area density (SAD), length density (LD), network density (ND), mean pore volume (MPV), node density (N-D), degree of anisotropy (DA), Euler number (EN), fractal dimension (FD), mean tortuosity (MT), number of node pores (NOP), average coordination number (CAN), number of channels (NC), average throat area (ATA), average channel length (ACL), connected porosity (CP), isolated porosity (IP), flatness (Flatness), elongation (Elongation), gap (Gap), compactness (Compactness), mean shape factor (MSF), sphericity (Sphericity), initial infiltration rate (IIR), stabilised infiltration rate (SIR). Correlation coefficients are listed in the lower left corner of the matrix and significance is listed in the upper right corner, with red indicating positive correlation and blue indicating negative correlation. *, **, *** represent p ≤ 0.05, p≤ 0.01, p ≤ 0.001 respectively.
Coatings 15 00908 g007
Figure 8. Path analyses (a) and effect plots (b) of changes in initial soil infiltration rates and their main influencing factors.
Coatings 15 00908 g008
Figure 9. Schematic diagram of soil pore distribution and precipitation pathways formed by moss rhizines and vascular plant roots.
Coatings 15 00908 g009
Table 1. Characteristics of bare soil and biocrusts.
Measurement IndicatorsBare SoilCyanobacterial-LichenMoss CrustsF
Crust thickness(mm)-7.99 ± 0.30 b14.47 ± 0.65 a412.52
Total biomass (g·cm−2)-0.08 ± 0.02 b0.11 ± 0.02 a8.377
Chlorophyll a content (μg·g−1)-0.15 ± 0.04 b2.29 ± 0.21 a412.51
pH8.48 ± 0.08 a8.10 ± 0.03 b7.74 ± 0.01 c255.7
Conductivity97.2 ± 0.27 b90.68 ± 0.68 c131.92 ± 5.19 a269.89
Bulk density (g·cm−3)1.75 ± 0.01 a1.54 ± 0.01 b1.34 ± 0.01 c1081.73
Total porosity (%)33.89% ± 0.56 c41.89% ± 0.60 b49.58% ± 0.43 a1081.73
Percentage of clay (<2 μm, %)3.71 ± 0.04 c3.76 ± 0.09 b4.29 ± 0.03 a141.57
Percentage of silt (2–20 μm, %)27.73 ± 0.17 b26.95 ± 0.27 c30.66 ± 0.06 a558.03
Percentage of sand (20–2000 μm, %)68.56 ± 0.21 b69.29 ± 0.33 a65.05 ± 0.01 c506.89
Organic matter content (g·kg−1)6.45 ± 0.26 c26.01 ± 3.43 b39.97 ± 6.52 a78.30
Surface roughness2.01 ± 0.03 c9.54 ± 0.14 a6.08 ± 0.10 b7005.53
Field capacity (cm3·cm−3)0.02 ± 0.02 c0.19 ± 0.07 b0.28 ± 0.05 a8.377
Saturated water content (cm3 cm−3)0.11 ± 0.07 c0.21 ± 0.08 b0.42 ± 0.11 a15.59
Saturated hydraulic conductivity (cm·min−1)0.03 ± 0.02 c0.08 ± 0.03 b0.29 ± 0.10 a15.59
Note: The data is expressed as mean ± standard deviation. Different letters presented indicate significant differences among soil treatments at the 0.001 probability level. F is the ratio of between-group variance to within-group variance, reflecting the magnitude of between-group differences relative to within-group differences.
Table 2. Pore characteristics of three types of crust.
Soil DepthCrust TypesSurface Area Density
(mm2 mm−3)
Length Density (mm mm−3)Network Density (Number mm−3)Mean Pore Volume (×10−2) (mm3)Node Density (Number mm−3)
Entire Soil ColumnBare Soil9.06 ± 2.03 c0.31 ± 0.11 c13.92 ± 2.14 c0.03 ± 0.01 c13.14 ± 2.65 c
Cyanobacterial-LichenCyanobacterial-lichen Crust59.27 ± 19.03 a37.95 ± 15.84 a1463.06 ± 211.23 a0.07 ± 0.04 b3990.57 ± 538.35 a
Moss Crust45.64 ± 0.35 b25.42 ± 0.12 b622.10 ± 49.12 b0.11 ± 0.03 a1039.79 ± 25.14 b
Biocrust LayerCyanobacterial-Lichen Crust51.64 ± 8.59 a39.04 ± 10.17 a741.88 ± 90.04 a0.06 ± 0.04 b2938.97 ± 139.21 a
Moss Crust43.23 ± 2.9 b18.27 ± 5.0 b329.24 ± 40.09 b0.13 ± 0.08 a1363.56 ± 60.12 b
Subsurface LayerCyanobacterial-Lichen Crust72.54 ± 20.25 a143.41 ± 21.52 a4086.82 ± 991.99 a0.02 ± 0.01 a4563.61 ± 553.51 a
Moss Crust42.79 ± 1.91 b61.66 ± 0.51 b916.17 ± 70.4 b0.02 ± 0.01 a2018.51 ± 74.75 b
The different letters presented at the same soil depth indicate significant differences between different types of crust at the 0.05 level.
Table 3. Pore morphology parameters of the three types of crust.
Soil DepthCrust TypesDegree of AnisotropyFractal DimensionEuler Number (×105)Mean Tortuosity
Entire Soil ColumnBare Soil0.22 ± 0.04 a2.30 ± 0.03 a−0.12 ± 0.01 c1.14 ± 0.26 a
Cyanobacterial-Lichen Crust0.26 ± 0.07 a2.73 ± 0.22 a36.64 ± 7.59 a1.15 ± 0.07 a
Moss Crust0.16 ± 0.03 a2.67 ± 0.22 a0.24 ± 0.06 b1.11 ± 0.11 a
Biocrust LayerCyanobacterial-Lichen Crust0.34 ± 0.11 a2.67 ± 0.22 a36.64 ± 0.32 a1.14 ± 0.09 a
Moss Crust0.2 ± 0.03 a2.67 ± 0.27 a−5.99 ± 0.30 b1.12 ± 0.17 a
Subsurface LayerCyanobacterial-Lichen Crust0.35 ± 0.07 a2.74 ± 0.18 a9.84 ± 0.64 a1.16 ± 0.08 a
Moss Crust0.23 ± 0.06 a2.67 ± 0.22 a3.76 ± 0.36 b1.16 ± 0.08 a
The different letters presented at the same soil depth indicate significant differences between different types of crust at the 0.05 level.
Table 4. Pore shape parameters of three types of crust.
Soil DepthCrust TypesMean Shape FactorSphericityFlatnessElongation
Entire Soil ColumnBare Soil6.47 ± 0.49 a0.55 ± 0.15 a0.45 ± 0.19 a0.31 ± 0.1 a
Cyanobacterial-Lichen Crust2.1 ± 0.95 b0.54 ± 0.25 a−0.12 ± 0.06 b−0.01 ± 0.01 c
Moss Crust1.67 ± 0.17 c0.54 ± 0.22 a−0.09 ± 0.04 c0.01 ± 0.01 b
Biocrust LayerCyanobacterial-Lichen Crust1.45 ± 0.31 a0.54 ± 0.25 a−0.18 ± 0.07 a−0.07 ± 0.03 a
Moss Crust1.45 ± 0.04 a0.55 ± 0.05 a−0.18 ± 0.07 a−0.07 ± 0.02 a
Subsurface LayerCyanobacterial-Lichen Crust1.27 ± 0.38 a0.54 ± 0.25 a−0.13 ± 0.07 a−0.02 ± 0.01 a
Moss Crust1.09 ± 0.01 b0.54 ± 0.11 a−0.11 ± 0.02 a−0.003 ± 0.001 b
The different letters presented at the same soil depth indicate significant differences between different types of crust at the 0.05 level.
Table 5. Characteristics of three types of crust pore networks.
Soil DepthCrust TypesConnected Porosity (%) Isolated Porosity (%)Number of Node PoresAverage Coordination NumberNumber of ChannelsAverage Throat Area (mm2)Average Channel Length (mm)
Entire Soil ColumnBare Soil1.72 ± 0.22 c0.40 ± 0.14 c197 ± 23.07 c4.05 ± 0.32 b410 ± 20.22 c1 ± 0.46 a4.25 ± 1.96 a
Cyanobacterial-Lichen Crust2.29 ± 0.26 b10.62 ± 2.41 b3571 ± 606.09 b6.64 ± 1.29 a3570 ± 671.51 b0.01 ± 0.01 b1.33 ± 0.57 b
Moss Crust4.73 ± 0.31 a16.74 ± 0.28 a7305 ± 96 a1.55 ± 0.26 c7232.33 ± 32.50 a0.01 ± 0.01 b1.01 ± 0.02 c
Biocrust LayerCyanobacterial-Lichen Crust0.67 ± 0.31 b18.10 ± 2.98 b1580.33 ± 426.39 a7.16 ± 1.56 a7232 ± 309.71 a0.01 ± 0.01 a1.14 ± 0.21 a
Moss Crust27.39 ± 0.2 a1.14 ± 0.12 a1580 ± 19.52 a7.15 ± 0.1 a7235 ± 32.79 a0.01 ± 0.01 a1.04 ± 0.12 a
Subsurface LayerCyanobacterial-Lichen Crust0.62 ± 0.18 b9.06 ± 1.03 b1232.33 ± 109.50 a4.45 ± 0.24 a3346 ± 267.25 b0.11 ± 0.06 a1.34 ± 0.34 a
Moss Crust2.5 ± 0.4 a12.21 ± 11.91 a2987 ± 116.89 b3.4 ± 0.26 b5077 ± 51.68 a0.01 ± 0.01 a1.31 ± 0.11 a
The different letters presented at the same soil depth indicate significant differences between different types of crust at the 0.05 level.
Disclaimer/Publisher’s Note: The statements, opinions and data contained in all publications are solely those of the individual author(s) and contributor(s) and not of MDPI and/or the editor(s). MDPI and/or the editor(s) disclaim responsibility for any injury to people or property resulting from any ideas, methods, instructions or products referred to in the content.