

Durability Analysis of Brick-Faced Clay-Core Walls in Traditional Residential Architecture in Quanzhou, China

 ,
, 


Abstract

1. Introduction
1.1. Background and Significance
1.2. Review of Durability Research
1.3. Research Objective
2. Materials and Methods
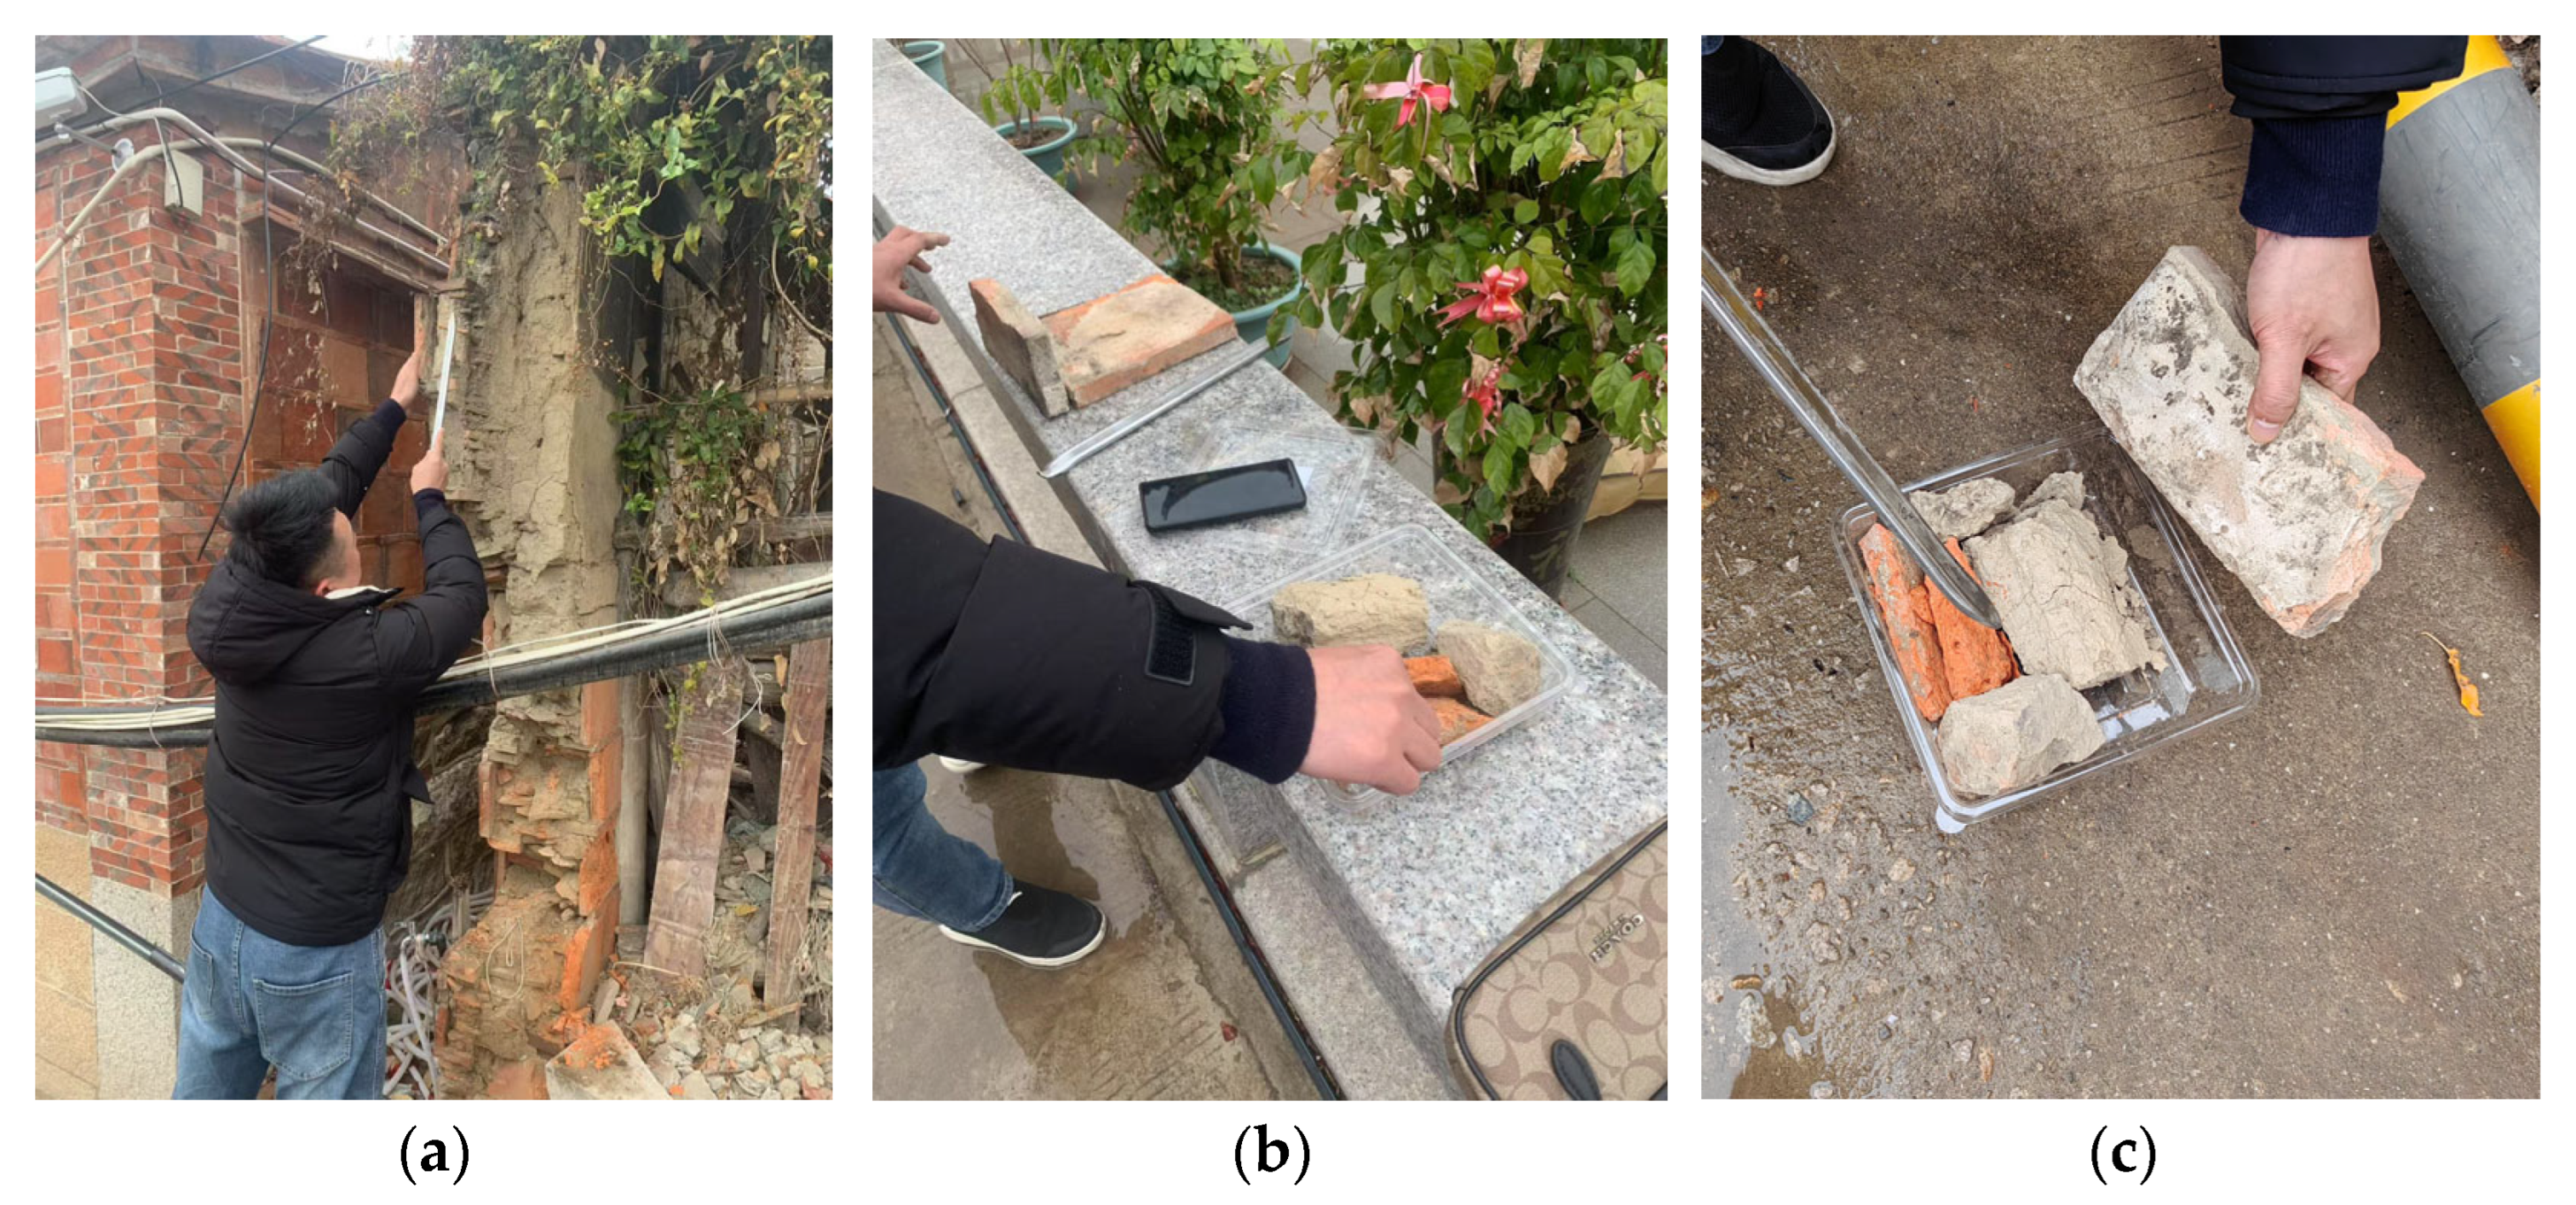
2.1. BCW Construction and Sampling
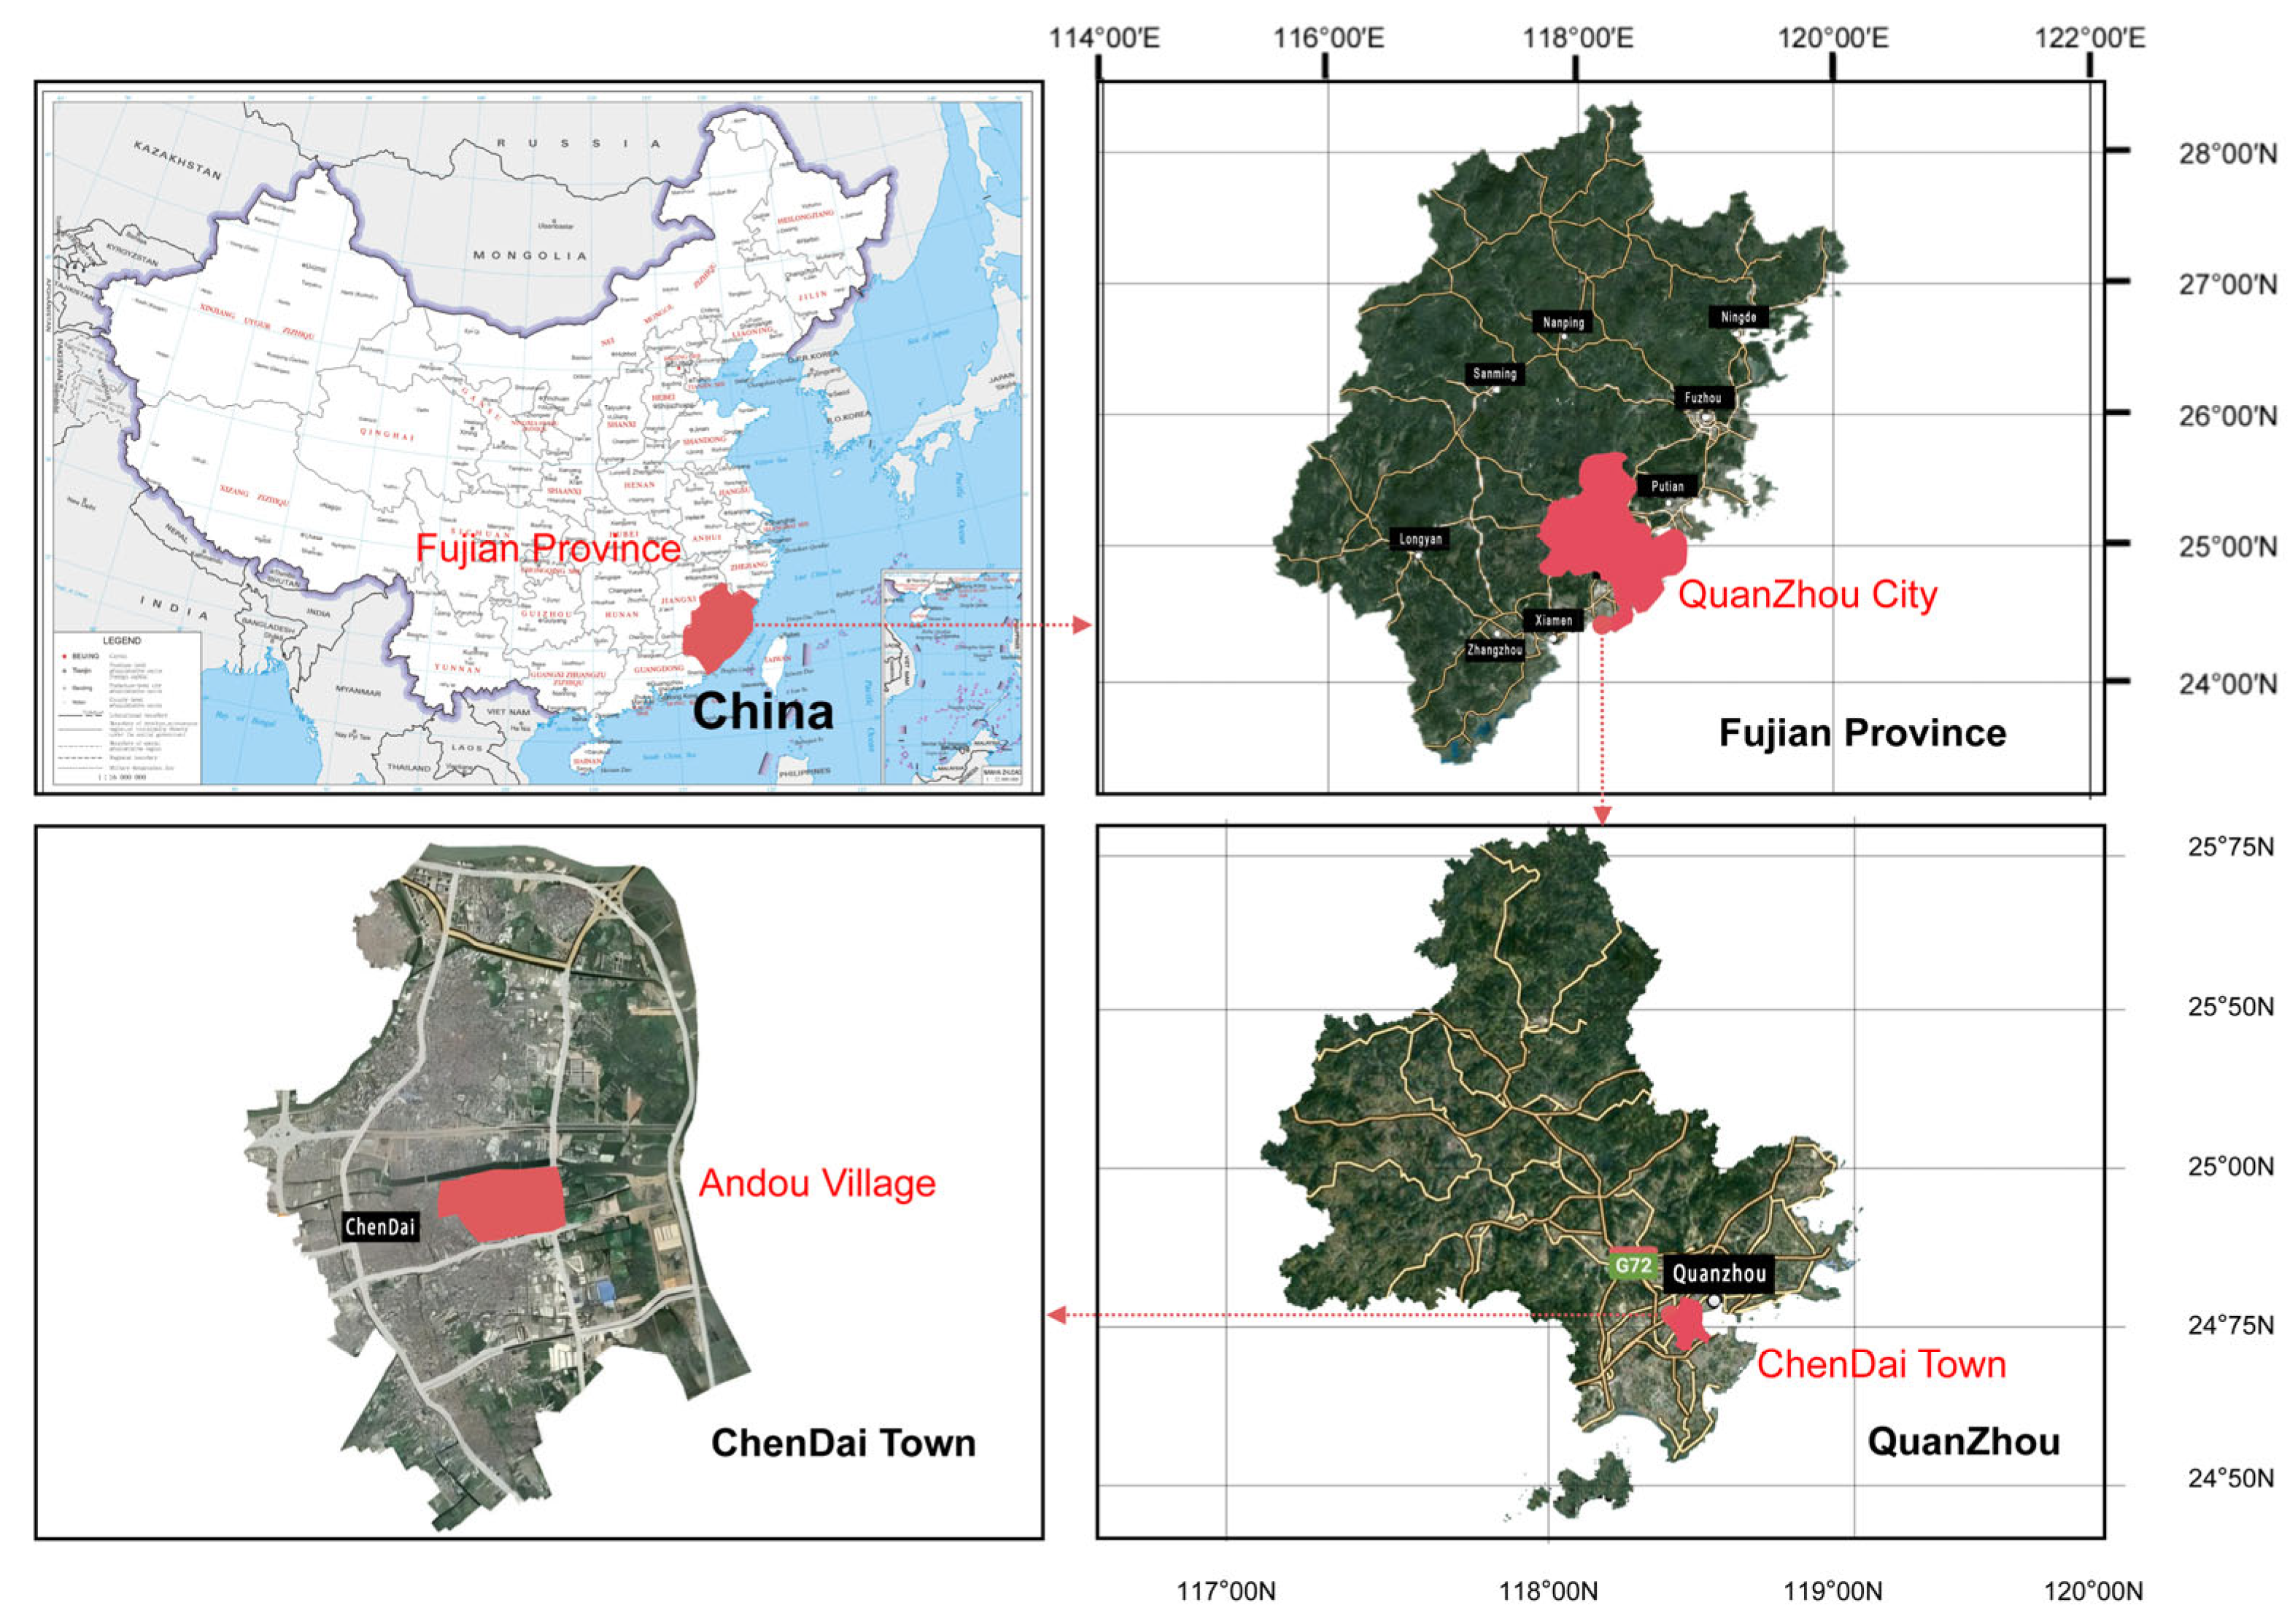
2.2. Basis for Sample Selection
- (1)
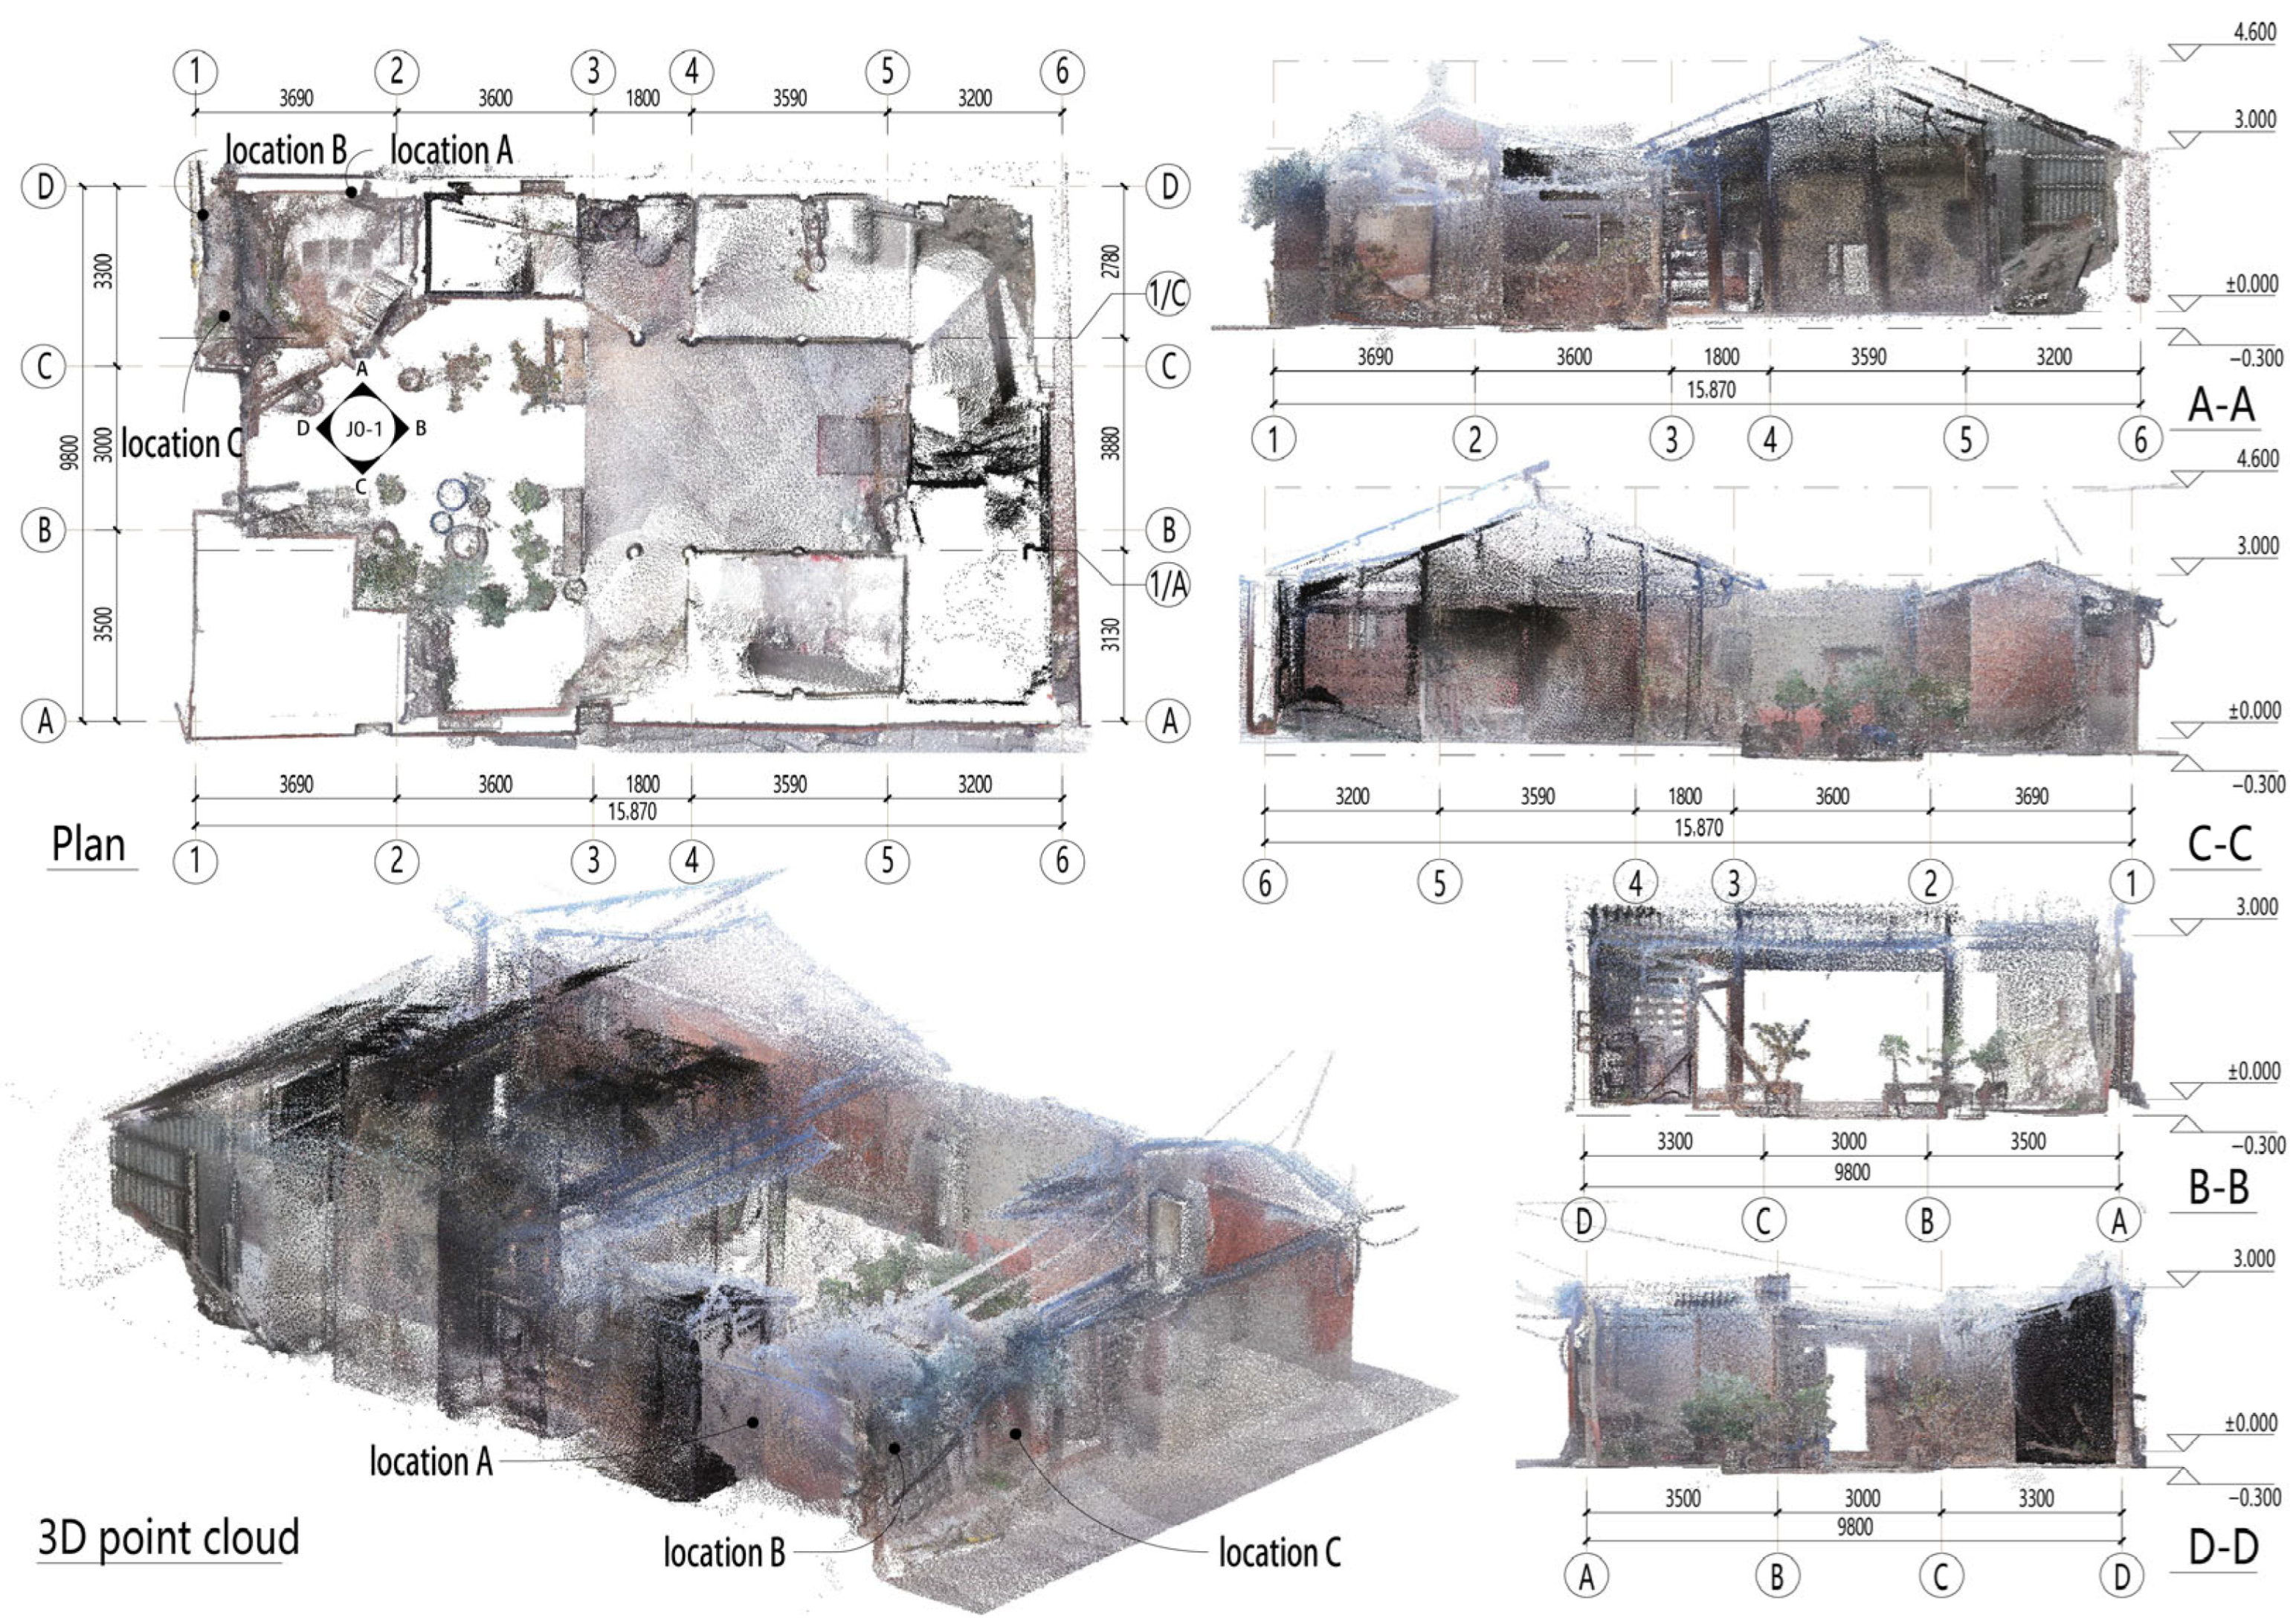
- Quanzhou—as a world marine commerce center and a World Heritage City in China during the Song and Yuan dynasties—can be considered a model for the construction of traditional residential architecture in Southern China [17]. The research object of this study is the historic “three-bay double-courtyard” residence in Quanzhou built by Ding Gongchen, a scientist in the Qing dynasty, during the Jiaqing era (1800–1875). This is a typical case for the study of BCWs (Figure 3).
- (2)
- The sample collection area was located on the south bank of Jinjiang River in Quanzhou City, belonging to a subtropical humid climate zone. Due to its proximity to the sea, the salinity in both the air and water is high. In addition, the region has experienced severe environmental pollution in the past 30 years [18]. Therefore, the weathering of BCW materials in the region makes it an ideal case for durability research.
- (3)
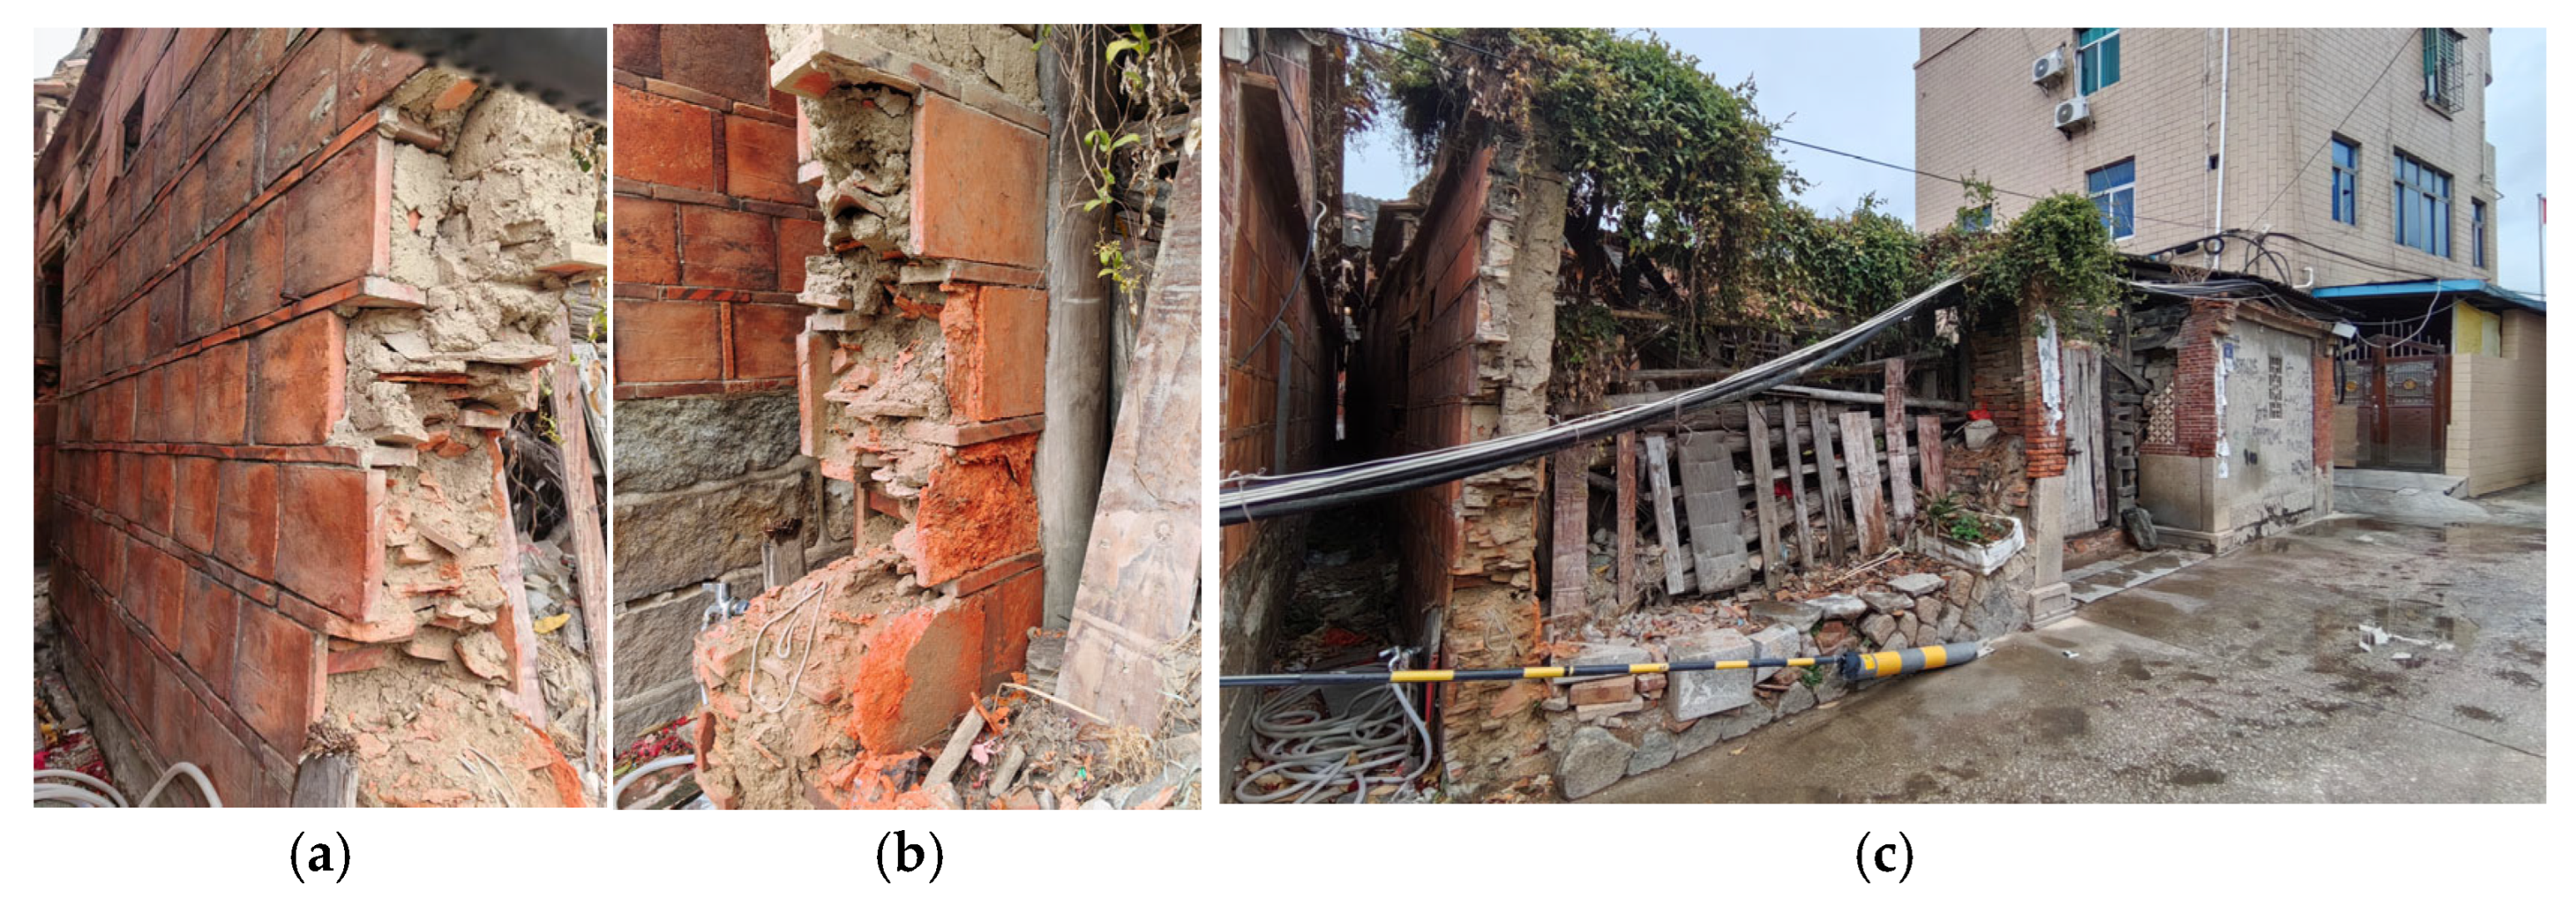
- The north mountain wall of the sample building shows three different states of BCW: (A) fully preserved wall, (B) wall damaged due to years of disrepair, and (C) a temporary reinforced wall completed in 1991. According to the principle of “recognizability” in the protection and restoration of ancient architecture, contemporary crafts and materials can be compared, distinguished, and excluded based on the current situation of point (C), in order to accurately identify the crafts and materials of points (A) and (B), which is a traditional practice in the Qing Dynasty of China [19] (Figure 3, Figure 4 and Figure 5).
2.3. Experimental Methods
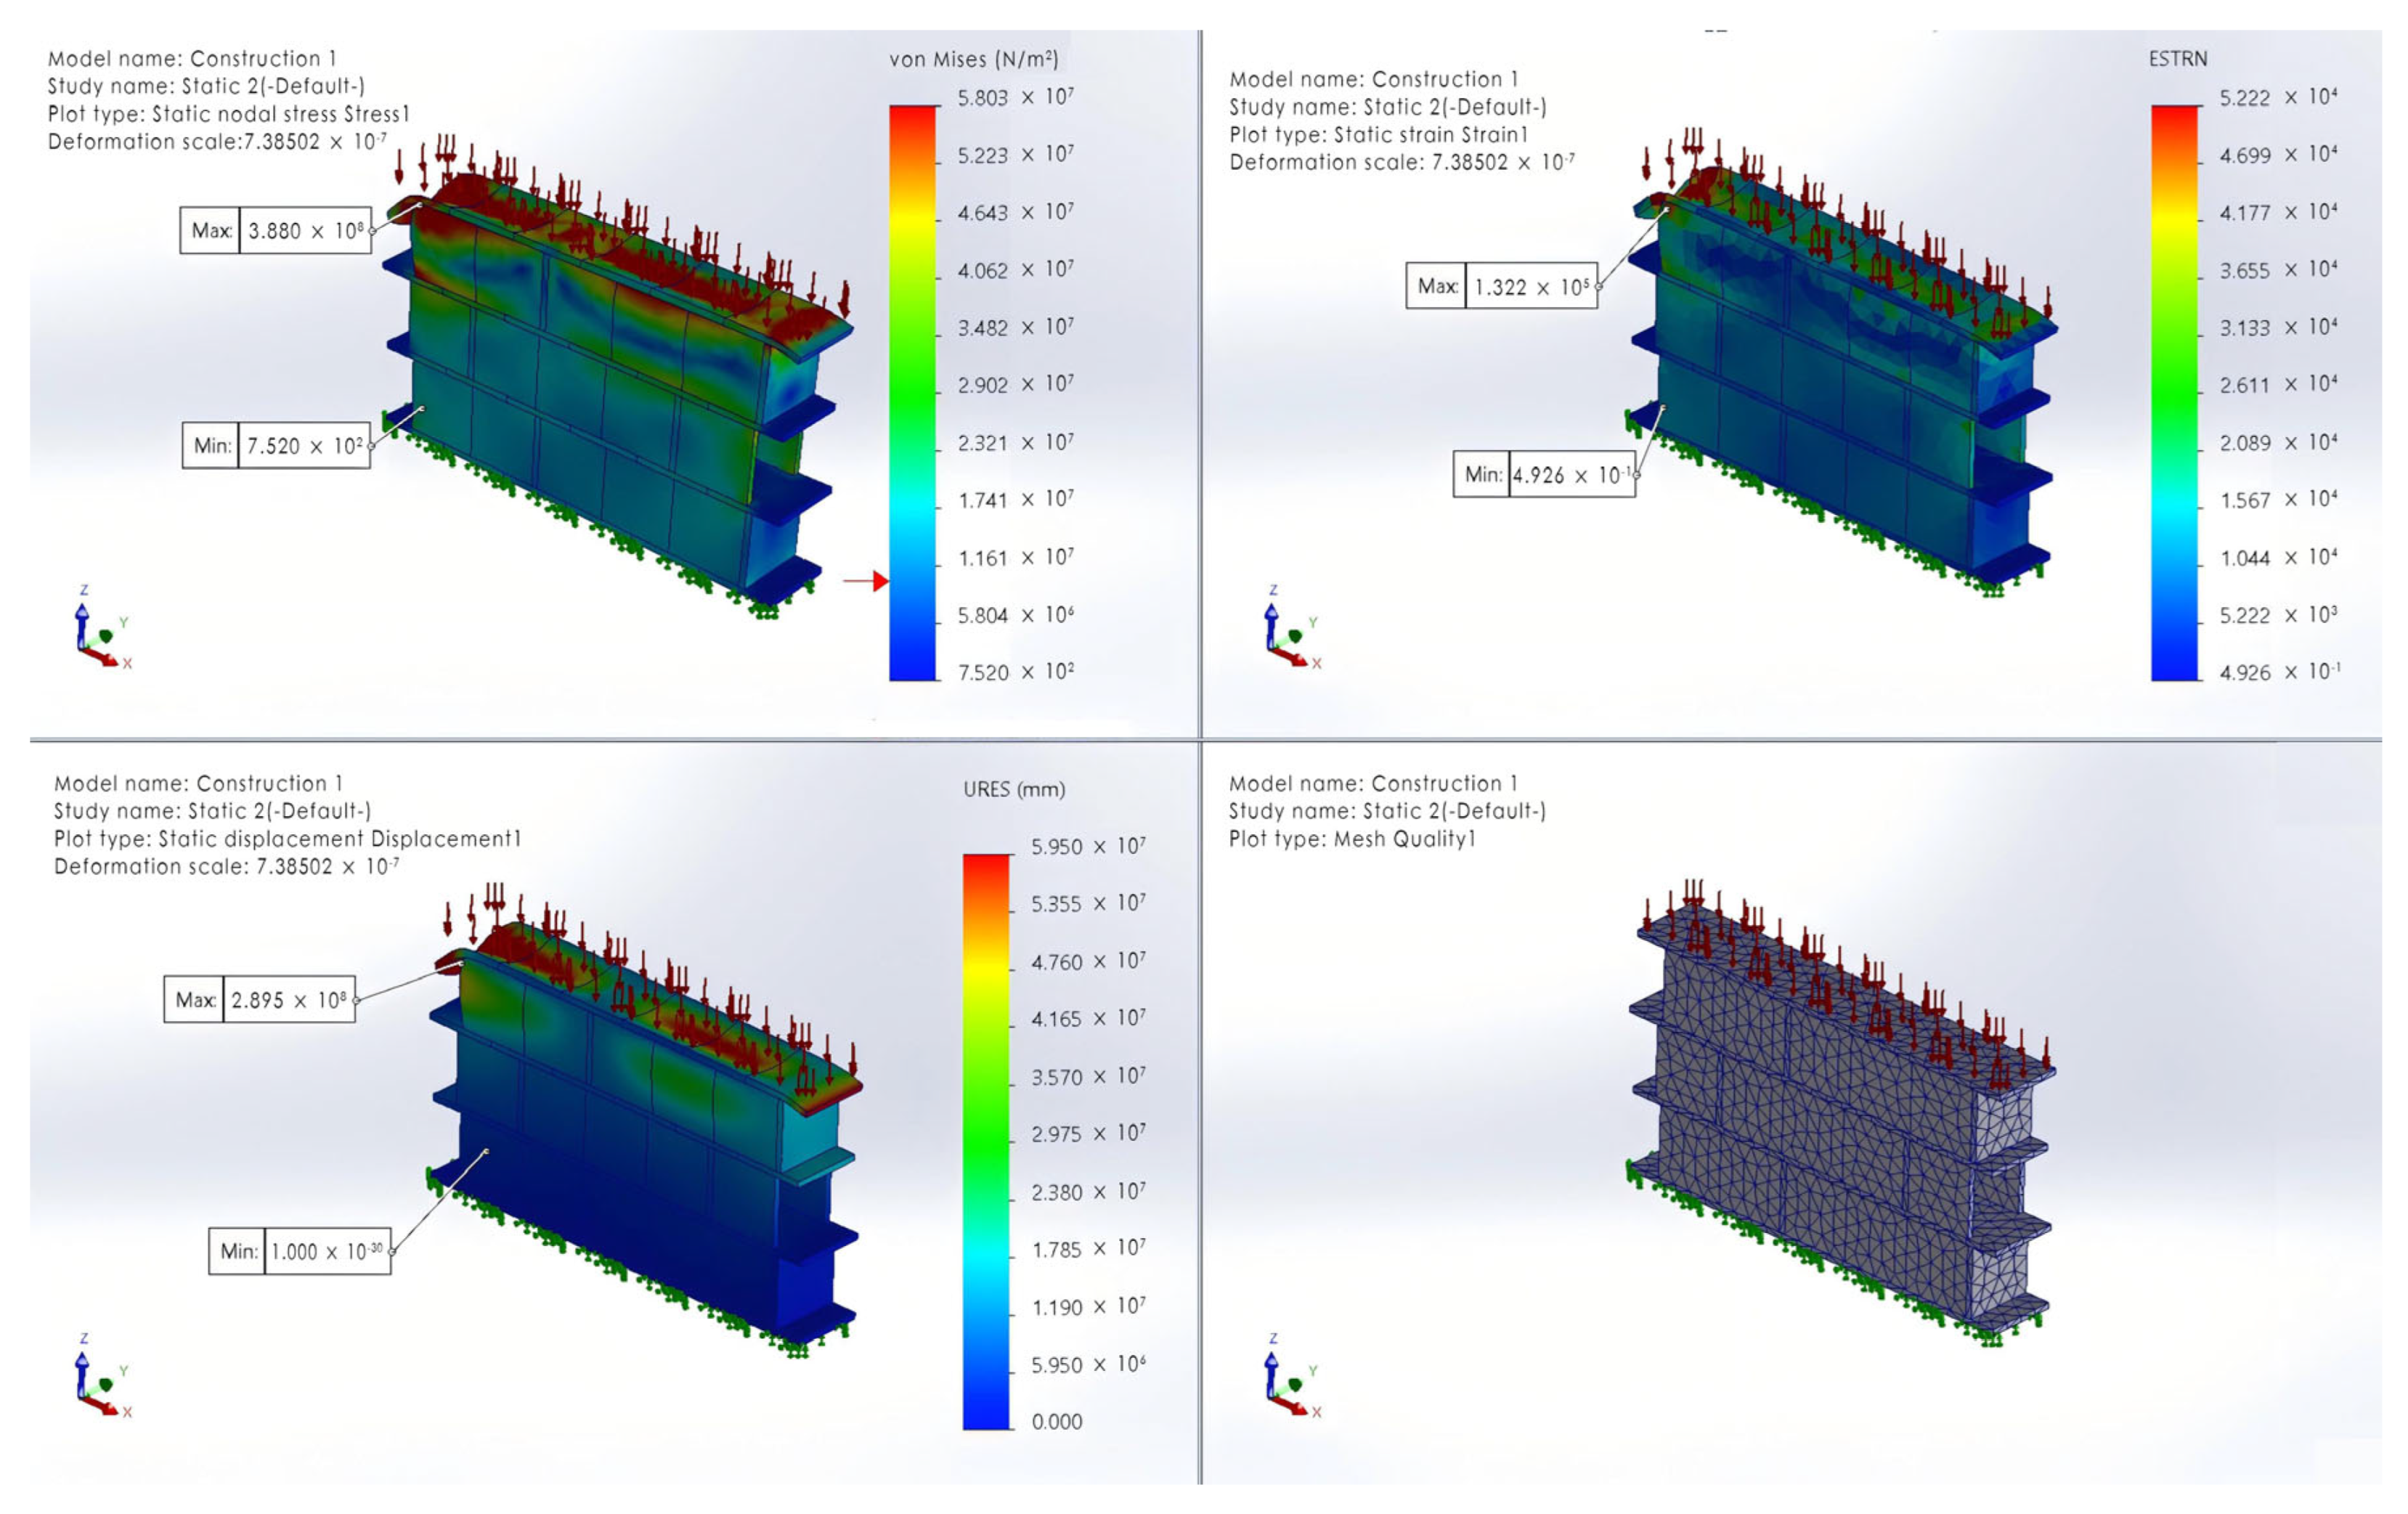
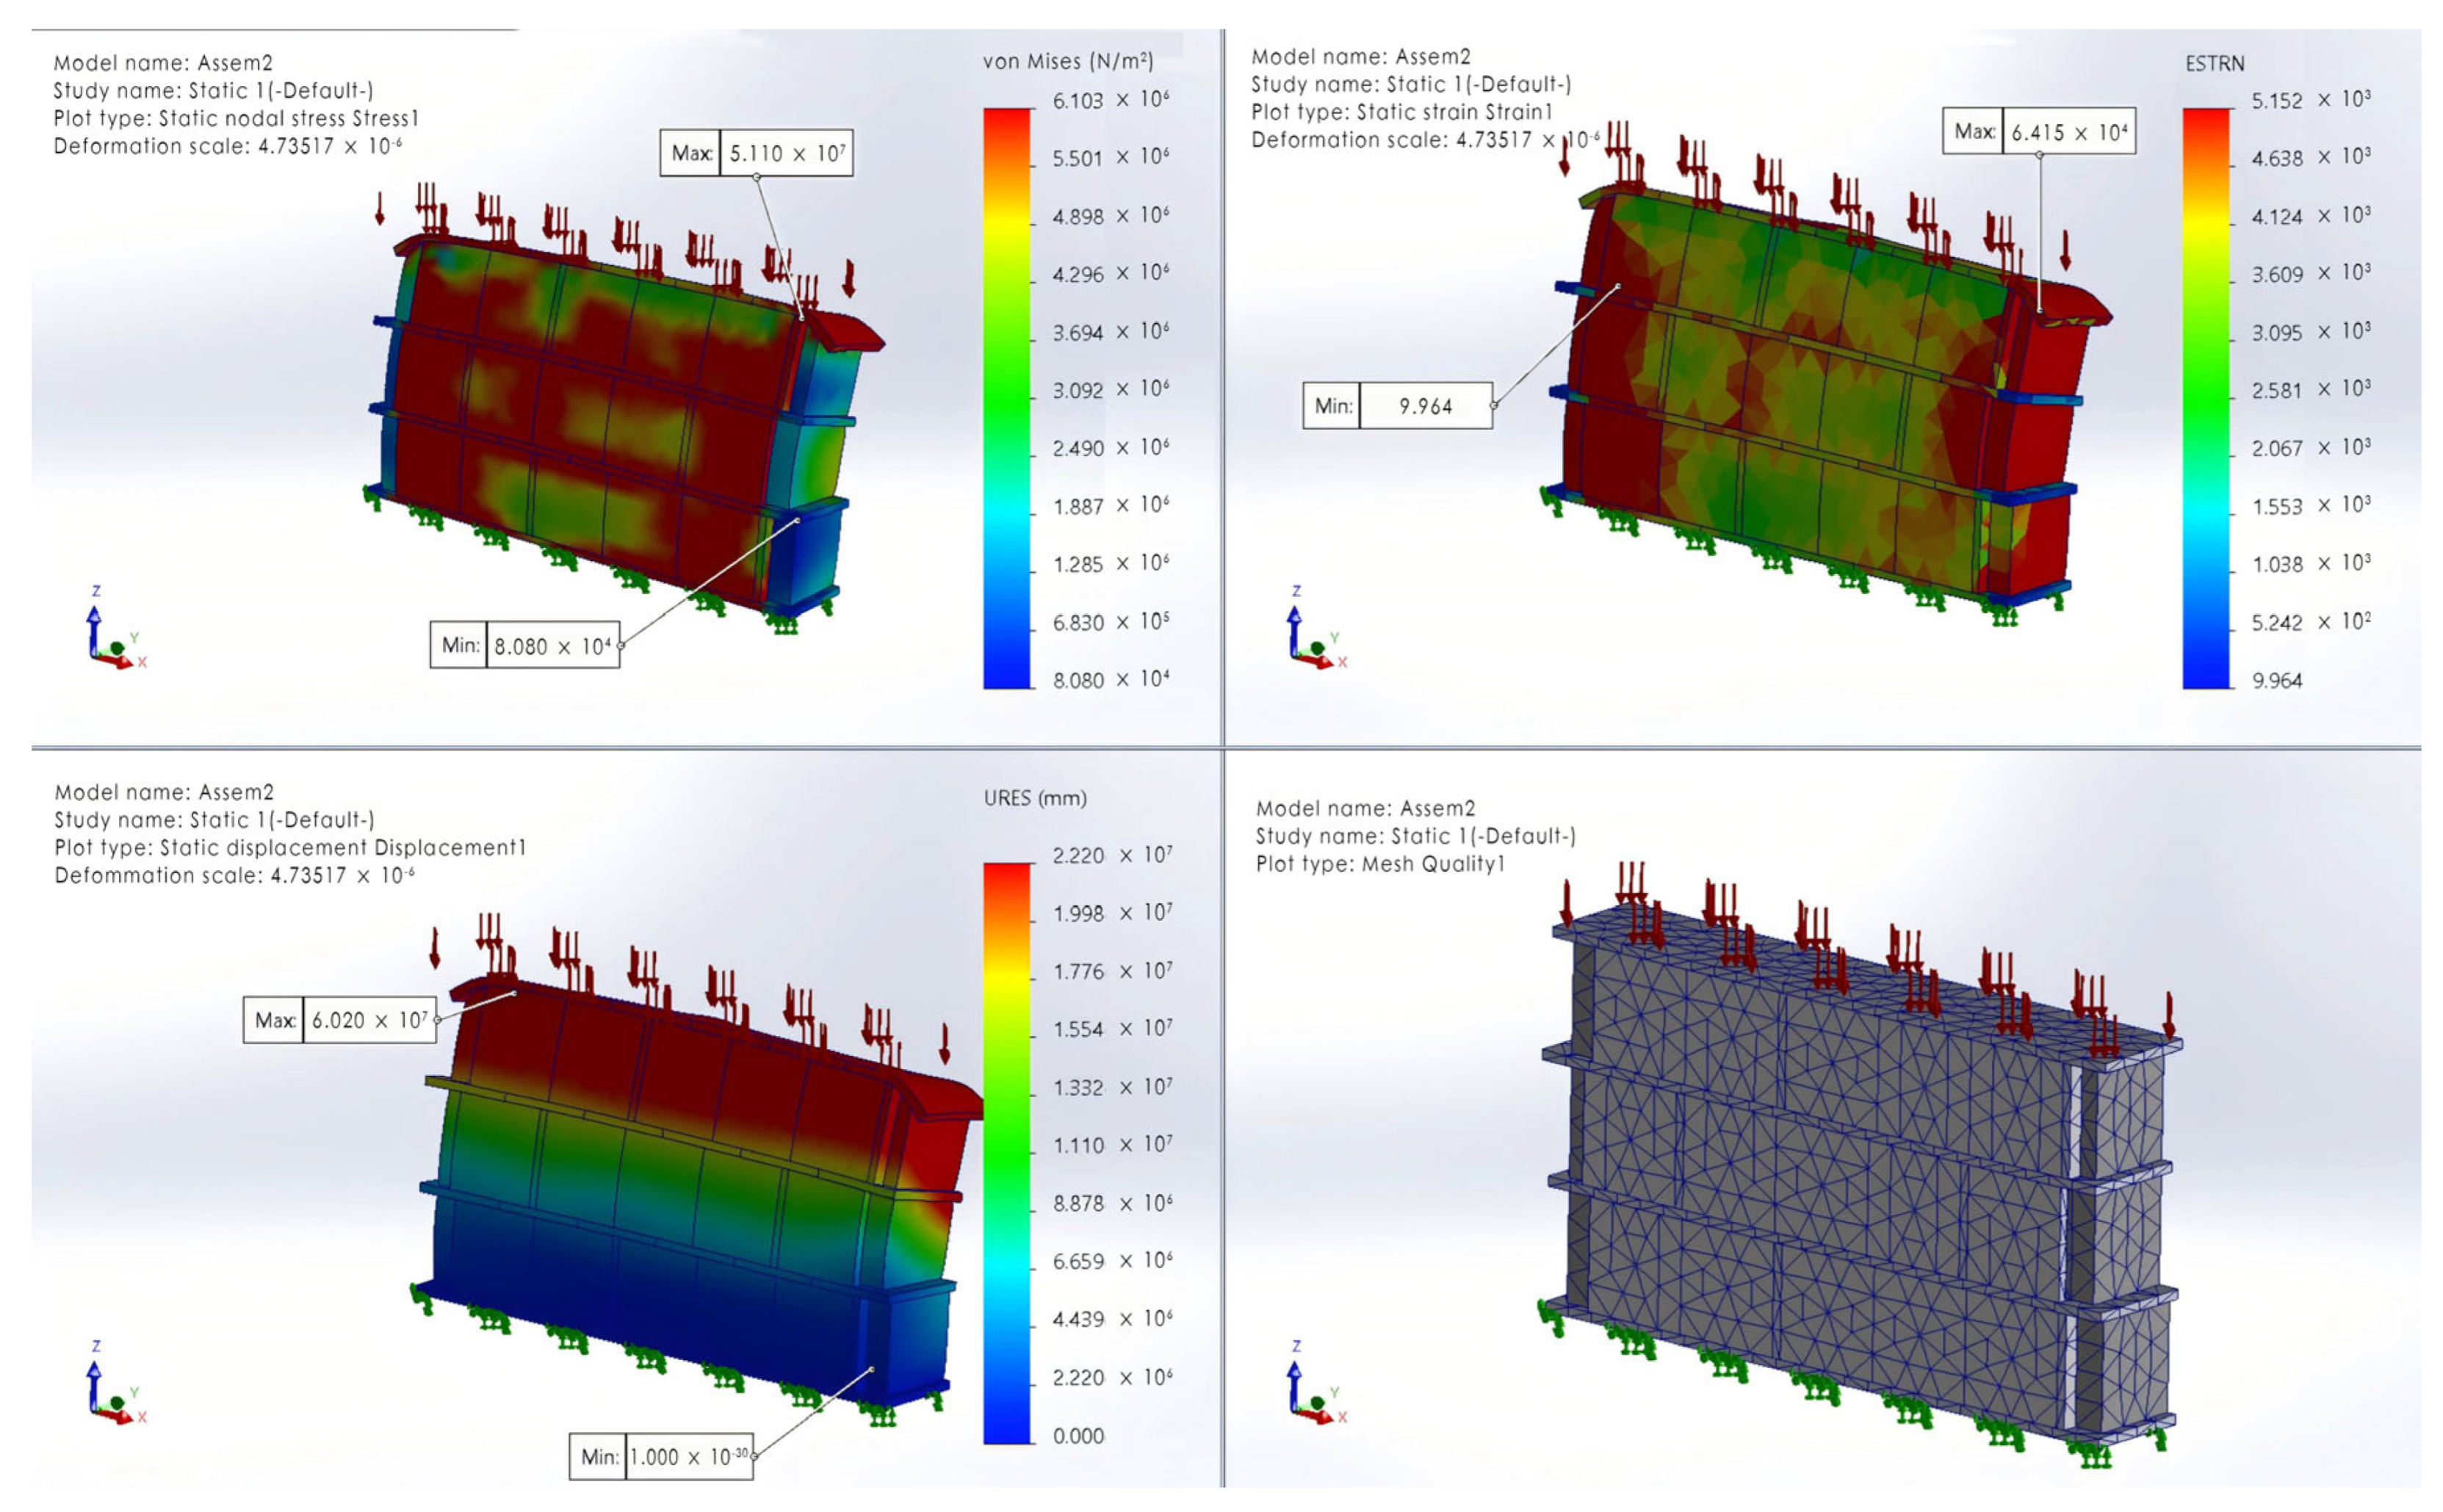
2.3.1. FEM Analysis
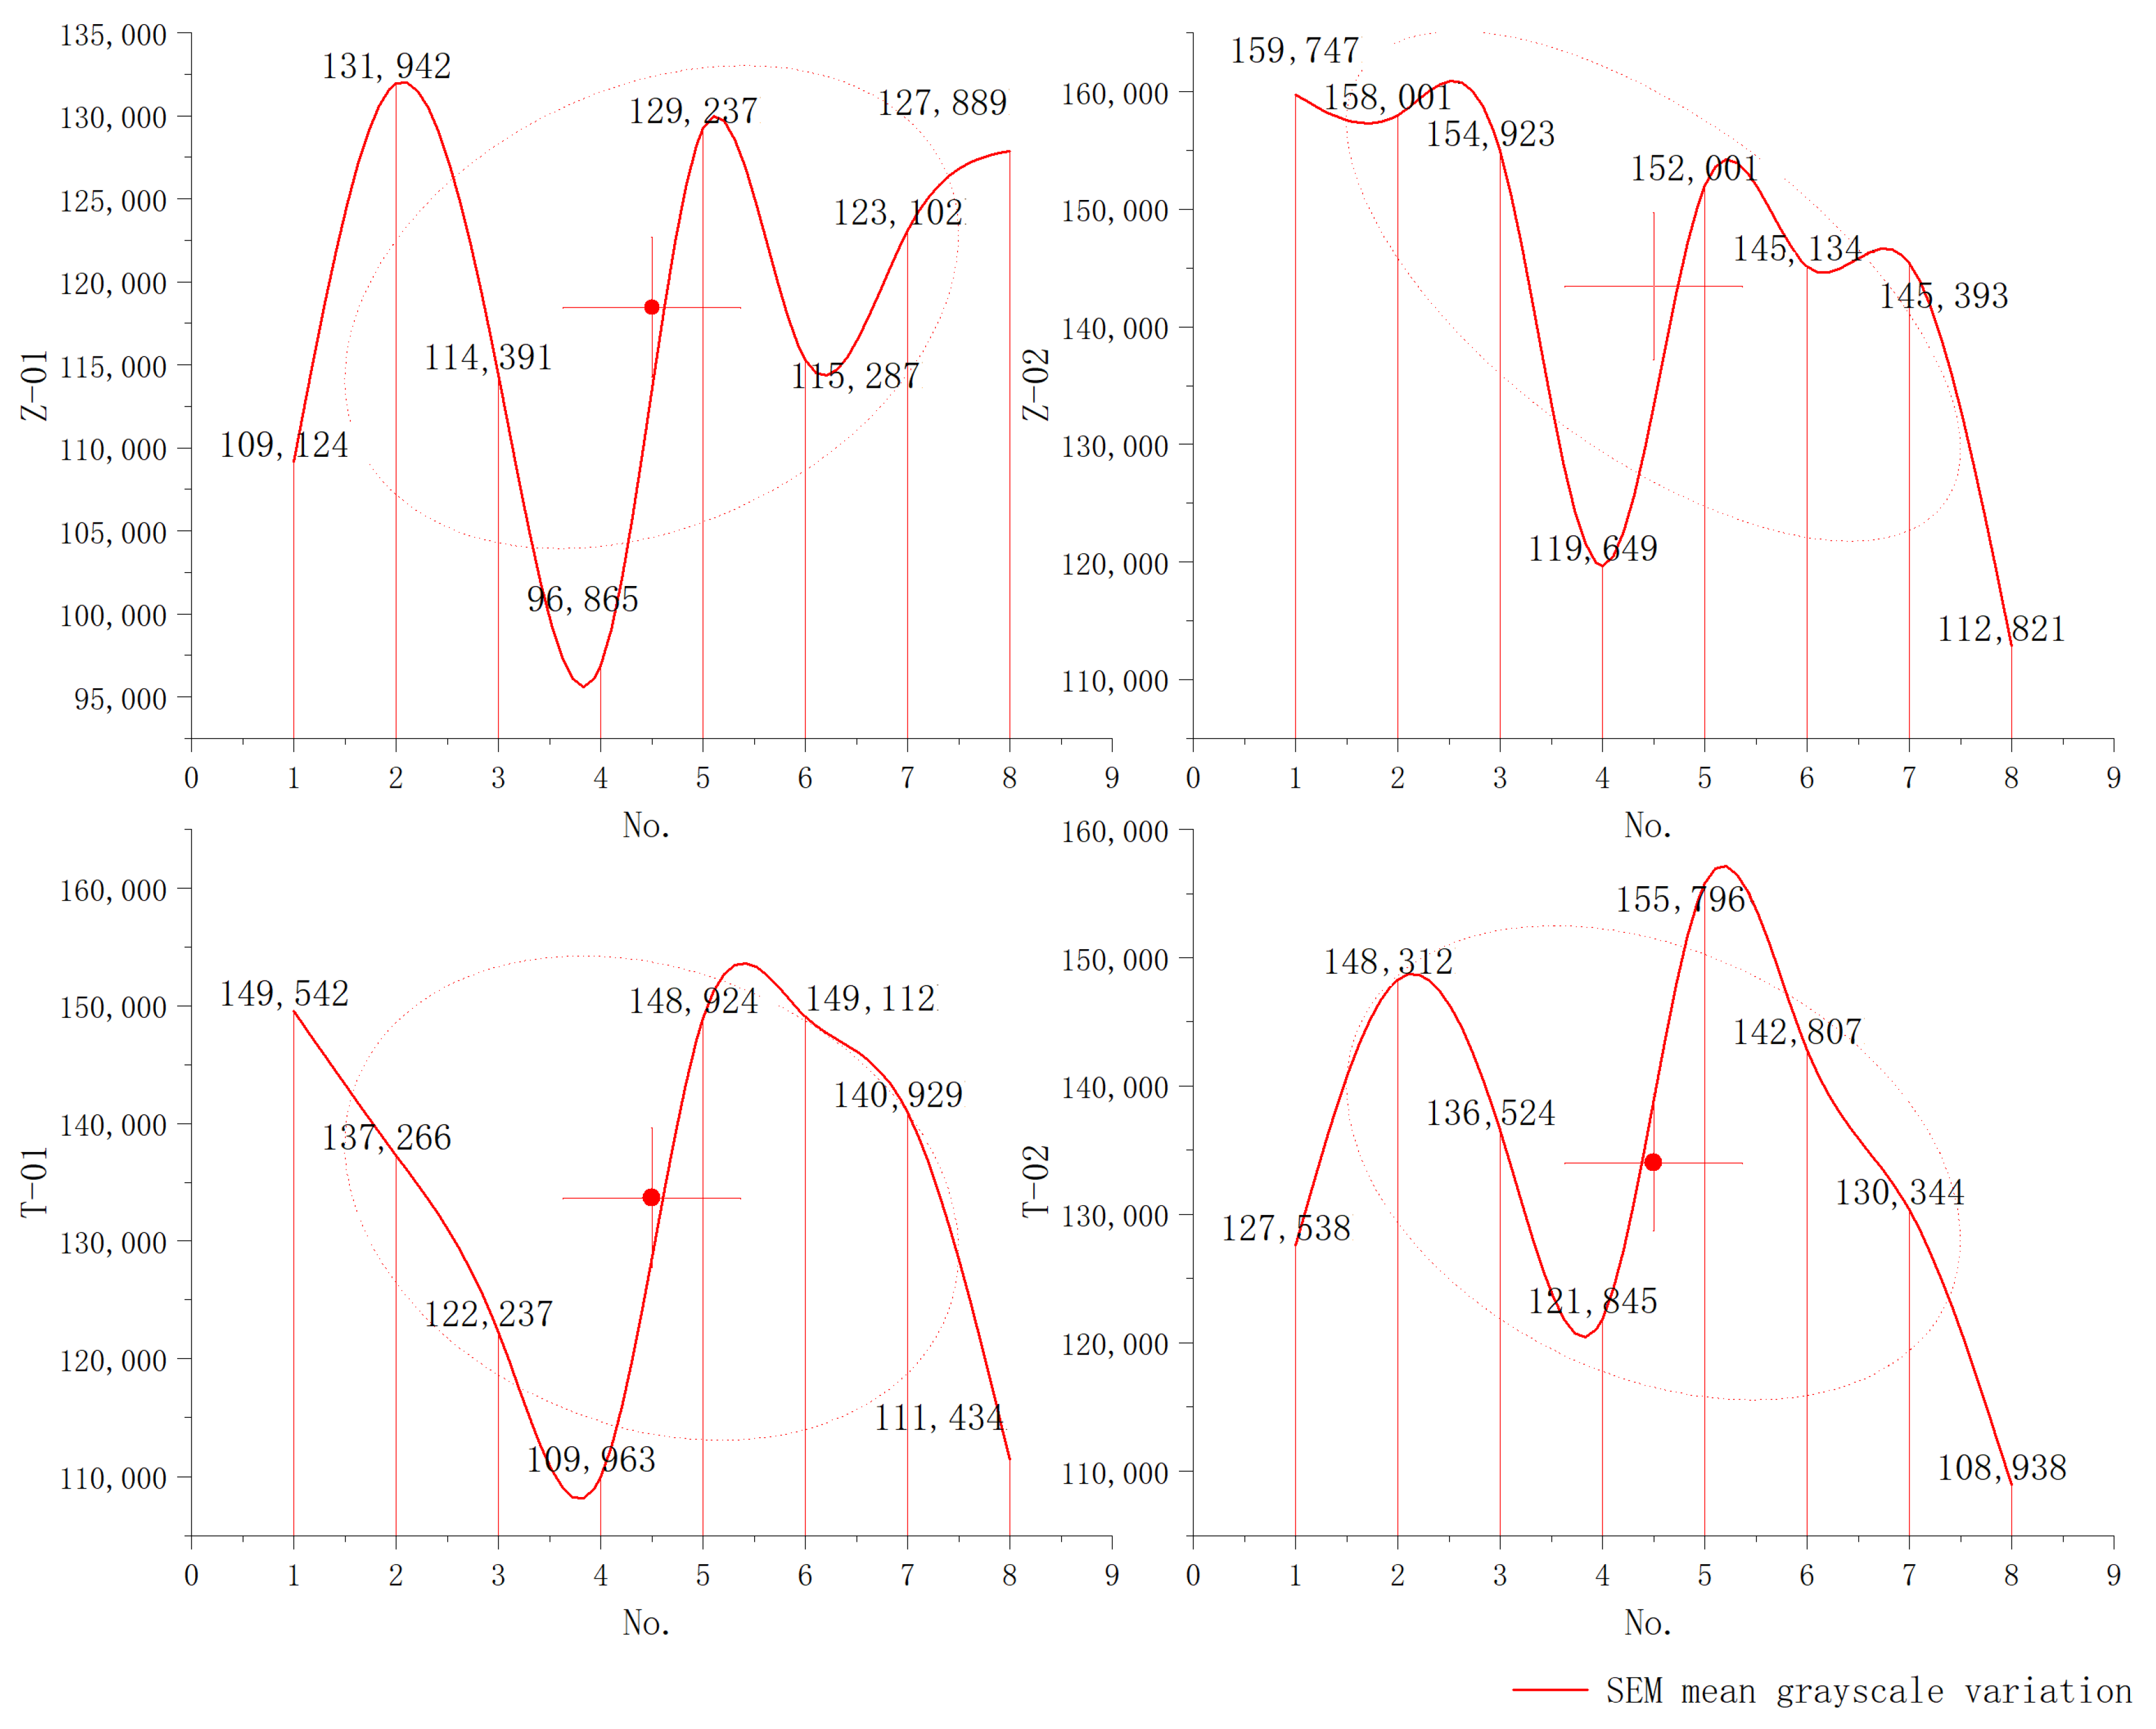
2.3.2. SEM Analysis
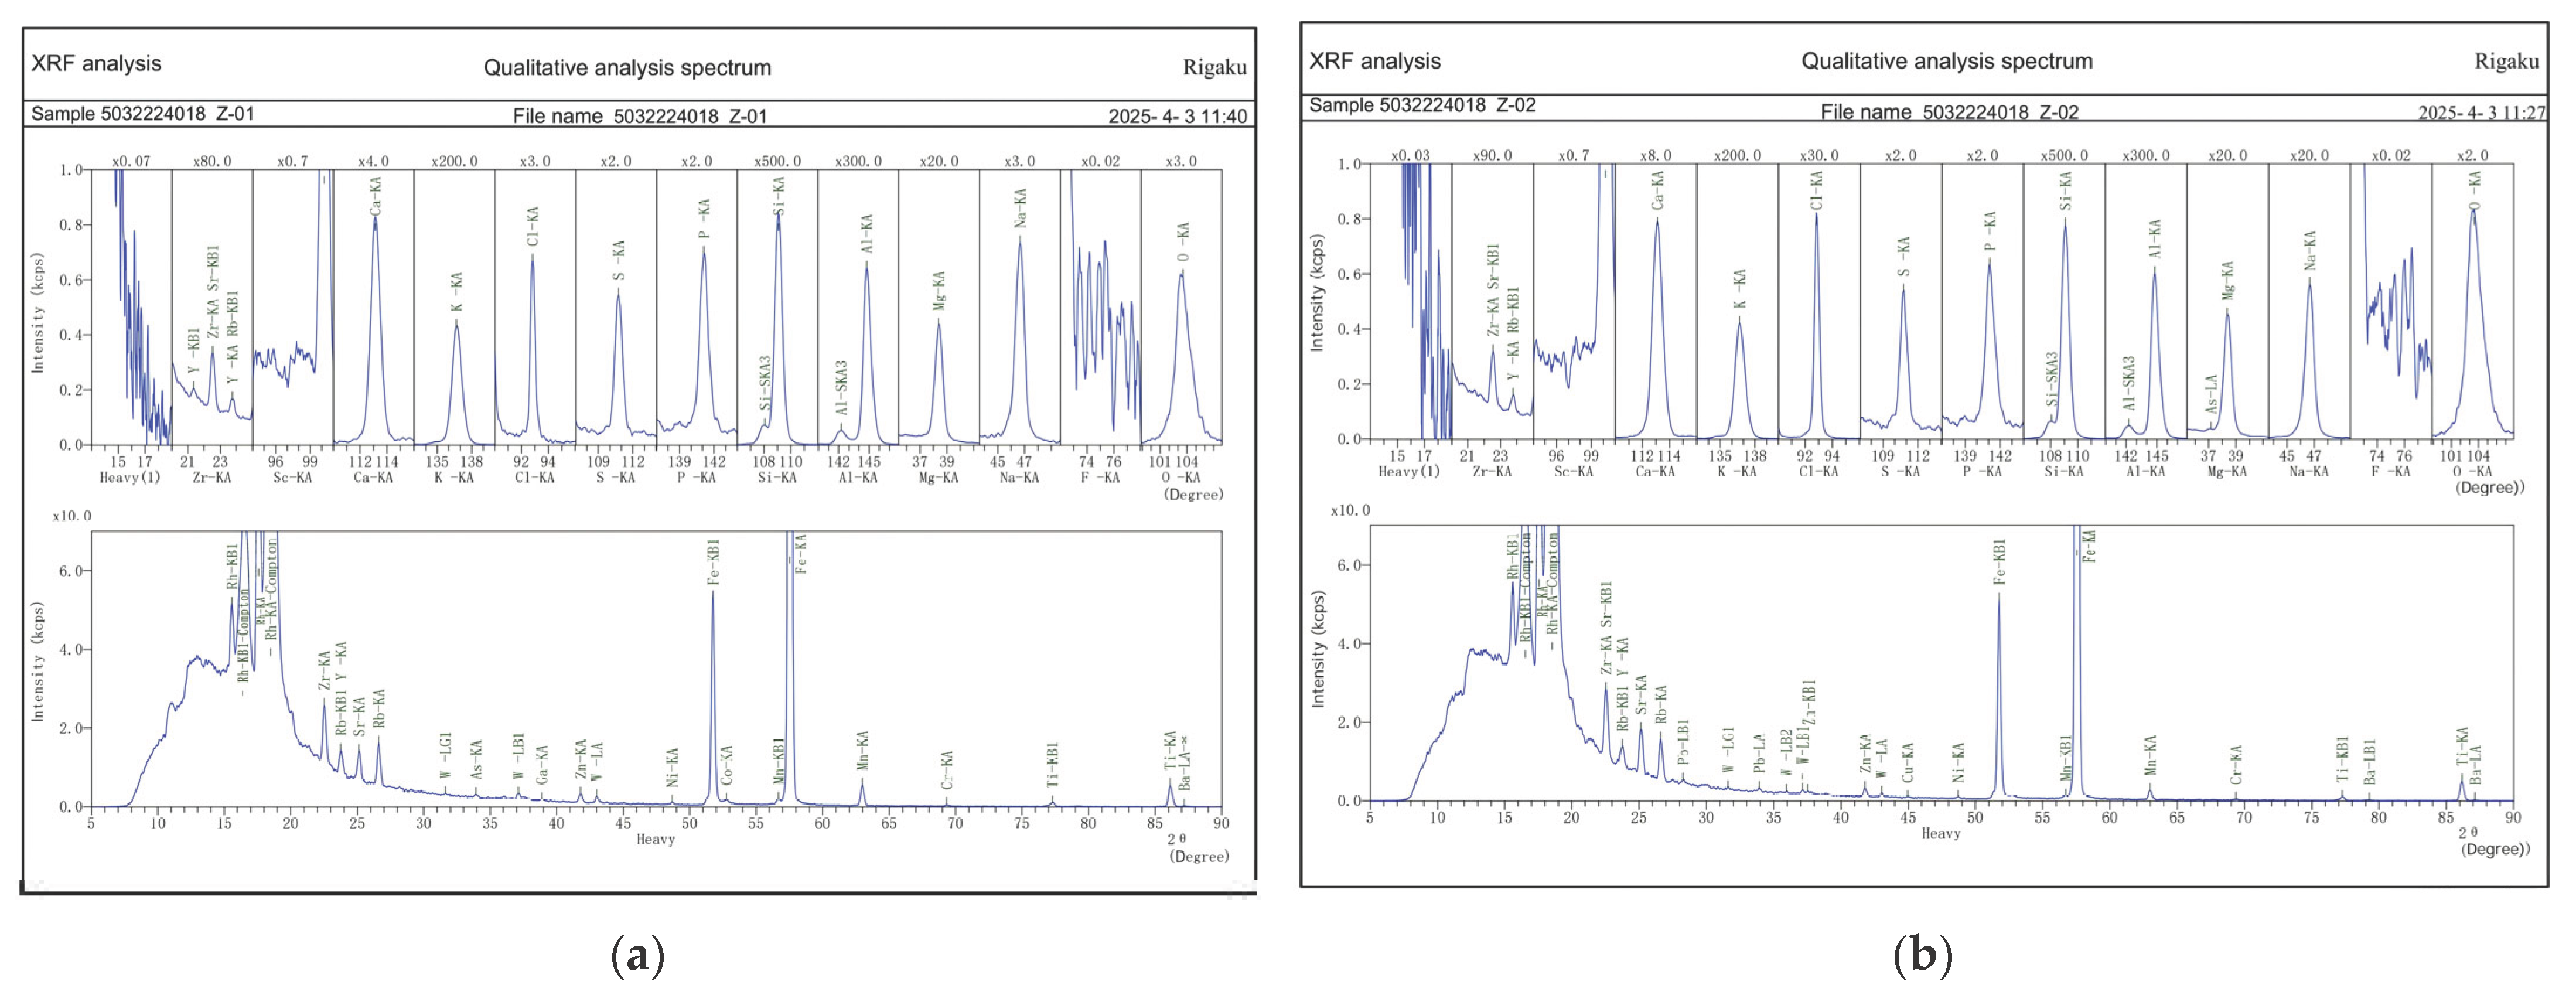
2.3.3. XRF Analysis
2.3.4. XRD Analysis
3. Results
3.1. FEM Simulation Analysis
3.1.1. Construction I
3.1.2. Construction II
3.1.3. Construction III
3.1.4. Summary: The Mechanical Relationship Between Bricks and Clay
3.2. SEM Microstructure Analysis
3.2.1. SEM-Red Brick
3.2.2. SEM-Clay Core
3.2.3. Summary: Microscopic Images of Materials
3.3. XRF Chemical Composition Analysis
3.3.1. XRF-Red Brick
3.3.2. XRF-Clay Core
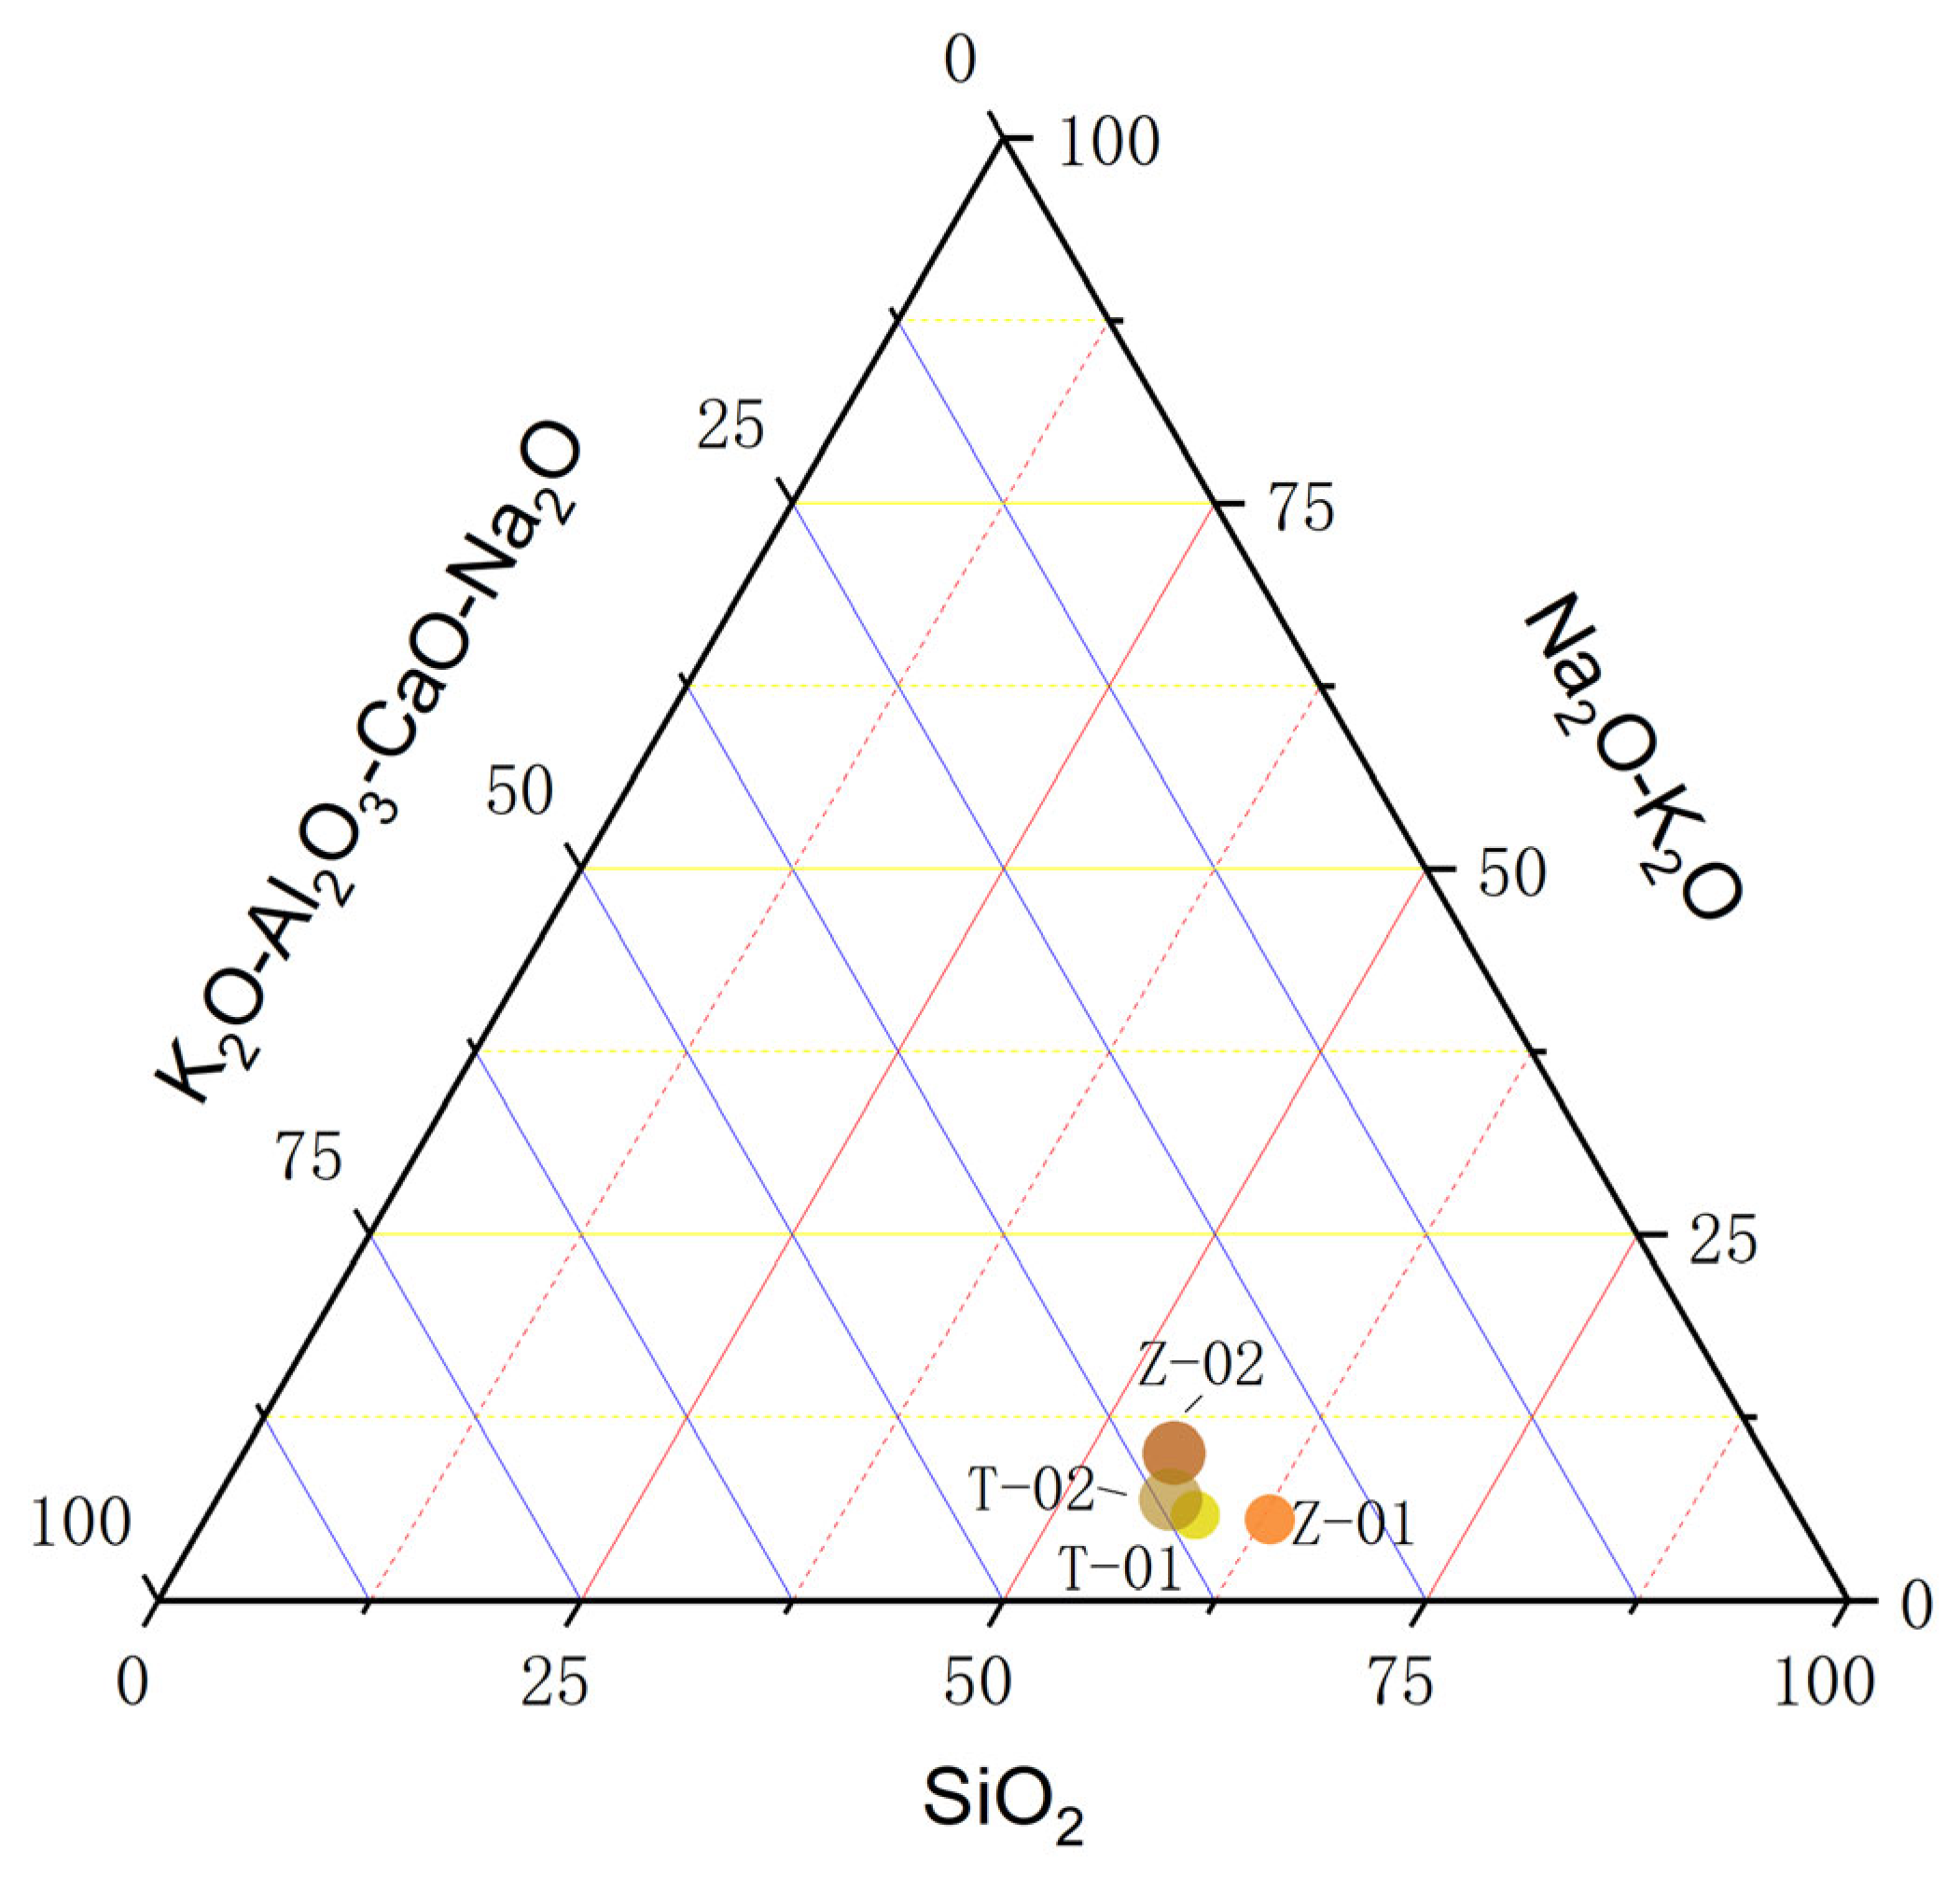
3.3.3. Summary: Changes in Chemical Composition
3.4. XRD Mineral Analysis
3.4.1. XRD-Red Brick
3.4.2. XRD-Clay Core
3.4.3. Summary: Changes in Minerals
4. Discussion
4.1. The Protection and Reinforcement Mechanism
4.2. The Infiltration and Destruction Mechanism
4.3. The Material Stability Mechanism
5. Conclusions and Expectation
5.1. Conclusions
- (1)
- The synergy of “brick-encased soil” mortise and tenon construction greatly enhances structural stability. The protective function of the red bricks and the internal support function of the soil wall complement each other, optimize the load dispersion effect, and delay the process of clay cores’ weathering and deterioration, thereby extending their service life.
- (2)
- External pollutants (such as moisture, halite, gypsum, and acidic substances) destroy the material structure through physical expansion and chemical deterioration, resulting in a reduction in compressive strength and durability.
- (3)
- Silicate minerals (such as illite, quartz, mullite, et al.) improve the compressive strength and durability of the red brick and clay core through their compact microstructure, crystal stability, and chemical inertness.
5.2. Expectation
- (1)
- Multiple factors can be considered to affect the durability of BCWs and expand research, such as “tie brick reinforcement”, “wood column wall interlocking”, etc.
- (2)
- Cross-regional comparisons should be made to elucidate the adaptability of BCWs to different climates.
- (3)
- By combining wind load testing, fatigue resistance testing, or interface detachment nonlinear contact simulation, the durability mechanism under multiple degradation conditions will be revealed.
- (4)
- Based on the results of this study and the emphasis on the principle of “minimal intervention” in the ICOMOS Authenticity Guidelines, further research will be conducted on protection and restoration strategies for BCWs [33].
Author Contributions
Funding
Institutional Review Board Statement
Informed Consent Statement
Data Availability Statement
Conflicts of Interest
Abbreviations
| BCW | Brick-faced clay-core wall |
| ESL. | Elemental spectral lines |
| Ele. | Element |
| w/o N. | w/o Normal |
| D. limit | Detection limit |
| SW FEM | SOLIDWORKS FEM |
| A.ph. | Amorphous phase |
Appendix A

| No. | Z-01 | Z-02 | T-01 | T-02 |
|---|---|---|---|---|
| Entity | 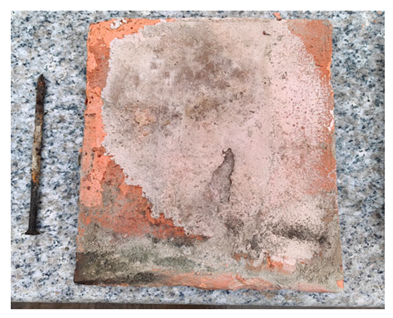 | 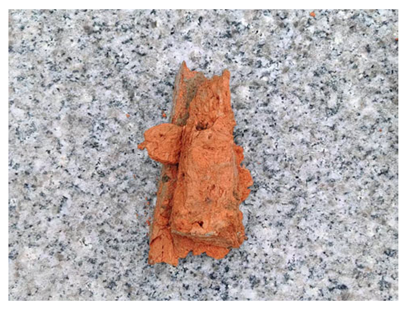 | 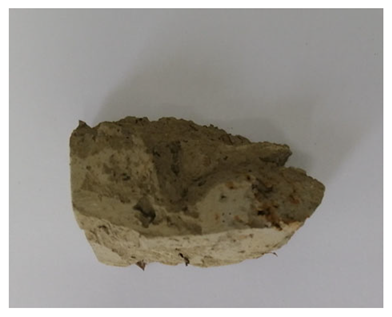 | 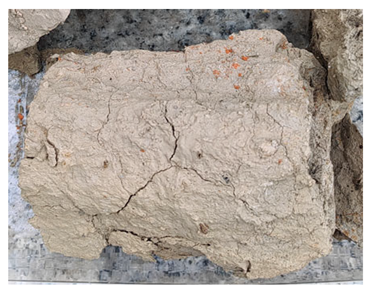 |
| Preliminary grinding |  |  |  |  |
| Fine sieving |  |  |  |  |
| Tablet compression | 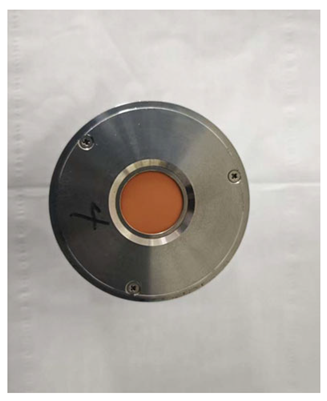 | 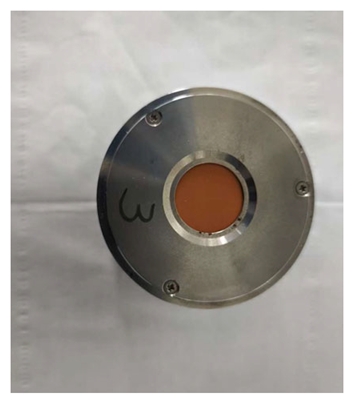 | 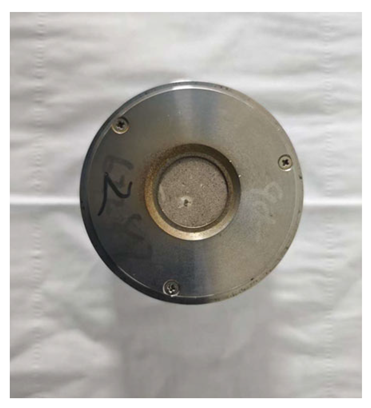 | 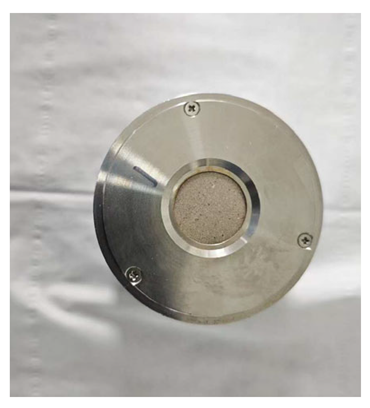 |
| Microstructure Analysis of SEM Images | ||||
|---|---|---|---|---|
| Mag | 5.00 K X | 1.00 K X | 500 X | 200 X |
| Z-01 (WD = 9.8 mm) | 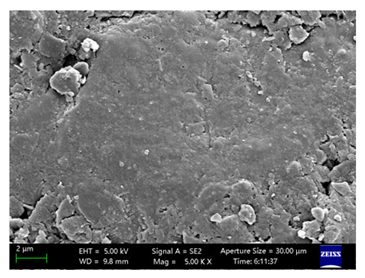 | 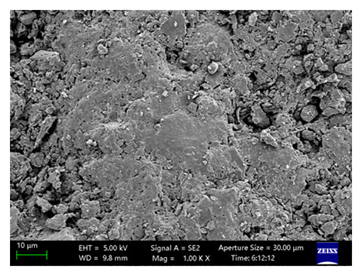 | 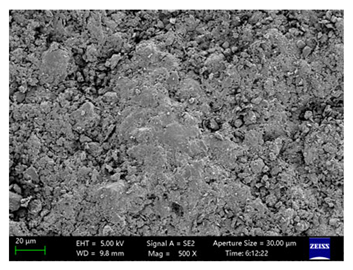 | 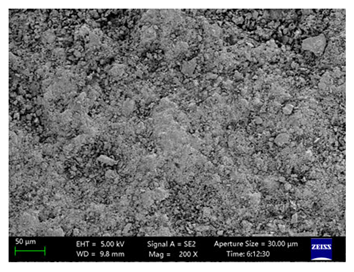 |
| Mean grayscale fluctuation | 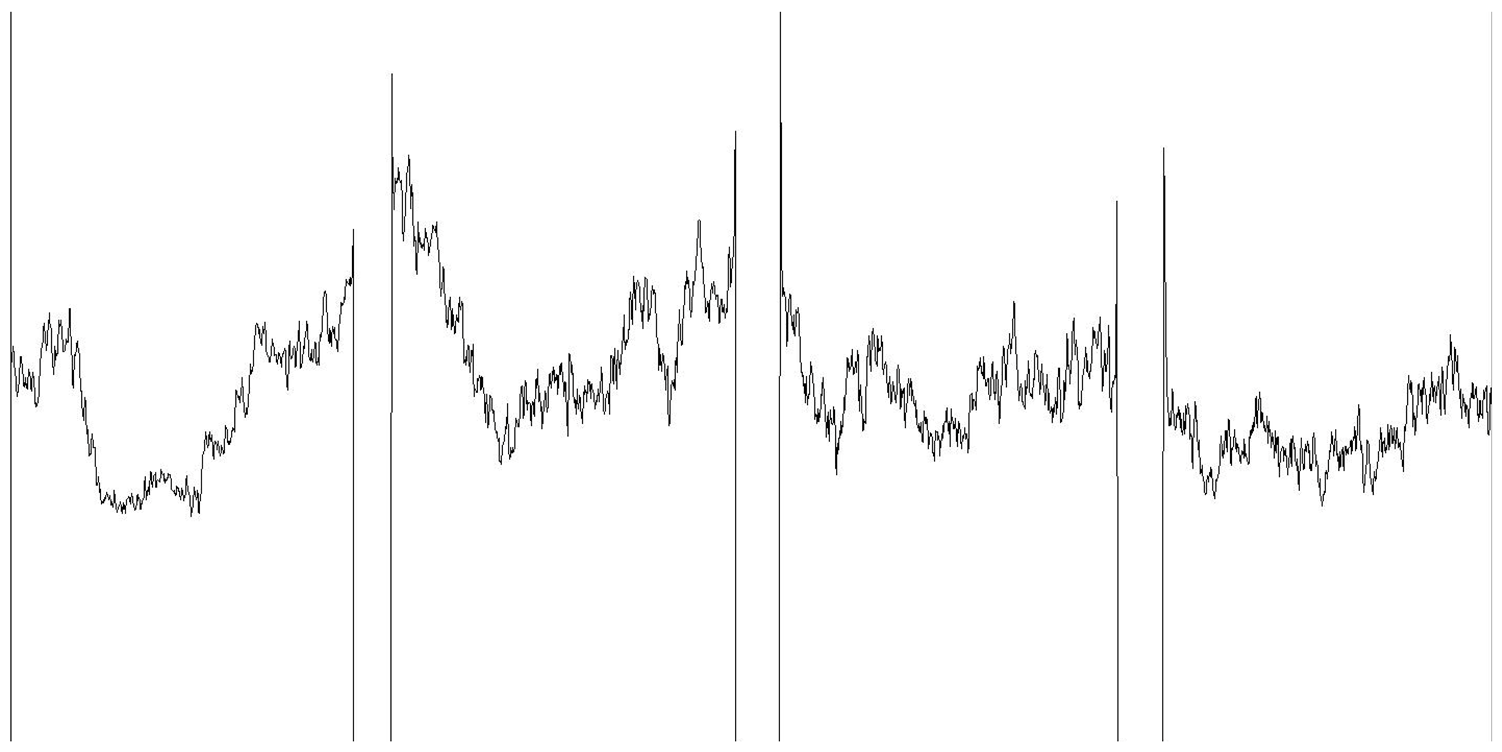 | |||
| Mean grayscale | 109,124 | 131,942 | 114,391 | 96,866 |
| Z-01 (WD = 9.2 mm) | 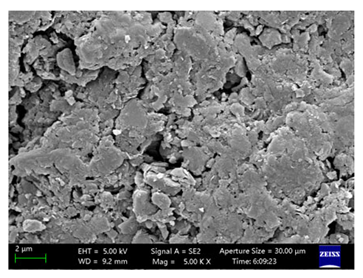 | 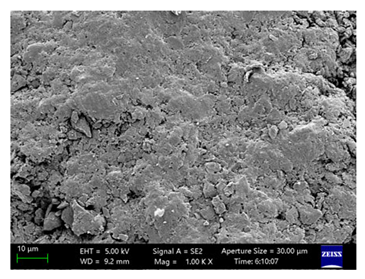 | 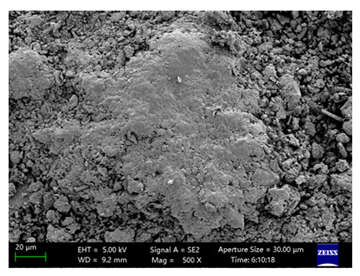 | 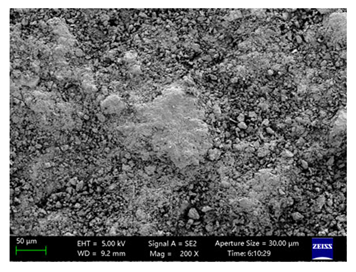 |
| Mean grayscale fluctuation | 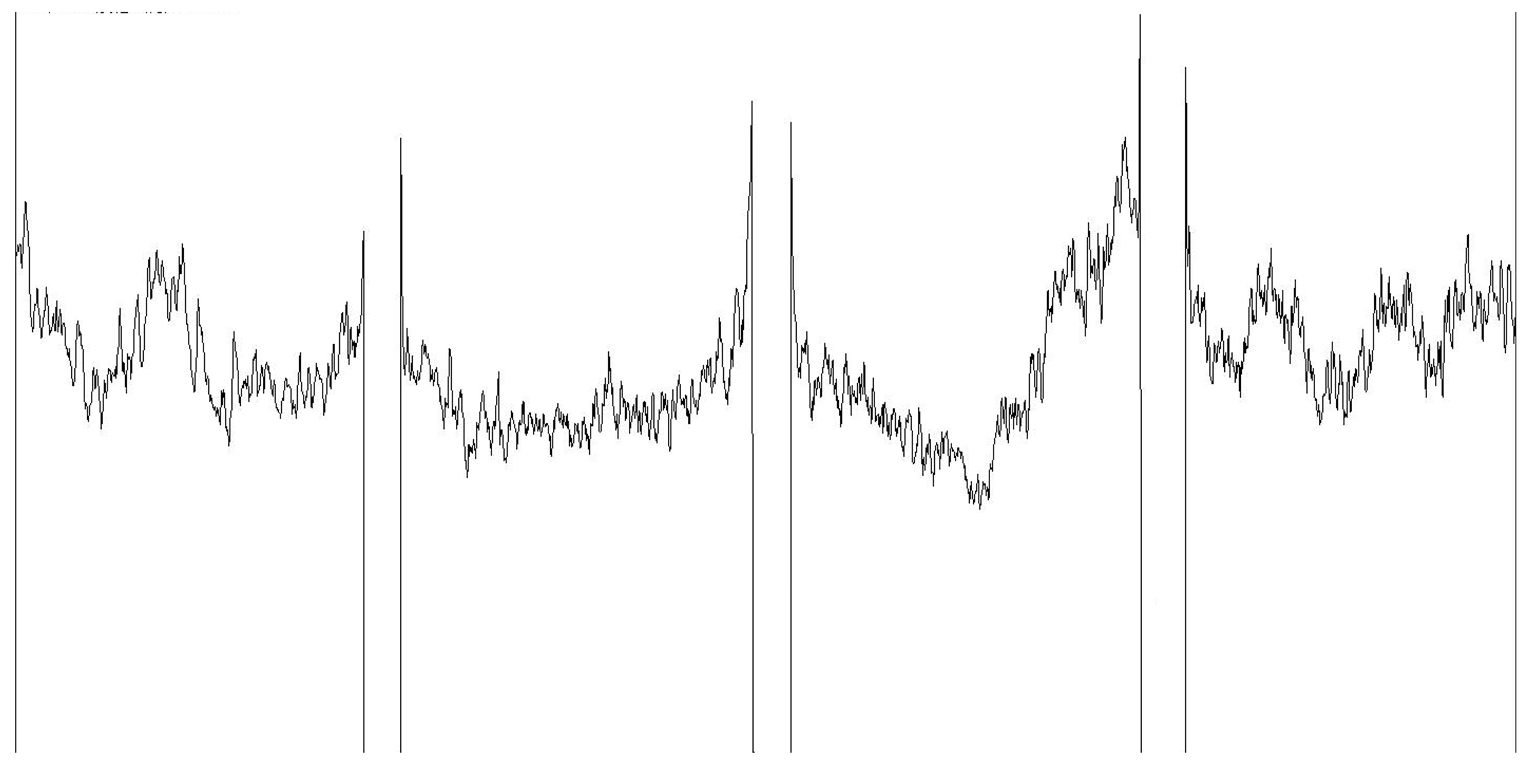 | |||
| Mean grayscale | 129,237 | 115,287 | 123,102 | 127,890 |
| Z-02 (WD = 7.6 mm) | 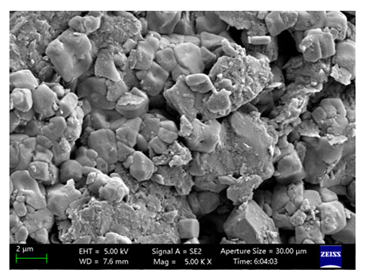 | 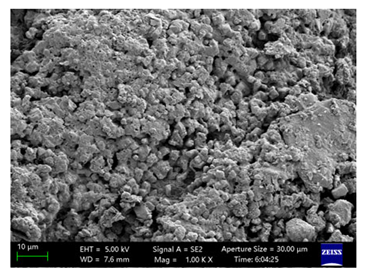 | 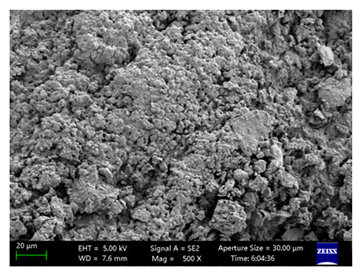 | 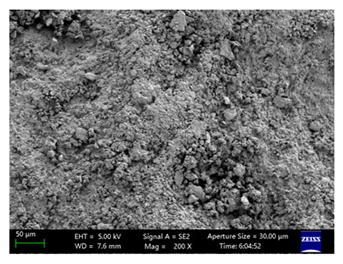 |
| Mean grayscale fluctuation | 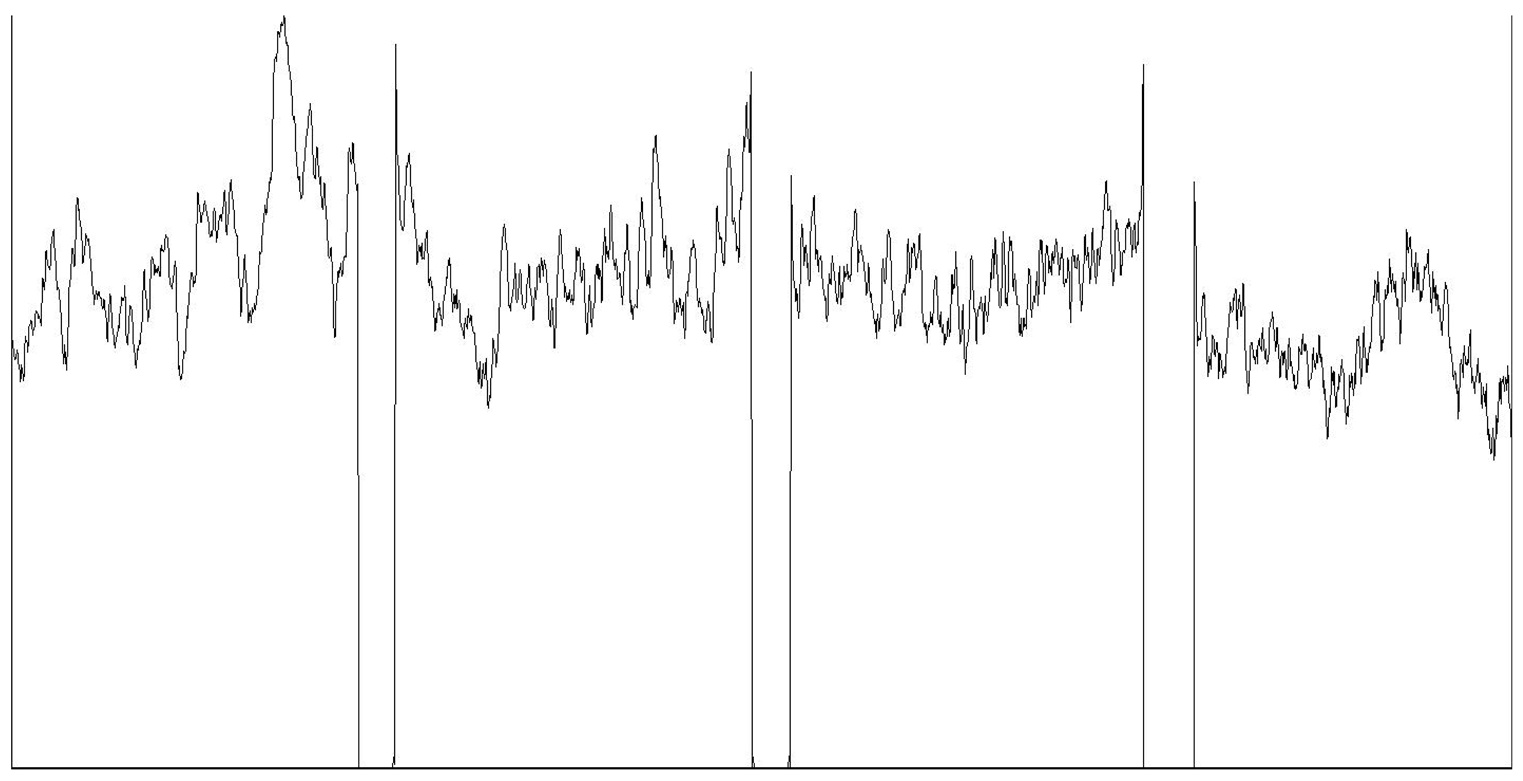 | |||
| Mean grayscale | 159,747 | 158,001 | 154,923 | 119,649 |
| Z-02 (WD = 6.9 mm) | 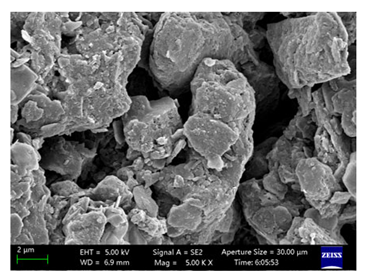 | 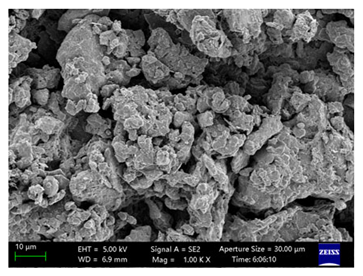 | 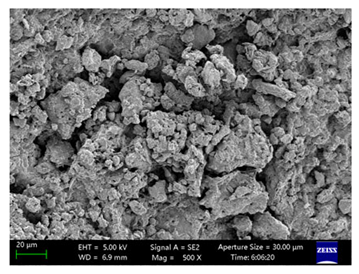 | 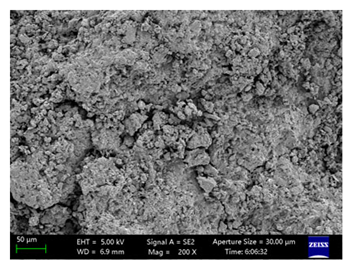 |
| Mean grayscale fluctuation | 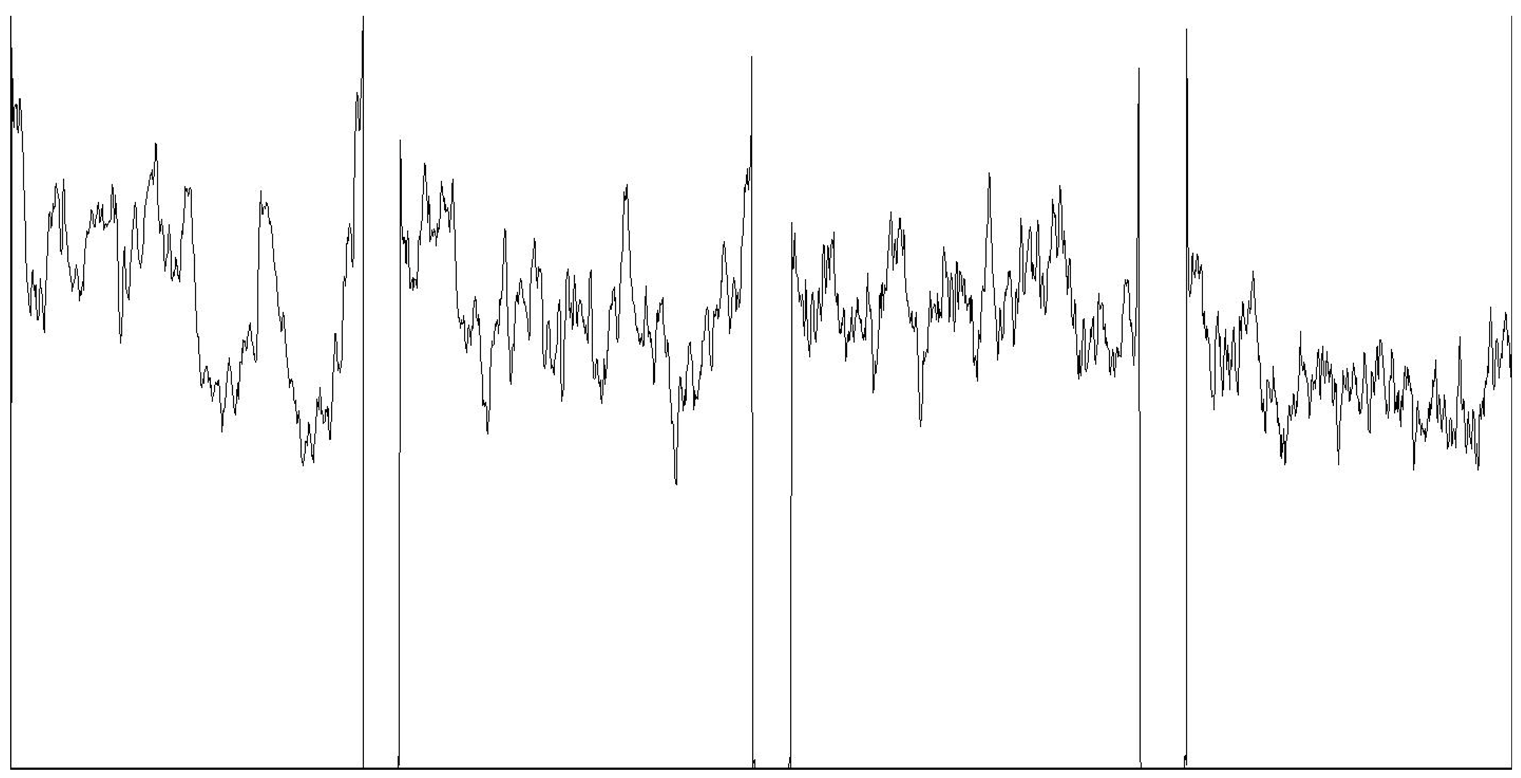 | |||
| Mean grayscale | 152,001 | 145,134 | 145,394 | 112,821 |
| T-01 (WD = 6.8 mm) | 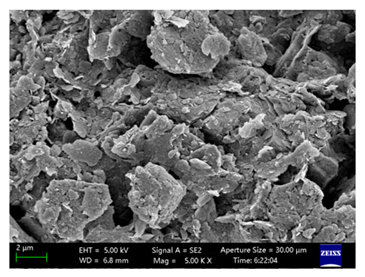 | 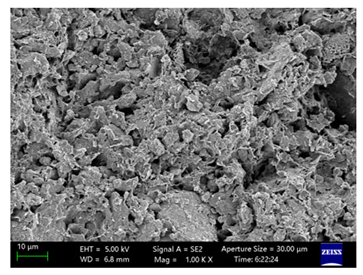 | 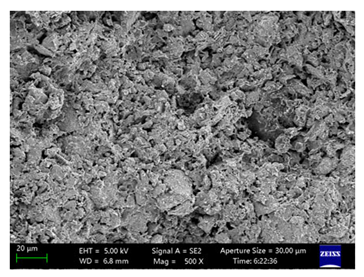 | 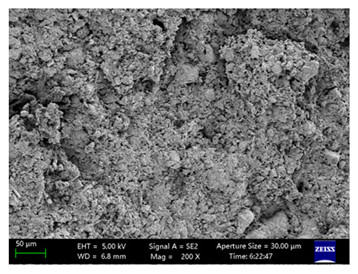 |
| Mean grayscale fluctuation | 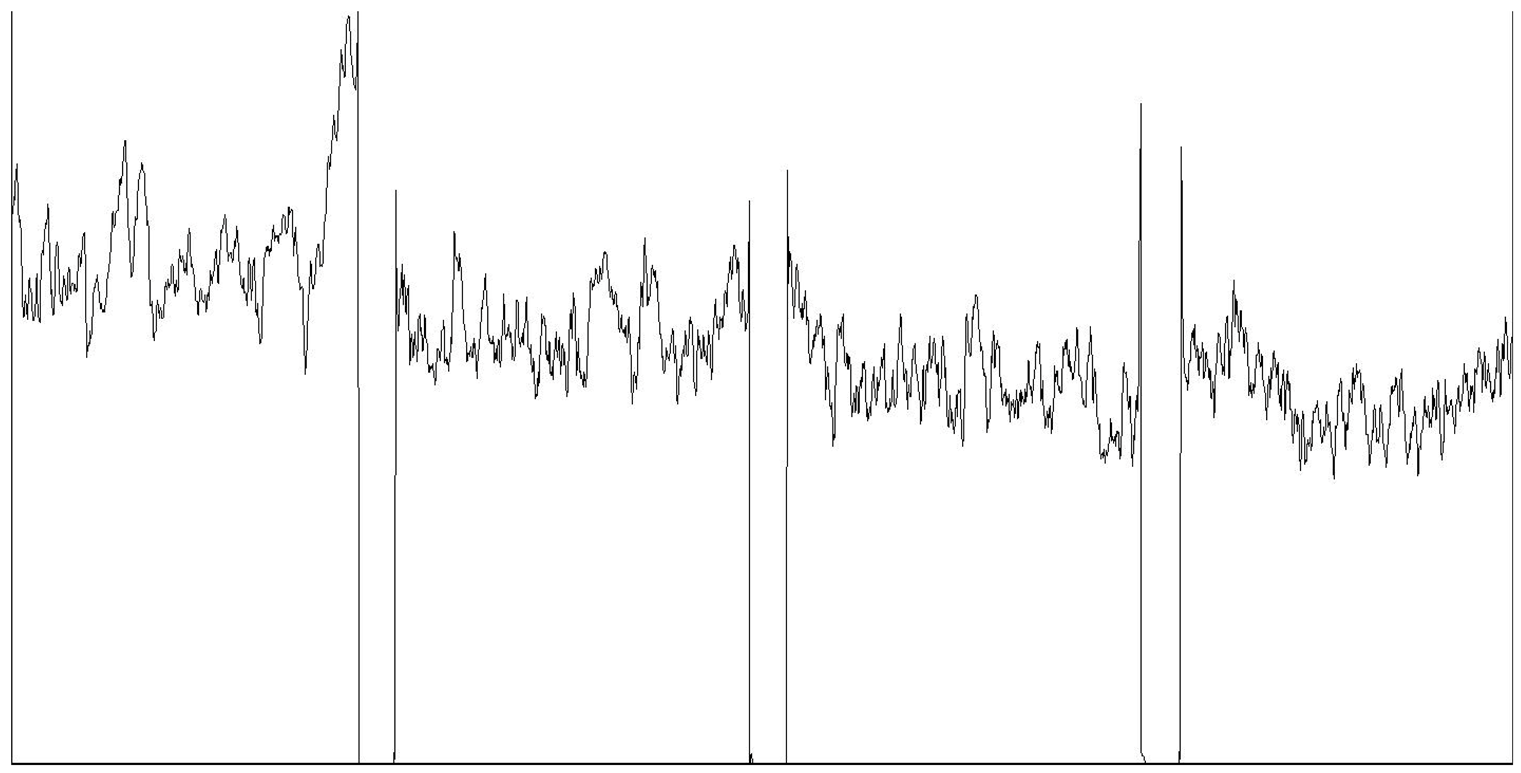 | |||
| Mean grayscale | 159,542 | 137,266 | 122,237 | 109,963 |
| T-01 (WD = 6.7 mm) | 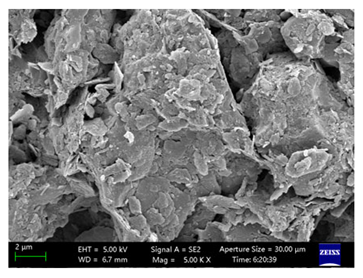 | 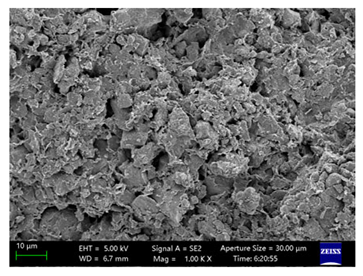 | 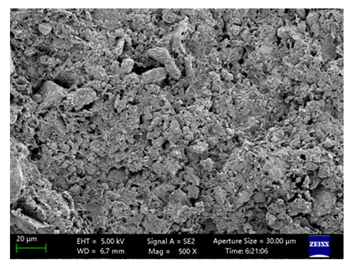 | 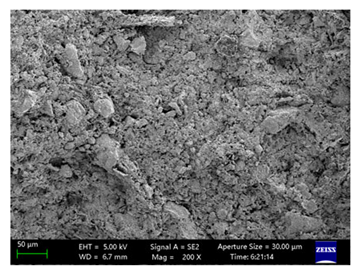 |
| Mean grayscale fluctuation | 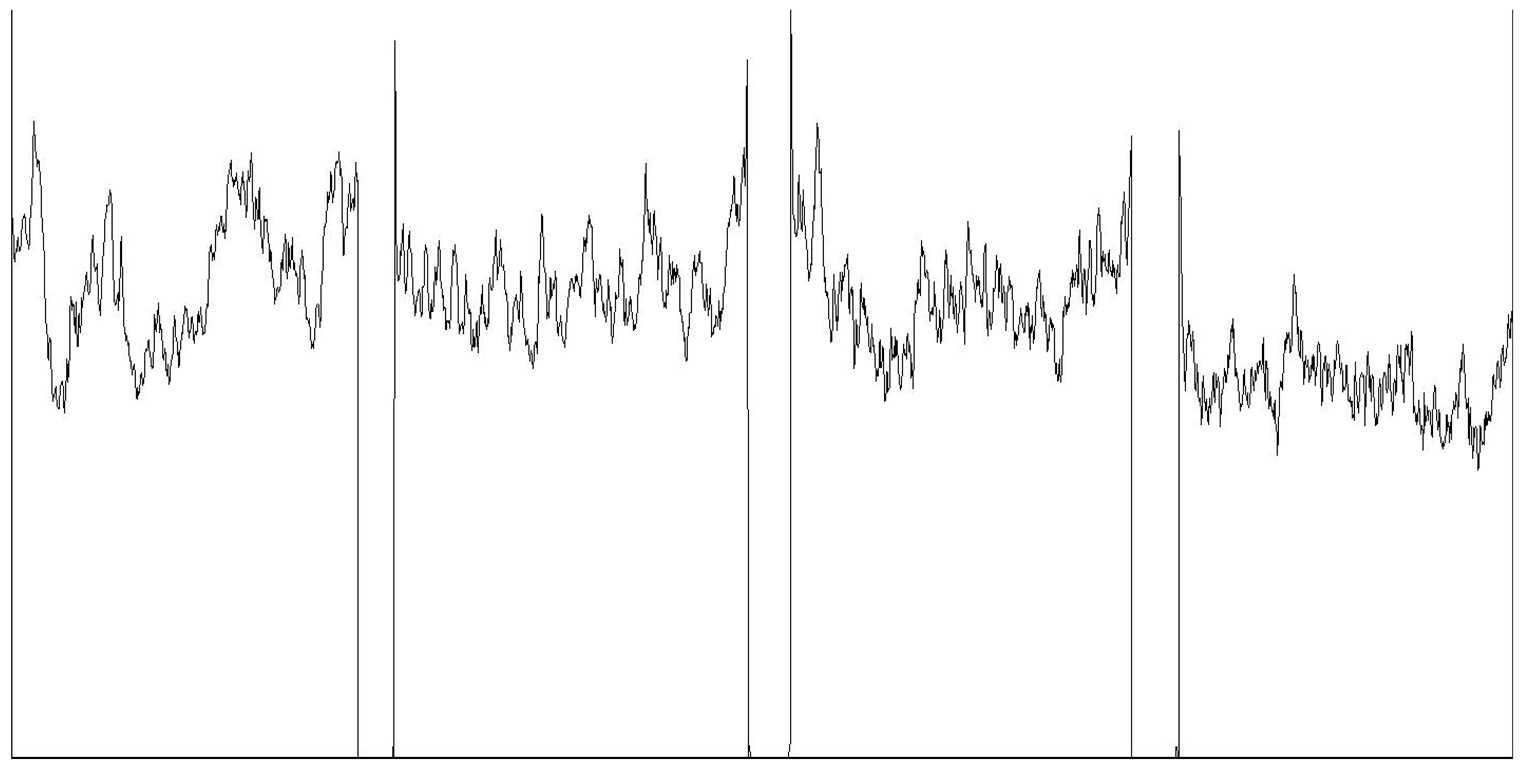 | |||
| Mean grayscale | 148,924 | 149,112 | 140,929 | 111,434 |
| T-02 (WD = 7.4 mm) | 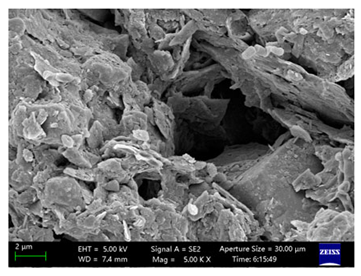 | 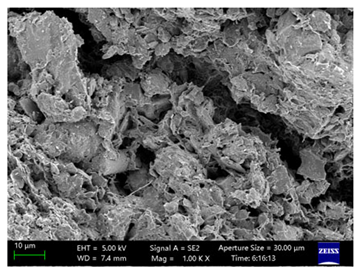 |  | 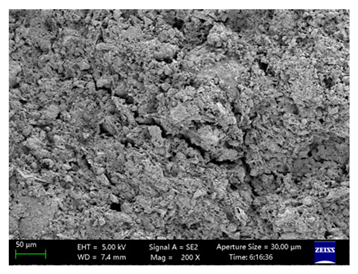 |
| Mean grayscale fluctuation | 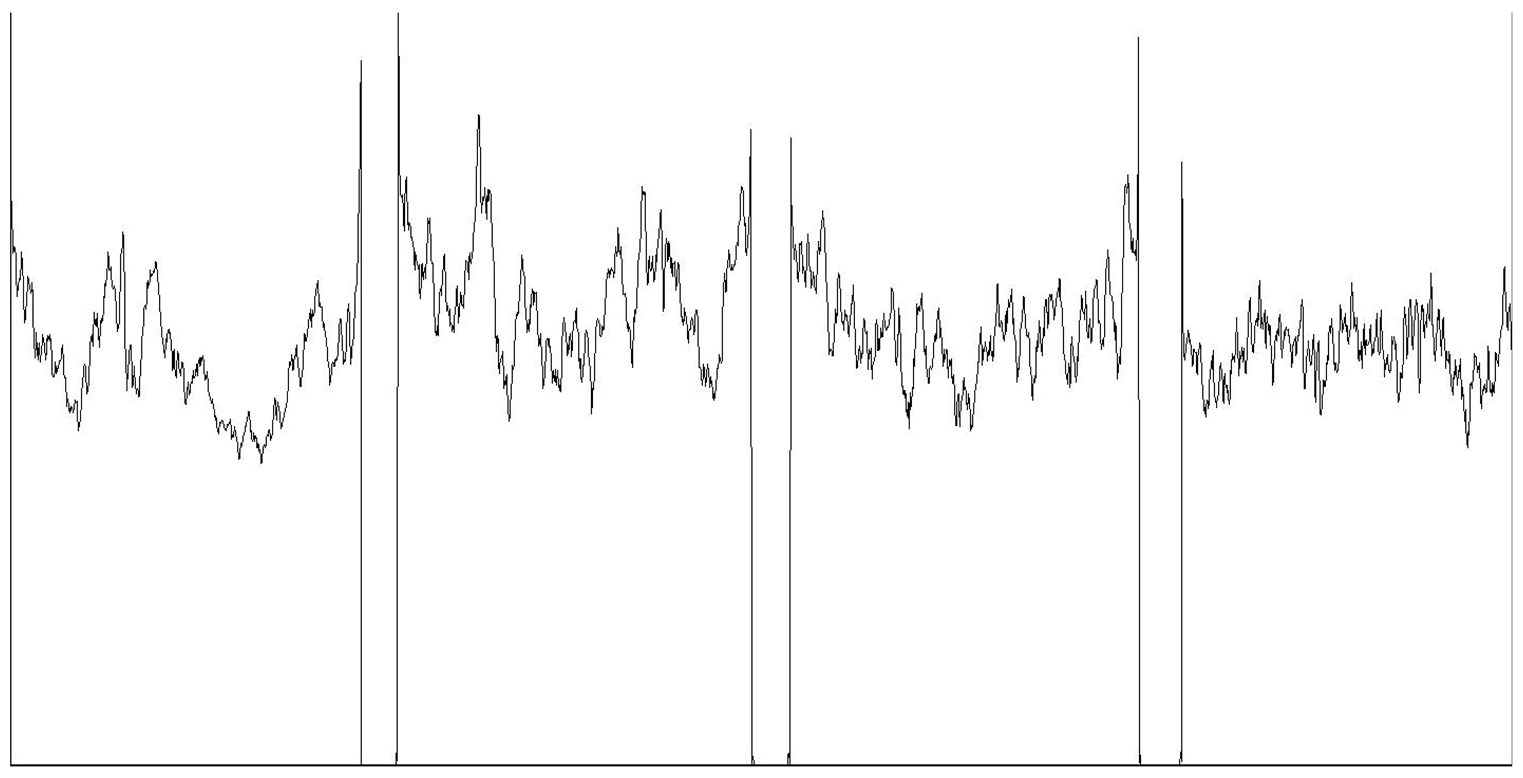 | |||
| Mean grayscale | 127,539 | 148,312 | 136,525 | 121,846 |
| T-02 (WD = 7.1 mm) | 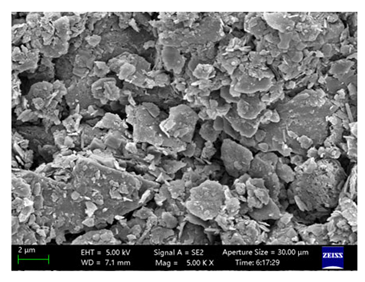 | 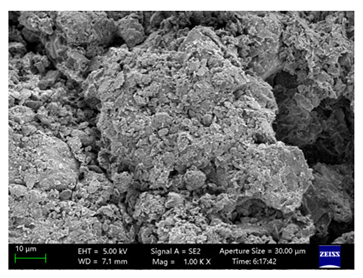 | 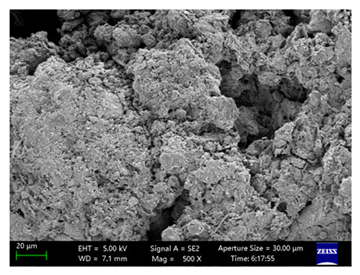 | 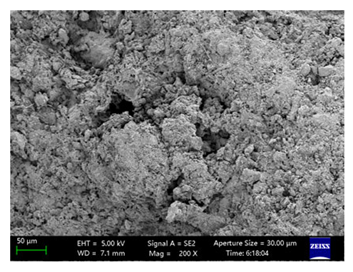 |
| Mean grayscale fluctuation | 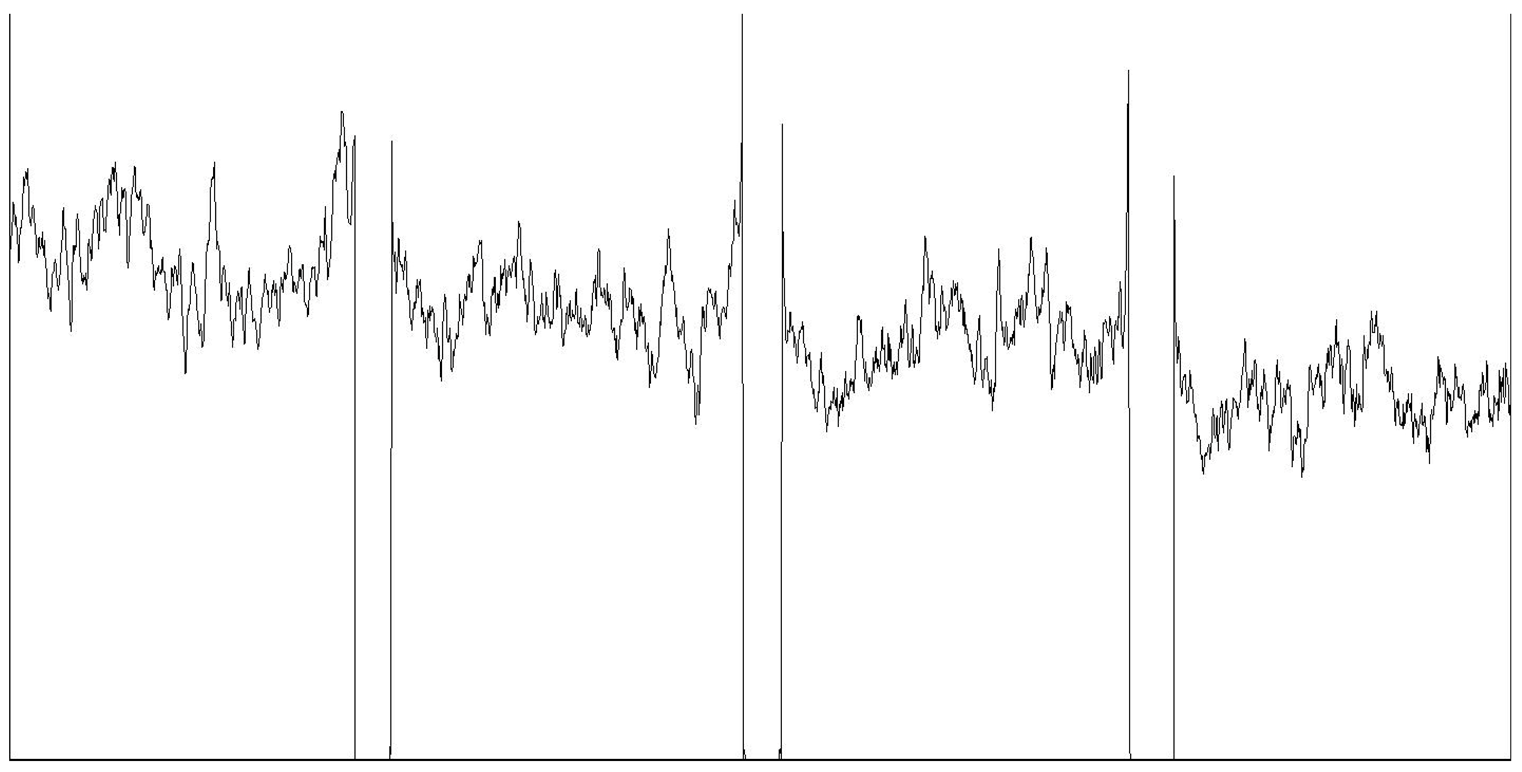 | |||
| Mean grayscale | 155,796 | 142,807 | 130,344 | 108,938 |
| Analytical: Element Analysis Result by Rigaku | ||||||||||||
|---|---|---|---|---|---|---|---|---|---|---|---|---|
| Sample designation: 25032224018 Sample Z-01 Red Brick (low degree of weathering) | Sample designation: 25032224018 Sample Z-02 Red Brick (high degree of weathering) | |||||||||||
| No. | Ele. | Result | D. limit | ESL. | Intensity | w/o N. | Ele. | Result | D. limit | ESL. | Intensity | w/o N. |
| The main element (mass%) | ||||||||||||
| 1 | O | 47.09 | 0.633 | O-KA | 1.773 | 35.318 | O | 43.95 | 0.569 | O-KA | 1.614 | 34.544 |
| 2 | Na | 0.90 | 0.010 | Na-KA | 2.131 | 0.674 | Na | 4.38 | 0.013 | Na-KA | 11.071 | 3.439 |
| 3 | Mg | 1.07 | 0.007 | Mg-KA | 8.321 | 0.805 | Mg | 1.11 | 0.007 | Mg-KA | 8.648 | 0.876 |
| 4 | Al | 10.97 | 0.006 | Al-KA | 190.77 | 8.232 | Al | 10.21 | 0.006 | Al-KA | 178.697 | 8.024 |
| 5 | Si | 28.59 | 0.007 | Si-KA | 417.964 | 21.446 | Si | 25.47 | 0.007 | Si-KA | 385.808 | 20.018 |
| 6 | P | 0.06 | 0.002 | P-KA | 1.261 | 0.042 | P | 0.05 | 0.002 | P-KA | 1.127 | 0.036 |
| 7 | S | 0.05 | 0.001 | S-KA | 1.005 | 0.035 | S | 0.04 | 0.001 | S-KA | 0.993 | 0.034 |
| 8 | Cl | 0.40 | 0.007 | Cl-KA | 1.894 | 0.241 | Cl | 3.84 | 0.015 | Cl-KA | 24.037 | 3.022 |
| 9 | K | 3.48 | 0.005 | K-KA | 85.59 | 2.607 | K | 3.40 | 0.005 | K-KA | 83.387 | 2.672 |
| 10 | Ca | 0.58 | 0.005 | Ca-KA | 3.249 | 0.431 | Ca | 1.11 | 0.006 | Ca-KA | 6.258 | 0.872 |
| 11 | Ti | 0.65 | 0.003 | Ti-KA | 5.404 | 0.49 | Ti | 0.62 | 0.005 | Ti-KA | 4.973 | 0.481 |
| 12 | Cr | 0.01 | 0.004 | Cr-KA | 0.31 | 0.011 | Cr | 0.01 | 0.003 | Cr-KA | 0.286 | 0.011 |
| 13 | Mn | 0.17 | 0.004 | Mn-KA | 5.189 | 0.126 | Mn | 0.08 | 0.003 | Mn-KA | 2.508 | 0.065 |
| 14 | Fe | 5.92 | 0.004 | Fe-KA | 278.659 | 4.434 | Fe | 5.51 | 0.004 | Fe-KA | 256.718 | 4.333 |
| The trace elements (mg/kg) | ||||||||||||
| 15 * | Co | 80 | 30.2 | Co-KA | 5427 | 60 | Pb | 86 | 36.3 | Pb-LBI | 9995 | 68 |
| 16 * | Ni | 87 | 18.7 | Ni-KA | 6372 | 65 | Ni | 67 | 18.7 | Ni-KA | 4987 | 53 |
| 17 * | Zn | 177 | 15.8 | Zn-KA | 22,166 | 133 | Cu | 41 | 16.5 | Cu-KA | 3905 | 33 |
| 18 * | Ga | 39 | 15.4 | Ga-KA | 5675 | 29 | Zn | 178 | 15.6 | Zn-KA | 22,683 | 140 |
| 19 * | As | 44 | 12.9 | As-KA | 9435 | 33 | Rb | 259 | 12 | Rb-KA | 10,149 | 203 |
| 20 * | Rb | 281 | 11.6 | Rb-KA | 10,812 | 211 | Sr | 248 | 12 | Sr-KA | 11,272 | 195 |
| 21 * | Sr | 169 | 11 | Sr-KA | 75,414 | 127 | Y | 31 | 12 | Y-KA | 5168 | 24 |
| 22 * | Y | 36 | 12 | Y-KA | 57,706 | 27 | Zr | 241 | 11 | Zr-KA | 17,526 | 189 |
| 23 * | Zr | 229 | 10.5 | Zr-KA | 158,257 | 172 | Ba | 855 | 197.6 | Ba-KA | 2071 | 672 |
| 24 * | W | 439 | 50.9 | W-LA | 15,936 | 329 | W | 281 | 52.4 | W-LA | 10,383 | 221 |
| Analytical: Oxidate Analysis Result by Rigaku | ||||||||||||
| Sample designation: 25032224018 Sample Z-01 Red Brick (low degree of weathering) | Sample designation: 25032224018 Sample Z-02 Red Brick (high degree of weathering) | |||||||||||
| No. | Ele. | Result | D. limit | ESL. | Intensity | w/o N. | Ele. | Result | D. limit | ESL. | Intensity | w/o N. |
| The main element (mass%) | ||||||||||||
| 1 | SiO2 | 60.91 | 0.015 | Si-KA | 417.964 | 45.822 | SiO2 | 54.21 | 0.015 | Si-KA | 385.808 | 42.771 |
| 2 | TiO2 | 1.08 | 0.005 | Ti-KA | 5.404 | 0.815 | TiO2 | 1.01 | 0.008 | Ti-KA | 4.973 | 0.799 |
| 3 | Al2O3 | 20.67 | 0.012 | Al-KA | 190.77 | 15.553 | Al2O3 | 19.21 | 0.012 | Mg-KA | 178.697 | 15.158 |
| 4 | MgO | 1.78 | 0.012 | Mg-KA | 8.321 | 1.335 | MgO | 1.84 | 0.012 | Mg-KA | 8.648 | 1.452 |
| 5 | CaO | 0.80 | 0.007 | Ca-KA | 3.249 | 0.601 | CaO | 1.54 | 0.009 | Ca-KA | 6.258 | 1.215 |
| 6 | MnO | 0.22 | 0.004 | Mn-KA | 5.189 | 0.162 | MnO | 0.11 | 0.004 | Mn-KA | 2.508 | 0.083 |
| 7 | Fe2O3 | 8.40 | 0.005 | Fe-KA | 278.659 | 6.318 | Fe2O3 | 7.82 | 0.006 | Fe-KA | 256.718 | 6.166 |
| 8 | Na2O | 1.21 | 0.014 | Na-KA | 2.131 | 0.909 | Na2O | 5.88 | 0.018 | Na-KA | 11.071 | 4.64 |
| 9 | K2O | 4.16 | 0.005 | K-KA | 85.59 | 3.132 | K2O | 4.07 | 0.006 | K-KA | 83.387 | 3.208 |
| 10 | P2O5 | 0.13 | 0.004 | P-KA | 1.261 | 0.095 | P2O5 | 0.10 | 0.003 | P-KA | 1.127 | 0.082 |
| 11 | Cl | 0.32 | 0.007 | Cl-KA | 1.894 | 0.241 | Cl | 3.82 | 0.015 | Cl-KA | 24.037 | 3.013 |
| The trace elements (mg/kg) | ||||||||||||
| 12 * | SO3 | 17 | 33.2 | S-KA | 10,049 | 885 | SO3 | 1067 | 32.7 | P-KA | 9933 | 842 |
| 13 * | Cr2O3 | 209 | 58.9 | Cr-KA | 3099 | 157 | Cr2O3 | 196 | 49.4 | Cr-KA | 2859 | 155 |
| 14 * | Co2O3 | 112 | 42.4 | Vo-KA | 5427 | 84 | NiO | 85 | 23.7 | Ni-KA | 4987 | 67 |
| 15 * | NiO | 110 | 23.7 | Ni-KA | 6372 | 83 | CuO | 51 | 20.6 | Cu-KA | 3905 | 41 |
| 16 * | ZnO | 219 | 19.6 | Zn-KA | 22,166 | 165 | ZnO | 220 | 19.3 | Zn-KA | 22,683 | 173 |
| 17 * | Ga2O3 | 52 | 20.7 | Ga-KA | 5675 | 39 | Rb2O | 280 | 13 | Rb-KA | 10,149.5 | 221 |
| 18 * | As2O3 | 57 | 17 | As-KA | 9435 | 43 | SrO | 290 | 13.6 | Sr-KA | 11,272.9 | 229 |
| 19 * | Rb2O | 306 | 12.6 | Rb-KA | 10,812.8 | 230 | Y2O3 | 39 | 15.5 | Y-KA | 51,682 | 31 |
| 20 * | SrO | 199 | 12.9 | Sr-KA | 75,414 | 150 | ZrO2 | 322 | 14.9 | Zr-KA | 175,264 | 254 |
| 21 * | Y2O3 | 45 | 15.2 | Y-KA | 57,706 | 34 | BaO | 947 | 219.7 | Br-LA | 2071 | 747 |
| 22 * | ZrO2 | 307 | 14.2 | Zr-KA | 158,257 | 231 | WO3 | 351 | 65.8 | W-KA | 10,383 | 277 |
| 23 * | WO3 | 549 | 64 | W-LA | 15,936 | 413 | Pb | 92 | 38.9 | Pb-LBI | 9995 | 73 |
| Analytical: Element Analysis Result by Rigaku | ||||||||||||
|---|---|---|---|---|---|---|---|---|---|---|---|---|
| Sample designation: 25032224018 Sample T-01 Clay Core (low degree of weathering) | Sample designation: 25032224018 Sample T-02 Clay Core (high degree of weathering) | |||||||||||
| No. | Ele. | Result | D. limit | ESL. | Intensity | w/o N. | Ele. | Result | D. limit | ESL. | Intensity | w/o N. |
| The main element (mass%) | ||||||||||||
| 1 | O | 49.10 | 0.599 | O-KA | 1.896 | 37.551 | O | 48.10 | 0.647 | O-KA | 1.834 | 37.093 |
| 2 | Na | 1.70 | 0.011 | Na-KA | 4.225 | 1.297 | Na | 2.53 | 0.012 | Na-KA | 6.358 | 1.95 |
| 3 | Mg | 0.56 | 0.007 | Mg-KA | 4.498 | 0.428 | Mg | 0.54 | 0.007 | Mg-KA | 4.349 | 0.42 |
| 4 | Al | 11.54 | 0.007 | Al-KA | 210.583 | 8.825 | Al | 11.35 | 0.006 | Al-KA | 206.087 | 8.751 |
| 5 | Si | 27.00 | 0.007 | Si-KA | 408.626 | 20.651 | Si | 26.27 | 0.007 | Si-KA | 398.829 | 20.261 |
| 6 | P | 0.08 | 0.002 | P-KA | 1.986 | 0.064 | P | 0.82 | 0.002 | P-KA | 1.996 | 0.064 |
| 7 | S | 0.21 | 0.002 | S-KA | 4.667 | 0.159 | S | 0.35 | 0.002 | S-KA | 7.968 | 0.271 |
| 8 | Cl | 1.82 | 0.01 | Cl-KA | 11.132 | 1.391 | Cl | 2.44 | 0.011 | Cl-KA | 15.071 | 1.884 |
| 9 | K | 2.87 | 0.004 | K-KA | 71.501 | 2.196 | K | 2.91 | 0.004 | K-KA | 72.123 | 2.242 |
| 10 | Ca | 0.77 | 0.005 | Ca-KA | 4.446 | 0.586 | Ca | 0.95 | 0.005 | Ca-KA | 5.478 | 0.732 |
| 11 | Ti | 0.54 | 0.007 | Ti-KA | 4.573 | 0.414 | Cr | 0.04 | 0.006 | Cr-KA | 1.597 | 0.425 |
| 12 | Cr | 0.01 | 0.004 | Cr-KA | 0.308 | 0.011 | Mn | 3.73 | 0.004 | Mn-KA | 1.171 | 0.028 |
| 13 | Mn | 0.03 | 0.003 | Mn-KA | 1.096 | 0.026 | Fe | 0.01 | 0.003 | Fe-KA | 183.21 | 2.875 |
| 14 | Fe | 3.63 | 0.003 | Fe-KA | 180.518 | 2.774 | Ni | 0.01 | 0.002 | Ni-KA | 0.496 | 0.005 |
| The trace elements (mg/kg) | ||||||||||||
| 15 * | Cu | 36 | 15.5 | Cu-KA | 3854 | 27 | Cu | 36 | 16.1 | Cu-KA | 3845 | 28 |
| 16 * | Zn | 109 | 14.1 | Zn-KA | 15,921 | 84 | Zn | 131 | 14.3 | Zn-KA | 18,772 | 101 |
| 17 * | As | 0 | 18 | As-KA | 10,477 | 0 | As | 0 | 18.3 | As-KA | 10,740 | 0 |
| 18 * | Rb | 243 | 10.3 | Rb-KA | 11,040.4 | 186 | Br | 27 | 11.2 | Br-KA | 9232 | 21 |
| 19 * | Sr | 147 | 9.9 | Sr-KA | 77,575 | 112 | Rb | 231 | 10.7 | Rb-KA | 104,127 | 178 |
| 20 * | Y | 26 | 10.5 | Y-KA | 55,914 | 20 | Sr | 149 | 10.1 | Sr-KA | 77,018 | 115 |
| 21 * | Zr | 265 | 9 | Zr-KA | 211,458 | 203 | Y | 42 | 10.4 | Y-KA | 61,741 | 33 |
| 22 * | Nb | 44 | 8.7 | Nb-KA | 35,156 | 33 | Zr | 282 | 9.1 | Zr-KA | 219,914 | 217 |
| 23 * | I | 358 | 70.4 | I-KA | 56,843 | 274 | Nb | 27 | 9 | Nb-KA | 24,010 | 21 |
| 24 * | Pb | 99 | 31.4 | Pb-LBI | 13,282 | 76 | Ba | 646 | 234.3 | Ba-KA | 1605 | 498 |
| 25 * | -- | -- | -- | -- | -- | -- | Pb | 106 | 31.6 | Pb-LBI | 13,952 | 82 |
| Analytical: Oxidate Analysis Result by Rigaku | ||||||||||||
|---|---|---|---|---|---|---|---|---|---|---|---|---|
| Sample designation: 25032224018 Sample T-01 Clay Core (low degree of weathering) | Sample designation: 25032224018 Sample T-02 Clay Core (high degree of weathering) | |||||||||||
| No. | Ele. | Result | D. limit | ESL. | Intensity | w/o N. | Ele. | Result | D. limit | ESL. | Intensity | w/o N. |
| The main element (mass%) | ||||||||||||
| 1 | SiO2 | 60.08 | 0.015 | Si-KA | 408.626 | 44.56 | SiO2 | 58.06 | 0.015 | Al-KA | 398.829 | 43.661 |
| 2 | TiO2 | 0.96 | 0.012 | Ti-KA | 4.573 | 0.71 | TiO2 | 0.97 | 0.011 | Ti-KA | 4.597 | 0.727 |
| 3 | Al2O3 | 22.46 | 0.012 | Al-KA | 210.583 | 16.658 | Al2O3 | 21.98 | 0.012 | Al-KA | 206.087 | 16.526 |
| 4 | MgO | 0.95 | 0.011 | Mg-KA | 4.498 | 0.706 | MgO | 0.92 | 0.012 | Mg-KA | 4.349 | 0.693 |
| 5 | CaO | 1.14 | 0.007 | Ca-KA | 4.446 | 0.843 | CaO | 1.40 | 0.007 | Ca-KA | 5.478 | 1.048 |
| 6 | MnO | 0.05 | 0.004 | Mn-KA | 1.096 | 0.035 | Fe2O3 | 5.62 | 0.005 | Fe-KA | 183.21 | 4.225 |
| 7 | Fe2O3 | 5.52 | 0.005 | Fe-KA | 180.518 | 4.095 | NiO | 0.01 | 0.002 | Ni-KA | 0.496 | 0.006 |
| 8 | Na2O | 2.34 | 0.014 | Na-KA | 4.225 | 1.735 | Na2O | 3.47 | 0.016 | Na-KA | 6.358 | 2.611 |
| 9 | K2O | 3.65 | 0.005 | K-KA | 71.501 | 2.71 | K2O | 3.66 | 0.005 | K-KA | 72.123 | 2.756 |
| 10 | P2O5 | 0.20 | 0.004 | P-KA | 1.986 | 0.149 | P2O5 | 0.20 | 0.004 | P-KA | 1.996 | 0.148 |
| 11 | SO3 | 0.55 | 0.004 | S-KA | 4.667 | 0.406 | SO3 | 0.91 | 0.004 | S-KA | 7.968 | 0.688 |
| 12 | CI | 1.92 | 0.01 | Cl-KA | 11.132 | 1.422 | CI | 2.55 | 0.012 | Cl-KA | 15.071 | 1.918 |
| The trace elements (mg/kg) | ||||||||||||
| 13 * | Cr2O3 | 218 | 56.3 | Cr-KA | 3083 | 161 | Cr2O3 | 500 | 46.7 | Mn-KA | 11,706 | 376 |
| 14 * | CuO | 48 | 20.2 | Cu-KA | 3854 | 36 | CuO | 48 | 20.9 | Cu-KA | 3845 | 36 |
| 15 * | ZnO | 146 | 18.2 | Zn-KA | 15,921 | 108 | ZnO | 173 | 18.4 | Zn-KA | 18,772 | 130 |
| 16 * | As2O3 | 0 | 25.5 | As-KA | 10,477 | 0 | As2O3 | 0 | 25.6 | As-KA | 10,740 | 0 |
| 17 * | Rb2O | 285 | 11.7 | Rb-KA | 11,040.4 | 211 | Br | 29 | 11.6 | Br-KA | 9232 | 22 |
| 18 * | SrO | 186 | 12.2 | Sr-KA | 77,575 | 138 | Rb2O | 268 | 12.1 | Rb-KA | 104,127 | 201 |
| 19 * | Y2O3 | 33 | 13.9 | Y-KA | 55,914 | 24 | SrO | 186 | 12.3 | Sr-KA | 77,018 | 140 |
| 20 * | ZrO2 | 383 | 12.6 | Zr-KA | 211,458 | 284 | Y2O3 | 55 | 13.7 | Y-KA | 61,741 | 41 |
| 21 * | Nb2O5 | 67 | 12.9 | Nb-KA | 35,156 | 50 | ZrO2 | 402 | 12.8 | Zr-KA | 219,914 | 303 |
| 22 * | I | 382 | 72.9 | I-KA | 56,843 | 283 | Nb2O5 | 41 | 13.3 | Nb-KA | 24,010 | 31 |
| 23 * | PbO | 114 | 35.1 | Pb-LBI | 13,282 | 85 | BaO | 758 | 268 | Ba-LA | 1605 | 570 |
| 24 * | -- | -- | -- | -- | -- | -- | PbO | 121 | 35.1 | Pb-LBI | 13,952 | 91 |
References
- Huang, X. Cleverly Cut and Fine Sticky: Appreciation of Wang Baoyuan’s Sticky Sculpture Works; Cultural Assets Bureau: Taiwan, China, 2010. [Google Scholar]
- Lu, E.; Lu, H. Preliminary report on the model test of hollow brick wall. J. South China Inst. Technol. 1957, 1, 63–72. [Google Scholar]
- Li, K.; Sun, J.K.; Wang, S.P.; Wang, C.; Pan, H.Q. Experimental study on compressive strength of high titanium slag concrete hollow block walls. Sichuan Archit. 2019, 39, 261–263. [Google Scholar]
- Nan, J. Study on Reinforcement and Seismic Performance of Cavity Walls’ Housing. J. Archit. Res. Dev. 2023, 1, 7–8. [Google Scholar] [CrossRef]
- Thenmozhi, R.; Saranya, K. Study on Compressive Strength of Reinforced and Cavity Wall Brickwork. IOP Conf. Ser. Earth Environ. Sci. 2022, 1086, 12048. [Google Scholar] [CrossRef]
- Zhu, B.; Wu, M.; Jiang, Z. Experimental Study on the Basic Behavior of Brick Masonry Under Cyclic Loading. J. Tongji Univ. 1980, 2, 1–14. [Google Scholar]
- Romina, S.; Marco, C.; Alberto, B.; Di Ludovico, M.; Prota, A.; Speranzini, E.; Molinari, A. Analysis of the seismic vulnerability and innovative retrofit solutions of cavity brickwork walls. Constr. Build. Mater. 2023, 409, 134018. [Google Scholar] [CrossRef]
- Zhou, T.; Tian, P.; Deng, M.; Zhao, X.; Liang, Z. Research on shaking table test of cavity-wall building strengthened with engineered cementitious composite. J. Build. Struct. 2018, 39, 147–152. [Google Scholar]
- Argentina, O.; Jesus, H.; Kathia, A. The Effect of a Segmented Wall Filled with PCM on Heat Transfer and Airflow in a Closed Cavity. J. Heat Transf. 2021, 143, 93001. [Google Scholar]
- Deng, J.R. Study on the Mechanical Behavior and Microscopic Characteristics of Microbial Remediation of Rock Materials. Ph.D. Thesis, Central South University, Changsha, China, 2023. Available online: https://oversea.cnki.net/KCMS/detail/detail.aspx?dbcode=CDFD&dbname=CDFDLAST2024&filename=1024367415.nh&uniplatform=OVERSEA&v=xxILHkb5uLlZV2YR9B-IF5dosD72YAit7cAJ8PR2psEtkFzsrN543eujKbG6l7wR (accessed on 8 June 2025).
- D’Ayala, D.; Zhu, H.; Aktas, Y. The Impact of Wind-Driven Rain on Surface Waterproofed Brick Cavity Walls. Buildings 2024, 14, 447. [Google Scholar] [CrossRef]
- Mehmood, T.; Abid, M.A.; Chatveera, B.; Sua-Iam, G.; Saingam, P.; Ejaz, A.; Hussain, Q.; Joyklad, P.; Suparp, S. Sustainable Reinforcement Methods for Brick Masonry Walls: An Experimental and Finite Element Analysis Approach. Buildings 2025, 15, 2180. [Google Scholar] [CrossRef]
- Wang, T.; Ma, J.; Zhang, W.; Wei, S.W. Feasibility of a Local Enclosure Structure Approach, Adaptability, and Promotion: Empty Bucket Walls in Jinhua and Wenzhou, Zhejiang Province. Small Town Constr. 2005, 4, 56–57. [Google Scholar]
- Hou, L.; Liu, Y.; Zhu, Y.; Zhao, X.; Yang, L. Thermal performance of cavity masonry walls and thermal design investigation in Western China. Energy 2024, 292, 130298. [Google Scholar] [CrossRef]
- Lai, S.; Zheng, Z. Traditional masonry techniques of Minnan red bricks and their inspiration. Huazhong Archit. 2007, 2, 154–157. [Google Scholar]
- Wang, Y.J.; Song, J.X.; Zhang, J.H.; Huang, Y.; Yang, S. Analysis of Rammed Earth Wall Erosion in Traditional Village Dwellings in Zhuhai City. Coatings 2025, 15, 526. [Google Scholar] [CrossRef]
- Wang, X.P.; Fang, K.; Chen, L.; Furuya, N. The influence of atrium types on the consciousness of shared space in amalgamated traditional dwellings—A case study on traditional dwellings in Quanzhou City, Fujian Province, China. J. Asian Archit. Build. Eng. 2019, 18, 335–350. [Google Scholar] [CrossRef]
- Yang, S.; Chen, Y.; Lin, X. Analysis of characteristics of climate change and agricultural disastrous weatherin Jinjiang City over the past 50 years. Fujian Agric. Sci. Technol. 2017, 1, 9–14. [Google Scholar] [CrossRef]
- Liu, R.; Gao, W.; Yang, F. Authenticity, Integrity, and Cultural–Ecological Adaptability in Heritage Conservation: A Practical Framework for Historic Urban Areas—A Case Study of Yicheng Ancient City, China. Buildings 2025, 15, 1304. [Google Scholar] [CrossRef]
- Schroeder, A.B.; Dobson, E.T.A.; Rueden, C.T.; Tomancak, P.; Jug, F.; Eliceiri, K.W. The ImageJ Ecosystem: Open-source Software for Image Visualization, Processing, and Analysis. Protein Sci. 2021, 30, 234–249. [Google Scholar] [CrossRef]
- Zhang, L.; Chen, Y.; Zheng, L.; Zheng, R. Research on the Composition and Casting Technology of Bronze Arrowheads Unearthed from the Ruins of the Imperial City of the Minyue Kingdom. Materials 2025, 18, 402. [Google Scholar] [CrossRef]
- Kabekkodu, S.; Blanton, T. Importance of powder diffraction raw data archival in a curated database for materials science applications. Acta Crystallogr. Sect. B Struct. Sci. Cryst. Eng. Mater. 2024, 80, 364–369. [Google Scholar] [CrossRef]
- Shen, J.; Zhang, Z. Influence of firing temperatures on the physical and mechanical properties of red bricks. Sci. Conserv. Archaeol. 2019, 31, 105–111. [Google Scholar]
- Zhen, L. The Traditional Firing Craft of Red Brick Kiln in South Fujian. Chin. J. Hist. Sci. Technol. 2005, 3, 249–256. [Google Scholar]
- Toufigh, V.; Ghasemalizadeh, S.; Mhkaramian, M.K. Experimental Investigation of Mixture Design and Durability Performance of Alkali-Activated Rammed Earth. Int. J. Geomech. 2022, 22, 4022029. [Google Scholar] [CrossRef]
- Han, W.; Gong, R.; Liu, Y.; Gao, Y. Influence mechanism of salt erosion on the earthen heritage site wall in Pianguan Bastion. Case Stud. Constr. Mater. 2022, 17, e01388. [Google Scholar] [CrossRef]
- Yi, Z.; Fu, L.J.; Zhan, S.; Yang, H.; Tang, A.; Jiang, T. Substitutional Doping for Aluminosilicate Mineral and Superior Water Splitting Performance. Nanoscale Res. Lett. 2017, 12, 456. [Google Scholar] [CrossRef]
- Hua, J.; Jia, Y.G.; Lv, Y.; Yang, X.; Gao, Y.; Sun, Y.C.; Shang, J.Y.; Yan, X.L. Co-transport and influence mechanism of hematite colloids and Cr(Ⅵ)in saturated porous media under acidic conditions. Environ. Chem. 2024, 43, 3845–3853. [Google Scholar] [CrossRef]
- SY/T 5163-2010; Method for X-Ray Diffraction Analysis of Clay Minerals and Common Non Clay Minerals in Sedimentary Rocks. National Energy Administration: Beijing, China, 2010. Available online: https://oversea.cnki.net/KCMS/detail/detail.aspx?dbcode=SCSD&dbname=SCSD&filename=SCSD000006151917&uniplatform=OVERSEA&v=Oph4xQC-wrVy3DBnmOhA9_Ce5kn6OqFNkd2dHkKx8Wfjq7awTg7D22yIkuAgASqOZiY3riBzqXo%3d (accessed on 8 June 2025).
- He, H.; Guo, L.; Xie, X.; Peng, J. Experimental studies on the selective adsorption of cu2+,pb2+,zn2+,cd2+,cr3+ ions on montmorillonite, illite and kaolinite and the influence of medium conditions. Acta Mineral. Sin. 1999, 2, 231–235. [Google Scholar]
- Wang, J. Chemical weathering mechanism of Albite-rich rocks in Grottoes under an acidic environment: An atomistic view from ReaxFF simulation. Comput. Mater. Sci. 2022, 211, 111498. [Google Scholar] [CrossRef]
- Jin, Z.L.; Liu, D.D.; Zhang, Y.K.; Chen, G.Q.; Xia, Y.; Su, B.; Zhou, T.; Lv, G.X.; Luo, H.J. Salt migrations and damage mechanism in cultural heritage objects. Sci. Conserv. Archaeol. 2017, 29, 102–116. [Google Scholar]
- Lin, M.; Roders, A.P.; Nevzgodin, I.; de Jonge, W. Values and interventions: Dynamic relationships in international doctrines. J. Cult. Herit. Manag. Sustain. Dev. 2025, 15, 728–749. [Google Scholar] [CrossRef]
- GB 50003-2011; Code for Design of Masonry Structures. General Administration of Quality Supervision, Inspection and Quarantine: Beijing, China, 2011.


| Material | Elastic Modulus | Poisson’s Ratio | Shear Modulus | Mass Density | Yield Strength |
|---|---|---|---|---|---|
| Unit | MPa | (μ) | N/m2 | kg/m3 | N/m2 |
| Red brick | 1300 | 0.2 | 5.15 × 10⁸ | 2100 | 107 |
| Clay core | 100 | 0.3 | 3.81 × 10⁷ | 1600 | 105 |
| No. of Observations | Mag (KX) | Z-01 | Z-02 | T-01 | T-02 |
|---|---|---|---|---|---|
| 1 | 5 | 109,124 | 159,747 | 149,542 | 127,539 |
| 2 | 1 | 131,942 | 158,001 | 137,266 | 148,312 |
| 3 | 0.5 | 114,391 | 154,923 | 122,237 | 136,525 |
| 4 | 0.2 | 96,865 | 119,649 | 109,963 | 121,846 |
| 5 | 5 | 129,237 | 152,001 | 148,924 | 155,796 |
| 6 | 1 | 115,287 | 145,134 | 149,112 | 142,807 |
| 7 | 0.5 | 123,102 | 145,394 | 140,929 | 130,344 |
| 8 | 0.2 | 127,889 | 112,821 | 111,434 | 108,938 |
| Average value | 118,480 | 143,459 | 133,676 | 134,013 | |
| No. | Kaolinite | Chlorite | Illite | Amphibole | Gypsum | Quartz | K-Feldspar | Plagioclase | Mullite | Halite | Hematite | A.ph. |
|---|---|---|---|---|---|---|---|---|---|---|---|---|
| Z-01 | / | / | 1.7 | / | / | 27.6 | 9.0 | / | 6.5 | 0.5 | 3.1 | 51.6 |
| Z-02 | / | / | 3.0 | / | / | 32.8 | 14.5 | / | / | 1.3 | 2.9 | 45.5 |
| T-01 | 32.8 | 3.7 | 11.2 | / | / | 46.5 | 2.2 | 3.6 | / | / | / | / |
| T-02 | 32.0 | 3.6 | 10.9 | 0.5 | 0.5 | 44.9 | 2.2 | 5.4 | / | / | / | / |
| No. | Oxidate | Z-01 | Z-02 | T-01 | T-02 |
|---|---|---|---|---|---|
| 1 | SiO2 | 60.91 | 54.21 | 60.08 | 58.06 |
| 2 | Na2O + K2O | 5.37 | 9.95 | 5.99 | 7.14 |
| 3 | K2O-Al2O3-CaO + Na2O | 30.42 | 3430 | 36.69 | 37.70 |
| Note | Al2O3 | 20.67 | 19.21 | 22.46 | 21.98 |
Disclaimer/Publisher’s Note: The statements, opinions and data contained in all publications are solely those of the individual author(s) and contributor(s) and not of MDPI and/or the editor(s). MDPI and/or the editor(s) disclaim responsibility for any injury to people or property resulting from any ideas, methods, instructions or products referred to in the content. |
© 2025 by the authors. Licensee MDPI, Basel, Switzerland. This article is an open access article distributed under the terms and conditions of the Creative Commons Attribution (CC BY) license (https://creativecommons.org/licenses/by/4.0/).
Share and Cite
Ding, Y.; Guan, R.; Chen, L.; Wang, J.; Zhang, Y.; Fu, Y.; Zhang, C. Durability Analysis of Brick-Faced Clay-Core Walls in Traditional Residential Architecture in Quanzhou, China. Coatings 2025, 15, 909. https://doi.org/10.3390/coatings15080909
Ding Y, Guan R, Chen L, Wang J, Zhang Y, Fu Y, Zhang C. Durability Analysis of Brick-Faced Clay-Core Walls in Traditional Residential Architecture in Quanzhou, China. Coatings. 2025; 15(8):909. https://doi.org/10.3390/coatings15080909
Chicago/Turabian StyleDing, Yuhong, Ruiming Guan, Li Chen, Jinxuan Wang, Yangming Zhang, Yili Fu, and Canjin Zhang. 2025. "Durability Analysis of Brick-Faced Clay-Core Walls in Traditional Residential Architecture in Quanzhou, China" Coatings 15, no. 8: 909. https://doi.org/10.3390/coatings15080909
APA StyleDing, Y., Guan, R., Chen, L., Wang, J., Zhang, Y., Fu, Y., & Zhang, C. (2025). Durability Analysis of Brick-Faced Clay-Core Walls in Traditional Residential Architecture in Quanzhou, China. Coatings, 15(8), 909. https://doi.org/10.3390/coatings15080909