Article

Evaluation of Integral and Surface Hydrophobic Modification on Permeation Resistance of Foam Concrete

1
Zhejiang Agricultural Business Colloge, Shaoxing 312000, China
2
School of Civil Engineering, Shaoxing University, Shaoxing 312000, China
*
Author to whom correspondence should be addressed.
Coatings 2025, 15(7), 854; https://doi.org/10.3390/coatings15070854 (registering DOI)
Submission received: 19 June 2025 / Revised: 10 July 2025 / Accepted: 18 July 2025 / Published: 20 July 2025
(This article belongs to the Special Issue Novel Cleaner Materials for Pavements)

Abstract

To investigate the impermeability of foam concrete in various challenging environments, this study evaluates its water resistance by measuring the water contact angle and water absorption. Polyurethane (PU) was used to fabricate polyurethane foam concrete (PFC), enabling a monolithic hydrophobic modification to improve the permeation performance of foam concrete. The study also examines the effects of carbonation and freeze–thaw environments on the permeation resistance of PFC. Graphene oxide (GO), KH-550, and a composite hydrophobic coating (G/S) consisting of GO and KH-550 were employed to enhance the permeation resistance of PFC through surface hydrophobic modification. The functionality of the G/S composite hydrophobic coating was confirmed using energy dispersive X-ray spectrometry (EDS) and Fourier transform infrared spectroscopy (FTIR). The results showed the following: (1) The water contact angle of PFC increased by 20.2° compared to that of ordinary foam concrete, indicating that PU-based hydrophobic modification can significantly improve its impermeability. (2) After carbonation, a micro–nano composite structure resembling the surface of a lotus leaf developed on the surface of PFC, further enhancing its impermeability. However, freeze–thaw cycles led to the formation and widening of microcracks in the PFC, which compromised its hydrophobic properties. (3) Surface hydrophobic modifications using GO, KH-550, and the G/S composite coating improved the anti-permeability properties of PFC, with the G/S composite showing the most significant enhancement. (4) GO filled the tiny voids and pores on the surface of the PFC, thereby improving its anti-permeability properties. KH-550 replaced water on the surface of PFC and encapsulated surface particles, orienting its R-groups outward to enhance hydrophobicity. The G/S composite emulsion coating formed a hydrophobic silane layer inside the concrete, which enhanced water resistance by blocking water penetration, reducing microscopic pores in the hydrophobic layer, and improving impermeability characteristics.

1. Introduction

Lightweight foam concrete offers benefits such as low deadweight, effective acoustic and thermal insulation, and ease of construction [1], and it has a wide range of application scenarios. However, foam concrete has a porous structure and is hydrophilic [2]. This hydrophilic and porous nature facilitates water penetration into the concrete structure. The primary mechanisms for water migration and transport include capillary adsorption [3], concentration-driven diffusion [4], and pressure-driven infiltration [5]. Various ions contained in water are corrosive to concrete structures [6]. For example, chloride ions, sulfate ions, and carbonate ions can invade the concrete through capillaries, leading to corrosion or carbonation of steel reinforcement. Consequently, addressing the issue of external water penetration into the interior of concrete to improve its durability is a pressing concern.
Common methods to reduce concrete permeability include decreasing the porosity of the cementitious material. This can be achieved by lowering the water–cement ratio or by incorporating supplementary cementitious materials to enhance densification [7], and, secondly, by introducing fine and unconnected air bubbles. However, these methods have limited effectiveness in reducing permeability. Increasing the total amount of cementitious materials and decreasing the water–cement ratio can adversely impact the fluidity of the concrete mix, making the concrete more difficult to work with and potentially affecting its overall performance. On the other hand, the hydrophobic modification of concrete is an effective treatment to prevent moisture penetration. There are two types of hydrophobic modification: integral modification and surface hydrophobic modification [8]. Integral modification entails incorporating hydrophobic substances into foam concrete to improve its properties, which is then hardened to achieve overall hydrophobicity. Surface hydrophobic modification involves applying a hydrophobic treatment to the surface of hardened foam concrete, enhancing its water resistance and durability. The hydrophobic material is usually attached to the surface and penetrates into the foam concrete interior through coating or impregnation. Standard penetration test measurements include the Karsten tube method [9], water contact angle measurements [10], and hydrophobic mass tests [11].
Overall hydrophobic modification can be achieved by using foaming agents with hydrophobic properties, which not only provide a foaming function but also improve impermeability. Among these foaming agents, the polyurethane (PU) foaming agent exhibits a good hydrophobic effect [12]. The use of PU as a blowing agent not only reduces environmental pollution caused by commonly used blowing agents such as aluminum powder [13,14] and hydrogen peroxide [15,16], but also results in PU foam that is lighter compared to aluminum powder and hydrogen peroxide [17,18]. Additionally, PU foam offers more flexibility [19], waterproofing [20], high thermal stability [21], and a short molding time [22], making it suitable for various engineering structures. Polyurethane foam concrete (PFC) is prepared by a physical foaming method, where PU is added to a preconfigured base mixture to form an integral cellular hydrophobic structure within the concrete.
Environmental changes significantly impact the mechanical properties of foam concrete. Studies show that carbonation processes can enhance these properties, improving the concrete’s overall performance [23]. On the other hand, freeze–thaw cycles are known to negatively affect the mechanical properties of concrete, leading to deterioration over time [24]. The dynamic elastic modulus of concrete increases with prolonged carbonation but decreases as the number of freeze–thaw cycles increases. The increase in dynamic elastic modulus after carbonation can be attributed to the growth of CaCO3 crystals and geopolymers, which fill the pores and cracks in the concrete. Conversely, freeze–thaw cycles exacerbate crack development, weakening the concrete’s structure. Currently, studies on how carbonation and freeze–thaw cycles affect concrete’s permeability resistance are lacking. Therefore, researching the impact of environmental factors on the permeability resistance of PFC is significantly important.
Silane emulsions are commonly used for the surface hydrophobic modification of concrete [25]. They have a good waterproofing effect because the small molecular size of silane molecules allows them to penetrate deeply into the micropores of concrete [26]. In the wet environment of concrete, silane molecules hydrolyze to produce silanol groups [27], which undergo condensation reactions with silicates to form a silica–oxygen bonding structure with strong hydrophobicity. In external environments, the volatilization and infiltration of silane emulsion can create tiny pores within the hydrophobic layer, allowing water vapor to penetrate the concrete and compromise the hydrophobic layer. Graphene oxide (GO), characterized by its abundance of hydroxyl, carboxyl, and oxygen groups on its surface, can effectively mitigate this issue [28]. GO provides binding sites for small silane molecules, enabling them to form a clustered structure within the concrete. This clustering tightly bonds the silane molecules to the concrete, enhancing the thickness and effectiveness of the hydrophobic layer. Surface hydrophobicity can also be applied to the repair of ancient buildings to improve their durability.
In this research, the hydrophobic properties of foam concrete were evaluated using water contact angle measurements and water absorption tests. These methods were employed to determine the effectiveness of the concrete’s resistance to water penetration. Diphenylmethane diisocyanate (MDI) and polyether polyol (PP) were used as overall hydrophobically modified blowing agents. Additionally, GO, the silane coupling agent KH-550 and a composite emulsion of GO and KH-550 (G/S) were applied as three anti-permeability coatings to study the anti-permeability performance of PFC under the complex environmental conditions of carbonation and freeze–thaw cycles.

2. Materials and Methods

2.1. Materials

In PFC, the ordinary Portland cement used is PO 42.5 (Anhui Conch Cement Company Limited, Wuhu, China), and the fine aggregate is basalt stone powder (BSP). BSP, selected from Shaoxing Central Asia Industrial and Trade Park (Shaoxing Zhongya Industrial and Trade Park Co., Ltd., Shaoxing, China), is depicted in Figure 1a. Its main chemical composition was measured by an XRD test (PANalytical B.V., Almelo, The Netherlands), as shown in Table 1. Before use, BSP was sieved through a 200 mesh to ensure it met the standard for stone powder particle size. The particle size was measured using a laser particle size analyzer (Malvern Instruments Ltd., Malvern, UK), with results shown in Figure 1b. MDI (Jining Huakai Resin Co., Ltd., Jining, Shandong, China) and PP (Guangzhou Huixiang Chemical Co., Ltd., Guangzhou, Guangdong, China) were used as the foaming agents. The molecular formula of MDI is C15H10N2O2, as shown in Figure 1c. MDI is a light-yellow liquid that is insoluble in water, with an NCO value of 30.5%–32%, a viscosity of 150–250 mPa.s, an acidity of ≤0.03, and physical indices as shown in Table 2. The molecular formula of PP is C16H34O5, as depicted in Figure 1d, with an OH value of 400–460, a viscosity of 120–180 mPa.s, acidity ≤ 0.05, moisture ≤ 0.05%, and a pH between 9 and 11. These results were obtained using a laser particle size analyzer for the stone powder. A GO aqueous solution (2 mg/mL) served as the source of GO, obtained from Carbon Fountain Technology Company, Suzhou, China. Its elemental analysis is depicted in Figure 2, and its molecular structure and formula are shown in Figure 3a,b. The particle size of GO was measured using a laser particle size analyzer, with results shown in Figure 3c. The silane coupling agent KH-550 (Zhonghang New Material Technology Co., Ltd., Zhengzhou, Henan, China) is a transparent liquid with the molecular formula C9H23NO3Si and a molecular mass of 221.37 g/mol. It has one hydrogen bond donor, four hydrogen bond acceptors, and nine rotatable bonds. The molecular formula and structure of KH-550 are shown in Figure 4a,b.

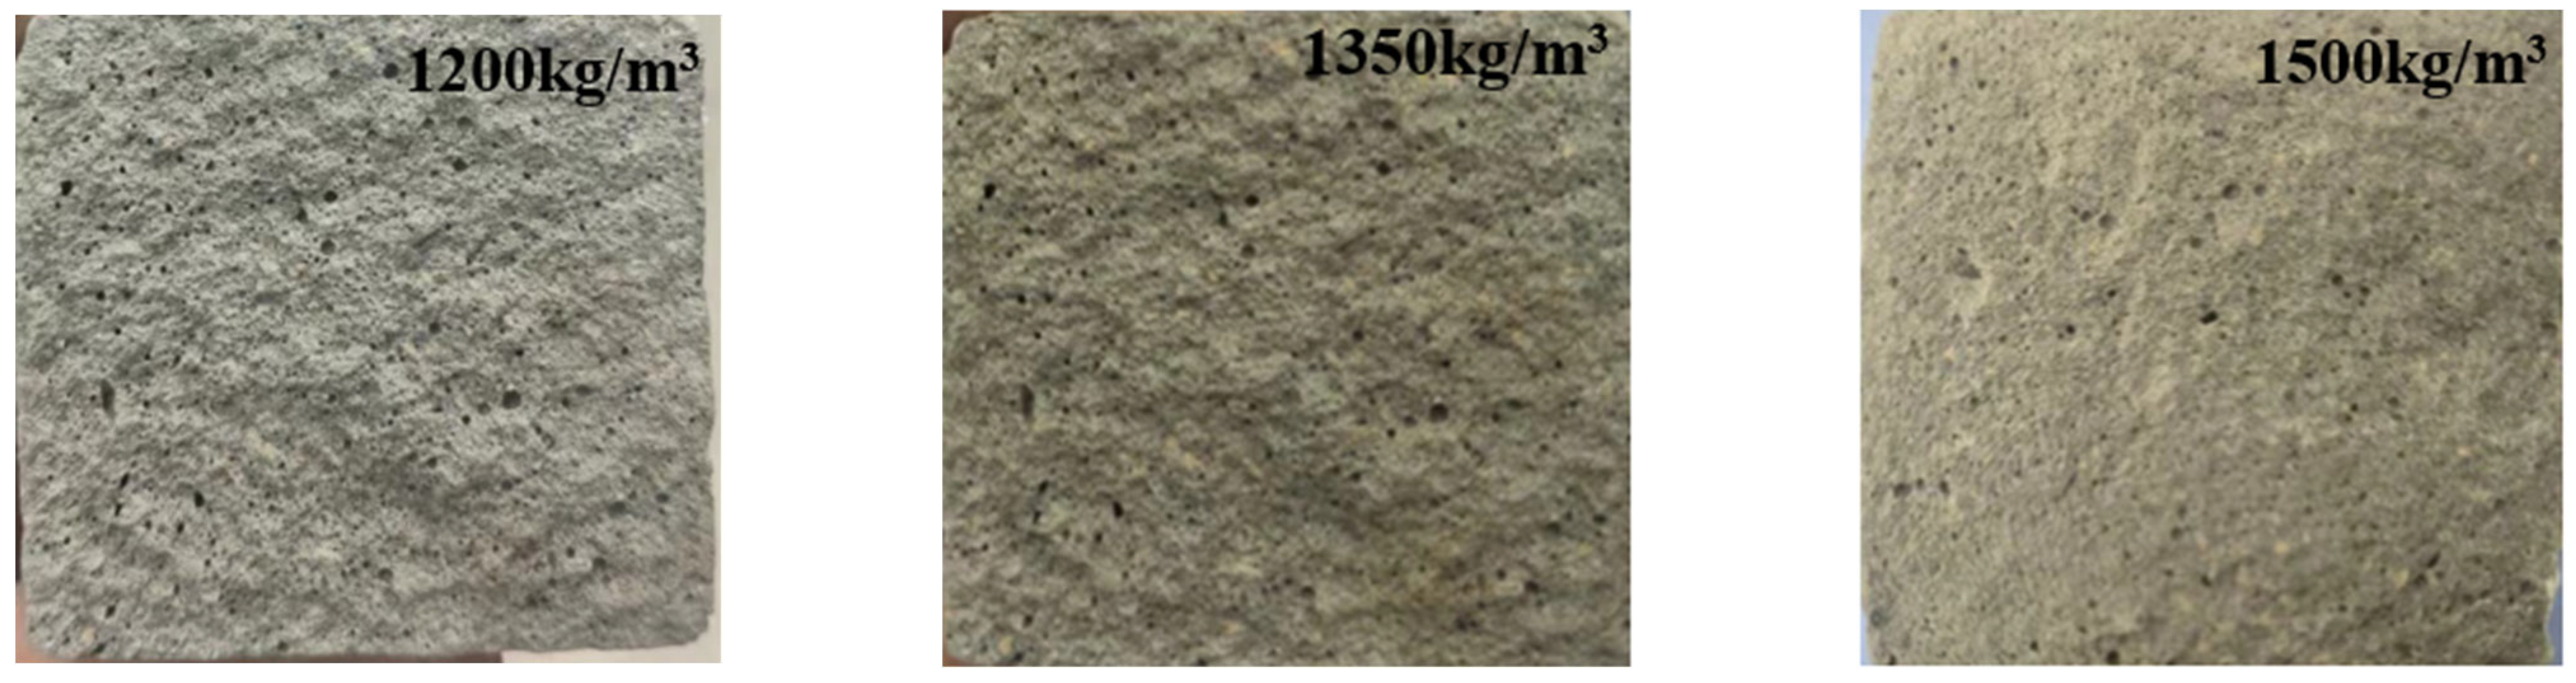
2.2. PFC Density Modulation and Specimen Preparation

The design dry density and water consumption of foam coagulation are calculated according to Equations (1) and (2).
ρ d = S a ( m c + m m )
m W = B ( m c + m m )
where ρ d is the design dry density of foam concrete, S a is the quality coefficient determined by the total amount of dry material of each basic constituent material and the total amount of non-evaporated material in the finished product after 28 d of foam concrete curing, and ordinary Portland cement is taken as 1.2. m c is the amount of cement used in 1 m3 of foam concrete, m m is the amount of admixture used in 1 m3 of foam concrete, m W is the amount of water used in 1 m3 of foam concrete, and B is the ratio of water to glue.
The total volume of slurry consisting of cement, admixture, aggregate, and water in 1 m3 of foam concrete and the amount of foam added were calculated according to Equations (3) and (4).
V 1 = m c ρ c + m m ρ m + m s ρ s + m w ρ w
V 2 = K ( 1 V 1 )
where V 1 is the total volume of slurry consisting of cement, admixture, aggregate, and water, ρ c is the density of cement, ρ m is the density of admixture, m s is the aggregate used for 1m3 of foam concrete, ρ s is the apparent density of aggregate, and V 2 is the amount of foam added. After calculating the concrete mix ratio after quality correction, the correction factor η is calculated by Equations (5) and (6).
η = ρ c o ρ c c
ρ c c = m c + m m + m s + m f + m w
where ρ c o is the wet density calculated according to the ratio of each constituent material, ρ c c is the measured wet density of the foam concrete mix, and m f is the amount of foam agent in 1 m3 of foam concrete obtained from the calculation of the ratio.
Based on the mix ratio calculations and density modulation, three densities of PFC, 1500 kg/m3, 1350 kg/m3, and 1200 kg/m3, were obtained, as shown in Table 3, for the mix ratio design. The internal pores of PFC with different densities are shown in Figure 5.

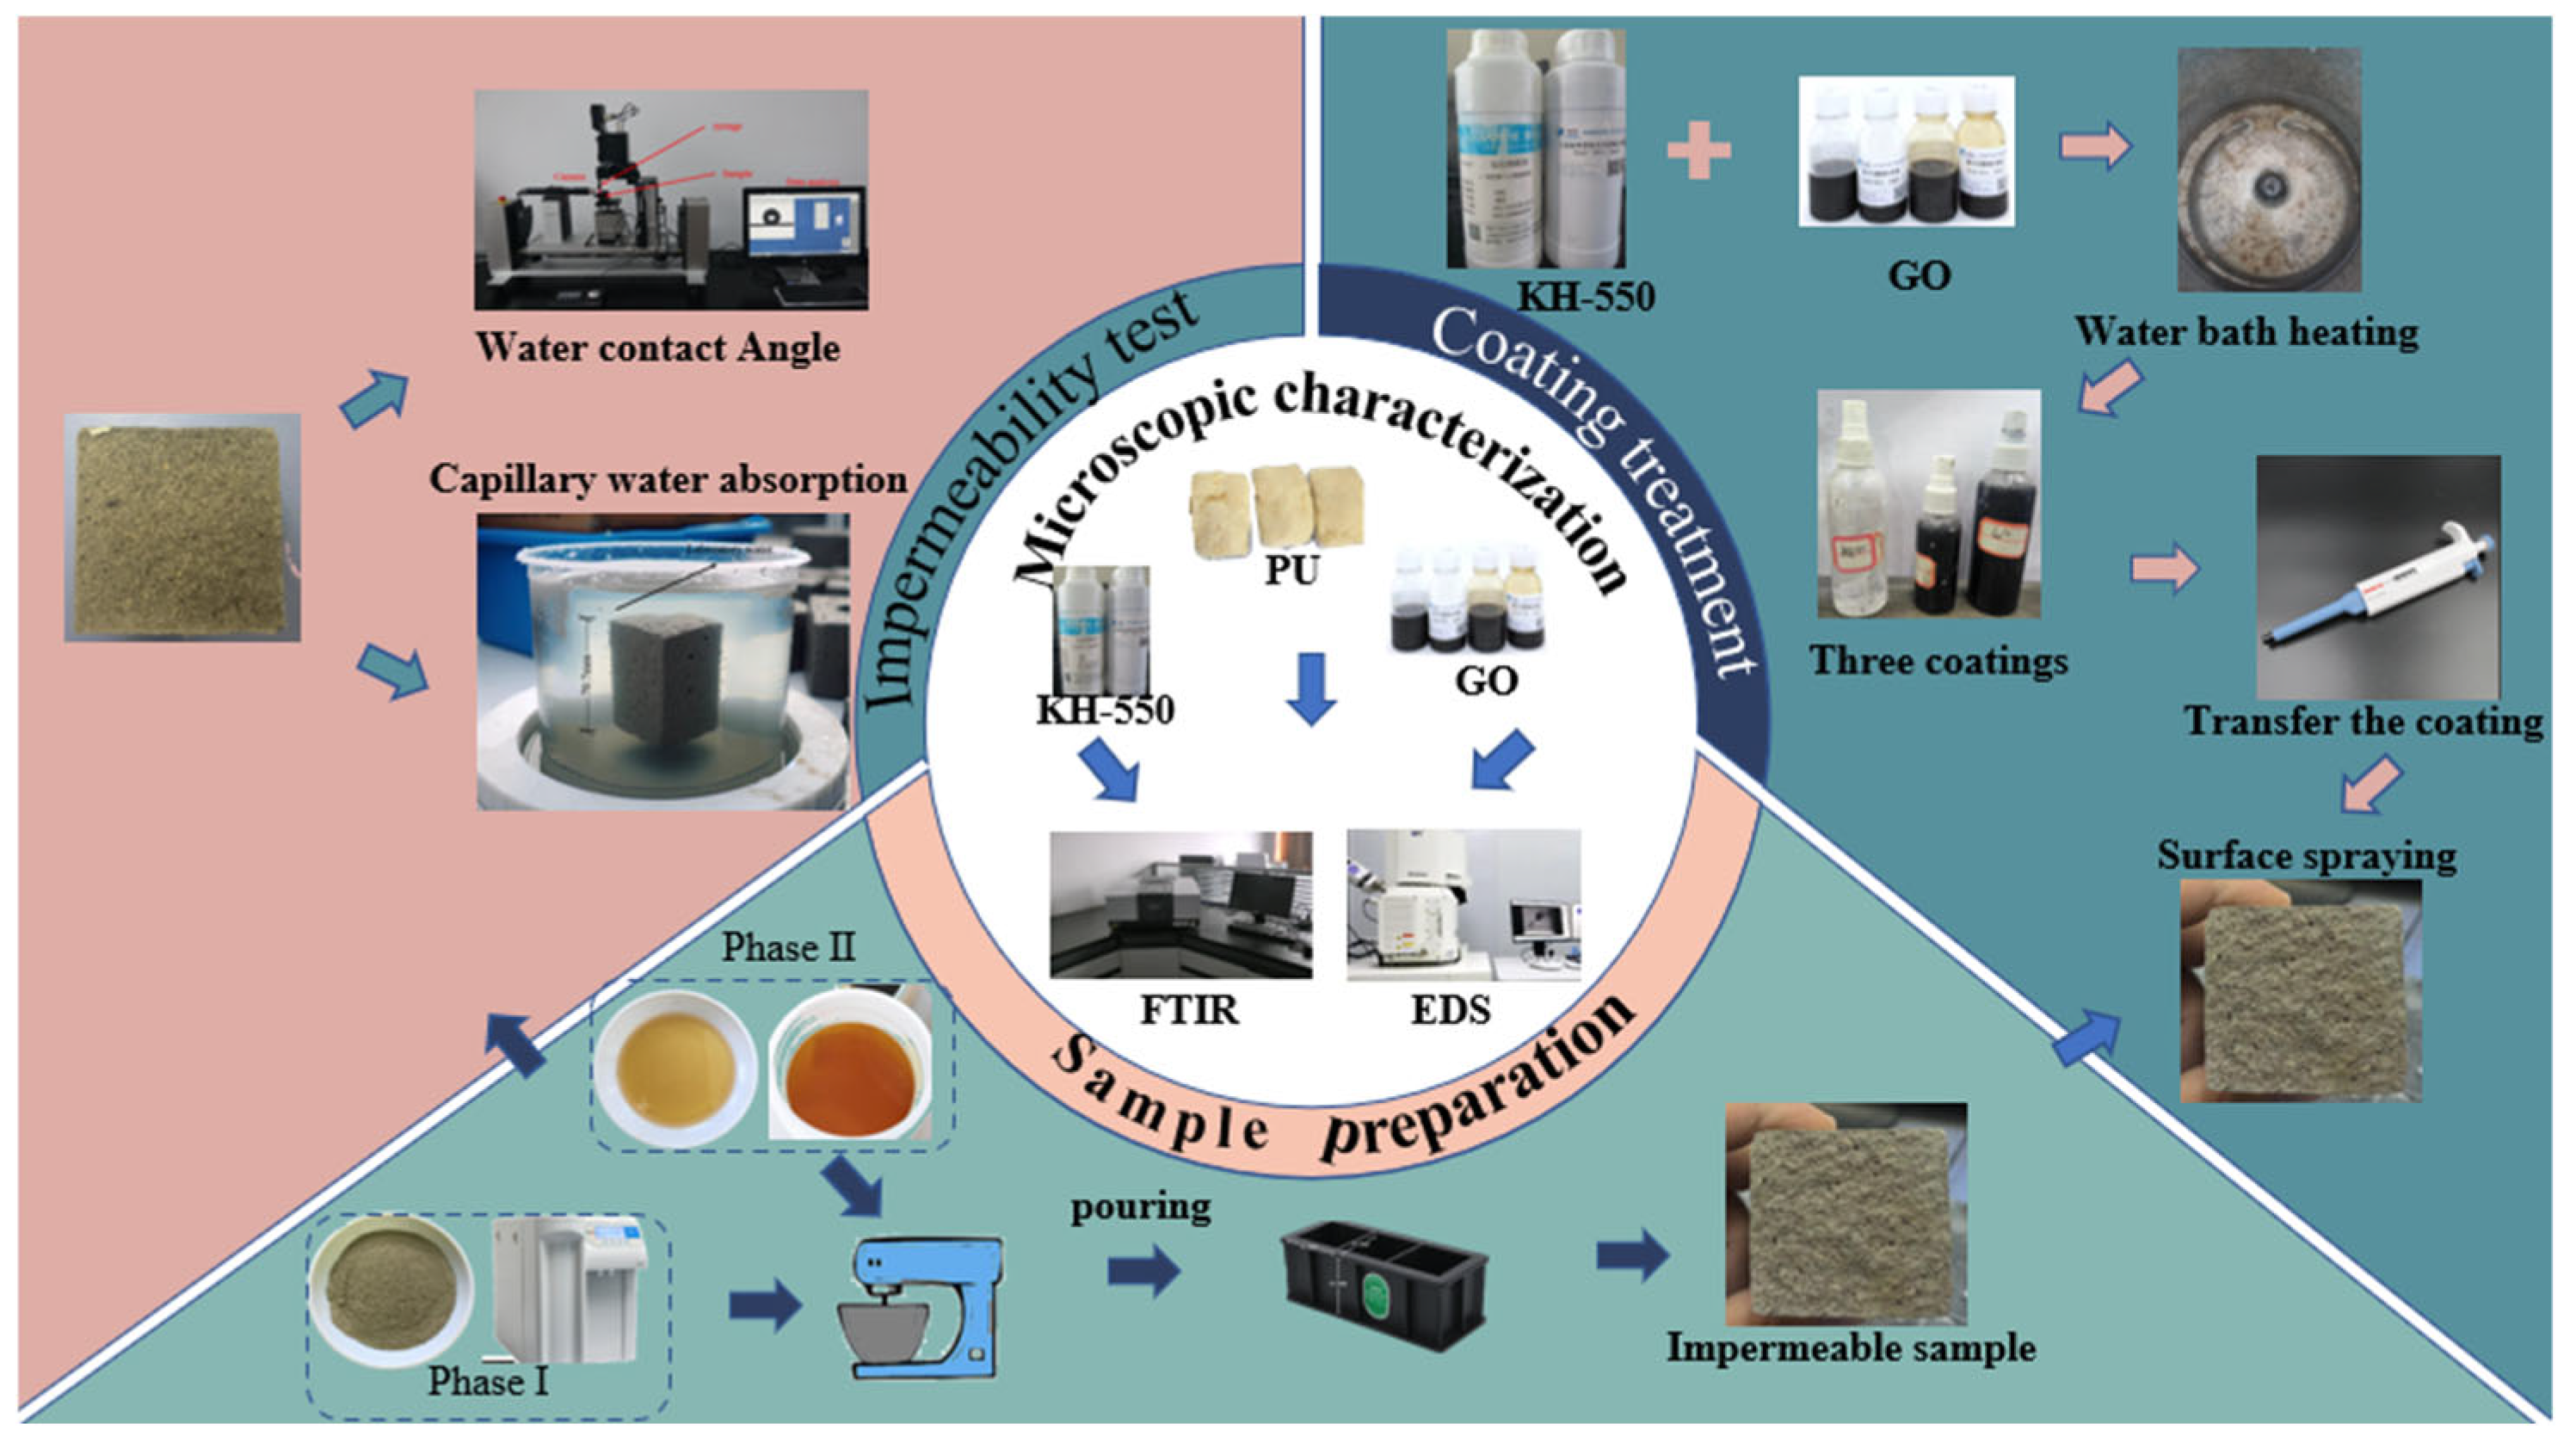
2.3. Specimen Preparation and Test Program

2.3.1. Preparation of Impermeable Specimens

The permeability specimen is a cube with a side length of 40 mm. The specimen production process is as follows. (1) Preparation of specimen tools: A layer of petroleum jelly was evenly coated around the mold to facilitate the demolding of the specimen. (2) Preparation of test materials: The mass of each constituent material was calculated according to the mixing ratio in Table 3, and all materials were weighed using an electronic scale. Cement and stone powder were stirred for 2 min until the mixture was homogeneous, forming the dry material. (3) Mixing of MDI and PP: MDI and PP were weighed separately. PP was poured into the dry material and stirred evenly for 1 min, followed by the addition of MDI, which was stirred evenly for another 2 min. (4) Preparation of specimen: The mixed material was filled into the mold in layers, and the surface of the specimen was smoothed with a spatula. (5) Specimen curing and mold removal: The molds were placed in a controlled curing room where the temperature was maintained at 20 °C ± 2 °C and the humidity was kept above 90%. The specimens were cured for 2 days before demolding. After demolding, the specimens were immersed in water and cured for up to 28 days [31]. The test program and process are shown in Figure 6.

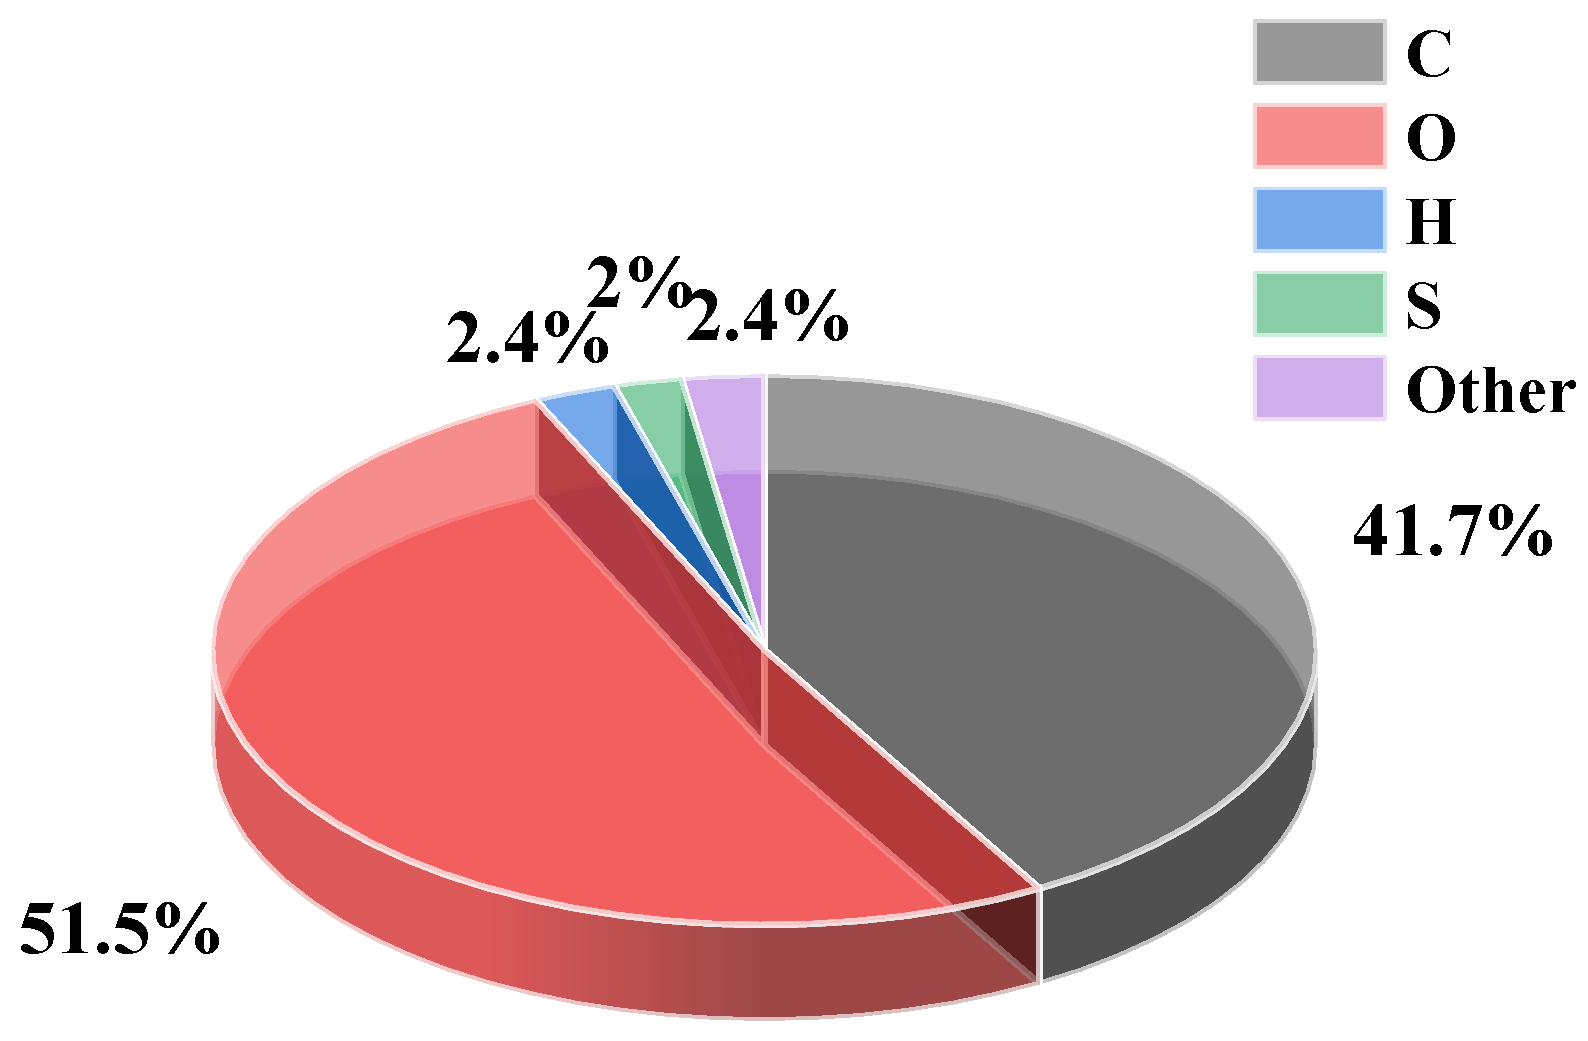
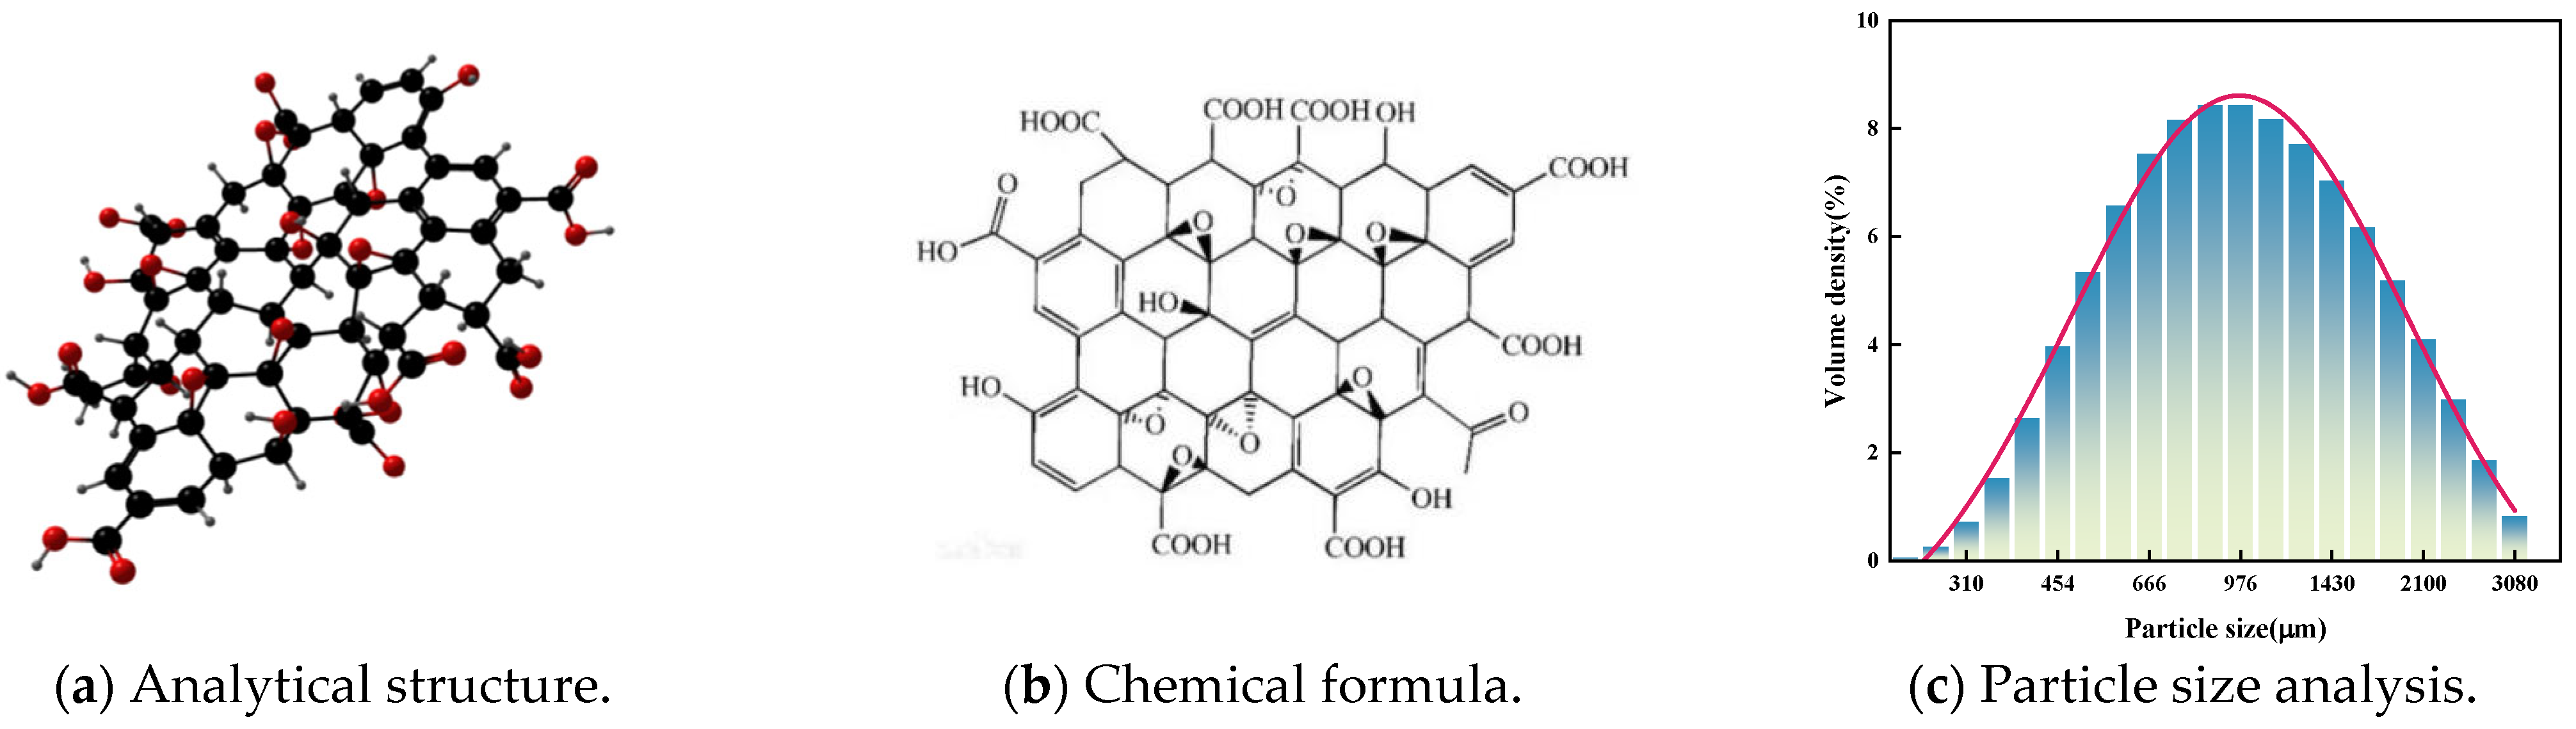
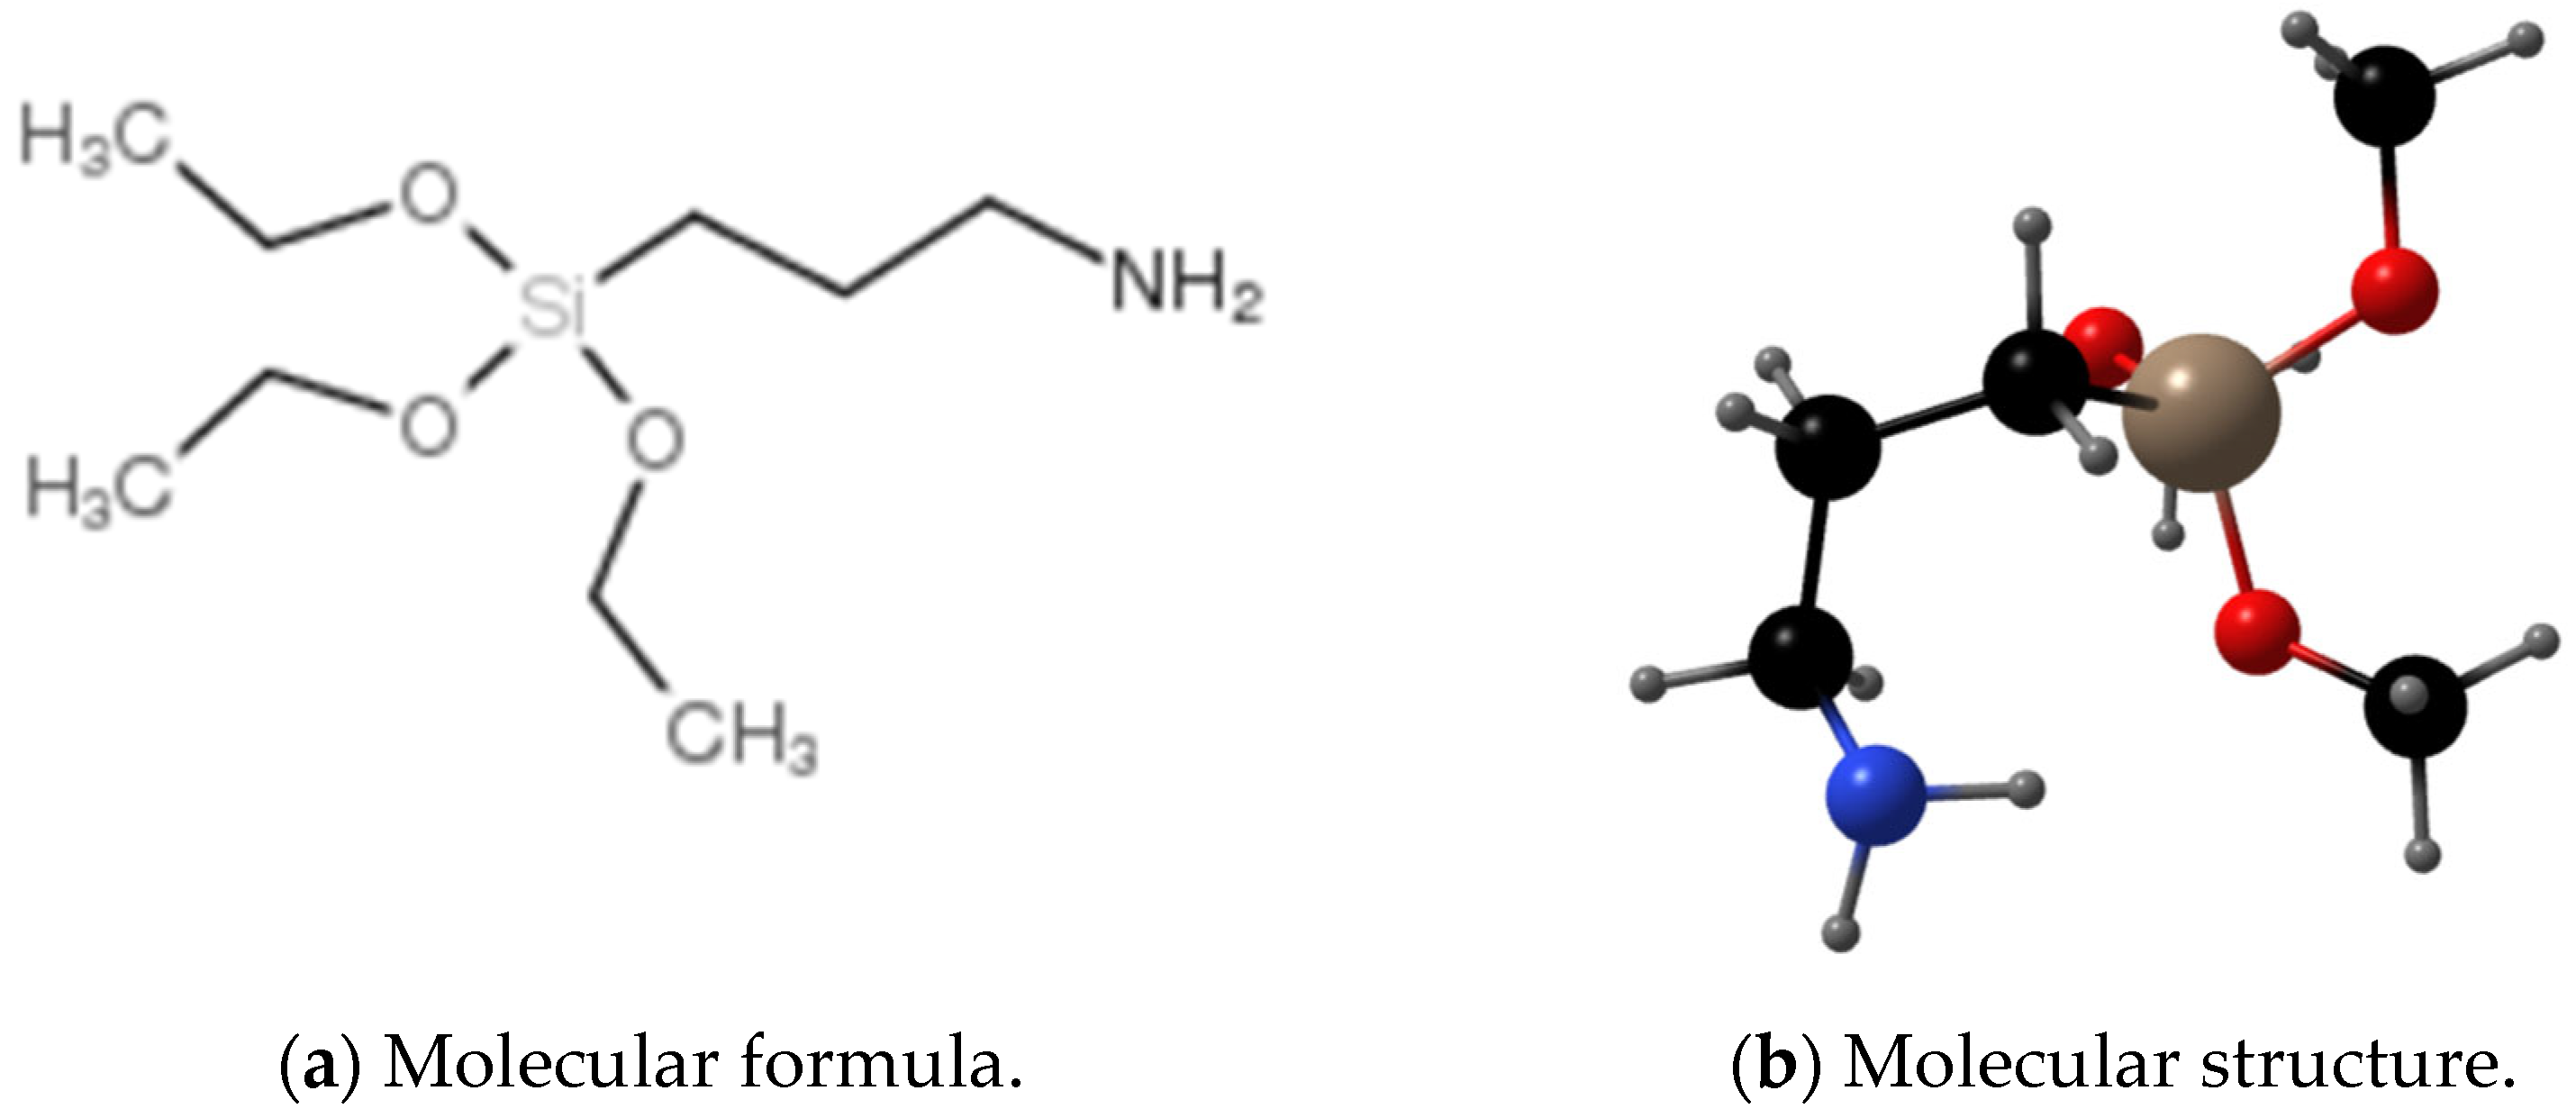
2.3.2. Preparation of GO/KH-550 Composite Emulsion (G/S)

The steps involved in preparing the G/S composite emulsion are as follows: (1) Weigh a 1:1 ratio of KH-550 and GO and mix them in a measuring cylinder. (2) Place the measuring cylinder in a magnetic stirring water bath and raise the temperature to 60 °C. (3) Add a magnetic stir bar (Shanghai Lichen Instrument Technology Co., Ltd., Shanghai, Shanghai, China) to the measuring cylinder and stir at 1600 rpm for 1 h. (4) After stirring is completed, remove the measuring cylinder from the water bath and allow it to cool to room temperature to form the G/S composite emulsion. The detailed preparation process is outlined in Figure 7. In these reactions, KH-550 is not only anchored to the GO surface, but its unreacted ethyl acrylate group (-C=C) also provides potential active sites. This improves the dispersibility and compatibility of GO within the target matrix [32].
KH- 540 R-Si OCH 3 3 + 3 H 2 O R-Si ( OH ) 3 + 3 C H 3 OH
The three ethoxy groups (-OEt) are hydrolyzed into hydroxyl groups (-OH), resulting in the formation of trihydroxysilane (H2N-(CH2)3-Si(OH)3) and ethanol (C2H5OH).
For the carboxyl group (-COOH),
H 2 N- C H 2 3 -Si OH 3 + -COOH R-CONH-R + H 2 O
Figure 7. Reaction principle of GO with KH-550.
Coatings 15 00854 g007

2.3.3. Test Scheme

To examine the influence of environmental factors on the impermeability of PFC, two key tests were conducted: a carbonation test and a freeze–thaw cycle test. Additionally, to explore the effects of surface hydrophobic modifications on PFC, three different hydrophobic coatings were applied to the PFC samples.
Details of the test procedures and the specific hydrophobic coatings used are outlined in Table 4.

2.4. Test Methods

2.4.1. Water Contact Angle Test Method

Standard permeation test methods include the Karsten tube method, water contact angle measurement, and hydrophobic mass test [11]. In this study, the water contact angle of PFC was measured using an OCA50Micro fully automated single-contact-angle measuring instrument (OCA50Micro, Dataphysics Instruments GMBH, Filderstadt, Germany), as shown in Figure 8. The contact angle of PFC was determined using the droplet method. In this method, each droplet, consisting of 2.5 microliters of distilled water, was placed on the surface of the PFC specimen. The contact angles at 10 different positions on the specimen’s surface were captured using a high-speed camera. The average of these measurements was then calculated and used as the final test result.

2.4.2. Water Absorption Test

The concrete specimens were supported with stands of the same height, ensuring that the distance between the bottom of the container and the concrete floor was 5 mm. Water from the laboratory was added to the container to ensure that the water level was higher than the top of the concrete specimens, as depicted in Figure 9. Subsequently, all the specimens were fully immersed in the water. After that, water absorption tests were carried out at intervals of 0, 1, 2, 4, 6, 8, 12, 24, 36, and 48 h.
The mass of the specimen after different immersion times was measured to determine the amount of water absorption, which was calculated using Equation (9) [33].
W A R = W t W o W o × 100 %
where W t denotes the mass after immersion and W o denotes the mass before immersion.

2.4.3. Carbonization and Freeze–Thaw Test Methods

To explore the effects of environmental conditions on the impermeability of PFC, various assessments were conducted, including carbonation tests and freeze–thaw cycle tests on PFC specimens.
Based on the research findings of Cui [34] and Fib [35], the concentrations chosen for this study were 2% and 4%. After reaching the required curing age, the PFC specimens were placed in a carbonation chamber. The environment inside the chamber was controlled to maintain a constant temperature of 20 °C and a humidity level of 90%. The specimens underwent the carbonation process for 48 h. After the carbonation process was completed, the specimens were subjected to a permeability resistance test to evaluate their performance.
According to GB/T 50082-2009 [36], the procedure for one freeze–thaw cycle test is as follows. (1) Place the PFC specimen, which has reached the required curing age, into water at 20 °C for 4 h. (2) After soaking, transfer the specimen into a freeze–thaw chamber at −20 °C and freeze it for 6 h. (3) After freezing, place the specimen back into water at 20 °C and allow it to thaw for 6 h. In the present study, 25 freeze–thaw cycles were conducted on the PFC specimens to carry out a permeability test.
In order to accurately obtain the water contact angle of PFC after freeze–thaw cycles, Three-tier controls were implemented during the measurement. (1) Selection of measurement points: Areas with visually observable spalling or holes (defects larger than 1 mm) were avoided, and points were only arranged in relatively intact surface regions. (2) Parameter optimization: The droplet volume was adjusted to 4 μL to enhance the wetting stability on rough surfaces. (3) Data filtering: Outliers were automatically excluded based on droplet morphology (those with excessive contact diameter or asymmetric spreading). Although the obtained results are apparent contact angles (not intrinsic values), this method more truly reflects the performance of the protective layer in actual harsh environments.

2.4.4. Concrete Surface Coating Method

The six surfaces of the concrete specimens were coated according to Table 5. The process was as follows: (1) Calculate the amount of spray required based on the surface area of the specimen, (2) use a pipette gun to draw the calculated amount of spray, and (3) transfer the solution into a spray bottle and use it to evenly coat the surface of the PFC specimen, as depicted in Figure 6.
Fourier transform infrared spectroscopy (FTIR, IRPrestige-21, Shimadzu, Tokyo, Japan) was used to identify functional groups and chemical bonds within the wave number range of 500–4000 cm−1 at room temperature. The morphology and size distribution of the materials were recorded and observed with a scanning electron microscope (SEM, JSM-6360 LV, JEOL, Tokyo, Japan). An energy-dispersive spectrometer (EDS, JSM-7800F Prime, JEOL, Tokyo, Japan) was used to measure the elemental species and contents in the microregions of the materials.

3. Results and Analysis

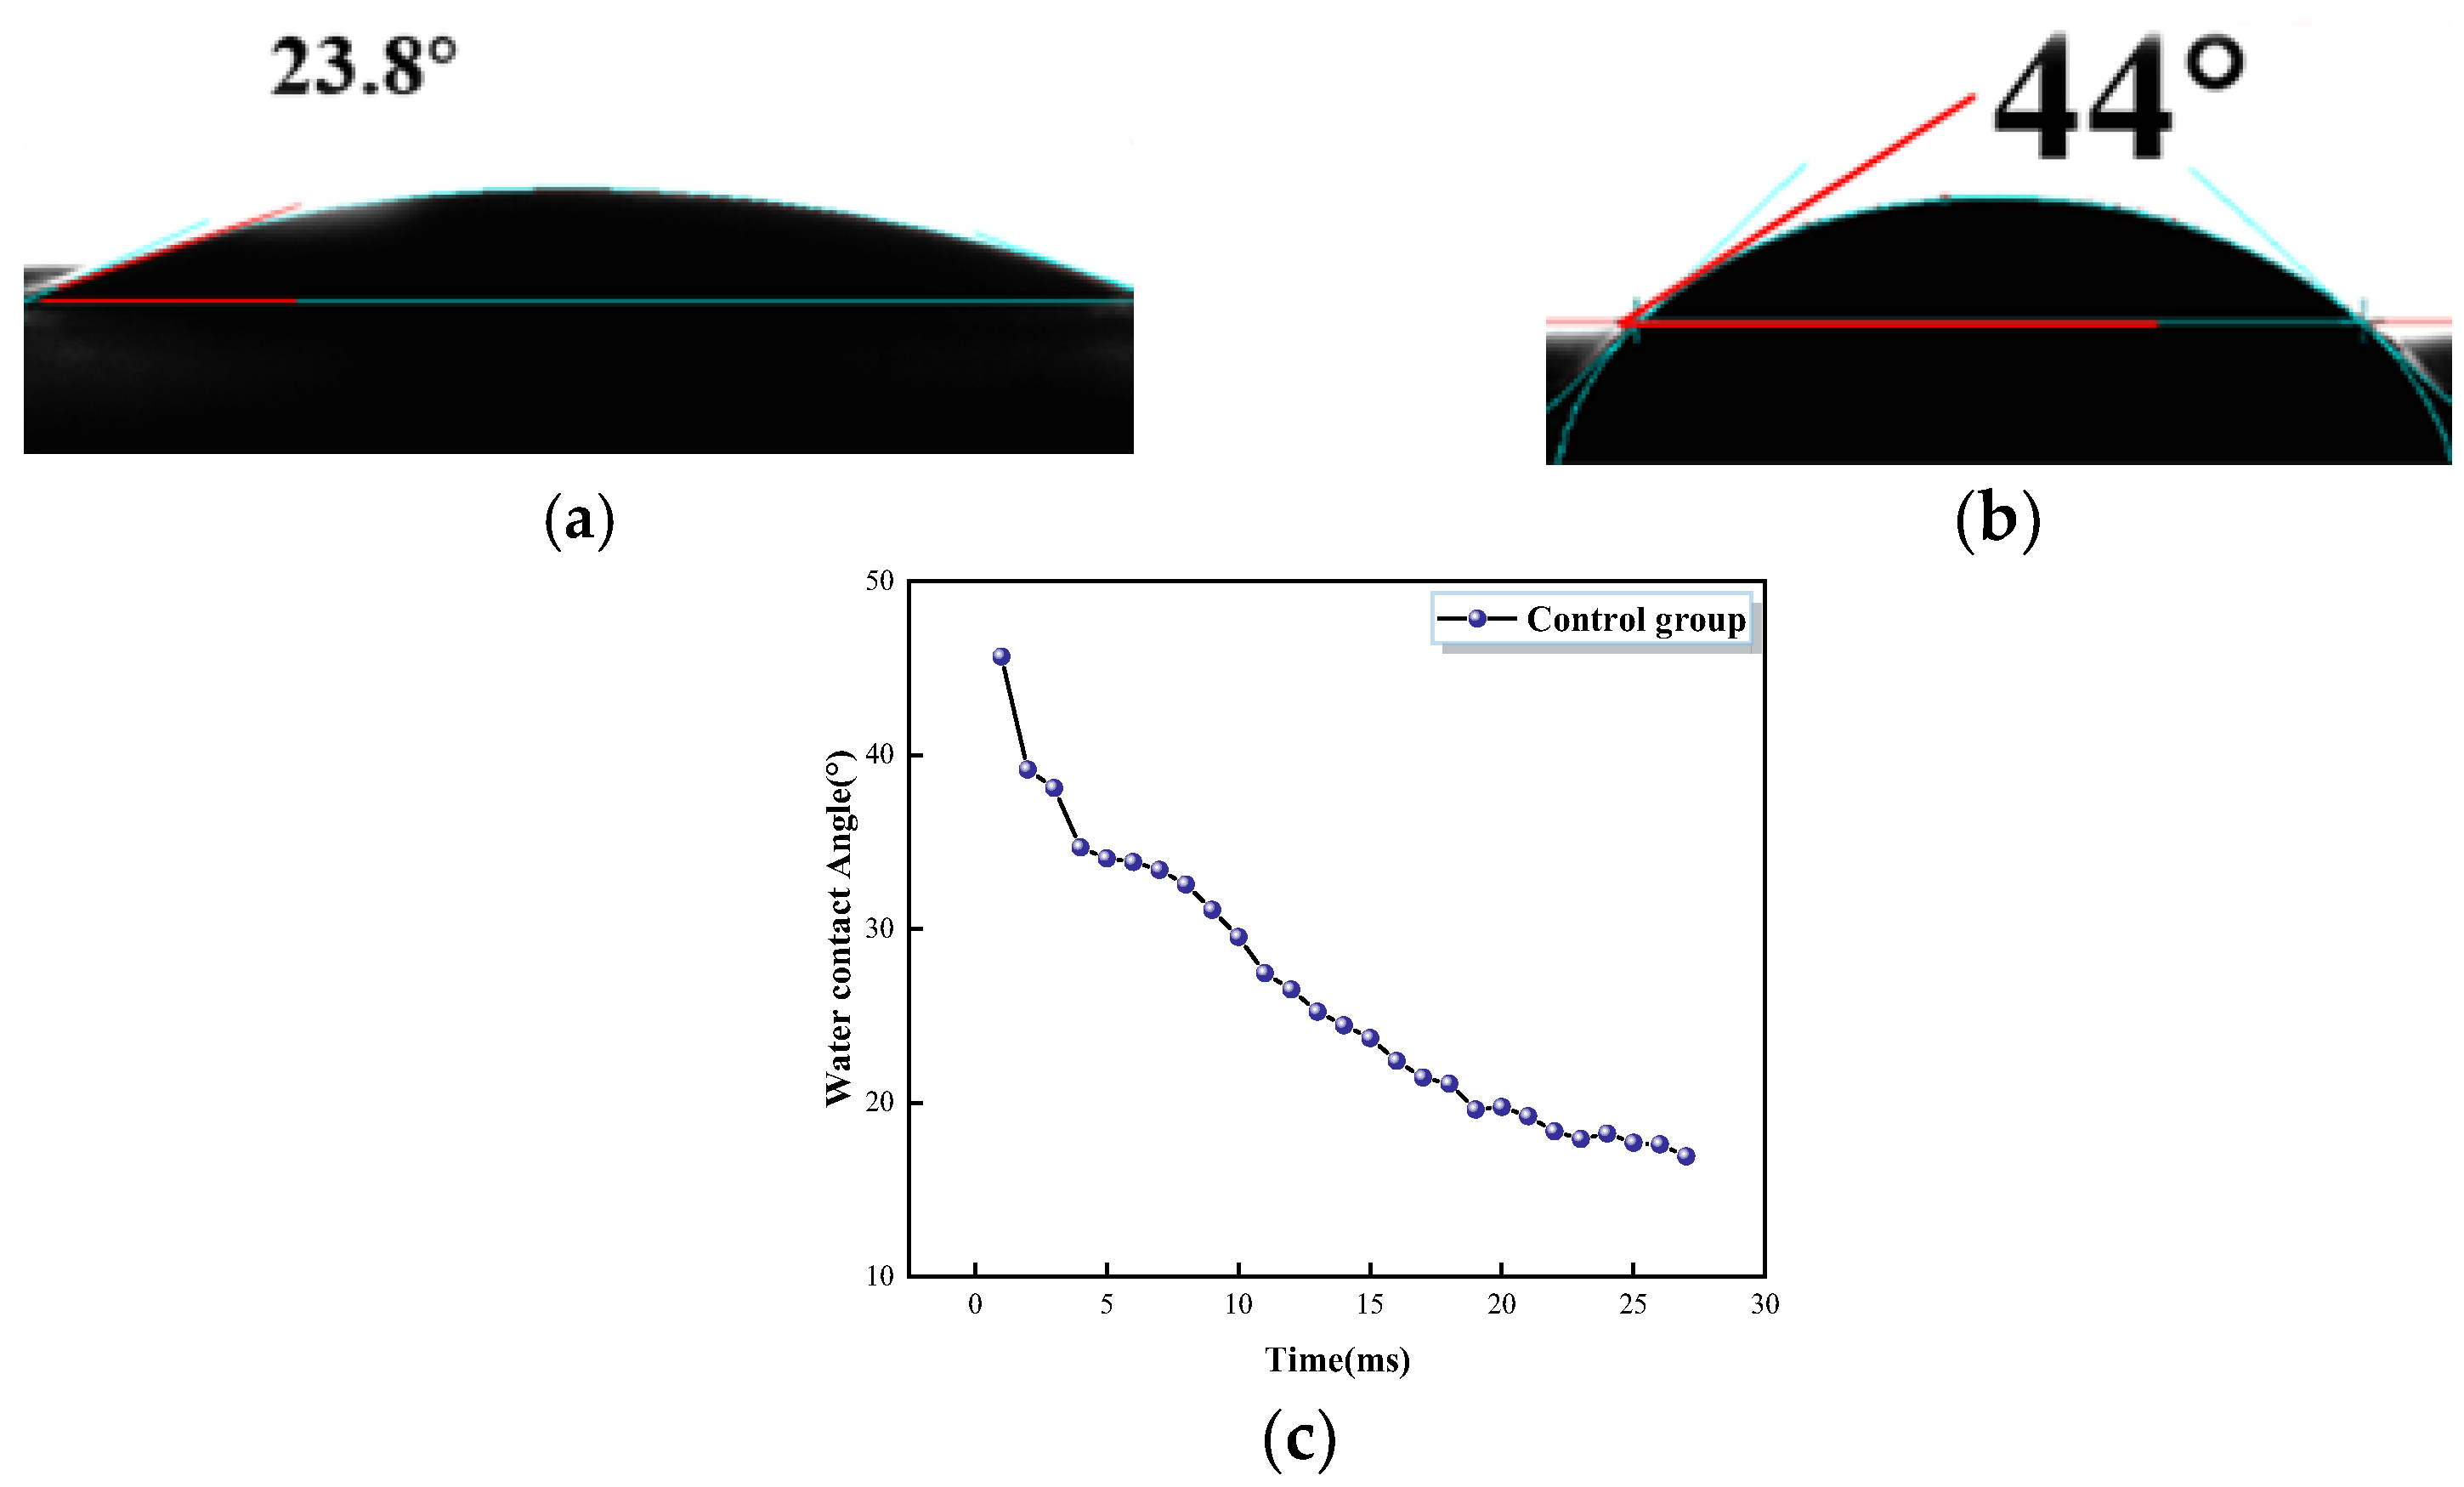
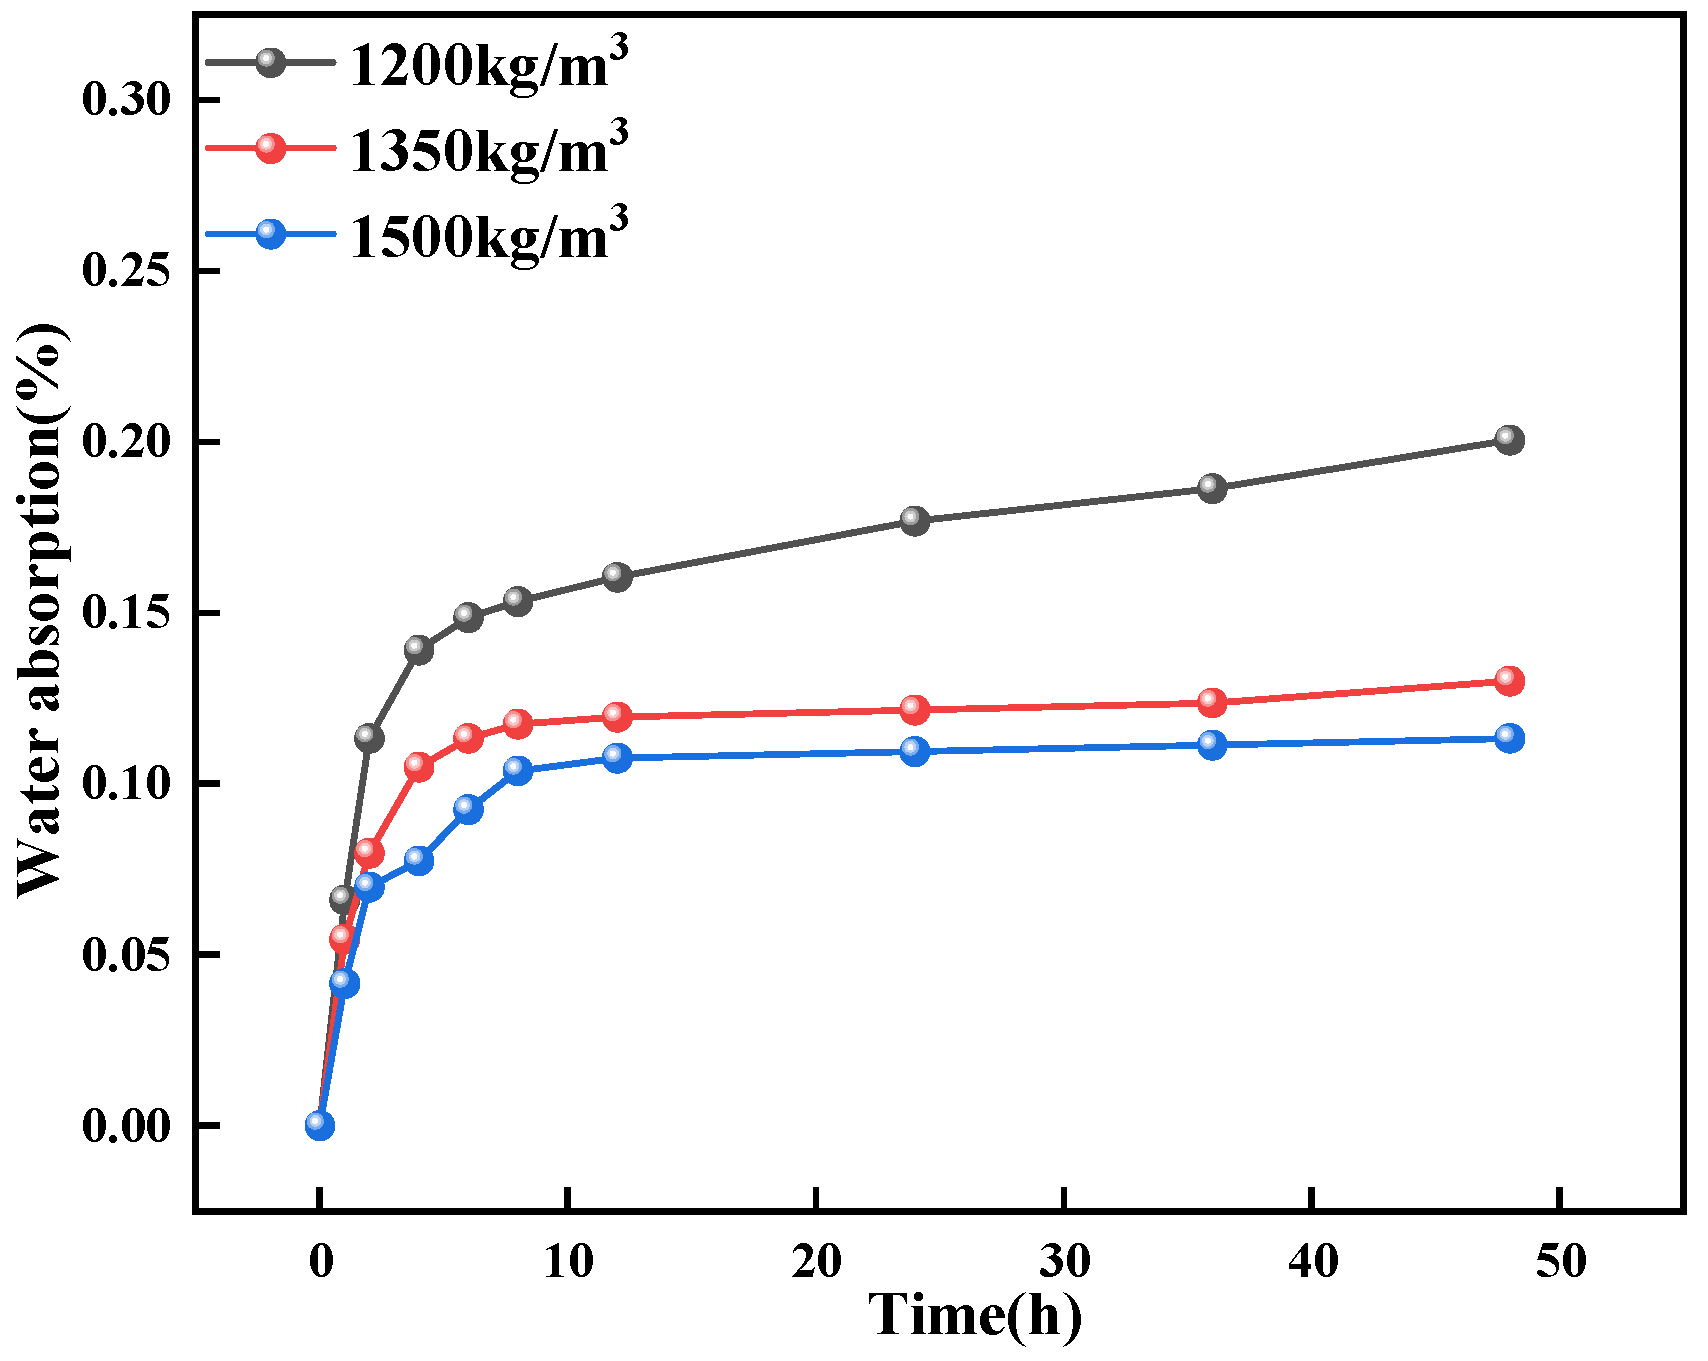
3.1. Effect of PU on Seepage Resistance of Foam Concrete

Figure 10a shows the concrete specimen without PU addition, with a contact angle of 23.8°. Figure 10b illustrates the water-repellent property of the PFC specimen. The contact angle of the PFC with added PU foam was 44°, and the curve of the water contact angle versus titration time is shown in Figure 10c. The experimental data indicate that adding PU foam to concrete increases the surface hydrophobicity of the PFC specimen, thereby lowering its water storage capacity.
Figure 11 illustrates the water absorption rate of PFC. The test results indicate that the water absorption rate of the PFC specimen increases rapidly during the initial 8 h period. By the 10 h mark, the internal pore water of the specimen approaches saturation, leading to a slower increase in water absorption between 10 and 48 h. At 48 h, the water absorption reached 0.28% for PU-1200, 0.13% for PU-1350, and 0.07% for PU-1500. The data demonstrate that the water resistance of composites enhanced with four different silane coupling agents improved [35]. Additionally, composites modified with KH-570 exhibited the best water resistance and superior interfacial compatibility. This modification effectively minimized the space available for water molecules within the composites, resulting in a significant enhancement of their water resistance. The water absorption of KH-570-modified materials at 48 h reached 1.5%. The water absorption rate of the PFC specimens in this experiment is much lower than that of the KH-570-modified composites in the cited article, regardless of density changes. This finding demonstrates that incorporating PU foam into concrete can significantly enhance its water resistance.

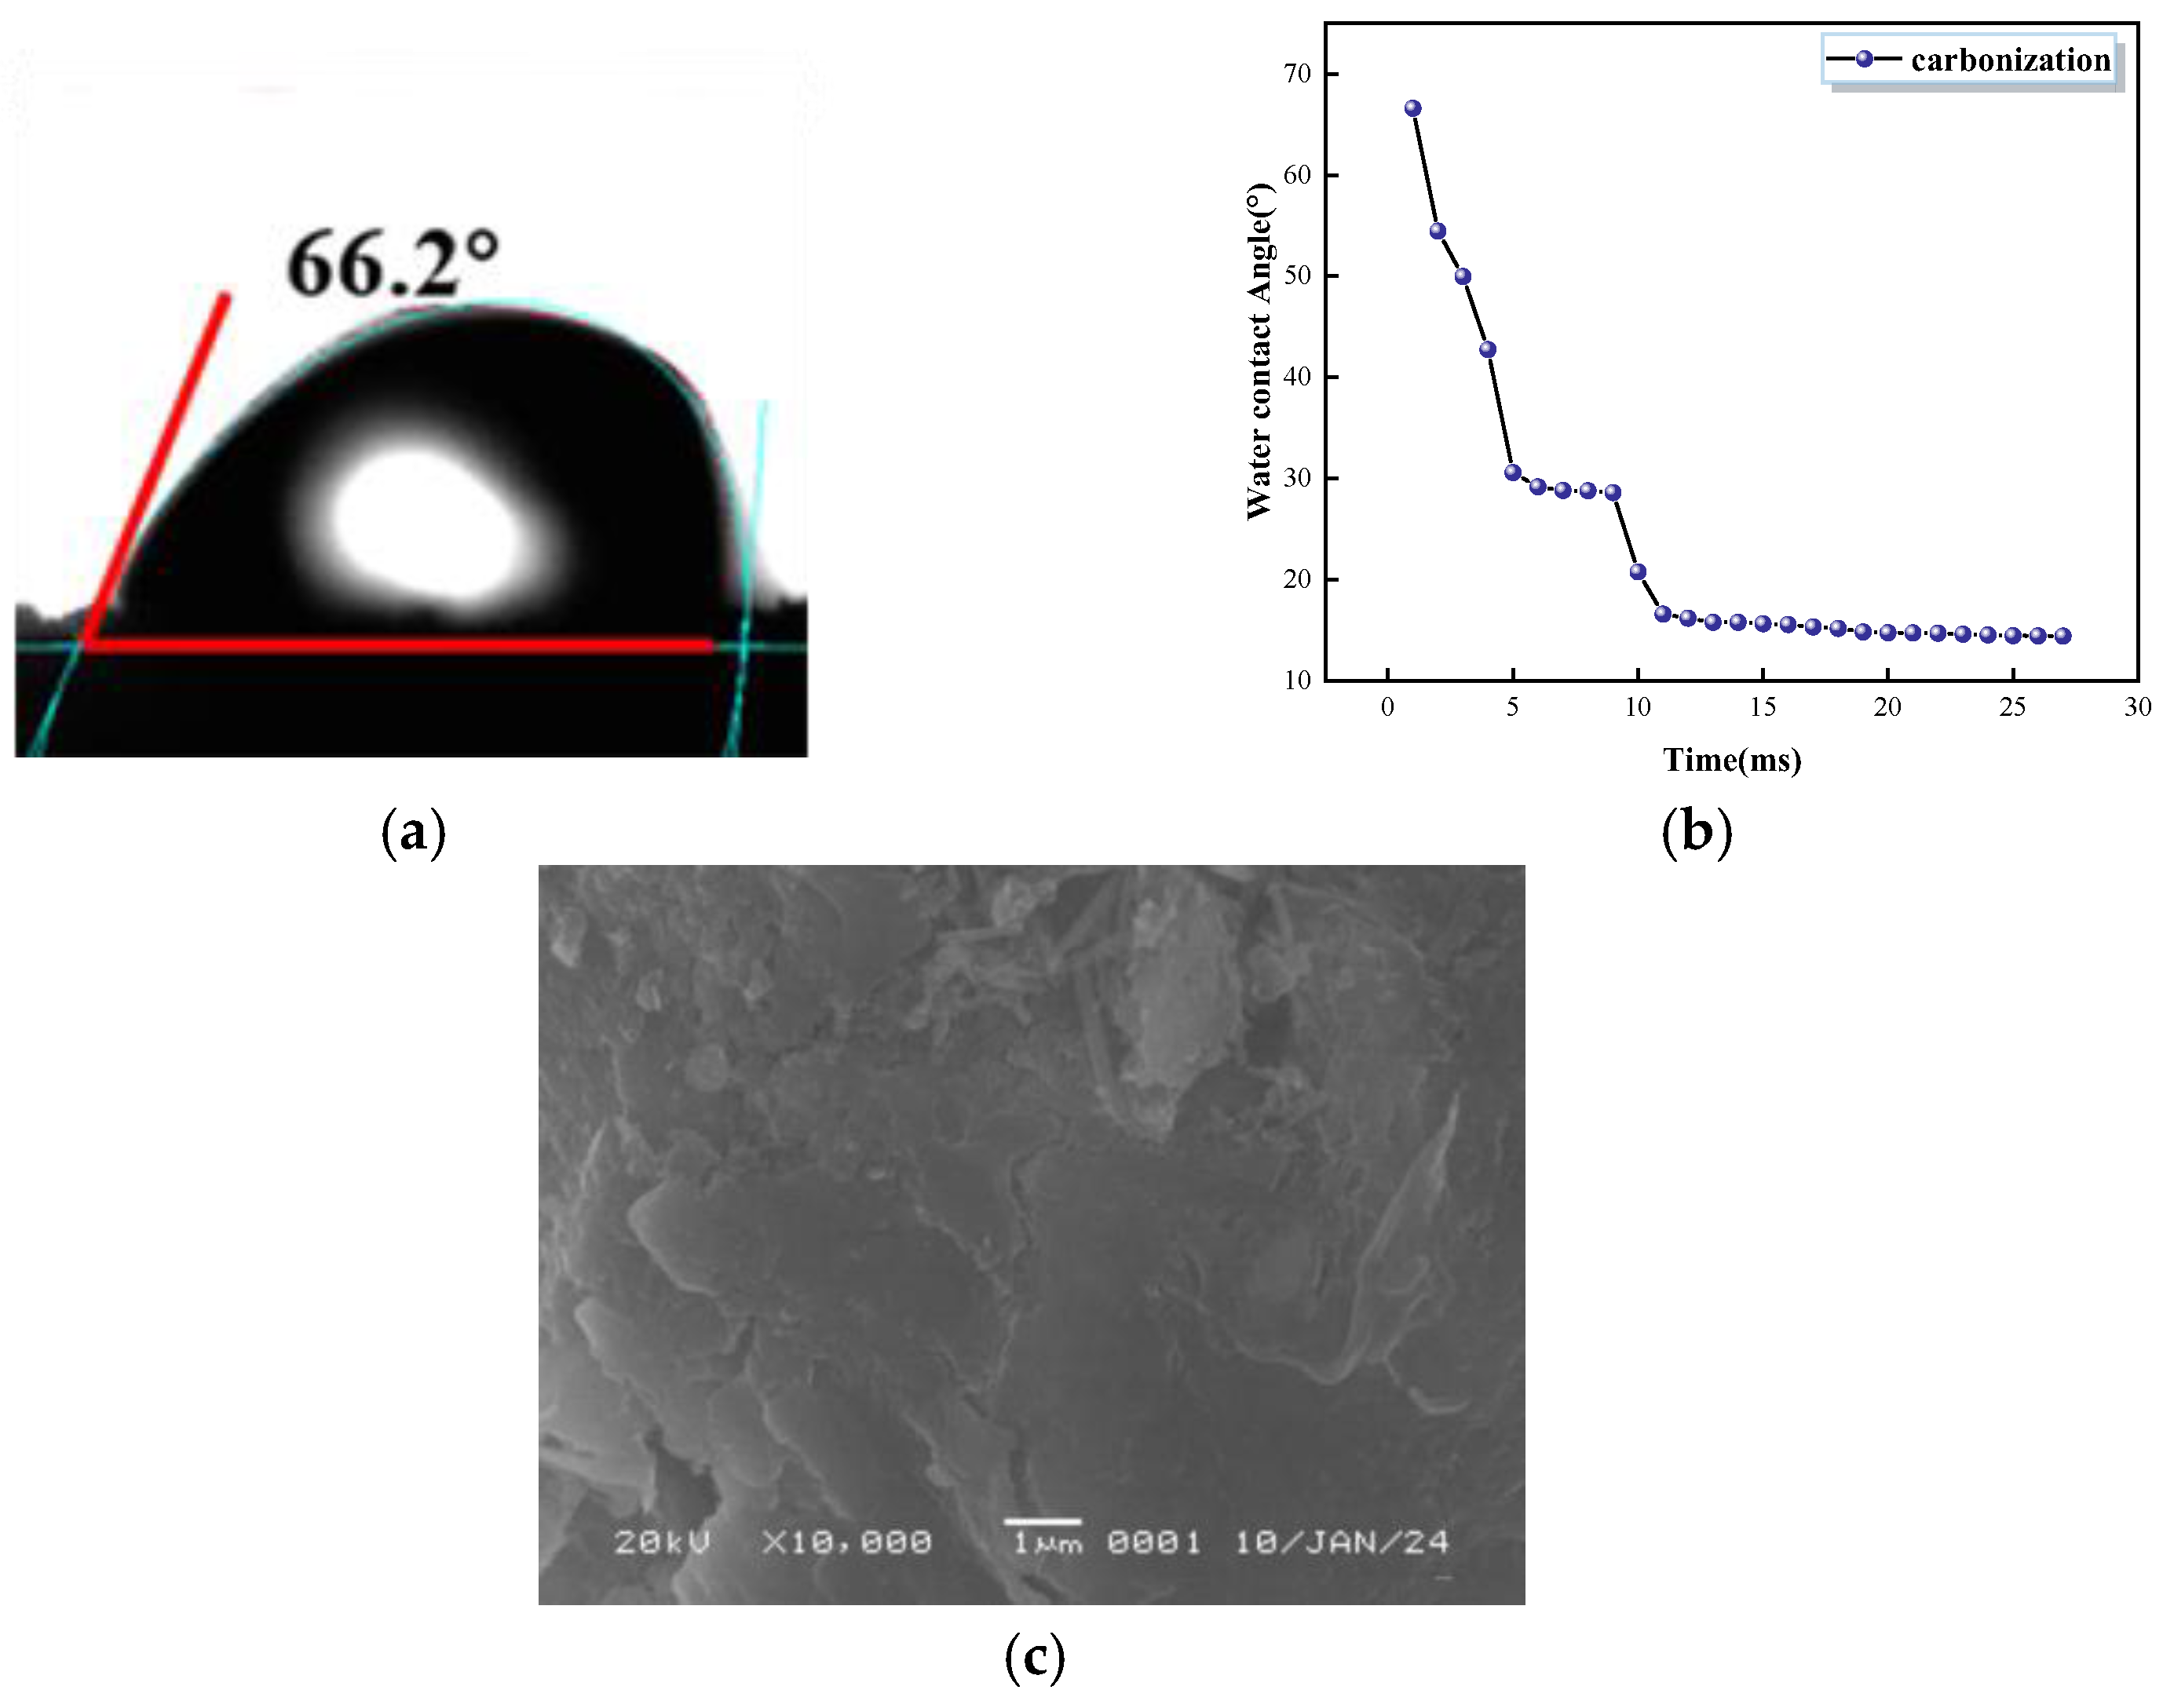
3.2. Effect of Carbonation Environment on PFC Impermeability Properties

As shown in Figure 12a, upon carbonation of the PFC, the water contact angle on its surface measured 66.2°. The curve of the water contact angle versus titration time is shown in Figure 12b. As the titration time increases, the water contact angle decreases rapidly within 5 ms and continues to decrease rapidly after 9 ms. Subsequently, the contact angle decreased slowly, reaching 14.4° at 27 ms. The surface micromorphology of the carbonized specimen, depicted in Figure 12c, reveals through SEM imaging that CaCO3 produced by the carbonation reaction is dispersed across the PFC surface. The quantity of CaCO3 formed is influenced by the duration of the carbonation process [30]. With longer carbonation times, more CaCO3 particles adhere to the PFC surface. Conversely, if the carbonation time is too short, there is insufficient CaCO3 on the surface, leading to slight alterations in surface texture and a reduced wetting angle. When the carbonation time is extended, the PFC surface becomes increasingly covered with CaCO3 particles, resulting in a progressive rise in the wetting angle. Additionally, the surface particles of the PFC develop a micro–nano composite structure akin to that of a lotus leaf, preventing water droplets from spreading and thereby increasing the contact angle [37].
Figure 13 presents the results of the water absorption test conducted after the CG-1500 specimen underwent 48 h of carbonation. The test findings indicate that the water uptake of the PFC sample increases rapidly during the initial 4 h, with continued growth observed between 8 and 12 h. By the 12 h mark, the internal pore water of the specimen essentially reaches saturation, leading to a stabilization of the water absorption rate, with little to no further increase observed beyond this point. At 48 h, the water absorption rates under different carbonation conditions are as follows: CG-1200 exhibits a water absorption rate of 0.2%, CG-1350 has a rate of 0.13%, and CG-1500 achieves a rate of 0.1%.

3.3. Effect of Freeze–Thaw Cycling on the Permeability of PFC

Following 25 freeze–thaw cycles, the water contact angle on the PFC surface reduced to 10.8°, as illustrated in Figure 14. The test findings demonstrate that freeze–thaw conditions significantly affect the impermeability performance of PFC. The PFC specimens experience internal damage as a result of freeze–thaw cycles, and this damage progresses through four main stages: the initial stage, the water infiltration stage, the freeze-development stage, and the structural damage stage [38], as shown in Figure 15. In the initial stage, the PFC exhibits small damage cracks and internal bubble cracks, as illustrated in Figure 15a. The water infiltration stage is shown in Figure 15b, where external water enters the PFC, filling the internal pores until they gradually become saturated. Next, in the freeze-development stage, as shown in Figure 15c, the volume expansion of frozen water generates tensile stress on the inner walls of the PFC specimen. This expansion pressure exceeds the load-bearing limit of the PFC, leading to disintegration of the internal structure, as illustrated in Figure 15d. The tensile stress results in the formation of microcracks or the expansion of existing cracks. As the number of freeze–thaw cycles increases, these microcracks can interconnect, forming larger cracks. The increase in internal water storage space leads to a further decrease in the water contact angle of the PFC surface.
Figure 16 displays the results of the water absorption test performed on the PFC specimen after it underwent 25 freeze–thaw cycles. The experimental data show that following the freeze–thaw test, the water absorption of the PFC is greater compared to both the control group and the carbonation group. At 48 h, the water absorption rates are as follows: FT-1200 is 0.31%, FT-1350 is 0.24%, and FT-1500 is 0.1%.

3.4. Effect of Three Hydrophobic Coatings on the Impermeability of PFC

3.4.1. Functionalization Tests for G/S

PU is a polymer material with a basic unit of urea bonds (-NHCOO-), formed through the polymerization reaction of isocyanates and polyols. The FTIR spectrum of rigid PU foam at room temperature in air is shown in Figure 17a.
For MDI, the symmetric and asymmetric stretching vibrations of N-H are represented by broad absorption bands near 3869 cm−1 and 3746 cm−1, respectively. A moderately strong peak at 1520 cm−1 confirms the in-plane bending vibration of N-H. The sharp absorption peak around 1705 cm−1 is typically associated with the stretching vibration of ester C=O and the asymmetric stretching vibration of N-CO-O. The weak peak near 631 cm−1 is attributed to the symmetric stretching vibration of N-CO-O. Additionally, several weak peaks in the range from 631 to 578 cm−1 correspond to the out-of-plane bending vibration of C-H in the polysubstituted benzene ring. For PP, the peaks near 2363 cm−1 are due to the stretching vibrations of C-H in methyl, methylene, and methine groups. The -CH3 group exhibits a symmetric bending vibration at 1380 cm−1. The stretching of ether bonds C-O-C results in a broad and strong absorption peak at 1009 cm−1.
Figure 17b illustrates the analysis of surface functional groups on GO using FTIR spectroscopy. The characteristic peak observed at 3414 cm−1 corresponds to the intermolecular stretching vibration of the -OH group. In addition, the carbonyl C=C peak at 1684 cm−1, the C=O backbone vibration at 1497 cm−1, and the C-O-C stretching vibration at 1067 cm−1 in GO are weakened.
Figure 17c shows the FTIR spectra of KH-550 as determined by FTIR spectroscopy. The absorption peak at 2981 cm−1 is attributed to the asymmetric stretching vibration, symmetric stretching vibration, and deformation vibration of C-H. The absorption peak at 1076 cm−1 is associated with the stretching vibrations of C=C and N-H. Additionally, the absorption peaks at 1076 cm−1 and 777 cm−1 correspond to the C-Si-O and Si-O-Si vibrations, respectively [39].
Figure 17d shows the FTIR spectrum of G/S. The shift in the characteristic peak of the OH stretching vibration from 3414 cm−1 to 3353 cm−1 in G/S suggests that the hydroxyl groups of GO have chemically reacted with the silane coupling agent. This reaction leads to a decrease in the number of available functional groups. A change in the peak at 1660 cm−1 indicates a reduction in the characteristic peak associated with the bending vibration of water absorbed by G/S. The weak absorption peak at 854 cm−1 corresponds to the Si-O-Si bond vibration resulting from the self-polymerization of silanol groups. Additionally, the absorption peak at 954 cm−1 increases to some extent, attributed to the formation of Si-O-C bonds between the silanol hydroxyl groups and the hydroxyl groups of GO during the reaction [40].
To demonstrate the functionalization of GO lamellae with KH-550, we analyzed the FTIR spectra of both GO and G/S samples, as illustrated in Figure 16. The FTIR spectrum of GO displayed a C=C backbone vibration at 1684 cm−1 [41], a C-O-C vibration of epoxy groups at 1067 cm−1, and a C=O stretching vibration at 1497 cm−1 [42,43,44]. Upon interaction with KH-550, new bands at 954 cm−1 and 854 cm−1 appeared in the FTIR spectrum of G/S, which were attributed to the formation of Si-O-C bonds between GO and silane agents. Meanwhile, the positions of some GO vibrational bands, such as -OH, C=C, and C-O, showed slight shifts in the spectra of the G/S samples. In the G/S samples, the intensity of these peaks is weakened due to their overlap with the N-H, NH2, and C-N vibrational bands of the silane groups. These changes suggest the pyrolysis of GO’s unstable oxygen-containing groups and the chemical reaction between GO functional groups and the amine groups of KH-550 [45,46].
Figure 18 shows the SEM and EDS test results of concrete specimens treated with different waterproofing coatings at 1000x magnification. The appearance of the specimens treated with GO dispersion coatings showed no substantial differences compared to those without coatings. In contrast, the silane emulsion-coated specimens exhibited flocculated structures on the inner surface, while the composite emulsion-coated specimens displayed clusters on the inner surface in addition to flocculated structures. Figure 18 also presents the EDS results for concrete samples treated with different waterproofing coatings. The Ca/Si ratios for the uncoated, GO-coated, silane emulsion-coated, and composite emulsion-coated specimens were 9.5, 9.6, 8.3, and 33.2, respectively. These findings suggest that the flocculated structures observed in the SEM images are attributed to the silane-based waterproofing materials. Additionally, the GO coating did not form a strong bond with the concrete, as evidenced by its Ca/Si ratio of 9.6, which is similar to that of the uncoated specimens. In contrast, both the silane emulsion and composite emulsion demonstrated good adhesion to the concrete.
Figure 19 illustrates that the carbon content in the composite emulsion-coated specimens is greater than that in the uncoated specimens, with values of 12.9 in the silane emulsion-coated specimens and 21.7 in the composite emulsion-coated specimens. This reveals the covalent bonding of GO and silanes in the composite emulsions. The homogeneous precipitation of KH-550 on GO, along with the removal of the oxidized functional groups of GO, offers binding sites for small silane molecules, thereby altering its lamellar morphology [47]. This interaction enables silane molecules to form a cluster-like structure within the concrete, leading to a robust bond with the substrate and enhancing the thickness of the hydrophobic layer. Consequently, this improves the impermeability of the PFC specimens. GO, the silane coupling agent KH-550, and G/S composite emulsion were used as coating agents to spray the surface of the specimens.

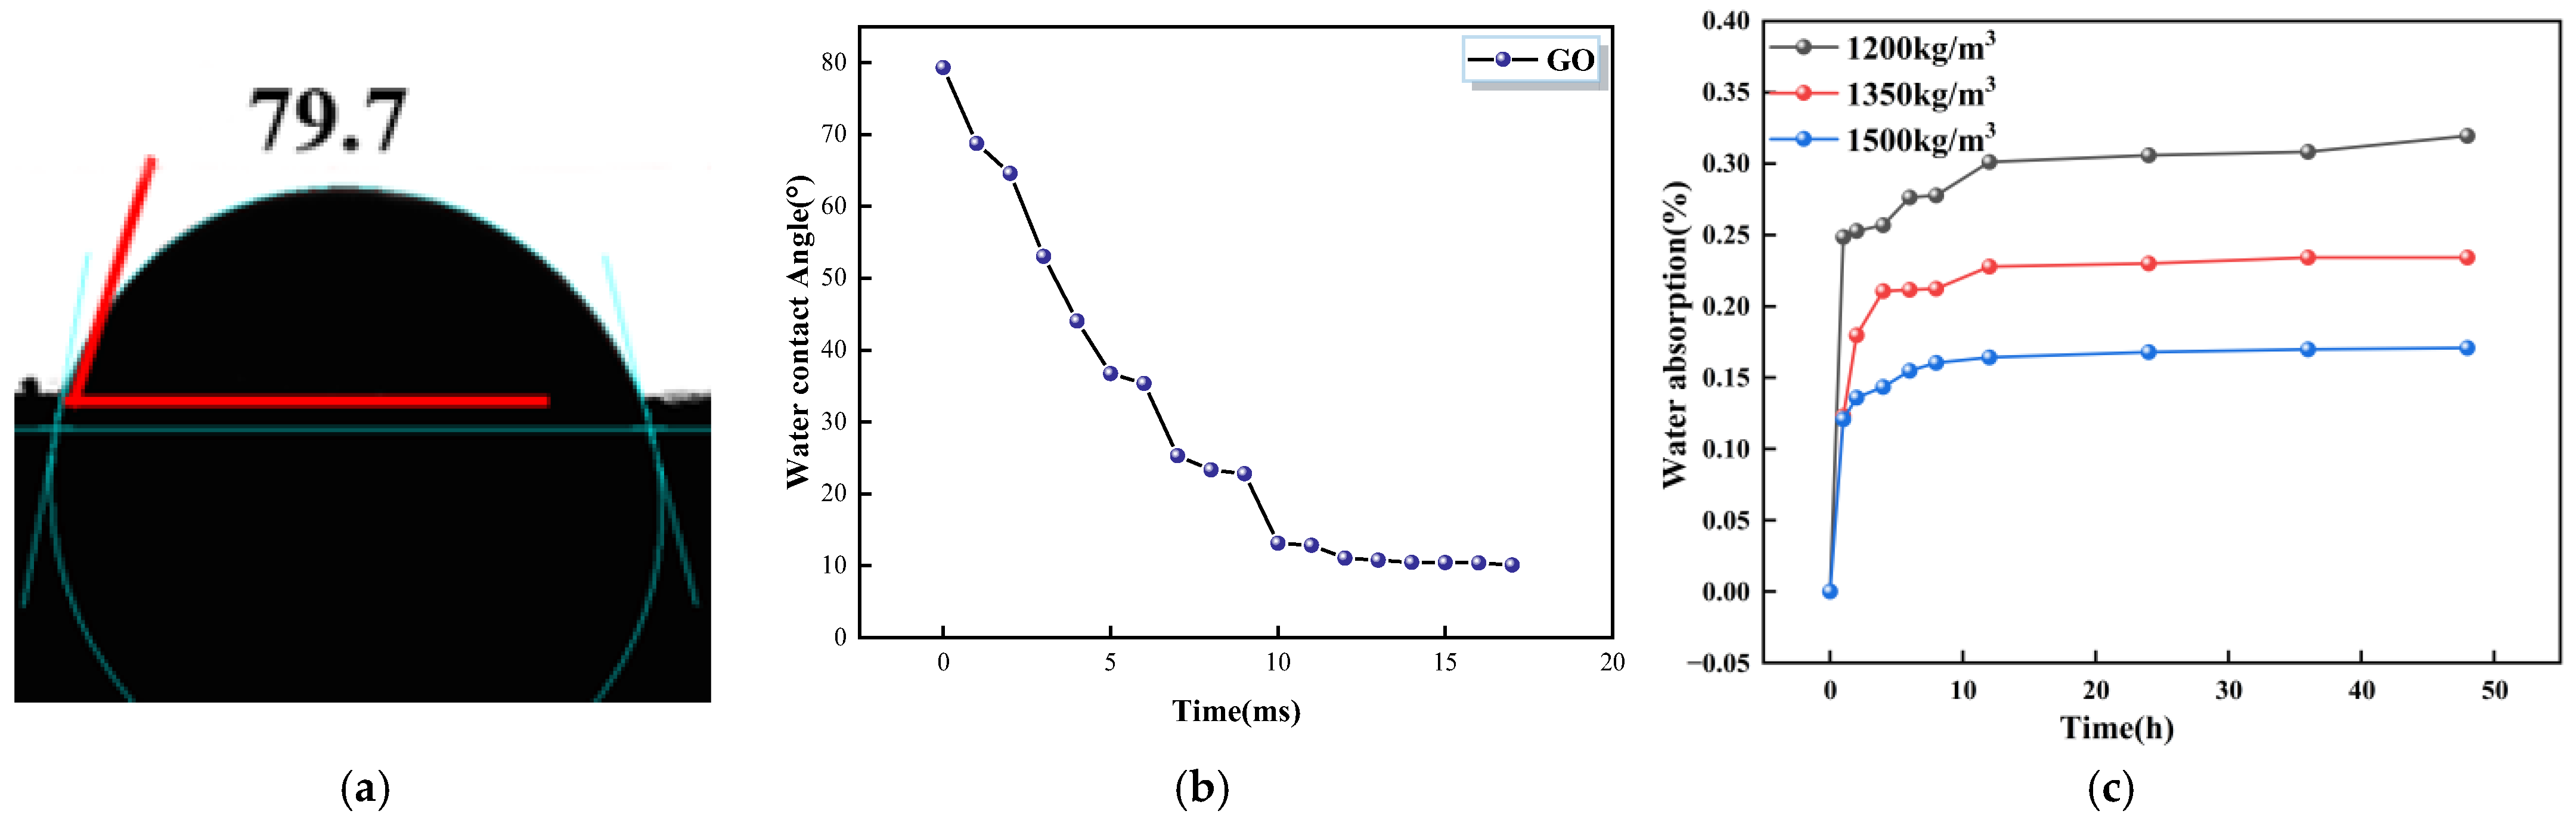
3.4.2. Contact Angle and Water Absorption Curve for GO Groups

As shown in Figure 20a, when coated with GO, the water contact angle on the PFC surface measured 79.7°. The curve of water contact angle versus titration time is depicted in Figure 20b. As the titration duration extended, the water contact angle swiftly dropped within the first 10 ms, and thereafter, the contact angle changed slowly after 10 ms. Compared to the PFC control group, which had a contact angle of 44°, the carbonization group exhibited a contact angle of 66.2°. However, the water repellency of the GO group was not satisfactory, as the contact angle increased by only 35.7° compared to the control group, but the contact angle was still less than 90°, and it decreased too quickly. This indicates that GO does not have a significant waterproofing effect on the concrete surface. This is attributed to the hydroxyl and carboxyl groups contained in graphene oxide, which make it hydrophilic. The complexation of GO by BSP [29] does not occur due to the absence of functional groups on the GO surface.
As depicted in Figure 20c, water absorption peaked at 0.3% for GO-1200, 0.23% for GO-1350, and 0.17% for GO-1500 at 48 h. The water absorption of concrete coated with GO dispersion was comparable to that of uncoated concrete, particularly when compared to the significantly lower water absorption rate of PU-1200, which was 0.27%. The water absorption rates of PU-1350 and PU-1500 were 0.13% and 0.07%, respectively, both of which were lower than those of the GO group. This indicates that the waterproofing effect of GO on the PFC was not significantly improved.

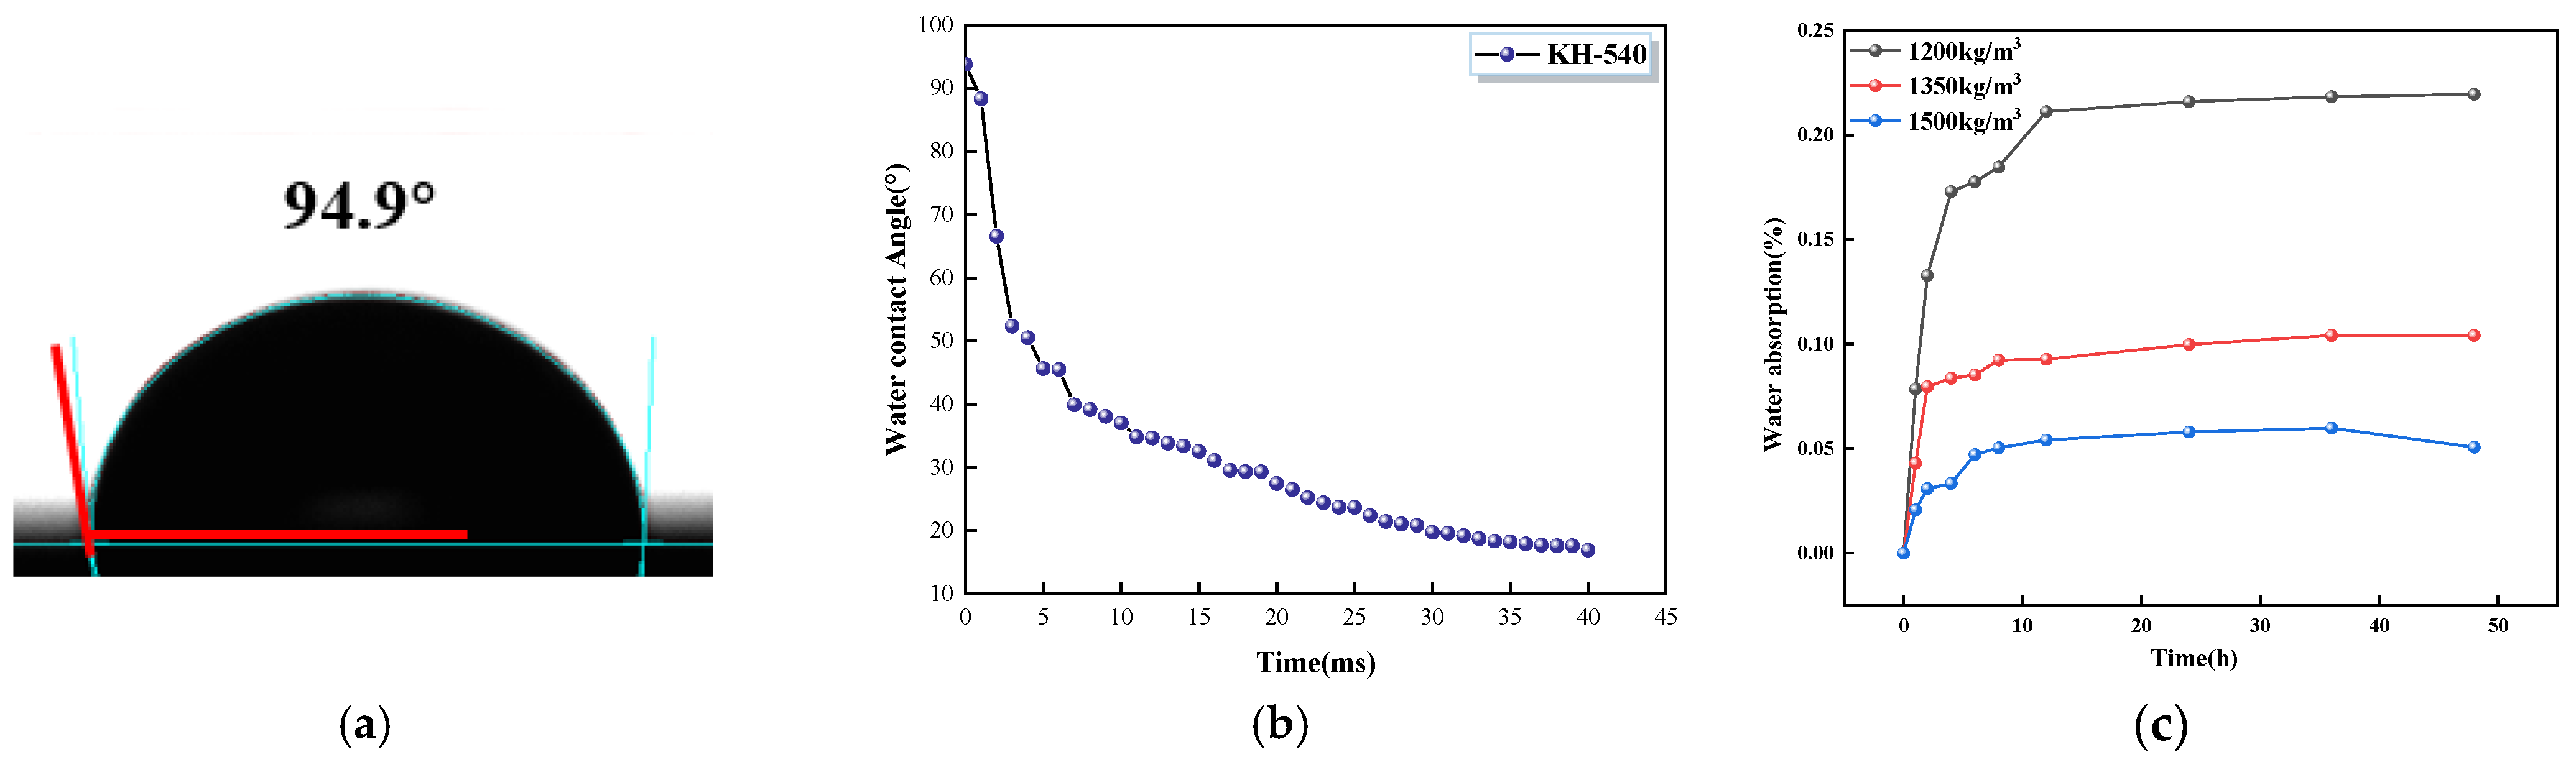
3.4.3. Contact Angle and Water Absorption Curves for KH-550 Groups

As shown in Figure 21a,b, treating the concrete surface with silane emulsion KH-550 increased the water contact angle on the PFC surface to 94.9°. This change indicates that the PFC surface transitioned from hydrophilic to hydrophobic due to the silane treatment. The KH-550 displaced the water on the PFC surface and encapsulated the surface particles, with the R groups oriented outward, thereby enhancing hydrophobicity.
As shown in Figure 21c, the water absorption of SCA-1200 reached a maximum of 0.21%, SCA-1350 reached 0.1%, and SCA-1500 reached 0.05% at 48 h. Compared to the control group, the water absorption of the KH-550-treated groups with varying densities was reduced by 22%, 23%, and 29%, respectively.

3.4.4. Contact Angle and Water Absorption Curves for G/S Groups

As depicted in Figure 22a,b, the water contact angle of the PFC surface treated with the G/S group was 120.2°, significantly higher than that of the concrete surface treated only with KH-550. As shown in Figure 22c, the PFC coated with the G/S group exhibited the lowest water absorption in the same time period, indicating the most effective waterproofing among the tested treatments. Water absorption in PFC specimens coated with G/S at various densities was reduced by 41%, 46%, and 29% compared to untreated PFC. When compared to PFC specimens coated with the GO group, the reduction in water absorption for the G/S-coated specimens was 47%, 70%, and 71%. Additionally, compared to PFC specimens coated with the KH-550 group, the water absorption of the G/S-coated specimens was reduced by 24%, 30%, and 40%. The emulsion penetrated the concrete and formed covalent bonds, creating a hydrophobic silane layer inside the concrete. This layer effectively prevented water from penetrating the interior. By incorporating GO, the silane increased the thickness of the hydrophobic layer, using GO as a template. This addition also decreased the microscopic pores in the hydrophobic layer, thus improving its waterproofing capabilities.

4. Conclusions

The impermeability properties of monolithic and surface hydrophobic modified foam concrete were tested using water contact angle measurements and water absorption tests. The functionalization of the G/S composite emulsion coating was verified by EDS and FTIR analyses. The following conclusions were obtained:
1.
PU has a strong hydrophobic effect on concrete. The water contact angle of ordinary concrete is 23.8°, while that of PFC is 44°, an increase of 9.4° compared to ordinary concrete. The water absorption of PFC specimens at 48 h is 0.28% for PU-1200, 0.13% for PU-1350, and 0.07% for PU-1500. This indicates that adding PU foam to concrete can effectively enhance its water resistance.
2.
Carbonization enhances hydrophobicity. The water contact angle of the PFC specimen with a carbonized layer was 66.2° initially, and it decreased to 14.4° at 27 ms. After carbonization, the PFC surface became covered with CaCO3 particles, leading to a gradual increase in the contact angle. The water absorption test, conducted 48 h after carbonization for the control group, showed that the water absorption rate was 0.2% for CG-1200, 0.13% for CG-1350, and 0.1% for CG-1500.
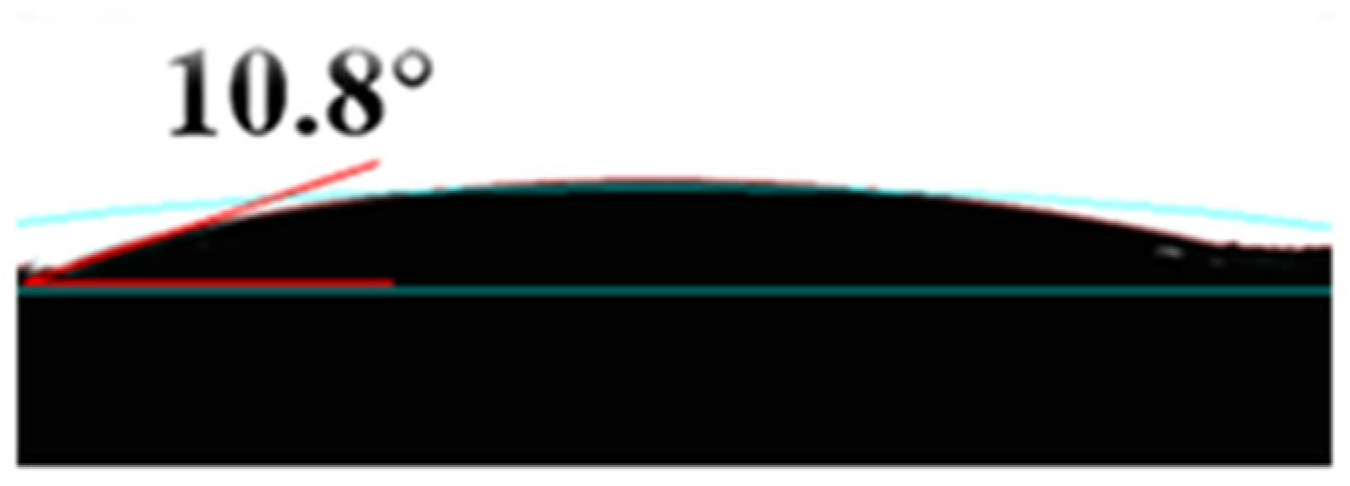
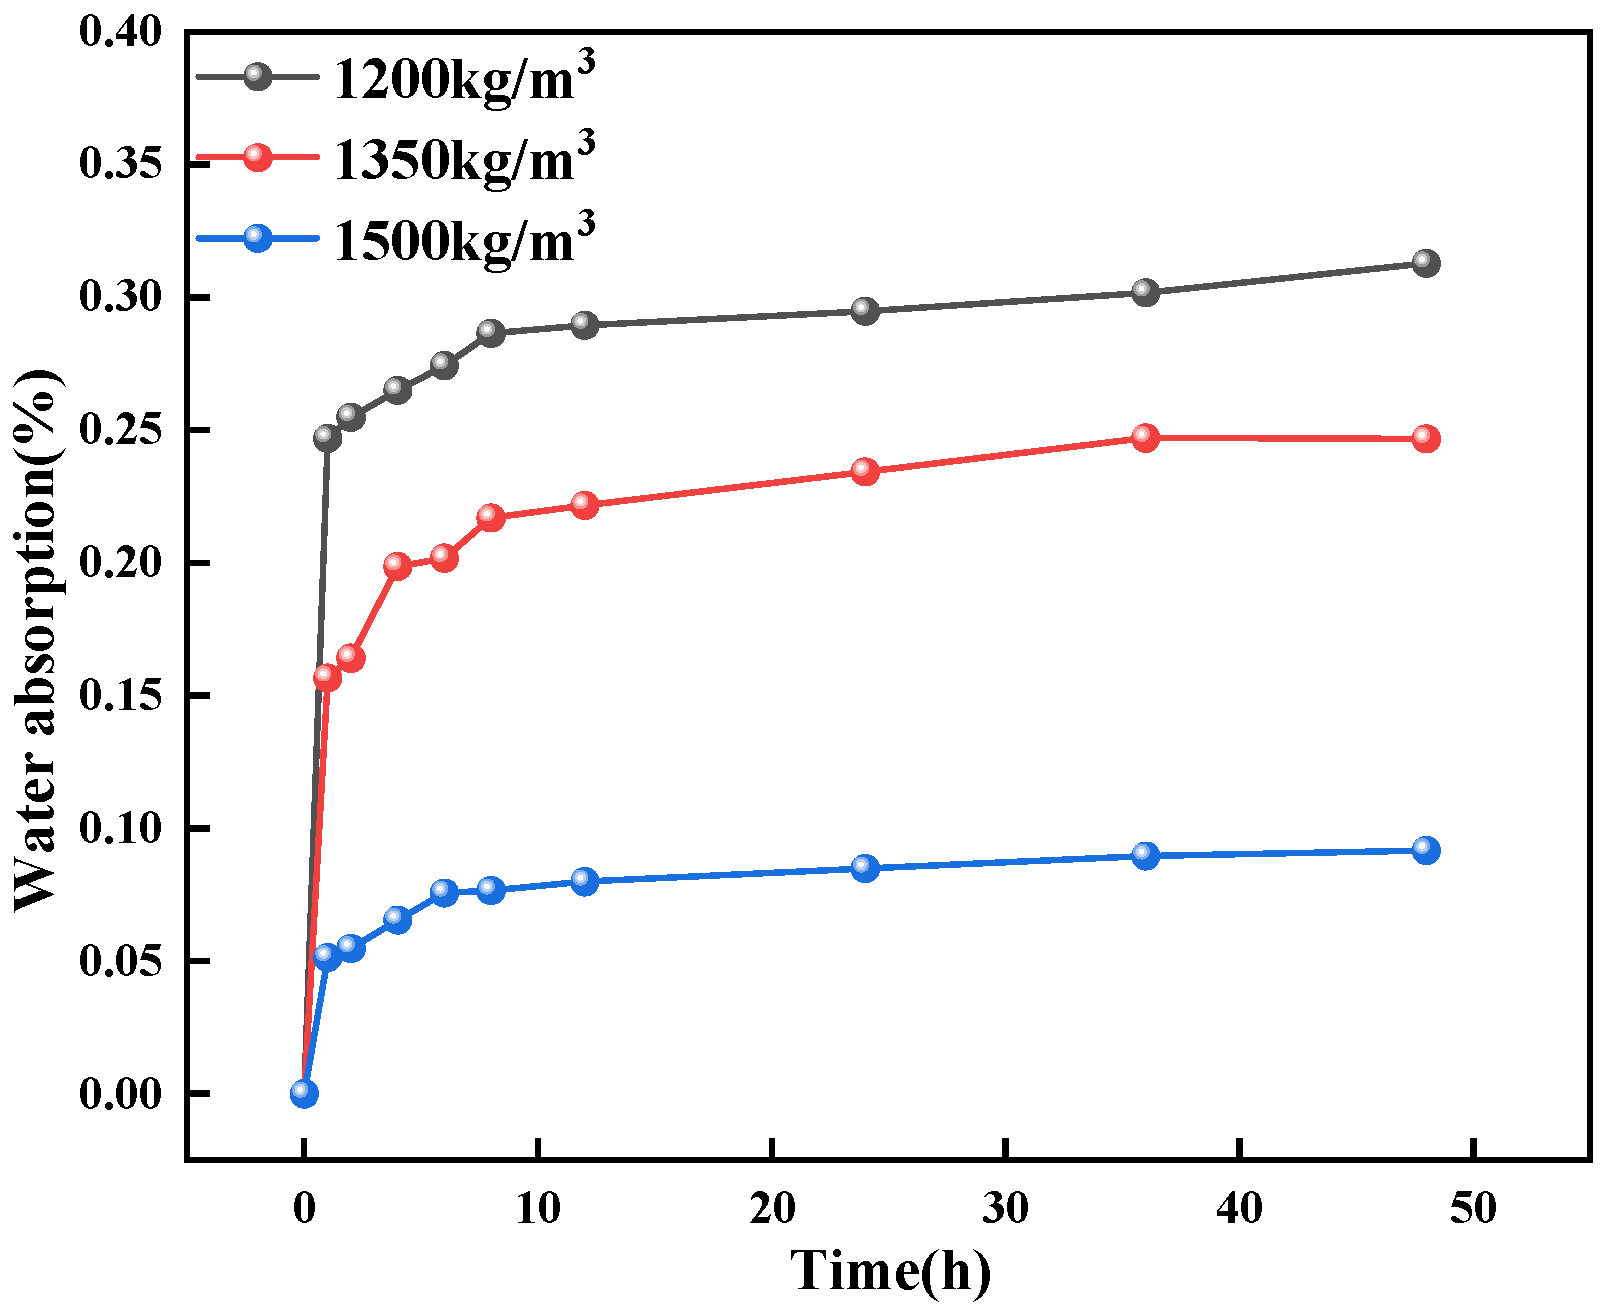
3.
Freeze–thaw cycles degrade hydrophobic properties. As these cycles repeat, the internal structure of PFC deteriorates, causing micro-cracks to merge into larger cracks. This expansion of internal water storage space results in a reduced water contact angle. After freeze–thaw treatment, the water contact angle of the PFC specimen was 10.8°. The water absorption rates were 0.31% for FT-1200, 0.24% for FT-1350, and 0.1% for FT-1500.
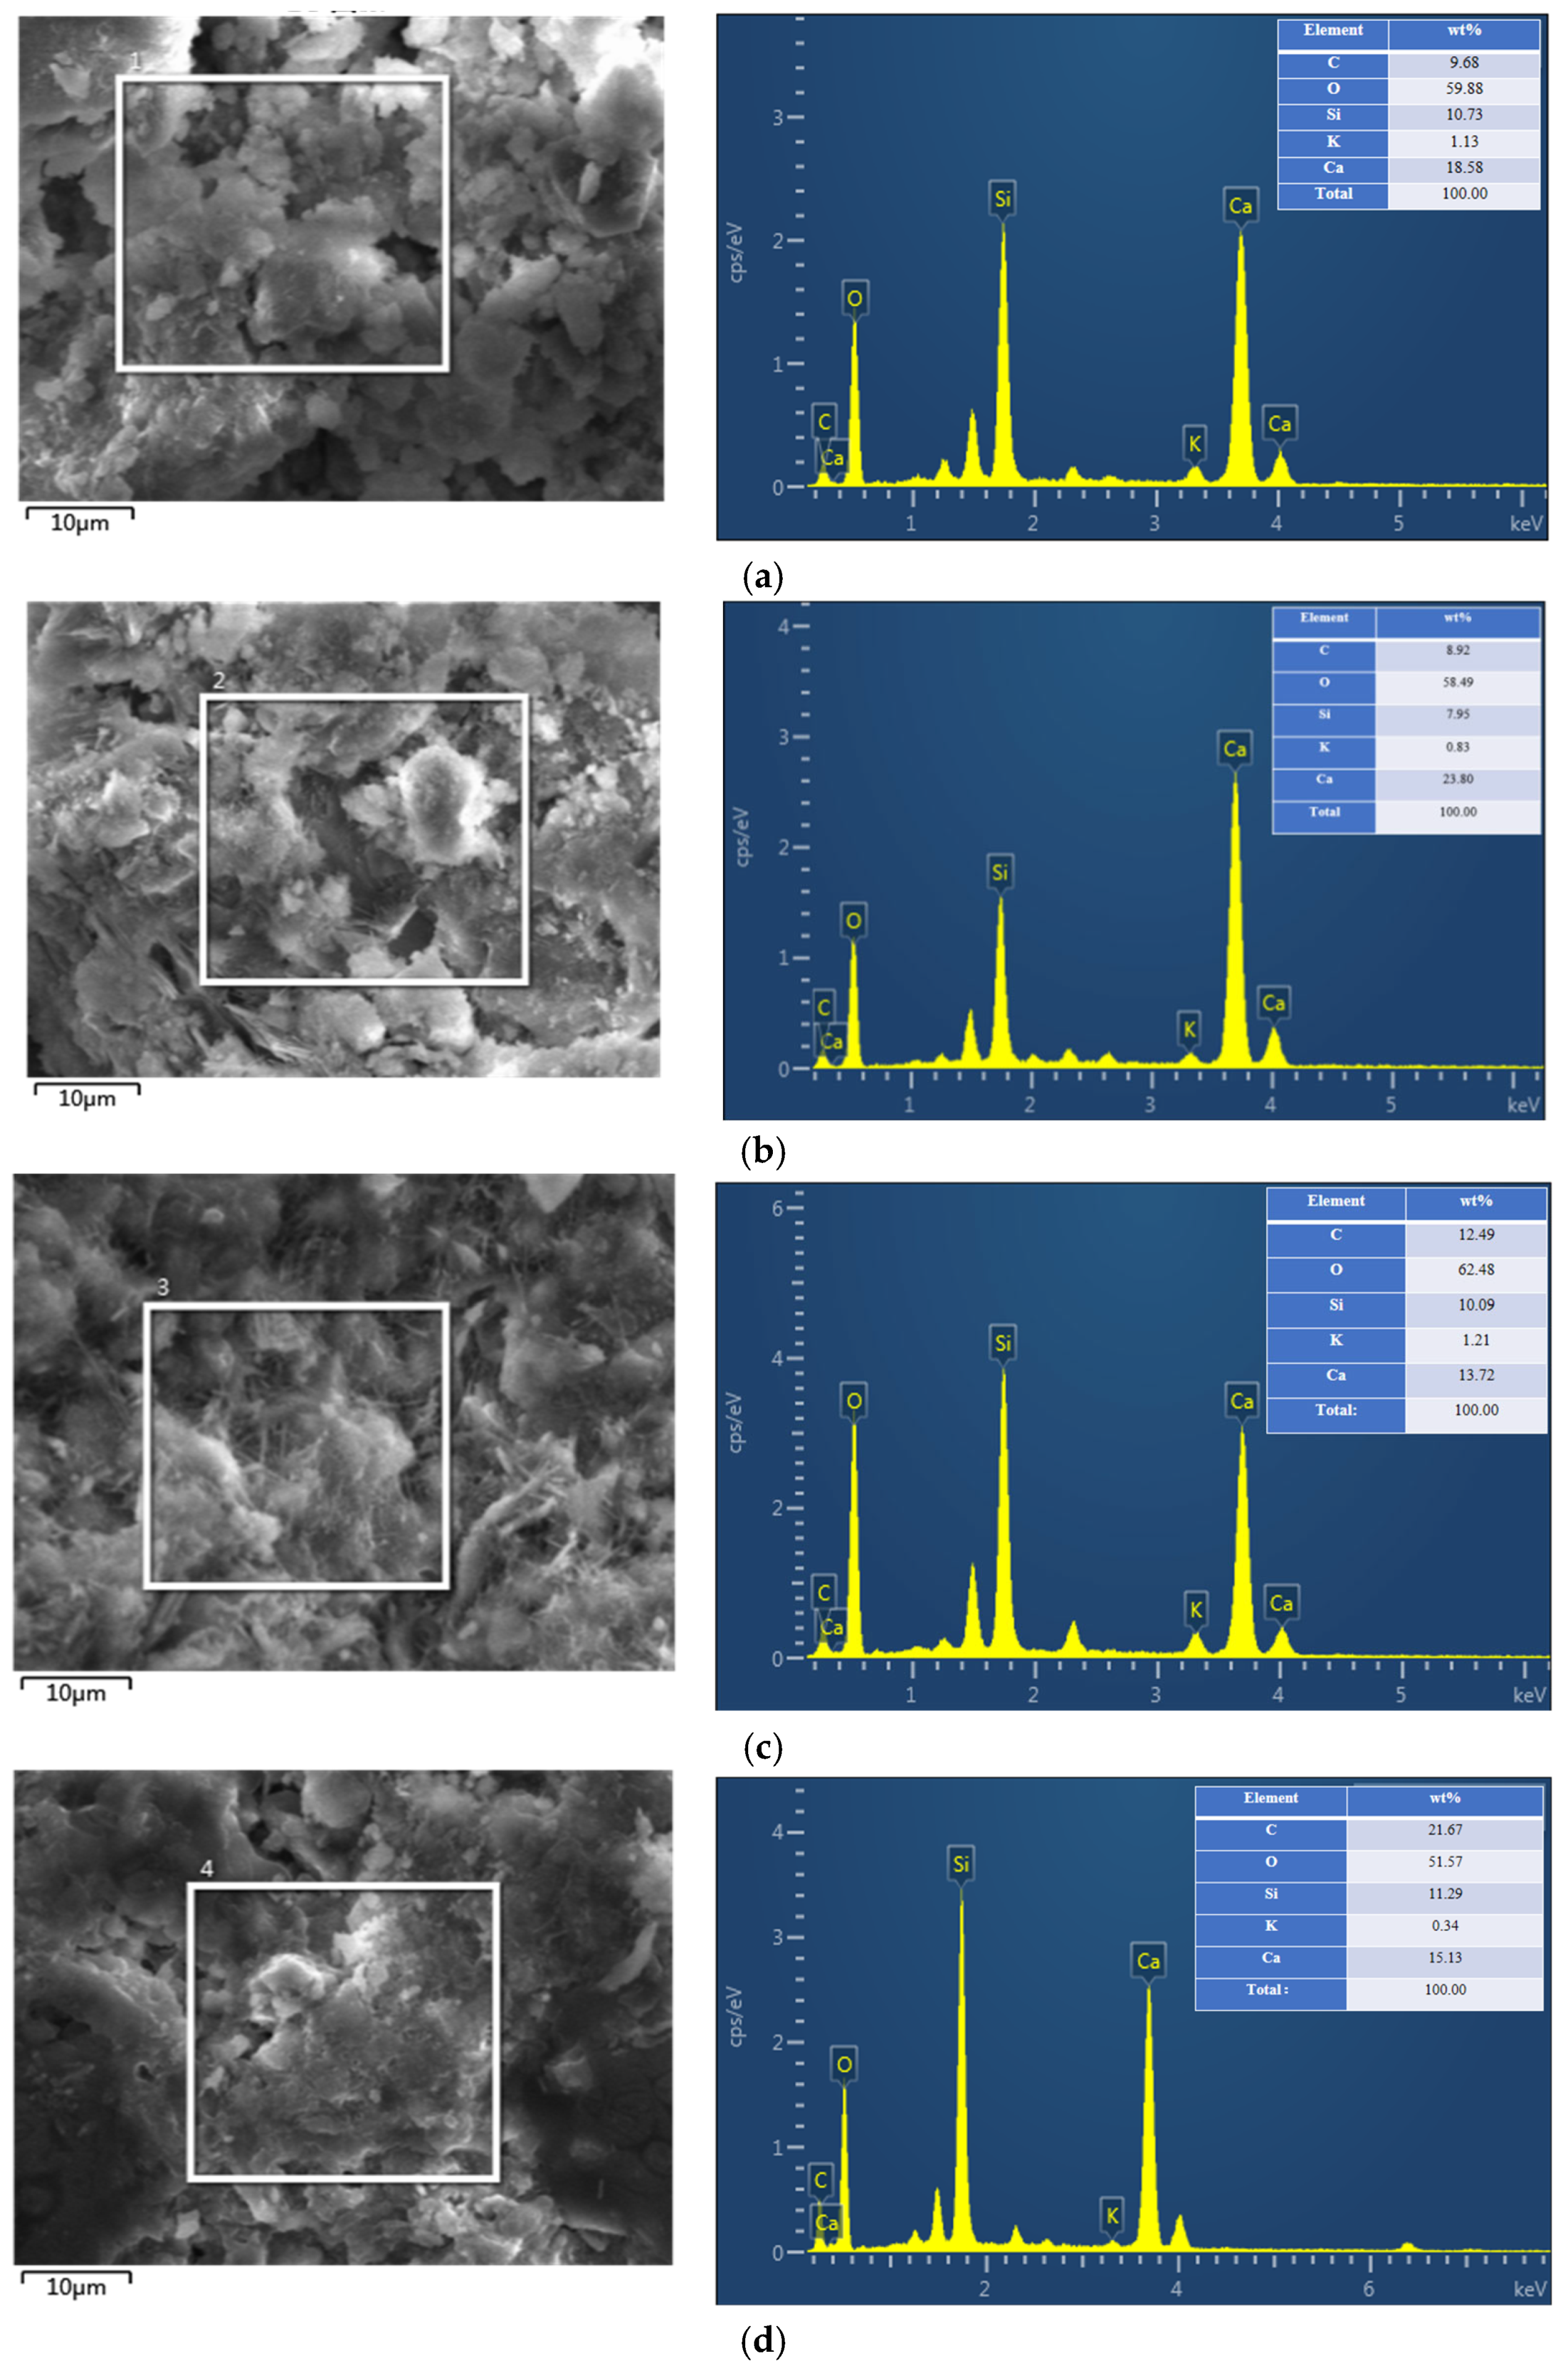
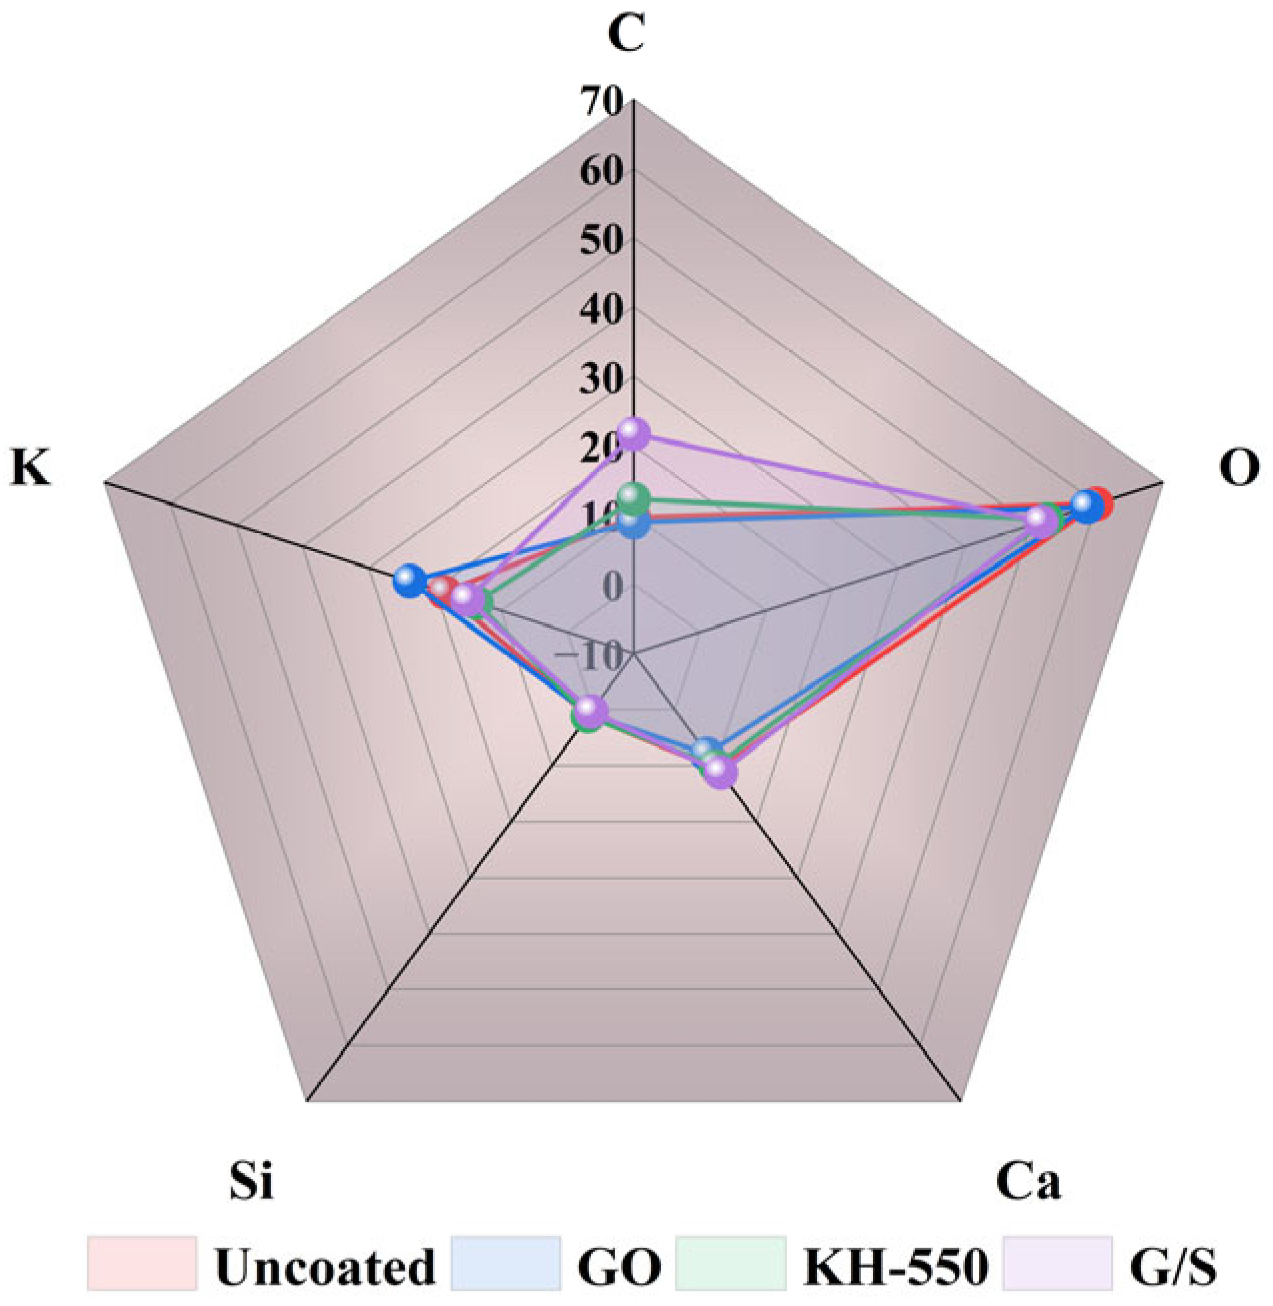
4.
GO, KH-550, and G/S all enhanced the impermeability of PFC, with G/S having the most significant effect on improving impermeability performance. Functionalization between GO and KH-550 was achieved, resulting in the appearance of new bands at 954 and 854 cm−1 in the FTIR spectra of G/S after the interaction between GO and KH-550. For the GO-coated PFC, the water contact angle of the specimen was 79.7°, which is an increase of 35.7° compared to the uncoated PFC. This suggests that GO alone did not significantly enhance the water repellency of the concrete surface. However, after treating the concrete surface with the silane emulsion KH-550, the water contact angle increased to 94.9°, changing the surface from hydrophilic to hydrophobic. After G/S treatment, the water contact angle further escalated to 120.2°, markedly surpassing the angle obtained with only the silane emulsion. The water absorption of concrete coated with GO dispersion was similar to that of uncoated PFC. However, when PFC was treated with KH-550, the water absorption of specimens coated at different densities was reduced to 22%, 23%, and 29%, respectively. After treatment with the G/S group, the water absorption of PFC specimens at different densities was further reduced to 41%, 46%, and 29%.
The findings of this study demonstrate that hydrophobized PFC significantly enhances the durability of concrete by reducing water absorption and improving frost resistance. In practical engineering applications, the use of hydrophobized PFC can effectively prolong the service life of concrete structures, especially in cold climates where freeze–thaw damage is prevalent. This material not only mitigates moisture ingress and associated deterioration but also contributes to lowering maintenance costs by minimizing crack formation and surface scaling. Furthermore, hydrophobized PFC offers environmental benefits by potentially reducing cement consumption and associated carbon emissions, aligning with sustainable construction practices. Its versatility makes it suitable for a wide range of infrastructure projects, including roads, bridges, tunnels, and underground facilities, where enhanced durability and water repellency are critical. Therefore, the incorporation of hydrophobized PFC presents a promising strategy for improving concrete performance and ensuring long-term structural integrity in demanding environments.
The water absorption rate of concrete is closely related to its frost resistance: The higher the water absorption rate, the poorer the frost resistance, and this relationship has been widely confirmed. With the application of modified materials and admixtures, the pore structure and water absorption behavior of concrete have changed, and its frost resistance mechanism may also differ. Therefore, studying the relationship between water absorption rate and frost resistance in modified concrete is of great significance for durability evaluation and engineering applications. In addition, hydrophilization treatment can effectively reduce the moisture content of concrete, inhibit the growth of fungi and mold, and improve durability and hygienic safety. Analyzing the impact of foam concrete modification on the depth of moisture penetration helps to comprehensively understand its water resistance and long-term service performance. In the future, it is necessary to systematically evaluate the hydrophilization effect and microbial protection performance, as well as the moisture penetration behavior, so as to provide theoretical support for the design and application of new concrete materials.

Author Contributions

Conceptualization, P.J.; investigation, P.Y. and F.W.; writing—original draft preparation, L.Y.; writing—review and editing, F.W. All authors have read and agreed to the published version of the manuscript.

Funding

This research received no external funding.

Institutional Review Board Statement

Not applicable.

Data Availability Statement

Data are contained within the article.

Conflicts of Interest

The authors declare no conflicts of interest.

Abbreviations

The following abbreviations are used in this manuscript:
PUPolyurethane
PFCPolyurethane foam concrete
FTIRFourier transform infrared spectrum
EDSEnergy dispersive X-ray spectrometer
GOGraphene oxide
G/SGraphene oxide and silane coupling agent complex emulsion
MDIDiphenylmethane diisocyanate
PPPolyether polyols
BSPBasalt stone powder
XRDX-ray diffractometer
KH-550Silane coupling agent

References

  1. Wu, H.; Zhang, Y.; Li, M.; Chen, X.; Wang, J.; Liu, S. Study on preparation and performance of advanced aerogel foamed concrete with ultra-light aerogel. Constr. Build. Mater. 2023, 366, 130166. [Google Scholar] [CrossRef]
  2. Feng, Z.; Wang, L.; Zhang, H.; Liu, Y.; Chen, M.; Li, X. Integral hydrophobic concrete without using silane. Constr. Build. Mater. 2019, 227, 116678. [Google Scholar] [CrossRef]
  3. Yu, J.; Chen, S.; Wang, K.; Liu, H.; Zhang, M.; Li, Y. Insights on the capillary transport mechanism in the sustainable cement hydrate impregnated with graphene oxide and epoxy composite. Compos. Part B Eng. 2019, 173, 106907. [Google Scholar] [CrossRef]
  4. Huang, K.; Si, Y.; Hu, J. Fluid Unidirectional Transport Induced by Structure and Ambient Elements across Porous Materials: From Principles to Applications. Adv. Mater. 2024, 36, 2402527. [Google Scholar] [CrossRef] [PubMed]
  5. Zhang, Y.; Xue, Z. Deformation-based monitoring of water migration in rocks using distributed fiber optic strain sensing: A laboratory study. Water Resour. Res. 2019, 55, 8368–8383. [Google Scholar] [CrossRef]
  6. Hu, J.Y.; Zhang, S.S.; Chen, E.; Li, W.G. A review on corrosion detection and protection of existing reinforced concrete (RC) structures. Constr. Build. Mater. 2022, 325, 126718. [Google Scholar] [CrossRef]
  7. Zhao, J.; Wang, X.; Liu, M.; Chen, Y.; Li, H.; Zhang, K. Hydrophobic or superhydrophobic modification of cement-based materials: A systematic review. Compos. Part B Eng. 2022, 243, 110104. [Google Scholar] [CrossRef]
  8. Xu, Y.; Chen, L.; Wang, H.; Liu, X.; Zhang, M.; Li, S. Research on the performance of foamed concrete based on superhydrophobic bulk modification. Constr. Build. Mater. 2024, 438, 137231. [Google Scholar] [CrossRef]
  9. Aktas, Y.D.; Zhu, H.; D’Ayala, D.; Weeks, C. Impact of surface waterproofing on the performance of brick masonry through the moisture exposure life-cycle. Build. Environ. 2021, 197, 107844. [Google Scholar] [CrossRef]
  10. Chen, X.; De Kock, T.; Cnudde, V.; Van Den Bossche, N. The influence of material characteristics and environmental circumstances on the efficiency of water repellent treatments of historic facades. Constr. Build. Mater. 2023, 386, 131610. [Google Scholar] [CrossRef]
  11. Weisheit, S.; Unterberger, S.H.; Bader, T.; Lackner, R. Assessment of test methods for characterizing the hydrophobic nature of surface-treated High Performance Concrete. Constr. Build. Mater. 2016, 110, 145–153. [Google Scholar] [CrossRef]
  12. Nguyen-Ha, T.M.; Kim, J.H.; Lee, S.Y.; Park, M.J.; Chen, X.; Wang, L. Novel high-performance sustainable polyurethane nanocomposite foams: Fire resistance, thermal stability, thermal conductivity, and mechanical properties. Chem. Eng. J. 2023, 474, 145585. [Google Scholar] [CrossRef]
  13. Geramipour, T.; Oveisi, H. Effects of foaming parameters on microstructure and compressive properties of aluminum foams produced by powder metallurgy method. Trans. Nonferrous Met. Soc. China 2017, 27, 1569–1579. [Google Scholar] [CrossRef]
  14. An, Y.; Zhang, H.; Liu, X.; Wang, M.; Chen, L.; Li, S. Foaming stabilization and mechanical properties of high-toughness aluminum foam fabricated using non-thickening foaming technology. J. Mater. Process. Technol. 2021, 296, 117212. [Google Scholar] [CrossRef]
  15. Petlitckaia, S.; Poulesquen, A. Design of lightweight metakaolin based geopolymer foamed with hydrogen peroxide. Ceram. Int. 2019, 45, 1322–1330. [Google Scholar] [CrossRef]
  16. Yan, S.; Chen, Y.; Wang, X.; Liu, M.; Zhang, K.; Li, H. Green synthesis of high porosity waste gangue microsphere/geopolymer composite foams via hydrogen peroxide modification. J. Clean. Prod. 2019, 227, 483–494. [Google Scholar] [CrossRef]
  17. Jiang, C.; Wang, L.; Zhang, H.; Liu, Y.; Chen, M.; Li, X. Self-healing polyurethane-elastomer with mechanical tunability for multiple biomedical applications in vivo. Nat. Commun. 2021, 12, 4395. [Google Scholar] [CrossRef] [PubMed]
  18. Liu, Z.; Chen, S.; Wang, K.; Zhang, M.; Li, Y.; Liu, H. Chemical upcycling of commodity thermoset polyurethane foams towards high-performance 3D photo-printing resins. Nat. Chem. 2023, 15, 1773–1779. [Google Scholar] [CrossRef] [PubMed]
  19. Sui, T.; Baimpas, N.; Dolbnya, I.P.; Prisacariu, C.; Korsunsky, A.M. Multiple-length-scale deformation analysis in a thermoplastic polyurethane. Nat. Commun. 2015, 6, 6583. [Google Scholar] [CrossRef] [PubMed]
  20. Park, S.; Kim, M.; So, H. TPU-assisted adhesive PDMS film for dry or underwater environments. NPG Asia Mater. 2024, 16, 26. [Google Scholar] [CrossRef]
  21. Zhang, X.; Guan, Q.; Wen, Y.; Wang, Z.; Xie, H. Improved thermal stability and flame retardancy of soybean oil-based polyol rigid polyurethane foams modified with magnesium borate hydroxide and ammonium polyphosphate. Sci. Rep. 2024, 14, 17340. [Google Scholar] [CrossRef] [PubMed]
  22. Choe, K.H.; Lee, D.S.; Seo, W.J.; Kim, W.N. Properties of Rigid Polyurethane Foams with Blowing Agents and Catalysts. Polym. J. 2004, 36, 368–373. [Google Scholar] [CrossRef]
  23. Yang, L.; Chen, S.; Wang, K.; Liu, H.; Zhang, M.; Li, Y. Durability of waste concrete powder-based geopolymer reclaimed concrete under carbonization and freeze–thaw cycles. Constr. Build. Mater. 2023, 403, 133155. [Google Scholar] [CrossRef]
  24. Chen, J.; Chen, B.; Qiang, S.; Chen, S. Study on strength deterioration mechanism of foamed concrete under freeze-thaw cycles: Experiment and numerical simulation. Constr. Build. Mater. 2024, 438, 137083. [Google Scholar] [CrossRef]
  25. Li, S.; Wang, X.; Zhang, H.; Liu, Y.; Chen, M.; Liu, K. Application of silane protective materials in the concrete durability improvement in recent years: A review. Eng. Fail. Anal. 2024, 160, 108140. [Google Scholar] [CrossRef]
  26. Wu, C.; Hou, D.; Yin, B.; Chen, B.; Li, Z. A polystyrene acrylate-polysiloxane multicomponent protective coating with interpenetrating polymer network structure for cementitious materials. Prog. Org. Coat. 2024, 195, 108640. [Google Scholar] [CrossRef]
  27. Zhao, L.; Zhang, Y.; Wang, H.; Liu, X.; Chen, M.; Li, S. Silane treatment for sisal fibers to improve the degradation resistance and interface with cement matrix. Constr. Build. Mater. 2024, 429, 136435. [Google Scholar] [CrossRef]
  28. Yu, H.; Chen, L.; Wang, K.; Zhang, M.; Liu, S.; Li, Y. The roles of oxygen-containing functional groups in modulating water purification performance of graphene oxide-based membrane. Chem. Eng. J. 2020, 389, 124375. [Google Scholar] [CrossRef]
  29. Jiang, P.; Wang, F.; Wang, W.; Li, N.; Yu, S. The absorption effect and mechanism of graphene oxide removal from aqueous solution by basalt stone power. Arab. J. Chem. 2024, 17, 105805. [Google Scholar] [CrossRef]
  30. Jiang, P.; Wang, F.; Li, N.; Wang, W.; Wang, B.; Yu, P. Polyurethane foam lightweight concrete: Preparation, CO2 fixation properties and mechanism. J. CO2 Util. 2025, 97, 103109. [Google Scholar] [CrossRef]
  31. Parsons, L.A.; Nwaubani, S.O. Abrasion-wear resistance of precarbonated and water-cured concrete made using ABS plastic derived from waste electrical and electronic equipment. Cem. Concr. Res. 2024, 179, 107470. [Google Scholar] [CrossRef]
  32. Yu, B.; Jiang, Z.; Tang, X.-Z.; Yue, C.Y.; Yang, J. Enhanced interphase between epoxy matrix and carbon fiber with carbon nanotube-modified silane coating. Compos. Sci. Technol. 2014, 99, 131–140. [Google Scholar] [CrossRef]
  33. Chen, K.; Wang, L.; Zhang, H.; Liu, Y.; Chen, M.; Li, S. Effect of silane coupling agent on compatibility interface and properties of wheat straw/polylactic acid composites. Int. J. Biol. Macromol. 2021, 182, 2108–2116. [Google Scholar] [CrossRef] [PubMed]
  34. Cui, H.; Tang, W.; Liu, W.; Dong, Z.; Xing, F. Experimental study on effects of CO2 concentrations on concrete carbonation and diffusion mechanisms. Constr. Build. Mater. 2015, 93, 522–527. [Google Scholar] [CrossRef]
  35. Code, C. Model Code for Service Life Design; Federation Internationale du Beton: Lausanne, Switzerland, 2006. [Google Scholar]
  36. GB/T 50082-2009; Standard for Test Methods of Long-Term Performance and Durability of Ordinary Concrete. China Architecture & Building Press: Beijing, China, 2009.
  37. Pourhashem, S.; Vaezi, M.R.; Rashidi, A.; Bagherzadeh, M.R. Distinctive roles of silane coupling agents on the corrosion inhibition performance of graphene oxide in epoxy coatings. Prog. Org. Coat. 2017, 111, 47–56. [Google Scholar] [CrossRef]
  38. Zhang, W.; Chen, S.; Liu, X.; Wang, K.; Li, Y.; Zhang, H. Influence of damage degree on the degradation of concrete under freezing-thawing cycles. Constr. Build. Mater. 2020, 260, 119903. [Google Scholar] [CrossRef]
  39. Wei, B.; Wang, X.; Chen, L.; Liu, M.; Zhang, K.; Li, H. Surface modification of filter medium particles with silane coupling agent KH550. Colloids Surf. A 2013, 434, 276–280. [Google Scholar] [CrossRef]
  40. Zhong, J.; Li, H.; Yu, J.; Tan, T. Effects of natural fiber surface modification on mechanical properties of poly (lactic acid)(PLA)/sweet sorghum fiber composites. Polym. Plast. Technol. Eng. 2011, 50, 1583–1589. [Google Scholar] [CrossRef]
  41. Chen, P.; Wang, L.; Zhang, H.; Liu, Y.; Chen, M.; Li, S. Carbonaceous nanofiber membrane functionalized by beta-cyclodextrins for molecular filtration. ACS Nano 2011, 5, 5928–5935. [Google Scholar] [CrossRef] [PubMed]
  42. Zhang, B.; Liu, X.; Chen, S.; Wang, K.; Li, Y.; Zhang, H. Magnetic iron oxide/graphene oxide nanocomposites: Formation and interaction mechanism for efficient removal of methylene blue and p-tert-butylphenol from aqueous solution. Mater. Chem. Phys. 2018, 205, 240–252. [Google Scholar] [CrossRef]
  43. Marcano, D.C.; Kosynkin, D.V.; Berlin, J.M.; Sinitskii, A.; Sun, Z.; Slesarev, A.; Alemany, L.B.; Lu, W.; Tour, J.M. Improved synthesis of graphene oxide. ACS Nano 2010, 4, 4806–4814. [Google Scholar] [CrossRef] [PubMed]
  44. Zhang, X.-J.; Wang, G.-S.; Cao, W.-Q.; Wei, Y.-Z.; Liang, J.-F.; Guo, L.; Cao, M.-S. Enhanced microwave absorption property of reduced graphene oxide (RGO)-MnFe2O4 nanocomposites and polyvinylidene fluoride. ACS Appl. Mater. Interfaces 2014, 6, 7471–7478. [Google Scholar] [CrossRef] [PubMed]
  45. Wang, X.; Jin, J.; Song, M. An investigation of the mechanism of graphene toughening epoxy. Compos. Sci. Technol. 2012, 72, 737–743. [Google Scholar] [CrossRef]
  46. Kou, L.; Gao, C. Making silica nanoparticle-covered graphene oxide nanohybrids as general building blocks for large-area superhydrophilic coatings. Nanoscale 2011, 3, 519–528. [Google Scholar] [CrossRef] [PubMed]
  47. Bittolo Bon, S.; Valentini, L.; Verdejo, R.; Garcia, M.A.; Epifani, M.; Hernández-Vélez, M.; López-Manchado, M.A. Deposition of amino-functionalized polyhedral oligomeric silsesquioxanes on graphene oxide sheets immobilized onto an amino-silane modified silicon surface. J. Mater. Chem. 2012, 22, 6213–6217. [Google Scholar]
Figure 1. BSP picture (a) and particle size distribution (b); MDI picture (c) and PP picture (d) [29,30].
Coatings 15 00854 g001
Figure 2. Elemental analysis table of GO.
Coatings 15 00854 g002
Figure 3. Analytical structure (a), chemical formula (b), and particle size analysis (c) of GO [29].
Coatings 15 00854 g003
Figure 4. Molecular formula (a) and molecular structure (b) of silane coupling agent.
Coatings 15 00854 g004
Figure 5. Internal pore distribution of PFC with different densities.
Coatings 15 00854 g005
Figure 6. Specimen preparation and test process.
Coatings 15 00854 g006
Figure 8. Water contact angle equipment.
Coatings 15 00854 g008
Figure 9. Schematic diagram of water absorption test.
Coatings 15 00854 g009
Figure 10. Water contact angle and water absorption of concrete: (a) water contact angle of ordinary concrete; (b) water contact angle of concrete after adding PU; (c) water absorption after adding PU.
Coatings 15 00854 g010
Figure 11. Water absorption of PFC.
Coatings 15 00854 g011
Figure 12. Water contact angle and surface microstructure of carbide group: (a) initial water contact angle; (b) end water contact angle; (c) surface micromorphology.
Coatings 15 00854 g012
Figure 13. Water absorption of carbonized groups.
Coatings 15 00854 g013
Figure 14. Water contact angle of PFC after 25 freeze–thaw cycles.
Coatings 15 00854 g014
Figure 15. Development process of freeze–thaw damage of concrete: (a) Phase I; (b) Phase II; (c) Phase III; (d) Phase IV.
Coatings 15 00854 g015
Figure 16. Water absorption.
Coatings 15 00854 g016
Figure 17. FTIR curves: (a) PU; (b) GO; (c) KH-550; (d) G/S.
Coatings 15 00854 g017
Figure 18. SEM vs. EDS plots of PDF: (a) uncoated; (b) GO coatings; (c) KH-550 coatings; (d) G/S composite emulsion coatings.
Coatings 15 00854 g018
Figure 19. Radar plots of major element contents for uncoated, GO, KH-550, and G/S.
Coatings 15 00854 g019
Figure 20. Contact angle and water absorption curve for GO groups: (a) water contact angle; (b) water contact angle change curve; (c) water absorption.
Coatings 15 00854 g020
Figure 21. Contact angle and water absorption curves for KH-550 groups: (a) water contact angle; (b) water contact angle change curve; (c) water absorption.
Coatings 15 00854 g021
Figure 22. Contact angle and water absorption curves for G/S group: (a) water contact angle; (b) water contact angle change curve; (c) water absorption.
Coatings 15 00854 g022
Table 1. Chemical composition of BSP (%) [29].
Chemical
Composition
SiO2Al2O3CaOMgOFe2O3FeONa2OK2OP2O5TiO2MnOOther
Content48.7913.068.63.55.68.932.641.280.333.050.174.05
Table 2. Physical specifications of the MDI [30].
MaterialsSmellBoiling Point (°C)Fusing Point (°C)Flash Point (°C)Solubility (mg/L)DensityLog Kow(est)
MDIOdorless314373961.511.25.22
Table 3. Concrete density adjustment program [30].
Dry Density (kg/m3)Water–Binder RatioFiller RatioCement (%)Stone Powder (%)Blowing Agent (%)
15000.540.542.4722.474.22
13500.540.543.2221.724.58
12000.540.544.7720.178.43
Table 4. Test scheme.
Sample Density and TypeBlowing AgentEnvironmental
Treatment
Coating Treatment
1500 kg/m31350 kg/m31200 kg/m3
PU-1500PU-1350PU-1200PU--
CG-1500CG-1350CG-1200Carbonization environment-
FT-1500FT-1350FT-1200Freeze–thaw environment-
GO-1500GO-1350GO-1200-GO
SCA-1500SCA-1350SCA-1200-KH-550
C/S-1500C/S-1350C/S-1200-C/S
Table 5. Spraying solutions for waterproof coatings.
ReagentsGO KH-550G/S
Coated amount (g/m2)120012001200
Coated amount in one time (g/m2)600600600
Interval between coating (/h)666
Disclaimer/Publisher’s Note: The statements, opinions and data contained in all publications are solely those of the individual author(s) and contributor(s) and not of MDPI and/or the editor(s). MDPI and/or the editor(s) disclaim responsibility for any injury to people or property resulting from any ideas, methods, instructions or products referred to in the content.

