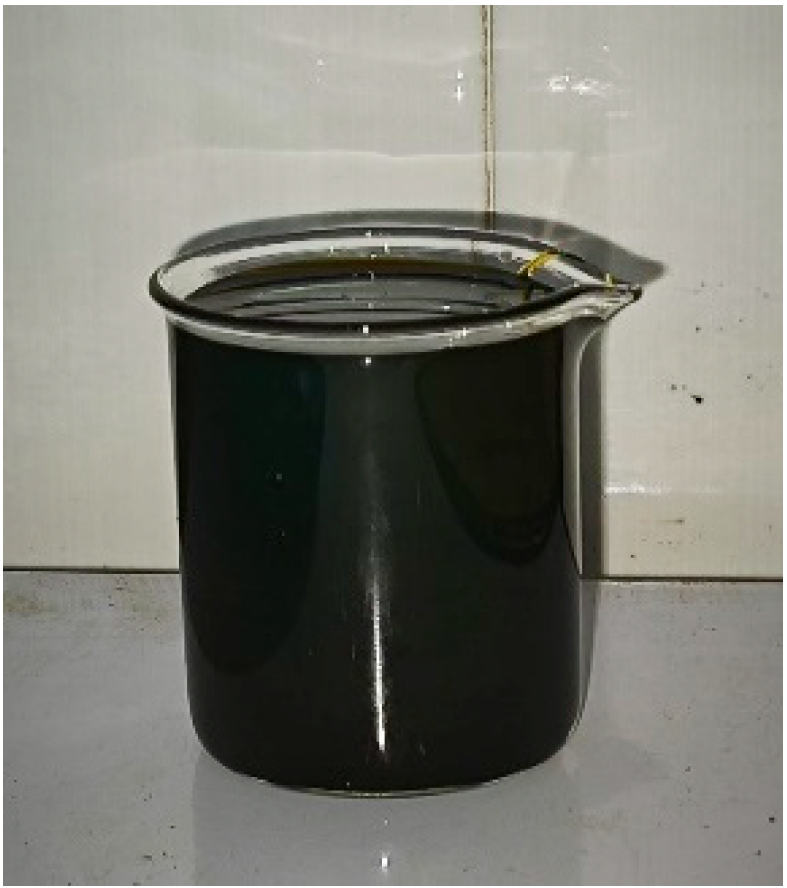
Figure 1.
Runqiang-RA102 high-performance asphalt regenerant.
Figure 1.
Runqiang-RA102 high-performance asphalt regenerant.
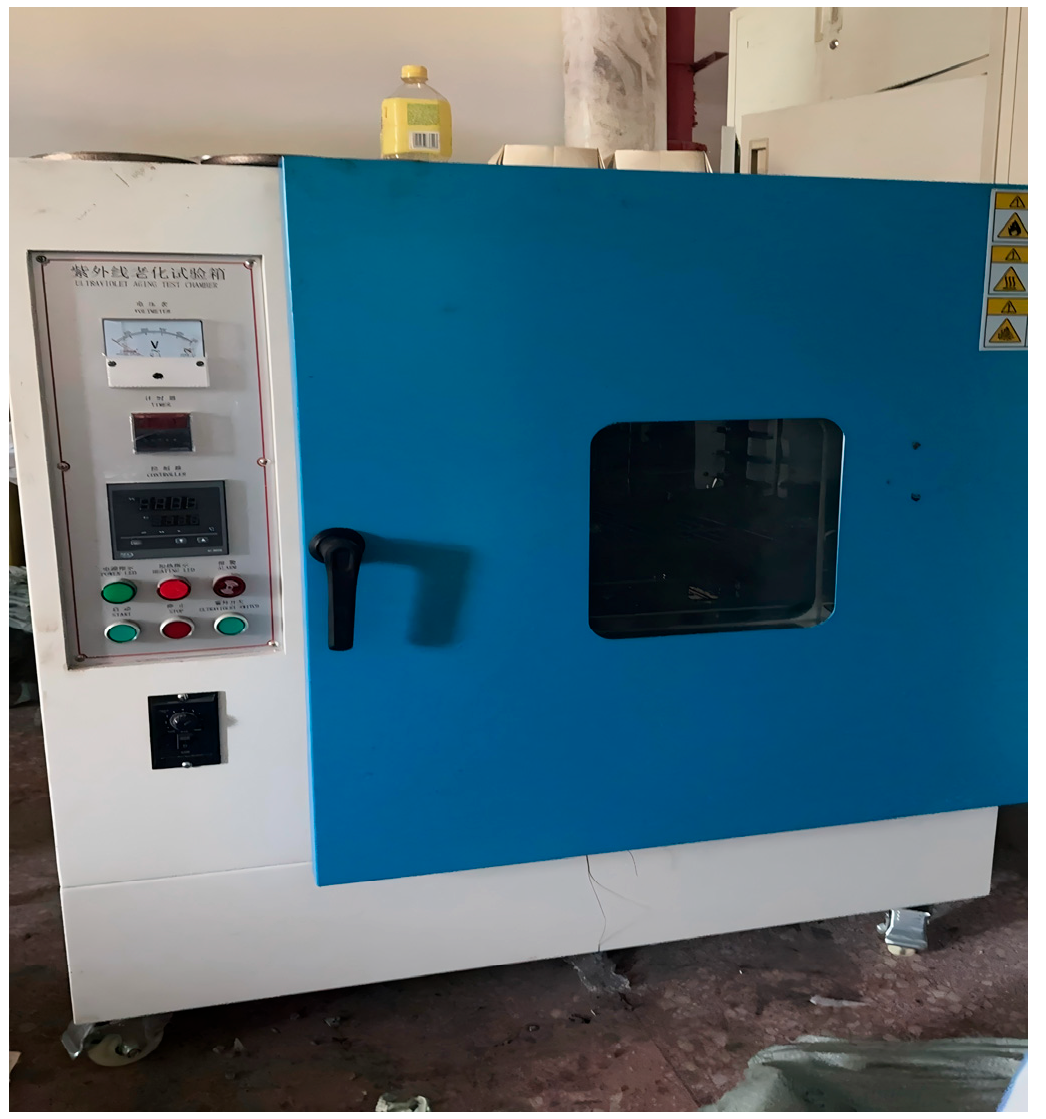
Figure 2.
The environment simulation box.
Figure 2.
The environment simulation box.
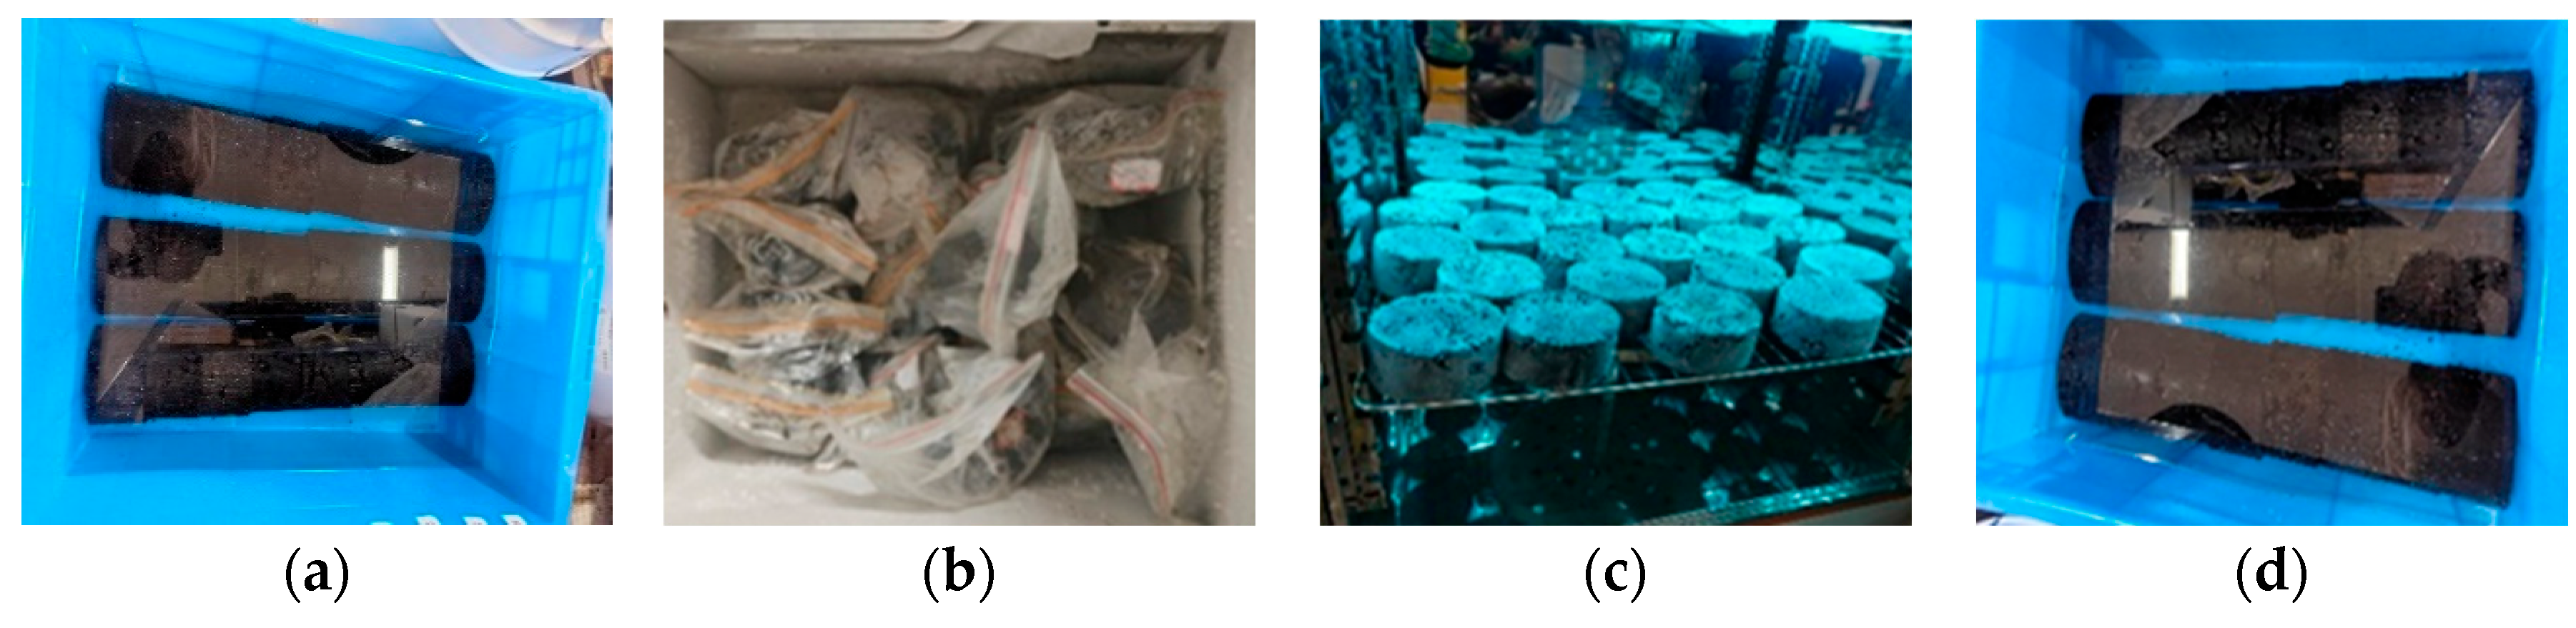
Figure 3.
Test cycle process diagram: (a) saturated water treatment; (b) freezing treatment; (c) UV aging; (d) melting process.
Figure 3.
Test cycle process diagram: (a) saturated water treatment; (b) freezing treatment; (c) UV aging; (d) melting process.
Figure 4.
A research technology roadmap.
Figure 4.
A research technology roadmap.
Figure 5.
Variation law of the dynamic stability of recycled asphalt mixtures.
Figure 5.
Variation law of the dynamic stability of recycled asphalt mixtures.
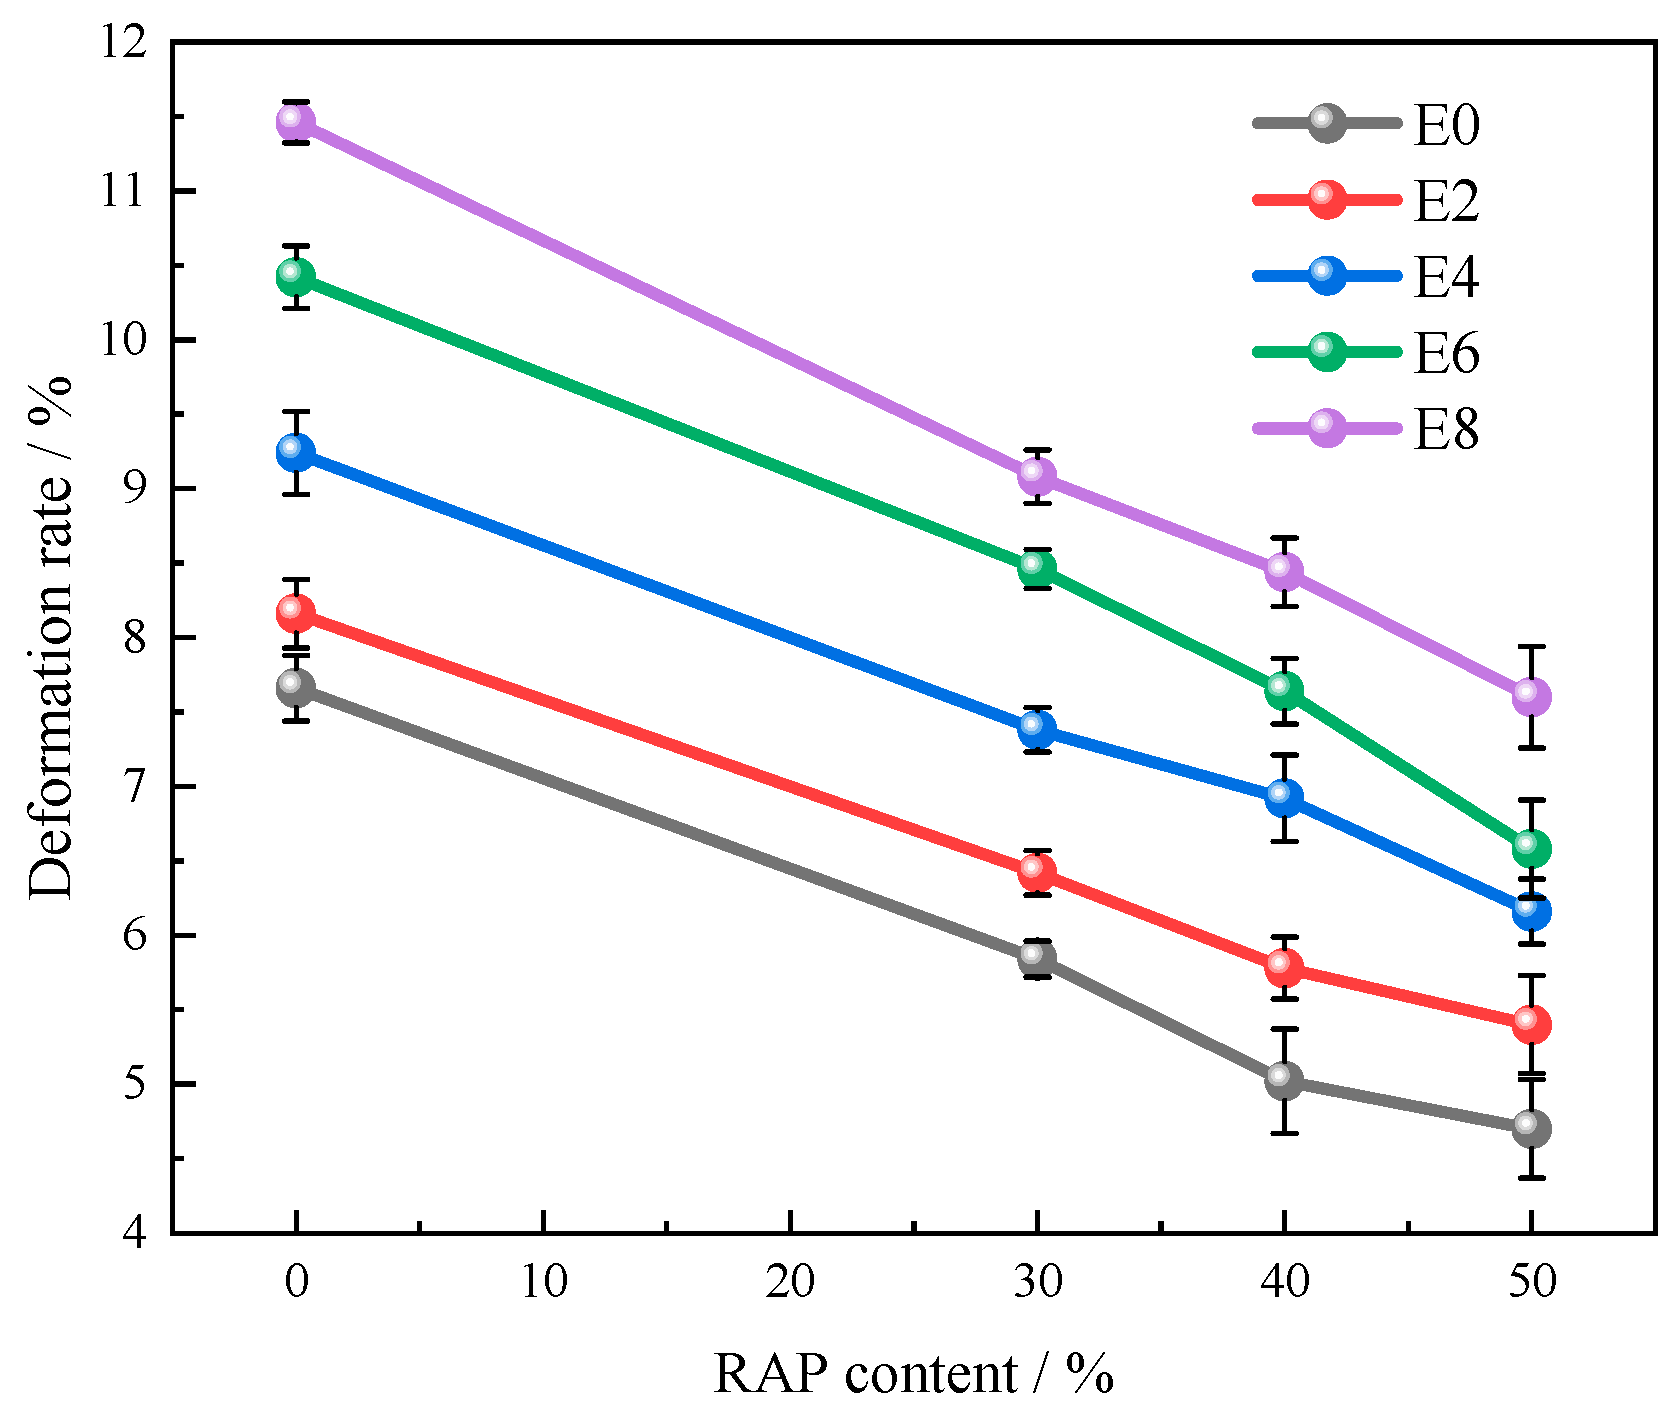
Figure 6.
Regularity of the rutting deformation rates of recycled asphalt mixtures.
Figure 6.
Regularity of the rutting deformation rates of recycled asphalt mixtures.
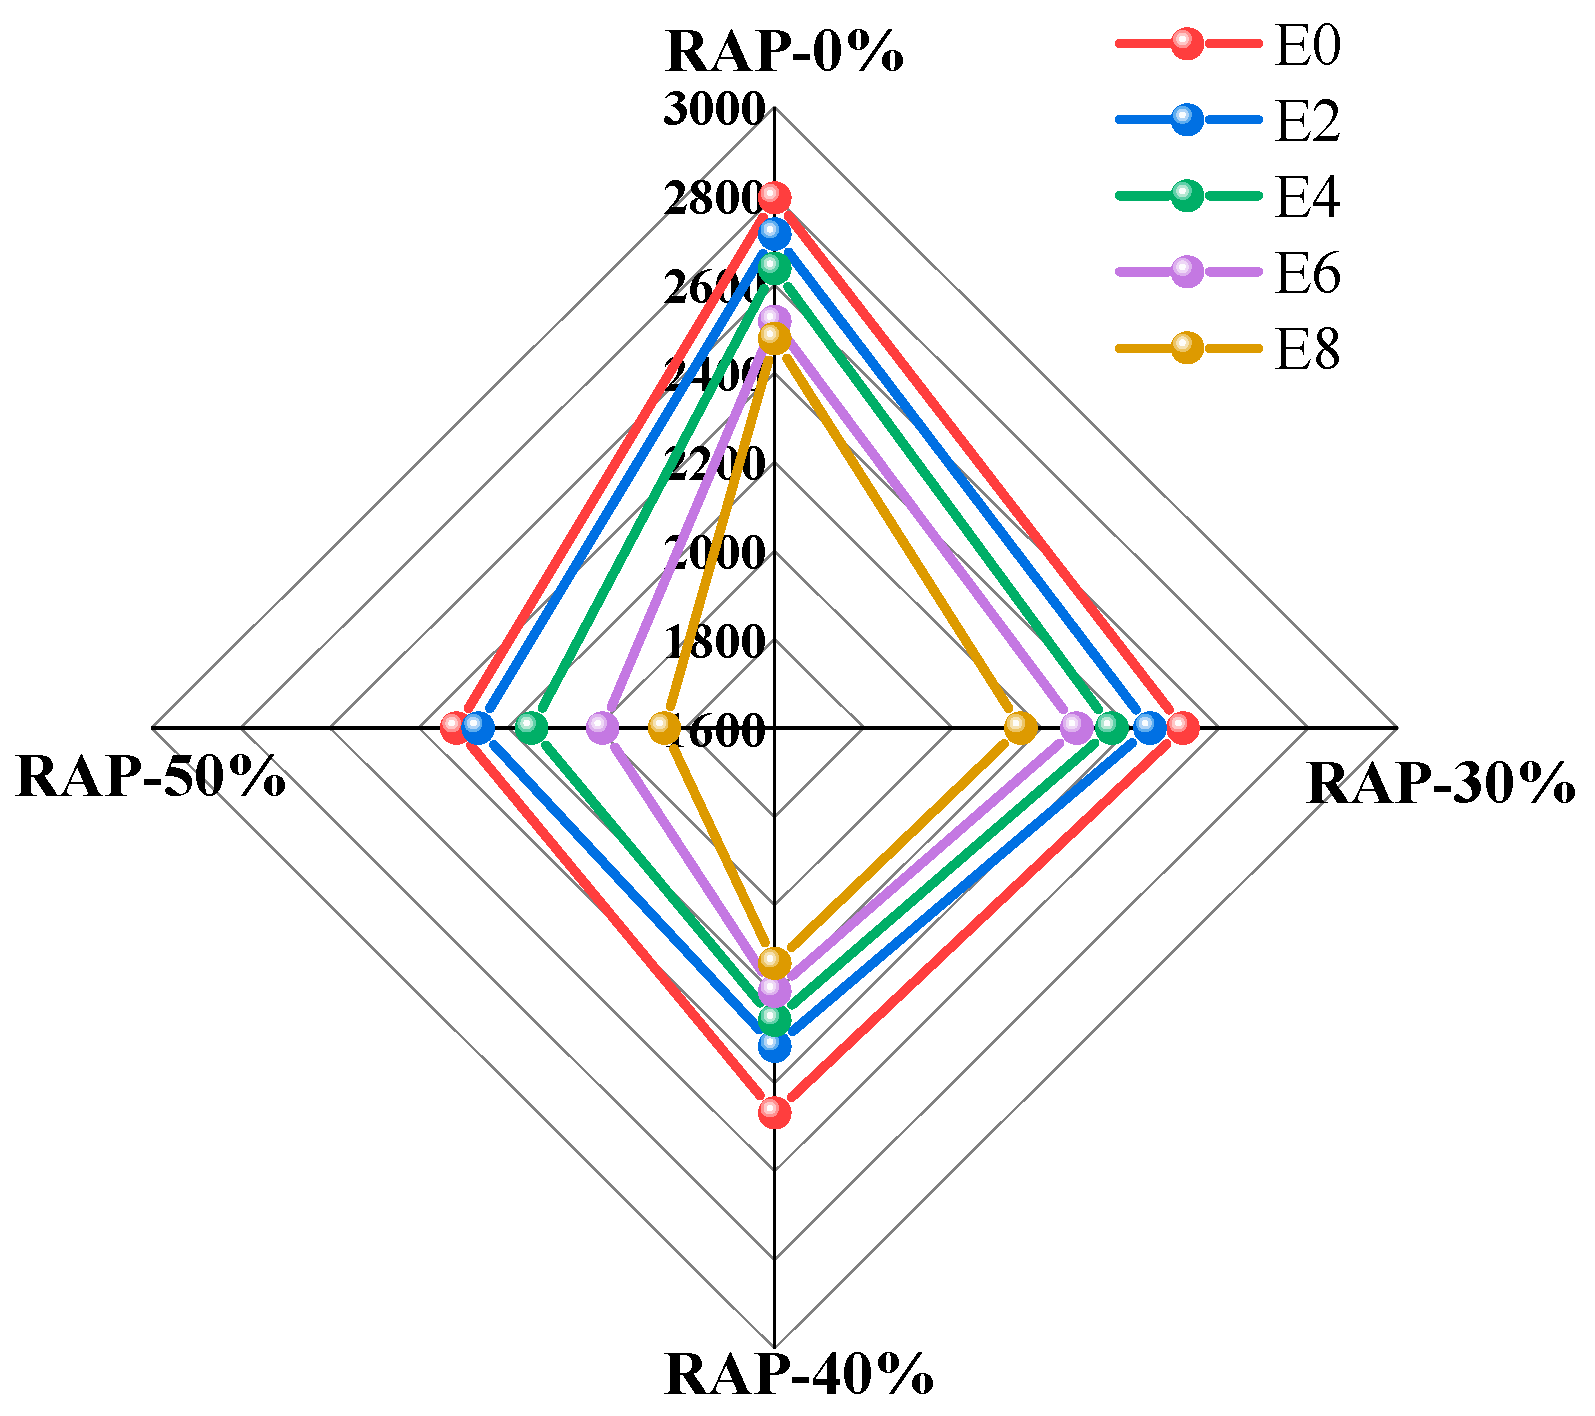
Figure 7.
The maximum bending strain of regenerated AC-13.
Figure 7.
The maximum bending strain of regenerated AC-13.
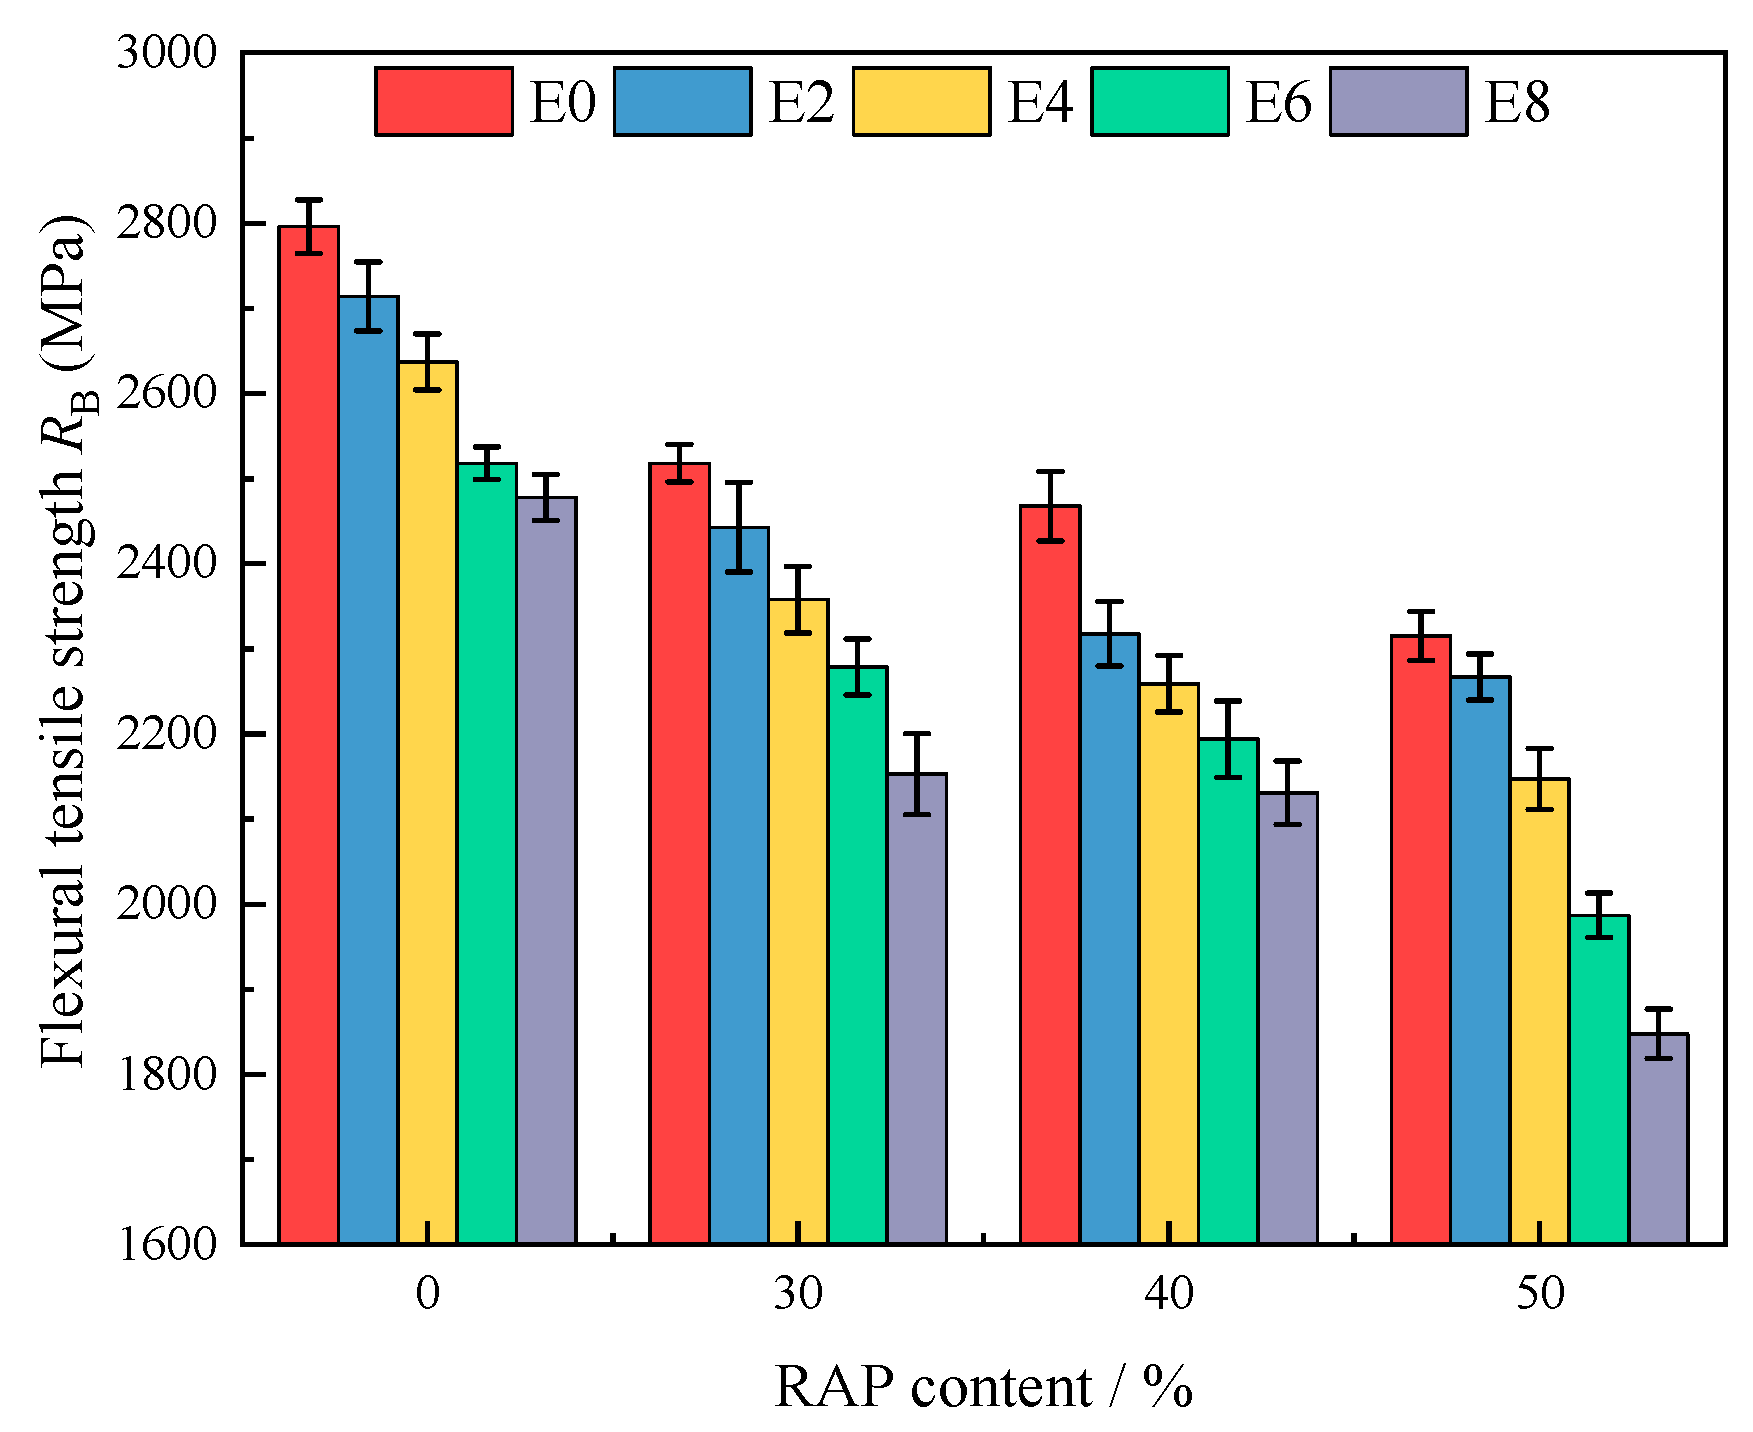
Figure 8.
Bending strength of regenerated AC-13.
Figure 8.
Bending strength of regenerated AC-13.
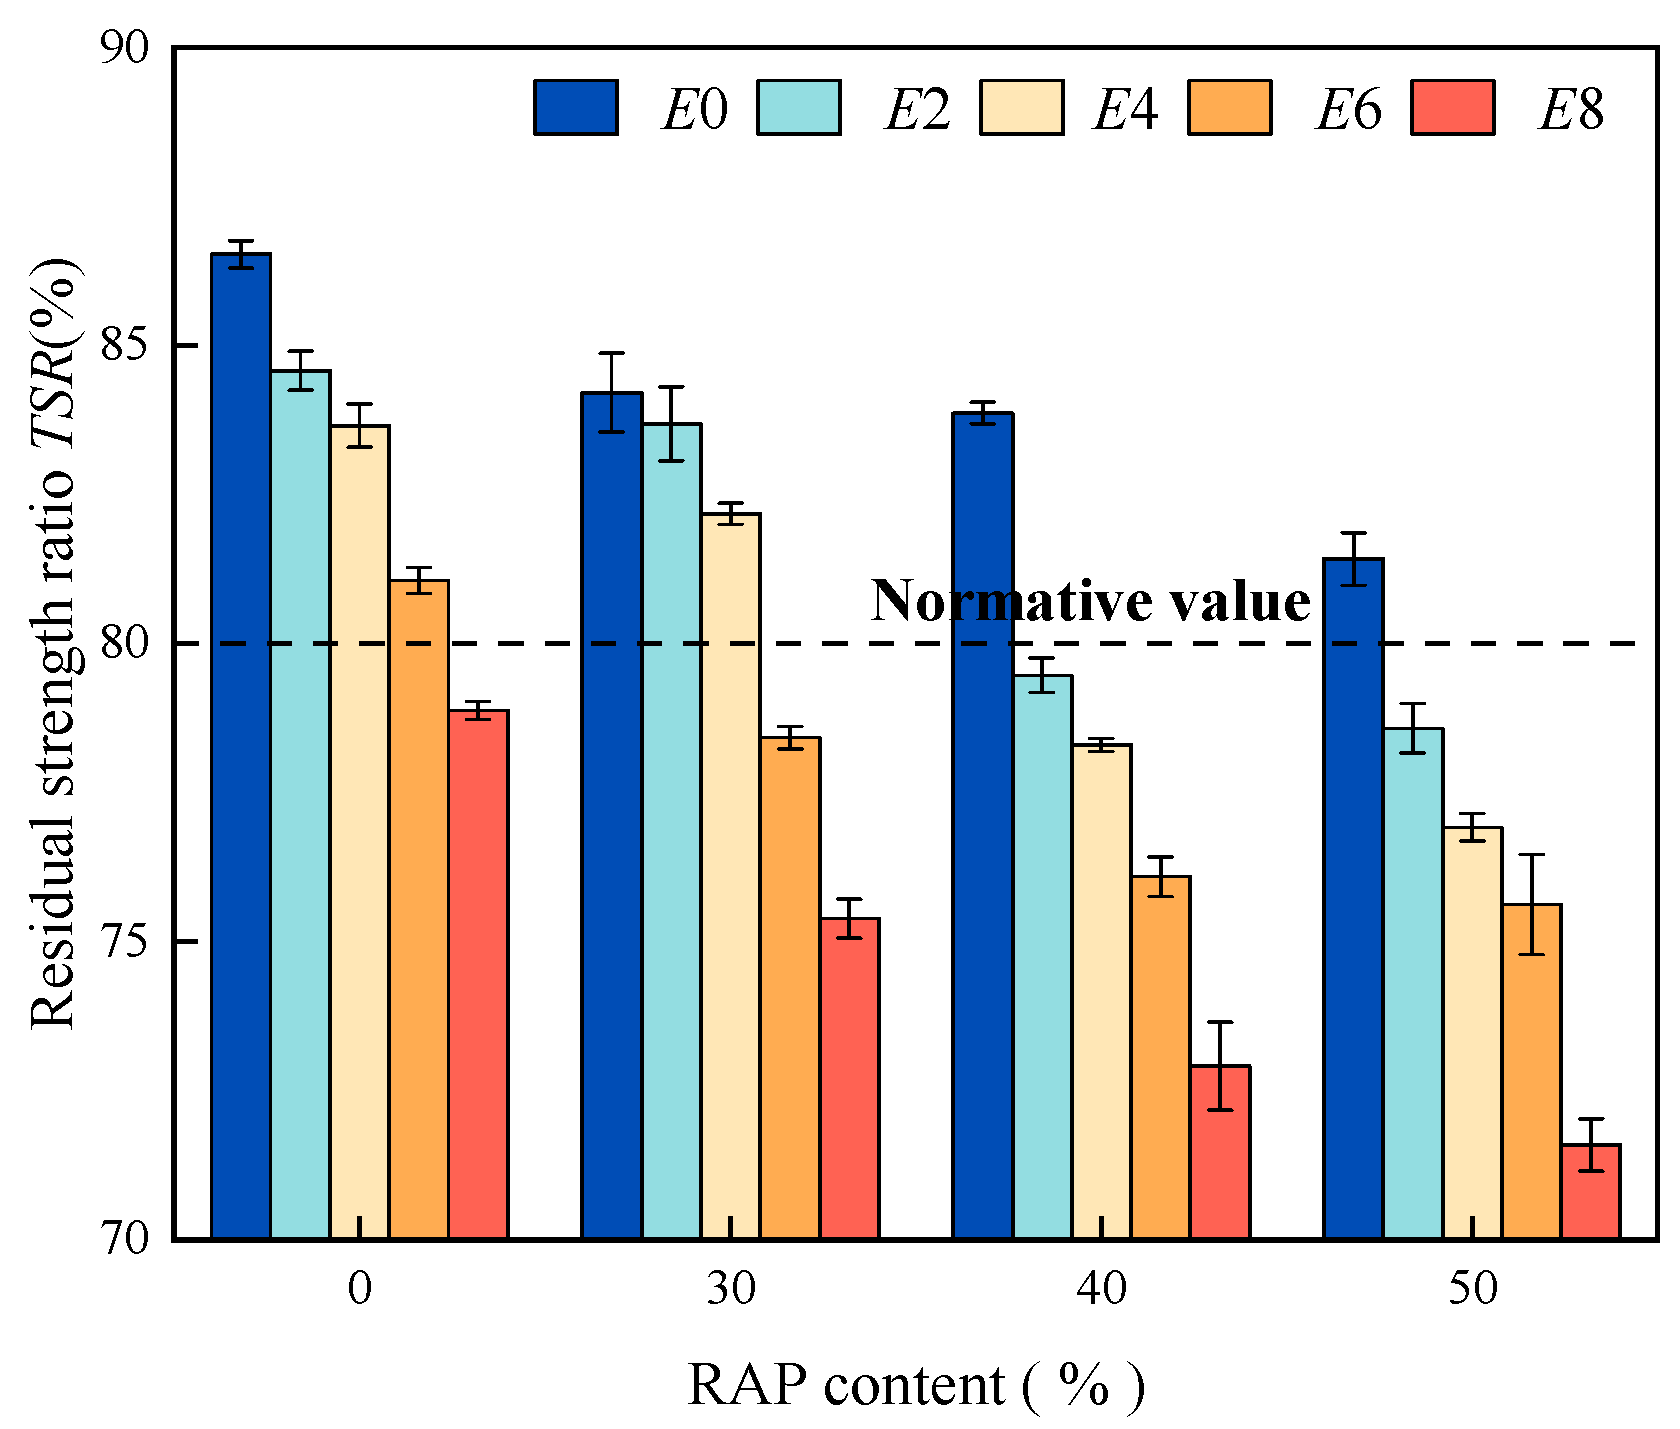
Figure 9.
Residual stability of regenerated AC-13.
Figure 9.
Residual stability of regenerated AC-13.
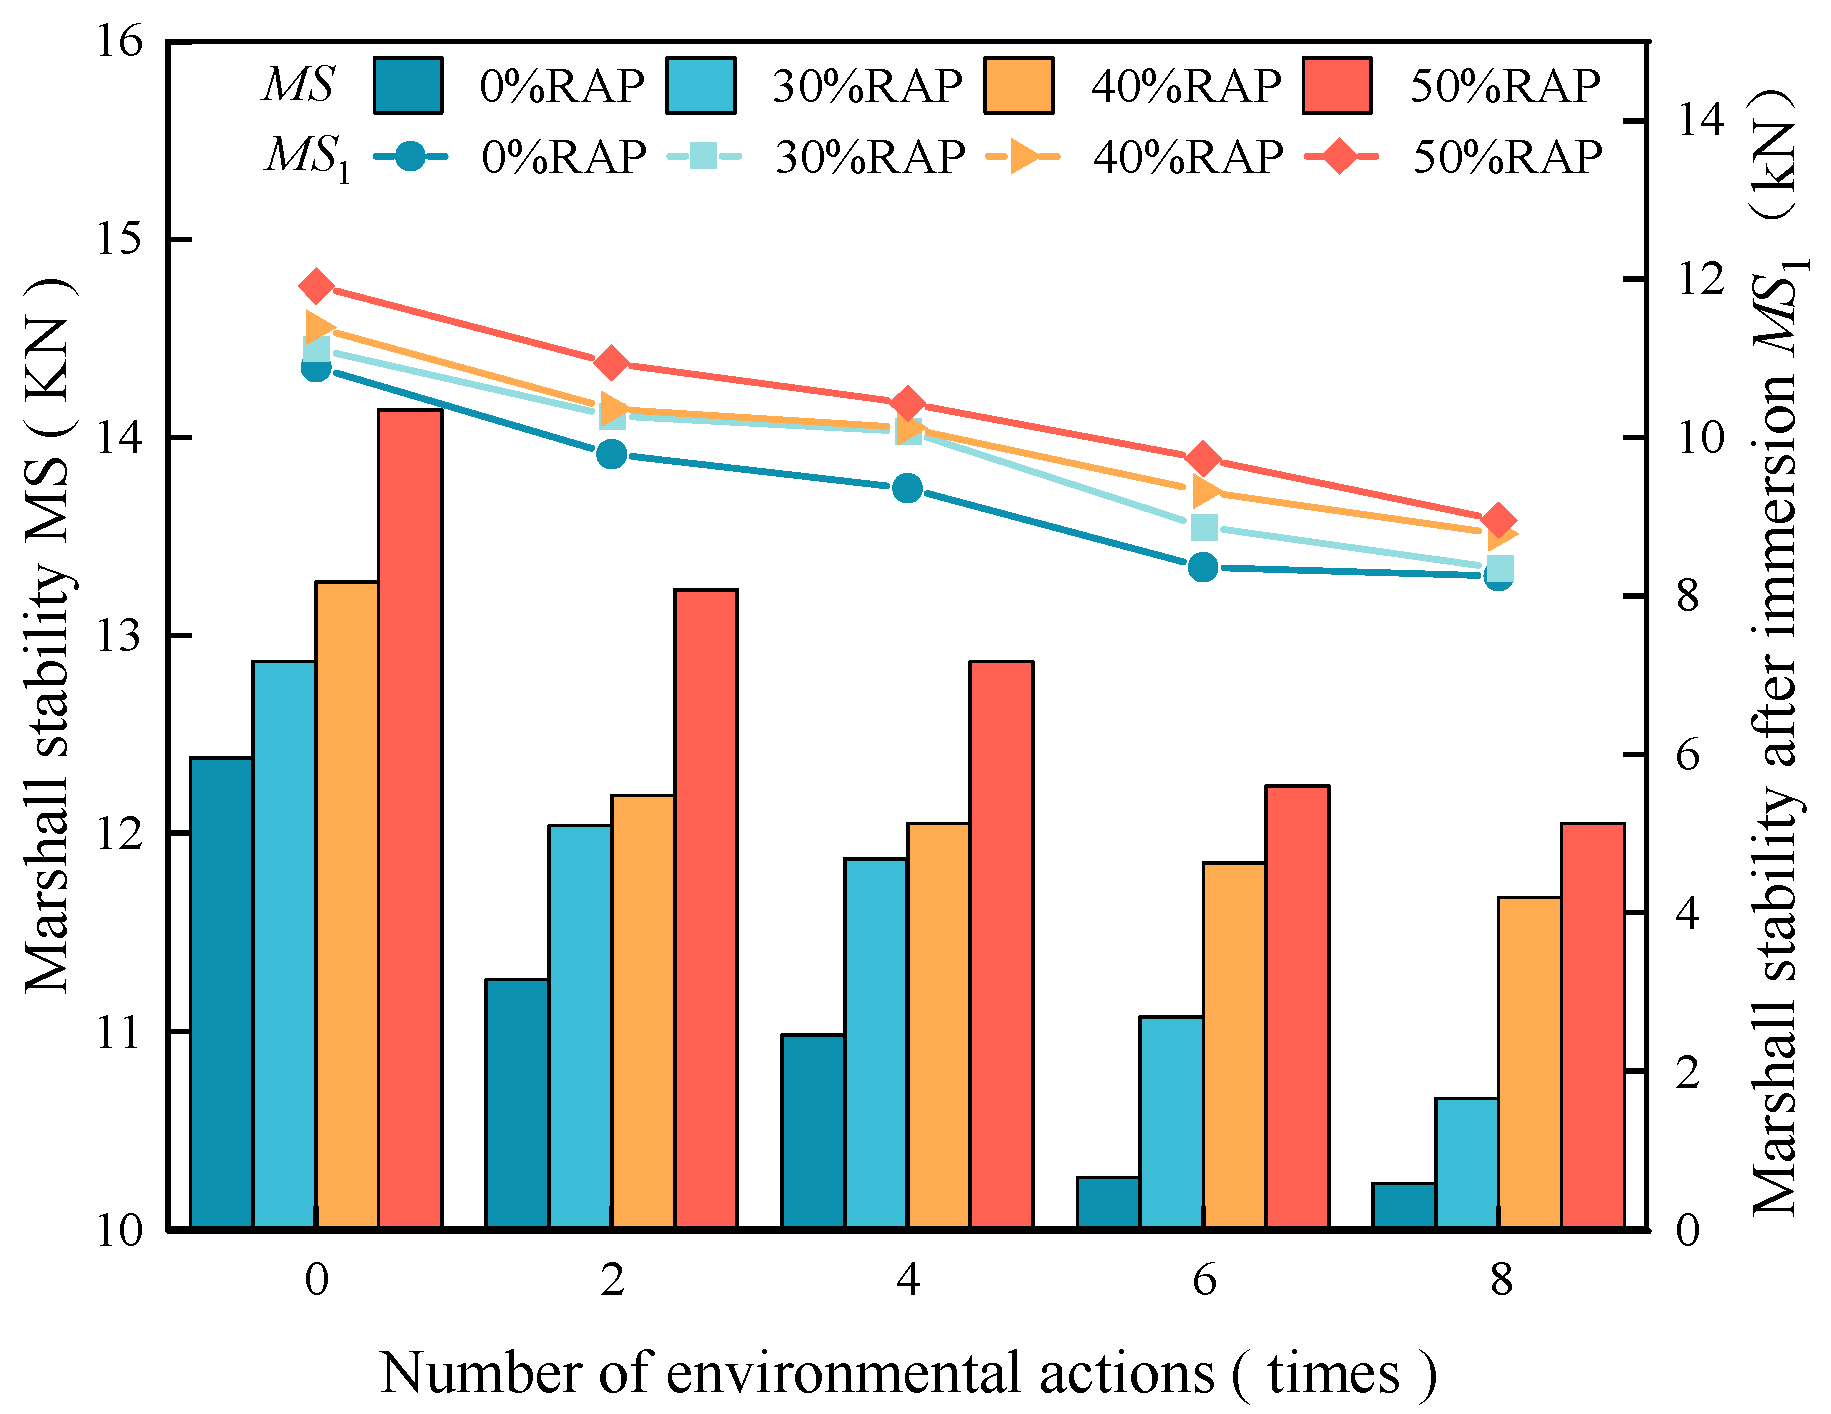
Figure 10.
Stability of regenerated AC-13 before and after immersion under different numbers of cycles.
Figure 10.
Stability of regenerated AC-13 before and after immersion under different numbers of cycles.
Figure 11.
The freeze–thaw splitting strength ratio of recycled AC-13 under different numbers of cycles.
Figure 11.
The freeze–thaw splitting strength ratio of recycled AC-13 under different numbers of cycles.
Figure 12.
Splitting strength of regenerated AC-13 before and after freeze–thaw cycles under different numbers of cycles.
Figure 12.
Splitting strength of regenerated AC-13 before and after freeze–thaw cycles under different numbers of cycles.
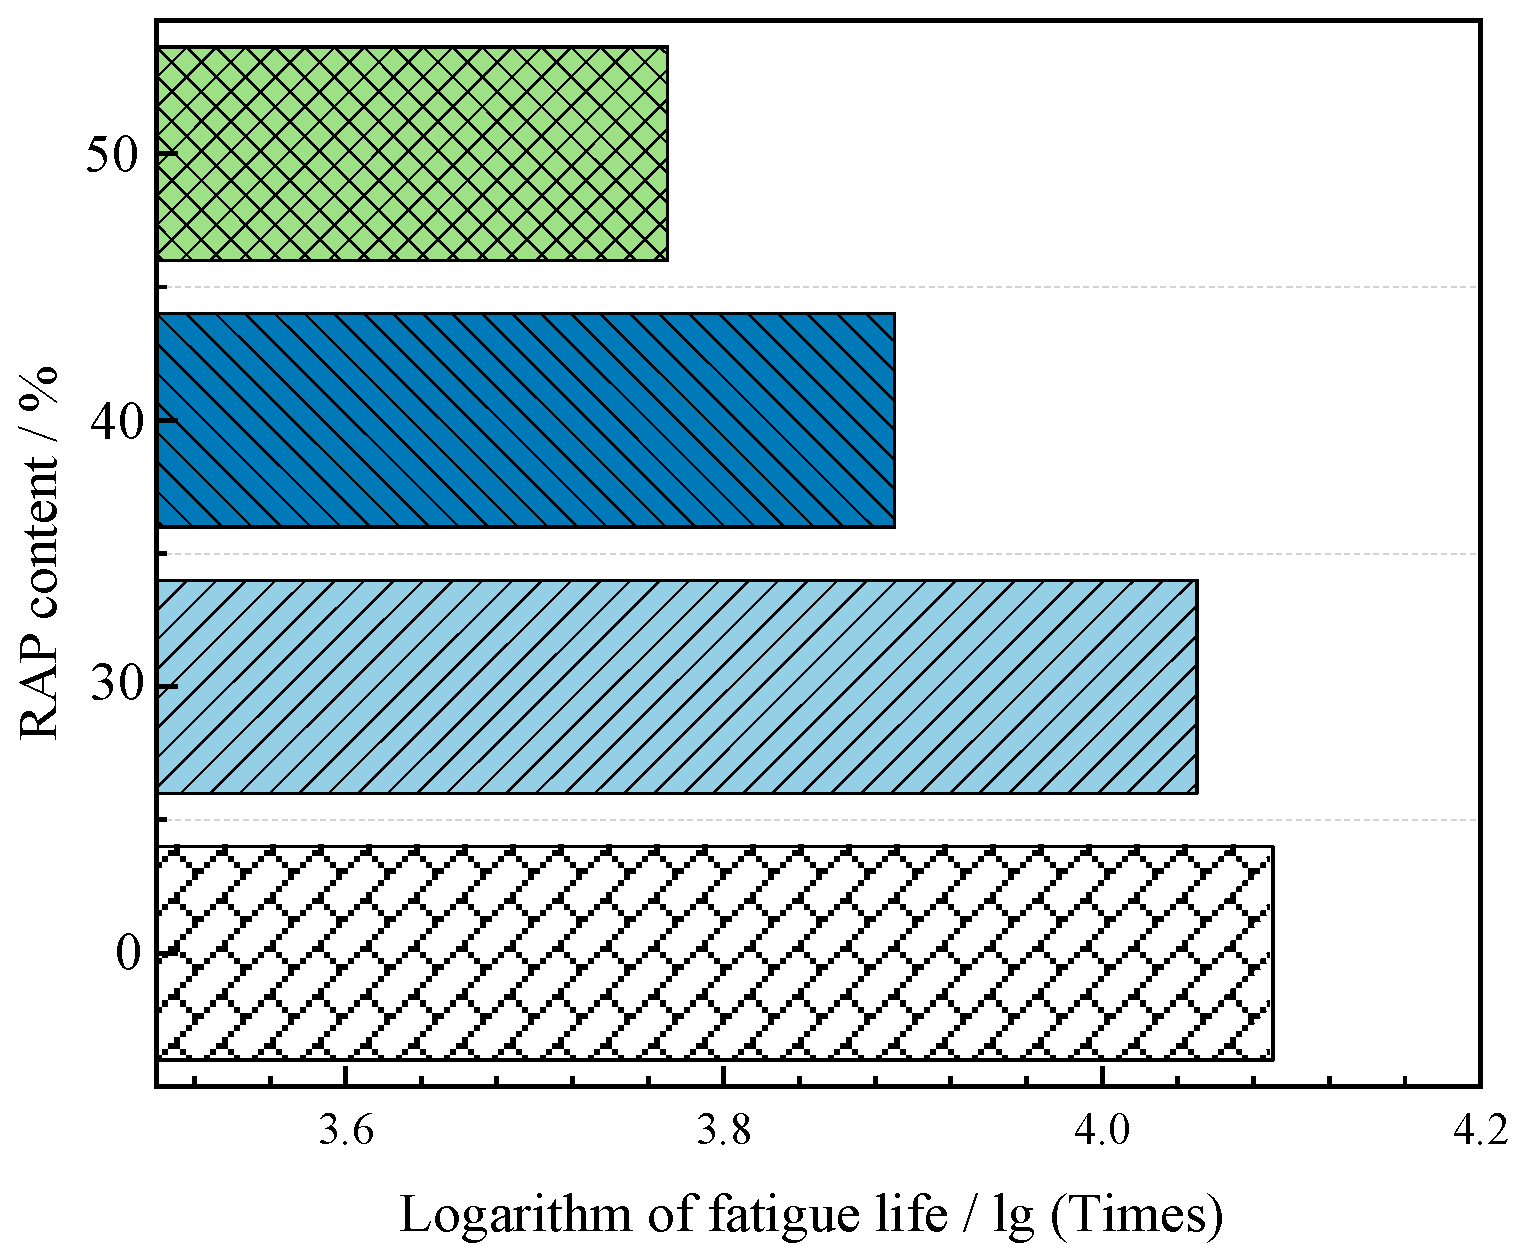
Figure 13.
Fatigue life of regenerated AC-13.
Figure 13.
Fatigue life of regenerated AC-13.
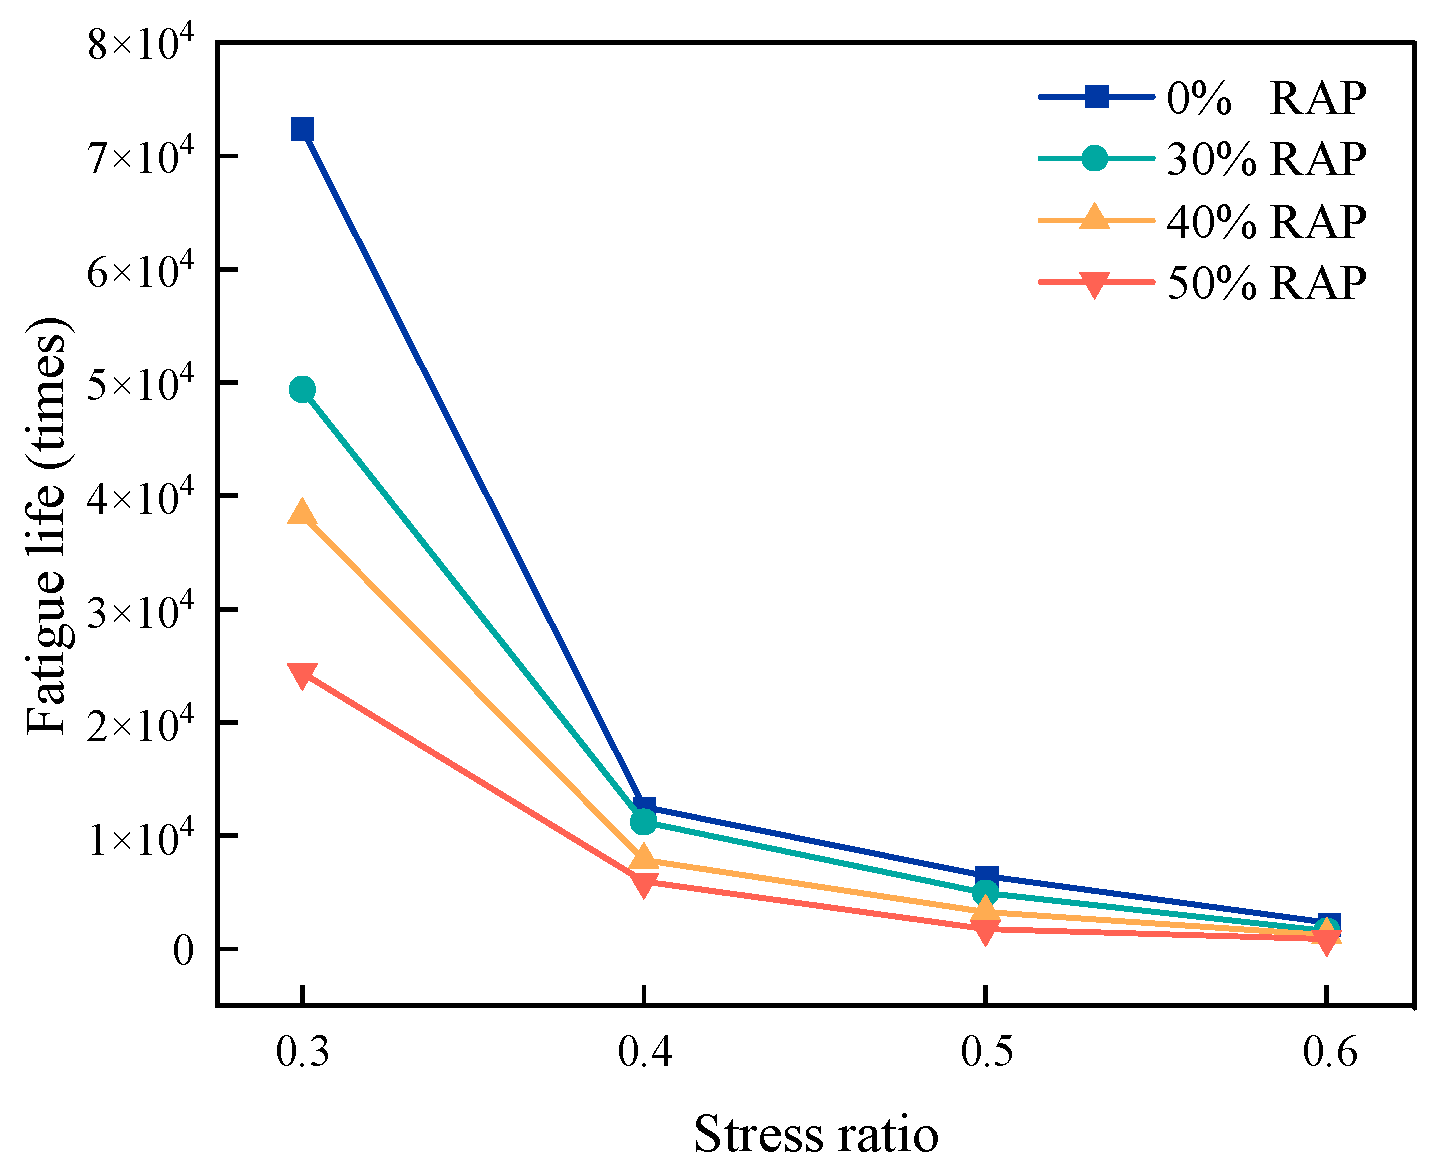
Figure 14.
Fatigue life curve of regenerated AC-13.
Figure 14.
Fatigue life curve of regenerated AC-13.
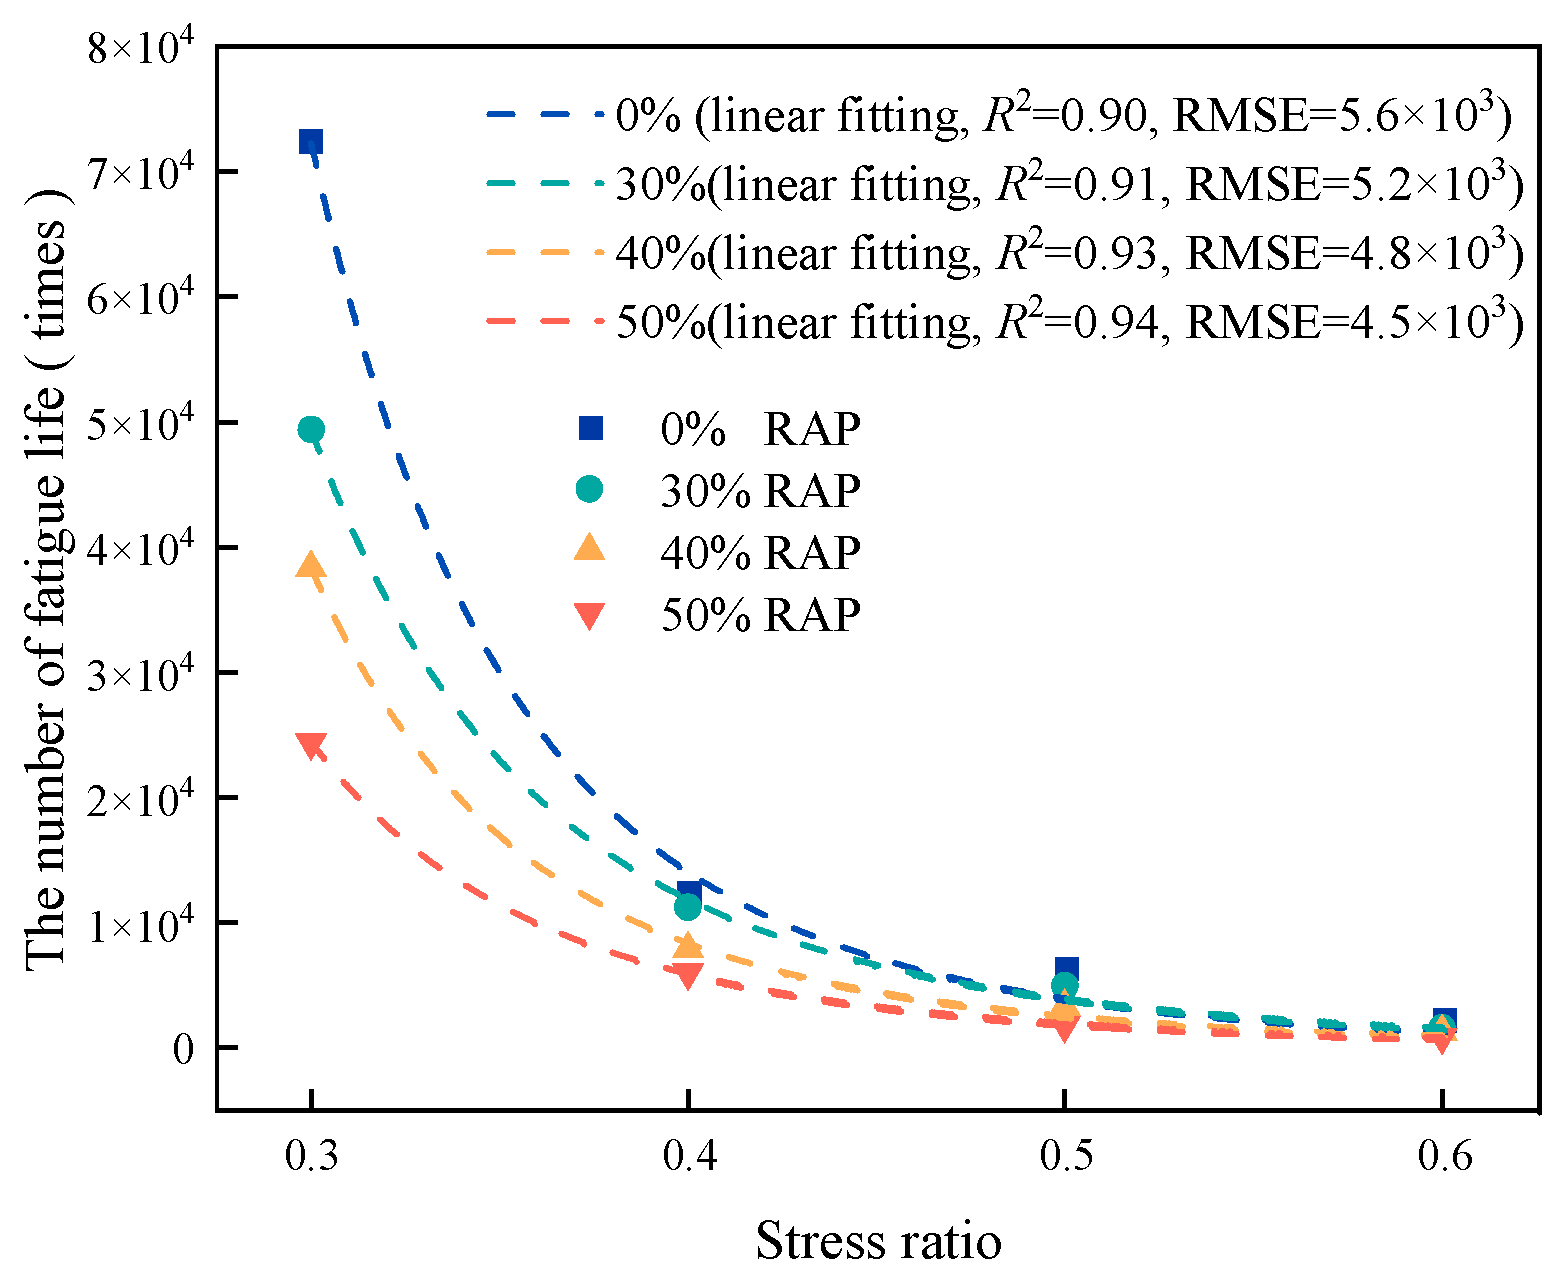
Figure 15.
C-logN linear fitting of regenerated AC-13.
Figure 15.
C-logN linear fitting of regenerated AC-13.
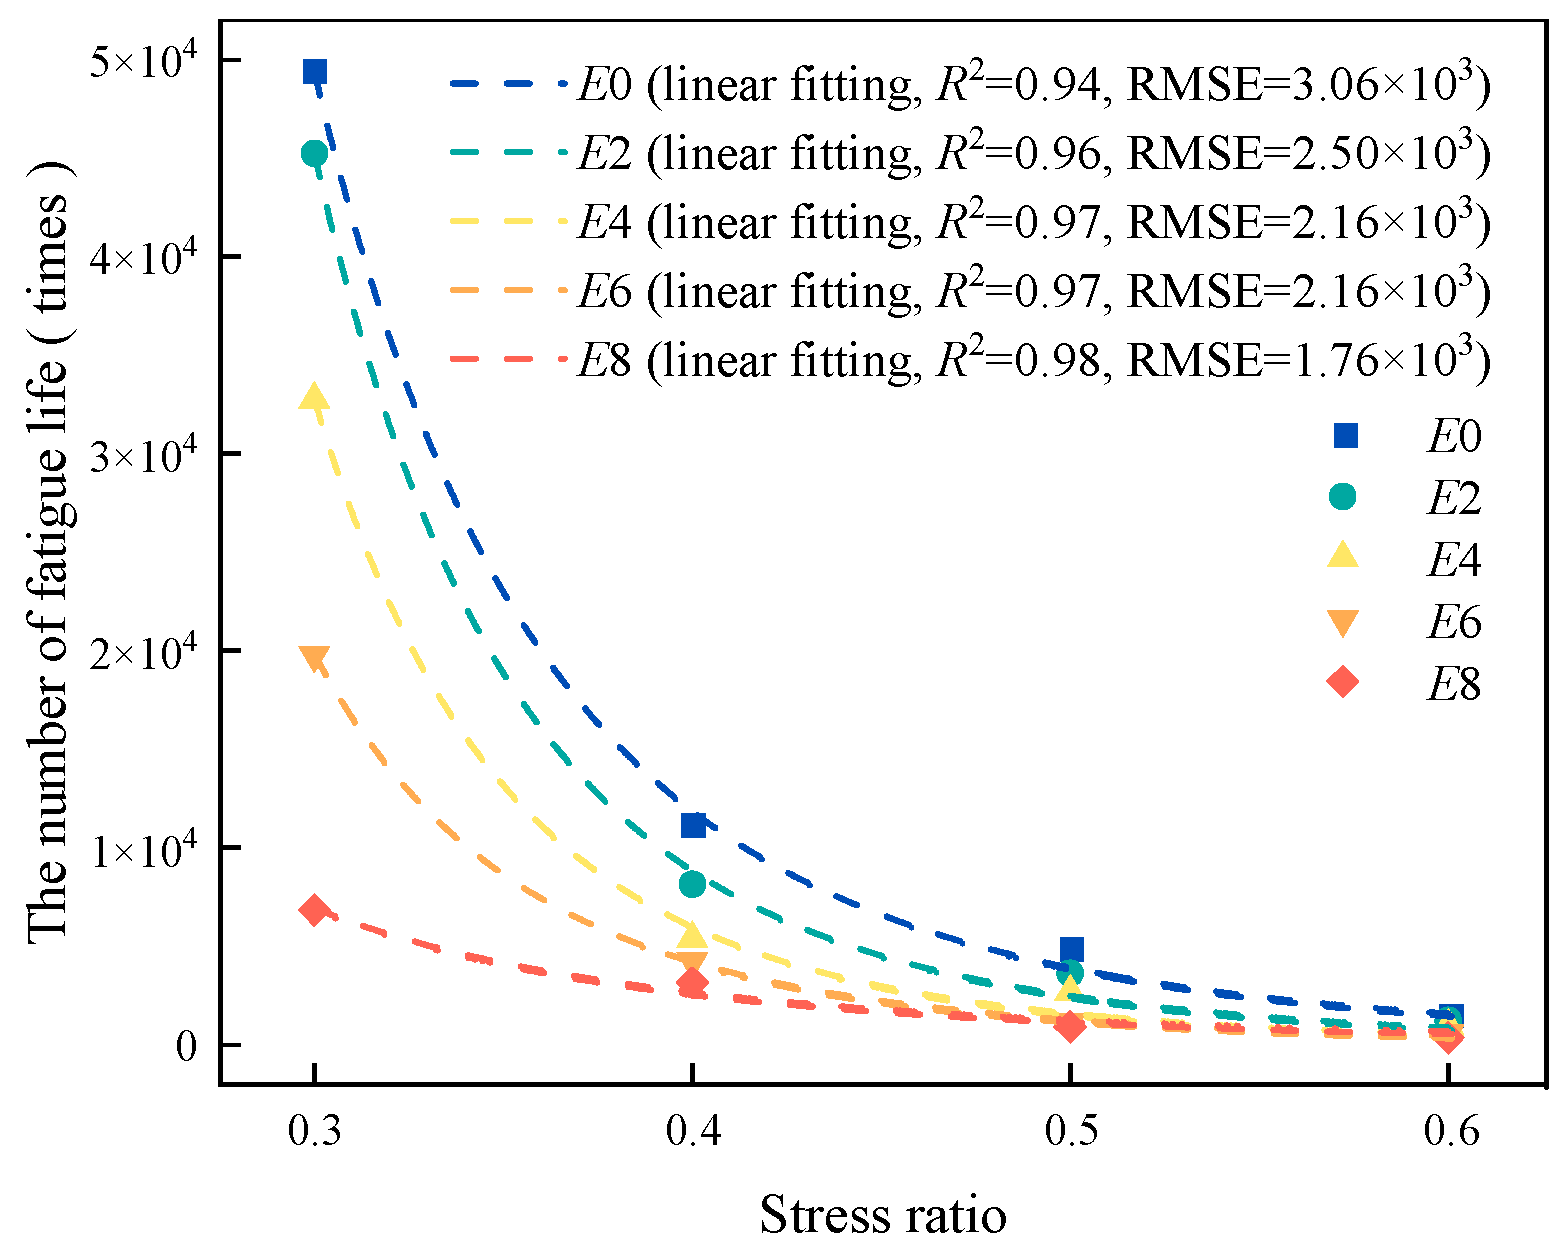
Figure 16.
The fitting curve of C ~ Nf of recycled AC-13 with different RAP content.
Figure 16.
The fitting curve of C ~ Nf of recycled AC-13 with different RAP content.
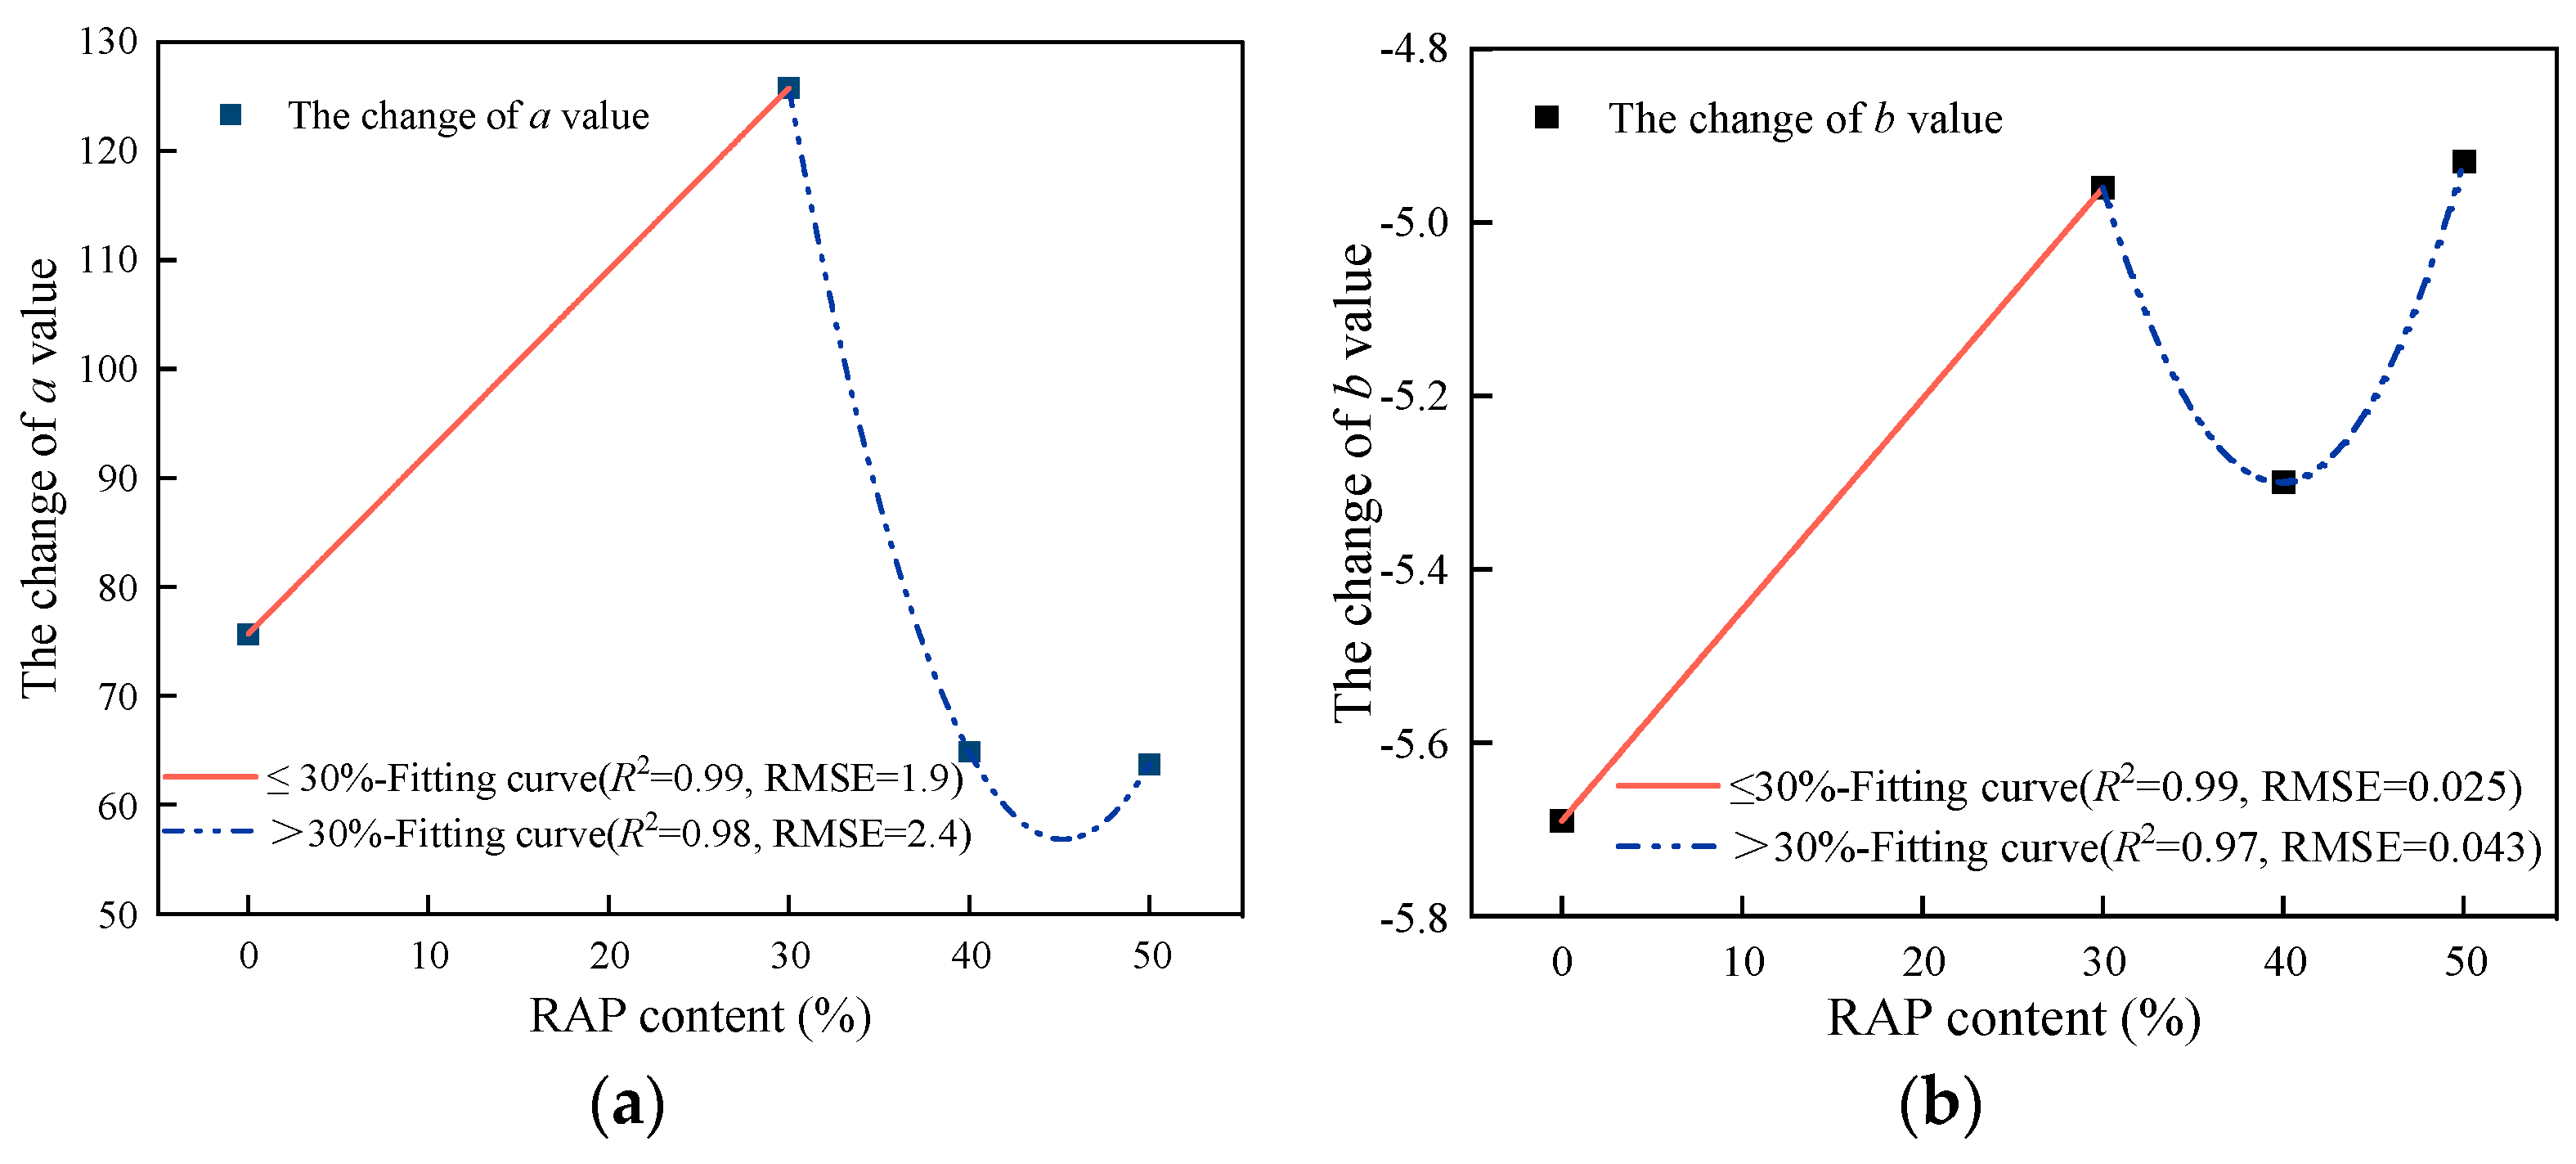
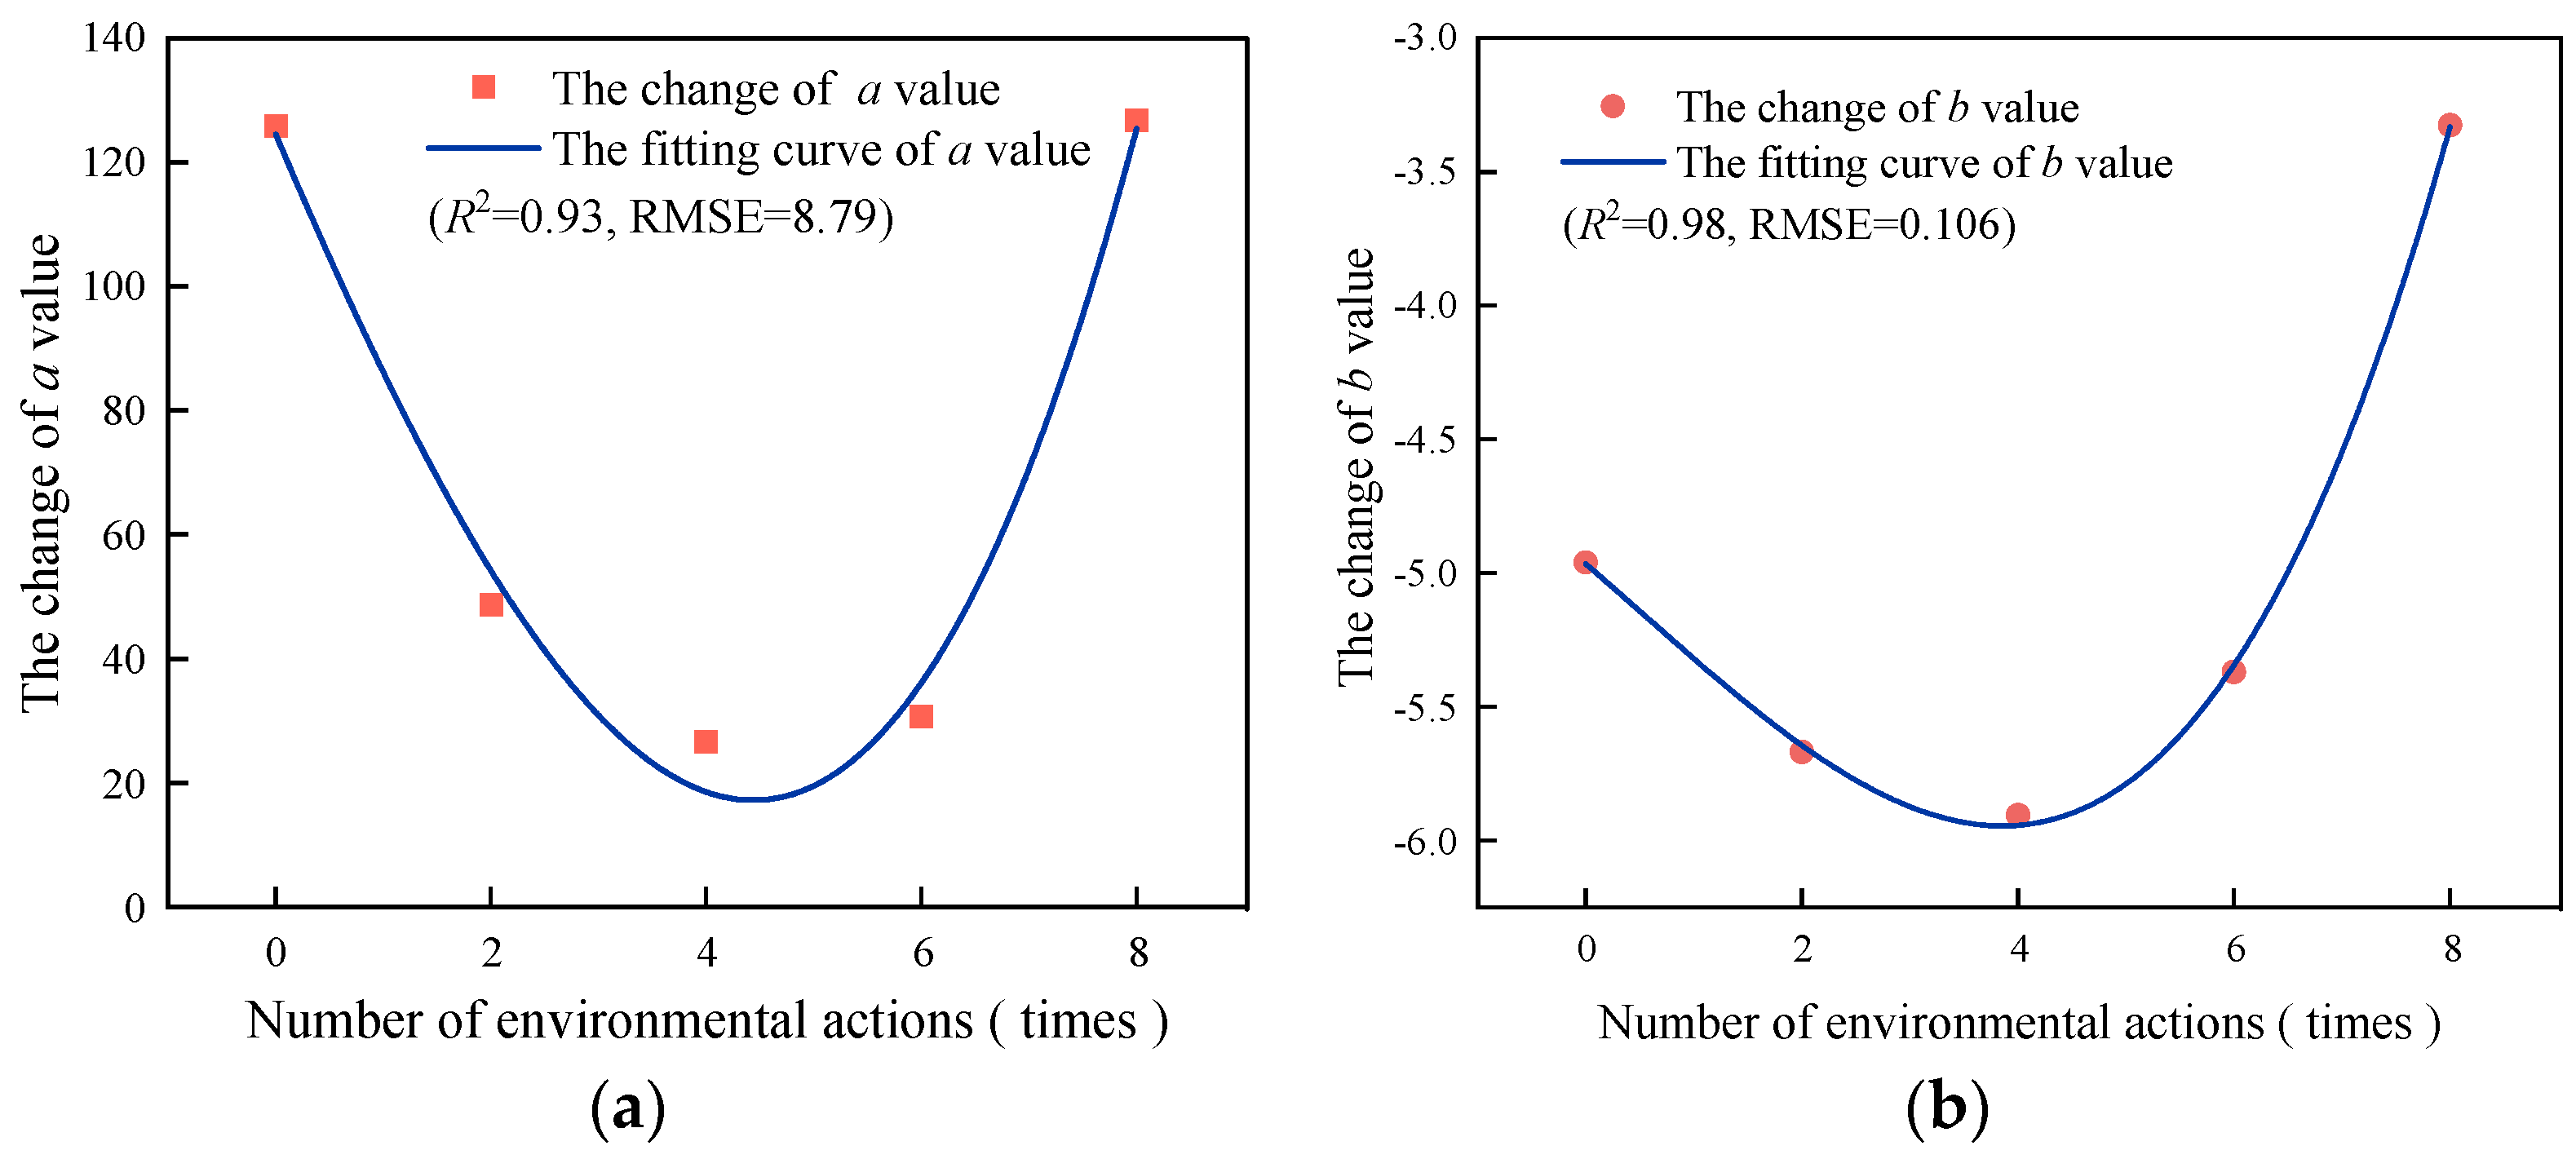
Figure 17.
The fitting curve of fitting parameters a and b and RAP content. (a) The change in parameter a; (b) the change in parameter b.
Figure 17.
The fitting curve of fitting parameters a and b and RAP content. (a) The change in parameter a; (b) the change in parameter b.
Figure 18.
The fitting curve of C and Nf of regenerated AC-13 under the same number of cycles.
Figure 18.
The fitting curve of C and Nf of regenerated AC-13 under the same number of cycles.
Figure 19.
The fitting curve of the fitting parameters a, b and the number of environmental times. (a) a value change, (b) b value change.
Figure 19.
The fitting curve of the fitting parameters a, b and the number of environmental times. (a) a value change, (b) b value change.
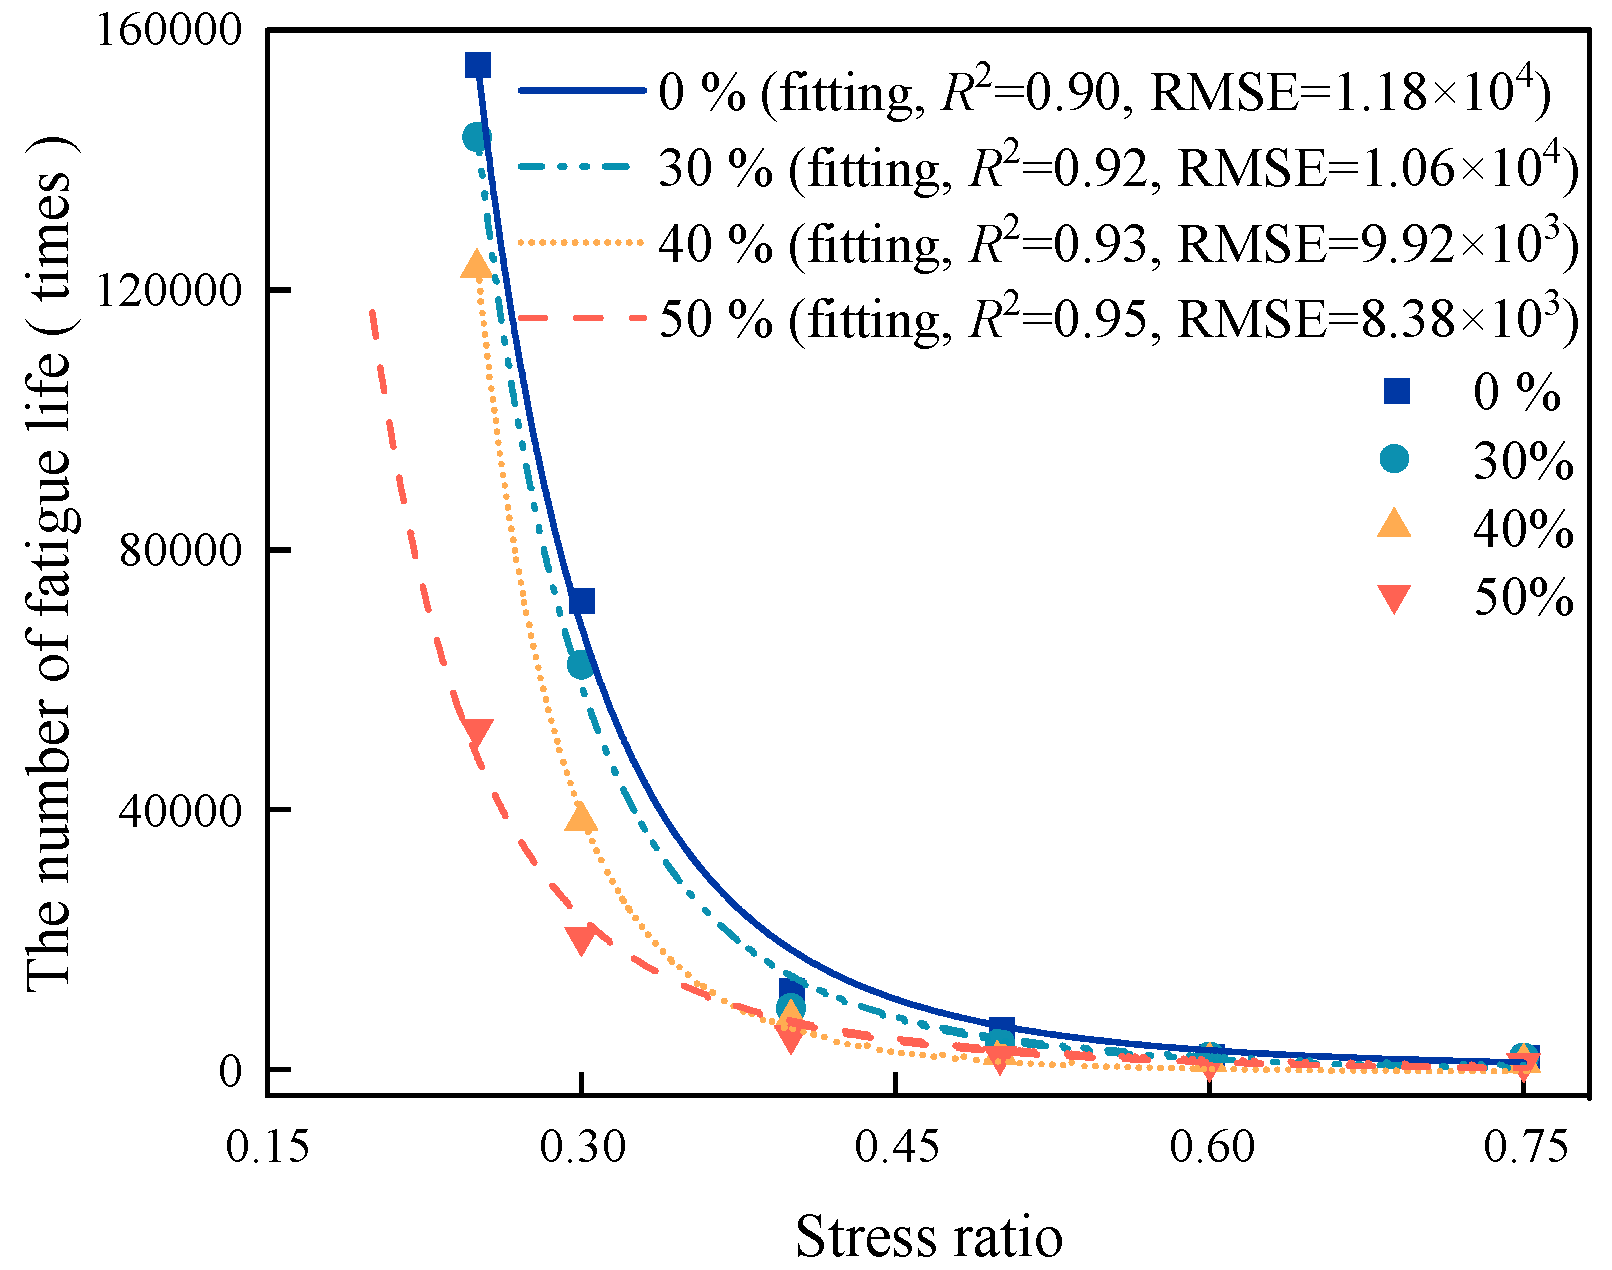
Figure 20.
Values under the conditions of different RAP contents (T = 15 °C, H = 10 Hz).
Figure 20.
Values under the conditions of different RAP contents (T = 15 °C, H = 10 Hz).
Figure 21.
Values under the conditions of different numbers of environmental actions (R = 30%, T= 15 °C, H = 10 Hz).
Figure 21.
Values under the conditions of different numbers of environmental actions (R = 30%, T= 15 °C, H = 10 Hz).
Table 1.
70 # matrix asphalt test results.
Table 1.
70 # matrix asphalt test results.
| Test Items | Result of Survey | Technology Index | Test Method |
|---|
| Penetration (25 °C, 100 g, 5 s)/0.1 mm | 72 | 60–80 | T0504-2011 |
| Penetration index PI | −1.1 | −1.5–+1.0 | T0604-2011 |
| Softening point/°C | 47.0 | ≥46 | T0606-2011 |
| 60 °C Dynamic viscosity/Pas | 222 | ≥180 | T0620-2011 |
| Ductility (15 °C)/cm | >150 | ≥100 | T0605-2011 |
| Wax content (distillation method)/% | 2.0 | ≤2.2 | T0615-2011 |
| Flash point/°C | >300 | ≥260 | T0611-2011 |
| Solubility/% | 99.96 | ≥99.5 | T0607-2011 |
| Density (15 °C)/(g/cm3) | 1.039 | - | T0603-2011 |
| Quality change after RTFOT/% | −0.038 | ≤±0.8 | T0609-2011 |
Table 2.
The performance index of basalt coarse and fine aggregate.
Table 2.
The performance index of basalt coarse and fine aggregate.
| Specification | 10~15 | 5~10 | 3~5 | 0~3 | Technical Requirement |
|---|
| Relative density of bulk volume/(g/cm3) | 2.681 | 2.604 | 2.621 | 2.722 | ≥2.50 |
| Apparent specific gravity/(g/cm3) | 2.723 | 2.704 | 2.672 | 2.750 | ≥2.60 |
| Water absorption/% | 0.714 | 1.330 | 0.602 | 0.825 | ≤3.0 |
| Aggregate crushing value/% | 18.5 | ≤28 |
| Adhesivity | 2 | ≥4 |
| Abrasion value/% | 18 | ≤30 |
Table 3.
Measured indexes and technical requirements of ore powder.
Table 3.
Measured indexes and technical requirements of ore powder.
| Item | Unit | Measured Value | Technical Requirement |
|---|
| Apparent density | t/m3 | 2.82 | ≥2.8 |
| Specific surface area | m2/kg | 401 | ≥350 |
| Fluidity ratio | % | 97 | ≥90 |
| Water content | % | 0.4 | ≤1.0 |
| SO3 | % | 0.32 | ≤4.0 |
| CL- | % | 0.01 | ≤0.02 |
| Loss on ignition | % | 0.23 | ≤2 |
Table 4.
Technical properties of old aggregate and old asphalt.
Table 4.
Technical properties of old aggregate and old asphalt.
| Performance Index | Result of Survey | Technical Requirement |
|---|
| The volume relative density of wool/(g/cm3) | 2.763 | - |
| Apparent relative density/(g/cm3) | 2.851 | ≥2.6 |
| Asphalt density (15 °C)/(g/cm3) | 1.028 | - |
| Los Angeles wear value/% | 12.4 | ≤28 |
| Crushing value/% | 12.2 | ≤26 |
| Water absorption/% | 0.45 | ≤2.0 |
| Needle flake particle content/% | 7.1 | ≤12 |
| RAP oil-stone ratio/% | 4.8 | - |
| Softening point of old asphalt/°C | 63.5 | ≥46 |
| Old asphalt 15 °C ductility/cm | 19.6 | ≥100 |
| Old asphalt 25 °C penetration/0.1 mm | 24.9 | 60–80 |
Table 5.
Technical indexes of regenerant.
Table 5.
Technical indexes of regenerant.
| Performance Index | Test Value | Specification Requirement |
|---|
| Viscosity at 60 °C/(mm2/s) | 82 | 50~175 |
| 15 °C density/(g/cm3) | 0.98 | - |
| Flash point/(°C) | 240 | ≥220 |
| Saturate content/(%) | 20.5 | ≤30 |
| Aromatic content/(%) | 64.4 | - |
Table 6.
Different RAP contents in old and new recycled AC-13 asphalt.
Table 6.
Different RAP contents in old and new recycled AC-13 asphalt.
| RAP Content/% | The Best Oil/Stone Ratio/% | Proportion of the New Asphalt Mixture | Total Asphalt Content/% | Old Asphalt Content/% | New Asphalt Content/% |
|---|
| 0 | 4.9 | 1 | 4.67 | 0 | 4.67 |
| 30 | 4.98 | 0.7 | 4.74 | 1.37 | 3.37 |
| 40 | 5.02 | 0.6 | 4.78 | 1.84 | 2.94 |
| 50 | 5.1 | 0.5 | 4.85 | 2.3 | 2.55 |
Table 7.
Equipment statistics.
Table 7.
Equipment statistics.
| Test Types | Instrument | Producer |
|---|
| Needle penetration | Automatic penetration instrument | Shanghai Changji SYD-2801, Shanghai, China |
| Softening point | Automatic softening point meter | Shanghai Li Tao XCQ-24, Shanghai, China |
| Ductility | Digital dilatometer | Shanghai electron WQD-1A/400, Shanghai, China |
| Wheel tracking test | Hamburg rutting instrument | UK Cooper‘s CRT-WTIM, Glasgow, UK |
| Beam bending test | Asphalt mixture beam bending tester | Shanghai Changji SYD-0715, Shanghai, China |
| Immersion Marshall test | Marshall stability tester | Hebei Construction LWD-5, Shijiazhuang, China |
| Freeze–thaw splitting test | Asphalt mixture splitting test machine | Tianjin Jianyi FY716-3, Tianjin, China |
| Indirect tensile fatigue test | Multifunctional test system (UTM) | IPC Australia UTM-25, Brisbane, Australia |
Table 8.
Old asphalt performance indexes with different regenerant contents.
Table 8.
Old asphalt performance indexes with different regenerant contents.
| Index | Unit | Base Asphalt | Old Asphalt | Regeneration Agent Dosage (%) |
|---|
| 6 | 8 | 10 | 12 |
|---|
| Penetration | 0.1 mm | 72 | 24.9 | 37 | 64 | 78 | 96 |
| Softening point | °C | 47 | 63.5 | 60.1 | 56.7 | 48.3 | 45.2 |
| Ductility (15 °C) | cm | >150 | 19.6 | 37.8 | 90.2 | 109.6 | >100 |
Table 9.
Recycled AC-13 under freeze–thaw cycles.
Table 9.
Recycled AC-13 under freeze–thaw cycles.
| Environment Simulation/Times | Mixture Type | Deformation at 45 min d1/mm | Deformation at 60 min d2/mm | Dynamic Stability DS
Times/mm | Deformation Rate PRD
/% |
|---|
| 0 | 0% RAP | 3.542 | 3.925 | 1645 | 7.66 |
| 30% RAP | 3.138 | 3.43 | 2158 | 5.84 |
| 40% RAP | 3.046 | 3.297 | 2510 | 5.02 |
| 50% RAP | 2.875 | 3.11 | 2681 | 4.70 |
| 2 | 0% RAP | 3.665 | 4.073 | 1544 | 8.16 |
| 30% RAP | 3.657 | 3.978 | 1963 | 6.42 |
| 40% RAP | 3.436 | 3.725 | 2180 | 5.78 |
| 50% RAP | 3.419 | 3.689 | 2333 | 5.4 |
| 4 | 0% RAP | 3.889 | 4.351 | 1364 | 9.24 |
| 30% RAP | 3.727 | 4.096 | 1707 | 7.38 |
| 40% RAP | 3.698 | 4.044 | 1821 | 6.92 |
| 50% RAP | 3.689 | 3.997 | 2045 | 6.16 |
| 6 | 0% RAP | 3.904 | 4.425 | 1209 | 10.42 |
| 30% RAP | 3.834 | 4.257 | 1489 | 8.46 |
| 40% RAP | 3.816 | 4.198 | 1649 | 7.64 |
| 50% RAP | 3.747 | 4.076 | 1915 | 6.58 |
| 8 | 0% RAP | 4.27 | 4.843 | 1099 | 11.46 |
| 30% RAP | 4.025 | 4.479 | 1388 | 9.08 |
| 40% RAP | 3.986 | 4.408 | 1493 | 8.44 |
| 50% RAP | 3.678 | 4.058 | 1658 | 7.6 |
Table 10.
Low temperature trabecular bending test results of regenerated AC-13.
Table 10.
Low temperature trabecular bending test results of regenerated AC-13.
| Simulation/Times | Mixture Type | Maximum Load/KN | Mid-Span Deflection/mm | Flexural Tensile Strength RB/MPa | Maximum Bending Strengthb/ |
|---|
| Measured | Stipulation |
|---|
| 0 | 0% RAP | 0.90 | 0.62 | 8.56 | 2796 | ≥2300 |
| 30% RAP | 0.97 | 0.56 | 9.27 | 2518 |
| 40% RAP | 1.02 | 0.55 | 9.72 | 2488 |
| 50% RAP | 1.09 | 0.51 | 10.37 | 2315 |
| 2 | 0% RAP | 0.87 | 0.60 | 8.27 | 2714 |
| 30% RAP | 0.98 | 0.54 | 8.96 | 2443 |
| 40% RAP | 1.00 | 0.52 | 9.53 | 2318 |
| 50% RAP | 1.06 | 0.50 | 10.05 | 2267 |
| 4 | 0% RAP | 0.83 | 0.59 | 7.95 | 2637 |
| 30% RAP | 0.90 | 0.52 | 8.58 | 2358 |
| 40% RAP | 0.97 | 0.50 | 9.24 | 2259 |
| 50% RAP | 1.01 | 0.48 | 9.65 | 2147 |
| 6 | 0% RAP | 0.81 | 0.56 | 7.68 | 2518 |
| 30% RAP | 0.84 | 0.51 | 8.01 | 2279 |
| 40% RAP | 0.89 | 0.49 | 8.52 | 2194 |
| 50% RAP | 0.98 | 0.44 | 9.29 | 1987 |
| 8 | 0% RAP | 0.75 | 0.55 | 7.15 | 2478 |
| 30% RAP | 0.81 | 0.48 | 7.69 | 2153 |
| 40% RAP | 0.88 | 0.47 | 8.39 | 2101 |
| 50% RAP | 0.90 | 0.41 | 8.53 | 1848 |
Table 11.
Immersion Marshall test results of regenerated AC-13.
Table 11.
Immersion Marshall test results of regenerated AC-13.
| Number of Cycles/Times | Mixture Type | Marshall Stability MS/kN | Immersion Stability MS1/kN | Residual Stability MS0/% |
|---|
| Measured Value | Specification Requirements |
|---|
| 0 | 0% RAP | 12.38 | 10.89 | 87.96 | ≥80 |
| 30% RAP | 12.87 | 11.12 | 86.40 |
| 40% RAP | 13.27 | 11.39 | 85.83 |
| 50% RAP | 14.14 | 11.91 | 84.23 |
| 2 | 0% RAP | 11.26 | 9.79 | 86.94 |
| 30% RAP | 12.04 | 10.27 | 85.30 |
| 40% RAP | 12.19 | 10.36 | 84.99 |
| 50% RAP | 13.23 | 10.94 | 82.69 |
| 4 | 0% RAP | 10.98 | 9.36 | 85.25 |
| 30% RAP | 11.87 | 10.08 | 84.92 |
| 40% RAP | 12.05 | 10.12 | 83.98 |
| 50% RAP | 12.87 | 10.43 | 81.04 |
| 6 | 0% RAP | 10.26 | 8.36 | 81.48 |
| 30% RAP | 11.07 | 8.87 | 80.13 |
| 40% RAP | 12.25 | 9.72 | 79.35 |
| 50% RAP | 13.24 | 10.04 | 75.83 |
| 8 | 0% RAP | 10.23 | 8.25 | 80.65 |
| 30% RAP | 10.66 | 8.35 | 78.33 |
| 40% RAP | 12.67 | 9.78 | 77.16 |
| 50% RAP | 13.87 | 10.36 | 74.69 |
Table 12.
Recycled AC-13 fatigue life times.
Table 12.
Recycled AC-13 fatigue life times.
| RAP Content/% | Stress Ratio | Brake Fatigue Life/Times | Logarithm of Fatigue Life |
|---|
| 0 | 0.4 | 12546 | 4.0985 |
| 30 | 11231 | 4.05042 |
| 40 | 7368 | 3.8673 |
| 50 | 5268 | 3.7216 |
Table 13.
The fatigue life times of regenerated AC-13 under different stress ratios (10 Hz, 15 °C).
Table 13.
The fatigue life times of regenerated AC-13 under different stress ratios (10 Hz, 15 °C).
| RAP Dosage/% | Stress Ratio | Fatigue Life Times/Times | Logarithm of Fatigue Life |
|---|
| 0 | 0.3 | 72,387 | 4.859660578 |
| 0.4 | 12,546 | 4.098505283 |
| 0.5 | 6439 | 3.808818425 |
| 0.6 | 2346 | 3.370328008 |
| 30 | 0.3 | 49,398 | 4.693709366 |
| 0.4 | 11,231 | 4.050418427 |
| 0.5 | 4950 | 3.694605199 |
| 0.6 | 1597 | 3.203304916 |
| 40 | 0.3 | 38,327 | 4.583504827 |
| 0.4 | 7868 | 3.895864351 |
| 0.5 | 3262 | 3.513483957 |
| 0.6 | 1264 | 3.101747074 |
| 50 | 0.3 | 24,384 | 4.38710495 |
| 0.4 | 5968 | 3.775828814 |
| 0.5 | 1778 | 3.249931757 |
| 0.6 | 876 | 2.942504106 |
Table 14.
A summary of the regression parameters of the fatigue curve.
Table 14.
A summary of the regression parameters of the fatigue curve.
| RAP Dosage/% | K | n |
|---|
| 0 | 6.175 | 4.75 |
| 30 | 6.05 | 4.77 |
| 40 | 5.94 | 4.82 |
| 50 | 5.77 | 4.85 |
Table 15.
Fitting values of fatigue equation parameters a and b under different RAP content.
Table 15.
Fitting values of fatigue equation parameters a and b under different RAP content.
| RAP Dosage/% | 0 | 30 | 40 | 50 |
|---|
| a | 75.67 | 125.78 | 64.886 | 63.73 |
| b | −5.69 | −4.96 | −5.299 | −4.93 |
Table 16.
The fitting value of parameter a.
Table 16.
The fitting value of parameter a.
| Parameter Value | A1 | B1 | C1 | D1 | E1 |
|---|
| a | 75.67 | 1.670 | 666.89 | −26.9977 | 0.29869 |
Table 17.
The fitting value of parameter b.
Table 17.
The fitting value of parameter b.
| Parameter Value | A2 | B2 | C2 | D2 | E2 |
|---|
| b | −5.69 | −0.024 | 0.305 | −0.2817 | 0.00354 |
Table 18.
Fitting values of a and b parameters.
Table 18.
Fitting values of a and b parameters.
| Number of Cycles/Times | 0 | 2 | 4 | 6 | 8 |
|---|
| a | 125.839 | 48.753 | 26.678 | 30.637 | 126.677 |
| b | −4.96 | −5.67 | −5.906 | −5.37 | −3.325 |
Table 19.
The fitting value of parameter a.
Table 19.
The fitting value of parameter a.
| Parameter Value | A3 | B3 | C3 | D3 |
|---|
| a | 124.481 | −40.722 | 2.01 | 0.386 |
Table 20.
The fitting value of parameter b.
Table 20.
The fitting value of parameter b.
| Parameter Value | A4 | B4 | C4 | D4 |
|---|
| b | −4.966 | −0.348 | −0.017 | 0.0107 |
Table 21.
The parameter values of the fatigue prediction equation.
Table 21.
The parameter values of the fatigue prediction equation.
| Model Parameter | P1 | P2 | P3 | P4 | P5 | P6 |
|---|
| a | 791.371 | −27.01 | 0.0298 | −40.722 | 2.01 | 0.386 |
| b | −4.661 | −0.281 | 0.00354 | −0.348 | −0.017 | 0.0107 |


 ,
, 


