Article

Two-Step Plasma Electrolytic Oxidation of Advanced High-Strength Steel in Aluminate and Silicate Solutions

Materials and Surface Engineering Group, Faculty of Mechanical Engineering, Chemnitz University of Technology, 09107 Chemnitz, Germany
*
Author to whom correspondence should be addressed.
Coatings 2025, 15(7), 850; https://doi.org/10.3390/coatings15070850 (registering DOI)
Submission received: 30 June 2025 / Revised: 16 July 2025 / Accepted: 17 July 2025 / Published: 19 July 2025

Abstract

This work aims to clarify whether the individual advantages of the two commonly used silicate- and aluminate-based electrolytes for the plasma electrolytic oxidation (PEO) of steel can be combined in a two-step process. The first PEO step was carried out in an aluminate–phosphate electrolyte with pulsed voltage and anodic amplitudes between 150 V and 200 V. The second PEO step was carried out at an increased anodic voltage amplitude of 400 V in a silicate–phosphate electrolyte. As a reference, PEO was conducted in a single step in the same silicate–phosphate electrolyte at an increased anodic voltage amplitude of up to 400 V. The microstructural layer analysis was carried out using SEM and EDX analyses, Raman spectroscopy and XRD analysis. Heterogeneous layers containing iron oxide and iron phosphate form in the silicate–phosphate electrolyte at anodic voltage amplitudes up to 300 V by electrochemical reactions. Further increasing the anodic voltage amplitude up to 400 V results in heterogeneous layers, too. PEO in the aluminate–phosphate electrolyte at 150 V causes the formation of thin, amorphous layers mainly consisting of aluminum and iron oxides. At 200 V amplitude, a PEO layer with pronounced open porosity is formed, which primarily consists of the crystalline phases corundum and hercynite. During subsequent PEO in the silicate–phosphate electrolyte, the previously formed layers were replaced by a macroscopically homogeneous layer that is mostly nanocrystalline and may contain amorphous iron(-aluminum) phosphates and oxides as well as silicon oxide. It can be concluded that the two-step PEO process is suitable for the production of more homogeneous PEO layers.

1. Introduction

Plasma electrolytic oxidation is a surface treatment that is primarily used to produce oxidic functional layers on the light metals Al [1], Mg [2] and Ti [3] as well as on other so-called valve metals, e.g., Nb [4]. In addition, research into the PEO of iron base materials has been intensified over the past 20 years [5]. One challenge here is the formation of an electrically insulating and sufficiently adhesive layer. This enables the inhibition of the electrochemical side reactions of metal dissolution and oxygen development and the increase in the anode potential until the electrolyte-specific ignition voltage is exceeded [6]. In addition, the formation of aluminum [7,8,9] or silicon oxides [10,11,12] is often pursued, as such PEO layers are characterized by an increased corrosion and/or wear protection capacity in many application scenarios [10,13]. For this reason, electrolytes containing aluminates or silicates are primarily used for the PEO of steel [5]. The state of knowledge about the electrolyte-specific mechanisms of surface layer formation (before the ignition voltage is reached) and the properties of PEO layers is briefly summarized below.
It is known from the literature that electrochemical passivation occurs during anodic polarization of unalloyed or low-alloy steels in alkaline solutions [14,15]. Divalent Fe oxides and hydroxides are initially formed and gradually oxidized further to trivalent Fe oxides and hydroxides [14,15], resulting in multilayer oxides/hydroxides with a thickness of a few nanometers [14,16]. If the anodic potential for oxygen evolution is sufficiently exceeded, e.g., above about 500 mV vs. SCE (equals 741 mV vs. SHE) at pH 13 [14], the passive layer is damaged due to gas evolution, resulting in a significant increase in the current density. This behavior was also observed with potentiodynamic polarization in aluminate (phosphate) solutions [17]. A measurable decrease in pH occurs near the anode with strongly increasing oxygen evolution [17]. The mechanisms of gel formation and precipitation with decreasing pH are described in more detail in [18,19]. In summary, the pH-induced precipitation reactions of insoluble Al2O3, Al(OH)3 or alumina-aluminum phosphate in aluminate [19,20] and aluminate–phosphate solution [8] can be described by the summation formulas in Equations (1) to (3). As a compromise between favoring the precipitation reaction and electrolyte stability, aluminate solutions with pH values between about 10 and 13 are often used for the PEO of steel. The electrolyte stability can be increased by adding pH buffers and complexing agents, whereby citrate and oxalate ions, for example, form particularly strong complexes with the Al ions [20,21].
[ A l ( O H ) 4 ] + H + A l ( O H ) 3 + H 2 O
2 [ A l ( O H ) 4 ] + 2 H + A l 2 O 3 + 5 H 2 O
3 [ A l ( O H ) 4 ] + [ H P O 4 ] 2 A l 2 O 3 · A l P O 4 + 5 O H + 4 H 2 O
Precipitation layers are formed well below the ignition voltage, as described in [17] (<OCP + 4 V) and [20] (<75 V). They predominantly consist of amorphous, hydrogenated Al(OH)3 [20] or Al2O3 and possibly hydrous phosphate [17], have a thickness of about 10 to 20 µm [17], and are described as closed and loosely adherent layers. The suitability of the precipitation layers as electrically insulating layers was demonstrated by means of ramp-like polarization tests [22] up to 100 V anode potential [23]. A similar precipitation layer with a characteristic block-like appearance due to drying and the associated decrease in volume [17,20,21] is shown in [8] for cell voltages of 450 V and 600 V (still below the ignition voltage). A sufficiently firmly adhering precipitation layer is converted into an Al2O3 layer by microarc discharges that has a similar topography to PEO layers on Al alloys [8]. Additionally, Al2O3 can be formed by thermal decomposition of aluminate ions in the discharge channel and participate in the layer formation [19]. Depending on the process parameters (e.g., electrical parameters, process duration), the PEO layers can have largely different phase compositions, ranging from FeAl2O4 and Fe3O4 [8,24], to Al2O3 phases and iron oxides [7,13,25] and almost pure Al2O3 with a high corundum content [19,23,26].
According to [5], the formation of an insulating layer in silicate electrolytes below the ignition voltage takes place analogously by deposition of a silicon oxide layer; however, the reaction conditions are not described in more detail. Silicate is considered to be a corrosion inhibitor due to the formation of a protective layer on Fe in alkaline solutions [27]. In addition, the pH-induced precipitation of silicate has been observed in various technical applications [28,29] and in geology, for example, in [30]. During the PEO process, the precipitation layer formation appears to be less pronounced in silicate electrolytes, which leads to higher current densities at the same voltage compared to aluminate electrolytes [31]. The substrate participates more strongly in the PEO process compared to aluminate electrolytes, so that the PEO layer grows further into the substrate [31]. Substrate oxidation and inward growth lead to increased layer adhesion [10]. As a result of silicate precipitation and conversion to SiO2 and oxidation of Fe from the substrate, the PEO layers typically consist of iron oxides and SiO2 [10,24,32]. Both a relatively uniform element and phase distribution with a homogeneous Si content and slightly increased Fe content near the substrate [11] and a two-layered structure with iron oxides near the substrate and amorphous SiO2 near the layer surface [31,33] are described in the literature.
To the authors’ knowledge, the combination of PEO processes in aluminate and silicate electrolytes in a multi-stage PEO process has not yet been described in the scientific literature. Based on the current state of research, however, the potential can be deduced to first produce an electrically insulating precipitation layer and PEO layer in aluminate solution and then to convert the layer during PEO in silicate solution in order to increase the adhesion to the substrate. The focus of this study is particularly on the layer formation during the PEO steps in both electrolytes and at different voltage amplitudes.

2. Materials and Methods

2.1. Materials

The DP steel CR440Y780T-DP/HCT780XD (mass fraction in %: <0.17 C, <0.3 Si, <2.0 Mn, <0.05 P, <0.01 S, 0.015–0.08 Al, <1.0 Cr + Mo, <0.05 Nb + Ti), provided by Salzgitter Flachstahl GmbH, Salzgitter, Germany, as hot-dip galvanized sheets with a thickness of about 1.7 mm, served as the substrate material. The samples were cut to a size of 15 × 15 mm2 by water jet cutting. Subsequently, about 0.1 mm to 0.2 mm of the sheet thickness was removed by grinding on one side. In this way, the hot dip galvanizing coating (thickness < 10 µm) and an edge region with a slightly different metallographic appearance (thickness approx. 50 µm, possibly decarburized) were removed. Furthermore, a blank metal surface with a defined roughness of R a ≈ 0.4 µm and R z ≈ 3.0 µm (transverse to the grinding direction) was obtained by grinding. Directly before the electrochemical measurements, the samples were degreased with ethanol. The samples appeared metallically bright. Pickling was avoided in order not to preferentially dissolve electrochemically less noble phases and thus change the phase composition on the surface.

2.2. PEO Experiments

The PEO experiments were performed in a capsuled treatment station (OTE Scheigenpflug, Leipzig, Germany). The experimental setup was connected to a pe861UA-500-10-24-S rectifier (plating electronics, Sexau, Germany) with a maximum output of 500 V (rms) voltage, and the current limit (rms) was set to 5 A. The DP steel sample was clamped in a cylindrical sample holder in a way that it is in contact on the back and masked on the front. The measurement area was about 78.5 mm2 (circular opening with a diameter of 10 mm). A stainless-steel foil served as the reference electrode. Electrical data acquisition was performed using a DL950 transient recorder (Yokogawa, Tokyo, Japan). A Raspberry Pi camera module IMX477 (Raspberry Pi Foundation, Cambridge, UK) with an 8–50 mm zoom lens was placed outside the bath and directed to the active process area to film the PEO process through a glass window.
The electrolyte composition of the silicate electrolyte (S) was 5 g/L KOH, 5 g/L Na2SiO3·5H2O and 1 g/L Na2HPO4. The electrolyte was used in a PEO basin with a volume of 15 L (including the cooling circuit), which was directly cooled by a heat exchanger to 20 °C. The electrolyte composition of the aluminate electrolyte (A) was 0.6 M NaAlO2, 0.3 M Na3PO4·12H2O and 0.15 M C4H6O6. In order to avoid aluminate precipitation within the cooling circuit, a 2.5 L electrolyte volume was used in a 3 L beaker. The glass was placed in a bath filled with 20 L (including the cooling circuit) of water, which was cooled by a heat exchanger to 20 °C.
Voltage-controlled anodic pulses with stepwise increased amplitude levels were applied to first facilitate the formation of insulating layers and initial PEO layers and stepwise thickening and transformation of the initial layer. The durations of voltage steps were 600 s for the voltage amplitude levels 150 V, 175 V and 200 V and 300 s for the voltage amplitude levels 300 V and 400 V. Unipolar, rectangular pulses were applied with 10 ms on-time and 10 ms off-time for the voltage amplitude levels 150 V, 175 V and 200 V and 2 ms on-time and 10 ms off-time for the voltage amplitude levels 300 V and 400 V. Table 1 gives an overview of the voltage and electrolyte steps. Conditions No. 1 to 3 were treated with a different number of voltage steps in aluminate electrolyte only. Condition No. 4 was treated in silicate electrolyte only as a reference, passing all investigated voltage steps. Finally, conditions No. 5 to 7 were treated in aluminate electrolyte and silicate electrolyte with varying numbers of voltage steps.

2.3. Microstructural Analysis

All specimens were routinely documented using a stereo microscope MVX 10 (Olympus, Tokyo, Japan). Additionally, metallographic preparation of cross-sections was carried out. For this purpose, the samples were cut, embedded in conductive resin, ground on SiC paper to 4000 grit, polished on cloths to a diamond size of 1 µm and, finally, polished with a suspension of colloidal silicon dioxide. Prior to scanning electron microscopy (SEM) measurements, the cross-sections were rinsed in ethanol and isopropanol and then dried in an oven at 60 °C. In order to ensure a sufficient electrical conductivity of the electrically insulating layers for the SEM investigations, all ground surfaces were vapor-coated with carbon. The scanning electron microscopic investigations were carried out with a SEM LEO1455VP (Zeiss, Oberkochen, Germany) at an acceleration voltage of 25 kV and a working distance of 14.5 mm using the secondary electron (SE) and backscattered electron (BSE) contrasts. In addition, the chemical composition of the layers was determined using energy-dispersive X-ray microanalysis (EDX, EDAX Genesis, Ametek Inc., Berwyn, IL, USA) at characteristic microstructural features.
In order to determine the phase composition, an X-ray diffraction (XRD) analysis was carried out using the D8 Discover (Bruker, Billerica, MA, USA) diffractometer with Co-Kα radiation. The measurements were performed on the surface of samples with a point focus (diameter pinhole aperture 0.5 mm) and the LYNXEYE XE-T detector (Bruker, Billerica, MA, USA). Measurements for the qualitative determination of the phase composition were carried out on the same sample surfaces using a confocal Raman microscope inVia (Renishaw, Wotton-under-Edge, United Kingdom). The measurement was carried out with a 20× lens and a laser wavelength of 532 nm at 10% excitation energy for 1 s with 25 accumulations. The reference data of possible phases were taken from the RRUFF database [34] and from the scientific literature.

3. Results

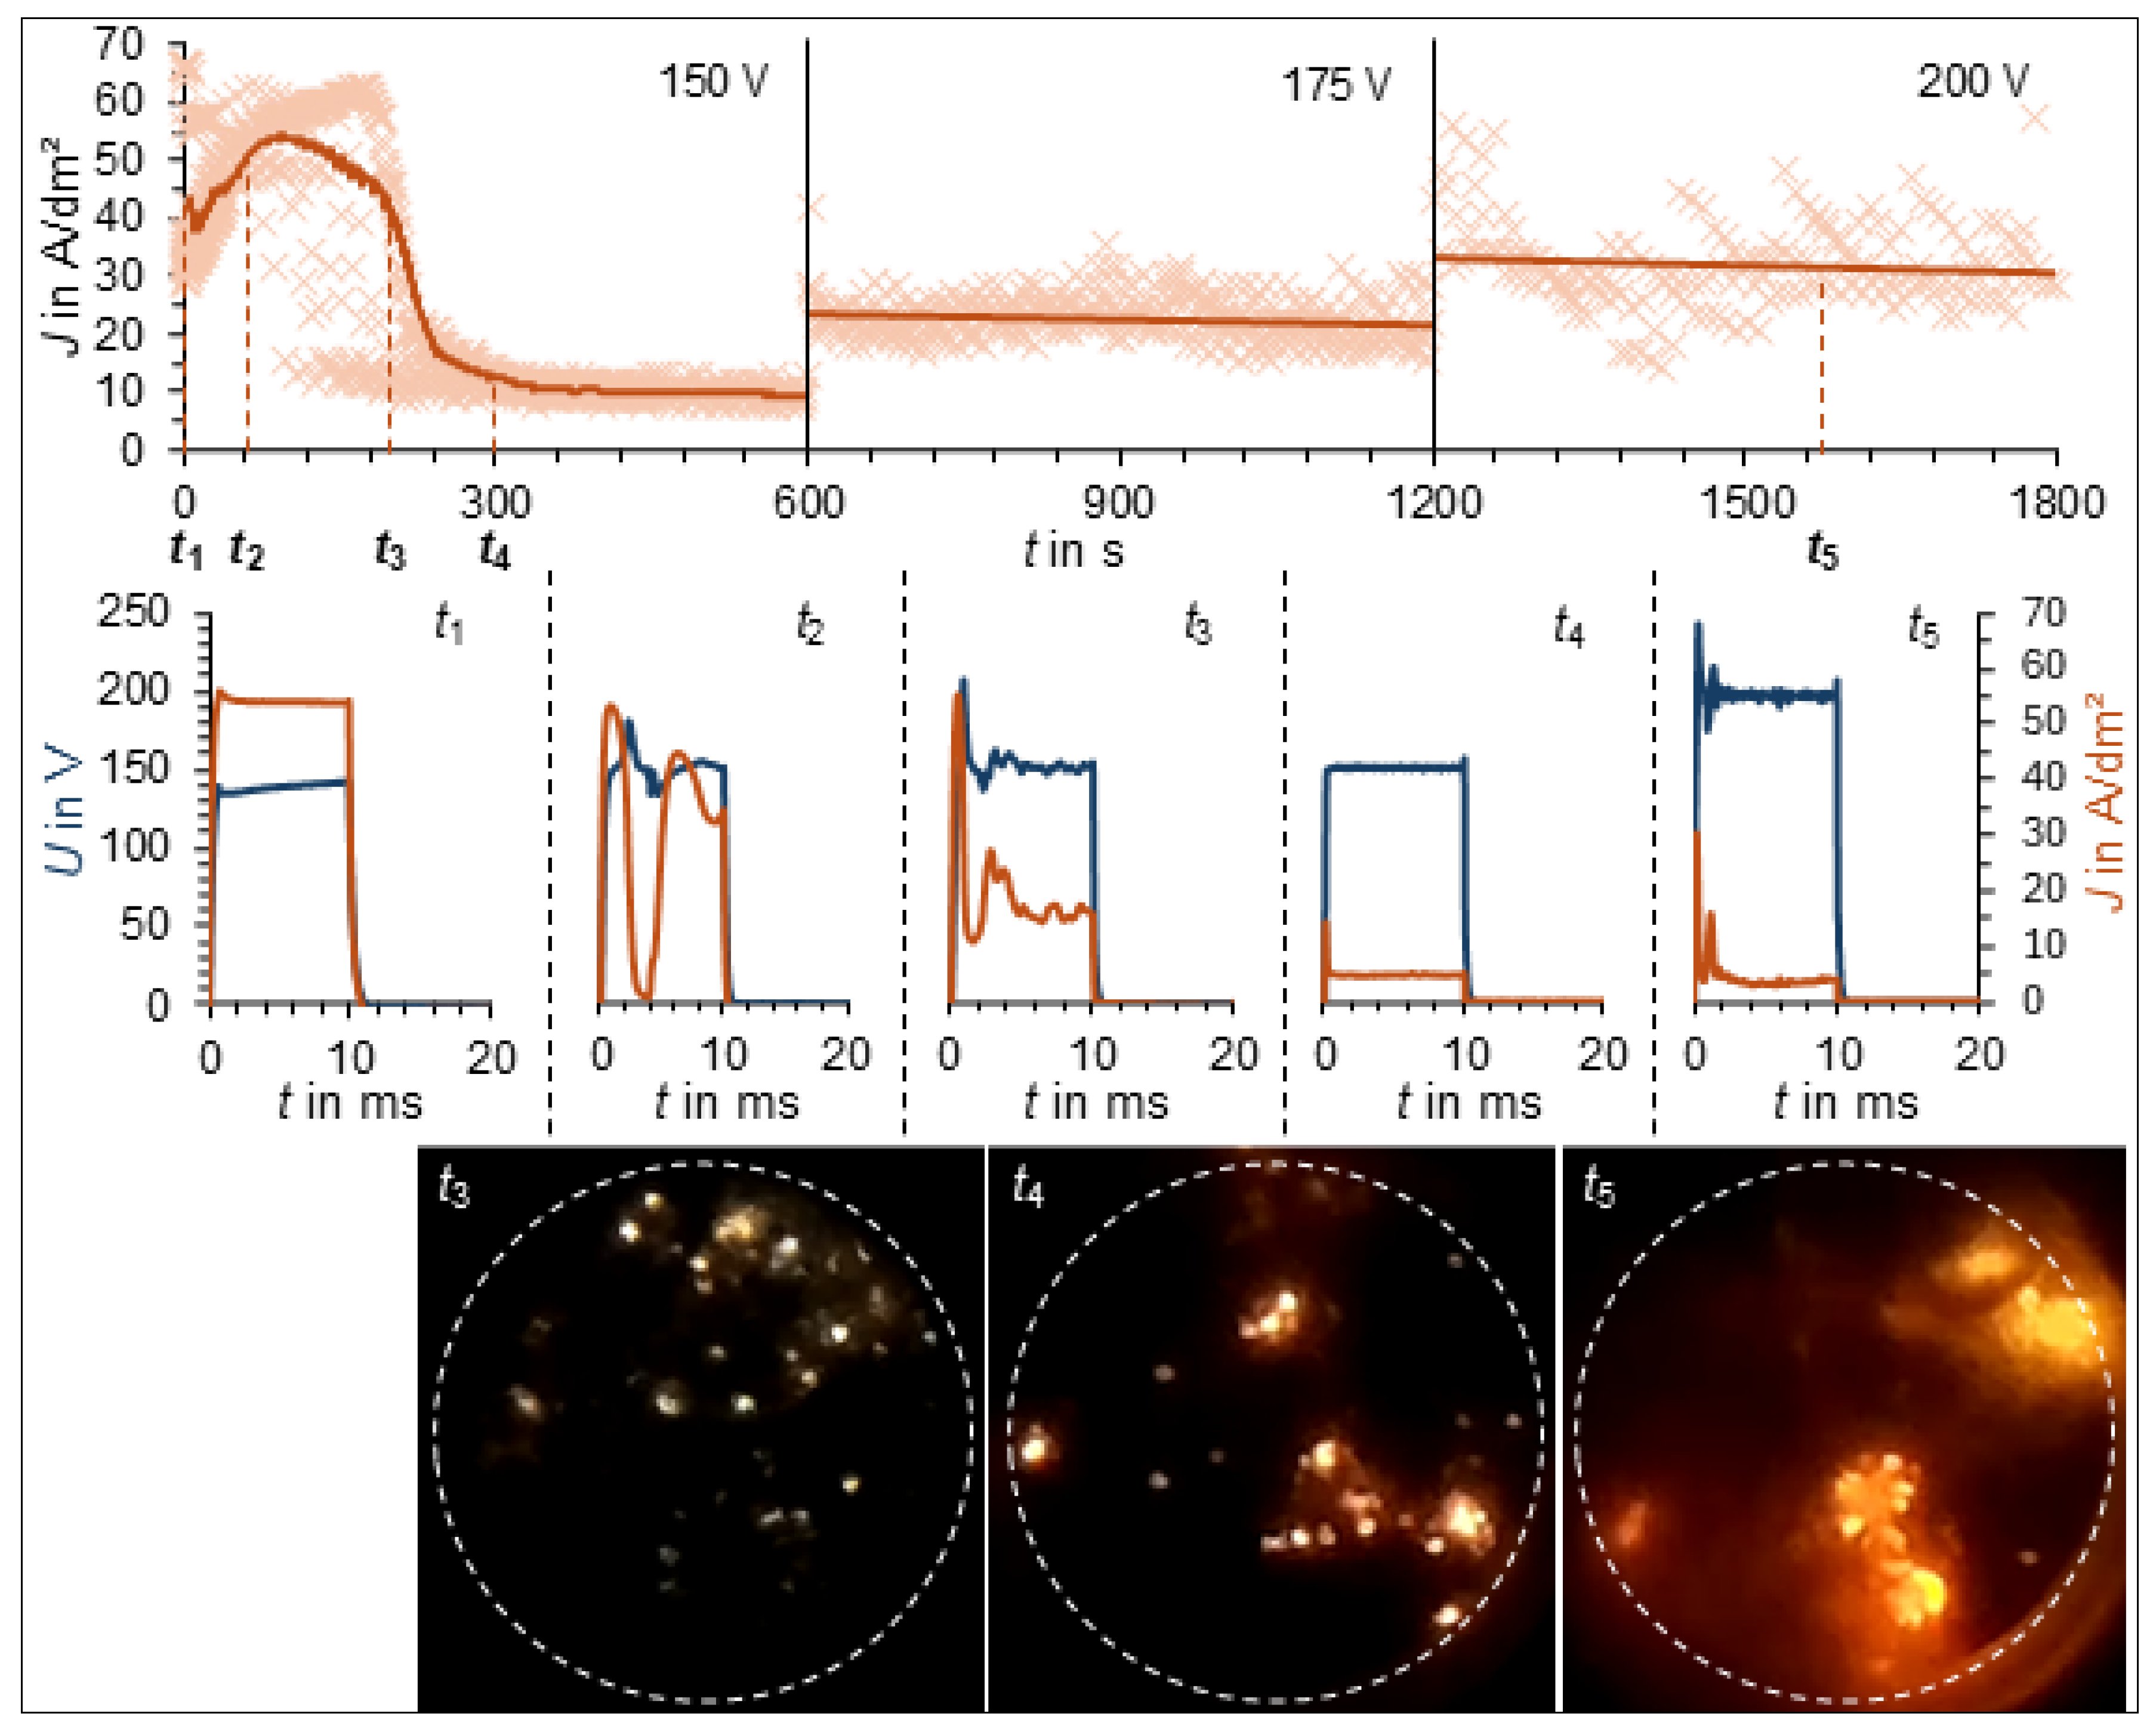
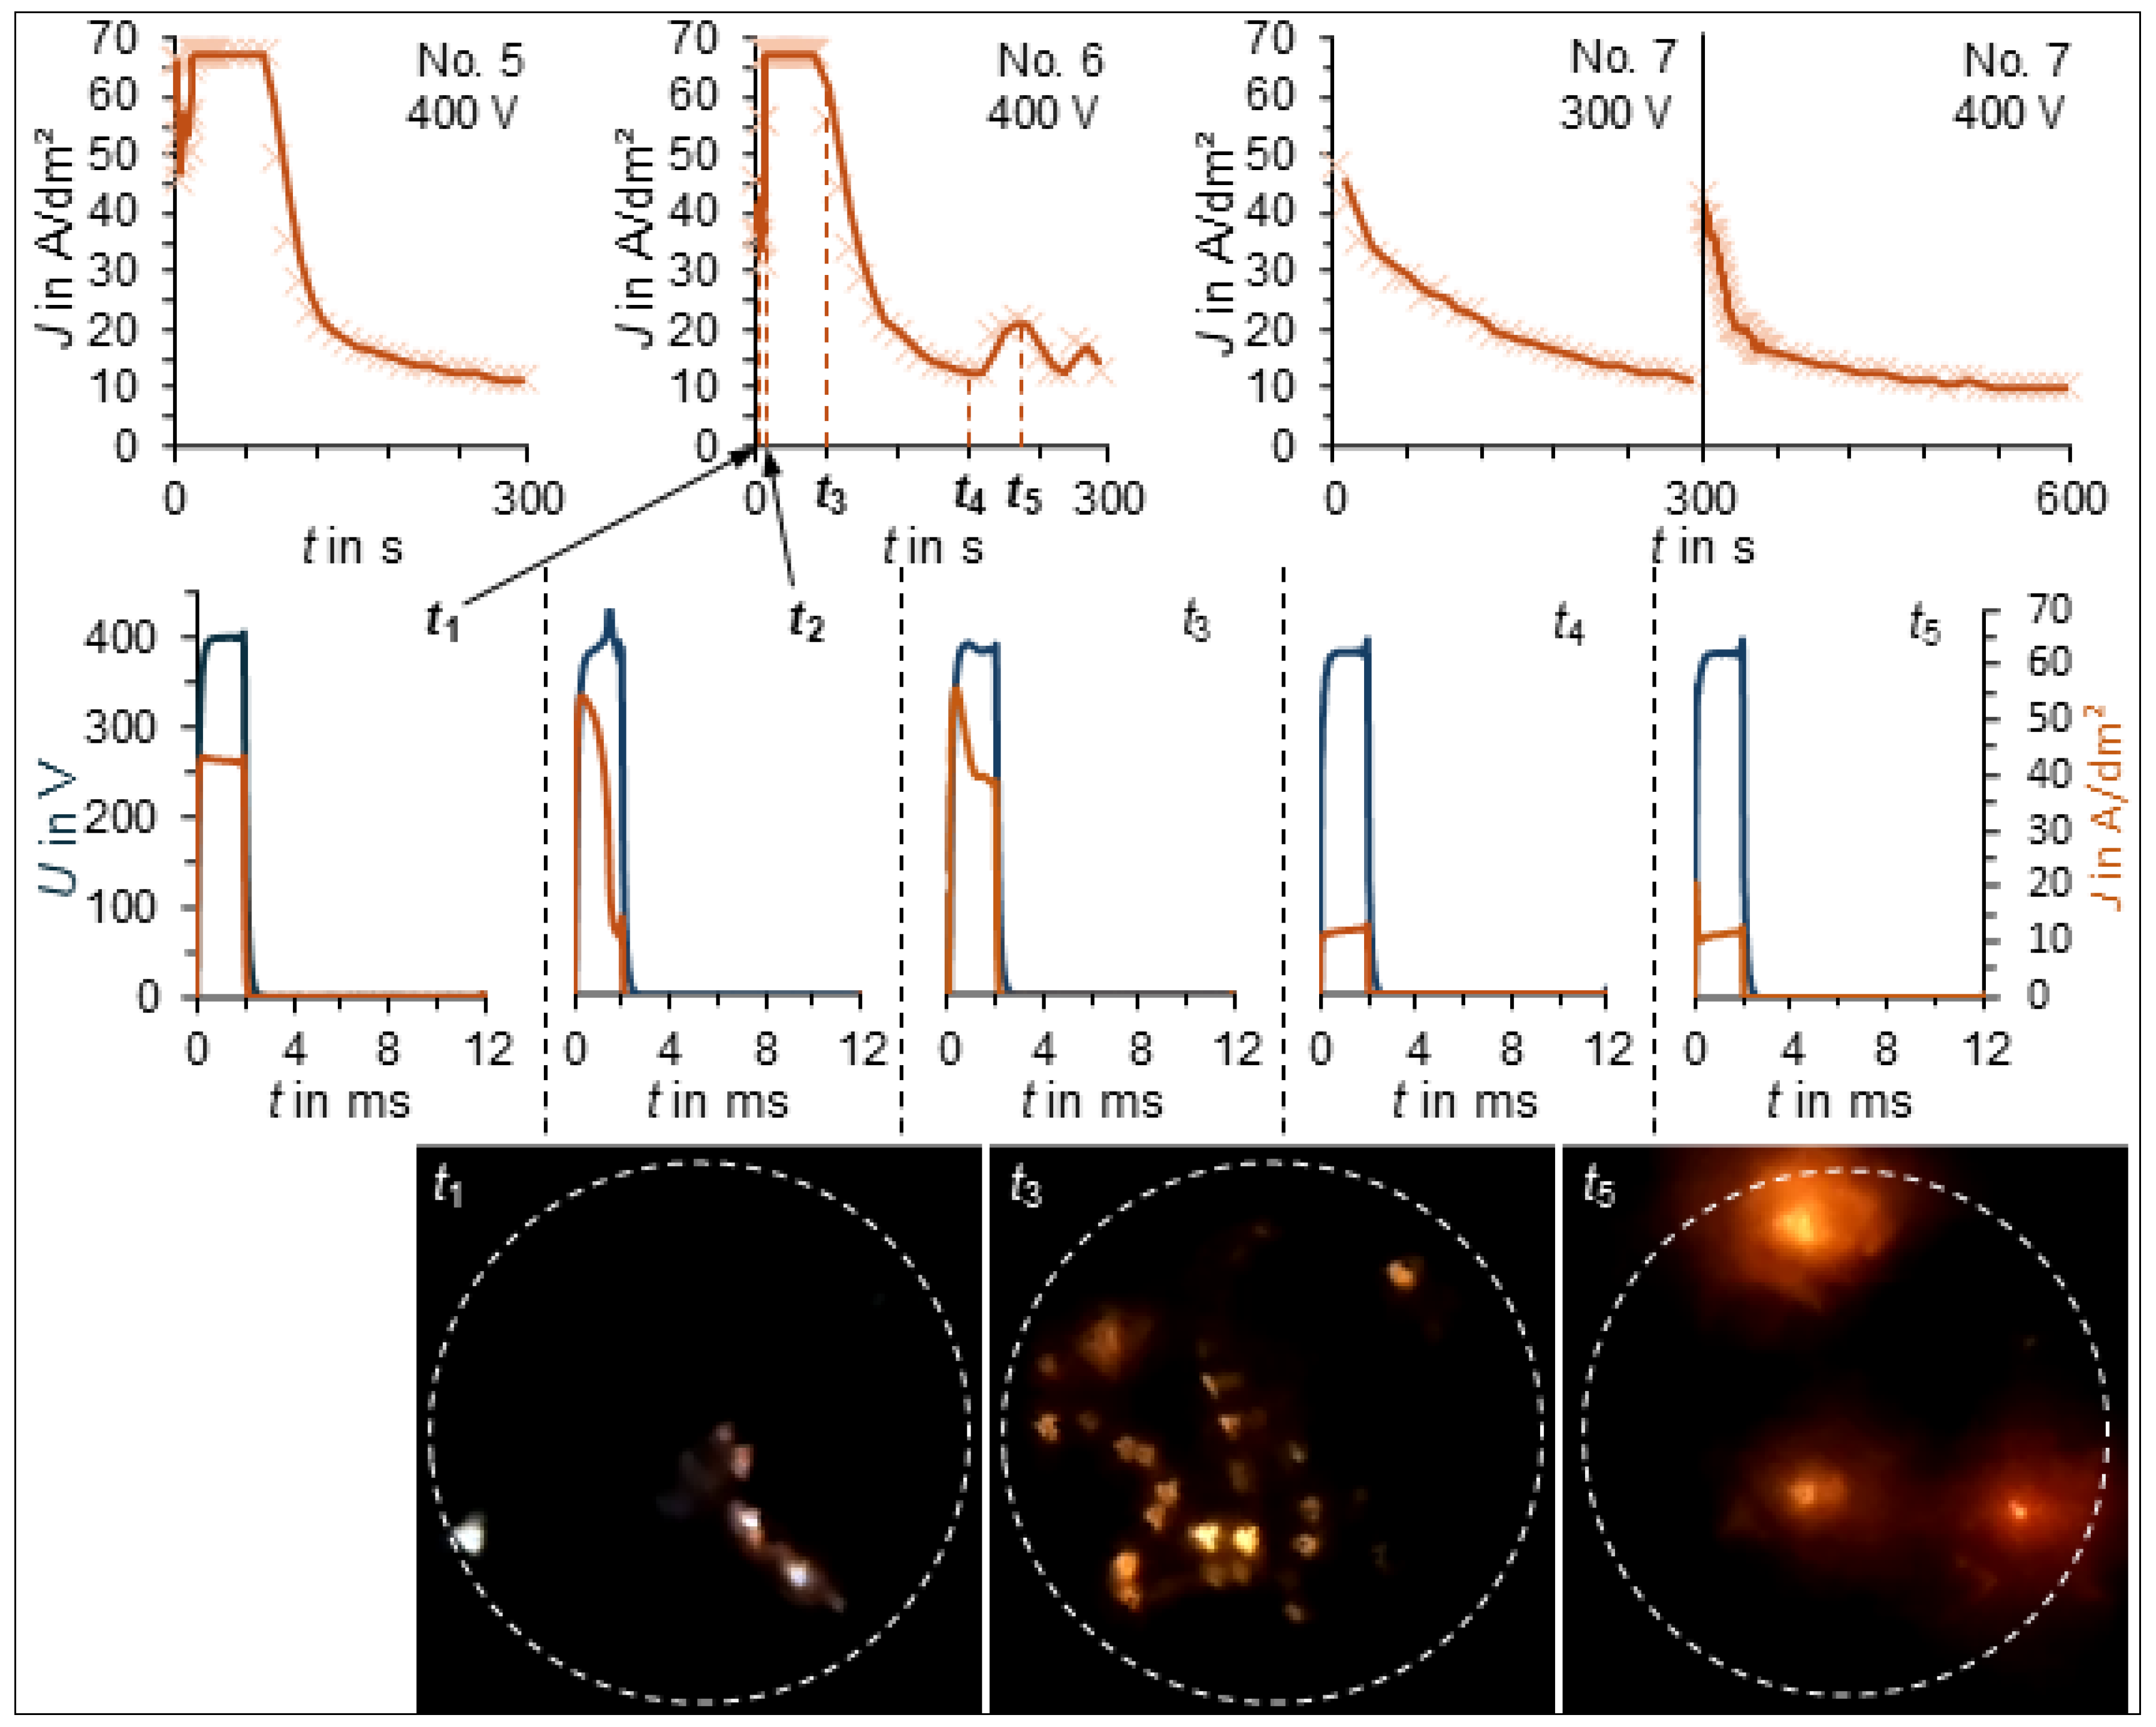
3.1. PEO Process Characteristics

The electrical process data was analyzed on two different time scales: Firstly, the maximum magnitudes of the current density pulses were evaluated and plotted over the process duration (Figure 1, Figure 2 and Figure 3, top row). Secondly, the voltage and current density time curves during individual pulses were analyzed. Voltage and current density transients are shown in the middle row in Figure 1, Figure 2 and Figure 3 to illustrate key characteristics of selected PEO experiments and process times. The predefined current limit of 5 A (corresponding to a current density of 637 A/dm2) was not reached in any of the experiments. Consequently, the pre-defined voltage amplitude could always be realized, aside from fluctuations due to the process and the voltage control.
The process steps in aluminate electrolyte were passed during several experiments, whereby similar process characteristics occurred at different times, especially regarding the first step with a voltage amplitude of 150 V (see Figure 1, top). Therefore, representative time points (t1 to t5) were marked on the continuous trend curve, and typical pulse characteristics from individual tests were assigned. The PEO in aluminate solution is characterized by a strong increase in the anodic current density at the beginning of the process (t2 in Figure 1, top) and a subsequent significant decrease in current density (t3 to t4 in Figure 1, top). In the range of the maximum, at about 100 s to 200 s duration, current density amplitudes of about 50 A/dm2 to 65 A/dm2 are reached. The shape of the voltage and current density pulses changes considerably over the process duration. After one second of process time (t1 in Figure 1, middle row), the voltage and current density pulses are almost rectangular in shape. After about 10 s, a fluctuation of the current density can already be observed during the pulse, which significantly increases during the phase of the increasing current density amplitude in Figure 1 (top). The strongest fluctuations in voltage and current density transients during the pulse duration were observed during the phase of the maximum current density amplitudes. As can be seen from a representative pulse at t2 in Figure 1 (middle row), the process voltage fluctuates between around 180 and 130 V in the first 5 ms and finally settles at around the pre-set 150 V. The current density maximum shown in Figure 1 (top) corresponds to the current density peak at the beginning of the pulse. This is followed by a current density minimum that almost reaches zero. Between about 100 s and 200 s process duration, the current density maximum at the beginning of the pulse initially remains at a high level (see the trend in Figure 1, top), whereby the fluctuation of current density and process voltage during the pulse and the current density level at the end of the pulse continuously decrease. A phase with decreasing current density-amplitude follows, starting at around 80 s to 200 s (Figure 1, top). As the current density decreases, finely distributed microarc discharges occur (Figure 1, bottom row, t3). During the phase of significantly decreasing maximum current density in Figure 1 (top), the current density transients change to a current density peak at the start of the pulse, followed by a current density plateau (Figure 1, middle row, t4). These characteristics are maintained in the period between about 300 s and 600 s, with the amplitude of the current density peak decreasing to about 10 A/dm2. Finely distributed microarc discharges dominate, with the color of the microarc discharges shifting to reddish (Figure 1, bottom row, t4). Occasionally, microarc discharges occur that are localized in one place for several seconds. At the end of the first voltage step at a voltage amplitude of 150 V, the pulse current density amplitude after the initial peak is about 4 A/dm2.
The stepped Increases in the voltage amplitude to 175 V and 200 V result in increases in the current density amplitude, whereby the amplitude values scatter strongly during the course of one experiment, particularly at a voltage amplitude of 200 V. As can be seen from the linear trend lines in Figure 1 (top), this scattering occurs around a mean value that decreases slightly with increasing process duration at one voltage level. The characteristics of the current density pulses with a short initial peak and subsequently constant current density level are basically retained at 175 V and 200 V voltage amplitude. The scattering of the current density amplitude in Figure 1 (top) is due to the different heights of the initial current density peaks over time. In addition, current density fluctuations around the current density level occur occasionally. A pulse with stronger voltage and current density fluctuations is shown in Figure 1 (middle row, t5). The intensity of the microarc discharges increases with the stepped increase in voltage and current density amplitude. In addition, the microarc discharges are increasingly localized to small sample areas (Figure 1, bottom row, t5). A further increase in the voltage amplitude in the aluminate electrolyte was dispensed with due to excessive electrical power and consequent heating.
At the beginning of the second electrolyte step in silicate solution at 300 V (No. 7) or 400 V (Nos. 5, 6 and 7) voltage amplitude, a clear increase in the current density amplitude is always observed (Figure 2, top row). The most important characteristics of the PEO process data are described below, with the example of condition No. 6, and are shown in Figure 2. Right at the beginning of the process, fine, white to yellowish microarc discharges occur along lines (Figure 2, bottom row, t1). At this point, there are approximately rectangular voltage and current density pulses (Figure 2, middle row, t1). After a few seconds, the microarc discharges extinguish. The pulses are characterized by a current density maximum at the beginning of the pulse, which is followed by a current density minimum (Figure 2, middle row, t2). Within the short pulse duration of 2 ms, neither the current density nor the voltage reaches steady-state values. During the subsequent discharge-free period, a maximum current density amplitude of 67 A/dm2 is reached (Figure 2, top row, between t2 and t3). This is due to a consistently high current density maximum at the beginning of the pulse. The fluctuations in the current density and voltage curves decrease and approach the shape of the transients shown in Figure 2, middle row, t3. After about 60 s, finely distributed, reddish microarc discharges initiate (Figure 2, bottom row, t3). Shortly before the end of the process, fluctuations in the maximum current density amplitude between approx. 10 and 20 A/dm2 occur, particularly in condition No. 6 (Figure 2, top row). These are due to different amplitudes of the current density peaks at the beginning of the pulse (see t4 and t5 in Figure 2, middle row). At time t5 (local current density maximum in Figure 2, top row, No. 6), more localized microarc discharges occur (Figure 2, bottom row, t5). At the end of the process, after 300 s at 400 V voltage amplitude, current density amplitudes of around 10 A/dm2 are reached for all combined PEO processes (Figure 1, top row).
At the beginning of the reference PEO process in the silicate electrolyte, the current density amplitudes of 25 to 30 A/dm2 are around 50% of the current density amplitudes measured in the aluminate electrolyte during the same period (Figure 3, top). In contrast to the discharge-free initial phase in the aluminate electrolyte, the voltage and current density pulses are almost rectangular (Figure 3, middle row, t2 and t3). In the period between 200 s and 400 s, the current density amplitude drops to below 5 A/dm2. This corresponds approximately to the current density level that is reached at the end of the first stage with a voltage amplitude of 150 V in the aluminate electrolyte (Figure 1, top). After about 300 s process duration, the first few and finely distributed microarc discharges with a reddish color are visible. In contrast to the aluminate electrolyte, the current density amplitude remains at approximately the same low level even when voltage amplitude increases to 175 V and 200 V. An increased intensity of the microarc discharges is only recognizable immediately after the voltage-amplitude increase for about 10 s to 20 s. This is shown in Figure 3 with the example of the time t3 after a 602 s process duration. For the rest of the time, only few isolated discharges are recognizable. Increasing the voltage amplitude to 300 V after 1800 s leads to a sustained increase in the current density amplitude to around 10 A/dm2, but not to a permanent intensification of the microarc discharges.
When the voltage amplitude is increased to 400 V, the microarc discharges become significantly more intense. In addition to finely distributed, reddish discharges, intense discharges occur occasionally. After about 2130 s, microarc discharges increasingly localize at one area for several seconds, as, for example, at the right edge in Figure 3, bottom row, at time t4. In the further process, sudden changes in the discharge pattern occur, with smaller white to yellowish discharges taking place on a clearly defined area (Figure 3, bottom row, t5). These phases are associated with a large increase in the current density amplitude, as can be seen clearly in Figure 3 (top) at time t5. During this period, strong current density and voltage fluctuations occur during a pulse (Figure 3, middle row, t5). This is followed by a phase of finely distributed, reddish microarc discharges, whereby the microarc discharges again become increasingly localized towards the end of the process.

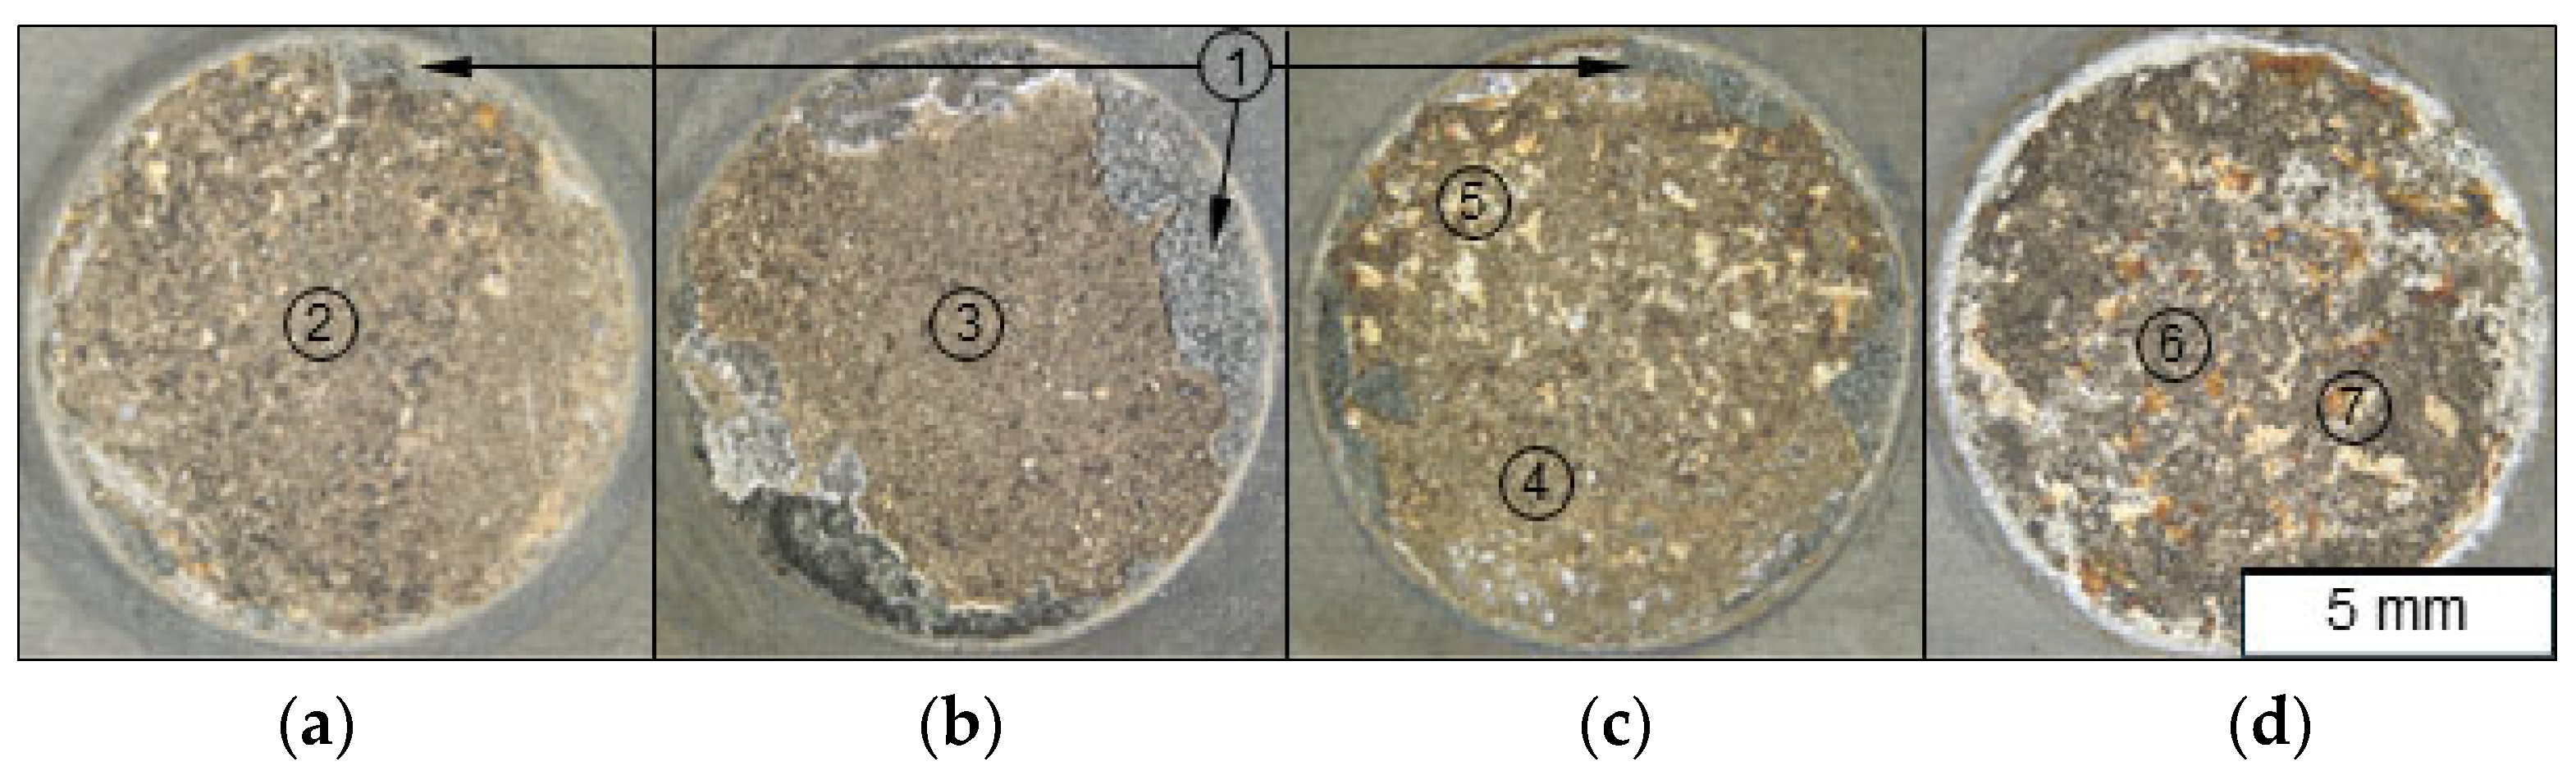
3.2. Macroscopical and Microstructural Features
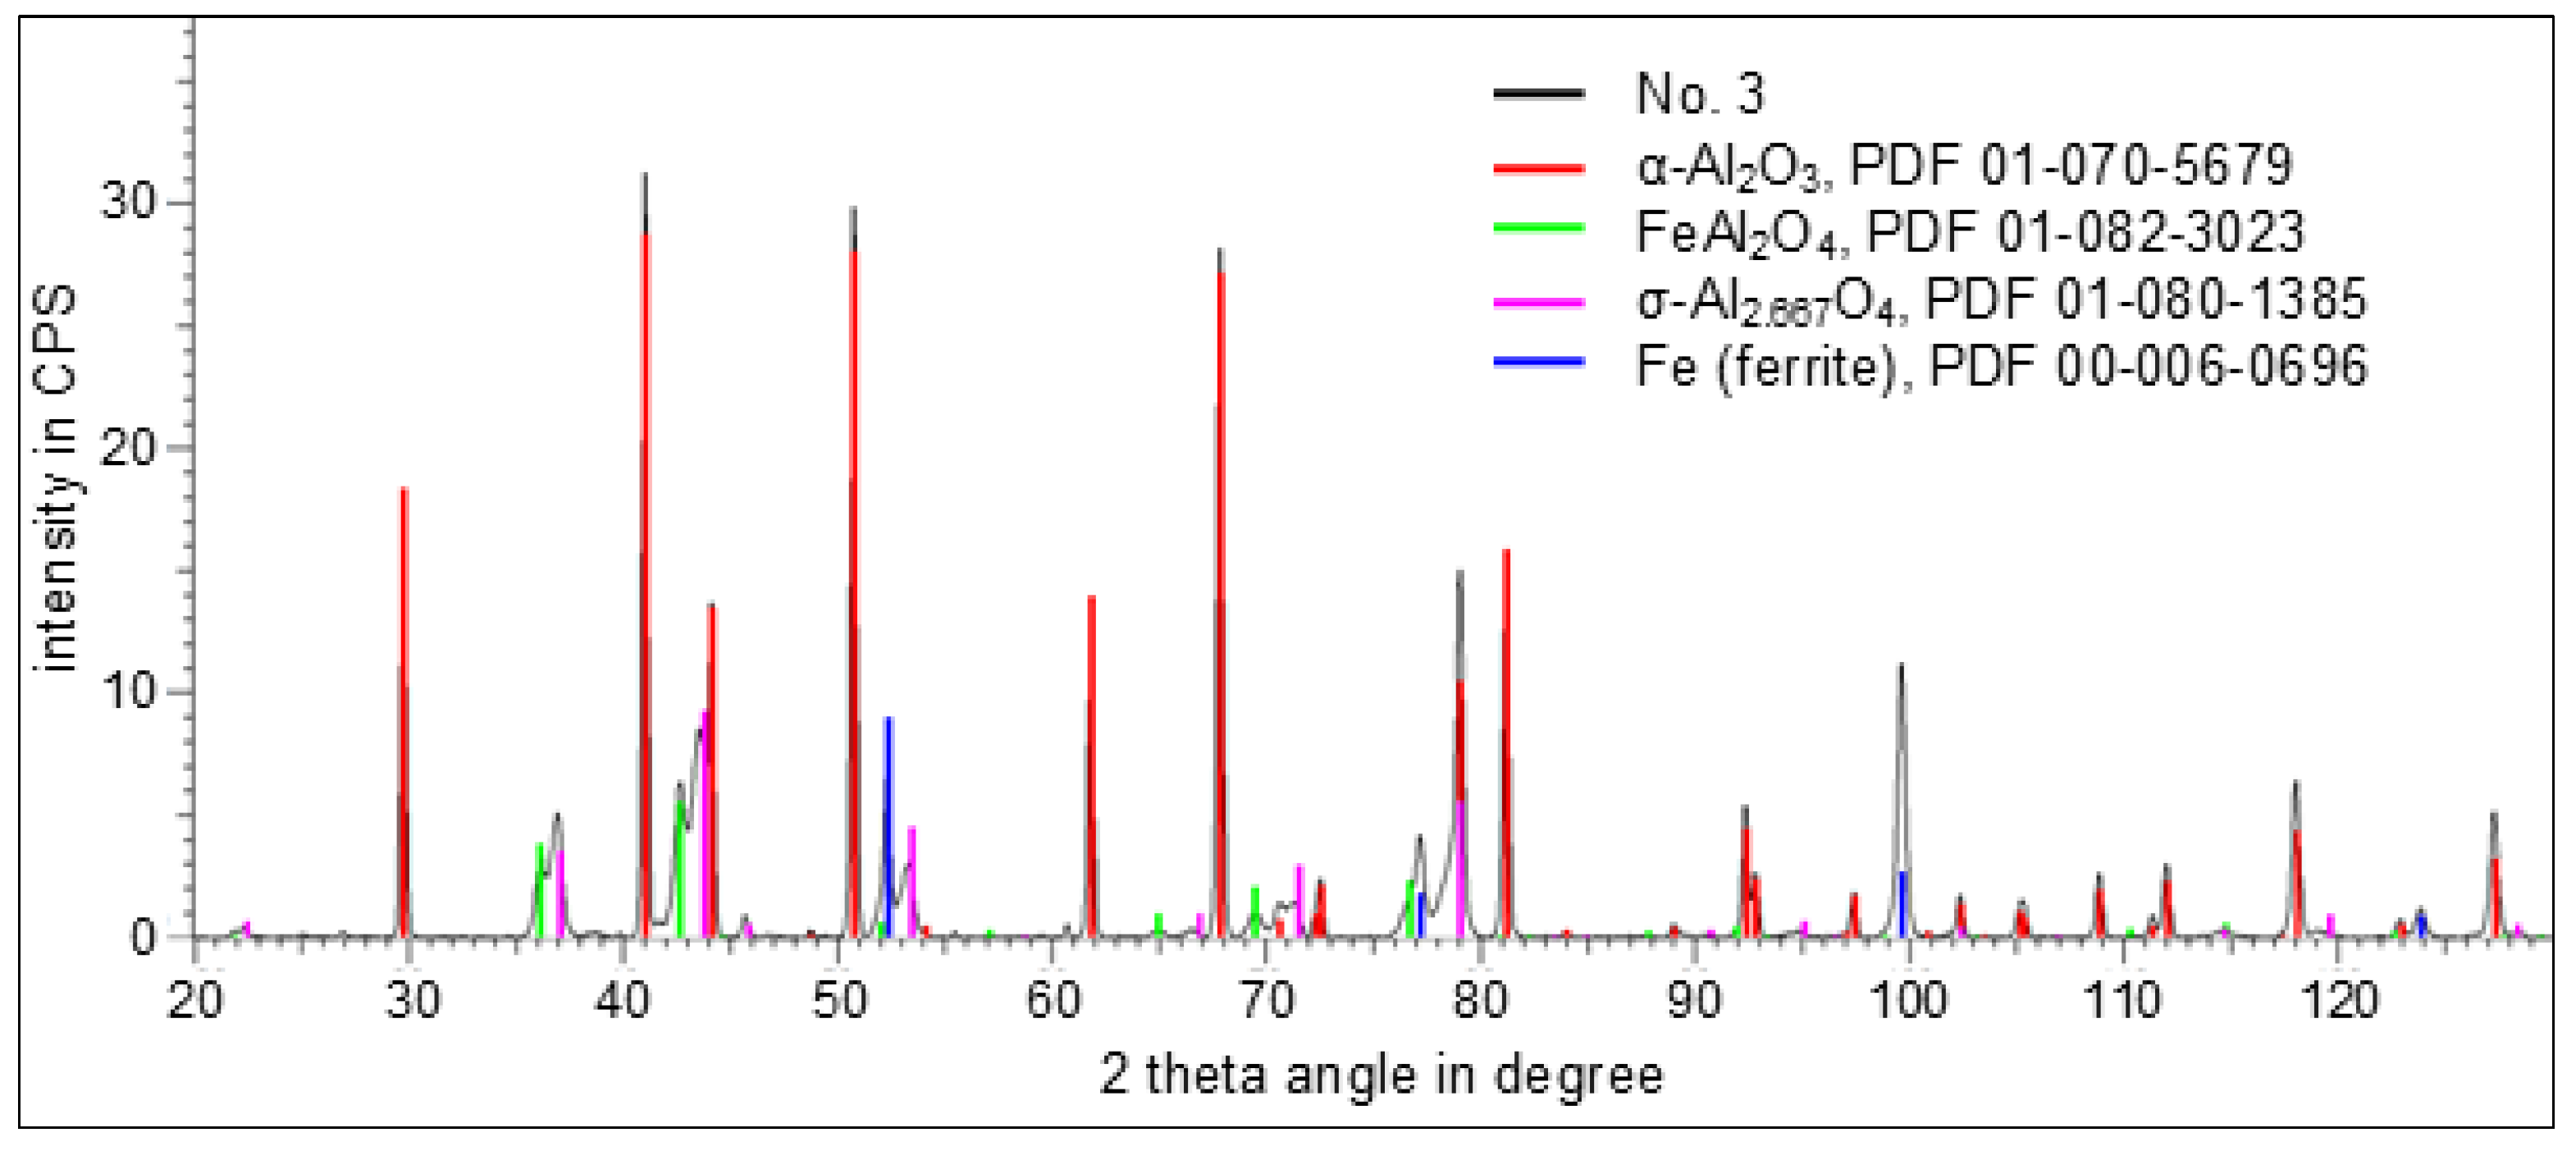
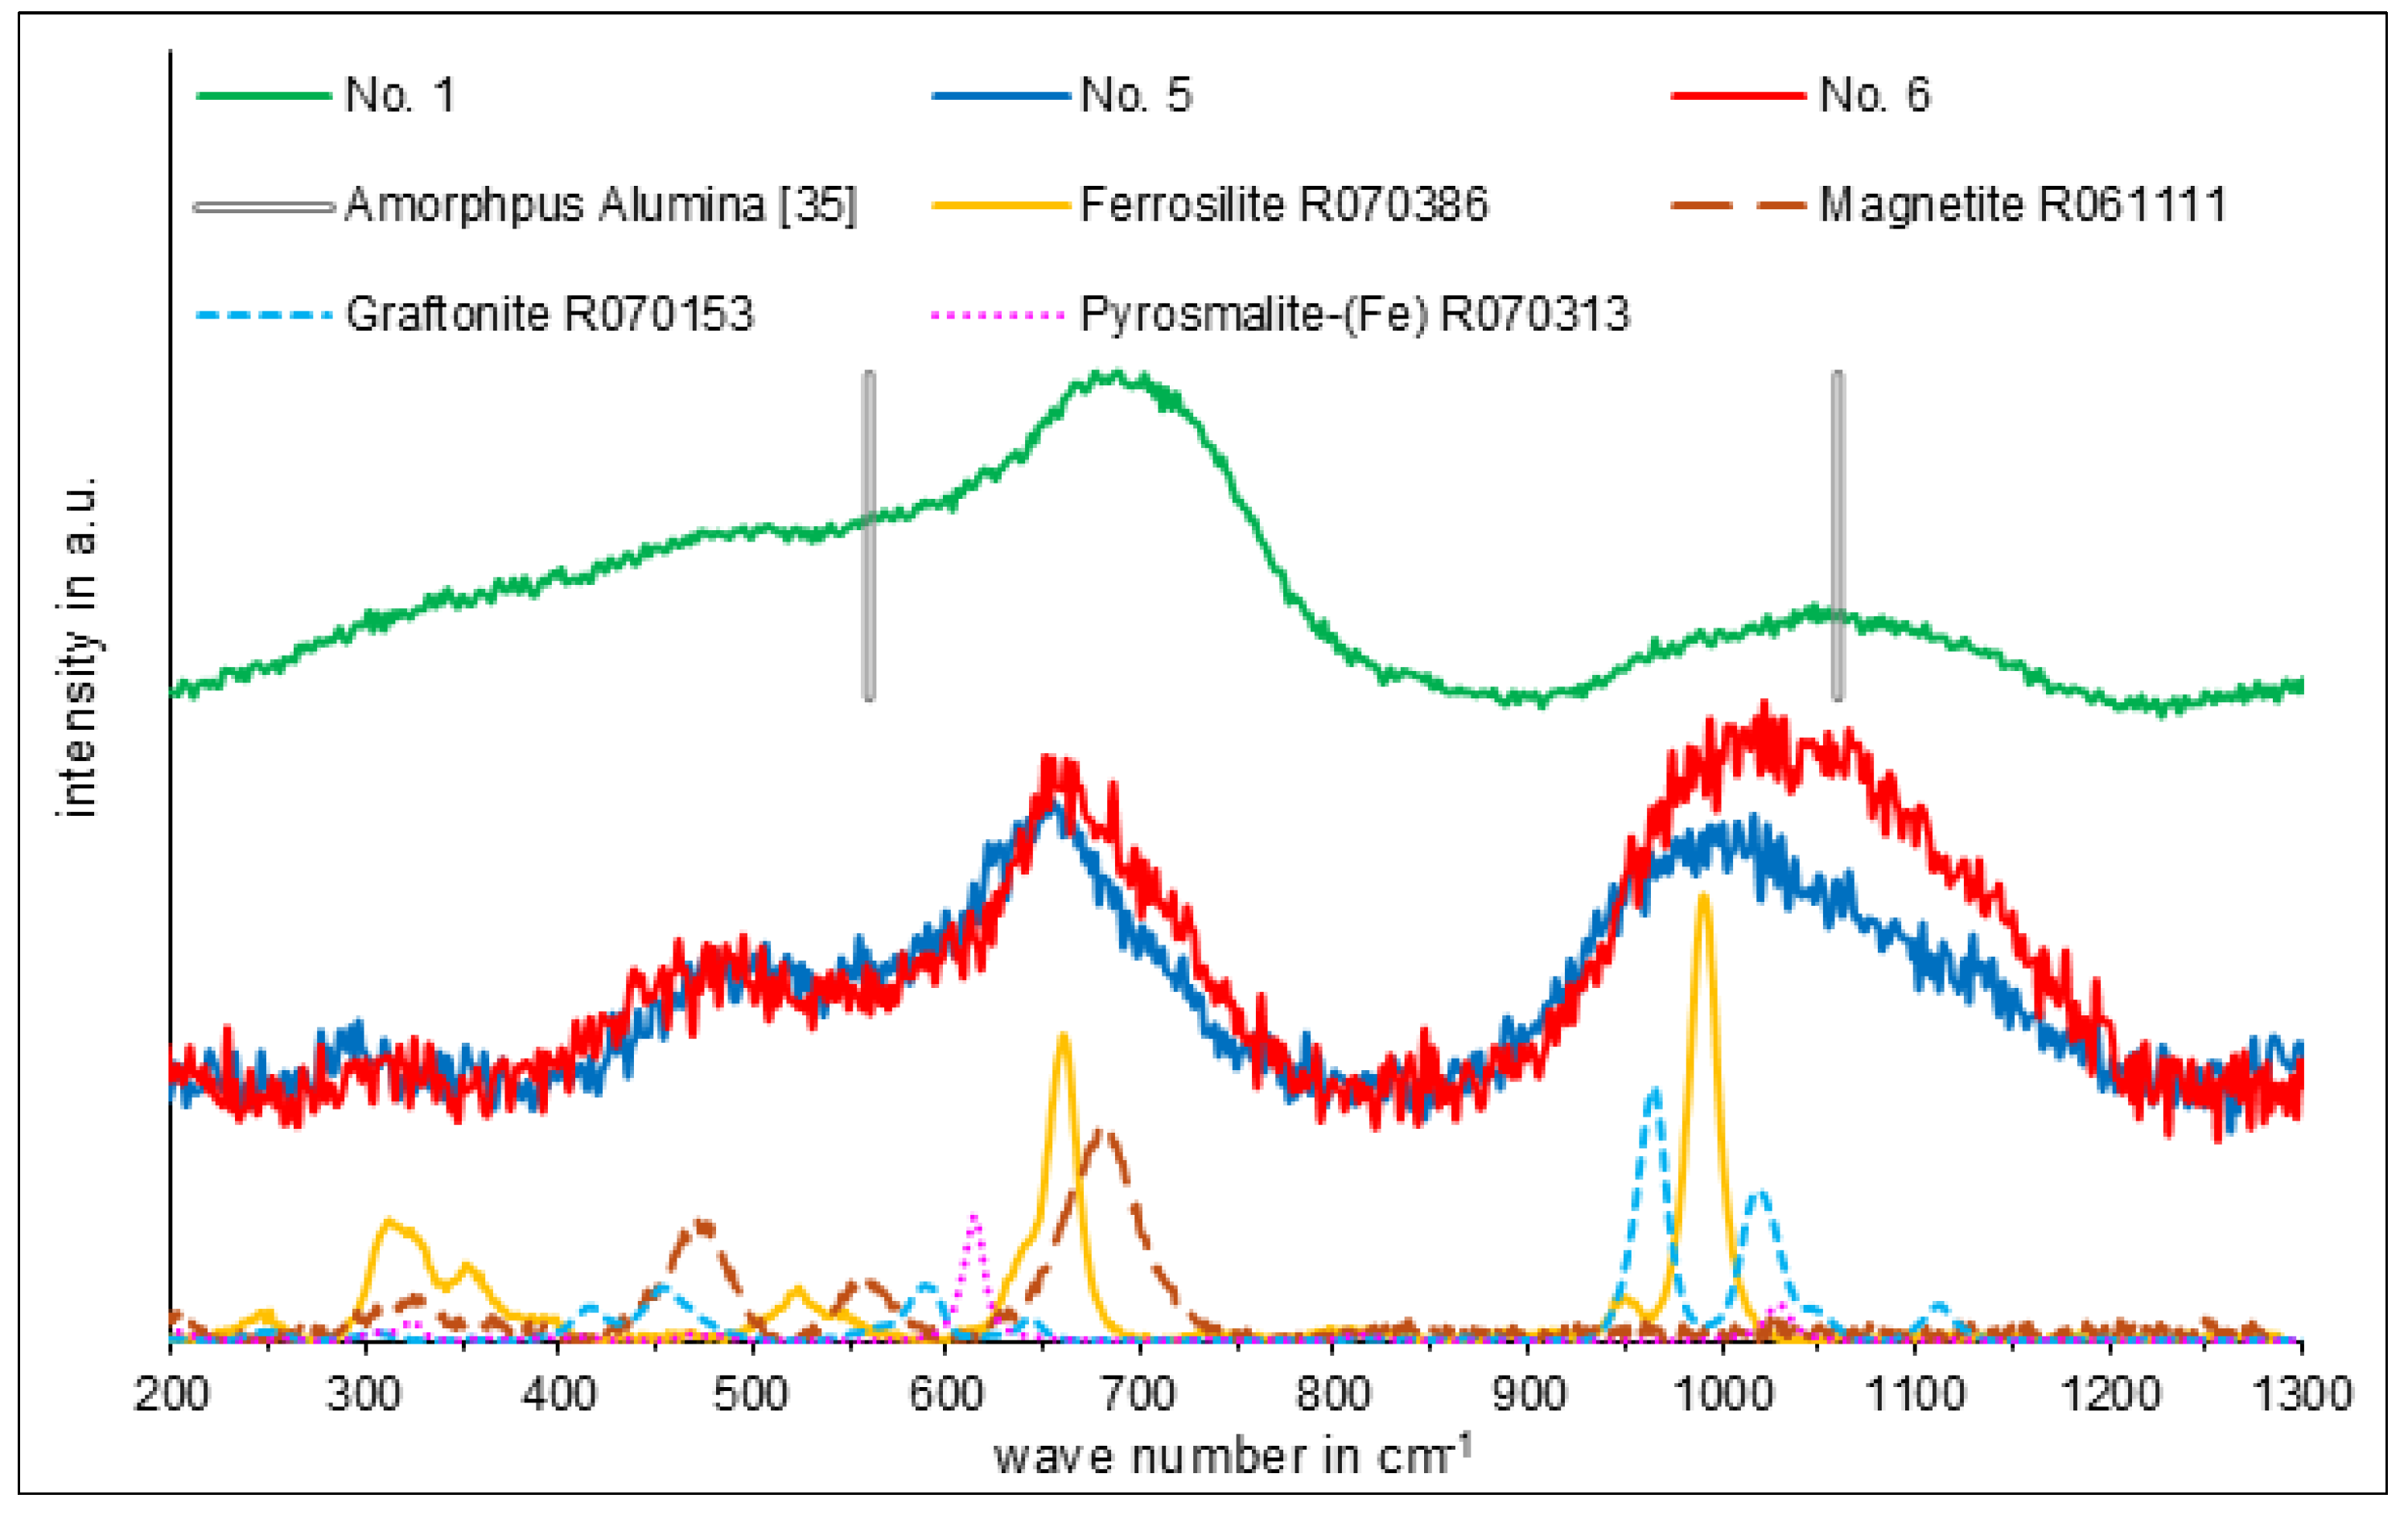
The PEO in aluminate solution at 150 V (No. 1) voltage amplitude results in a macroscopically homogeneous light-gray colored layer (Figure 4a, mark 1). Further, layer flaking can be seen in Figure 4a, which occurred during sample handling and rinsing. At the flaking areas, the substrate remains covered by a thin layer, which indicates a cohesive failure within the layer (Figure 4a, mark 2). After the additional PEO step at 175 V voltage amplitude (No. 2), the coating surface shows two clearly distinguishable features: uniformly matt gray porous areas and areas with high porosity (Figure 4b). In the porous areas, flaking occurs (during sample handling), exposing shiny metallic surfaces (Figure 4b, mark 3). The further increase in voltage amplitude to 200 V (No. 3) leads to an increase in the roughness of the macroscopically relatively uniform layer (Figure 4c). Larger flaking occurs locally, whereby the substrate is still partially covered by inner layer areas and a thin, slightly transparent layer (Figure 4c, mark 4).
At the edges of the layers produced in two electrolytes (No. 5, 6 and 7), areas of remnants of the layers shown in Figure 4b and c can still be seen (Figure 5, mark 1). In particular, the fracture edges of the gray layer areas visible in Figure 5b show that layers produced in the aluminate electrolyte have flaked off in the course of the PEO in the silicate electrolyte. New PEO layers with a different color and microstructure have formed at the exposed surfaces. These are similar for conditions No. 5 (Figure 5a) and No. 6 (Figure 5b) with regard to the macroscopically relatively homogeneous layer in the center of the sample (Figure 5a,b, marks 2 and 3) and somewhat more heterogeneous areas close to the edges. The surface of condition No. 7 shown in Figure 5c also exhibits a relatively homogeneous PEO layer in the lower part of the image (Figure 5c, mark 4), but a more heterogeneous PEO layer over large areas in the upper half of the image, which consists of slightly elevated gray areas and deeper yellowish areas (Figure 5c, mark 5). The reference layer (No. 4), produced entirely in the silicate electrolyte, has a highly heterogeneous layer surface with elevated areas of different shades of gray (Figure 5d, mark 6) and deeper areas with a yellow to brownish color (Figure 5d, mark 7).
The microstructural analysis of the PEO layers was carried out using SEM images and EDX analyses on metallographically prepared cross-sections of the layers. Pore infiltration and bonding to the coating surface by the embedding resin took place during hot embedding. As a result of thermal contraction during the cooling of the embedded cross-sections, cracks always formed within the oxide layer near the substrate, parallel to the substrate surface. The PEO at 150 V voltage amplitude (No. 1) results in a layer with a non-uniform thickness between about 5 µm and 20 µm (left in Figure 6a). After the additional PEO step at 175 V voltage amplitude (No. 2), there are layer areas with a relatively uniform thickness of around 60 µm and layer areas with a thickness of around 80 µm, in which the outer part of the layer is almost completely separated by inner cavities from the layer adjacent to the substrate (left half of the image in Figure 6b). In condition No. 3, layer thickness variations between approx. 40 µm and 110 µm as well as compact layer areas next to areas of high porosity are present. According to the EDX measurements (Table 2), the layers produced in aluminate electrolyte consist predominantly of the elements Al and O, with the ratio of Al to O between about 0.54 (Table 1, point 1: increased Fe and P contents of 6.0% and 5.5%) and about 1.0 (Table 1, points 2 and 5: low P content and Fe contents of 4.1% and 1.7%). The BSD image of the layer of condition No. 3 (Figure 6c) shows isolated brighter areas (measuring point 4) with an increased Fe content (12%). Otherwise, all the layers shown in Figure 2 exhibit a low elemental contrast, which can be attributed to fluctuations in the chemical composition as well as to nanoporosity or porosity below the cross-section plane.
Conditions No. 5 and No. 6 exhibit similar microstructural features. The layer thickness ranges from approximately 30 µm to 80 µm, with regions of uniform layer thickness (approx. 60 µm) and relatively low porosity (Figure 7a) alongside regions of lower or increased layer thickness and increased porosity within the layer. Condition No. 7 and the reference condition No. 4 also locally exhibit relatively uniform and compact layer regions, comparable to conditions No. 5 and No. 6 (Figure 7a). However, conditions No. 7 and No. 4 are generally characterized by more irregular layers with larger layer thickness fluctuations between 30 µm and 150 µm and locally higher surface roughness (Figure 7b,c). In terms of chemical composition, all conditions shown in Figure 7 are similar. In contrast to the conditions produced in aluminate electrolyte, low Al contents of a maximum of 0.5% are observed. In the inner layer (close to the substrate), phases with increased Fe and/or P content are present (points 2 and 7 in Figure 7 and Table 3), which appear brighter in the BSE contrast. The highest Fe content of 34.1% is found near the substrate (point 3 in Figure 7 and Table 3). In the vicinity of discharge channels of energy-intensive microarcs, e.g., areas with increased layer thickness and porosity in Figure 7b,c, similar elemental compositions are also locally detectable near the outer layer surface (point 5 in Figure 7). The highest P content (26.0%) and a lower Fe content (12.6%) were measured there. In addition to the Fe- and P-rich areas, other regions are present that appear darker in the BSE contrast and consist predominantly of the elements Si and O (points 1, 4 and 6 in Figure 7 and Table 3). The Si-O ratio varies between 0.78 (point 6, low Fe and P contents of 0.5% and 0.8%) and 0.55 (point 4, higher Fe and P contents of 1.4% and 4.9%).

3.3. Phase Analysis

The phase analysis is intended to clarify how the phase composition changes, first by increasing the voltage amplitude in the aluminate electrolyte and subsequently by PEO in the silicate electrolyte. For this purpose, conditions No. 1, 3 and 5, 6 were examined. The diffraction diagram of condition No. 1 provided neither evidence of crystalline nor X-ray amorphous phases, probably due to the low layer thickness and the low average atomic mass of the atoms in the oxide. The diffractogram of condition No. 6 shows a broad peak in the low 2α angle range with a maximum at 26°. This indicates the existence of X-ray amorphous phases. In contrast, the PEO layer of condition No. 3 consists predominantly of crystalline phases, because the diffractogram shows clearly defined peaks for crystalline phases instead of an amorphous peak. As can be seen from the background-corrected spectrum of condition No. 3 in Figure 8, the layer consists predominantly of α-Al2O3 (corundum) as well as smaller amounts of the non-stoichiometric aluminum oxide σ-Al2.667O4 and the spinel FeAl2O4 (hercynite). Peaks of the Fe substrate (ferrite) are also measurable.
Due to the shallow depth of information in Raman microscopy (<1 µm), it was possible to record Raman spectra at the PEO layer surface. The spectrum of condition No. 1 (Figure 9) shows a broad peak with a maximum at approximately 690 cm−1, a shoulder between approximately 540 cm−1 and 470 cm−1, and a gradual decrease in intensity towards lower wave numbers. This pattern is in good agreement with the intensity ratios of the characteristic peaks of magnetite, with the highest intensity at 680 cm−1 and lower intensities at approximately 480 cm−1 and 330 cm−1. Sudare et al. [35] report Raman peaks for amorphous alumina in the measured range at approximately 1060 cm−1 and 560 cm−1 (indicated as lines in Figure 9). This is in good agreement with the broad peak with a maximum at about 1050 cm−1 and the shoulder at about 560 cm−1 in the Raman spectrum of condition No. 1. The Raman spectra of conditions No. 5 and 6 differ only slightly in terms of peak positions and intensity ratios. The spectra show broad peaks with maxima at approximately 480 cm−1, 660 cm−1, and 1020 cm−1. The first two peaks again indicate the presence of magnetite. The peaks at 660 cm−1 and 1020 cm−1 are consistent with the ferrosilite phase. A small amount of other Fe- and Si-containing oxides or hydroxides, such as pyrosmalite (Fe) (characteristic peak at approximately 615 cm−1), may also be present. In the range between approximately 950 cm−1 and 1050 cm−1, characteristic peaks of various phosphates, such as graftonite, are present. No Raman spectra of Si-O or Si-OH containing phases could be found in the literature that are compatible with the spectra of conditions No. 5 and 6.

4. Discussion

4.1. Layer Evolution in the Aluminate Electrolyte

For a given voltage amplitude, the trends of the current density amplitude indirectly reflect the change in the system’s impedance. In the systems presented here, the ohmic component of the impedance is primarily determined by the formation of electrically insulating layers. Therefore, the electrical data, both the transients on the time scale of individual pulses and the change in the current density maxima over the process duration, together with images of the microarc discharges, can provide information about the layer formation or destruction during PEO.
At the beginning of the process, an active phase with a high current density amplitude of approximately 50 A/dm2 to 60 A/dm2 is present for approximately 100 s to 200 s. Before the first microarc discharges occur, the current flow during the current density peak at the beginning of the pulse (Figure 1, middle row, t2) must be due to electrochemical reactions, in particular anodic metal dissolution and/or oxygen evolution. As a result of oxygen evolution, a pH reduction and precipitation reactions according to Equations (1) to (3) are to be expected, which lead to the formation of aluminum oxide- or hydroxide-rich precipitates, as previously described in the literature [17,19]. The current density minimum during the on-time of the pulse may be because of the temporary interruption of the current flow by precipitation products on the anode surface. The subsequent increase in current density might indicate that the precipitation layer is detached due to strong oxygen evolution. After that, pH reduction and precipitation reactions might occur again, see current density decrease at the end of the pulse (Figure 1, middle row, t2). This interaction of oxygen evolution and layer deposition repeats periodically, with the previously formed precipitation layer being disrupted again during the first 3 µs of the subsequent current density pulse. An alternative explanation of the current density fluctuations is the periodic surface covering with a gas film due to strong oxygen evolution, followed by the detachment of the gas bubbles and the exposition of the surface, which leads to strong oxygen evolution again. In each case, a firmly adhering, electrically insulating layer that leads to a permanent reduction in the current density amplitude is not formed before the onset of the microarc discharges. The increasing coverage of the surface with a PEO layer leads to a decrease in the current density fluctuations and a decrease in the current density level at the end of the pulse.
With the initial PEO layer completely covering the surface, a constant level of the current density amplitude is reached after approximately 300 s of process time (Figure 1, top). The continuously decreasing current density level (see Figure 1, middle row, t3 and t4) and the decreased number and increased intensity of the microarc discharges (see Figure 1, bottom row, t3 and t4) indicate a thickness increase in the PEO layer between the microarc initiation and 600 s. After the first voltage step (condition No. 1), localized microarc discharges resulted in local layer thicknesses of up to 20 µm (Figure 6a). According to Table 2, the PEO layer consists predominantly of the elements Al and O. This suggests that the extension of the microarc discharges was predominantly limited to the thickness of the precipitation layer. The incorporation of Fe may be due to some substrate influence as well as to the transformation and incorporation of electrochemically formed iron oxides during PEO. According to the results of the XRD phase analysis, no crystalline phases are detectable for condition No. 1. The assignment of the phases amorphous Al2O3 and magnetite is plausible considering the EDX analysis. The broad bands in the Raman spectrum (Figure 9) complicate phase evaluation and can also be explained by X-ray amorphous phases, as these exhibit a wider variation in vibrational frequencies and energies due to different bond angles and lengths [36]. With respect to the thin and uneven layer thickness, there are similarities between the layer microstructure of condition No. 1 and the initial layer formation in PEO of Al alloys [37]. However, the layer delamination during sample handling (Figure 4a) and the crack near the substrate (Figure 6b) indicate a low layer cohesion within the layer.
The stepped increases in the process voltage to 175 V and 200 V lead to microarc discharges of higher intensity and consequently to increased current density levels. The temporarily strong localization of microarc discharges leads to locally high porosity (Figure 4b). A characteristic of these porous regions is voids in the region of the medium layer thickness, as can be seen in Figure 6b. The cracks running parallel to the substrate-layer interface, close to the substrate (Figure 6b,c), indicate a weak layer cohesion within the layer. Consequently, layer spalling occurs during PEO, presumably due to thermal stresses and gas evolution, leading to the exposure of the substrate, except for thin adhering layer residues. On the exposed substrate, the insulating layer formation and initial PEO layer formation must first take place again. This leads to the strong fluctuations in the current density maxima over the process duration, as seen in Figure 1 (top) for 175 V and 200 V. Oxide layer thickness (Figure 6) and surface porosity (Figure 4) increase with increasing voltage amplitude and advancing process duration. With condition No. 3, a macroscopically relatively homogeneous surface porosity is achieved, with the exception of layer spallation (Figure 4c). Furthermore, during PEO at 175 V and 200 V voltage amplitudes, the amorphous phases formed at 150 V voltage amplitude are transformed into crystalline phases. According to the results of the XRD phase analysis, PEO coatings in condition No. 3 consist largely of α-Al2O3 (corundum). The phase transformation from amorphous Al oxide to α-Al2O3 with increasing process time has also been described for the PEO of Al alloys [38,39]. The phase composition measured in this study, consisting of the Al oxides α and σ, as well as FeAl2O4, is not known from the literature. The α-Al2O3 and FeAl2O4 phases have also been detected in PEO coatings on steel by Cheng et al., along with other Al and Fe oxides [7]. The phases σ-Al oxide and FeAl2O4 are also described as reaction products of the thermite reaction, with the non-stoichiometric σ-Al oxide being formed by rapid quenching and FeAl2O4 (hercynite) being an intermediate product [40]. Since no atomic Al is present as a reducing agent for iron oxides in the present PEO process, a thermite reaction, as defined, cannot occur. However, rapid quenching of Al-containing oxides from the melt also occurs in the PEO process, which might lead to the formation of the non-stoichiometric σ-phase. The EDX analyses in Figure 6c (points 4 and 5 in Table 2) show that phases with high Fe content (point 4) exist alongside phases with low Fe content and illustrate the heterogeneous phase distribution in the PEO layer.

4.2. Layer Evolution in the Silicate Electrolyte

Since no aluminate ions are present in the silicate electrolyte, a different layer formation mechanism can be assumed at the beginning of the reference process (condition No. 4). Possible layer-formation mechanisms for the alkaline silicate electrolyte include electrochemical passivation through the formation of iron oxides and hydroxides and silicate precipitation, as described in the introduction. In contrast to the anodic polarization of Al and Mg alloys below the ignition voltage in electrolytes that form an adherent, insulating layer, the current density amplitude does not decrease immediately after the start of the process [22], but only after approximately 200 s of process time (Figure 3, top). To the authors’ knowledge, the formation and behavior of iron oxide/hydroxide passivation layers are not described in the scientific literature at comparably high anodic process voltages of approximately 150 V. According to current research, the passive layers formed in alkaline solutions are already disrupted after exceeding the pH-dependent anode potential of oxygen evolution [14,15,17]. However, in contrast to the current density fluctuations occurring during the initial phase of PEO in the aluminate electrolyte, the almost rectangular current density pulses do not indicate the large-scale penetration and re-formation of passive layers or precipitation layers. Since, to the best of the authors’ knowledge, mechanistic descriptions are currently lacking in the literature, the precipitation layer formation at the beginning of PEO of unalloyed and low-alloyed steels in alkaline silicate solutions should be clarified in future research. Based on the occurrence of the first microarc discharges after approximately 300 s and the decrease in current density after approximately 200 s, it can be concluded that an electrically insulating layer has already formed before the onset of the microarc discharges. The growth of the electrically insulating layer continues during the microarc discharge phase between approximately 300 s and 600 s, but is not significantly accelerated by the PEO layer formation.
Since the stepwise increase in the voltage amplitude to 175 V, 200 V and 300 V each resulted in only a short-time intensification followed by the almost termination of the microarc discharges, it can be assumed that the current flow is largely due to electrochemical reactions, in particular oxygen evolution and metal dissolution. The stepwise increase in the current density amplitude after increasing the voltage amplitude to 300 V, therefore, indicates a further intensification of the electrochemical side reactions. During this phase, porous iron oxides and hydroxides were likely formed, which are still recognizable on the surface due to their rust-like color even after the subsequent PEO at a voltage amplitude of 400 V (Figure 5d). This further suggests that porous iron oxides and hydroxides are not completely converted into a homogeneous, more compact layer despite the significant intensification of the microarc discharges at a voltage amplitude of 400 V. The pronounced localization of the microarc discharges at a voltage amplitude of 400 V (Figure 3, bottom row, t4) likely occurs in regions with low layer thickness and/or high porosity that were formed in the previous steps up to a voltage amplitude of 300 V. The layer microstructure near the discharge channel of an energy-intensive microarc discharge is shown in Figure 7c. Layer regions with locally increased thickness and porosity are formed. Layer spallation of several square millimeters in area occurs during the PEO process, exposing substrate areas completely or except for thin adhering layer residues. This is the reason for the sharp current density increase at around 2300 s in Figure 3. The finely distributed microarc discharges with a whitish color (Figure 3, bottom row, t5) indicate that a new PEO layer is forming at these locations. In addition to microarc localization, this contributes to the formation of PEO layers that are macroscopically heterogeneous in terms of layer thickness, porosity and phase composition (see Figure 5d).

4.3. Layer Evolution in the Silicate Electrolyte After PEO in the Aluminate Electrolyte

Finally, conditions No. 5, 6 and 7 illustrate the layer development during PEO in the two different electrolytes. They all end with the same PEO step at a voltage amplitude of 400 V. The macroscopic and microstructural differences between the conditions described below, therefore, arise as a result of the different preceding process steps.
For all three conditions, the layers formed by PEO in the aluminate electrolyte (corresponding to conditions No. 2 or 3) are detached over large areas immediately after the beginning of the PEO in the silicate electrolyte. Cracks in the PEO layer initially develop likely as a result of abruptly increased oxygen evolution in the area of the layer defects (see Figure 4b,c), leading to the exposure of linear substrate areas. Fine, whitish microarc discharges, characteristic of the initial PEO layer formation, occur there for the first few seconds (Figure 2, bottom row, t1). With the large-scale layer detachment, which is likely favored by the weak cohesion within the layer, the microarcing ends. Layer delamination is associated with a sudden increase in the maximum pulse current density up to 67 A/dm2, which also roughly corresponds to the maximum pulse current densities measured at the beginning of the PEO in the aluminate electrolyte. Furthermore, similar current density fluctuations were detected during individual pulses in both microarc-free phases (see Figure 1 and Figure 2, middle row, t2). Aluminate precipitation cannot be the reason for the current density fluctuations during the PEO in the silicate electrolyte. In this case, the current density fluctuations most likely occur due to strong gas evolution. Clarifying the mechanisms taking place between layer delamination and the restart of microarc discharges requires further research.
Layer delamination and reformation occur for conditions No. 5 and 6 without pronounced formation of porous iron oxides or hydroxides. Therefore, the newly formed PEO layers appear macroscopically more homogeneous compared to condition No. 4. The differences between the process steps of conditions No. 5 and 6 do not have a significant impact on macroscopic homogeneity, since the PEO layers formed in aluminate electrolyte were initially largely delaminated in both cases. However, larger layer residues are still present at the edges of the process area of condition No. 6. In that case, the PEO took place on a slightly reduced active surface area. Condition No. 7 occupies a special position between conditions No. 5 and 6 and condition No. 4. since after detachment of the PEO layer formed in the aluminate electrolyte, an increased formation of iron oxides and hydroxides occurred during the process step at a voltage amplitude of 300 V. This results in increased macroscopic heterogeneity compared to conditions No. 5 and 6, but higher homogeneity compared to condition No. 4 (see Figure 5a–c). This is also evident in the layer cross-section by the existence of layer regions of increased thickness and porosity (right in Figure 7b) and layer regions with uniform layer thickness (left in Figure 7b). The highest uniformity of layer thickness was observed in the layer cross-section of conditions No. 5 and 6 (exemplarily shown in Figure 7a). Still, regions of different porosity and chemical composition exist next to each other, albeit on a finer scale. Conditions No. 4 to 7 shown in Figure 7 validate the trend described in the literature that Fe-rich phases are present near the substrate and Si-rich phases are present close to the outer surface of the layer [31,33]. However, as a result of energy-intensive microarc discharges, Fe-rich phases are locally moved to the layer surface, and Si-rich phases are shifted towards the substrate. In agreement with the layer-delamination mechanism described in the literature [31], cracks parallel to the substrate may have originated at the transition between the Fe-rich and Si-rich phases, but in some cases, they also run transversely through the Fe-rich layer. In contrast to the description in the literature [31], however, the transverse cracks are less pronounced than after PEO in an aluminate electrolyte. However, this is not a fundamental contradiction, since the layer microstructure characteristics, including phase formation in the aluminate electrolyte, strongly depend on the process conditions and the resulting incorporation of precipitation products and substrate components.
The phase analysis revealed no known Si oxide phase, despite locally high Si concentrations of up to 43% and low contents of Al, Fe and P (point 6 in Table 3). Nevertheless, the existence of amorphous Si oxides is likely and cannot be excluded, as these are not detectable by XRD, and the detection by Raman spectroscopy is difficult due to broader bands that may be shifted to other wave numbers [36]. The existence of Fe oxides, such as magnetite, and Fe phosphates, such as graftonite, is plausible considering the EDX measurements. Furthermore, the existence of Fe-Si mixed oxides, particularly ferrosilite, is likely due to the high fit with the Raman spectra of conditions No. 5 and 6.

5. Conclusions

The most important conclusion from this work is that for the investigated conditions, the phase composition of the PEO layers is essentially determined by the final process step at a voltage amplitude of 400 V. Layers previously formed by PEO in the aluminate electrolyte are not converted or incorporated in the final layer, but are removed immediately after the start of the PEO in the silicate electrolyte. However, the uniformity of the PEO layers, both on the macroscopic scale and microscale (phase distribution, porosity, layer thickness), is determined by the preceding process steps. If a macroscopically heterogeneous oxide layer exists before the final process step at a voltage amplitude of 400 V, this will also result in a macroscopically heterogeneous layer at the end of the process. The main benefit of the combined PEO in the aluminate and subsequently in the silicate electrolyte is the new formation of a more homogeneous PEO layer at a voltage amplitude of 400 V. Condition No. 5 proved to be advantageous with respect to layer homogeneity and more economical due to the waiver of process steps at 200 V and 300 V voltage amplitude compared to the conditions No. 6 and 7. Based on the SEM investigations, the layers resulting from the combined processes show an improved layer adhesion compared to the PEO layers formed in the aluminate electrolyte, but they are still prone to internal cracking. Future research should tackle that structural weakness and investigate application-related layer properties, e.g., adhesion strength and corrosion protection. Subsequent fundamental research should address the layer formation mechanisms before microarc discharge initiation and the further reduction in process steps before the final process step at a 400 V voltage amplitude.

Author Contributions

Conceptualization, R.M., T.M. and T.L.; methodology, R.M.; investigation, R.M.; resources, T.L.; data curation, R.M.; writing—original draft preparation, R.M.; writing—review and editing, T.M. and T.L.; visualization, R.M.; supervision, T.M. and T.L.; project administration, T.L.; funding acquisition, T.L. All authors have read and agreed to the published version of the manuscript.

Funding

This research was funded by Deutsche Forschungsgemeinschaft (DFG, German Research Foundation), grant number 464291298.

Institutional Review Board Statement

Not applicable.

Informed Consent Statement

Not applicable.

Data Availability Statement

The authors confirm that the data supporting the findings of this study are available within the article.

Acknowledgments

The technical assistance of Jainish Jadvani (PEO experiments, sample preparation and optical microscopy), Saravanan Palaniyappan (Raman) and Marc Pügner (XRD) is gratefully acknowledged.

Conflicts of Interest

The authors declare no conflicts of interest. The funders had no role in the design of the study; in the collection, analyses or interpretation of data; in the writing of the manuscript or in the decision to publish the results.

References

  1. Sieber, M.; Simchen, F.; Morgenstern, R.; Scharf, I.; Lampke, T. Plasma Electrolytic Oxidation of High-Strength Aluminium Alloys—Substrate Effect on Wear and Corrosion Performance. Metals 2018, 8, 356. [Google Scholar] [CrossRef]
  2. Yao, W.; Wu, L.; Wang, J.; Jiang, B.; Zhang, D.; Serdechnova, M.; Shulha, T.; Blawert, C.; Zheludkevich, M.L.; Pan, F. Micro-arc oxidation of magnesium alloys: A review. J. Mater. Sci. Technol. 2022, 118, 158–180. [Google Scholar] [CrossRef]
  3. Li, G.; Ma, F.; Liu, P.; Qi, S.; Li, W.; Zhang, K.; Chen, X. Review of micro-arc oxidation of titanium alloys: Mechanism, properties and applications. J. Alloy. Compd. 2023, 948, 169773. [Google Scholar] [CrossRef]
  4. Babaei, K.; Fattah-Alhosseini, A.; Chaharmahali, R. A review on plasma electrolytic oxidation (PEO) of niobium: Mechanism, properties and applications. Surfaces Interfaces 2020, 21, 100719. [Google Scholar] [CrossRef]
  5. Attarzadeh, N.; Molaei, M.; Babaei, K.; Fattah-Alhosseini, A. New Promising Ceramic Coatings for Corrosion and Wear Protection of Steels: A Review. Surfaces Interfaces 2021, 23, 100997. [Google Scholar] [CrossRef]
  6. Simchen, F.; Sieber, M.; Lampke, T. Electrolyte influence on ignition of plasma electrolytic oxidation processes on light metals. Surf. Coat. Technol. 2017, 315, 205–213. [Google Scholar] [CrossRef]
  7. Cheng, B.; Lu, H.; Bai, K.; Wang, C.; Wang, W.; Guo, F. Formation of ceramic coatings on non-valve metal low carbon steel using micro-arc oxidation technology. Ceram. Int. 2024, 50, 23541–23549. [Google Scholar] [CrossRef]
  8. Li, Z.; Cheng, Y.; Kang, S.-H.; Tu, W.; Cheng, Y. A re-understanding of the breakdown theory from the study of the plasma electrolytic oxidation of a carbon steel — A non-valve metal. Electrochim. Acta 2018, 284, 681–695. [Google Scholar] [CrossRef]
  9. Huang, M.; Wang, Y.; Chu, C.-H.; Zhang, M.-X.; Wang, H.-B.; Xue, S.-X. Wear resistance of alumina-coated oil casing steel N80 via MAO with rare earth additive. Ceram. Int. 2017, 43, 6397–6402. [Google Scholar] [CrossRef]
  10. Yang, W.; Peng, Z.; Liu, B.; Liu, W.; Liang, J. Influence of Silicate Concentration in Electrolyte on the Growth and Performance of Plasma Electrolytic Oxidation Coatings Prepared on Low Carbon Steel. J. Mater. Eng. Perform. 2018, 27, 2345–2353. [Google Scholar] [CrossRef]
  11. Malinovschi, V.; Marin, A.; Mihalache, M.; Iosub, I. Preparation and characterization of coatings on carbon steel obtained by PEO in silicate/carbonate electrolyte. Surf. Coat. Technol. 2016, 296, 96–103. [Google Scholar] [CrossRef]
  12. Wang, Y.; Jiang, Z. In situ formation of low friction ceramic coatings on carbon steel by plasma electrolytic oxidation in two types of electrolytes. Appl. Surf. Sci. 2009, 255, 6240–6243. [Google Scholar] [CrossRef]
  13. Yang, W.; Li, Q.; Liu, W.; Liang, J.; Peng, Z.; Liu, B. Characterization and properties of plasma electrolytic oxidation coating on low carbon steel fabricated from aluminate electrolyte. Vacuum 2017, 144, 207–216. [Google Scholar] [CrossRef]
  14. Freire, L.; Nóvoa, X.; Montemor, M.; Carmezim, M. Study of passive films formed on mild steel in alkaline media by the application of anodic potentials. Mater. Chem. Phys. 2009, 114, 962–972. [Google Scholar] [CrossRef]
  15. Joiret, S.; Keddam, M.; Nóvoa, X.R.; Pérez, M.C.; Rangel, C.; Takenouti, H. Use of EIS, ring-disk electrode, EQCM and Raman spectroscopy to study the film of oxides formed on iron in 1M NaOH. Cem. Concr. Compos. 2002, 24, 7–15. [Google Scholar] [CrossRef]
  16. DorMohammadi, H.; Pang, Q.; Murkute, P.; Árnadóttir, L.; Isgor, O.B. Investigation of iron passivity in highly alkaline media using reactive-force field molecular dynamics. Corros. Sci. 2019, 157, 31–40. [Google Scholar] [CrossRef]
  17. Morgenstern, R.; Rojas, C.A.; Simchen, F.; Meinhold, V.; Mehner, T.; Lampke, T. Passivation and pH-Induced Precipitation during Anodic Polarization of Steel in Aluminate Electrolytes as a Precondition for Plasma Electrolytic Oxidation. Coatings 2023, 13, 656. [Google Scholar] [CrossRef]
  18. Eremin, N.I.; Mironov, Y.A.; Volokhov, V.E. Structure and Behaviour of Aluminate Ions in Solution. Russ. Chem. Rev. 1974, 43, 92–106. [Google Scholar] [CrossRef]
  19. Karpushenkov, S.A.; Shchukin, G.L.; Belanovich, A.L.; Savenko, V.P.; Kulak, A.I. Plasma electrolytic ceramic-like aluminum oxide coatings on iron. J. Appl. Electrochem. 2009, 40, 365–374. [Google Scholar] [CrossRef]
  20. Kurze, P. Herstellung, Charakterisierung und Anwendung von Al2O3-Schichten insbesondere auf Aluminium- und Eisenwerkstoffen. Ph.D. Thesis, Technische Hochschule Karl-Marx-Stadt, Karl-Marx-Stadt, Germany, March 1982. [Google Scholar]
  21. Dao Huu, N. Untersuchungen zur Anodischen Abscheidung von Schutzschichten aus Wäßrigen Aluminatlösungen auf Eisenwerkstoffen. Ph.D. Thesis, Technische Hochschule Karl-Marx-Stadt, Karl-Marx-Stadt, Germany, September 1979. [Google Scholar]
  22. Simchen, F.; Sieber, M.; Mehner, T.; Lampke, T. Characterisation Method of the Passivation Mechanisms during the pre-discharge Stage of Plasma Electrolytic Oxidation Indicating the Mode of Action of Fluorides in PEO of Magnesium. Coatings 2020, 10, 965. [Google Scholar] [CrossRef]
  23. Simchen, F.; Masoud-Nia, N.; Mehner, T.; Lampke, T. Formation of corundum-rich alumina coatings on low-carbon steel by plasma electrolytic oxidation. IOP Conf. Ser. Mater. Sci. Eng. 2021, 1147, 012007. [Google Scholar] [CrossRef]
  24. Wang, J.; Yao, Z.; Yang, M.; Wang, Y.; Xia, Q.; Jiang, Z. A Fe3O4/FeAl2O4 composite coating via plasma electrolytic oxidation on Q235 carbon steel for Fenton-like degradation of phenol. Environ. Sci. Pollut. Res. 2016, 23, 14927–14936. [Google Scholar] [CrossRef] [PubMed]
  25. Li, Y.; Chen, M.; Li, W.; Wang, Q.; Wang, Y.; You, C. Preparation, characteristics and corrosion properties of α-Al2O3 coatings on 10B21 carbon steel by micro-arc oxidation. Surf. Coat. Technol. 2019, 358, 637–645. [Google Scholar] [CrossRef]
  26. Malinovschi, V.; Marin, A.; Moga, S.; Negrea, D. Preparation and characterization of anticorrosive layers deposited by micro-arc oxidation on low carbon steel. Surf. Coat. Technol. 2014, 253, 194–198. [Google Scholar] [CrossRef]
  27. Amaral, S.; Müller, I. A RRDE study of the electrochemical behavior of iron in solutions containing silicate and sulphate at pH 10–13. Corros. Sci. 1999, 41, 759–771. [Google Scholar] [CrossRef]
  28. Lian, T.; Jones, D. Electrochemical Corrosion Behavior of Low Carbon Steel in Concentrated Geologic Vadose Waters. Corrosion 1999, 55, 1012–1019. [Google Scholar] [CrossRef]
  29. Schmitt, W.; Flügel, W.; Schwenk, W. Fast pitting corrosion in a steel/water system as a result of unusual stabilization of anodes. Mater. Corros. 1992, 43, 39–47. [Google Scholar] [CrossRef]
  30. Palmer, A.N.; Palmer, M.V. Geochemistry of capillary seepage in Mammoth Cave. Acta Carsologica 2003, 30, 14–32. [Google Scholar]
  31. Yang, W.; Li, Q.; Liu, C.; Liang, J.; Peng, Z.; Liu, B. A comparative study of characterisation of plasma electrolytic oxidation coatings on carbon steel prepared from aluminate and silicate electrolytes. Surf. Eng. 2017, 34, 54–62. [Google Scholar] [CrossRef]
  32. Yang, W.; Li, Q.; Xiao, Q.; Liang, J. Improvement of corrosion protective performance of organic coating on low carbon steel by PEO pretreatment. Prog. Org. Coat. 2015, 89, 260–266. [Google Scholar] [CrossRef]
  33. Ma, C.; Liu, J.; Zhu, X.; Xue, W.; Yan, Z.; Cheng, D.; Fu, J.; Ma, S. Anticorrosive non-crystalline coating prepared by plasma electrolytic oxidation for ship low carbon steel pipes. Sci. Rep. 2020, 10, 1–9. [Google Scholar] [CrossRef] [PubMed]
  34. Database of Raman Spectroscopy, X-Ray Diffraction and Chemistry Data for Minerals. Available online: https://rruff.info (accessed on 29 January 2023).
  35. Sudare, T.; Zenzai, A.; Tamura, S.; Kiyama, M.; Hayashi, F.; Teshima, K. Hierarchical spheres of Mg–Al LDH for the removal of phosphate ions: Effect of alumina polymorph as precursor. CrystEngComm 2019, 21, 7211–7216. [Google Scholar] [CrossRef]
  36. Tuschel, D. Why Are the Raman Spectra of Crystalline and Amorphous Solids Different? Spectroscopy 2017, 32, 26–33. [Google Scholar]
  37. Jaspard-Mécuson, F.; Czerwiec, T.; Henrion, G.; Belmonte, T.; Dujardin, L.; Viola, A.; Beauvir, J. Tailored aluminium oxide layers by bipolar current adjustment in the Plasma Electrolytic Oxidation (PEO) process. Surf. Coat. Technol. 2007, 201, 8677–8682. [Google Scholar] [CrossRef]
  38. Rogov, A.B.; Yerokhin, A.; Matthews, A. The role of cathodic current in plasma electrolytic oxidation of aluminium: Current density ‘scanning waves’ on complex-shape substrates. J. Phys. D Appl. Phys. 2018, 51, 405303. [Google Scholar] [CrossRef]
  39. Rogov, A.B.; Matthews, A.; Yerokhin, A. Role of cathodic current in plasma electrolytic oxidation of Al: A quantitative approach to in-situ evaluation of cathodically induced effects. Electrochimica Acta 2019, 317, 221–231. [Google Scholar] [CrossRef]
  40. Durães, L.; Costa, B.F.; Santos, R.; Correia, A.; Campos, J.; Portugal, A. Fe2O3/aluminum thermite reaction intermediate and final products characterization. Mater. Sci. Eng. A 2007, 465, 199–210. [Google Scholar] [CrossRef]
Figure 1. Overview of the process data of the PEO process steps in the aluminate electrolyte; time course of the maximum pulse current density (top), voltage and current density transients during individual pulses (middle row) and discharge images (bottom row) at selected times.
Coatings 15 00850 g001
Figure 2. Overview of the process data of the PEO step in the silicate electrolyte of conditions No. 5, 6 and 7; time courses of the maximum pulse current density (top), voltage and current density transients during individual pulses (middle row) and discharge images (bottom row) of No. 6 at selected times.
Coatings 15 00850 g002
Figure 3. Overview of the process data of the reference PEO process in the silicate electrolyte (condition No. 4); time course of the maximum pulse current density (top), voltage and current density transients during individual pulses (middle row) and discharge images (bottom row) at selected times.
Coatings 15 00850 g003
Figure 4. Optical microscopy images at sample surfaces of conditions: (a) No. 1; (b) No. 2; (c) No. 3.
Coatings 15 00850 g004
Figure 5. Optical microscopy images at sample surfaces of conditions: (a) No. 5; (b) No. 6; (c) No. 7; (d) No. 4.
Coatings 15 00850 g005
Figure 6. SEM images (BSE contrast) at the cross-sections of conditions (a) No. 1, (b) No. 2 and (c) No. 3, including the positions of the EDX point analyses.
Coatings 15 00850 g006
Figure 7. SEM images (BSE contrast) at the cross-sections of conditions (a) No. 5, (b) No. 7 and (c) No. 4, including the positions of the EDX point analyses.
Coatings 15 00850 g007
Figure 8. Diffraction diagram of condition No. 3 including indications of the assigned phases.
Coatings 15 00850 g008
Figure 9. Raman spectra of conditions No. 1, 5 and 6 and selected reference spectra. The lines overlapping the Raman spectrum of condition No. 1 mark the positions of characteristic bands of amorphous Al2O3 according to [35].
Coatings 15 00850 g009
Table 1. Survey of parameter combinations.
NumberElectrolyte StepsVoltage Amplitude Levels in V
150175200300400
1SingleA
2SingleAA
3SingleAAA
4SingleSSSSS
5Two-StepAA S
6Two-StepAAA S
7Two-StepAAASS
Table 2. Chemical composition according to EDX point analyses at the positions marked and numbered in Figure 6.
PointMolar Fraction in %
AlFePONa
130.56.05.556.61.3
247.54.10.447.60.4
339.73.72.852.31.5
434.112.00.552.70.8
547.71.70.449.80.5
Table 3. Chemical composition according to EDX point analyses at the positions marked and numbered in Figure 7.
PointMolar Fraction in %
AlFeSiPONaK
10.50.837.11.759.9--
20.313.06.218.361.40.50.2
3 *-34.10.72.661.7--
40.21.432.64.959.80.70.5
50.512.62.926.057.6-0.4
60.40.543.00.855.2--
7 **0.319.86.213.057.42.60.4
* contains 0.8% Mn, ** contains 0.4% Mn.
Disclaimer/Publisher’s Note: The statements, opinions and data contained in all publications are solely those of the individual author(s) and contributor(s) and not of MDPI and/or the editor(s). MDPI and/or the editor(s) disclaim responsibility for any injury to people or property resulting from any ideas, methods, instructions or products referred to in the content.

