Article

Modification of Polyurethane/Graphene Oxide with Dielectric Barrier Plasma Treatment for Proper Coating Adhesion on Fiberglass

by
Oscar Xosocotla
1,*,
Bernardo Campillo
2,
Horacio Martínez
3,*,
María del Pilar Rodríguez-Rojas
3,
Rafael Campos
1 and
Victoria Bustos-Terrones
4
1
The National Technological Institute of Mexico/CENIDET, Interior Palmira, S/N, Col. Palmira, 62490 Cuernavaca, Mexico
2
Faculty of Chemistry, National Autonomous University of Mexico, 04510 Mexico City, Mexico
3
Spectroscopy Laboratory, Institute of Physical Sciences, National Autonomous University of Mexico, 04510 Mexico City, Mexico
4
Environmental Engineering and Sustainability Research Laboratory, Polytechnic University of the State of Morelos, Boulevard Cuauhnáhuac 566, Col. Lomas del Texcal, 62574 Jiutepec, Mexico
*
Authors to whom correspondence should be addressed.
Coatings 2025, 15(4), 411; https://doi.org/10.3390/coatings15040411
Submission received: 14 February 2025 / Revised: 26 March 2025 / Accepted: 27 March 2025 / Published: 30 March 2025

Abstract

:
Wind turbine blades are made from fiberglass, whose faces are eroded due to environmental conditions. Polyurethane (PU) coatings are broadly used in several types of coatings due to their strong adhesion. However, their inferior mechanical properties limit their application on fiberglass. In this study, graphene oxide (GO) was modified through a dielectric barrier plasma (DBP) treatment at atmospheric pressure to improve the dispersion of GO in PU and increase its adhesion to fiberglass (GF) substrates, resulting in excellent adhesion properties of the PU/GO coating on fiberglass. Additionally, PU/GO coatings are crucial for preventing and protecting against erosion. The results obtained for the intensity ratio of the I D / I G peaks observed through Raman spectroscopy exhibited that the plasma treatment increased the defects in the GO structure through covalent and non-covalent interactions with the PU. Contact angle tests and surface free energy measurements indicated the deoxygenation of the GO structure, enhancing its dispersion in the PU matrix, as observed through XRD. The plasma treatment increased the PU/GO adhesion by 27.6% after 10 min of treatment, suggesting that more defects in the GO structure were correlated with greater adhesion strength.

1. Introduction

The wind energy industry has an important role in mitigating climate change because of its clean way of producing electricity. Wind energy showed a great growth in electrical capacity from 2011 to 2021 [1,2], with an increase from 216. 419 MW to 770. 336 MW. This growth was due to new policies and cost reductions. In addition, as technology develops and production is scaled up, the levelized cost of electricity (LCOE) of global onshore wind energy dropped by 56% since 2010 from 0.089 $/kWh to 0.039 $/kWh, and newly commissioned offshore wind projects saw reductions of about 48%. Wind towers face a serious problem due to climatic and environmental demands [3,4]. Wind turbines work in environments with extreme conditions, such as rain, hail, sand, saline, heat, cold, and UV, and all of these increase the erosion of the leading edge of the blade (LEB), which negatively changes the aerodynamic properties of the blade and decreases the annual energy production [5,6,7]. Law and Koutsos [8] researched the loss of energy due to the LEB in an operational wind farm. They found that the average AEP reduction due to average erosion on the wind farm was about 1.8%, and the worst case of erosion of the turbine AEP was 4.9%. LEB erosion is a very expensive issue that has not been solved, but there are some methods of reducing the LEB erosion process. Reducing the rotor speed during hydro-climatic events to extend the life span of the blades at the expense of energy production is one of the methods of reducing the LEB erosion process. Composite polymer materials are very interesting in the wind industry because of their excellent anti-erosive/wear properties and UV protection [7]. Fiberglass (FG) is used to manufacture wind turbine blades. The FG is produced from very fine fibers of glass whose compounds are aluminum silicate. This aluminum silicate consists of alumina (A12O3) from bauxite and silica (SiO2) from sand. These two compounds are melted at high temperatures (around 1723 K). FGs with various diameters and chemistries can be obtained. The FGs are combined with various polymers, such as polyethylene (PE), polystyrene (PS), and polypropylene (PP), where the composition of the glass dictates the properties of the end product. Key production methods include pultrusion, where fibers are pulled through resin and heated dies, and hand lay-up, which involves manually applying resin to layered fibers. Other techniques include compression molding and resin transfer molding, each offering unique advantages for creating strong, lightweight materials suitable for diverse applications [9,10,11,12,13,14]. Polyurethane (PU) is a broad class of polymers that can be engineered to meet a wide range of properties, making them one of the most versatile engineering materials. PU products account for around 5% of plastics worldwide and are present in almost all sectors of industry, including automotive, construction, adhesives and coatings, elastomers, appliances, and flexible and rigid foams. Despite the broad range of engineering properties that can be tailored with PU, the chemistry involved is simple. This chemistry is based on the reaction of an isocyanate with a polyol, leading to a urethane bond release and carbon dioxide polymerization. This reaction system can be adapted for a broad range of applications, since the isocyanates and polyols precursors can be chosen with a wide range of chemical structures, enhancing the variety of mechanical, thermal, chemical, and flammability properties that can be achieved [9,10,11,12,13,14]. The incorporation of particles such as graphene, graphene oxide, carbon nanotubes, metals, and ceramics in a PU matrix has emerged as an excellent choice for protecting the erosion of wind turbine blades due to their excellent mechanical properties. The hexagonal structure of graphene oxide (GO) embedded into a PU matrix enhances the thermomechanical properties, resistance to aggressive environments, and electrical properties [15,16,17,18]. Graphene oxide (GO), a derivative of graphene, has a layered structure with oxygen-containing functional groups attached to both sides of the layer and the edges of the plane. These functional groups include epoxide, hydroxyl, carbonyl, and carboxyl groups, which make graphene oxide hydrophilic while maintaining the sp2 bond of graphite. GO can be synthesized by oxidation of graphite into graphite oxide, followed by the exfoliation of graphite oxide into graphene oxide. The electronic and structural properties of GO depend on the number of layers, the number and type of oxygen groups, and the density of points on the surface. However, many exfoliation methods are needed to separate GO flakes. They depend on chemical treatment, ultrasound treatment, stripping, or interaction with organic molecules. Also, electrodeposition and laser methods are combined to make a flexible and transparent conductive film. GO is inexpensive and scalable to synthesize with a variety of excellent properties [15,16,17,18]. GO is characterized by a high degree of oxygen content due to the presence of various oxygen functional groups on its surface. These groups, including hydroxyl, carboxyl, and epoxy, enhance its hydrophilicity and stability in aqueous dispersions. Its unique structure allows for effective interactions with other materials, further expanding its utility in advanced technologies [19,20,21,22].
Plasma treatment is a physicochemical process that modifies the structure of graphene oxide (GO). This process improves the physical and chemical properties of GO by introducing oxygenated functional groups, which increases its hydrophobicity and functionalization capacity and modifies the structures of GO, facilitating the dispersion of particles when immersed in a polymeric matrix [23,24,25,26]. Furthermore, plasma treatment can increase the defect density on the surface of GO, promoting its reactivity, and is presented as an effective technique for optimizing the characteristics of GO in various applications. GO particles modified using plasma and other functional materials have been used as fillers in PU matrices to protect against the erosion of wind turbine blades, and their dispersion in PU matrices and their relationship with adhesion strength in GF substrates have been observed.

2. Materials and Methods

2.1. Fiberglass Substrates

Substrates were obtained from a fiberglass (GF) plate with dimensions of 3 × 3 × 1 cm3; one surface of the substrate was sanded with a silicon carbide sheet of 50 grit to obtain a rough surface of the same dimensions. The samples were introduced in an ultrasonic bath(CS Scientific, Warminster, PA, USA) for 30 min; then, they were put in an oven (Rorer, Mexico) at 30 °C for 35 min to remove moisture and residues. DBP treatment of GF substrates was used to increase the surface energy of the substrates.

2.2. Graphene Oxide

The GO particle diameter ranged from 7 to 12 μm. The surface area was 50–200 m2/g. They had a multilayer structure. Shenzhen Yuechuang Technology Co., Ltd,(Shenzhen, China) supplied the GO particles.

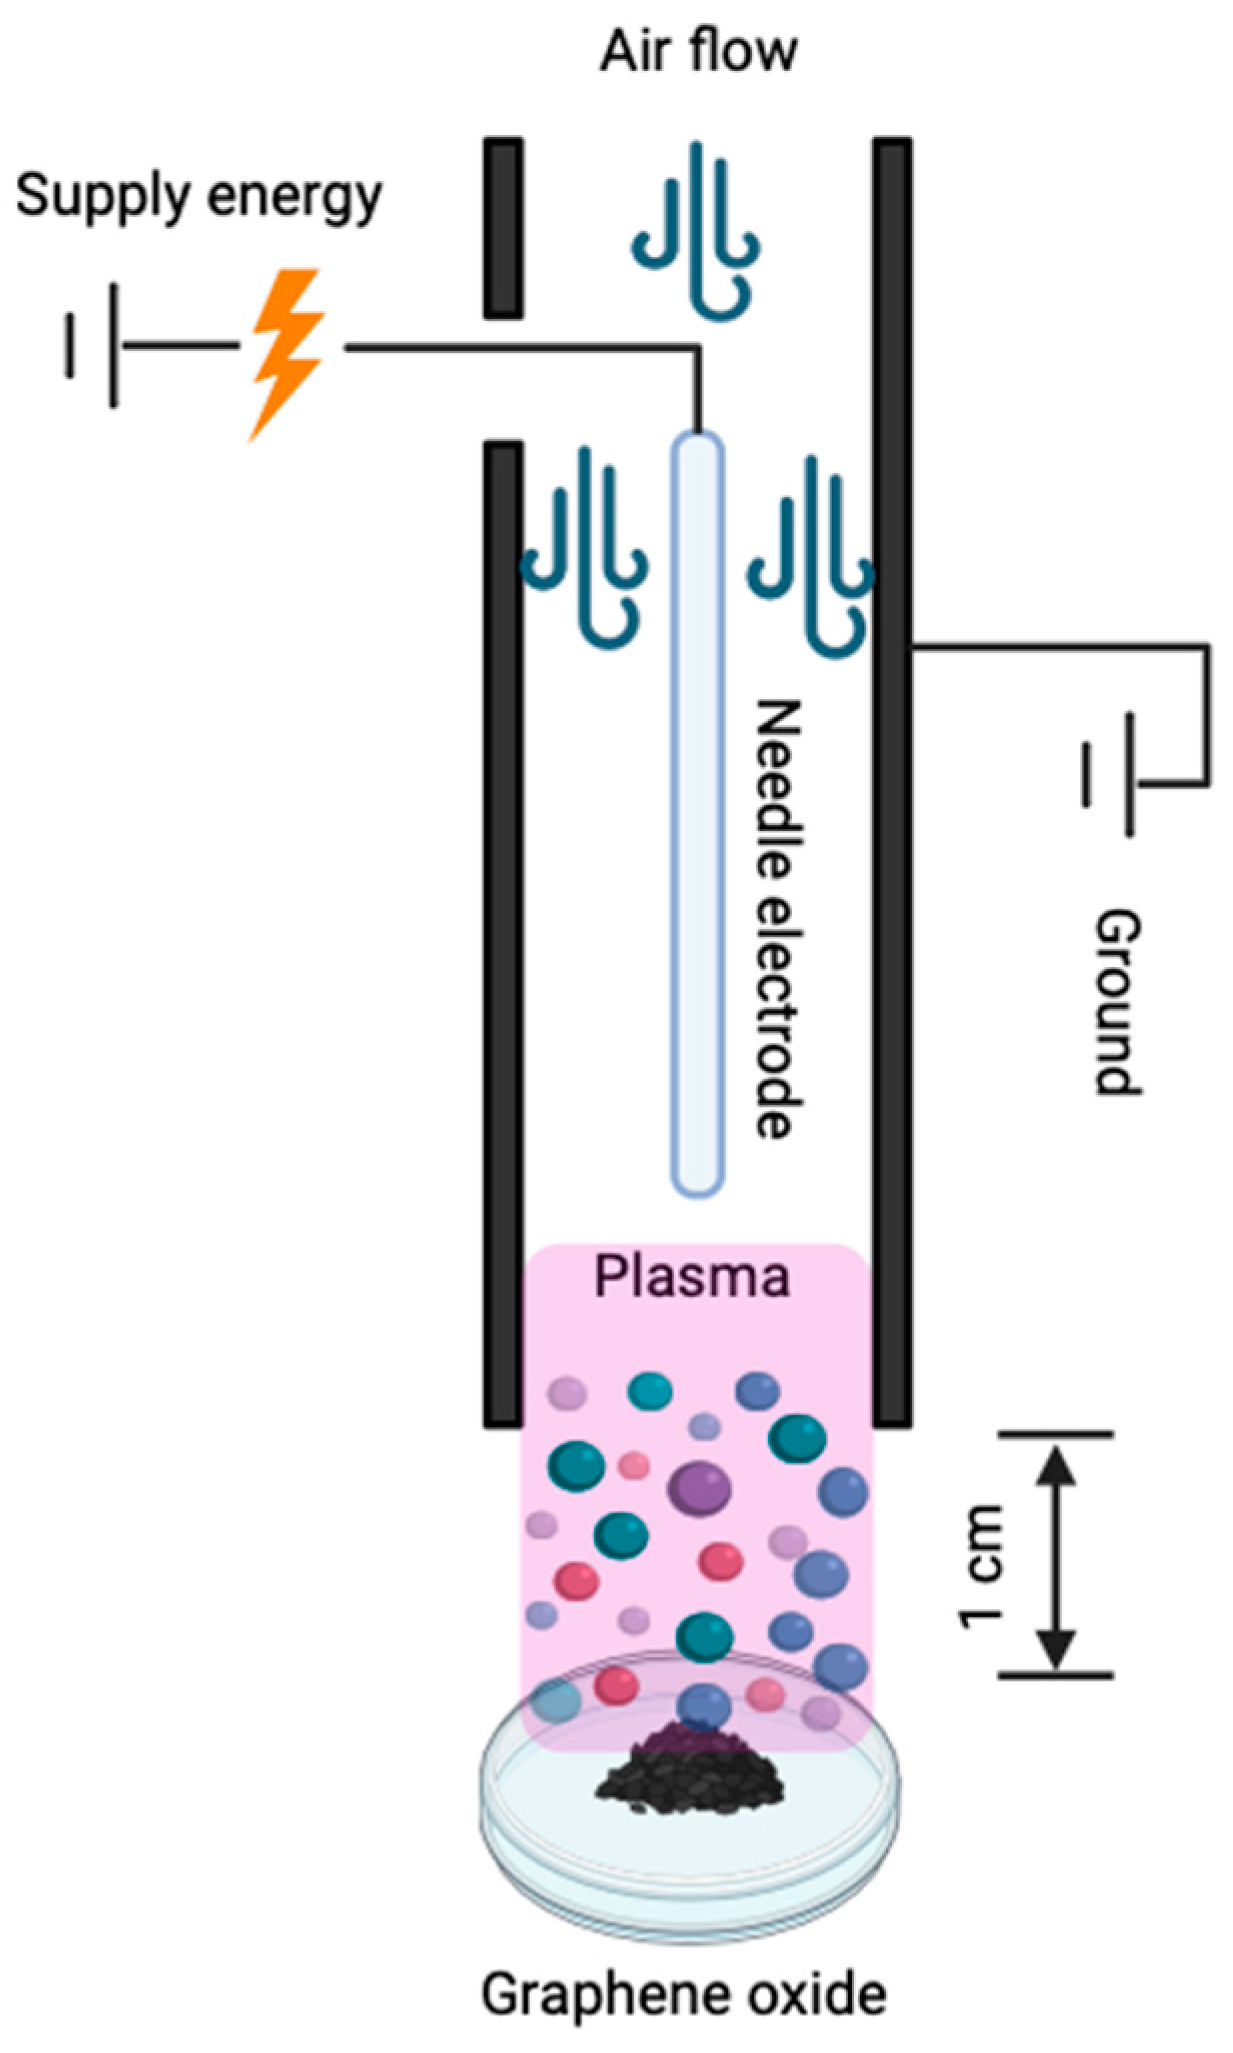
2.3. Dielectric Barrier Plasma Treatment

An APC 500 plasma torch source (Diener Electronics, Ebhausen, Germany) was used for surface modification. The plasma source was operated at 20 kV @ 25 mA, frequency of 40 kHz, and air pressure of 1500 torr. DBP was created by two electrodes. Due to the airflow, the discharge extended from the electrode region, and the active plasma contained an area of ~10 cm2. The samples were positioned at the center of the gliding plasma.
The GF substrates were exposed for 5, 10, 15, 29, 25, and 30 s at 4 cm from the nozzle. The plasma exposure times were determined based on previous studies found in the literature.
As DBP treatment is chemically aggressive, it can produce a high degree of disorder in graphene oxide’s structure and electronic characteristics, even with short exposure times; to avoid this, DBP treatment at atmospheric pressure was used to functionalize the GO surface. Therefore, GO particles were placed in a Pyrex glass Petri dish (model 3160-101; (Corning Inc., Corning, NY, USA) see Figure 1). The Petri dish was a dielectric barrier between plasma and the GO particles. Subsequently, GO samples were treated. The distance between the nozzle surface and the Petri dish was 1 cm, and the exposure times were 6, 10, and 15 min.

2.4. Application of the Coating

GO particles (Ps) were added to a water-based polyurethane (PU) resin (Comex paints) at a concentration of 0.2% (w/v) (PU-0. 2GO). The mixture was placed in an ultrasonic bath for 50 min in order to disperse the GO particles (Figure 2). The dispersion of GO in PU was carried out using an airbrush (Master Airbrush, San Diego, CA, USA) at 30 psi on the previous substrate for 60 s with a thickness of about 400 mm, as observed with an HW300PRO Paint Thickness Gauge (Hukwong Instruments, Shenzhen, China). This methodology was used for GO exposed to DBP for 6, 10, and 15 min.
Raman spectroscopy studies were carried out with a SENTERRA II spectrometer (Bruker Corporation, Billerica, MA, USA) (Bruker). The Raman spectrometer was equipped with a 785 nm laser, a 40× objective lens, and an operating power of 100 mW. The integration time was 1000 ms. The main vibrational modes of graphene oxide are well documented in the literature, and they were used to identify and analyze the spectra obtained in the present work.
The X-ray diffraction patterns of the different PU/GO coatings were investigated using an X-ray diffractometer (XRD, Rigaku Miniflex DMAX 2200, (Rigaku Corporation, Tokyo, Japan) ). The coating layer was subjected to Cu–Kα radiation (1.54 nm) with a graphite monochromator in the 2θ range of 5–60° with a grazing angle of 1°.
FTIR studies were carried out using a Bruker IFS 125hr FTIR spectroscopy (Bruker Corporation, Billerica, MA, USA) system to determine the dispersion of GO in PU.
The wettability was studied using contact angle tests. A USB digital microscope (model Px-537 (Pixter, Shenzhen, China) ) was used, and distilled water and diiodomethane were used as contact liquids. The surface energy was subsequently calculated using the Owens–Wendt method. The drop volume was 3 µL.
Adhesion tests (Pull Off) were performed to evaluate the adhesion of the PU/0.2 GO coating on the GF substrates. The ASTM D4541 standards [27] were used with a PosiTest AT-M (DeFelsko Corporation, Oswego, NY, USA) device.

3. Results and Discussion

3.1. GF Substrates

3.1.1. Contact Angle and Surface Energy

Figure 3 shows the change in the contact angles of the plasma-treated samples. A 40% decrease in the contact angle was observed for the sample treated for 5 s, and a 54% decrease was observed for the sample treated for 30 s. No important variations in the change in the angle were observed after plasma treatment for times longer than 15 s. The increase in the wettability of the plasma-treated samples was because of the insertion of polar groups on the surface, which is characteristic of the plasma treatment of polymeric surfaces such as GF substrates [28,29].
Figure 4 shows the variations in the polar component ( γ s p ), the dispersion component ( γ s d ), and the surface free energy γ s before and after the plasma treatment. It was observed that the sample treated for 15 s presented a higher surface energy, increasing from 52.4 to 71.5 mJ/m2 compared with the untreated sample. However, the components of the surface free energy had to be analyzed to extract more information from the results. The dispersion component of the substrates decreased from 49.8 to 44.5 mJ/m2 after 5 s of treatment and remained constant for longer times. This change was associated with the crosslinked bonds, which enhanced the orientation of the polymer chains, primarily through the C=O and -NH groups present on the surface macrostructure after the plasma treatment. The polar component allowed us to understand the polar bonds available on the surface of the substrate. The plasma treatment increased the polar component from 2.7 to 22.9 mJ/m2 after 15 s of treatment; with longer exposure times, the polar component remained constant. This phenomenon was associated with the saturation of polar groups on the surface [22,24]. To identify the specific polar groups introduced onto the surface of the GF substrates, chemical analysis techniques such as XPS or FTIR would be required. However, this was beyond the scope of the current section.

3.1.2. Raman Spectroscopy for GF

Raman spectroscopy was used to investigate the species present on the surface of the GF substrates treated with plasma. In Figure 5, the main characteristic peaks of the substrates with and without treatment are shown. The vibration spectrum of the fiberglass was mainly identified in the low-frequency regions between 200 and 600 cm−1 and around 800 cm−1. All of these bands of the fiberglass spectrum were assigned to bending or stretching vibrations of the Si-O-Si bond [30]. The Si-O-Si band disappeared after the plasma treatment, suggesting the formation of new compounds on the surface. By observing the surface energy calculations, this could be associated with these compounds being polar groups, the peak of which appeared in the region between 2000 and 3500 cm−1. However, since Raman spectroscopy is insensitive to small-wavelength regions, the characteristic peaks of the polar groups (-OH, -C=O, etc.) could not be observed. The major absorption bands at 800 and 1000 cm−1 increased after 15 s of plasma treatment, which corresponded to the vibration of the Si-C and Si-O bonds, respectively. The surface of the fiberglass underwent crosslinking after 15 s of treatment, forming a continuous and random carbosiloxane network at the cost of the lateral methyl groups. The band at 1408 cm−1 corresponded to the deformation of the Si-CH3 bonds [31]. Polymeric material presents better mechanical properties when it has a higher degree of crosslinking [32,33]. The peak at 3300 cm−1 appearing after 15 s of treatment corresponded to an amide group (-NH). It is known that -C=O and -NH groups form intermolecular hydrogen bonds between themselves, which could explain the increase in the aromatic ring peak and the stretching vibration of -C=O after 15 min of treatment. The sample after 20 s of treatment shows only two bands at 800 cm−1 and 1600 cm−1, which are attributed to the Si-C and Si-CH3 bonds, respectively. On the other hand, for the samples treated for 25 and 30 s, the bands appear at 600 cm−1 and 1408 cm−1, corresponding to the Si-O-Si and Si-CH3 bonds, respectively. Plasma treatment in polymeric materials is primarily governed by the interactions between the species generated during the process, which include electrons, positive ions, molecules, neutral and excited radicals, and atoms in their ground state. The formation of -NH groups after 15 s of treatment was mainly due to the interactions between these species and the free radicals generated on the polymer surface during the plasma treatment. In particular, the species formed during the dissociation of the gas (humid air, composed of 79% N2, 20% O2, and 1% other components) reacted with the surface of the fiberglass substrates, promoting the formation of -NH, -OH, and -C=O groups (see Figure 6) [22,23].

3.2. Graphene Oxide Modification

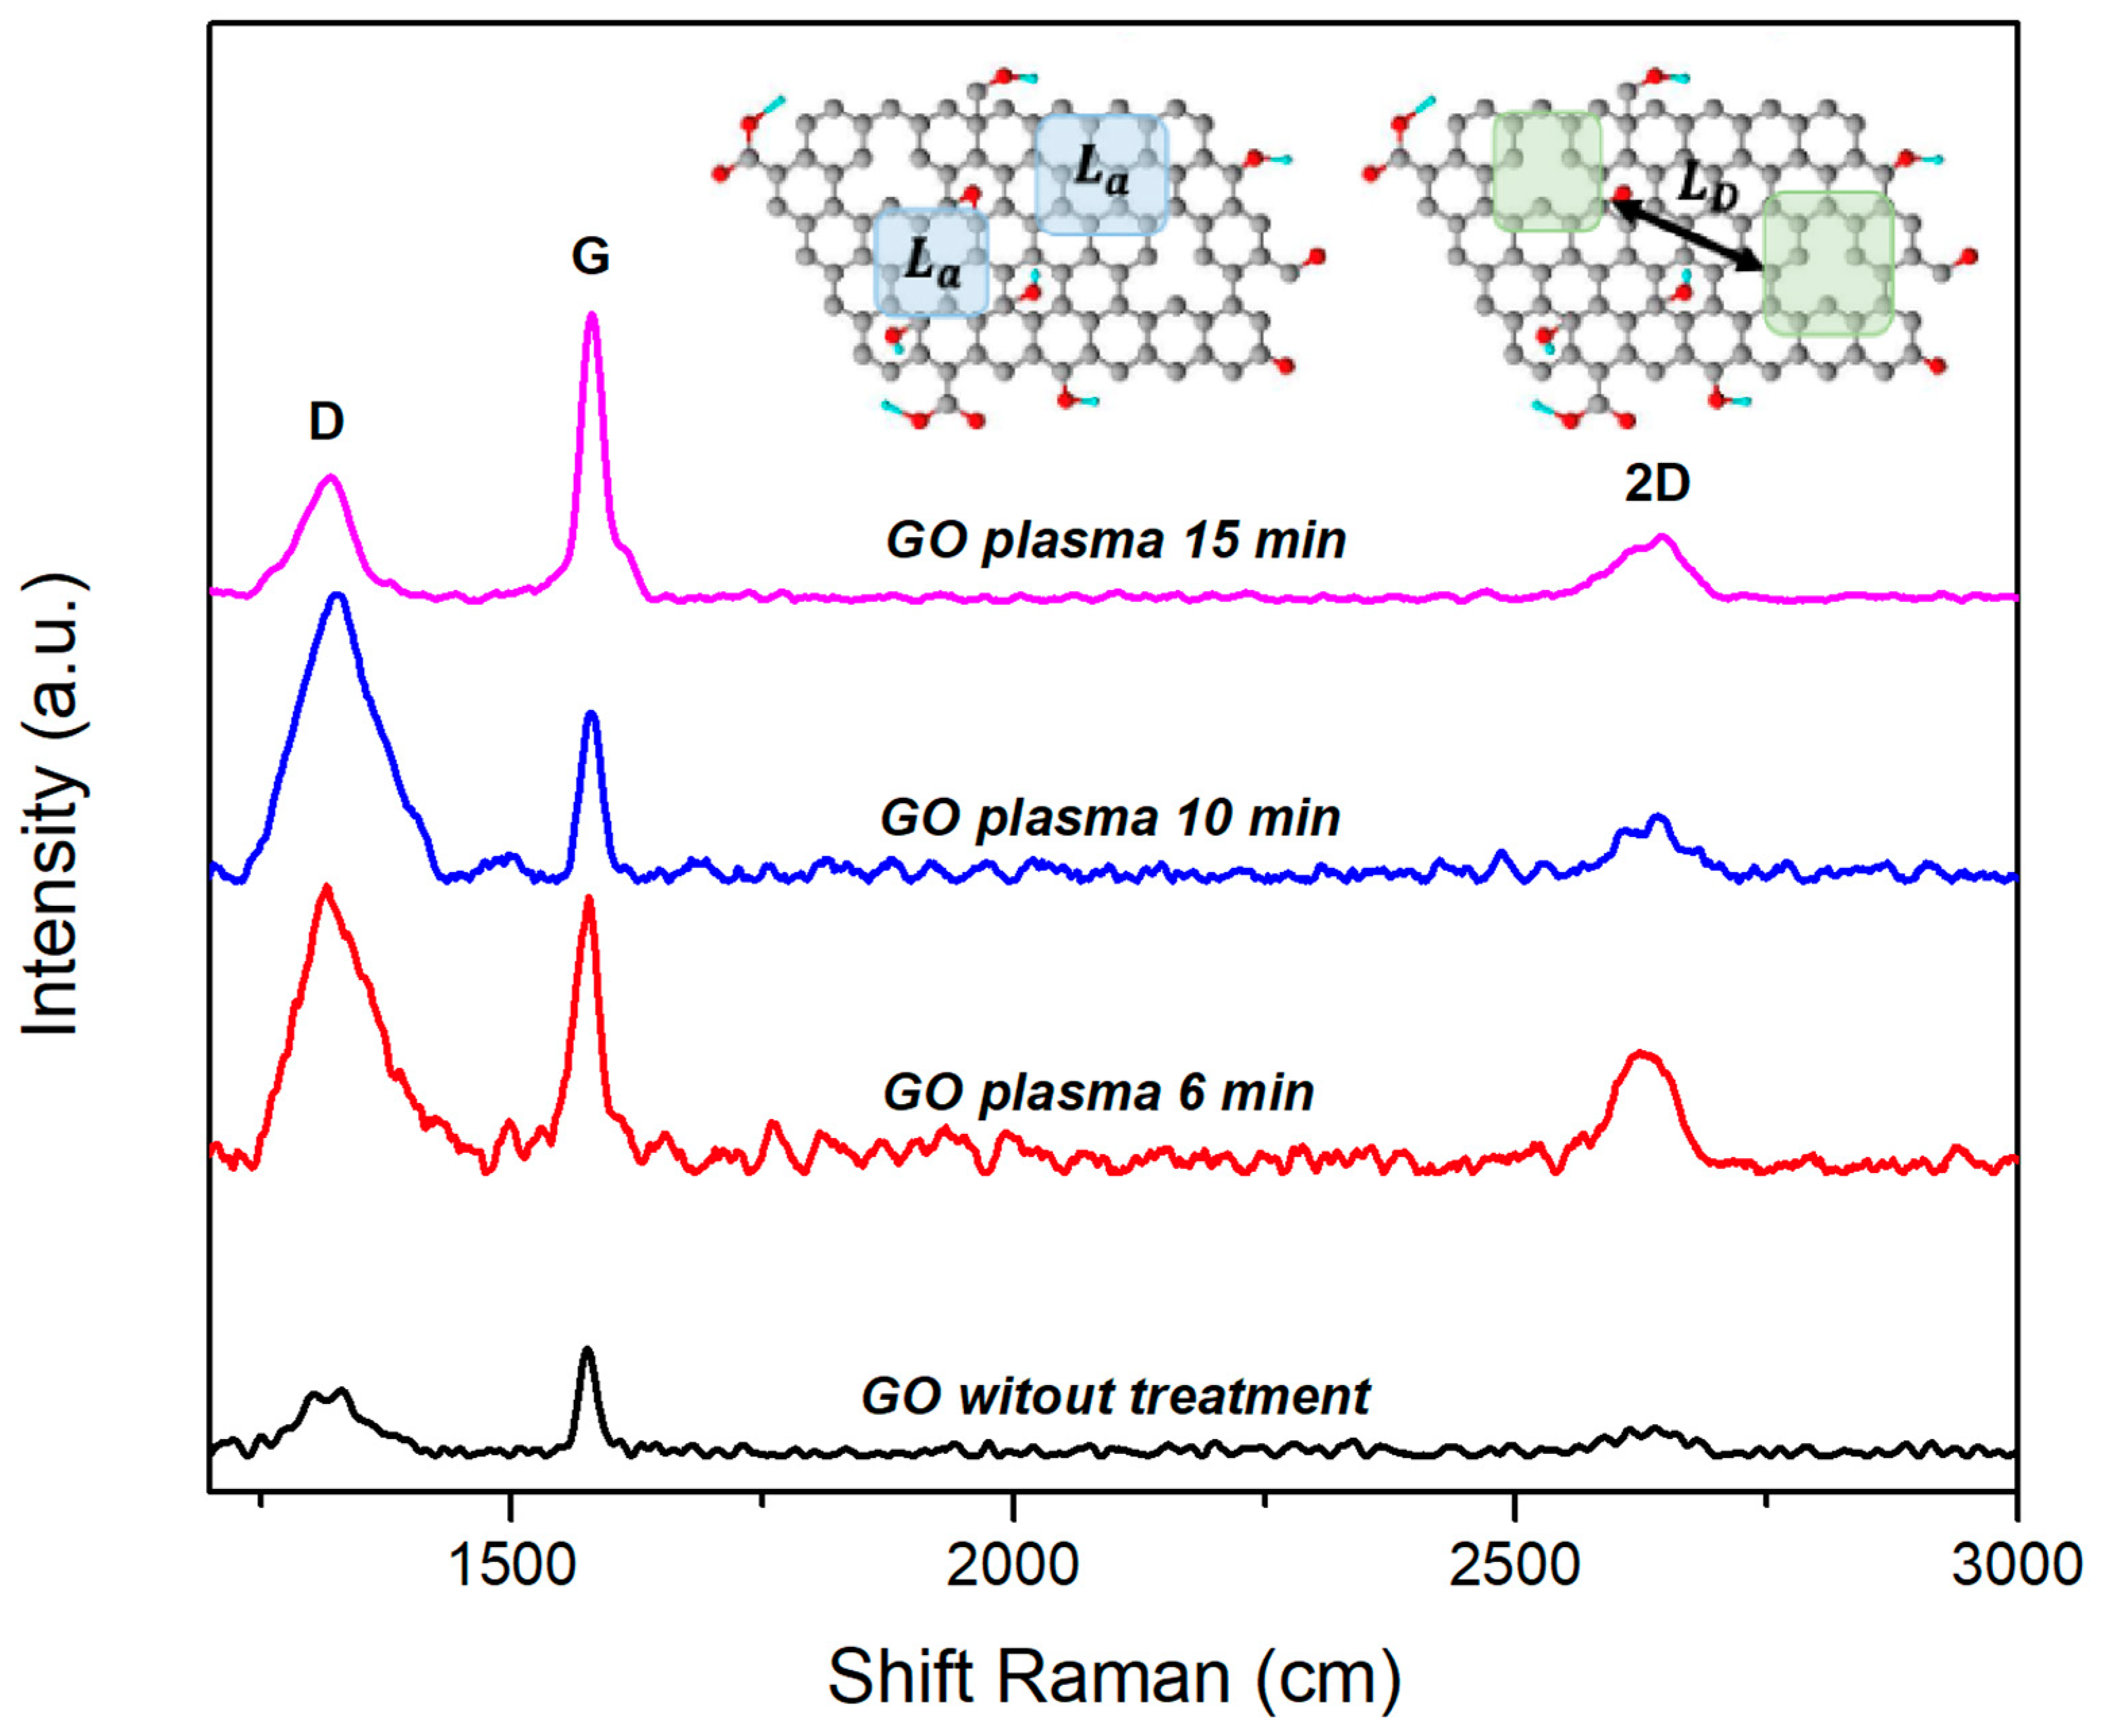
3.2.1. Raman Spectroscopy for GO

Plasma treatment is a forceful process that can modify the GO structure superficially due to the presence of oxygenated groups. The Raman spectra allow the detection of different carbon allotropes (graphene, graphite, graphene oxide, etc.), and through the intensity ratios of I D / I G and I 2 D / I G , it is possible to estimate the crystallite size, defects, number of layers, and density. Figure 7 shows the Raman spectra of graphene oxide with different plasma treatment times. Two main bands of GO are observed: the D band (1590 cm−1) and the G band (1590 cm−1). These are related to structural defects or the presence of oxygenated groups that disrupt the symmetry of the plane and the configuration of the sp2-hybridized carbon atoms. The 2D band is of lower intensity and is a harmonic of the D band that determines the dependence on various perturbations associated with the number of defects [33,34,35]. Table 1 shows the relationship of the main bands of the different GO samples. Untreated GO showed a low I D / I G   i n t e n s i t y   r a t i o . The value of the intensity ratio of 0.55 indicates a high-quality material with a high oxygenated group concentration. After 6 and 10 min of plasma treatment, the I D / I G intensity ratio increased to 1.04 and 1.63, respectively. This increase is attributed to the creation of defects and disorder on the GO surface due to the deoxygenation of the surface, as evidenced by the increase in the intensity of the D band and the decrease in the intensity of the G band, which is related to the level of oxidation. The decrease in the I D / I G (≈0.42) intensity ratio for GO treated for 15 min represents the recovery of the sp2 graphitic structure of the carbon atoms, accompanied by a reduction in the oxygenated functional groups, which have been observed in previous investigations [30,31,34,35]. That is, with long plasma treatment times, the properties of the graphene oxide structure are partially recovered. However, this does not result in a complete restoration of the sp2 graphitic structure. To fully restore the sp2 graphitic structure, a plasma treatment using carbon-rich gases, such as CH4 (methane) or C2H2 (acetylene), is required. These gases provide reactive carbon, which is essential for more effectively restoring the graphene network [36,37,38,39,40]. The I 2 D / I G intensity ratio was used to estimate the number of layers of GO. An I 2 D / I G intensity ratio of 2–3 corresponds to a monolayer, a ratio of 1–2 corresponds to a bilayer, and an I 2 D / I G intensity ratio of <1 corresponds to a multilayer. Table 1 shows that the I 2 D / I G intensity ratios for the GO samples ranged from 0.20 to 0.45, indicating a multilayer structure [31,35,41].
Through the Tuinstra–Koenig law [36,42] and the ID/IG intensity ratio, it is possible to estimate the reduction in the functional groups, the level of defects, and the crystallite size in the sp2 plane (La), as shown in Equation (1).
L a n m = 2.4 × 10 10 λ L 4 I D I G 1
Here, λL is the laser excitation wavelength, and I D / I G is the D and G band intensity ratio. Comparing the values of La for GO without treatment (166 nm) with those of the samples treated at 6 min (56 nm) and 10 min (88 nm), reductions in La of 66% and 47%, respectively, are observed, resulting in an increase in the disorder in the structure, which is associated with a possible reduction in oxygen functional groups. The increase in La to 217 nm after 15 min of plasma treatment can be attributed to the possible saturation of oxygen in the structure of GO (see Table 2). Considering GO as a crystalline structure with point defects, it is possible to calculate the average distance between point defects (Ld) and the defect density ( n d ), as described by Sharma et al. [42].
L d 2 ( n m 2 ) = 1.8 ± 0.5 × λ L 4 I D I G 1
n d 2 = 1.8 ± 0.5 × 10 22 λ L 4 I D I G
Untreated GO and GO treated for 15 min showed the smallest distance between point defects (Ld) [36,42], which was between 40 and 46 nm, respectively, corroborating their low defect densities of 3.33 × 10¹⁰ and 2.54 × 10¹⁰. However, the GO treated for 6 and 10 min had higher defect densities of 6.30 × 10¹⁰ and 9.87 × 10¹⁰, with a distance between defects of 29 and 23 nm, respectively. This phenomenon can be associated with the increase in the intensity of the D band due to the presence of defects and vacancies, grain boundaries, and the edges of the carbon network. The increase in n d for GO after 6 and 10 min of plasma treatment was due to the deoxygenation of the structure of GO, which decreased the crystallite size (La). However, with longer plasma treatment times, the graphitic structure was recovered through the repair of defects, as temperature dependence is an important variable in all possible contributions of anharmonicity, grain size, and deformations [36,37,38,39,40]. Huang et al. [36] modified the surface of graphene with oxidized chemical vapor deposition (oxidized CVD–graphene) using a plasma jet at atmospheric pressure with helium in an air atmosphere. It was found that with short treatment times (0–60 s), the content of oxygenated groups increased, while with times of over 60 s, oxidized CVD graphene began to lose oxygen and carbon.

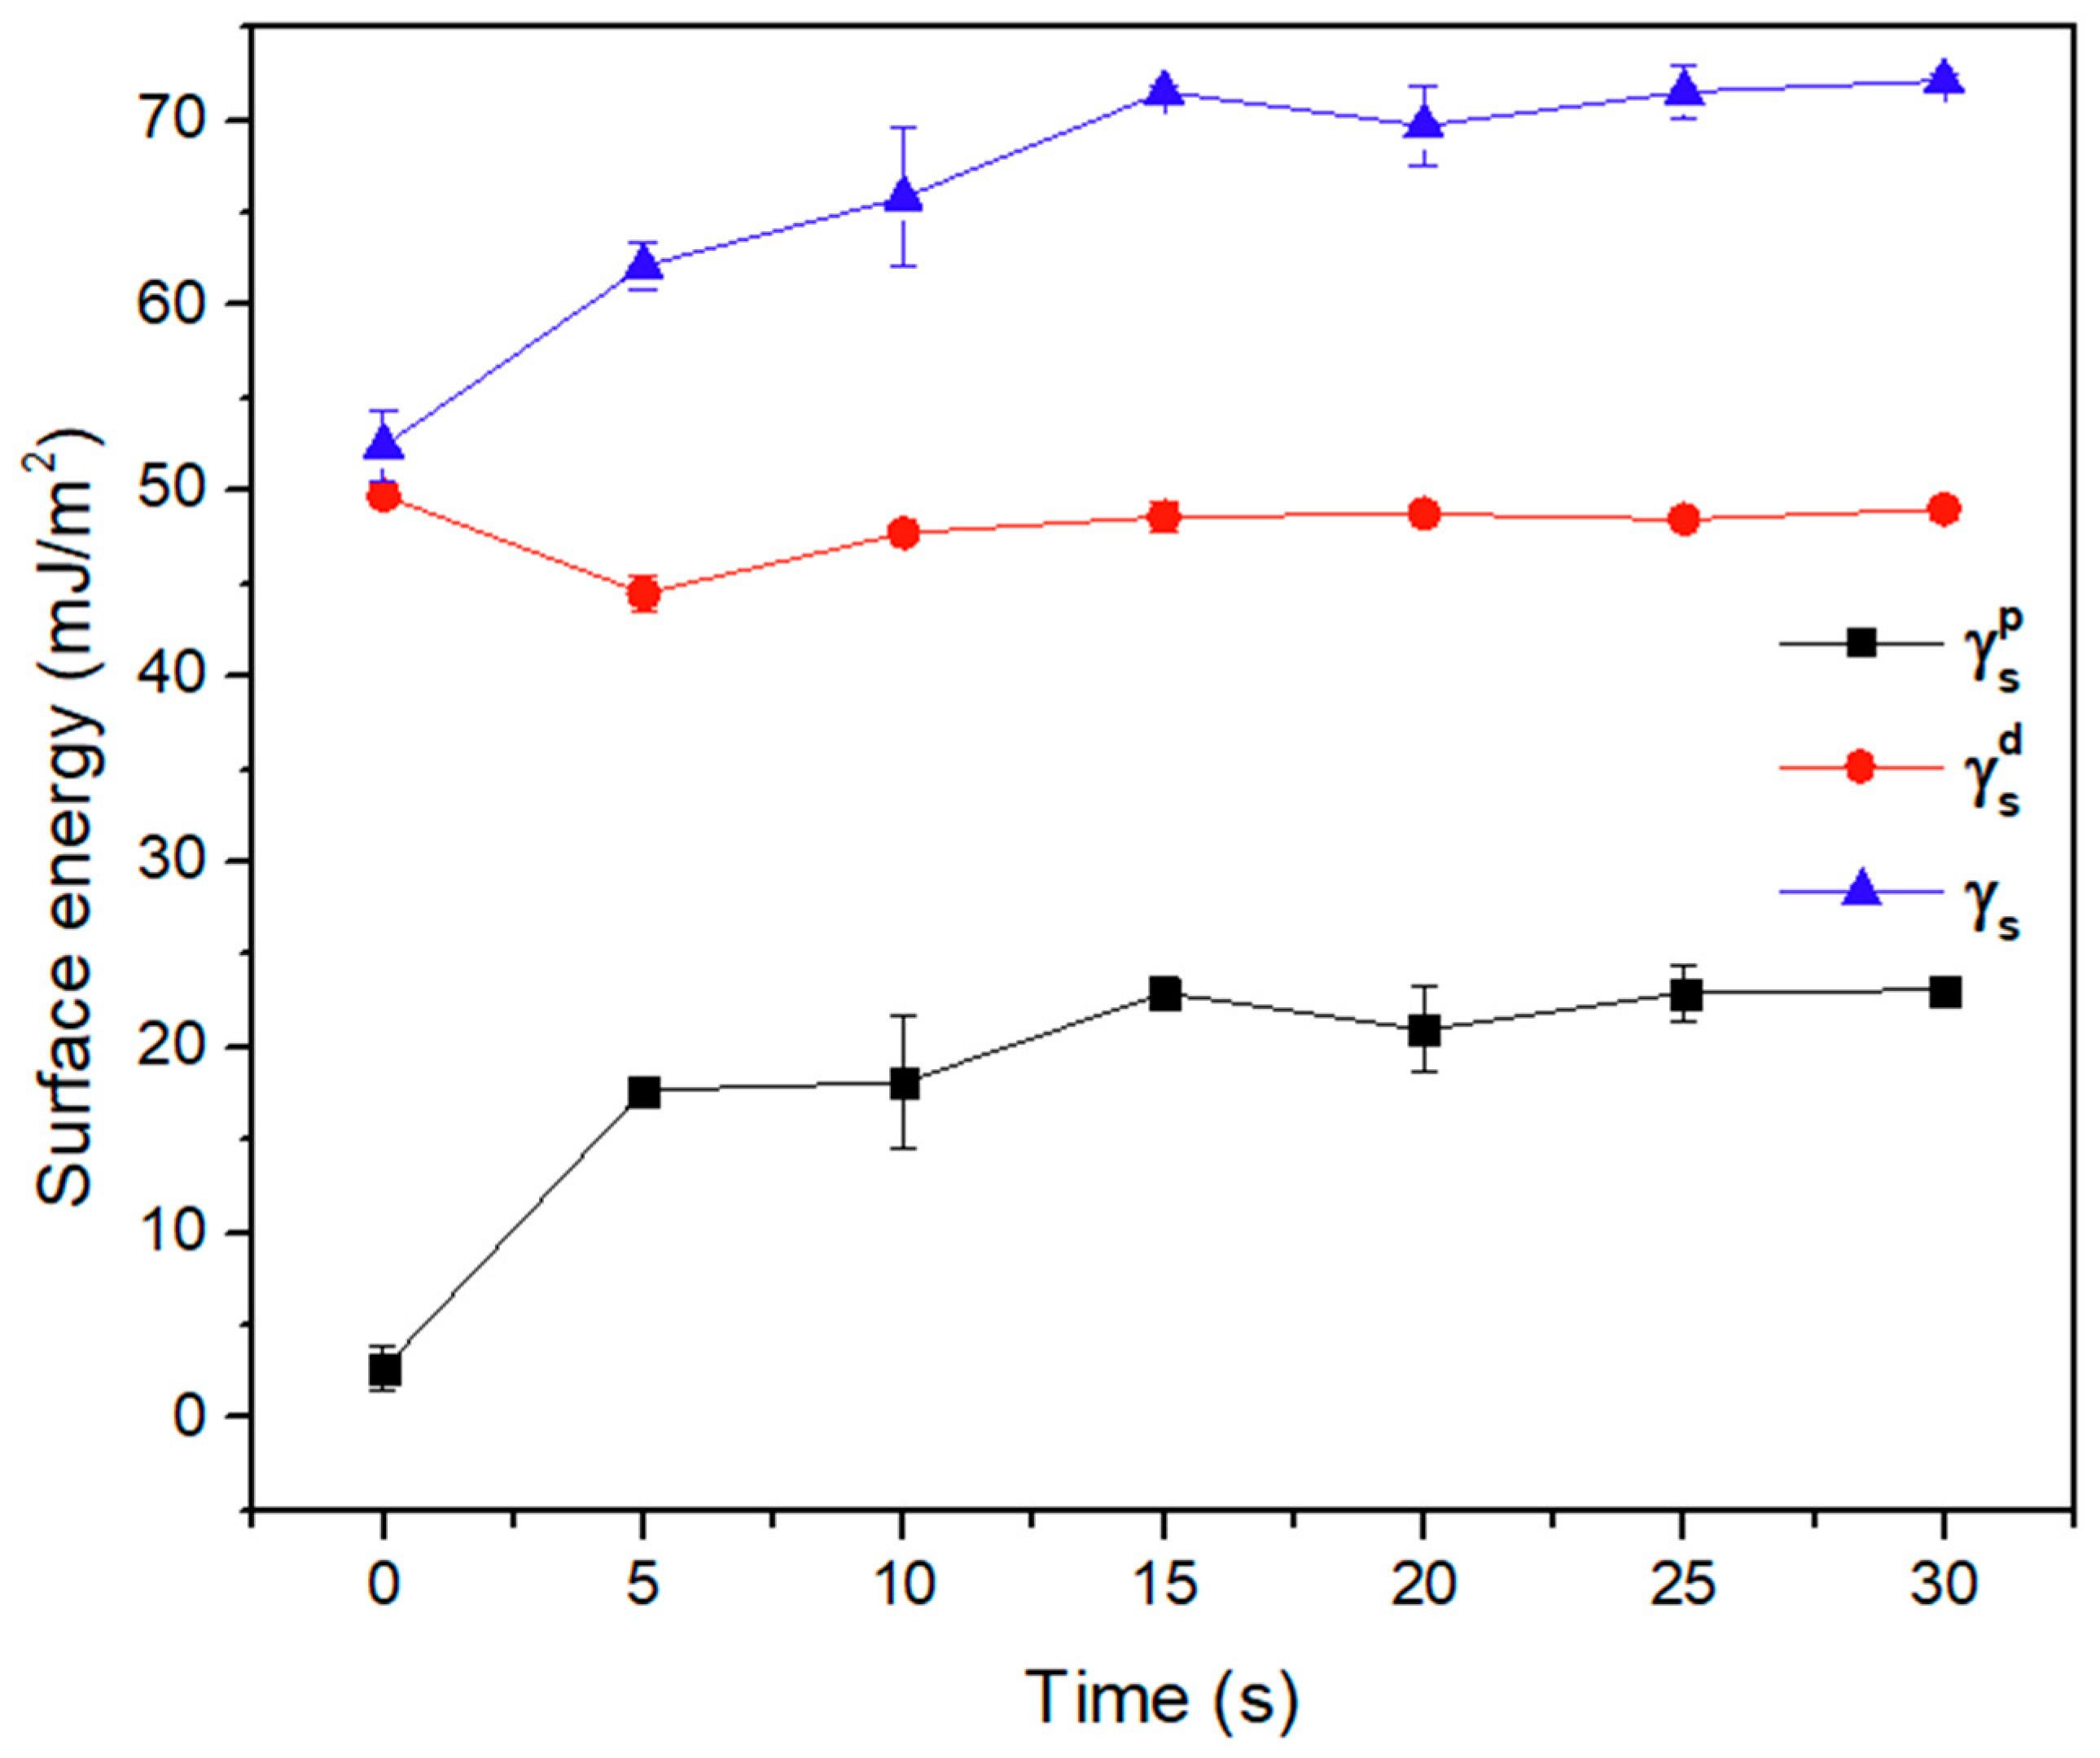
3.2.2. Surface Energy Test

It was possible to calculate the surface energy of the modified graphene oxide through contact angle tests. Surface energy is the sum of the polar component and the dispersive component. The polar component provides information about the presence of polar species such as hydroxyls, carboxyls, epoxides, etc. [24]. Figure 8 shows the polar component of GO before and after plasma treatment. However, a trend toward increased hydrophobicity is observed due to the loss of oxygenated groups during plasma treatment [22]. During plasma treatment, the structure of graphene oxide suffers covalent and non-covalent modifications. The Raman spectra showed an increase in defects in the structure of GO, which can be related to the deoxygenation of the GO surface caused mainly by cleaving the epoxide groups, which are more susceptible due to the instability of the rings [22,43,44,45,46,47].

3.3. Polyurethane/Graphene Oxide (PU/GO) Coatings

Through contact angle, surface free energy, and Raman spectroscopy tests, it is concluded that the GF sample treated for 15 s is the most suitable for the application of the PU/GO coating. Since it presents higher surface energy. This increases adhesion with other materials, optimizing the effectiveness of the coating.

3.3.1. FTIR Spectroscopy for PU/GO

Using FTIR spectra, the interactions between graphene oxide particles and the polyurethane matrix were studied. The addition of GO at low concentrations did not generate new bands in the FTIR spectra, although changes were found in the intensities of the bands of the functional groups C-O-C, C=O, and -NH at 1049 cm−1, 1732 cm−1, and 3338 cm−1, respectively.
These functional groups are sensitive to the hydrogen bonds present in PU since they are proton donors and acceptors. Hydrogen bonds are known to affect the crosslinking of the PU structure to a great extent, since the more hydrogen bonds, the more intermolecular strength the structure has, which affects the mechanical properties to a great extent.
As shown in Figure 9, the C-O-C, C=O, and –NH bands in the PU/0.2GO_10 min sample presented lower intensities than the other coatings. This reduction in intensity was caused by a larger amount of crosslinking between hydrogen bonds and –NH and C=O groups.
According to Huang et al. [36], the instability of the epoxide groups due to the electron bombardment during plasma treatment allowed the C-O-C bond to be broken, forming highly reactive radicals such as CO. Once activated, the epoxide captured atomic oxygen from the surrounding atmosphere, forming O2. For CVD–graphene [36] with high epoxide content, the reduction rate was higher than the oxidation rate. We found that GO had a slight increase in the intensity of the C-O-C band, which may be due to oxidation degree after 6 and 10 min of treatment [36].
In conclusion, the plasma treatment of GO particles reduced the crosslinking of the PU matrix between the –NH and C=O groups, producing fewer disturbances to the hydrogen bonds. Figure 8 does not show this trend for the GO treated for 10 min, since the bands of –NH and C-O-C presented lower intensity, which indicated a greater degree of crosslinking between hydrogen bonds and the functional groups –NH and C=O [48].

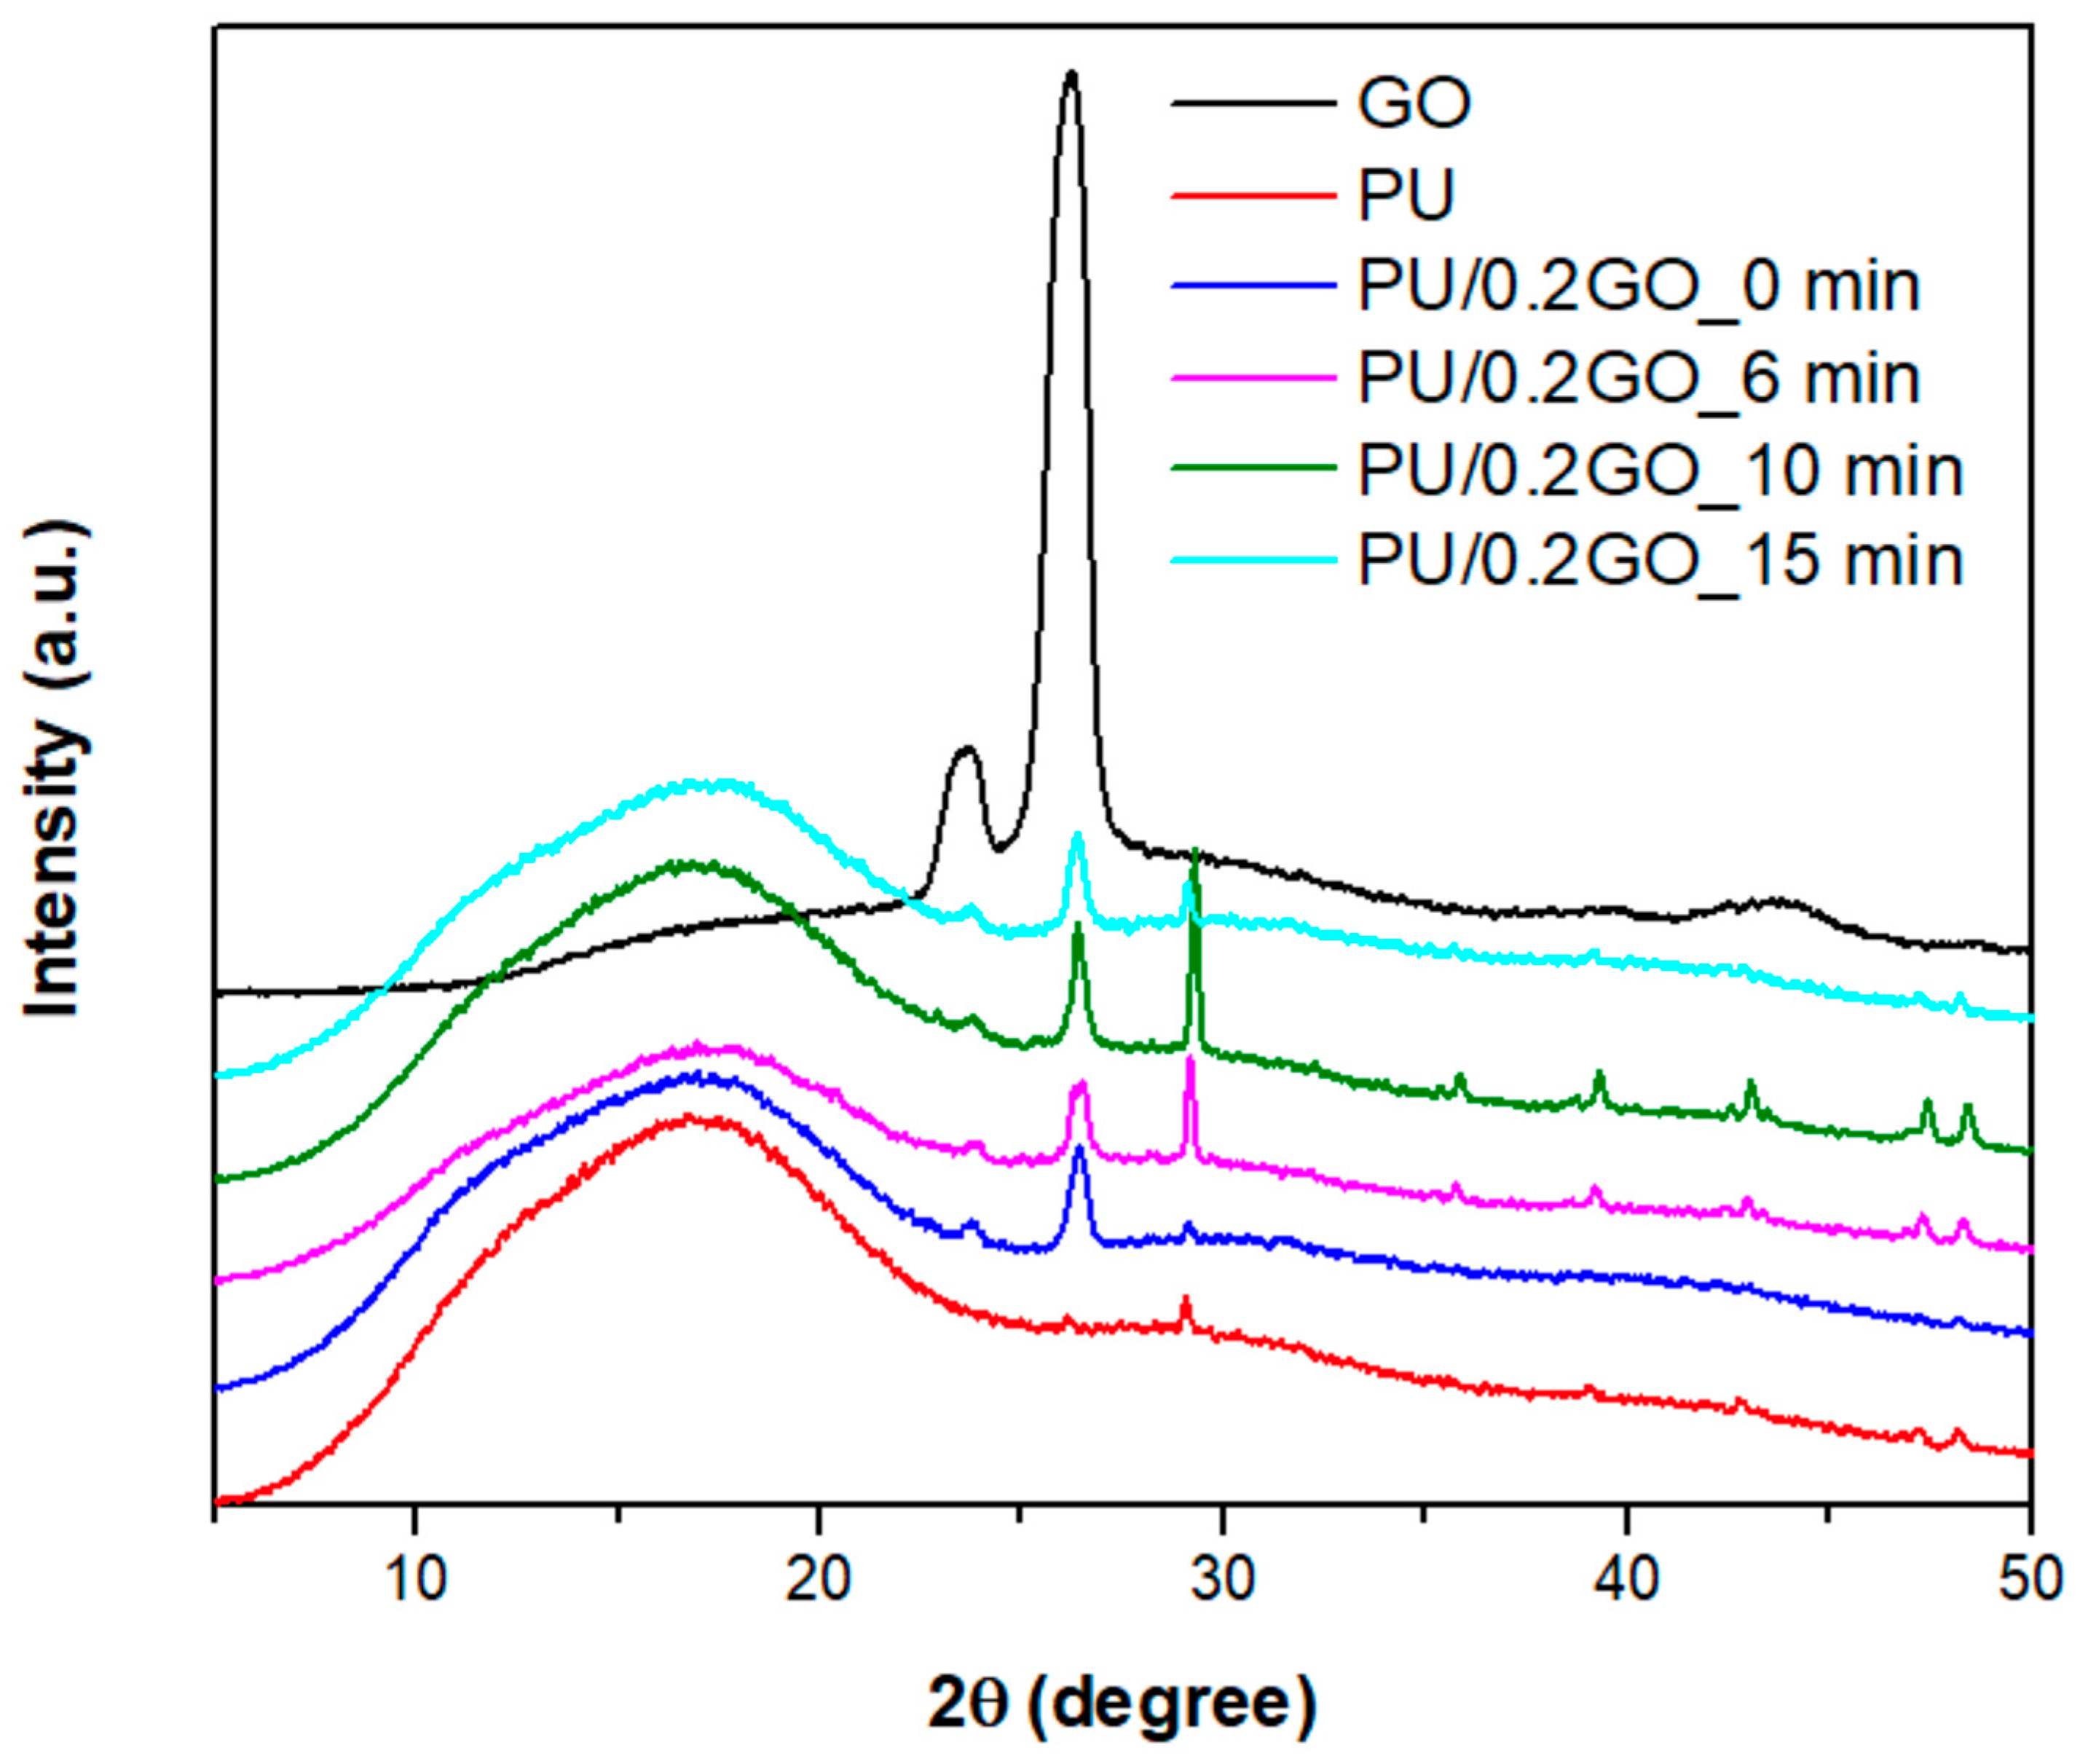
3.3.2. X-Ray Diffraction for PU/GO

Diffraction patterns of PU, GO and the different PU/GO coatings are shown in Figure 10. Figure 10 displays a board peak intensity of around 17°, which corresponds with an amorphous feature of crosslinking in PU (see PU curve in Figure 10). GO exhibits a strong, sharp peak at 26.4° (see GO curve in Figure 10), indicating that it is highly crystalline. The peak at 26.4° corresponds to the crystalline layers of GO and the interplanar space between the layers of graphite. This has been observed and confirmed in PU/GO compounds previously [38,39,40].
To observe the interactions between the GO and PU particles, the crystal size (D) was calculated using the Paul Scherer equation and the interplanar distance using Bragg’s law (d), as shown in Table 3.
D = ( k λ ) / β c o s ( θ )
d = λ / 2 s i n ( θ )
Here, β is the full peak width of the diffraction peak at half-maximum height (FWHM); θ is the half-diffraction angle of the peak corresponding to inter-layer spacing; d is the inter-layer spacing; and λ is the wavelength of the X-ray source.
The addition of GO particles did not affect the structure of PU (corresponding to 17°), as the crystal size remained invariant (0.499–0.567 nm; see Table 3) before and after plasma treatment. The interplanar distance of the peak at 26.4° in the PU/GO compound remained invariant (0.339); however, the presence of the peak indicated the dispersion of GO within the PU matrix. In general, the XRD patterns indicate good dispersion of GO, and the presence of additional peaks in the PU/0.2GO_6 min and PU/0.2GO_10 min samples show a larger crystallization area due to the GO aggregation structures. With the invariant changes in crystal size and the interplanar distance suggest the formation of reduced oxide graphene. The formation of reduced graphene oxide can be confirmed through Raman spectroscopy because there is a redeposition of species with the removal of a great number of polar groups, such as carbonyls, hydroxyls, and epoxides, during plasma treatment. Figure 11 shows a representative image highlighting the polar groups most susceptible to removal [40,49,50].

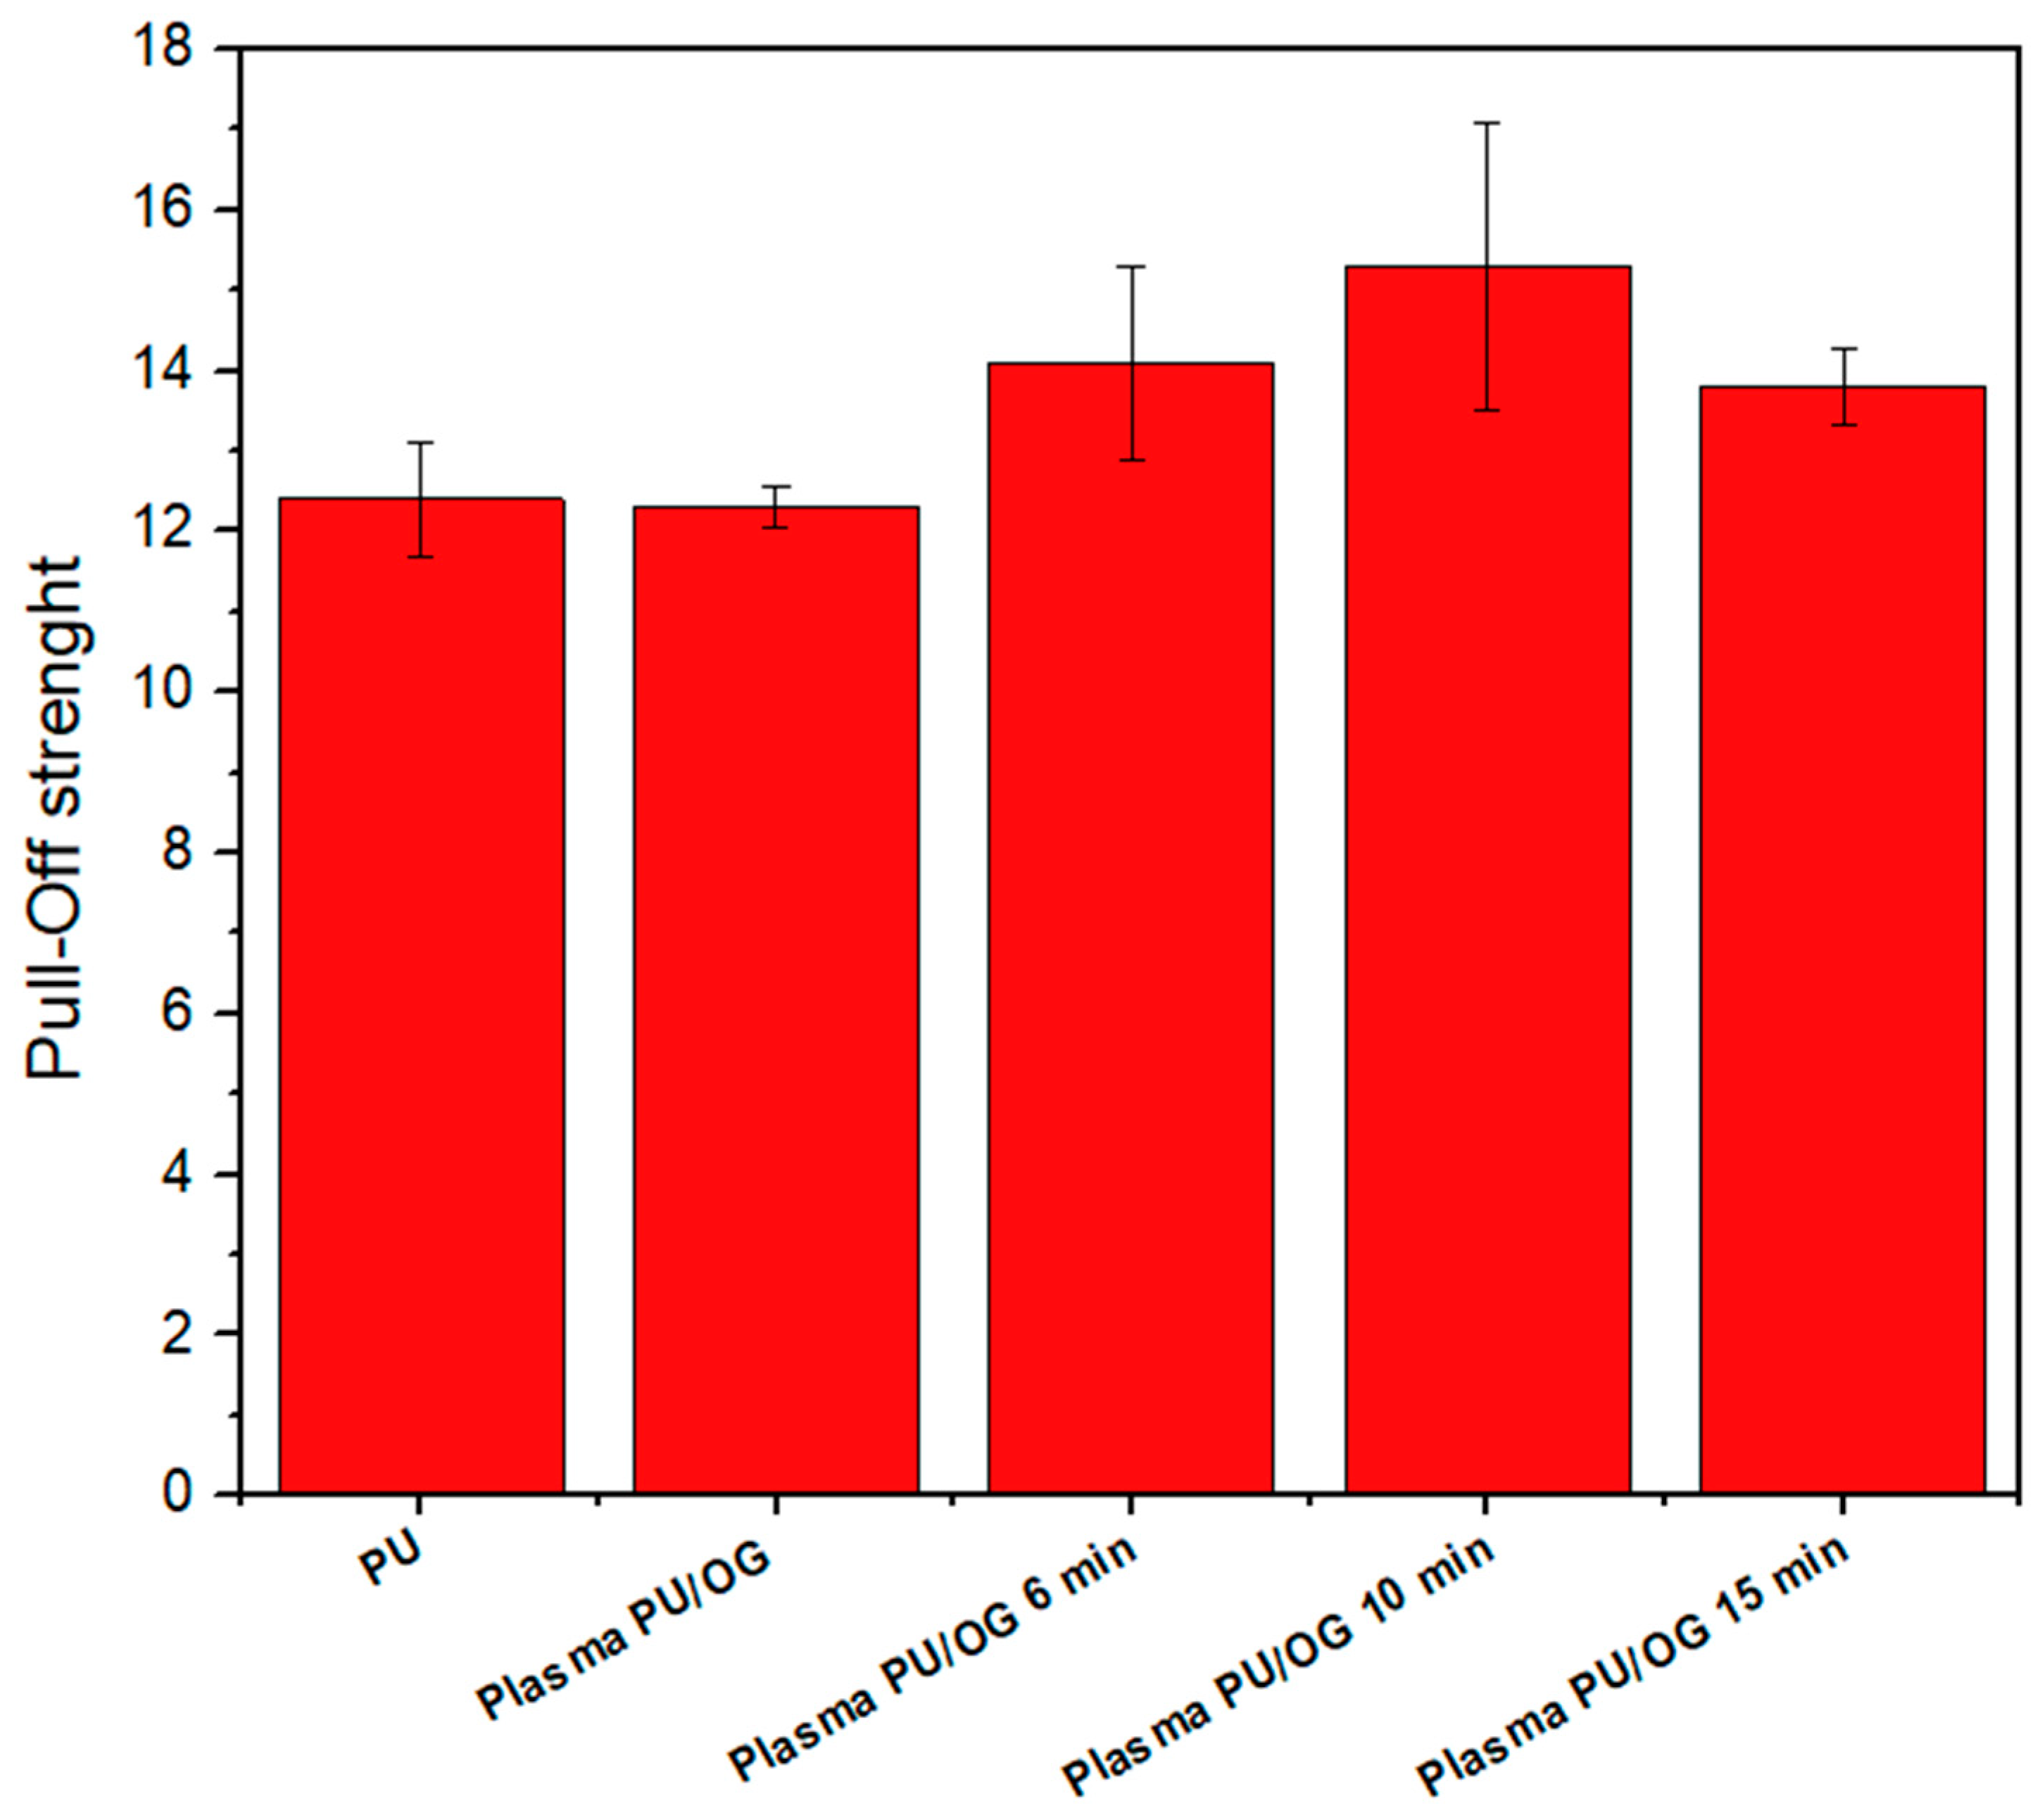
3.3.3. Adhesion Tests

Plasma treatments modify the covalent and noncovalent interactions in the graphene oxide structure due to the deformation and redeposition of oxygenated groups on the surface of GO [51,52,53,54]. Noncovalent bonds—mainly π-π interactions, hydrogen bonding, and electrostatic interactions—improve the dispersion and interfacial compatibility of GO in the PU matrix due to the structural defects in GO produced by the plasma treatment [45,46,55,56,57]. In Figure 12, the adhesion tests for the different coatings are presented. The PU/0.2GO sample treated for 10 min showed 27.6% more adhesion strength than the untreated PU/0.2GO. This improvement in adhesion strength was due to the fact that it presented a greater defect density in the structure of GO (Ld), which allowed for better dispersion and compatibility of GO in the PU matrix, effectively facilitating the dispersion of PU in the layers of GO [40,49,50]. The Raman spectra showed a reduction in GO after 6 min of treatment, and after 15 min, the GO structure had restored its sp2 domains. It can be said that reduced graphene oxide from plasma treatment increases the adhesion strength on GF substrates.

4. Conclusions

The main objective of this study was to perform DBP treatments on graphene oxide (GO) particles prior to their incorporation into a polyurethane (PU) matrix, aiming to enhance particle dispersion and, as a result, improve their resistance to erosion and wear, which are key characteristics for their application in wind turbine blades. The purpose of performing plasma treatment on the surface of the substrates was to enhance the adhesion strength between the substrates and the PU/GO coatings, which can be observed through the polar component of the surface energy. The plasma treatment increased the polar component of the surface of the fiberglass (GF) substrates from 52.4 mJ/m2 to 71.5 mJ/m2 after 15 s of treatment, which improved the adhesion of the PU/GO coating.
On the other hand, plasma treatment improved the dispersion and compatibility of graphene oxide (GO) within the polyurethane (PU) matrix after 10 min of treatment, as confirmed by the reduction in the peak at 2θ = 20° in the X-ray diffraction (XRD) analysis. This effect is attributed to an increased defect density (nd) and a reduced inter-defect distance (Ld), due to the presence of oxygenated groups introduced by plasma treatment and confirmed by FTIR analysis. Additionally, the intensity of the bands corresponding to -NH and C-O-C decreased, indicating an enhanced degree of crosslinking between the hydrogen bonds and functional groups (-NH and C=O). These changes improved the dispersion of GO within the PU matrix, leading to a 24% increase in adhesion strength after 10 min of plasma treatment.

Author Contributions

Conceptualization, O.X. and H.M.; methodology, O.X.; software, R.C. and V.B.-T.; validation, R.C. and V.B.-T.; formal analysis, M.d.P.R.-R. and B.C.; investigation, O.X.; resources, H.M.; data curation, B.C., R.C. and V.B.-T.; writing—original draft preparation, O.X.; writing—review and editing, H.M.; visualization, B.C., R.C. and V.B.-T.; supervision, H.M.; project administration, H.M.; funding acquisition, H.M. All authors have read and agreed to the published version of the manuscript.

Funding

This study was sponsored by DGAPA IN-102222 and CONACyT 225991 and 268644.

Institutional Review Board Statement

Not applicable.

Informed Consent Statement

Not applicable.

Data Availability Statement

Data are contained within the article.

Acknowledgments

Oscar Eduardo Xosocotla Espejel, with CVU number 801782, thanks CONACHCyT for the doctoral scholarship (project number 6578441). María del Pilar Rojas Rodriguez, with CVU number 745531, thanks CONACHCyT for the postdoctoral scholarship (project number 6578441). Juana Romero-Vergara, Hector Hugo Hinojosa, Fermin Castillo, and Osvaldo Flores are acknowledged for their technical assistance.

Conflicts of Interest

The authors declare no conflicts of interest.

References

  1. Walayat, K.; Haeri, S.; Ma, J.; Zhang, Y. PD–DEM hybrid modeling of leading-edge erosion in wind turbine blades under controlled impact scenarios. Comput. Part. Mech. 2024, 11, 1903–1921. [Google Scholar] [CrossRef] [PubMed]
  2. Lee, H.; Hwang, Y.M.; Lee, J.; Kim, N.; Ko, S. A Drone-driven X-ray Image-based Diagnosis of Wind Turbine Blades for Reliable Operation of Wind Turbine. IEEE Access 2024, 12, 56141–56158. [Google Scholar] [CrossRef]
  3. Lopez, J.C.; Kolios, A. An autonomous decision-making agent for offshore wind turbine blades under leading edge erosion. Renew. Energy 2024, 227, 120525. [Google Scholar] [CrossRef]
  4. Carraro, M.; De Vanna, F.; Zweiri, F.; Benini, E.; Heidari, A.; Hadavinia, H. CFD Modeling of Wind Turbine Blades with Eroded Leading Edge. Fluids 2022, 7, 302. [Google Scholar] [CrossRef]
  5. Law, H.; Koutsos, V. Leading edge erosion of wind turbines: Effect of solid airborne particles and rain on operational wind farms. Wind Energy 2020, 23, 1955–1965. [Google Scholar] [CrossRef]
  6. Pryor, S.C.; Barthelmie, R.; Cadence, J.; Dellwik, E.; Hasager, C.B.; Kral, S.T.; Reuder, J.; Rodgers, M.; Veraart, M. Atmospheric Drivers of Wind Turbine Blade Leading Edge Erosion: Review and Recommendations for Future Research. Energies 2022, 15, 8553. [Google Scholar] [CrossRef]
  7. Mishnaevsky, L.; Tempelis, A.; Kuthe, N.; Mahajan, P. Recent developments in the protection of wind turbine blades against leading edge erosion: Materials solutions and predictive modeling. Renew. Energy 2023, 215, 118966. [Google Scholar] [CrossRef]
  8. Wang, B.; Xing, G.; Zhang, J.; Sheng, M.; Wang, J.; Wang, Z. Relationship between wet coating thickness and nanoparticle loadings based on the performance of mixed matrix composite membranes. J. Membr. Sci. 2023, 667, 121167. [Google Scholar] [CrossRef]
  9. Liang, G.; Yao, F.; Qi, Y.; Gong, R.; Li, R.; Liu, B.; Zhao, Y.; Lian, C.; Li, L.; Dong, X.; et al. Improvement of Mechanical Properties and Solvent Resistance of Polyurethane Coating by Chemical Grafting of Graphene Oxide. Polymers 2023, 15, 882. [Google Scholar] [CrossRef]
  10. El-Shamy, O.A.A.; Deyab, M. Eco-friendly biosynthesis of silver nanoparticles and their improvement of anti-corrosion performance in epoxy coatings. J. Mol. Liq. 2023, 376, 121488. [Google Scholar] [CrossRef]
  11. Asim, N.; Badiei, M.; Samsudin, N.A.; Mohammad, M.; Razali, H.; Soltani, S.; Amin, N.A. Application of graphene-based materials in developing sustainable infrastructure: An overview. Composites. Part B Eng. 2022, 245, 110188. [Google Scholar] [CrossRef]
  12. Jiang, Y.; Li, Z. Preparation and characterization of a novel polyurethane/polyurethane modified graphene oxide composites. Colloid Polym. Sci. /Colloid Polym. Sci. 2021, 299, 1767–1776. [Google Scholar] [CrossRef]
  13. Ince, J.C.; Mudasir, P.; Mathews, L.D.; Pai, A.R.; Al-Qatatsheh, A.; Abbasi, S.; Yin, Y.; Hameed, N.; Duffy, A.R.; Lau, A.K.; et al. Overview of emerging hybrid and composite materials for space applications. Adv. Compos. Hybrid Mater. 2023, 6, 130. [Google Scholar] [CrossRef]
  14. Tounici, A.; Martín-MartíNez, J.M. Addition of Graphene Oxide in Different Stages of the Synthesis of Waterborne Polyurethane-Urea Adhesives and Its Influence on Their Structure, Thermal, Viscoelastic, and Adhesion Properties. Materials 2020, 13, 2899. [Google Scholar] [CrossRef]
  15. Wang, H.; Ye, M.; Wu, J.; Li, Y.; Guo, L.; Yang, D. Development of amine functionalized graphene oxide/fluorinated polyurethane topcoat with integrated anti-corrosion, anti-aging, and anti-bacterial performance. Prog. Org. Coat. 2024, 189, 108337. [Google Scholar] [CrossRef]
  16. Wei, G. Three-dimensional porous graphene-polymer frameworks for electromagnetic interference shielding. In Elsevier EBooks; Elsevier: Amsterdam, The Netherlands, 2024; pp. 221–244. [Google Scholar] [CrossRef]
  17. Liu, H.; Liu, Y.; Liu, W.Q.; Pan, J.; Huang, S.Q.; Mou, Z.G. Preparation and Properties of Modified Graphene Oxide/Polyurethane Composites. Integr. Ferroelectr. 2020, 206, 1–9. [Google Scholar] [CrossRef]
  18. Hamam, K.A.; Gaabour, L.H. Verify the changes in the structural and physical properties of PU/PEO embedded with graphene oxide. Results Phys. 2017, 7, 2427–2431. [Google Scholar] [CrossRef]
  19. George, J.S.; Poornima, V.P.; Paduvilan, J.K.; Salim, N.V.; Sunarso, J.; Kalarikkal, N.; Hameed, N.; Thomas, S. Advances and future outlook in epoxy/graphene composites for anticorrosive applications. Prog. Org. Coat. 2022, 162, 106571. [Google Scholar] [CrossRef]
  20. Acharya, S.; Swain, L.M.; Samal, R.R.; Parashar, S.K.S.; Sahoo, B.P. Fabrication of Multiwalled Carbon Nanotubes (MWCNT) and Reduced Graphene Oxide (rGO)-based thermoplastic polyurethane and polypyrrole nanocomposites for electromagnetic wave absorption application with a low reflection. Polym. Compos. 2023, 45, 3769–3784. [Google Scholar] [CrossRef]
  21. Olivieri, F.; Rollo, G.; De Falco, F.; Avolio, R.; Bonadies, I.; Castaldo, R.; Cocca, M.; Errico, M.E.; Lavorgna, M.; Gentile, G. Reduced graphene oxide/polyurethane coatings for wash-durable wearable piezoresistive sensors. Cellulose 2023, 30, 2667–2686. [Google Scholar] [CrossRef]
  22. Hamzaj, A.K.; Dona, E.D.; Santhosh, N.; Shvalya, V.; Košiček, M.; Cvelbar, U. Plasma-Modification of graphene oxide for advanced ammonia sensing. Appl. Surf. Sci. 2024, 660, 160006. [Google Scholar] [CrossRef]
  23. El-Hossary, F.M.; Ghitas, A.; El-Rahman, A.M.A.; Ebnalwaled, A.A.; Shahat, M.A.; Fawey, M.H. Cold RF oxygen plasma treatment of graphene oxide films. J. Mater. Science. Mater. Electron. 2021, 32, 15718–15731. [Google Scholar] [CrossRef]
  24. Kumar, P.; Šilhavík, M.; Zafar, Z.A.; Červenka, J. Universal Strategy for Reversing Aging and Defects in Graphene Oxide for Highly Conductive Graphene Aerogels. J. Phys. Chem. C 2023, 127, 10599–10608. [Google Scholar] [CrossRef]
  25. Kong, W.; Ge, X.; Zhang, Q.; Zhang, F.; Kong, D.; Zhu, X.F.; Zhang, M.; Feng, Y. Ultrafast air-plasma reduction-exfoliation of graphene oxide aerogel at room temperature for capacitive deionization. Carbon 2023, 215, 118501. [Google Scholar] [CrossRef]
  26. Pathak, S.M.; Kumar, V.P.; Bonu, V.; Latha, S.; Mishnaevsky, L.; Lakshmi, R.; Bera, P.; Barshilia, H.C. Solid particle erosion studies of ceramic oxides reinforced water-based PU nanocomposite coatings for wind turbine blade protection. Ceram. Int. 2022, 48, 35788–35798. [Google Scholar] [CrossRef]
  27. ASTM D4541-22; Standard Test Method for Pull-Off Strength of Coatings Using Portable Adhesion Testers. ASTM International: West Conshohocken, PA, USA, 2022.
  28. Pugh, K.; Nash, J.; Reaburn, G.; Stack, M. On analytical tools for assessing the raindrop erosion of wind turbine blades. Renew. Sustain. Energy Rev. 2020, 137, 110611. [Google Scholar] [CrossRef]
  29. Nagae, S.; Nakamae, K. Characterization of glass fiber/nylon-6 interface by laser Raman spectroscopy. Int. J. Adhes. Adhes. 2002, 22, 139–142. [Google Scholar] [CrossRef]
  30. Alosaimi, F.K.; Tùng, T.T.; Dao, V.; Huyen, N.K.; Nine, J.; Hassan, K.; Ma, J.; Lošić, D. Graphene-based multifunctional surface and structure gradients engineered by atmospheric plasma. Appl. Mater. Today 2022, 27, 101486. [Google Scholar] [CrossRef]
  31. Wróblewska, A.; Dużyńska, A.; Judek, J.; Stobiński, L.; Żerańska-Chudek, K.; Gertych, A.P.; Zdrojek, M. Statistical analysis of the reduction process of graphene oxide probed by Raman spectroscopy mapping. J. Phys. Condens. Matter 2017, 29, 475201. [Google Scholar] [CrossRef]
  32. Yadav, V.K.; Fulekar, M.H. Advances in Methods for Recovery of Ferrous, Alumina, and Silica Nanoparticles from Fly Ash Waste. Ceramics 2020, 3, 384–420. [Google Scholar] [CrossRef]
  33. Zhang, W.; Yang, P.; Cao, Y.; Yu, P.; Chen, M.; Zhou, X. Evaluation of fiber surface modification via air plasma on the interfacial behavior of glass fiber reinforced laminated veneer lumber composites. Constr. Build. Mater. 2019, 233, 117315. [Google Scholar] [CrossRef]
  34. Arsenin, A.V.; Volkov, V.S.; Novikov, S.M. Comparison of CVD-grown and exfoliated graphene for biosensing applications. AIP Conf. Proc. 2021, 2359, 020035. [Google Scholar] [CrossRef]
  35. Kumar, S.; Goswami, M.; Singh, N.; Siddiqui, H.; Sathish, N.; Ashiq, M.; Kumar, S. Temperature-controlled exfoliation of graphite oxide: Studies of defects and transport properties of graphene oxide. Mater. Res. Express 2022, 9, 054001. [Google Scholar] [CrossRef]
  36. Huang, W.; Ptasińska, S. Functionalization of graphene by atmospheric pressure plasma jet in air or H2O2 environments. Appl. Surf. Sci. 2016, 367, 160–166. [Google Scholar] [CrossRef]
  37. Obaid, A.N.; Al-Bermany, E. Impact of graphene nanosheets on adhesion and corrosion performance of reinforced polyurethane coating for aerospace aluminium alloy 2024-T3. Int. J. Adhes. Adhes. 2024, 132, 103695. [Google Scholar] [CrossRef]
  38. Owji, E.; Ostovari, F.; Keshavarz, A. Electro-thermal properties and characterization of the flexible polyurethane-graphene nanocomposite films. Phys. Scr. 2022, 97, 105704. [Google Scholar] [CrossRef]
  39. Bagheri, F.; Saudi, A.; Bidram, E.; Asefnejad, A.; Sanati, A.; Zarrabi, A.; Rafienia, M. Fabrication of 3D porous polyurethane-graphene oxide scaffolds by a sequential two-step processing for non-load bearing bone defects. Phys. Scr. 2024, 99, 045023. [Google Scholar] [CrossRef]
  40. Kumar, S.H.B.V.; Muydinov, R.; Szyszka, B. Plasma Assisted Reduction of Graphene Oxide Films. Nanomaterials 2021, 11, 382. [Google Scholar] [CrossRef]
  41. Ott, A.K.; Ferrari, A.C. Raman spectroscopy of graphene and related materials. In Elsevier Ebooks; Elsevier: Amsterdam, The Netherlands, 2023; pp. 233–247. [Google Scholar] [CrossRef]
  42. Sharma, M.; Rani, S.; Pathak, D.K.; Bhatia, R.; Kumar, R.; Sameera, I. Temperature-dependent Raman modes of reduced graphene oxide: Effect of anharmonicity, crystallite size, and defects. Carbon 2021, 184, 437–444. [Google Scholar] [CrossRef]
  43. Alam, K.; Jo, Y.Y.; Park, C.; Cho, H. Synthesis of Graphene Oxide Using Atmospheric Plasma for Prospective Biological Applications. Int. J. Nanomed. 2020, 15, 5813–5824. [Google Scholar] [CrossRef]
  44. Jafari, A.; Mortaheb, H.R.; Gallucci, F. Plasma treatment for enhanced functionalization of graphene nanosheets by octadecyl amine. Chem. Eng. Res. Des. 2022, 187, 251–260. [Google Scholar] [CrossRef]
  45. El-Hossary, F.M.; Ghitas, A.; El-Rahman, A.M.A.; Shahat, M.A.; Fawey, M.H. The effective reduction of graphene oxide films using RF oxygen plasma treatment. Vacuum 2021, 188, 110158. [Google Scholar] [CrossRef]
  46. Yakin, F.S.M.; Abdullah, M.F.; Badaruddin, S.A.M.; Syono, M.I.; Soriadi, N. Surface modification and properties modulation of rGO film by short duration H2 and NH3 plasma treatment. Mater. Today Proc. 2021, 42, 2996–3001. [Google Scholar] [CrossRef]
  47. Ramamoorthy, H.; Buapan, K.; Chiawchan, T.; Thamkrongart, K.; Somphonsane, R. Exploration of the temperature-dependent correlations present in the structural, morphological, and electrical properties of thermally reduced free-standing graphene oxide papers. J. Mater. Sci. 2021, 56, 15134–15150. [Google Scholar] [CrossRef]
  48. Chadha, N.; Sharma, R.; Saini, P. A new insight into the structural modulation of graphene oxide upon chemical reduction is probed by Raman spectroscopy and X-ray diffraction. Carbon Lett. 2021, 31, 1125–1131. [Google Scholar] [CrossRef]
  49. Zhang, J.; Guo, L.; Meng, Q.; Wang, W.; Li, Z.; Chang, M.; Liu, M.; Jin, Z.; Zhao, K. Polyurethane foam-derived nitrogen-enriched porous carbon/reduced graphene oxide composite with sandwich-like nanoarchitectures for supercapacitors. J. Mater. Science. Mater. Electron. 2018, 29, 9942–9953. [Google Scholar] [CrossRef]
  50. Sabet, M.; Soleimani, H.; Mohammadian, E.; Hosseini, S. The effect of graphene oxide on polyurethane’s mechanical, thermal characteristics and flame retardancy. Plast. Rubber Compos. 2020, 50, 61–70. [Google Scholar] [CrossRef]
  51. Sharma, R.; Chadha, N.; Saini, P. Determination of defect density, crystallite size, and a number of graphene layers in graphene analogs using X-ray diffraction and Raman spectroscopy. Indian J. Pure Appl. Phys. 2017, 55, 625–629. [Google Scholar]
  52. Ponnamma, D.; Sadasivuni, K.K.; Strankowski, M.; Moldenaers, P.; Thomas, S.; Grohens, Y. Interrelated shape memory and Payne effect in polyurethane/graphene oxide nanocomposites. RSC Adv. 2013, 3, 16068. [Google Scholar] [CrossRef]
  53. Bhatt, M.D.; Kim, H.; Kim, G. Various defects in graphene: A review. RSC Adv. 2022, 12, 21520–21547. [Google Scholar] [CrossRef]
  54. Kaur, A.; Kaur, J.; Singh, R.C. Tailor-made exfoliated reduced graphene oxide nanosheets based on an oxidative-exfoliation approach. Fuller. Nanotub. Carbon Nanostruct. 2018, 26, 1–11. [Google Scholar] [CrossRef]
  55. Razaq, A.; Bibi, F.; Zheng, X.; Papadakis, R.; Jafri, S.H.M.; Li, H. Review on Graphene-, Graphene Oxide-, Reduced Graphene Oxide-Based Flexible Composites: From Fabrication to Applications. Materials 2022, 15, 1012. [Google Scholar] [CrossRef] [PubMed]
  56. Aghamohammadi, H.; Eslami-Farsani, R. An experimental investigation on the sulfur and nitrogen co-doping and oxidation of prepared graphene by electrochemical exfoliation of pencil graphite rods. Ceram. Int. 2020, 46, 28860–28869. [Google Scholar] [CrossRef]
  57. Colom, X.; Ávila, F.J.C.; Arias, M.J.L.; Sanjuan, G.; Galí, I.G. Análisis estructural de Óxidos de Grafeno (GO) y Óxidos de Grafeno reducidos (rGO). Afinidad 2020, 77, 167–174. Available online: https://dialnet.unirioja.es/servlet/articulo?codigo=7762528 (accessed on 17 May 2024).
Figure 1. Schematic diagram of the DBP atmospheric pressure.
Coatings 15 00411 g001
Figure 2. DBP treatment of GO.
Coatings 15 00411 g002
Figure 3. Graph of the angles of the substrates with and without plasma treatment for 5, 10, 15, 20, 25, and 30 s.
Coatings 15 00411 g003
Figure 4. Graph of the variations in the polar component γ s p , dispersion component γ s d , and surface free energy γ s after the plasma treatment.
Coatings 15 00411 g004
Figure 5. Raman spectra of GF substrates with and without DBP at atmospheric pressure treatment.
Coatings 15 00411 g005
Figure 6. Interaction of the DBP at atmospheric plasma treatment with GF.
Coatings 15 00411 g006
Figure 7. Raman spectra obtained from the different PU/GO coatings.
Coatings 15 00411 g007
Figure 8. Surface energy as a function of plasma treatment duration.
Coatings 15 00411 g008
Figure 9. FTIR spectra obtained from the different PU/GO coatings.
Coatings 15 00411 g009
Figure 10. Diffraction patterns of graphene oxide before and after plasma treatment.
Coatings 15 00411 g010
Figure 11. Crystal structures of graphene oxide and reduced graphene oxide.
Coatings 15 00411 g011
Figure 12. Adhesion tests on the different coatings as a function of treatment time.
Coatings 15 00411 g012
Table 1. Relationships of the intensities of the main GO bands before and after plasma treatment.
Sample I D I G I 2 D I D / I G I 2 D / I G
GO without treatment0.390.700.140.550.20
GO plasma 6 min1.721.660.751.040.45
GO plasma 10 min1.851.130.341.630.30
GO plasma 15 min0.791.900.390.420.21
Table 2. Information on the crystalline structure of GO before and after plasma treatment.
SampleLa
[nm]
Ld
[nm2]
nd
[nm−2]
GO without treatment166403.33 × 1010
GO plasma 6 min88296.30 × 1010
GO plasma 10 min56239.87 × 1010
GO plasma 15 min217462.54 × 1010
Table 3. Data extracted from the diffraction patterns of graphene oxide before and after plasma treatment.
Sample
[°]
d
[nm]
D
[nm]
Average
[D]
PU/0.2GO_0 min26.400.33916.868.67
16.770.530.499
PU/0.2GO_6 min26.410.33817.118.81
17.360.5120.512
PU/0.2GO_10 min26.400.33920.4410.50
16.991.6380.565
PU/0.2GO_15 min26.350.33917.118.80
17.200.5170.497
Disclaimer/Publisher’s Note: The statements, opinions and data contained in all publications are solely those of the individual author(s) and contributor(s) and not of MDPI and/or the editor(s). MDPI and/or the editor(s) disclaim responsibility for any injury to people or property resulting from any ideas, methods, instructions or products referred to in the content.

