Article

Microstructure Evolution Mechanism and Corrosion Resistance of FeCrNi(AlTi)x Medium Entropy Alloy Prepared by Laser Melting Deposition with Al and Ti Content Changes

1
Guangdong Provincial Key Laboratory of Industrial Intelligent Inspection Technology, School of Electromechanical Engineering and Automation, Foshan University, Foshan 528225, China
2
Datang Boiler and Pressure Vessel Inspection Center Co., Ltd., Hefei 231200, China
*
Author to whom correspondence should be addressed.
Coatings 2025, 15(7), 851; https://doi.org/10.3390/coatings15070851
Submission received: 20 June 2025 / Revised: 16 July 2025 / Accepted: 17 July 2025 / Published: 19 July 2025

Abstract

In order to improve the microstructure and corrosion resistance of entropy alloy in the FeCrNi system, laser melting deposition technology was used as a preparation method to study the effects of different contents of Al and Ti on the microstructure and corrosion resistance of entropy alloy in FeCrNi(AlTi)x (x = 0.17, 0.2, and 0.24). The results show that the addition of Al and Ti elements can change the phase structure of the alloy from a single FCC phase structure to an FCC + BCC biphase structure. The BCC phase volume fraction of FeCrNi(AlTi)0.2 is the highest among the three alloys, reaching 37.5%. With the addition of Al and Ti content, the grain of the alloy will be refined to a certain extent. In addition, the dual-phase structure will also improve the corrosion resistance of the alloy. In 3.5 wt.% NaCl solution, the increase of Al and Ti content can effectively improve the protection of the passivation film on the surface of the entropy alloy in FeCrNi(AlTi)x, effectively inhibit the large-scale corrosion phenomenon on the alloy surface, and thus improve the corrosion resistance of the alloy. In a certain range, increasing the content of Al and Ti elements in the FeCrNi(AlTi)x system can improve the corrosion resistance of the alloy.

1. Introduction

The multi-component characteristics of high entropy alloy (HEA) and medium entropy alloy (MEA) have opened infinite new directions in the composition design of their related research, which makes them have more unique properties and therefore attract wide attention [1,2,3,4]. Various HEAs and MEAs with single-sided centrocubic (FCC) crystal structures, such as FeCrNi [1], CoCr2FeNiMo [5], Al0.5CoCrCuFeNi [6], Al7(CrMnFeCoNi)93 [7], and FeCoCrNi [8,9], have been widely studied for their excellent corrosion resistance and mechanical properties. However, the corrosion resistance of these alloys cannot fully meet the needs of practical applications. In order to enhance their properties, researchers have developed many methods, such as changing the alloy processing method [10,11], grain refinement [12,13], and changing the ratio of each element of the alloy [14,15,16]. Through research, it is found that the alloy can be transformed from a single-phase structure to a dual-phase eutectic structure by adding other elements or changing the element ratio in the alloy composition [5,6,7].
In recent years, many researchers have studied medium/high entropy alloys manufactured by additive manufacturing (AM) technology [17,18,19]. Laser melting deposition (LMD) is one of the main processing processes of metal additive manufacturing, which uses a high-power laser as its energy source to prepare parts in the form of layer-by-layer stacking [20,21]. This technology has significant advantages in the preparation of multi-component high-entropy alloys. According to the characteristics of different element powders, the powder feeding parameters of each powder barrel can be optimized and coordinated to achieve a high-flux in-situ preparation of high-entropy alloys [22]. In addition, laser melting deposition can also realize the formation of large-sized and composition gradient parts, so LMD is the most mainstream high-entropy alloy additive manufacturing technology.
The phase structure of the entropy alloy in FeCrNi is a single-phase FCC structure [23,24], whose composition is close to that of traditional austenitic stainless steel and other iron-based alloys. Schneider & Laplanche [23] found that after annealing at 1273 K or even higher temperatures, the phase structure of the entropy alloy in FeCrNi is still a single-phase FCC structure. After annealing at low temperature, the microstructure of the two phases is presented, in which FCC is the primary phase and BCC is the secondary phase. Due to phase transformation, twin crystals and stacking faults in the deformation stage, the FeCrNi alloy has good plasticity and strain hardening ability, but its yield strength is low. Wu et al. [25] studied the binary, ternary, and quaternary atomic subsystems of Cantor alloys, focusing on their phase stability after casting and thermal machining. The results show that only two binary systems, five ternary systems and three quaternary systems are single FCC solid solutions under the conditions of casting and homogenization, among which ternary alloys have the highest hardness, which also indicates that the number of alloying elements is not an absolute factor for them to achieve better results in solid solution strengthening of isoatomic alloys. The coordination of elements is more important. This result also confirms that the entropy alloy in FeCrNi can have a good hardening ability, but in terms of strength, researchers have further improved the strength of the entropy alloy in FeCrNi by adding Al and Ti elements. Al and Ti elements have a large gap in atomic radius compared with Fe, Cr and Ni elements, of which Al atom is much smaller than the atomic radius of Ti atom is much larger than the atomic radius of Fe, Cr and Ni, and its fusion will cause large lattice distortion, so as to improve the effect of solid solution strengthening. At the same time, the second term will precipitate to produce the effect of precipitation strengthening [26,27].
In terms of corrosion resistance, under the condition of passivation, adding the Al element to the composition of the alloy can optimize its corrosion resistance [28]. Fu et al. [29] prepared FeCrNi medium entropy alloy by laser powder bed melting and studied its corrosion resistance. By comparing LPBF 316L, they found that LPBF FeCrNi had better corrosion resistance in NaCl solution. The protective Cr-rich passivation film formed on the surface of LPBF FeCrNi has fewer defects and strong self-healing ability, while the high-density grain boundary provides a diffusion channel for Cr, promotes the formation of the passivation film, and improves the corrosion resistance of the alloy. This study also shows that FeCrNi medium entropy alloy processed by additive manufacturing can maintain good corrosion resistance. Luo et al. [30] studied the corrosion resistance of CoCrFeMnNi high entropy alloy with equal atomic ratio by comparing it with 304L stainless steel, and found that compared with HEAs, these atoms had a good ability to form a passivation film during corrosion, but no obvious selective dissolution of metal elements occurred during surface passivation. The content of Cr in the passivation film on HEAs is much lower than that in the passivation film of 304L stainless steel. This discovery shows that mindlessly adding elements to achieve complex element composition does not necessarily make the alloy exhibit better properties in various characteristics, and exploring what proportion of various element compositions can achieve the optimal effect of the required characteristics is the focus of research in various series of high entropy alloys.
Li et al. [31] studied the corrosion resistance of AlxCoCrCuFeNi (x = 0.5, 1, 1.5) high-entropy alloy in 0.5 M NaCl salt solution and 0.5 M H2SO4 weakly acidic solution, and found that the as-cast Al0.5 alloy had a single-phase FCC structure and Al1.0 alloy had a single-phase BCC structure. Al1.5 alloy is composed of FCC and BCC biphase structure; in salt solution, the corrosion current density of Al0.5 and Al1.0 alloy is higher than that of Al1.5 alloy. Therefore, Li et al. believe that BCC is more corrosion resistant than the FCC phase, and the reduction of local corrosion resistance of Al1.5 is caused by the local microcell formed by the FCC + BCC biphase structure. Kao et al. [32] studied the effect of adding Al element to AlxCoCrFeNi (x = 0, 0.25, 0.5, 1) high-entropy alloy on the corrosion resistance of the alloy in weak acid solution containing Cl ion. In an acidic environment, a selective corrosion of the BCC phase enriched with Al-Ni was found. This indicates that the addition of Al can promote the heterogeneous multiphase microstructure composed of FCC and ordered/disordered BCC phases [33], which can effectively improve the corrosion resistance of the alloy. However, most of the above studies contain a high concentration of Co element, and the price of Co element is more expensive than other alloying elements, which makes the alloy obtained by research difficult to be widely used in engineering practice. In addition, the strong induced radioactivity of Co and its high neutron absorption cross section (37.18b) also limit its application in the nuclear field [34].
In view of the above, this paper designed and manufactured a FeCrNi(AlTi)x mesentropy alloy for Marine corrosion resistance equipment materials by taking FeCrNi mesentropy alloy with equal atomic ratio FeCrNi in single-phase FCC structure by eliminating the expensive and radioactive Co element; and adding Al and Ti elements with atomic content of 0.17, 0.2, and 0.24 mol.%, respectively, we precisely controlled the dual-phase ratio through Al/Ti content. LMD technology was used to study the influence of Al and Ti elements on the microstructure and corrosion resistance of FeCrNi entropy alloy, and the related strengthening mechanism and deformation mechanism. Adjusting the microstructure and properties of Fe-Cr-Ni alloys by changing the content of Al and Ti elements is of great significance for developing medium/high entropy alloys with excellent comprehensive properties.

2. Experimental

In this experiment, Fe, Cr, Ni, Ti, and Al elemental metal particles with a purity greater than 99.9% were selected as raw materials for processing, and the ingredients were mixed according to the atomic fraction ratio. The composition ratio is shown in Table 1. FeCrNi(AlTi)x (where x = 0, 0.17, 0.2, 0.24 mol.%) alloy ingot was prepared by Laser Metal Deposition (LMD) technology. The relevant printing parameters are shown in Table 2. After natural cooling, the alloy ingots are cut into tensile samples and cuboid metallographic samples of 10 mm × 10 mm × 8 mm in size. In this paper, as-cast samples are labeled as FeCrNi, AlTi0.17, AlTi0.2, and AlTi0.24, respectively.
All samples will be ground with 250# to 5000# sandpaper and then polished with 5 μm and 0.5 μm diamond polish prior to microcharacterization and electrochemical corrosion experiments.
The phase structure of the cast and homogenized samples was characterized by Bruker’s D8 Discover high-resolution X-ray diffractometer (XRD, D8 Discover, Bruker AXS GmbH, Karlsruhe, Germany) with a scanning velocity of 3.6°/min and a 2θ range of 30° to 100°.
The morphology of the sample was observed using a field emission electron microscope (Thermo Fisher Quatro S, Noran System 7, Waltham, MA, USA) equipped with an energy dispersive spectrometer (EDS), and after ion polishing of the sample surface by an ion beam polisher (Fischione 1061, Fischione Instruments, Inc., Export, PA, USA). The grain size, shape distribution, and phase Angle of the alloy samples were analyzed by the same equipment equipped with electron backscatter diffraction (EBSD) technology.
The corrosion resistance of the alloy was tested in 3.5 wt.%NaCl solution. One surface of the test sample was polished with sandpaper, then embedded in a resin model with an outer diameter of 30 mm, then washed with ethanol and deionized water in turn, and left in the air for about 24 h. The other side was connected with copper wires using double-sided conductive tape. The scanning electrochemical microscope Versa SCAN device, Versa STAT 3F, and Versa STAT 3 (AMETEK Scientific Instruments, Berwyn, IL, USA) were used as two potentiostat devices for testing. A three-electrode system was used: a working electrode to test the sample, electrode to a platinum needle, and a reference electrode to a saturated Al/AgCl electrode. The sample was immersed in a 3.5 wt.%NaCl solution for about 3600 s to ensure that the electrochemical surface was in a stable state was obtained before subsequent testing. The most advanced is the electrochemical impedance spectroscopy test, which tests the frequency range of 106–10−2 Hz, and the voltage change amplitude of 20 mV. After the impedance spectrum test, the potentiodynamic polarization test of the sample is carried out. The initial potential is 0.3 V below the open potential, and the potential rises at a rate of 1 mV/s until the termination potential is reached, that is, 2.0 V above the open potential. At least three electrochemical tests were carried out for each alloy component to ensure that the experimental data were non-accidental and reproducible. After the electrochemical test was completed, the morphology, distribution, and quantity of pitting on the surface of the alloy samples were observed by the above scanning electron microscope, and the changes of elements in the pitting pit and the surrounding non-corroded surface were analyzed by EDS line scanning.

3. Results and Discussion

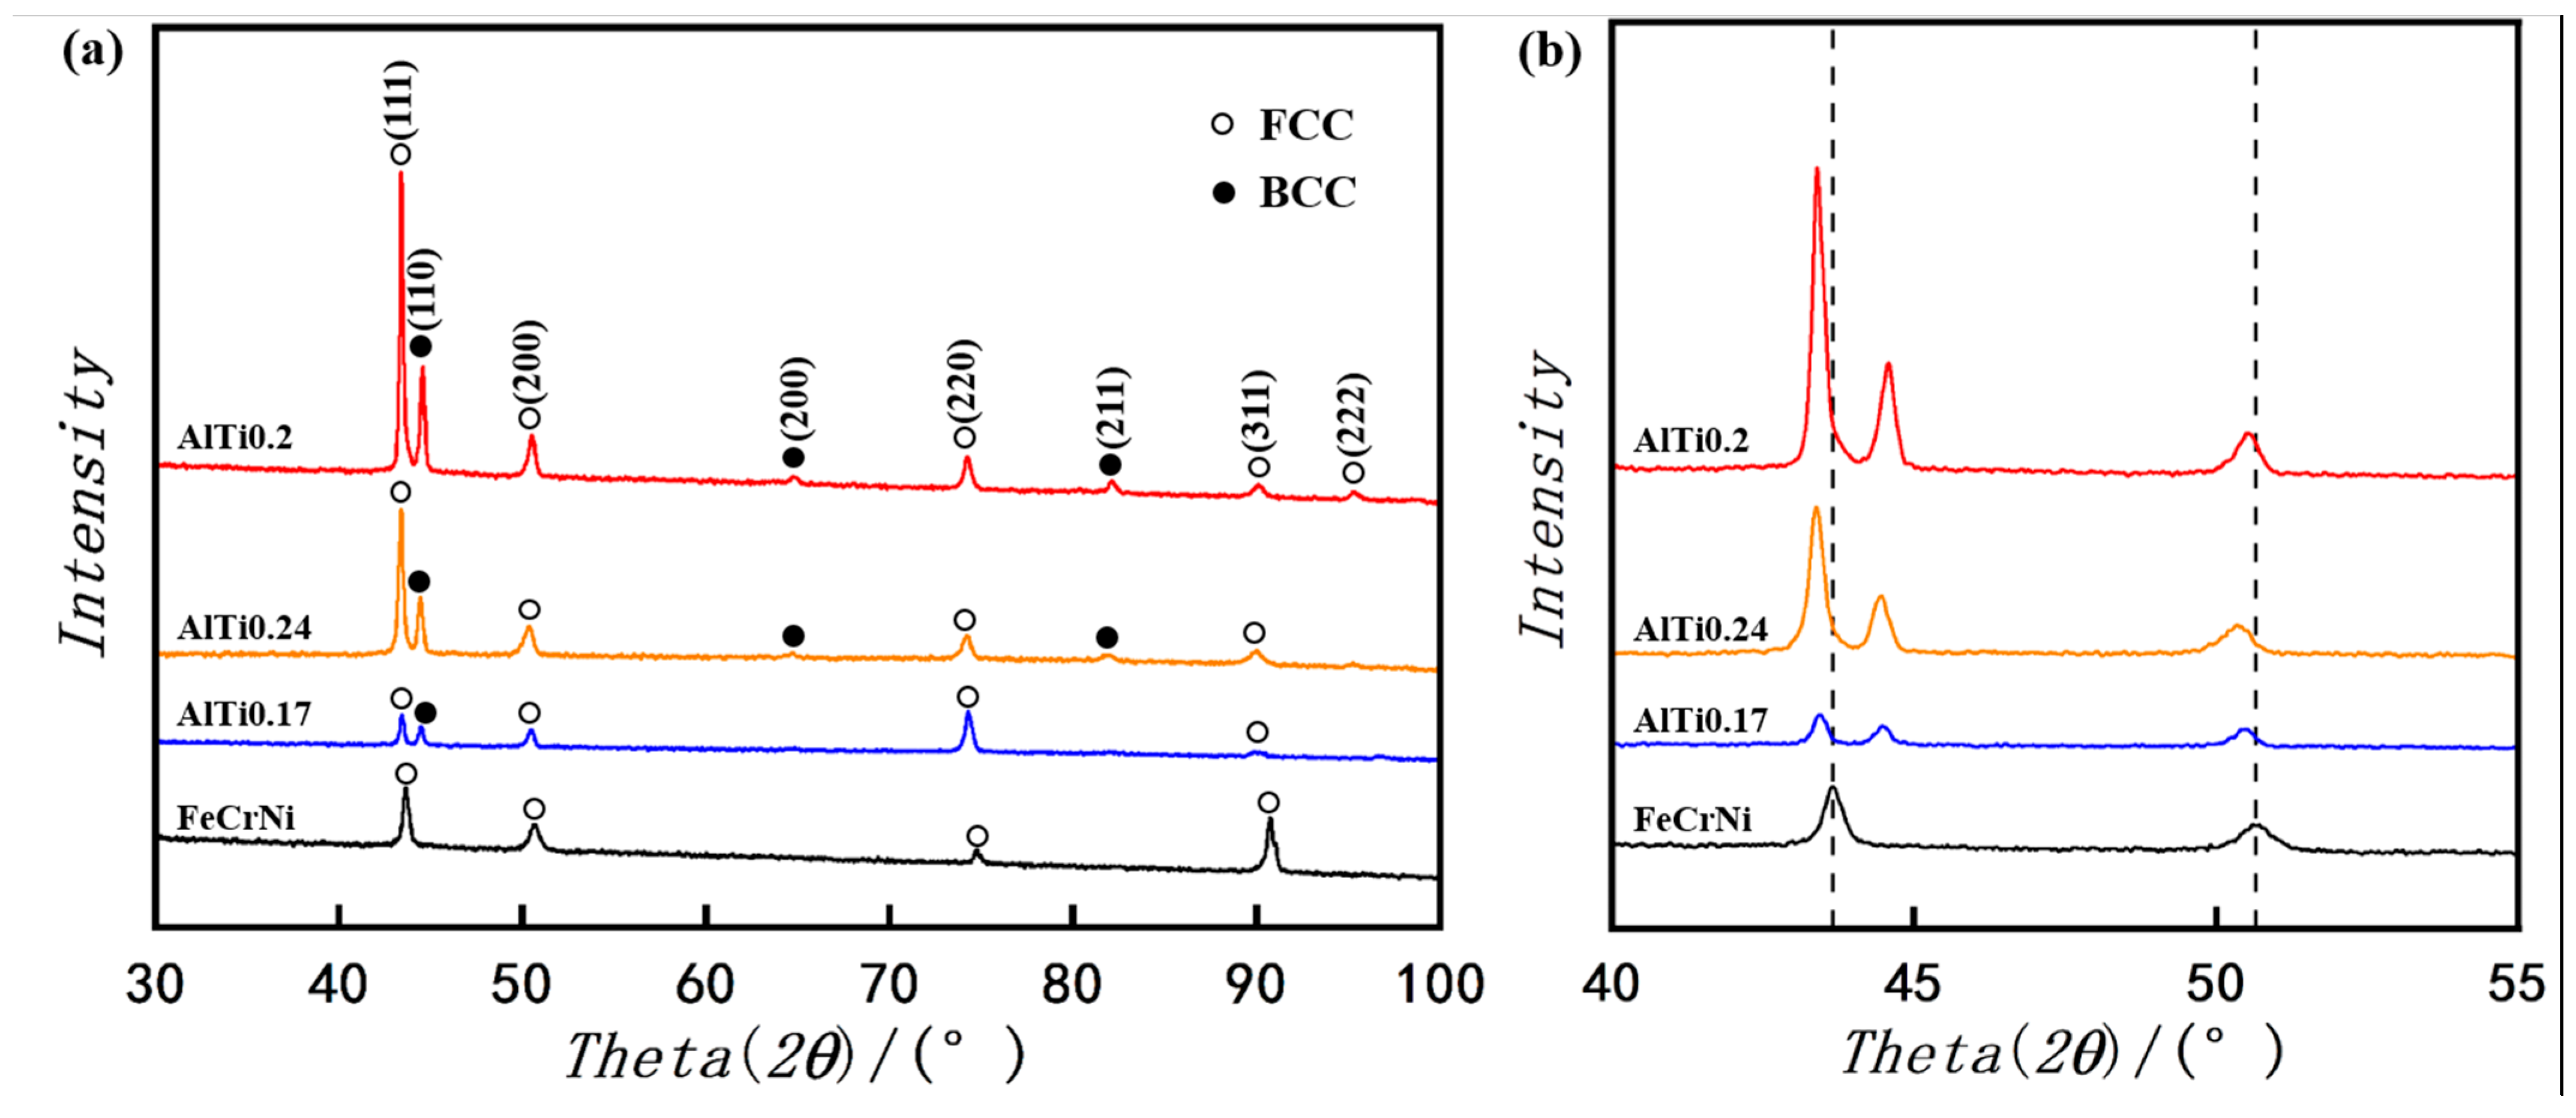
3.1. Phase Identification

The XRD pattern of FeCrNi(AlTi)x medium-entropy alloy is shown in Figure 1. The FeCrNi alloy is an FCC single-phase structure. According to the XRD pattern, when x = 0.17, the (110) diffraction peak of BCC phase has appeared in the pattern of AlTi0.17 sample, and in the FCC diffraction peak, except (200), the other diffraction peaks have a phenomenon of intensity decline, which is sufficient to indicate that the addition of Al and Ti elements can transform the alloy into FCC + BCC biphase structure. When the content of Al and Ti elements reaches x = 0.2, the intensity of the (110) diffraction peak of the BCC phase increases significantly, and (200) and (211) diffraction peaks of the BCC phase appear, although the intensity of the diffraction peaks is not large. In the diffraction peak of the FCC phase, except for the phenomenon that the intensity of the high-angle (311) diffraction peak is weakened, the other diffraction peaks are strengthened, and the higher-angle FCC phase (222) diffraction peak appears. When the content of Al and Ti elements is increased to x = 0.24, the intensity of each diffraction peak decreases compared with that of 0.2 content, and the intensity of the (220) diffraction peak is even lower than that of the AlTi0.17 alloy, and the diffraction peak of high-angle (222) also disappears. It can be seen that blindly adding Al and Ti elements cannot gradually enhance the diffraction peak of BCC, and adjusting the content of Al and Ti elements to achieve the optimal state of alloy phase composition is the key to meeting the practical application.
At the same time, the lattice parameters were calculated based on the positions of the FCC diffraction peaks. The lattice parameters of the FCC phases in the FeCrNi, AlTi0.17, AlTi0.2, and AlTi0.24 alloys were 3.59 Å, 3.608 Å, 3.609 Å, and 3.613 Å, respectively. By comparing the data, it can be found that the spectra of the samples with Al and Ti elements are shifted to lower angles compared with the spectra of FeCrNi alloy samples, as shown in Figure 1b This shift occurs because Ti, which has a larger atomic radius (176 pm), and Al, which has a relatively smaller atomic radius (118 pm), were added. The atomic radii of Fe, Cr, and Ni are 156 pm, 166 pm, and 149 pm, respectively. The significant difference in atomic radii leads to irregular atomic arrangements within the crystal structure, causing lattice expansion and distortion. This also results in an increase in the lattice parameter [35], consequently causing the diffraction peaks to shift towards lower angles. Subsequent experiments revealed that this change also brings about certain alterations in the corrosion resistance of the alloy.

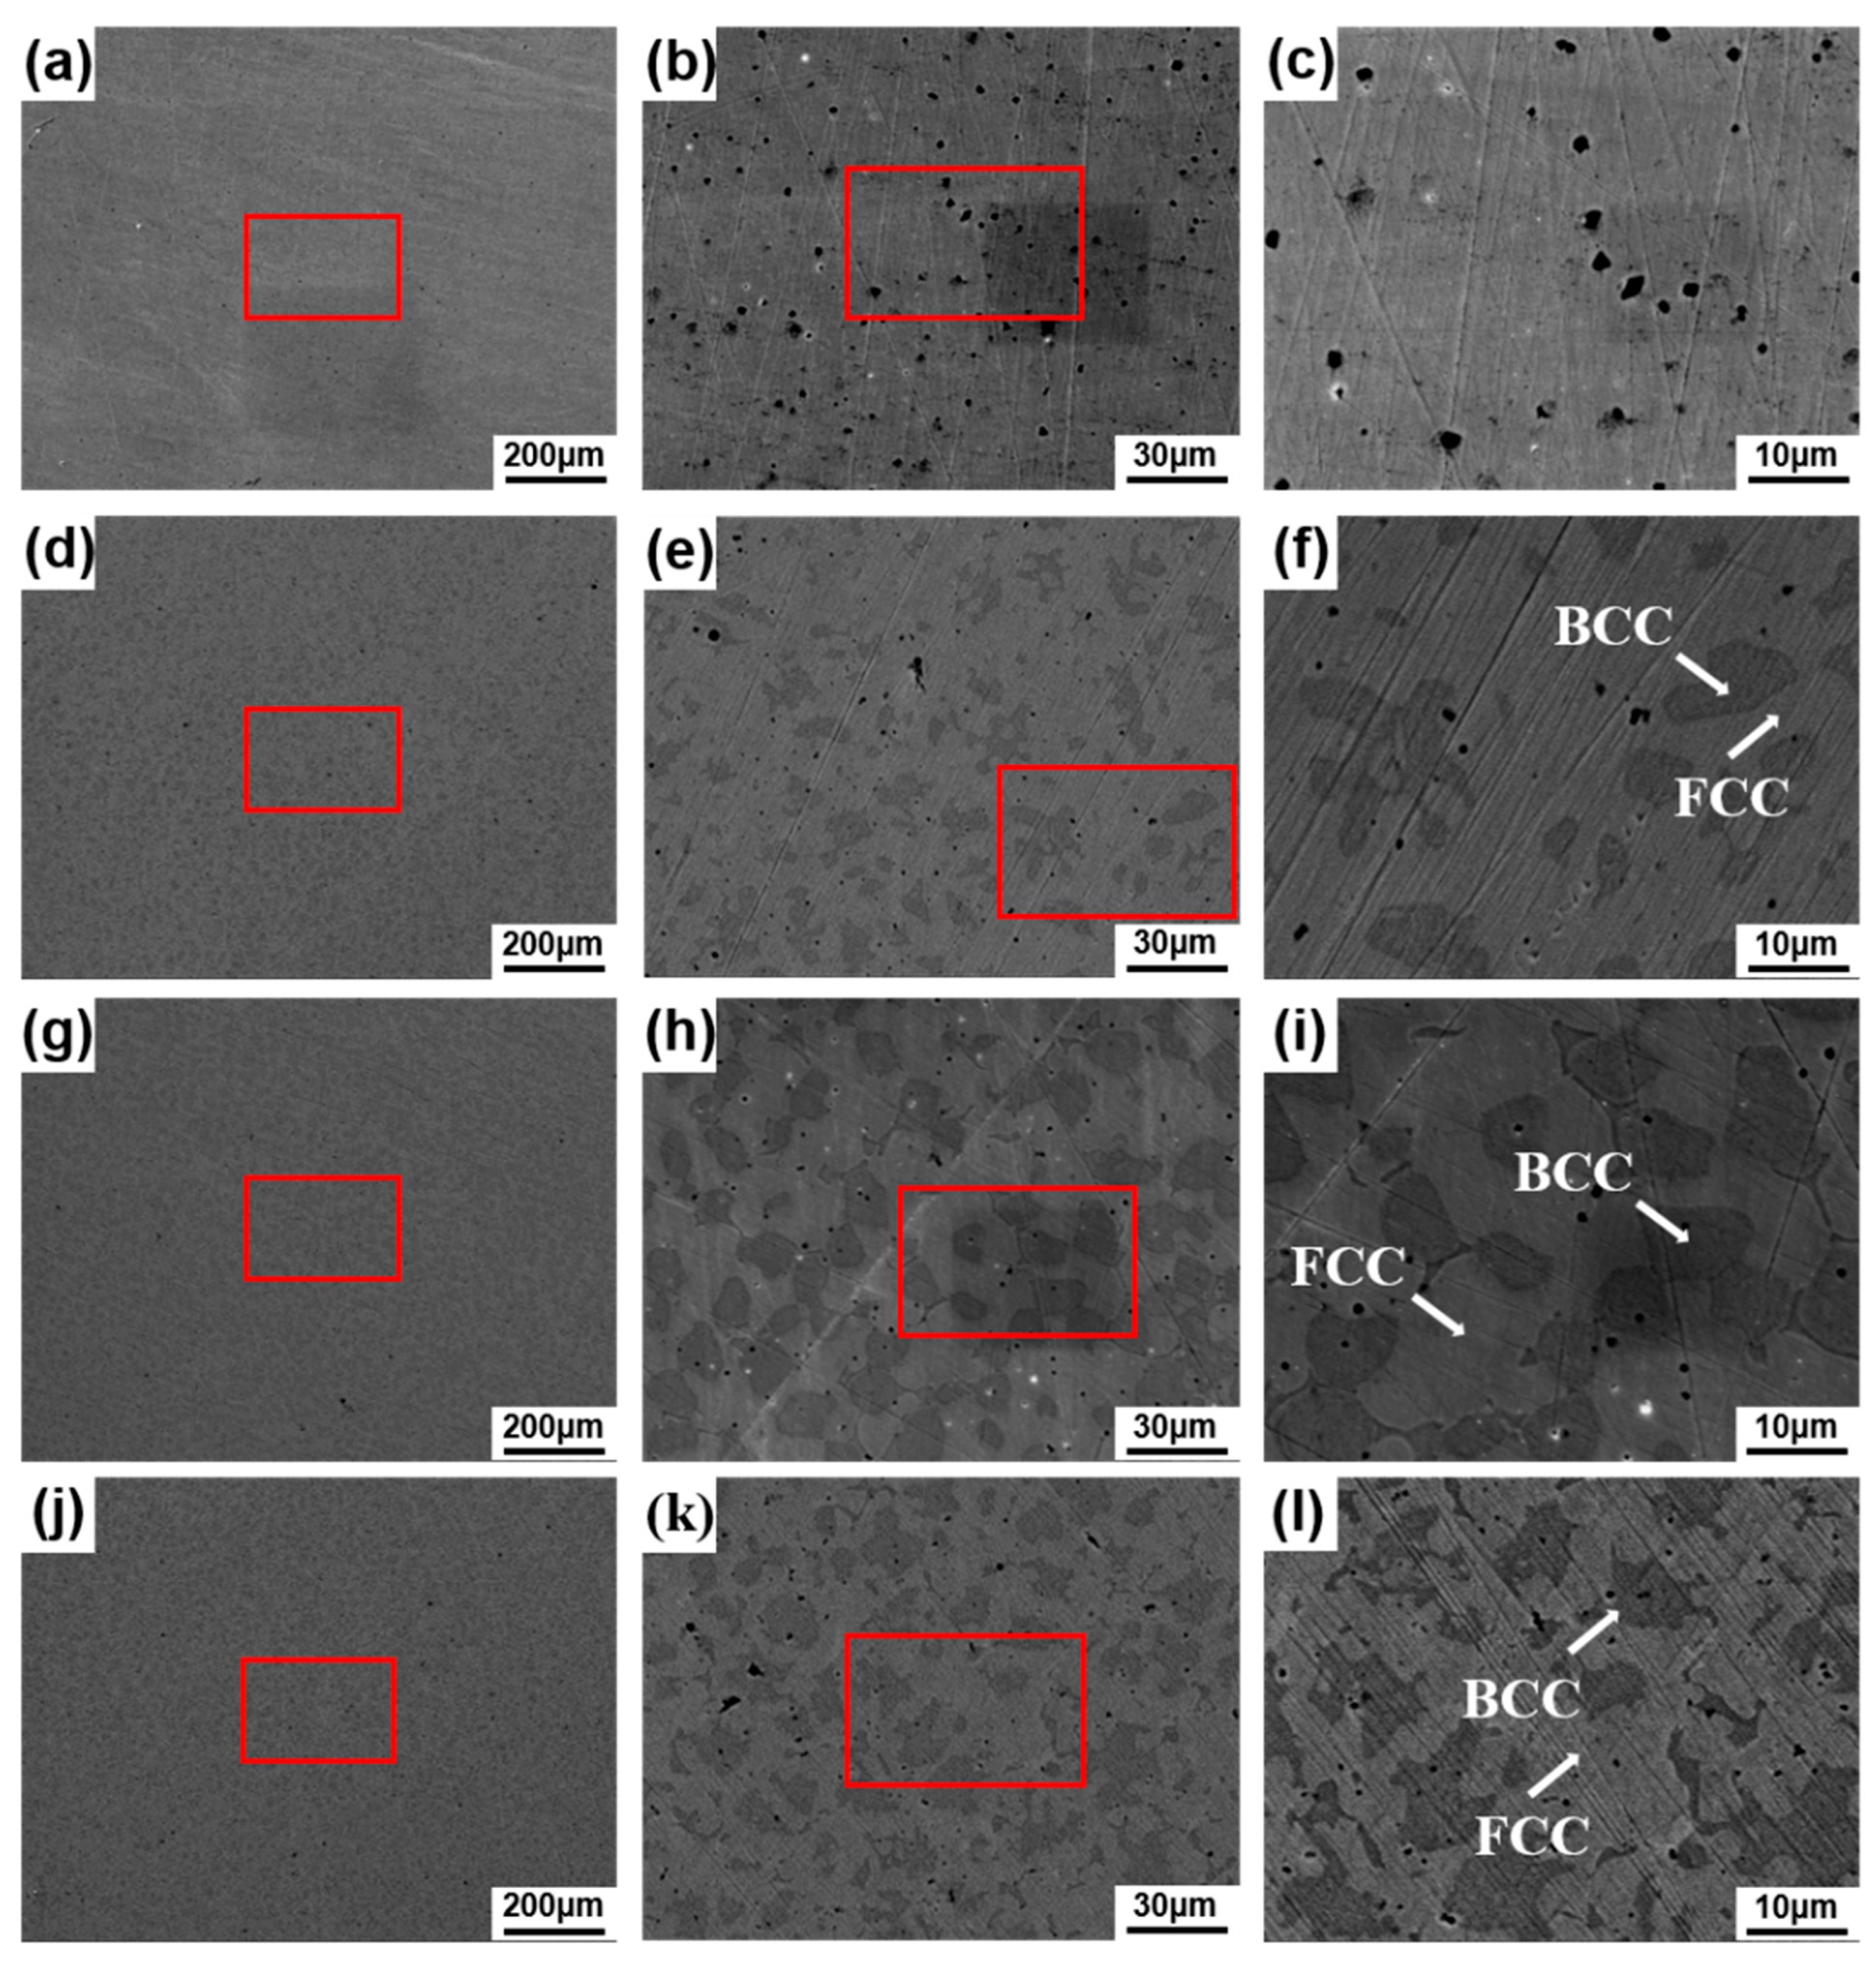
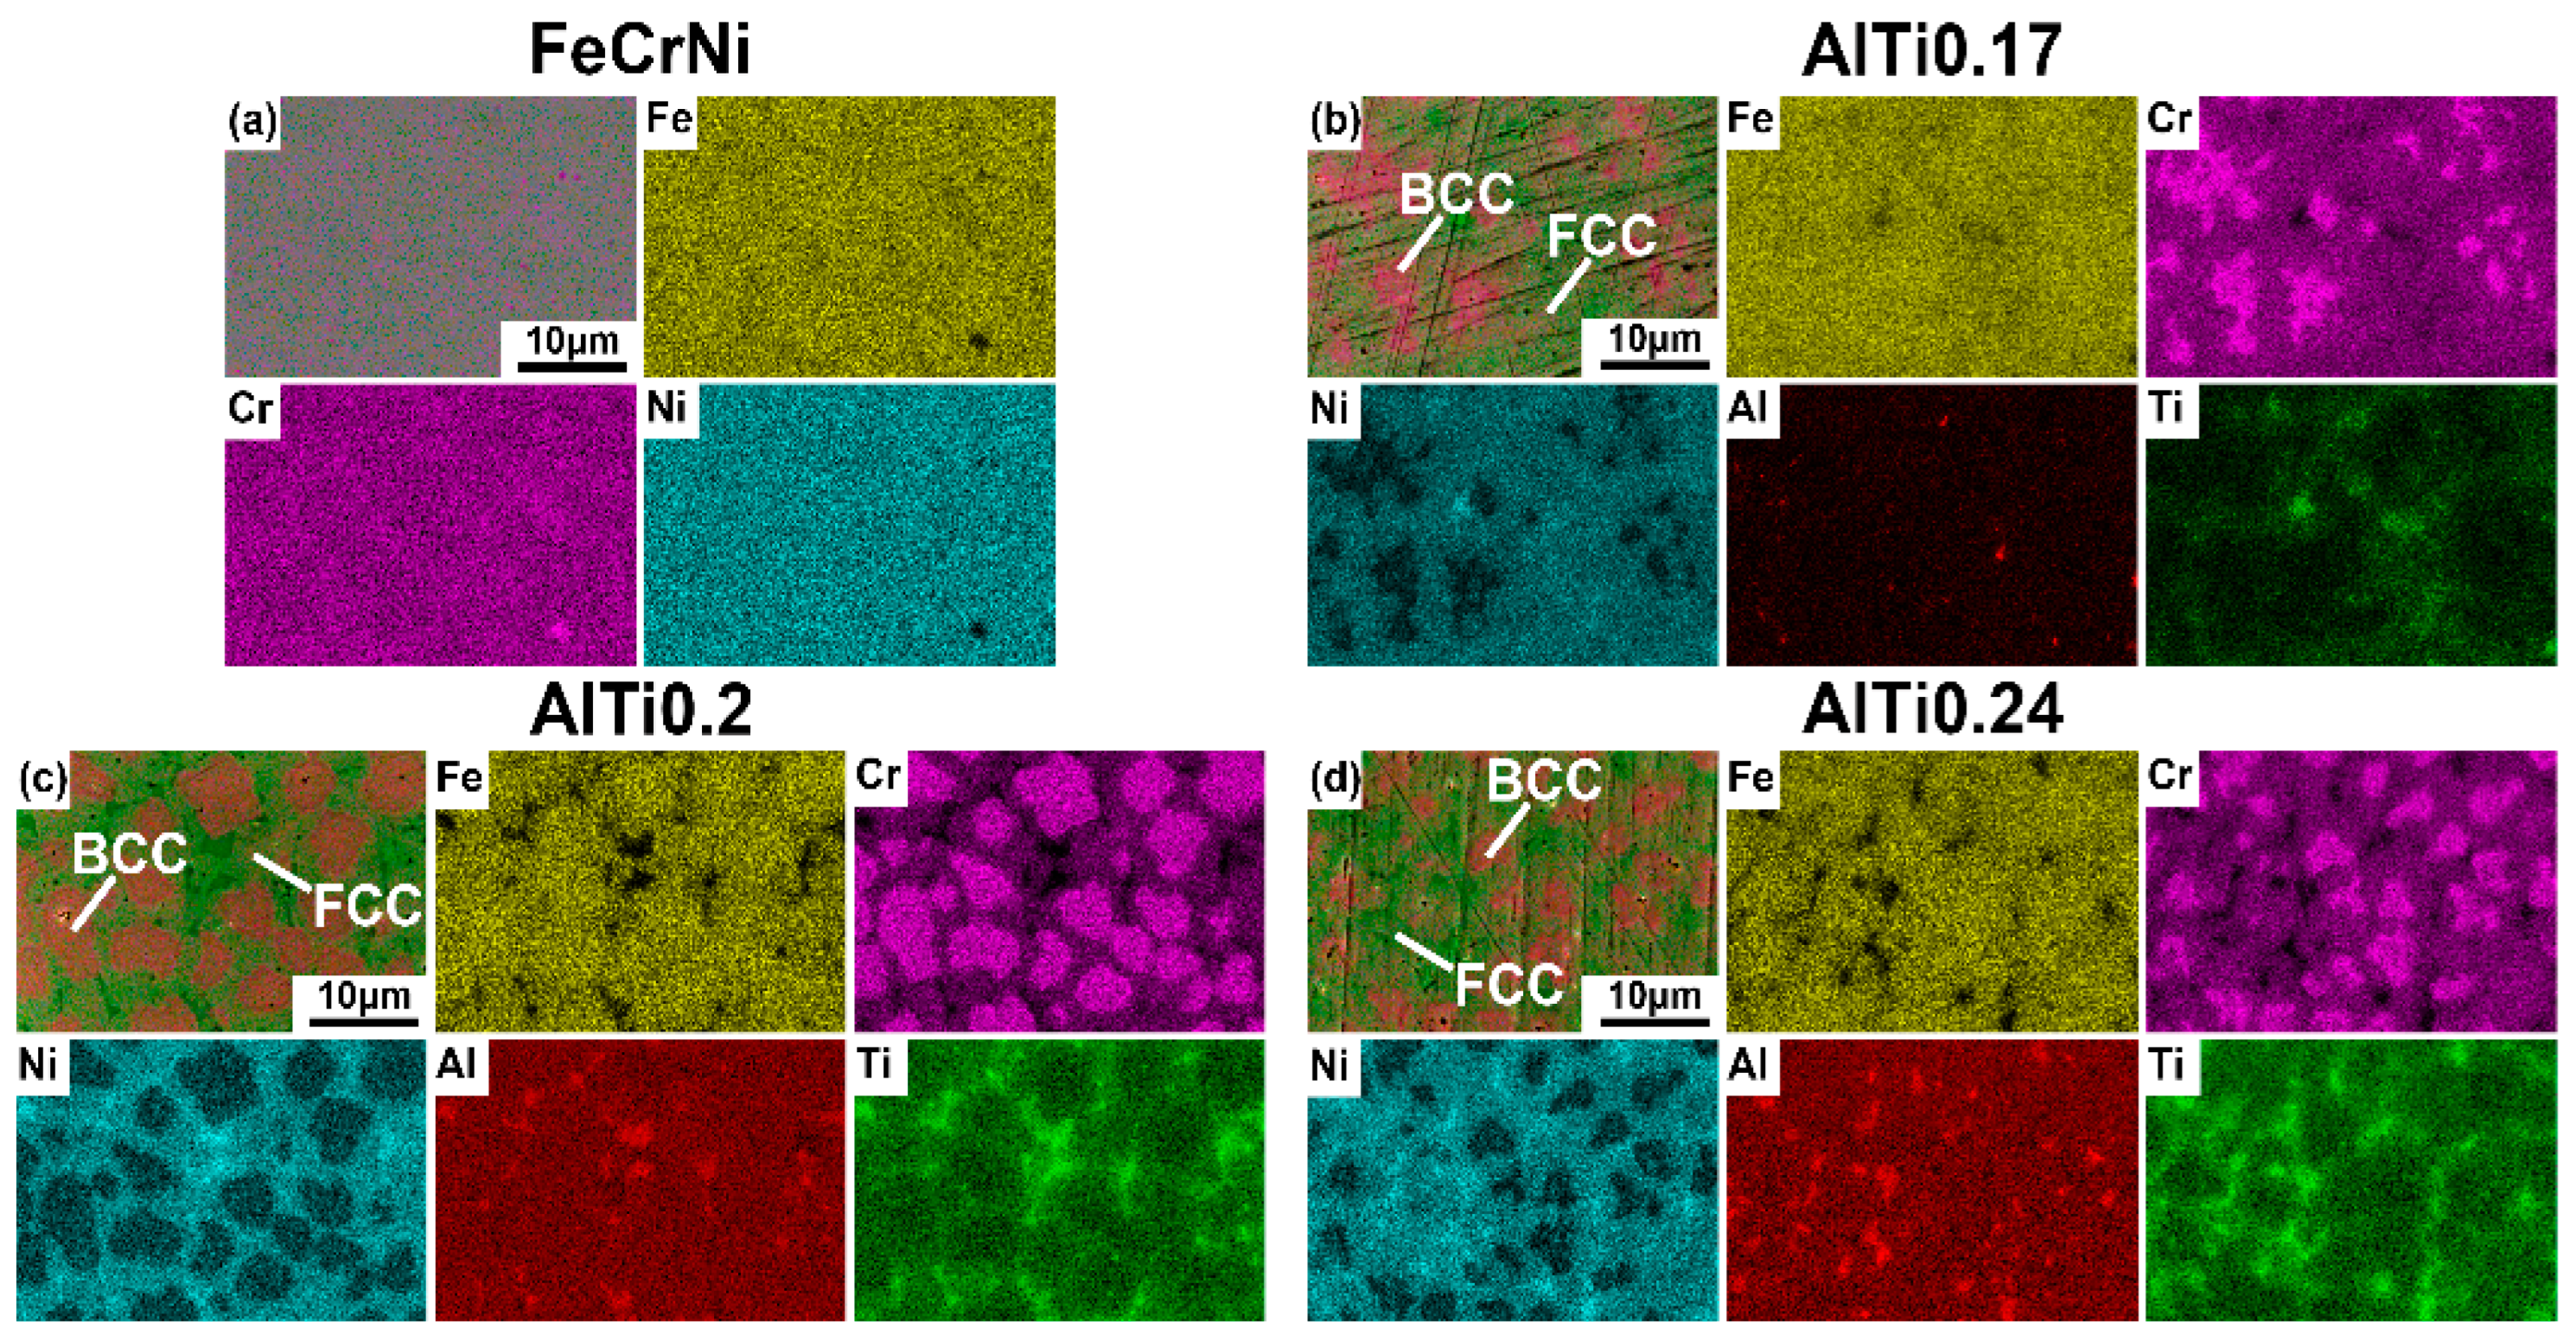
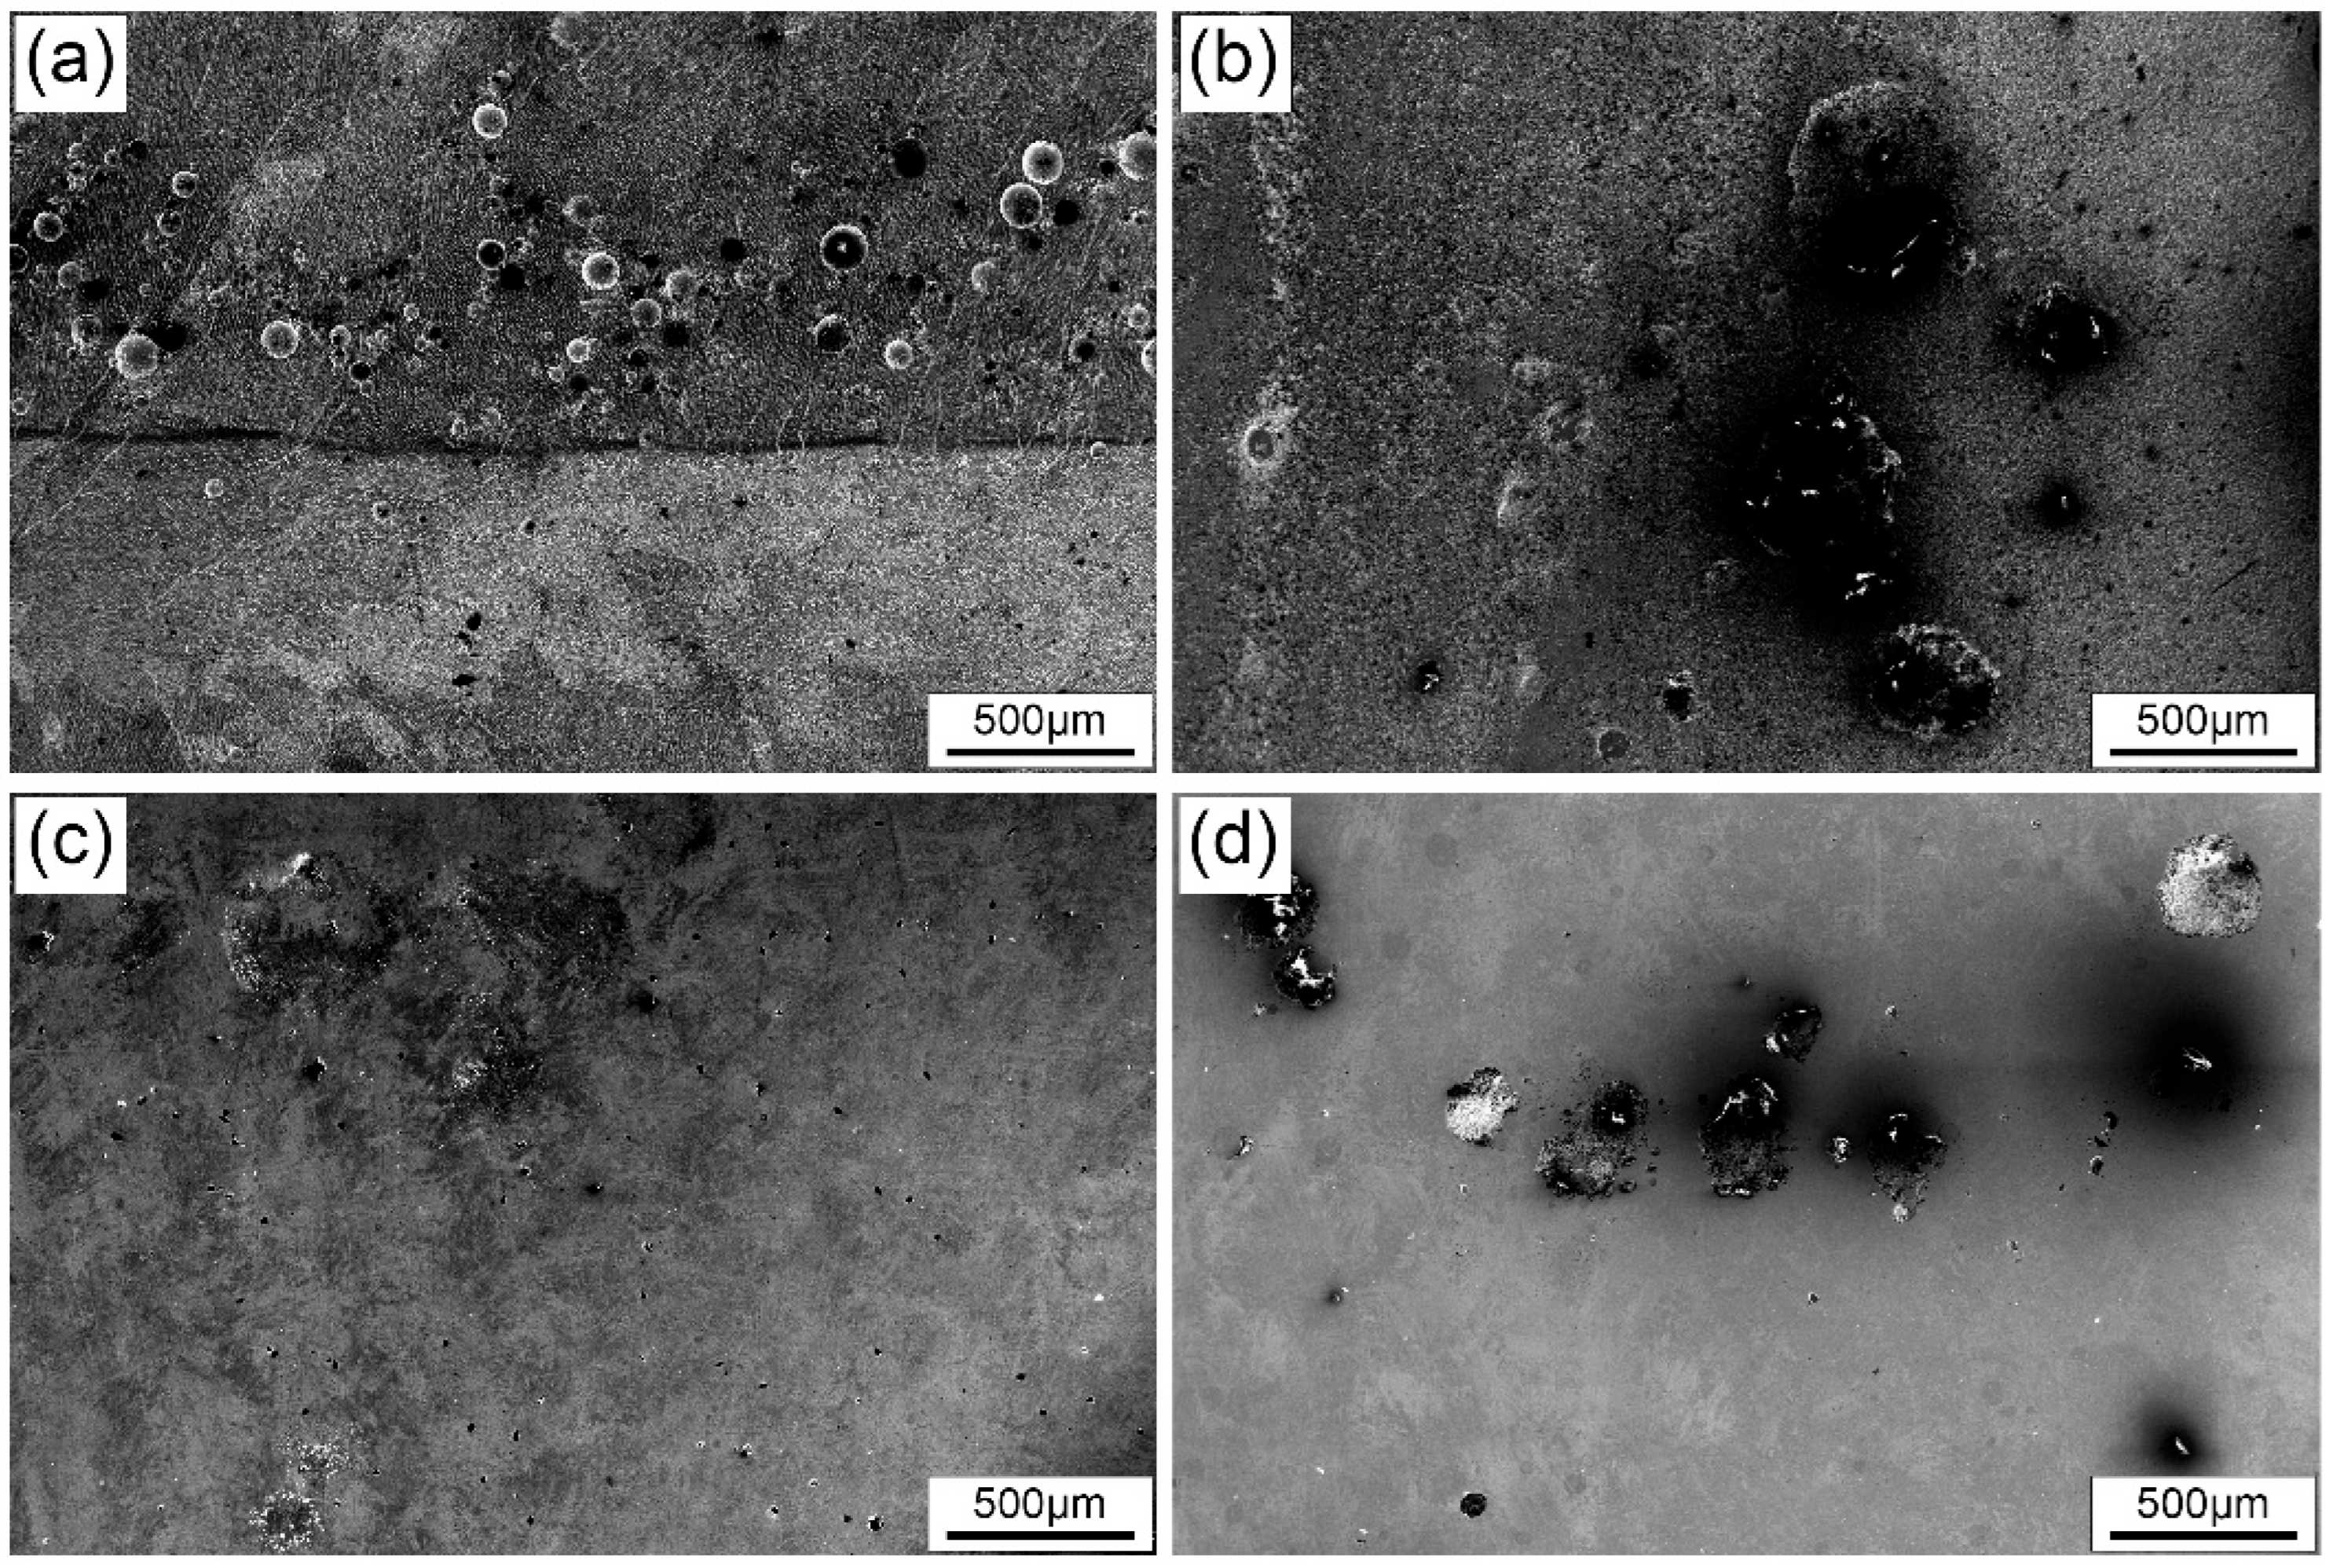
3.2. Surface Morphology and Energy Spectrum Analysis of Alloys

Figure 2 and Figure 3 show the SEM morphology of FeCrNi(AlTi)x medium-entropy alloy and the EDS element plane map, respectively. At the scale of 200 μm, that is, Figure 2a,d,g,j the difference between FeCrNi and other three alloys with Al and Ti elements added can be compared from the surface morphology of the alloy; When the scale of 30 μm is reached, as shown in Figure 2b,e,h,k it can be seen that there are obvious contrast differences on the surface of other alloys except FeCrNi alloy, while the surface of FeCrNi alloy only has pores and polished scratches. A small amount of randomly distributed dark gray precipitated BCC phase can be seen in the FCC phase of light gray matrix on the surface of the AlTi0.17 alloy. With the increase of Al and Ti elements, the content of dark gray precipitated BCC phase on the surface of AlTi0.2 and AlTi0.24 alloy is significantly increased, and its density is larger than that of AlTi0.17 alloy, and the entire alloy surface presents FCC + BCC biphase alternating layer structure. This phenomenon may be because the addition of Al and Ti elements promoted the precipitation of the BCC phase and changed the phase composition and microstructure of the alloy, which is also consistent with the results of the XRD pattern. When the magnification reaches 10 μm, as shown in Figure 2c,f,i,l the BCC phase on the surface of AlTi0.24 alloy with higher content of Al and Ti elements begins to appear branching and dendritic structure, which is similar to the aggregate structure, which is a special form of dendrite structure, indicating the existence of element segregation in the alloy. In other words, during the solidification process, the composition of the alloy is different in the dendrite and interdendrite regions, and the region with brighter contrast is the dendrite region, while the part with darker contrast is the interdendrite region. In general, the dendrite region has a high concentration of elements, while the interdendrite region may enrich other elements or show a low alloy composition, and whether the appearance of this structure is the reason for the weakening of the intensity of each diffraction peak needs to be verified with EBSD results.
According to EDS component surface scanning distribution (Figure 3) and EDS two-phase chemical composition analysis results (Table 3), it can be seen that the Fe in the BCC phase of AlTi0.17, 0.2, and 0.24 alloys is 32.4 ± 0.3 at.%, 35.1 ± 0.3 at.% and 30.7 ± 0.3 at.%, respectively, and the enrichment of the Cr element is more significant. They were 34.3 ± 0.3 at.%, 35.7 ± 0.3 at.% and 41.5 ± 0.3 at.%, respectively. The enrichment of Fe and Cr elements in the BCC phase, and the accumulation of Ni elements in the FCC phase, which indicates that the high content of Cr and Fe is conducive to the formation of disordered BCC structural phase, and the addition of Al and Ti elements promotes the enrichment of Fe and Cr elements, resulting in the formation of FCC+BCC biphase structure.
Based on the above research, it can be found that the entropy alloy in FeCrNi(AlTi)x changes from FCC single-phase structure to FCC + BCC biphase structure with the increase of Al and Ti content. The electronegativity difference (∆χ) between alloying elements is one of the important factors affecting the phase stability in the alloy, that is, the larger the ∆χ between alloying elements, the more likely the element with higher electronegativity is to lose its extranuclear electrons, while the element with higher electronegativity is more likely to get electrons, thus forming an intermetallic compound in the alloy [36,37]. The calculation formula for ∆χ of high entropy alloy is as follows [37]:
Δ χ = i 1 N c i χ i χ 2
where ci is the atomic fraction of the i-th element in the alloy; χ’ is the Pauling electronegativity of the i-th element in the alloy. χ’ is the average Pauling electronegativity of all alloying elements, which is calculated using the weighted average, with the weight being the atomic fraction. It can be seen that when the Al and Ti contents x of the entropy alloy in FeCrNi(AlTi)x = 0, 0.17, 0.2, 0.24, the ∆χ value is 0.1039, 0.1202, 0.1227, and 0.1302, respectively. It can be seen from the calculation results that with the increase of Al and Ti elements content, the electronegativity difference ∆χ among elements in FeCrNi(AlTi)x entropy alloy increases. This is because Al and Ti have a large electronegativity difference compared with Fe and Ni elements, and the elements in the alloy form a strong chemical bond or have a tendency to ionize, thus causing some elements to gather. The formation of phase transformation and the uneven distribution of the internal phase of the alloy are the reasons for promoting the phase precipitation of the intermetallic compound BCC in the alloy, so that the alloy changes from a single phase to a biphasic structure after adding Al and Ti elements. This change will also affect the corrosion resistance of the alloy; the increase in poor electronegativity will cause some metals to form an uneven oxide film on the alloy surface, resulting in a local electrochemical corrosion phenomenon on the alloy surface, and then affect the corrosion resistance of the alloy.

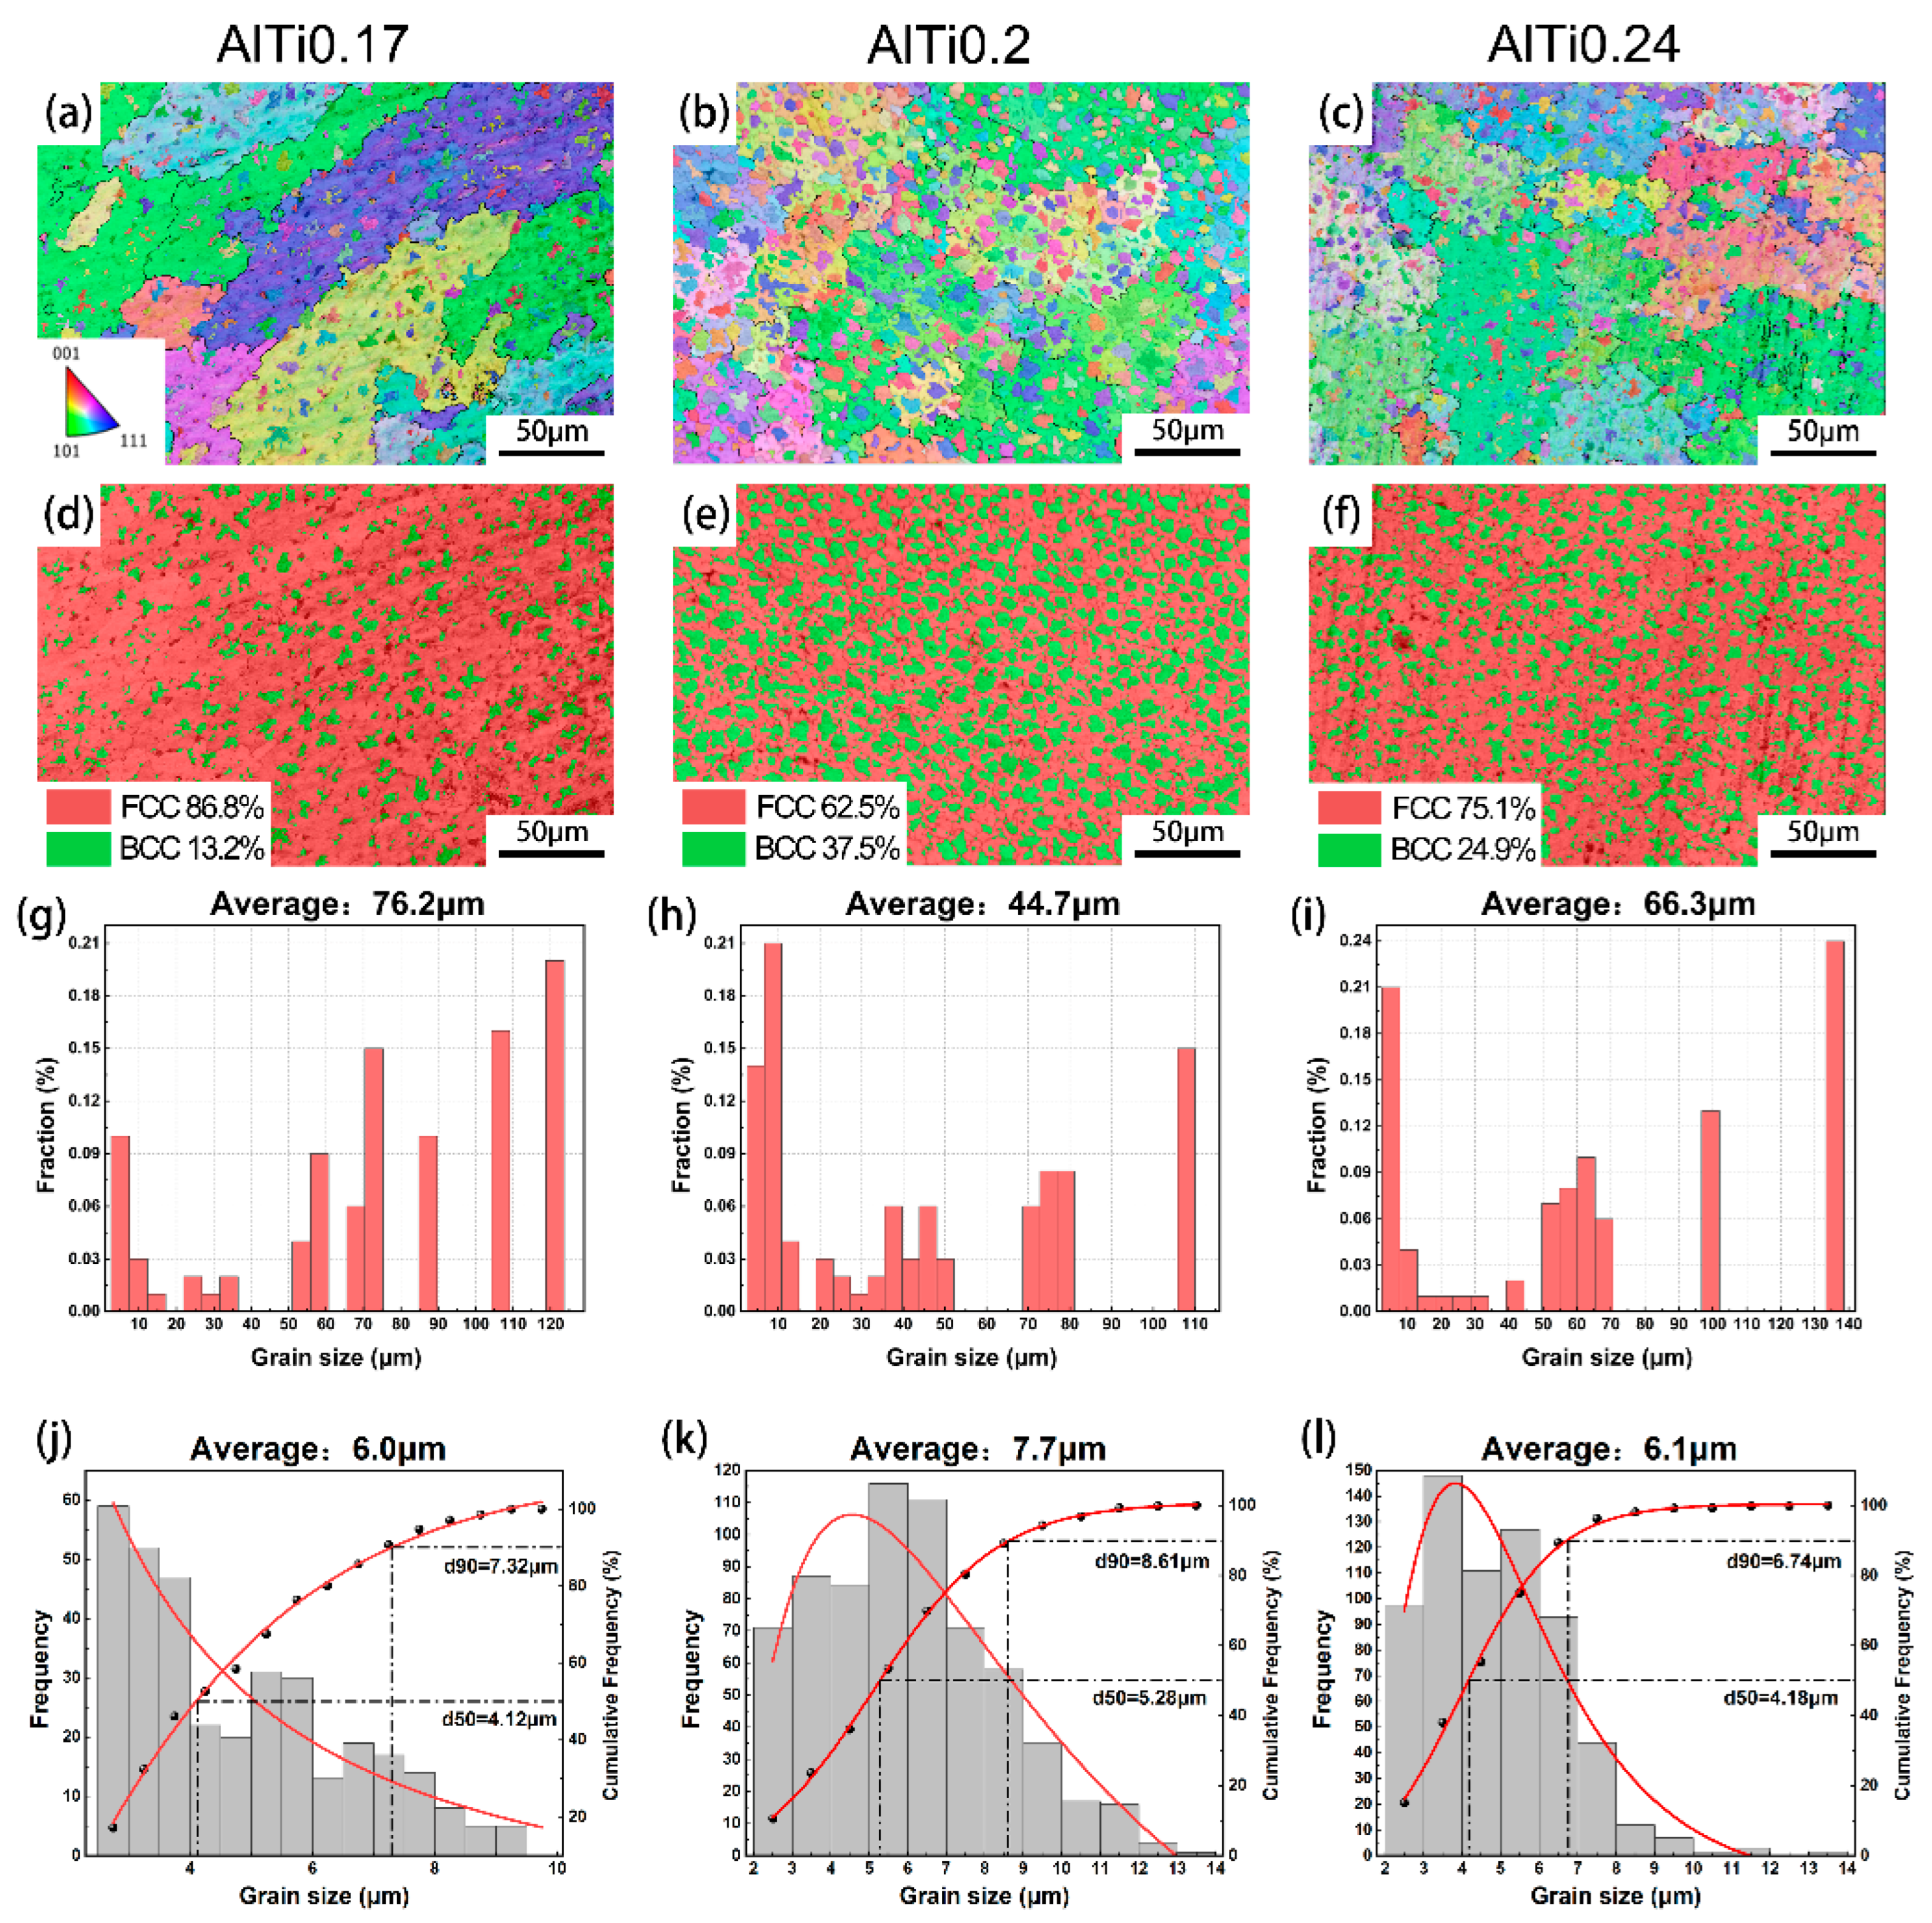
3.3. Microstructure Analysis

In order to further analyze the microstructure, electron back-scattering diffraction (EBSD) was used to analyze the grain morphology, size, and distribution of the alloy. Figure 4 shows the EBSD inverse pole diagram, phase distribution diagram, and grain size distribution results of three alloys with different Al and Ti contents. The inverse pole diagram (IPF) in Figure 4a–c shows that the grain size of the FCC phase in AlTi0.17 is large and the grain shape is columnar, while the grain size of the BCC phase is small and the shape is different. The FCC phase grain size of AlTi0.2 and AlTi0.24 is smaller than that of AlTi0.17, and the grain morphology is finer and more irregular, and more inclined to equiaxial crystal morphology, which is because the increase of Al content increases the cooling rate of the molten pool, resulting in grain refinement [38,39]. When the content of Al and Ti is 0.2, the grain of the BCC phase is more uniform; in contrast, the grain of the BCC phase of AlTi0.24 also shows an irregular shape. The three alloys with different compositions all show a biphase structure of BCC and FCC, which is consistent with the results of XRD pattern analysis, and the inverse pole diagram shows that the BCC phase is dispersed in the FCC matrix. Combined with the EDS analysis in Figure 3, it can be seen that BCC phases are formed in the enrichment areas of Al, Ti, and Cr elements. Therefore, the addition of Al and Ti elements can transform FeCrNi alloy from a single FCC phase structure to FCC + BCC biphase structure, and the formation of this biphase structure is related to cooling rate and solid phase transition [27,40]. It can be seen more clearly from the phase distribution diagram in Figure 4d–f that the BCC phase is randomly distributed in the FCC matrix. With the increase of the content of Al and Ti, the content of the BCC phase in the alloy changes in a normal distribution. At AlTi0.2, the BCC phase content reaches 37.5 ± 0.5%, which confirms the analysis results of the XRD pattern. The BCC phase shows strong diffraction peaks in AlTi0.2.
Figure 4g–i shows the overall grain size distribution diagram. Due to the large amount of small-sized BCC phase grains precipitation, the average grains of AlTi0.2 and AlTi0.24 decrease. However, it can be seen from the grain distribution histogram that when the content of Al and Ti is 0.2, the maximum grain size is only 110 μm, and the proportion is 15%. Compared with AlTi0.17, it can be seen that the grains of the FCC phase are refined and the size distribution is more uniform. Compared with the grain size distribution diagram of the BCC phase (Figure 4j–l), it can be seen that the fitting curve of the grain size distribution of the BCC phase in the alloy changes from the inverse function image to the open downward quadratic function image with the increase of Al and Ti content in the alloy. According to the data, the average grain size of the BCC phase is a minimum of 6.0 μm of AlTi0.17 alloy, but it can be seen from the distribution diagram that AlTi0.17 alloy has more grains of 1–2 μm size, making its average grain size small. Compared with AlTi0.2 and AlTi0.24 alloys, it can be found that the minimum grains are greater than 2 μm. It can be seen from Figure 4k,l that 50% of the grain size of BCC of AlTi0.2 is less than 5.28 μm, and 90% is less than 8.61 μm; 50% of the BCC grain size of AlTi0.24 is below 4.18 μm, and 90% of the grain size is less than 6.74 μm, which indicates that the increase of Al and Ti content can refine the BCC grain size to a certain extent. However, according to the phase distribution diagram and XRD pattern, an excessive addition of Al and Ti elements will lead to a decrease in the precipitation of the BCC phase.
Figure 5 shows the grain orientation deviation results of the three alloys. It can be seen that the regions with higher KAM values of AlTi0.17 and AlTi0.2 alloys are all located at the grain boundaries of BCC grains within the FCC grains, which indicates that there is more dislocation accumulation at the interface of BCC and FCC phases, resulting in significantly higher dislocation density. Among them, this phenomenon is more obvious in the AlTi0.2 alloy, and the difference of the highest KAM value between the BCC grain and the FCC grain reaches 6.19°. AlTi0.24 has a higher KAM value in both the FCC phase region and the BCC phase region, and its dislocation density is higher, which will cause the material to be more brittle, thus affecting its toughness.
As can be seen in Figure 5a–c, the geometrically necessary dislocations (GNDs) of the AlTi0.2 alloy are more evenly distributed. Both AlTi0.17 and AlTi0.24 have high-density dislocation regions, and the regions with high dislocation density will become stress concentration regions, which will affect their fatigue characteristics. Thus, the corrosion resistance of the material is reduced [41].
The results of EBSD analysis show that the addition of Ti and Al not only changes the microstructure of FeCrNi alloy from single FCC structure to FCC + BCC biphase structure, but also significantly affects the deformation mechanism and corrosion resistance of FeCrNi alloy. With the increase of the content of Al and Ti elements in the alloy, the content of BCC phase shows a trend of first increasing and then decreasing, which indicates that the addition of Al and Ti elements has limited strengthening effect on the alloy, and regulating the content of Al and Ti elements to achieve the best effect is the focus of follow-up research.

3.4. Electrochemical Impedance Spectroscopy

Figure 6 shows the Electrochemical Impedance Spectroscopy (EIS) of FeCrNi alloy and FeCrNi(AlTi)x medium-entropy alloy with three different components in 3.5 wt.%NaCl solution. Figure 6a,b represents the Nyquist diagram and Bode diagram, respectively. It can be clearly seen from the Nyquist figure that FeCrNi(AlTi)x medium -entropy alloys all exhibit a single capacitive react-arc, indicating that the corrosion reaction of the alloy in solution is controlled by the charge transfer process kinetics [42], and the center of the capacitive react-arc circle is located below the real axis, indicating that the corrosion process on the surface of the alloy is controlled by an electrochemical process [43]. The diameter of the half arc in the figure reflects the corrosion resistance of the material in solution. The larger the diameter of the half arc in the curve, the better the corrosion resistance of the passivated film [30,44]. With the addition of Al and Ti elements, the arc radius in the Nyquist diagram of the alloy gradually increases. Among the three different additive contents, AlTi0.2 has a larger arc radius, and the arc radius decreases when the content further increases. This series of phenomena shows that the addition of Al and Ti elements can help the entropy alloy in FeCrNi(AlTi)x to exhibit stronger protective film formation ability and greater electrochemical dissolution resistance, and this will increase with the increase of the content in a certain range. The proportion of Al and Ti components is 0.2 Near peak.
In the Bode diagram in Figure 6b, the slopes of the log|Z|-logf curves of four samples are all close to or −1 in the frequency range of 10−1–103, indicating that the passivation film formed on the surface of the alloy is a pseudocapacitance, and the phase Angle of the alloy presents a transient stable state within this range, forming a phase Angle platform. This phenomenon indicates that a certain passivation film has been formed on the surface of the alloy. As can be seen from the comparison of different color curves in the figure, the slope of the red curve representing the sample of AlTi0.2 is larger in this range and closer to 1, which indicates that it is more stable in this state. The curve continued until the frequency range of 10−2 near the end of the test before the slope changed, and there was no unstable fluctuation during the period, which showed that its corrosion resistance was better than that of the other two alloy samples with different additives. At this low frequency band, the phase Angle of the AlTi0.2 sample is closer to 90°, which indicates that the impedance of the system is capacitive or dispersive, and the diffusion process of ions in the electrolyte solution has a significant influence on the impedance. However, in the high frequency region above 105, the corresponding phase angle-frequency curve shows a reverse peak shape, which is a charge transfer process, and the transient response at this time shows an unstable state.
A single capacitive reactance arc may represent a double-layer capacitance at the electrode interface, but it does not exclude the possibility that other capacitive elements may be present in the circuit. The constant phase element (CPE) is used to simulate non-ideal capacitive behavior, such as the “dispersion effect” caused by factors such as the non-uniformity of the electrode surface, the adsorption layer, and the poor conductivity of the solution. Therefore, combined with the preliminary analysis of the Nyquist diagram and Bode diagram, R(Q(R(QR))) was first used as the equivalent circuit for fitting, but the final data error was large. Considering the rationality of circuit components, an inductance L was added to the original equivalent circuit to represent some transient responses or high-frequency behaviors in the circuit. The equivalent circuit, as shown in Figure 6c, is fitted with Rs(Qp(RpL(RctQct))), where Rs is the solution resistance, Rp is the resistance of the corrosion product film, and Qp is the capacitance effect related to the electrode interface. L represents some transient response or high-frequency behavior, Rct is a charge transfer resistor, and Qct is a constant phase element, which is used to simulate non-ideal capacitance behavior. Finally, the Chi-square approximation obtained by the equivalent circuit is two orders of magnitude different from R(Q(R(QR))). And each data error can reach a relatively lower value. Due to the heterogeneity of the surface of the alloy and the non-ideal capacitive response due to its adsorption effect [45], the ideal capacitors (Qp and Qct) were replaced by constant phase elements (CPE) in this fitting. Ideally, the phase constant ZCPE is represented by the following formula:
Z C P E = Y 0 1 j ω n
where Y0 is the scale factor; j is an imaginary unit; ω is the angular frequency; n is an exponential factor, and this formula represents the dispersion degree of CPE. When n = −1, CPE represents inductance. When n = 0, CPE represents pure resistance. When n = 1, CPE represents the ideal capacitance. Table 4 shows the impedance fitting results of FeCrNi(AlTi)x medium-entropy alloy. It can be seen from the parameters in the table that the values of n1 are all 1, indicating that its CPE is close to the ideal capacitance. In other data, the value of Rs is much different from that of other resistors, and the difference between them is almost inorganic, which indicates that they show similar ionization ability under voltage disturbance. Rp value is the resistance of the corrosion product film, and it can be seen that the AlTi0.2 sample is the smallest in this value, which can be found in the following electrochemical corrosion morphology SEM diagram. In the most important Rct value, the sample of AlTi0.2 showed its superiority, reaching 4.049 × 10⁴ Ω·cm2, compared with the 3.034 × 10⁴ Ω·cm2 of AlTi0.24, which had thousands of differences. The 1.201 × 10⁴ Ω·cm2 of FeCrNi and 1.412 × 10⁴ Ω·cm2 of AlTi0.17 have a bigger gap. The charge transfer resistance represents the difficulty of ion transfer, and the higher the resistance value, the better the corrosion resistance [46]. The lower the Rct value, the higher the ion migration through the double charge layer. The corrosion resistance of the alloy is relatively poor. This indicates that the passivation film formed on the surface of AlTi0.2 can more effectively limit the transfer of metal surface charge. According to the above analysis, the addition of Al and Ti elements can effectively enhance the charge transfer limitation of the passivation film generated on the surface of the alloy, thus improving the corrosion resistance of the alloy. Within a certain range, the strengthening effect will increase with the increase of the content, but when the content of AlTi reaches 0.2, the enhancement effect will reach a saturation state. With the further increase of AlTi content, the strengthening effect was reduced.

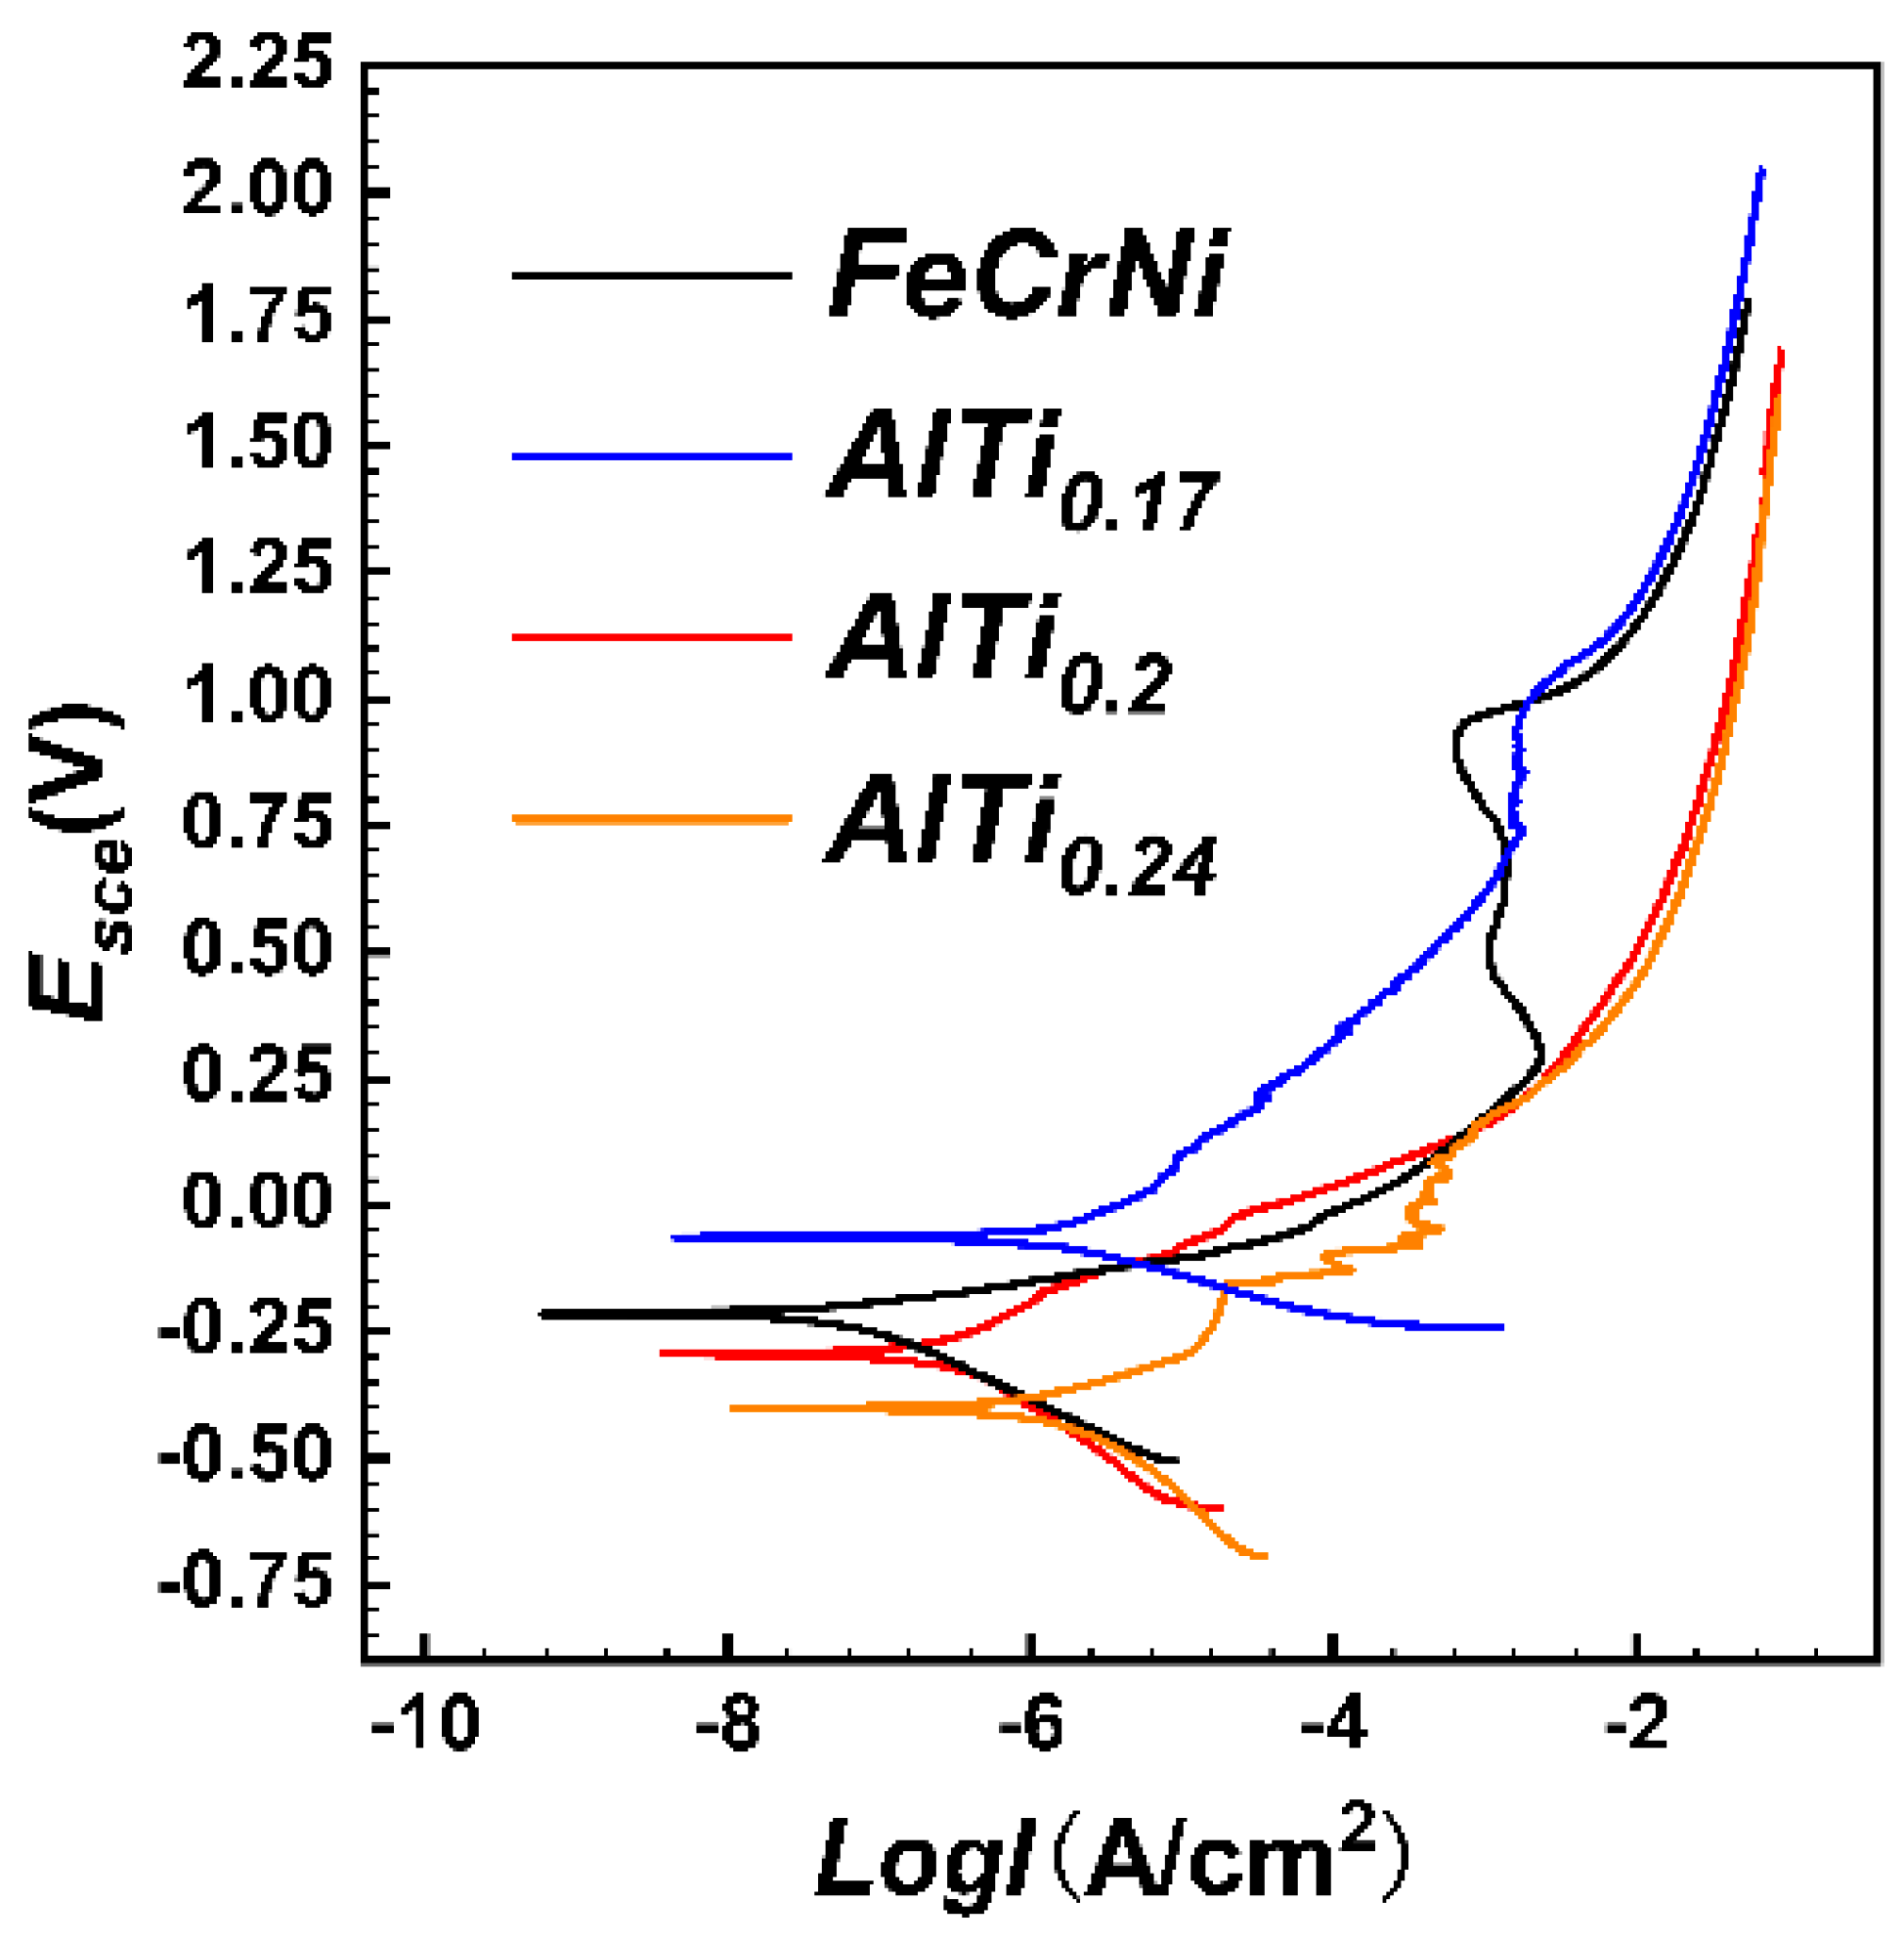
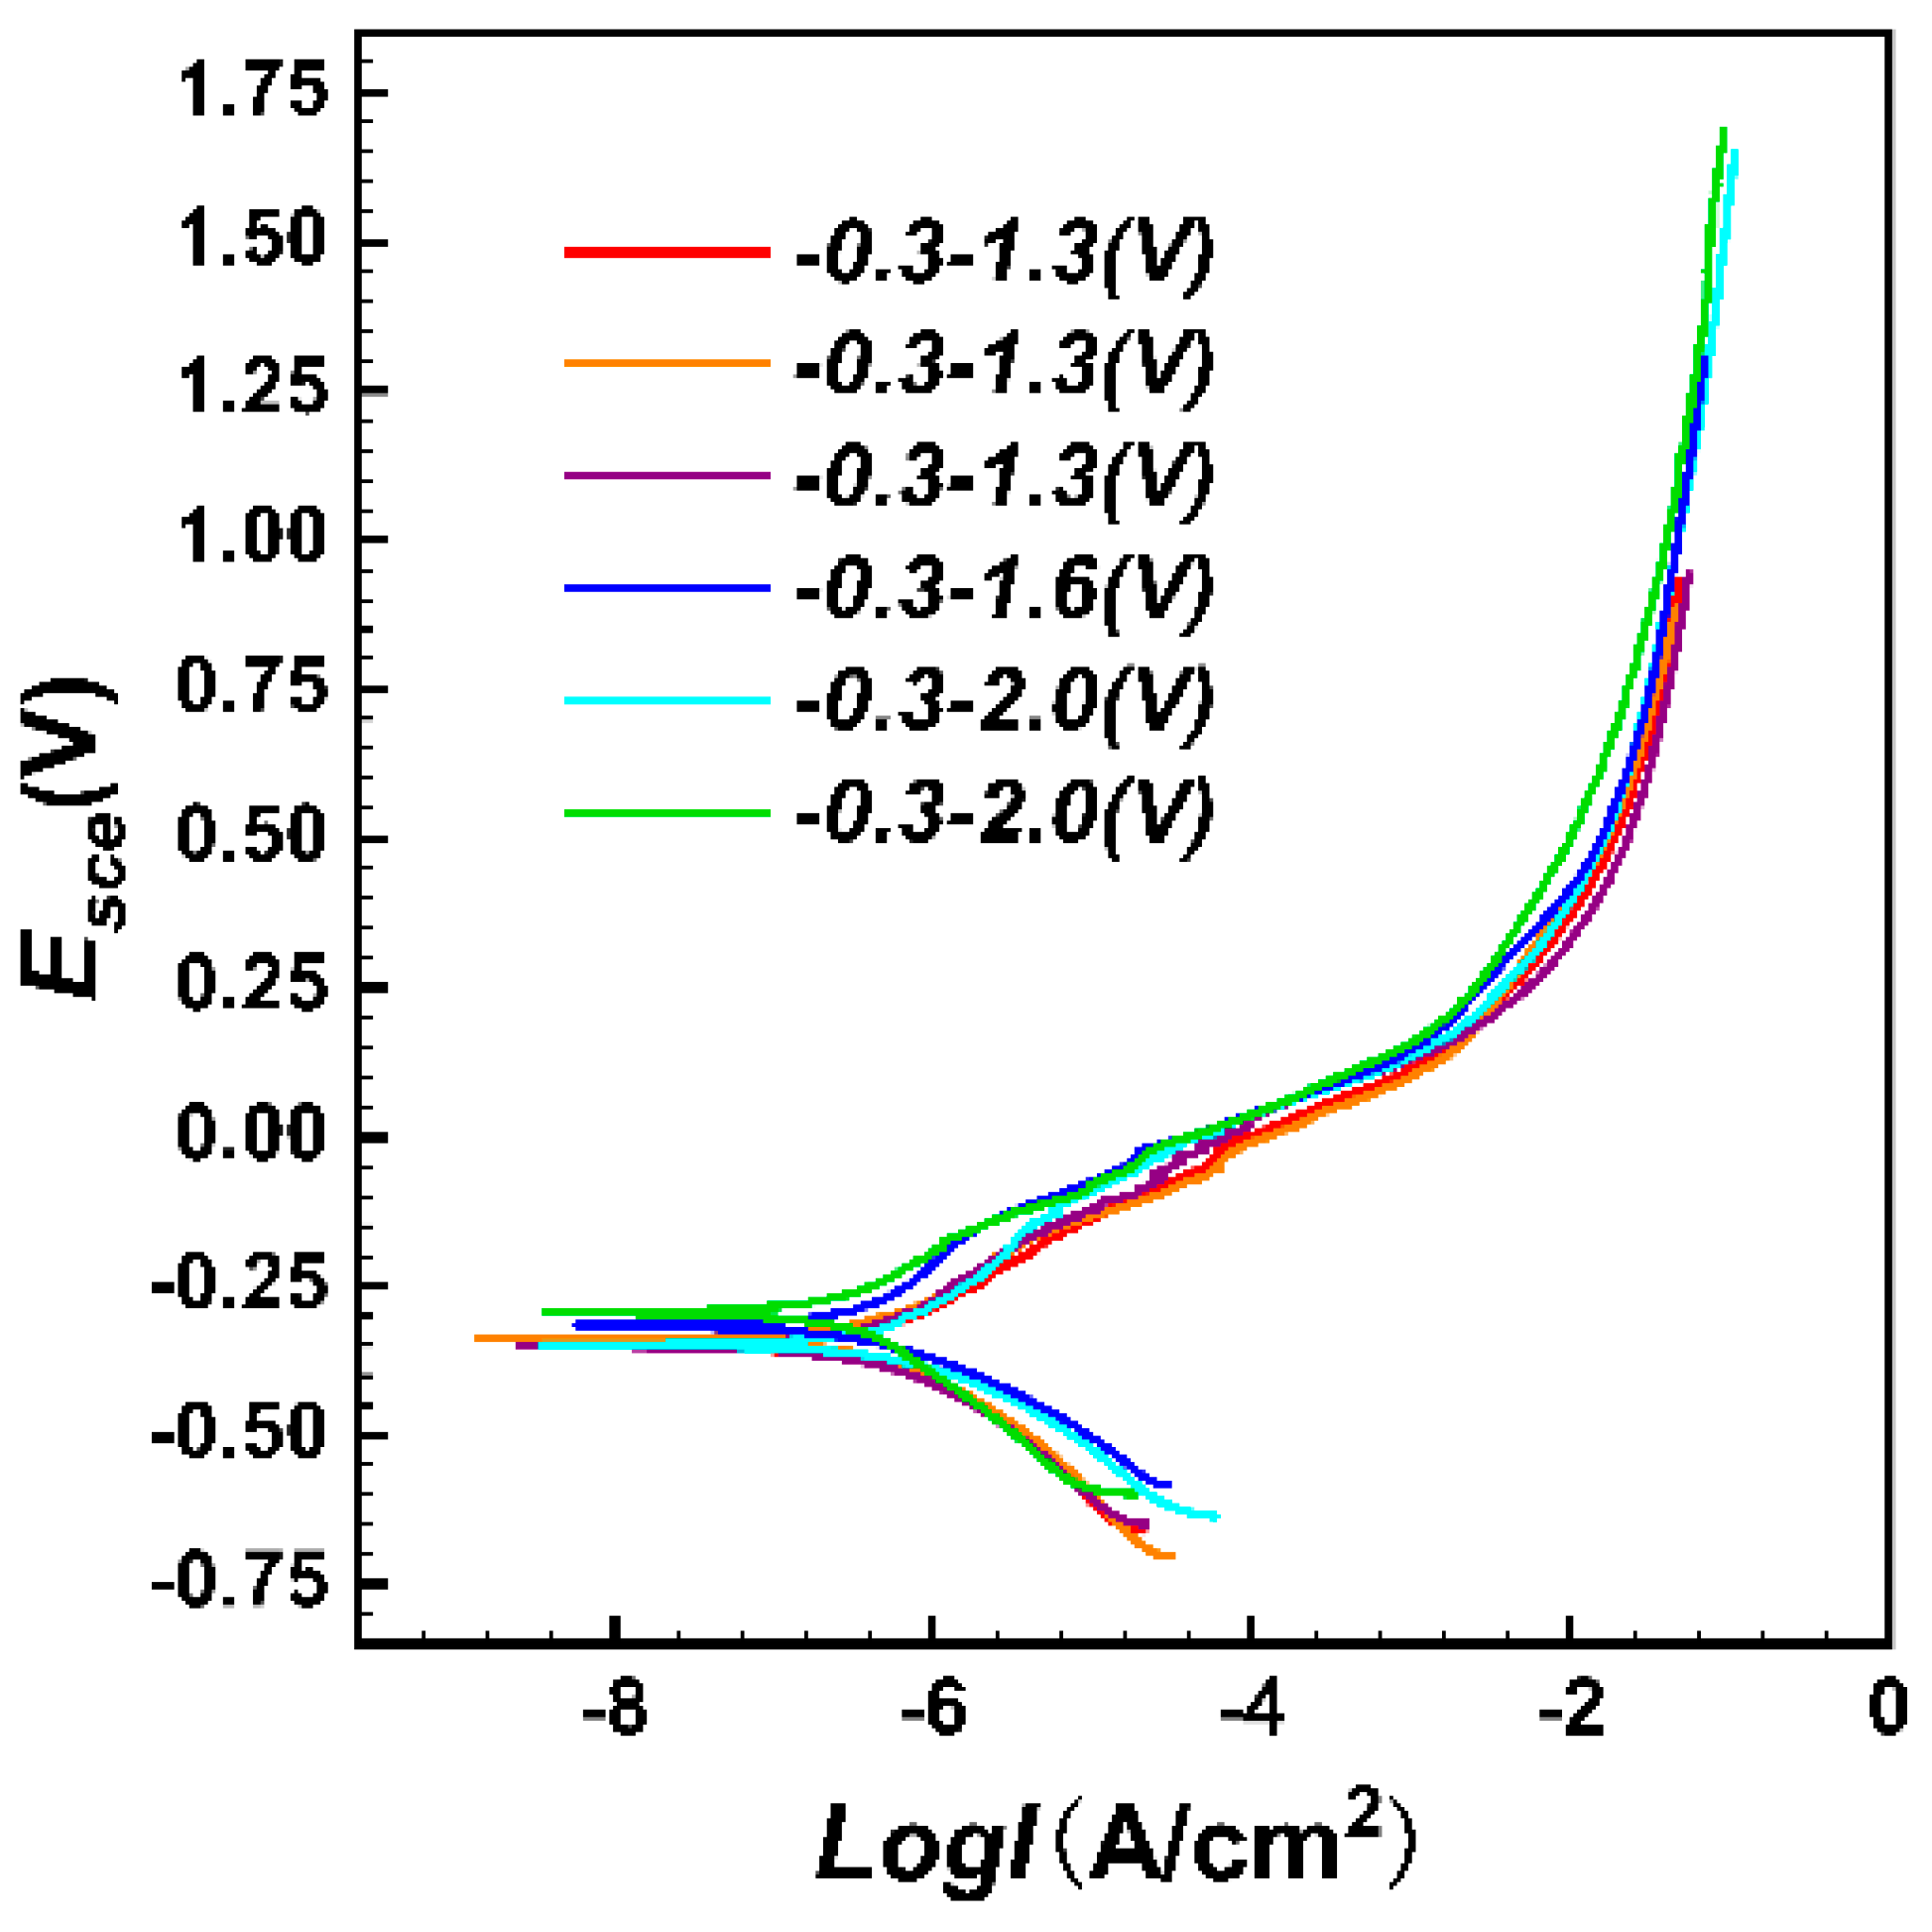
3.5. Potentiodynamic Polarization

In this study, FeCrNi(AlTi)x alloy was immersed in 3.5 wt.%NaCl solution at room temperature to make it undergo action potential polarization reaction after the open-circuit potential was stabilized, and the reaction potential was −0.3 V to −2.0 V relative to the open-circuit potential. Figure 7 shows the potentiodynamic polarization curves of the four alloys. Table 5 lists a series of electrochemical parameters obtained by fitting the polarization curve. These include corrosion potential (Ecorr), Passivation start potential (Ep-s), breakdown potential (Ebr) and passivation window width (Passivation Window: Ebr-Ep-s), self-etching current density (Icorr), and overpassivation current density (Itr).
Combined with the chart data, it can be seen that the entropy alloy in FeCrNi itself can be spontaneously passivated when it is subjected to action potential polarization in NaCl solution. From these two data points alone, it can be seen that it has better corrosion resistance. Compared with AlTi0.17, which has just added Al and Ti elements, it has better performance after it has passed the corrosion potential. It has a lower passivation starting potential and a larger passivation window width. However, from corrosion potential to passivation initial potential, the current of the AlTi0.17 alloy changes less with voltage.
However, with the addition of Al and Ti elements, AlTi0.2 showed better corrosion resistance. After the initial passivation of Ep-s = 0.1089 V, no passivation film rupture occurred until the anode potential was 2.0V relative to the open circuit potential. Until the end of the experiment, the attack penetration potential could not be observed in the potentiodynamic polarization curve. As can be seen from the results of multiple AlTi0.2 experiments in Figure 8, this phenomenon is a common phenomenon, and the results of multiple experiments show that the corrosion resistance of AlTi0.2 alloy is stable and excellent. When the content of Al and Ti is increased to 0.24, the driven potential polarization curve shows that AlTi0.24 alloy tends to a stable state after two passivations and passivation damage.
According to the single driven potential polarization curve and its various electrochemical parameters, AlTi0.24 shows relatively poor corrosion resistance. But single data do not directly prove the validity of this conclusion. Therefore, the surface morphology of the four alloy samples after potentiodynamic polarization reaction was characterized by scanning electron microscopy in this study, and the overall surface corrosion morphology of the alloy was obtained as shown in Figure 9. Under the scale of 500 μm, it can be seen that FeCrNi and AlTi0.17 suffered serious corrosion on the entire surface after potentiodynamic polarization. The original flatness of the alloy surface is lost. However, it can be observed from Figure 9c,d that most of the surfaces of AlTi0.2 and AlTi0.24 after the reaction still maintain the original morphology that is not corroded, which indicates that the alloys of the two components show better corrosion resistance in the electrochemical environment, and their surface structures are relatively stable.
Combined with the potentiodynamic polarization curve of Figure 7, it can be seen that the current of FeCrNi and AlTi0.17 alloy is in a relatively stable state after the passivation film breaks, because the entire surface of FeCrNi and AlTi0.17 is uniformly corroded, making them in a stable state. AlTi0.2 alloy is in a stable state during the reaction until the end of the experiment; Although AlTi0.24 experienced two passivation film fractures in the polarization curve and then entered the steady state, it can be guessed from the overall corrosion morphology of Figure 9d that the surface of the previous two passivation films was locally corroded, while the overall alloy surface passivation film still has relatively good corrosion resistance, so that after two fractures, AlTI0.24 can be successfully corroded. The corrosion current can still be in a relatively stable state.
According to the results of Figure 9, the most severely corroded locations of the three different alloy components were selected, and the SEM images, as shown in Figure 10, were obtained after the magnification was increased. The comparison of Figure 10a,d,g,j can confirm the above conclusion. After the magnifications are increased, it can be seen from Figure 10b that the surface of the FeCrNi alloy without Al and Ti elements added after corrosion presents a uniform “fish scale” shape, and some seriously corroded pitting pits are randomly distributed on the surface. When Al and Ti elements are added, the corrosion surface with different contents shows different forms according to its corrosion resistance. When the scale reaches 100 μm, it can be seen that Figure 10e also shows AlTi0.17, whose corrosion morphology is completely different from that of the FeCrNi alloy. After it is locally enlarged to a 20 μm scale, the result of Figure 10f can be seen, where the deep black part of its surface is a pitting pit. The entire surface of the sample presents a large pitting pit with a discrete distribution, which makes the entire surface appear to be corroded under a small electron microscope scanning. When Al and Ti elements are further increased, the corrosion resistance of the alloy is improved. As can be seen from Figure 10i, only small pitting pits are randomly distributed on the surface of the AlTi0.2 alloy, and the overall surface passivation effect of the alloy is good, showing relatively excellent corrosion resistance. It can be seen from Figure 9d that although AlTi0.24 does not have such a large area of corrosion as FeCrNi alloy and AlTi0.17 alloy, it still has a small local area of corrosion. As can be seen from Figure 10j,k, it is like a “crater” on the alloy surface, which can be found by increasing the magnification. The corrosion has penetrated deep into the alloy.
Based on the above potentiodynamic polarization curve and corrosion surface topography analysis, it can be concluded that the corrosion resistance of AlTi0.2 alloy with Al and Ti elements added is the best, followed by AlTi0.24 alloy, and finally AlTi0.17 and FeCrNi alloy, which is consistent with the impedance spectrum test analysis results. It can be seen from this that the addition of Al and Ti elements to FeCrNi alloy can improve its corrosion resistance, and within a certain range, with the increase of Al and Ti elements content, there is a downward trend after reaching the peak. The relationship between the overall corrosion resistance and the content of Al and Ti elements, and the test results of microhardness and BCC phase, are consistent with the normal distribution.
Based on the observed excellent corrosion resistance, particularly in the AlTi0.2 alloy sample, this Co-free MEA system demonstrates significant potential for use as either corrosion-resistant structural material or protective coating in marine environments—such as ship components, seawater pipeline systems, and offshore platform structures—or other chloride-containing environments, including chemical processing equipment and desalination plants. The compatibility with laser metal deposition (LMD) further enhances its industrial viability. LMD enables the near-net-shape fabrication of complex geometries (e.g., valve bodies, pump impellers) and provides on-site repair capabilities for corrosion-damaged infrastructure, significantly reducing lifecycle costs in maintenance-intensive environments [47].

4. Conclusions

In this study, FeCrNi alloy and three kinds of FeCrNi(AlTi)x medium entropy alloys with different Al and Ti contents were prepared by LMD technology. The chemical composition, microstructure, and corrosion resistance of the alloy samples were systematically described. Key findings are as follows:
(1)
FeCrNi alloy prepared by laser melting deposition technology shows a single-phase FCC structure. With the addition of Al and Ti elements, the alloy changes from a single FCC phase structure to a biphase FCC + BCC structure. In a certain range, with the increase of the content of Al and Ti elements, the BCC phase ratio continues to increase. After reaching the saturation state, the increase in the content of Al and Ti in the alloy will lead to a decrease in BCC content.
(2)
In FeCrNi(AlTi)x medium entropy alloy, the grains of the BCC phase are dispersed in the FCC matrix, and more dislocations accumulate at the interface of the BCC phase and FCC phase, resulting in significantly higher dislocation density. With the increase of the content of Al and Ti, the grain of the alloy can be refined to a certain extent.
(3)
The geometrically necessary dislocations (GNDs) of AlTi0.2 alloy are distributed most evenly among the three alloys, and AlTi0.17 and AlTi0.24 both have high-density dislocation regions. The regions with high dislocation density will make them stress-concentrated regions, which will affect their fatigue characteristics, and thus reduce the corrosion resistance of the material. Adjusting the content of Al and Ti elements in the alloy can change the microstructure composition of the alloy, so as to change the corrosion resistance of the alloy.
(4)
FeCrNi(AlTi)x medium entropy alloy has good corrosion resistance and can be spontaneously passivated in 3.5 wt.%NaCl solution to form a corrosion-resistant passivated film. With the increase of the content of Al and Ti, the protection of the passivation film on the surface of FeCrNi(AlTi)x can be effectively improved, and the corrosion rate of the alloy surface can be reduced. Among the alloys with different contents of Al and Ti, the AlTi0.2 alloy has the best corrosion resistance. After the high-potential potentiodynamic corrosion test, the surface of other alloys has a large-scale corrosion phenomenon, and only part of the alloy has a random pitting morphology.
In subsequent research, we will consider supplementing XPS experiments to analyze the chemical composition of the passive film formed on the sample surface, thereby further enhancing the reliability of the results; systematically evaluate key mechanical properties such as tensile strength, hardness, and toughness to provide more comprehensive performance data for practical applications; and conduct more refined composition optimization within or near the studied range in order to balance mechanical properties with corrosion resistance.

Author Contributions

Software, M.L. and C.L.; validation, X.L.; investigation, M.L. and K.W.; resources, G.S.; data curation, K.W. and C.L.; writing—reviewing and editing, M.L. and K.W.; funding acquisition, G.S. All authors have read and agreed to the published version of the manuscript.

Funding

This work was supported by Guangdong Basic and Applied Basic Research (2022A1515010761, 2022A1515140028, 2022A0505050081), Guangdong Provincial Ocean Economy Development Special Fund ([2024]32), Foshan Technology Project (1920001000409), and the Key Laboratory of Guangdong Regular Higher Education (2017KSYS012).

Institutional Review Board Statement

Not applicable.

Informed Consent Statement

Not applicable.

Data Availability Statement

Data are contained within the article.

Conflicts of Interest

Author Guanghui Shao was employed by the company Datang Boiler and Pressure Vessel Inspection Center Co., Ltd. The remaining authors declare that the research was conducted in the absence of any commercial or financial relationships that could be construed as a potential conflict of interest.

References

  1. Yeh, J.W.; Chen, S.K.; Gan, J.Y.; Chin, T.S.; Shun, T.T.; Tsau, C.H.; Chang, S.Y. Nanostructured High-Entropy Alloys with Multiple Principal Elements: Novel Alloy Design Concepts and Outcomes. Adv. Eng. Mater. 2004, 6, 299–303. [Google Scholar] [CrossRef]
  2. Cantor, B.; Knight, P.; Vincent, A.J. Microstructural development in equiatomic multicomponent alloys. Mater. Sci. Eng. A 2004, 375, 213–218. [Google Scholar] [CrossRef]
  3. Ding, J.; Yu, Q.; Asta, M.; Ritchie, R.O. Tunable stacking fault energies by tailoring local chemical order in CrCoNi medium-entropy alloys. Proc. Natl. Acad. Sci. USA 2018, 115, 8919–8924. [Google Scholar] [CrossRef]
  4. Li, Z.; Zhao, S.; Ritchie, R.O. Mechanical properties of high-entropy alloys with emphasis on face-centered cubic alloys. Prog. Mater. Sci. 2019, 102, 296–345. [Google Scholar] [CrossRef]
  5. Fu, Y.; Huang, C.; Du, C.; Li, J.; Dai, C.; Luo, H.; Liu, Z.; Li, X. Evolution in microstructure, wear, corrosion, and tribocorrosion behavior of Mo-containing high-entropy alloy coatings fabricated by laser cladding. Corros. Sci. 2021, 191, 109727. [Google Scholar] [CrossRef]
  6. Tong, C.J.; Chen, Y.L.; Yeh, J.W.; Lin, S.J.; Chen, S.K.; Shun, T.T.; Tsau, C.H. Chang Microstructure characterization of AlxCoCrCuFeNi high-entropy alloy system with multiprincipal elements. Metall. Mater. Trans. A 2005, 36, 881–893. [Google Scholar] [CrossRef]
  7. He, J.Y.; Liu, W.H.; Wang, H.; Wu, Y.; Liu, X.J.; Nieh, T.G.; Lu, Z.P. Effects of Al addition on structural evolution and tensile properties of the FeCoNiCrMn high-entropy alloy system. Acta Mater. 2014, 62, 105–113. [Google Scholar] [CrossRef]
  8. Brif, Y.; Thomas, M.; Todd, I. The use of high-entropy alloys in additive manufacturing. Scr. Mater. 2015, 99, 93–96. [Google Scholar] [CrossRef]
  9. He, F.; Wang, Z.; Wu, Q.; Niu, S.; Li, J.; Wang, J.; Liu, C. Solid solution island of the Co-Cr-Fe-Ni high entropy alloy system. Scr. Mater. 2017, 131, 42–46. [Google Scholar] [CrossRef]
  10. Hu, H.X.; Liu, Y.; Huang, Q.L. Effect of preparation technology on corrosion resistance of entropy alloy in powder metallurgy FeCrNi. Powder Metall. Mater. Sci. Eng. 2023, 28, 490–499. (In Chinese) [Google Scholar]
  11. Gu, S.; Huang, H.Y.; Lin, Y.C.; Hsieh, C.-A.; Panda, P.K.; Chang, J.-K.; Hsieh, C.-T. High-entropy alloys with low platinum content: Novel catalysts for oxygen reduction and evolution reactions. Emergent Mater 2025. [Google Scholar] [CrossRef]
  12. Sun, S.J.; Tian, Y.Z.; An, X.H.; Lin, H.; Wang, J.; Zhang, Z. Ultrahigh cryogenic strength and exceptional ductility in ultrafine-grained CoCrFeMnNi high-entropy alloy with fully recrystallized structure. Mater. Today Nano 2018, 4, 46–53. [Google Scholar] [CrossRef]
  13. Sun, S.J.; Tian, Y.Z.; Lin, H.R.; Dong, X.G.; Wang, Y.H.; Zhang, Z.J.; Zhang, Z.F. Enhanced strength and ductility of bulk CoCrFeMnNi high entropy alloy having fully recrystallized ultrafine-grained structure. Mater. Des. 2017, 133, 122–127. [Google Scholar] [CrossRef]
  14. Shun, T.T.; Du, Y.C. Microstructure and tensile behaviors of FCC Al0.3CoCrFeNi high entropy alloy. J. Alloys Compd. 2009, 479, 157–160. [Google Scholar] [CrossRef]
  15. Zhang, Y.; Xiao, M.; Zhou, Y.M.; Shen, Y.F. Thermal stability of eutectic FeNiCoCrTi0.6N0.4 high-entropy alloy coating. Powder Metall. 2022, 65, 61–69. [Google Scholar] [CrossRef]
  16. Ma, Y.; Wang, Q.; Jiang, B.B.; Li, C.L.; Hao, J.M.; Li, X.N.; Dong, C.; Nieh, T.G. Controlled formation of coherent cuboidal nanoprecipitates in bodycentered cubic high-entropy alloys based on Al2(Ni,Co,Fe,Cr)14 compositions. Acta Mater. 2018, 147, 213–225. [Google Scholar] [CrossRef]
  17. Lee, J.Y.; An, J.; Chua, C.K. Fundamentals and applications of 3D printing for novel materials. Appl. Mater. Today 2017, 7, 120–133. [Google Scholar] [CrossRef]
  18. Han, C.; Fang, Q.; Shi, Y.; Tor, S.B.; Chua, C.K.; Zhou, K. Recent advances on high entropy alloys for 3D printing. Adv. Mater. 2020, 32, 1903855. [Google Scholar] [CrossRef]
  19. Zafar, M.Q.; Zhao, H. 4D printing: Future insight in additive manufacturing. Met. Mater. Int. 2020, 26, 564–585. [Google Scholar] [CrossRef]
  20. Hao, Y.B.; Zhao, K.; Huang, Y.L. Microstructures and mechanical properties of doubled annealed laser melting deposited TC11 titanium alloy. Chin. J. Lasers 2021, 48, 2202001. [Google Scholar]
  21. Hu, Z.H.; Song, C.H.; Liu, L.Q. Research progress of selective laser melting of nitinol. Chin. J. Lasers 2020, 47, 1202005. [Google Scholar] [CrossRef]
  22. Moorehead, M.; Bertsch, K.; Niezgoda, M.; Parkin, C.; Elbakhshwan, M.; Sridharan, K.; Zhang, C.; Thoma, D.; Couet, A. High-throughput synthesis of Mo-Nb-Ta-Whigh-entropy alloys via additive manufacturing. Mater. Des. 2020, 187, 108358. [Google Scholar] [CrossRef]
  23. Schneider, M.; Laplanche, G. Effects of temperature on mechanical properties and deformation mechanisms of the equiatomic CrFeNi medium-entropy alloy. Acta Mater. 2021, 204, 116470. [Google Scholar] [CrossRef]
  24. Liang, D.; Zhao, C.; Zhu, W.; Wei, P.; Jiang, F.; Zhang, Y.; Sun, Q.; Ren, F. Overcoming the strength-ductility trade-off via the formation of nanoscale Cr-rich precipitates in an ultrafine-grained FCC CrFeNi medium entropy alloy matrix. Mater. Sci. Eng. A 2019, 762, 138107. [Google Scholar] [CrossRef]
  25. Wu, Z.; Bei, H.; Otto, F.; Pharr, G.M.; George, E.P. Recovery, recrystallization, grain growth and phase stability of a family of FCC-structured multi-component equiatomic solid solution alloys. Intermetallics 2014, 46, 131–140. [Google Scholar] [CrossRef]
  26. Takeuchi, A.; Inoue, A. Classification of bulk metallic glasses by atomic size difference, heat of mixing and period of constituent elements and its application to characterization of the main alloying element. Mater. Trans. 2005, 46, 2817–2829. [Google Scholar] [CrossRef]
  27. Reed, R.C. The Superalloys: Fundamentals and Applications; Cambridge University Press: New York, NY, USA, 2006. [Google Scholar]
  28. Yang, T.; Zhao, Y.L.; Li, W.P.; Yu, C.Y.; Luan, J.H.; Lin, D.Y.; Fan, L.; Jiao, Z.B.; Liu, W.H.; Liu, X.J.; et al. Ultrahigh-strength and ductile superlattice alloys with nanoscale disordered interfaces. Science 2020, 369, 427–432. [Google Scholar] [CrossRef]
  29. Fu, A.; Cao, Y.K.; Zhou, Z.Y.; Wang, J.; Khanlari, K.; Wang, B.; Liu, B. Corrosion behavior of FeCrNi medium-entropy alloy fabricated by laser powder bed fusion. Mater. Commun. 2024, 38, 108558. [Google Scholar] [CrossRef]
  30. Luo, H.; Li, Z.M.; Mingers, A.M.; Raabe, D. Corrosion behavior of an equiatomic CoCrFeMnNi high-entropy alloy compared with 304 stainless steel in sulfuric acid solution. Corros. Sci. 2018, 134, 131–139. [Google Scholar] [CrossRef]
  31. Firouzdor, V.; Sridharan, K.; Cao, G.; Anderson, M.; Allen, T. Corrosion of a stainless steel and nickel-based alloys in high temperature supercritical carbon dioxide environment. Corros. Sci. 2013, 69, 281–291. [Google Scholar] [CrossRef]
  32. Li, B.-Y.; Peng, K.; Hu, A.-P.; Zhou, L.-P.; Zhu, J.-J.; Li, D.-Y. Structure and properties of FeCoNiCrCu0.5Alx high-entropy alloy. Trans. Nonferrous Met. Soc. China 2013, 23, 735–741. [Google Scholar] [CrossRef]
  33. Zheng, M.Y.; Li, C.W.; Ye, Z.H.; Zhang, X.; Yang, X.; Wang, Q.; Gu, J. Strength-ductility synergy of additively manufactured (CoCrNi)87Al13 medium entropy alloy with heterogeneous multiphase microstructure. Scr. Mater. 2023, 222, 115016. [Google Scholar] [CrossRef]
  34. Yamamoto, Y.; Pint, B.A.; Terrani, K.A.; Field, K.; Yang, Y.; Snead, L. Development and property evaluation of nuclear grade wrought FeCrAl fuel cladding for light water reactors. J. Nucl. Mater. 2015, 467, 703–716. [Google Scholar] [CrossRef]
  35. He, J.Y.; Wang, H.; Wu, Y.; Liu, X.; Mao, H.; Nieh, T.; Lu, Z. Precipitation behavior and its effects on tensile properties of FeCoNiCr high-entropy alloys. Intermetallics 2016, 79, 41–52. [Google Scholar] [CrossRef]
  36. Zhang, Y.; Zhou, Y.J.; Lin, J.P.; Chen, G.L.; Liaw, P.K. Solid-solution phase formation rules for multi-component alloys. Adv. Eng. Mater. 2008, 10, 511–602. [Google Scholar] [CrossRef]
  37. Zhang, Y.; Chen, M.B.; Yang, X. Advanced High Entropy Alloy Technology; Chemical Industry Press: Beijing, China, 2018; pp. 115–117. (In Chinese) [Google Scholar]
  38. Sunkari, U.; Reddy, S.R.; Rathod, B.D.S.; Kumar, S.S.S.; Saha, R.; Chatterjee, S.; Bhattacharjee, P.P. Heterogeneous precipitation mediated heterogeneous nanostructure enhances strength-ductility synergy in severely cryo-rolled and annealed CoCrFeNi2.1Nb0.2 high entropy alloy. Sci. Rep. 2020, 10, 6056. [Google Scholar] [CrossRef]
  39. Chen, H.; Kosiba, K.; Suryanarayana, C.; Lu, T.; Liu, Y.; Wang, Y.; Prashanth, K.G. Prashanth, Feedstock preparation, microstructures and mechanical properties for laser-based additive manufacturing of steel matrix composites. Int. Mater. Rev. 2023, 68, 1192–1244. [Google Scholar] [CrossRef]
  40. DebRoy, T.; Mukherjee, T.; Wei, H.L.; Elmer, J.W.; Milewski, J.O. mechanistic models and machine learning in metal printing. Nat. Rev. Mater. 2021, 6, 48–68. [Google Scholar] [CrossRef]
  41. Wu, W.Q.; Zhou, R.; Wei, B.Q. Nanosized precipitates and dislocation networks reinforced C-containing CoCrFeNi high-entropy alloy fabricated by selective laser melting. Mater. Charact. 2018, 144, 605–610. [Google Scholar] [CrossRef]
  42. Bommersbach, P.; Alemany-dumont, C.; Millet, J.P.; Normand, B. Formation and behaviour study of an environmentfriendly corrosion inhibitor by electrochemical methods. Electrochim. Acta 2005, 51, 1076–1084. [Google Scholar] [CrossRef]
  43. Wang, J.; Li, J.; Yang, H.; Huang, H.; Ji, S.; Ruan, J.; Liu, Z. Corrosion behavior of CoCrNi medium-entropy alloy compared with 304 stainless steel in H2SO4 and NaOH solutions. Corros. Sci. 2020, 177, 108973. [Google Scholar] [CrossRef]
  44. Han, Z.H.; Ren, W.N.; Yang, J.; Tian, A.; Du, Y.; Liu, G.; Wei, R.; Zhang, G.; Chen, Y. The corrosion behavior of ultra-fine grained CoNiFeCrMn high-entropy alloys. J. Alloys Compd. 2020, 816, 152583. [Google Scholar] [CrossRef]
  45. Marino, C.E.B.; Maascaro, L.H. EIS characterization of a Ti-dental implant in artificial saliva media: Dissolution process of the oxide barrier. J. Electroanal. Chem. 2004, 568, 115–120. [Google Scholar] [CrossRef]
  46. Cao, C.N.; Zhang, J.Q. Introduction to Electrochemical Impedance Spectroscopy; Science Press: Beijing, China, 2002. (In Chinese) [Google Scholar]
  47. Gupta, A.K.; Choudhari, A.; Rane, A.; Tiwari, A.; Sharma, P.; Gupta, A.; Sapale, P.; Tirumala, R.T.A.; Muthaiah, R.; Kumar, A. Advances in Nickel-Containing High-Entropy Alloys: From Fundamentals to Additive Manufacturing. Materials 2024, 17, 3826. [Google Scholar] [CrossRef]
Figure 1. X-ray diffraction patterns of FeCrNi(AlTi)x alloy (a) 30°~100° (b) 40°~55°.
Coatings 15 00851 g001
Figure 2. SEM morphology of the FeCrNi(AlTi)x alloy (ac), FeCrNi (df), AlTi0.17 (gi), AlTi0.2 (jl), AlTi0.24.
Coatings 15 00851 g002
Figure 3. EDS surface scanning analysis of the FeCrNi(AlTi)x alloy (a) FeCrNi, (b) AlTi0.17, (c) AlTi0.2, (d) AlTi0.24.
Coatings 15 00851 g003
Figure 4. EBSD results of FeCrNi(AlTi)x alloy (ac) inverse pole figure maps; (df) phase map; (gi) total grain size distribution; (jl) grain size distribution of BCC phase.
Coatings 15 00851 g004
Figure 5. KAM of FeCrNi(AlTi)x alloy (ac) overall KAM; (df) KAM about FCC; (gi) KAM about BCC.
Coatings 15 00851 g005
Figure 6. Bode plots (a) Nyquist plots; (b) R(Q(RL(RQ))) equivalent electrical circuit for fitting EIS data; (c) FeCrNi(AlTi)x alloy in 3.5 wt.%NaCl solution.
Coatings 15 00851 g006
Figure 7. Potentiodynamic-polarization curves of FeCrNi(AlTi)x alloy in 3.5 wt.%NaCl solution.
Coatings 15 00851 g007
Figure 8. Potentiodynamic-polarization curves of FeCrNi(AlTi)0.2 alloy in 3.5 wt.%NaCl solution.
Coatings 15 00851 g008
Figure 9. Surface corrosion morphology of FeCrNi(AlTi)x alloy specimen 500 μm (a) FeCrNi; (b) AlTi0.17; (c) AlTi0.2; (d) AlTi0.24.
Coatings 15 00851 g009
Figure 10. Surface corrosion morphology of FeCrNi(AlTi)x alloy specimen (ac) FeCrNi; (df) AlTi0.17; (gi) AlTi0.2; (jl) AlTi0.24.
Coatings 15 00851 g010
Table 1. Nominal chemical compositions of FeCrNi(AlTi)x medium-entropy alloys(at.%).
SampleFeCrNiAlTi
FeCrNi33.3333.3433.33--
AlTi0.1730.0030.0229.985.005.00
AlTi0.229.4129.4229.415.885.88
AlTi0.2428.6728.7028.637.016.99
Table 2. Printing parameters for alloy ingots.
Laser Power
(W)
Scanning Speed
(mm/s)
Spot Diameter
(mm)
Overlap Rate
(%)
Powder Feed Rate
(g/min)
180052.12453.7
Table 3. Chemical compositions of the two phases in the FeCrNi(AlTi)x alloy(at.%).
SamplePhaseDetected Composition/at.%
FeCrNiAlTi
FeCrNiFCC30.9 ± 0.331.1 ± 0.338.0 ± 0.3--
BCC-----
AlTi0.17FCC30.6 ± 0.3 28.5 ± 0.3 32.0 ± 0.36.6 ± 0.22.3 ± 0.2
BCC32.4 ± 0.334.3 ± 0.322.7 ± 0.37.2 ± 0.23.4 ± 0.2
AlTi0.2FCC30.9 ± 0.323.2 ± 0.337.2 ± 0.33.0 ± 0.25.7 ± 0.2
BCC35.1 ± 0.335.7 ± 0.323.3 ± 0.32.3 ± 0.23.6 ± 0.2
AlTi0.24FCC29.6 ± 0.322.2 ± 0.334.6 ± 0.37.5 ± 0.26.1 ± 0.2
BCC30.7 ± 0.341.5 ± 0.318.8 ± 0.35.7 ± 0.23.3 ± 0.2
Values represent mean ± standard deviation (SD) of 3 measurements per phase region. Measurement uncertainty based on EDS detector calibration; ±0.3 at.% for Fe/Cr/Ni; ±0.2 at.% for Al/Ti.
Table 4. Fitting results of the impedance of the FeCrNi(AlTi)x alloy.
PhaseRs
(Ω·cm2)
Rp
(Ω·cm2)
Qp
Y0 (sn·Ω−1·cm−2)
n1Rct
(Ω·cm2)
Qct
Y0 (sn·Ω−1·cm−2)
n2
FeCrNi5.151 × 10−614.216.960 × 10−911.201 × 1047.530 × 10−50.8752
AlTi0.174.201 × 10−615.615.001 × 10−911.412 × 1043.273 × 10−50.8414
AlTi0.21.132 × 10−611.326.881 × 10−914.049 × 1044.133 × 10−50.9189
AlTi0.244.257 × 10−599.237.347 × 10−1013.034 × 1041.230 × 10−50.8038
All the goodness-of-fit values (χ2) of the equivalent circuit fittings are below 1 × 10⁻³.
Table 5. The fitting parameters of the polarization curve for the FeCrNi(AlTi)x alloy.
PhaseEcorr (VSCE)Ep-s (VSCE)Ebr (VSCE)Ebr-Ecorr (VSCE)Icorr (A/cm2)Itr (A/cm2)
FeCrNi−0.21470.28810.9569 0.6688 5.992 × 10−107.901 × 10⁻⁴
AlTi0.17−0.46960.73711.05970.32264.527 × 10−93.185 × 10⁻³
AlTi0.2−0.29350.10893.668 × 10−9
AlTi0.24−0.4009−0.2841−0.15430.12981.083 × 10−82.094 × 10⁻⁵
Disclaimer/Publisher’s Note: The statements, opinions and data contained in all publications are solely those of the individual author(s) and contributor(s) and not of MDPI and/or the editor(s). MDPI and/or the editor(s) disclaim responsibility for any injury to people or property resulting from any ideas, methods, instructions or products referred to in the content.

