Article

The Influence of Ni Incorporation on the Surface Porosity and Corrosion Resistance of CrBN Coatings on 45 Steel in Seawater

by
Zhidong Zhou
1,
Xue Wu
1,
Qianzhi Wang
1,2,*,
Gai Zhao
3,* and
Zhifeng Zhou
4
1
College of Mechanical and Electrical Engineering, Nanjing University of Aeronautics and Astronautics, Nanjing 210016, China
2
National Key Laboratory of Helicopter Aeromechanics, Nanjing University of Aeronautics and Astronautics, Nanjing 210016, China
3
State Key Laboratory of Mechanics and Control for Aerospace Structures, Nanjing University of Aeronautics and Astronautics, Nanjing 210016, China
4
Hong Kong Branch of National Precious Metals Material Engineering Research Center (NPMM), City University of Hong Kong, Hong Kong, China
*
Authors to whom correspondence should be addressed.
Coatings 2025, 15(7), 804; https://doi.org/10.3390/coatings15070804
Submission received: 3 June 2025 / Revised: 3 July 2025 / Accepted: 7 July 2025 / Published: 9 July 2025

Abstract

By adjusting NiCr target power, five CrNiBN coatings with different Ni contents were fabricated on 45 steel by magnetron sputtering with the aim of improving corrosion resistance of CrBN coatings in seawater. The structure and morphology of CrNiBN coatings were characterized by X-ray diffraction and scanning electron microscope, while its electrochemical properties were evaluated by open circuit potential, electrochemical impedance spectroscopy, and potential dynamic polarization. The results demonstrated that Ni incorporation could reduce the surface porosity of CrBN coatings from 16.8% to 7.7% as Ni content increased from 4.35 at% to 19.62 at%. On this basis, when Ni increased from 4.35 at% to 7.28 at%, self-corrosion potential gradually increased, which prompted the CrNiBN coating with 7.28 at% Ni to present the highest charge transfer resistance Rct of 1.965 × 10⁴ Ω·cm2 and the highest polarization resistance Rp of 74.9 kΩ·cm2. However, more Ni doping from 12.54 at% to 19.62 at% would decrease self-corrosion potential and trigger oxidation. Consequently, the CrNiBN coatings with Ni content from 12.54 at% to 19.62 at% presented decreasing Rct and Rp. Even so, the corrosion resistance of the CrNiBN coating was still better than that of CrBN coating indicating an improved corrosion inhibition efficiency by 12.53 times.

Graphical Abstract

1. Introduction

As one kind of carbon structural steel, 45 steel has been widely used to manufacture machine parts such as spindles, gears, shafts, and connecting rods [1,2]. In order to meet the high requirements of wear and corrosion resistance, post treatments such as quenching, normalizing, and tempering are applied on 45 steel [3,4]. However, the improvements in mechanical properties due to the above post treatments are limited since the chemical composition of 45 steel remains unchanged. Therefore, the wear and corrosion resistances of 45 steel are still insufficient to meet working requirements. As an alternative, coating is a positive technology to greatly improve the wear and corrosion resistances since it jumps out of the chemical composition of substrate [5,6,7]. Namely, the coating’s own performance determines its wear and corrosion resistances. For instance, Maskavizan’s research found that the wear rate of CrN coating was 0.15 × 10⁻⁶ mm3/Nm, which is 20 times lower than the wear rate of 45 steel (3.85 × 10⁻⁶ mm3/Nm) [8,9]. Similarly, Ge et al. [10] prepared densely structured and highly oriented columnar VN coatings through relatively intense ion bombardment reactive magnetron sputtering at 773 K. The VN coatings exhibited a hardness range of 25 to 30 GPa based on Oliver and Pharr approach and subsequently demonstrated an extremely low wear rate less than 5.0 × 10⁻⁸ mm3/Nm. Regarding corrosion resistance, the corrosion current density of 45 steel was 23 μA/cm2 [11]. After the deposition of the CrN coating, the corrosion current density could decrease to 0.96 μA/cm2 [12]. Chen’s study found that the chemical inertness of TiN in saltwater environment can effectively prevent the corrosion of stainless steel AISI-201. The corrosion current density (icorr) was significantly reduced to 7.4 nA/cm2 [13]. The reduced corrosion current densities of 1.58 nA/cm2 and 52.9 nA/cm2 by applying sputtered CrN and TiN coatings on AISI304 and AISI316L were reported in the literature as well [14,15].
However, binary nitride coatings such as CrN, TiN, and VN have an upper limit of hardness at around 30 GPa based on Oliver and Pharr approach, which restricts its wear resistance [16]. In the meantime, columnar crystal is the major growth pattern for nitride coatings so as to inevitably form the clearance between adjacent columnar crystals. As a consequence, the clearance would offer the channel for corrosion medium to erode substrate [17]. To solve these two issues, composite structure coatings consisting of nano crystal and amorphous matrix have been proposed. Owing to the inhibitions of dislocation multiplication and grain boundary sliding, the enhancement effect from the strong interfaces of nano crystal and amorphous matrix could increase hardness whilst the amorphous matrix could seal clearance [18,19]. For instance, Wang et al. [20] discovered that CrAlN coatings possessed a unique amorphous/crystalline structure of 5 nm crystals uniformly embedded within amorphous matrix. As a result, compared to conventional CrN coatings, CrAlN coatings exhibit relatively smaller grain sizes and a denser structure with a hardness of approximately 33.4 GPa while also demonstrating superior wear resistance. Similarly, Martinez et al. also found that the columnar growth of CrN crystals was indeed disrupted after doping a certain amount of Si, and the amorphous distribution of SiNx was distributed in CrN crystals, and the microstructure and mechanical properties such as the density and hardness of the coatings were improved to a certain extent [21,22,23]. For corrosion resistance, Yoo et al. [24] studied the corrosion behavior of CrSiN coatings with different Si contents in a 3.5 wt% NaCl solution. The study found that the structure of the coating became denser after Si doping, and, therefore, it reduced the path for solution erosion into the interior of the coating. As a result, when the Si/(Si + Cr) content in the coating was 20%, the coating exhibited the lowest corrosion current of 0.0845 nA/cm2 and the highest surface porosity resistance and charge transfer resistance. Wan et al. [25] incorporated Al into CrN coatings to form CrAlN coatings with a denser columnar crystal structure. Owing to the formation of Al2O3 and Cr2O3 protective films in seawater, the CrAlN coating presented a low corrosion current density of 1.14 × 10⁻⁸ A/cm2, which was lower than that of CrN coating by a degree of 92%. Moreover, the higher hardness of 23.8 GPa for CrAlN coating contributed to its enhanced wear resistance as well.
Although both the wear and corrosion resistances are improved by the enhanced effect of nano-crystal/amorphous matrix composite structure, insufficient toughness appears. For this issue, some toughened metals are introduced into composite coatings, such as Cu, Ni, Al, and Pt. It has been reported that the critical loads Lc1 and Lc2 for the crack initiation of CrAlN coatings were 27 N and 30 N with a crack propagation resistance (CPR) value of 81 N2. In contrast, the Ni-CrAlN coating exhibited higher Lc1 and Lc2 values than the CrAlN coating, and its CPR value increased to 352 N2, indicating that Ni incorporation could significantly enhance the coating’s toughness [26]. Moreover, Wang et al. found that a distinct pop-in was observed on the loading curve of CrSiN coatings, whereas the loading curve of Ni-CrSiN coatings was smooth, indicating that the Ni incorporation was able to improve coating toughness against circular cracks. As a consequence, the wear and corrosion resistances of CrSiN coatings in seawater was enhanced after Ni incorporation [27,28]. Our previous work investigated the influence of tough metal Ni on the mechanical and tribological properties of CrBN coatings. It was found that the moderate incorporation of Ni (4.35 at% and 7.28 at%) could improve the hardness of CrBN coatings and thus enhance its tribological properties. Nevertheless, the high incorporation of Ni (12.62 at% and 19.62 at%) would deteriorate the mechanical and tribological properties of CrBN coatings [29].
As mentioned above, the surface protection coatings are expected to possess both good wear and corrosion resistance. However, the influence of Ni incorporation on the corrosion resistance of CrBN coatings in seawater has not been investigated. It is still unknown whether the incorporation of Ni could enhance the corrosion resistance of CrBN coatings in seawater and the corresponding optimal incorporation content of Ni. Thus, it is necessary to investigate the influence of Ni incorporation on the corrosion resistance of CrBN coatings in seawater in this study. More importantly, the inner enhances mechanism of anti-corrosion need to be revealed.

2. Materials and Methods

2.1. Coatings Deposition

Magnetron sputtering as one kind of physical vapor deposition technology was used to deposit CrNiBN coatings on 45 steel wafers with the dimension of Φ 30 mm × 4 mm. Prior to deposition, the 45 steel was polished to a surface roughness Ra around 50 nm by using a precision polishing machine (UNIPOL 802, Hefei Kejing, Heifei, China). Before the coating’s deposition, a cleaning process by ion bombardment was applied to 45 steel. Afterwards, a multi-layer transition architecture, including Cr, CrN, and Cr(Ni)BN tiers, was deposited for improving adhesion strength. Firstly, a Cr tier was deposited by only sputtering Cr target at the power of 1150 W under the Ar flow of 50 sccm for 10 min. Secondly, a CrN tier was deposited by sputtering the Cr target at a power of 1150 W under the mixture atmosphere of Ar and N2 for 15 min. Thirdly, a Cr(Ni)BN tier was deposited by co-sputtering Cr and CrB2 targets under the mixture atmosphere of Ar and N2 for 15 min. At last, the top layer of CrNiBN was deposited by co-sputtering Cr, CrB2, and NiCr targets. During each stage, a bias voltage of −80 V but no heating was applied on substrate. For the depositions of CrN, Cr(Ni)BN tiers, and a CrNiBN top layer, an optical emission monitor (OEM) was used to automatically control the flow of N2 by presetting at 50%. In order to achieve the different Ni concentrations in coatings, the sputtering power of NiCr alloy target was set as 120 W, 240 W, 360 W, 480 W, and 600 W during the deposition of CrNiBN top layer. The specific deposition parameters of CrNiBN coatings are listed in Table 1. During the deposition of CrNiBN top layer, the sputtering powers of Cr and CrB2 targets were set as 1150 W and 720 W, respectively, while that of NiCr alloy target varied from 120 W to 600 W for different CrNiBN coatings. Thus, the relative Ni content became more with the increasing sputtering power of NiCr alloy target and resulted in the increasing concentration of Ni in CrNiBN coatings. Additionally, increasing the sputtering power of the NiCr alloy target would increase the thickness. To ensure similar total coating thickness, the deposition time of CrNiBN top layer decreased from 80 min to 55 min. To distinguish the CrNiBN coatings deposited at different sputtering powers, the code CrNiBN-120, CrNiBN-240, CrNiBN-360, CrNiBN-480, and CrNiBN-600 will be denoted in the following main text.

2.2. Structural Characterization and Morphology Observation

In order to determine the microstructure of CrNiBN coatings, the chemical composition, crystal structure, and bonding condition of coatings were characterized by using energy dispersive spectrometer (EDS), X-ray diffraction (XRD, Ultima IV, Tokyo, Japan), and X-ray photoelectron spectroscopy (XPS), respectively. During XRD measurement, a Cu Ka radiation (λ = 0.15404 nm) was used and conducted at the voltage of 40 kV and the current of 40 mA. The scanning range of diffraction angle 2θ was from 20° to 80° with an interval of 0.02°. For surface porosity measurement, the weighting method was intended to be used. Firstly, the coatings sample was immersed in water. In the meantime, ultrasonic cleaning was applied to make water go into surface pores. Afterwards, the coatings sample was taken out for weighting the first time. Secondly, after the first weighting, the coatings sample was put into a vacuum tube furnace to remove water for weighting the second time. By comparing the first and second weights, the difference is the weight of water in porosity. According to the density of water, the volume of porosity could be obtained. Then the relative ratio of porosity volume to coatings volume is the porosity. However, we found that the difference in weight cannot be measured by using an electronic balance (AL104, METTLER TOLEDO, Zurich, Switzerland) with the accuracy of 0.1 mg. The reason is that the calculated difference in weight could be as low as 0.037 mg based on the surface porosity of 16.8% for CrBN coating. Thus, we used the ImageJ to analyze the surface porosity rather than weighting method. The surface morphology of coatings was first observed by using scanning electron microscope (SEM). Afterwards, the software ImageJ (version 1.8.0) was used to process the images of surface morphology and to calculate the surface porosity of coatings directly [30,31,32,33]. The accuracy of surface porosity measurement is 0.001%. In order to minimize the measurement error, three images for each coating were used to calculate the average surface porosity.

2.3. Electrochemical Properties Measurement

The electrochemical properties of CrNiBN coatings were tested by using an electrochemical workstation (CHI660E, Shanghai Chenhua Instruments Company, Shanghai, China) in 3.5 wt% NaCl solution. The test was conducted using a three-electrode system, including working electrode, auxiliary electrode, and reference electrode, which are the CrNiBN coatings, platinum wire, and saturated calomel electrode, respectively. Before testing, the coating surface was washed by ultrasonic cleaning in ethanol for 10 min to remove residual contaminants and wiped to dry with dust-free paper. Afterwards, a copper wire was connected with the back of the sample, which was mounted on the test apparatus with an exposing area of 0.5 cm2 for testing. Finally, the platinum wire electrode, saturated calomel electrode (SCE) and the coatings sample were fully immersed in 3.5 wt% NaCl solution by maintaining them at the same horizontal line. The whole three-electrode system was placed in an electromagnetic shield box to reduce electromagnetic interference. The corrosion resistance of the CrNiBN coatings in 3.5 wt% NaCl solution were evaluated from the following three aspects:
(1)
Open circuit potential (OCP): The sample was soaked in 3.5 wt% NaCl solution, and the variation in potential was recorded for 3600 s.
(2)
Electrochemical impedance spectroscopy (EIS): After OCP test, the stable open circuit potential was set as the starting potential, the scanning frequency was set from 1 mHz to 100 kHz, and the amplitude of the AC excitation signal was set to 10 mV.
(3)
Potential dynamic polarization test (PDP): After EIS test, the relationship of potential and current for sample was measured by PP test. The scanning range was set from −1.0 V to 1.0 V with the scanning rate of 20 mV/min. During the test, the current sensitivity was set to be automatic.
The OCP, EIS, and PDP tests were carried out twice, and the data of the second time was used. In order to reveal the electrochemical structure of the coatings and obtain corresponding equivalent element parameters for evaluating corrosion resistance, the equivalent circuit was used to fit the EIS test results, which would discussed in Section 3.3.2. For the potential dynamic polarization test results, the self-corrosion current density (Icorr) and self-corrosion potential (Ecorr) are obtained using the Tafel curve extrapolation method [34]. Then, according to the Stern–Geary formula, as shown in Equation (1), the polarization resistance (Rp) of the coatings was calculated to analyze its dynamic corrosion resistance [35,36].
R p = β a β c 2.303 I c o r r ( β a + β c )
Among them, βa and βc are the slopes of the Tafel anode and cathode, respectively.

3. Results and Discussion

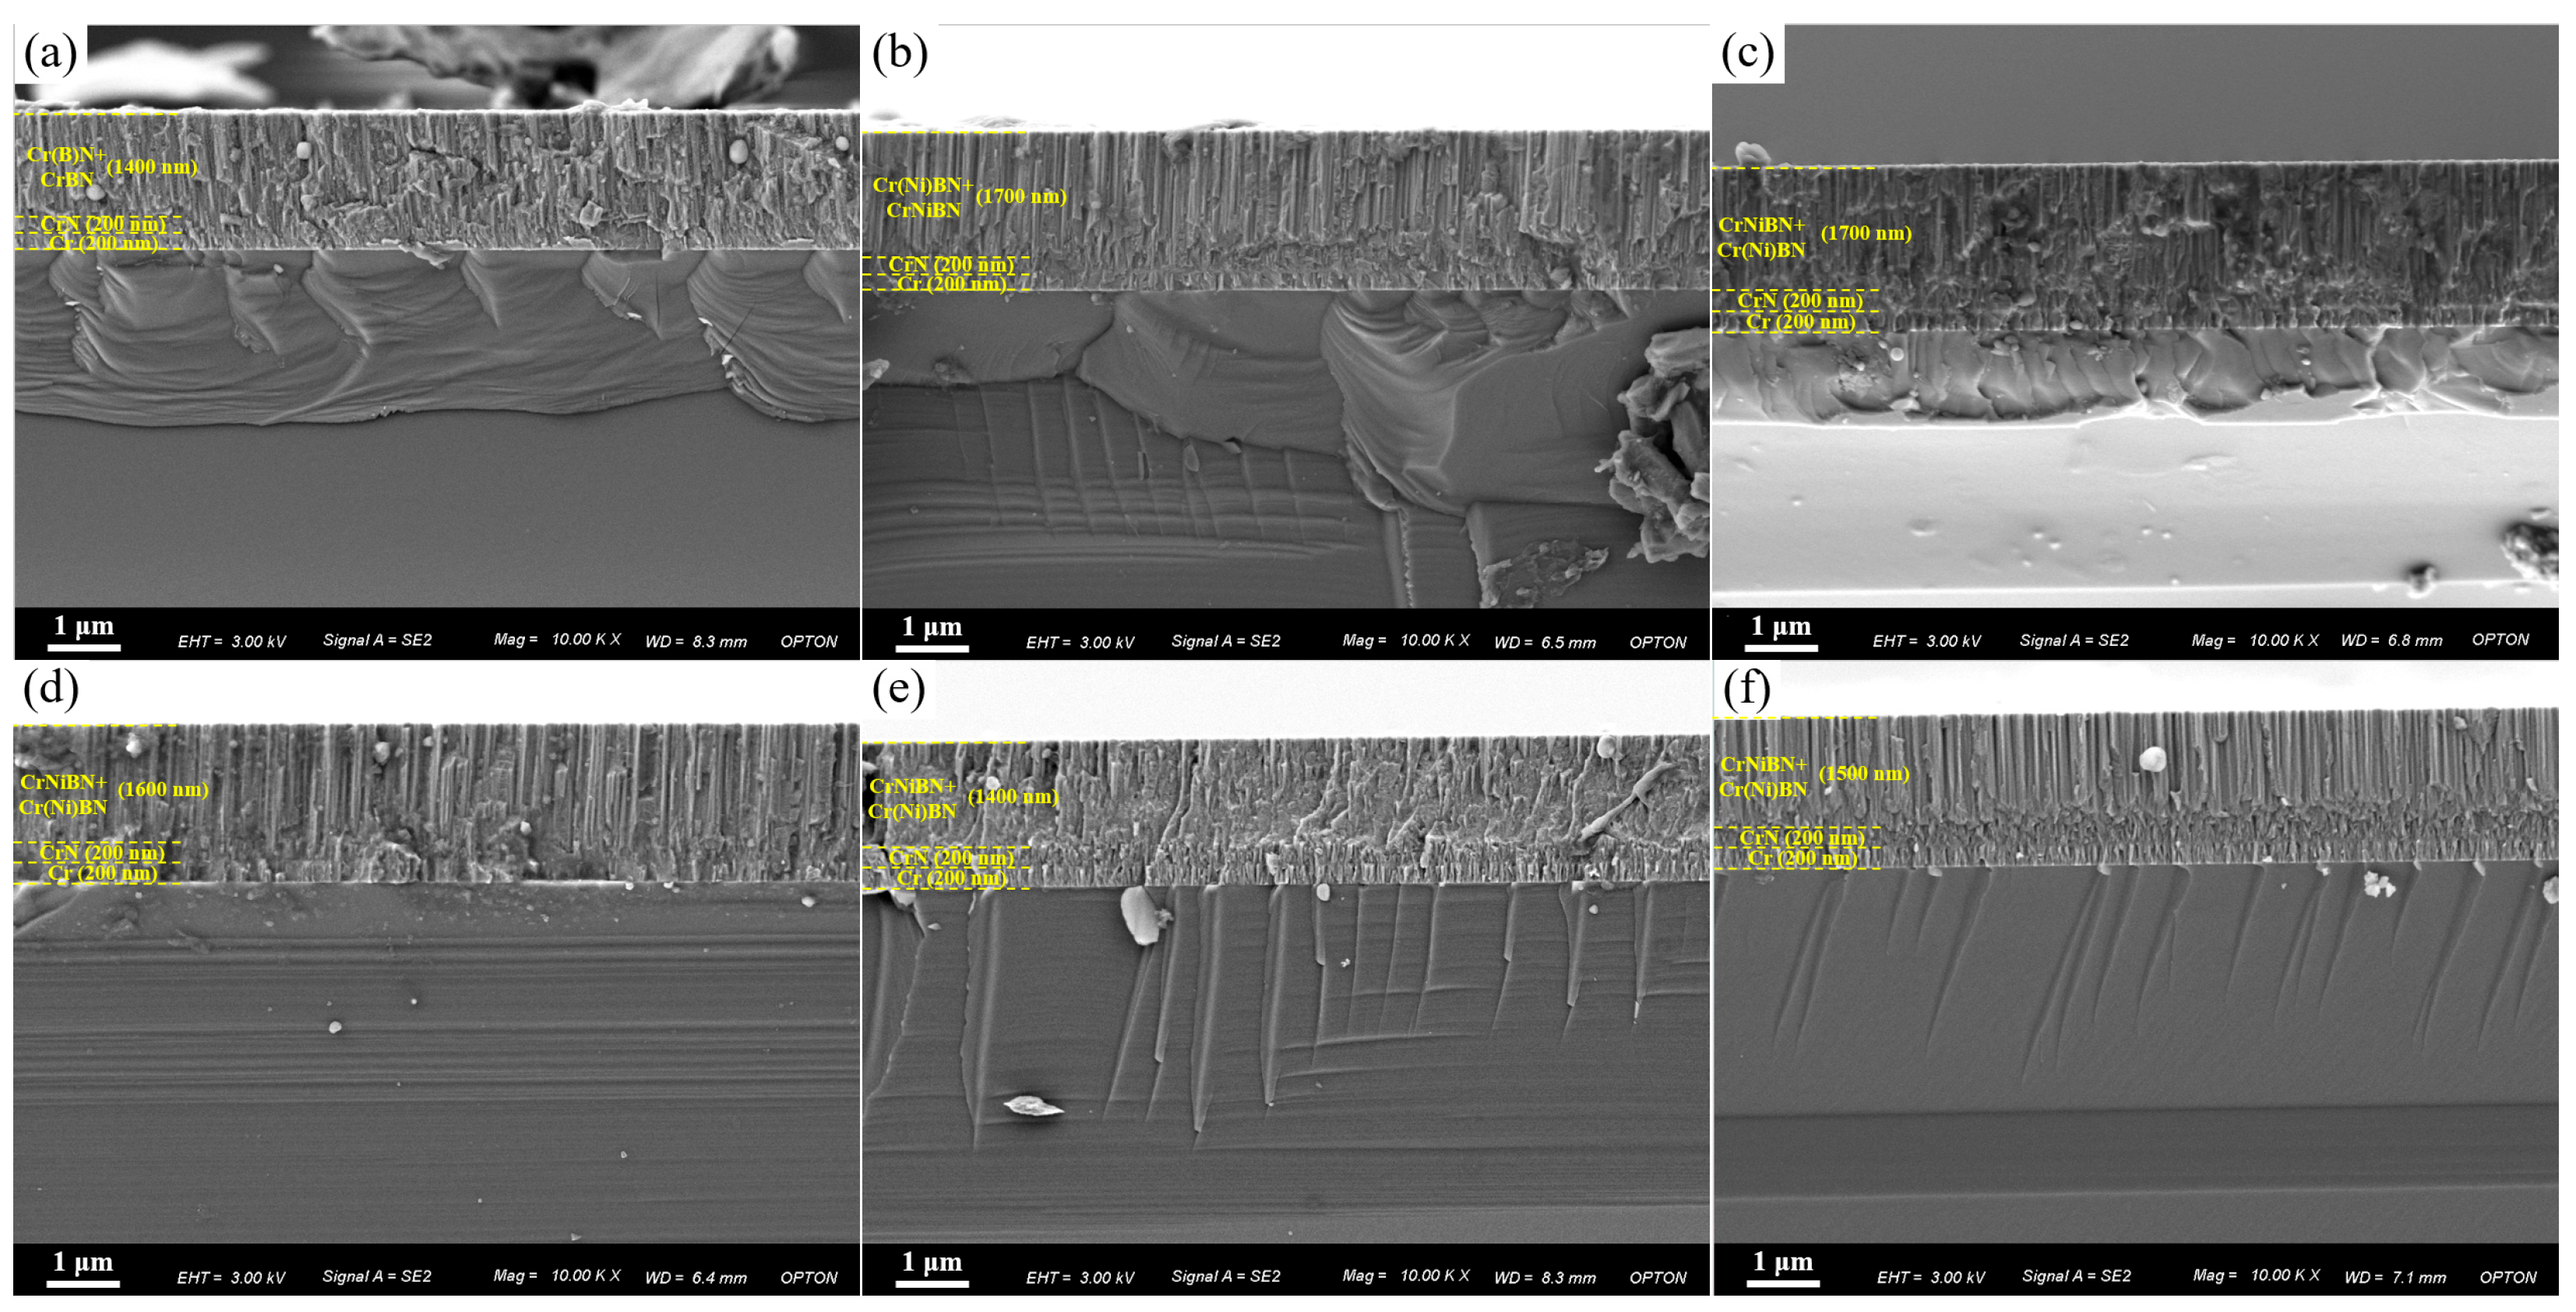
3.1. Microstructure of CrNiBN Coatings

The variation in Cr, B, N, and Ni element concentration as a function of NiCr alloy target power is illustrated in Figure 1. It has been found that with the increase in sputtering power of NiCr alloy target from 120 W to 600 W, the Ni concentration in CrNiBN coatings increases from 4.35 at.% to 19.62 at.%. According to the XRD results reported in our previous work [29], three diffraction peaks of CrN (111), CrN (200), and CrN (220) at 36.7°, 43.1°, and 62.5° were observed (JCPDS 11-0065), which demonstrates the face-centered cubic structure. With increasing Ni content, the intensity of CrN (111) in CrNiBN coatings varies slightly. With regard to the XPS results, a major Ni-Ni bond around 853.0 eV and a strong B-N bond around 190.3 eV were detected [29]. This demonstrates that Ni is mainly bonded with Ni while B is mainly bonded with N. By considering XRD and XPS results together, CrNiBN coatings present a nano-composite structure composed of CrN crystals and amorphous matrix.

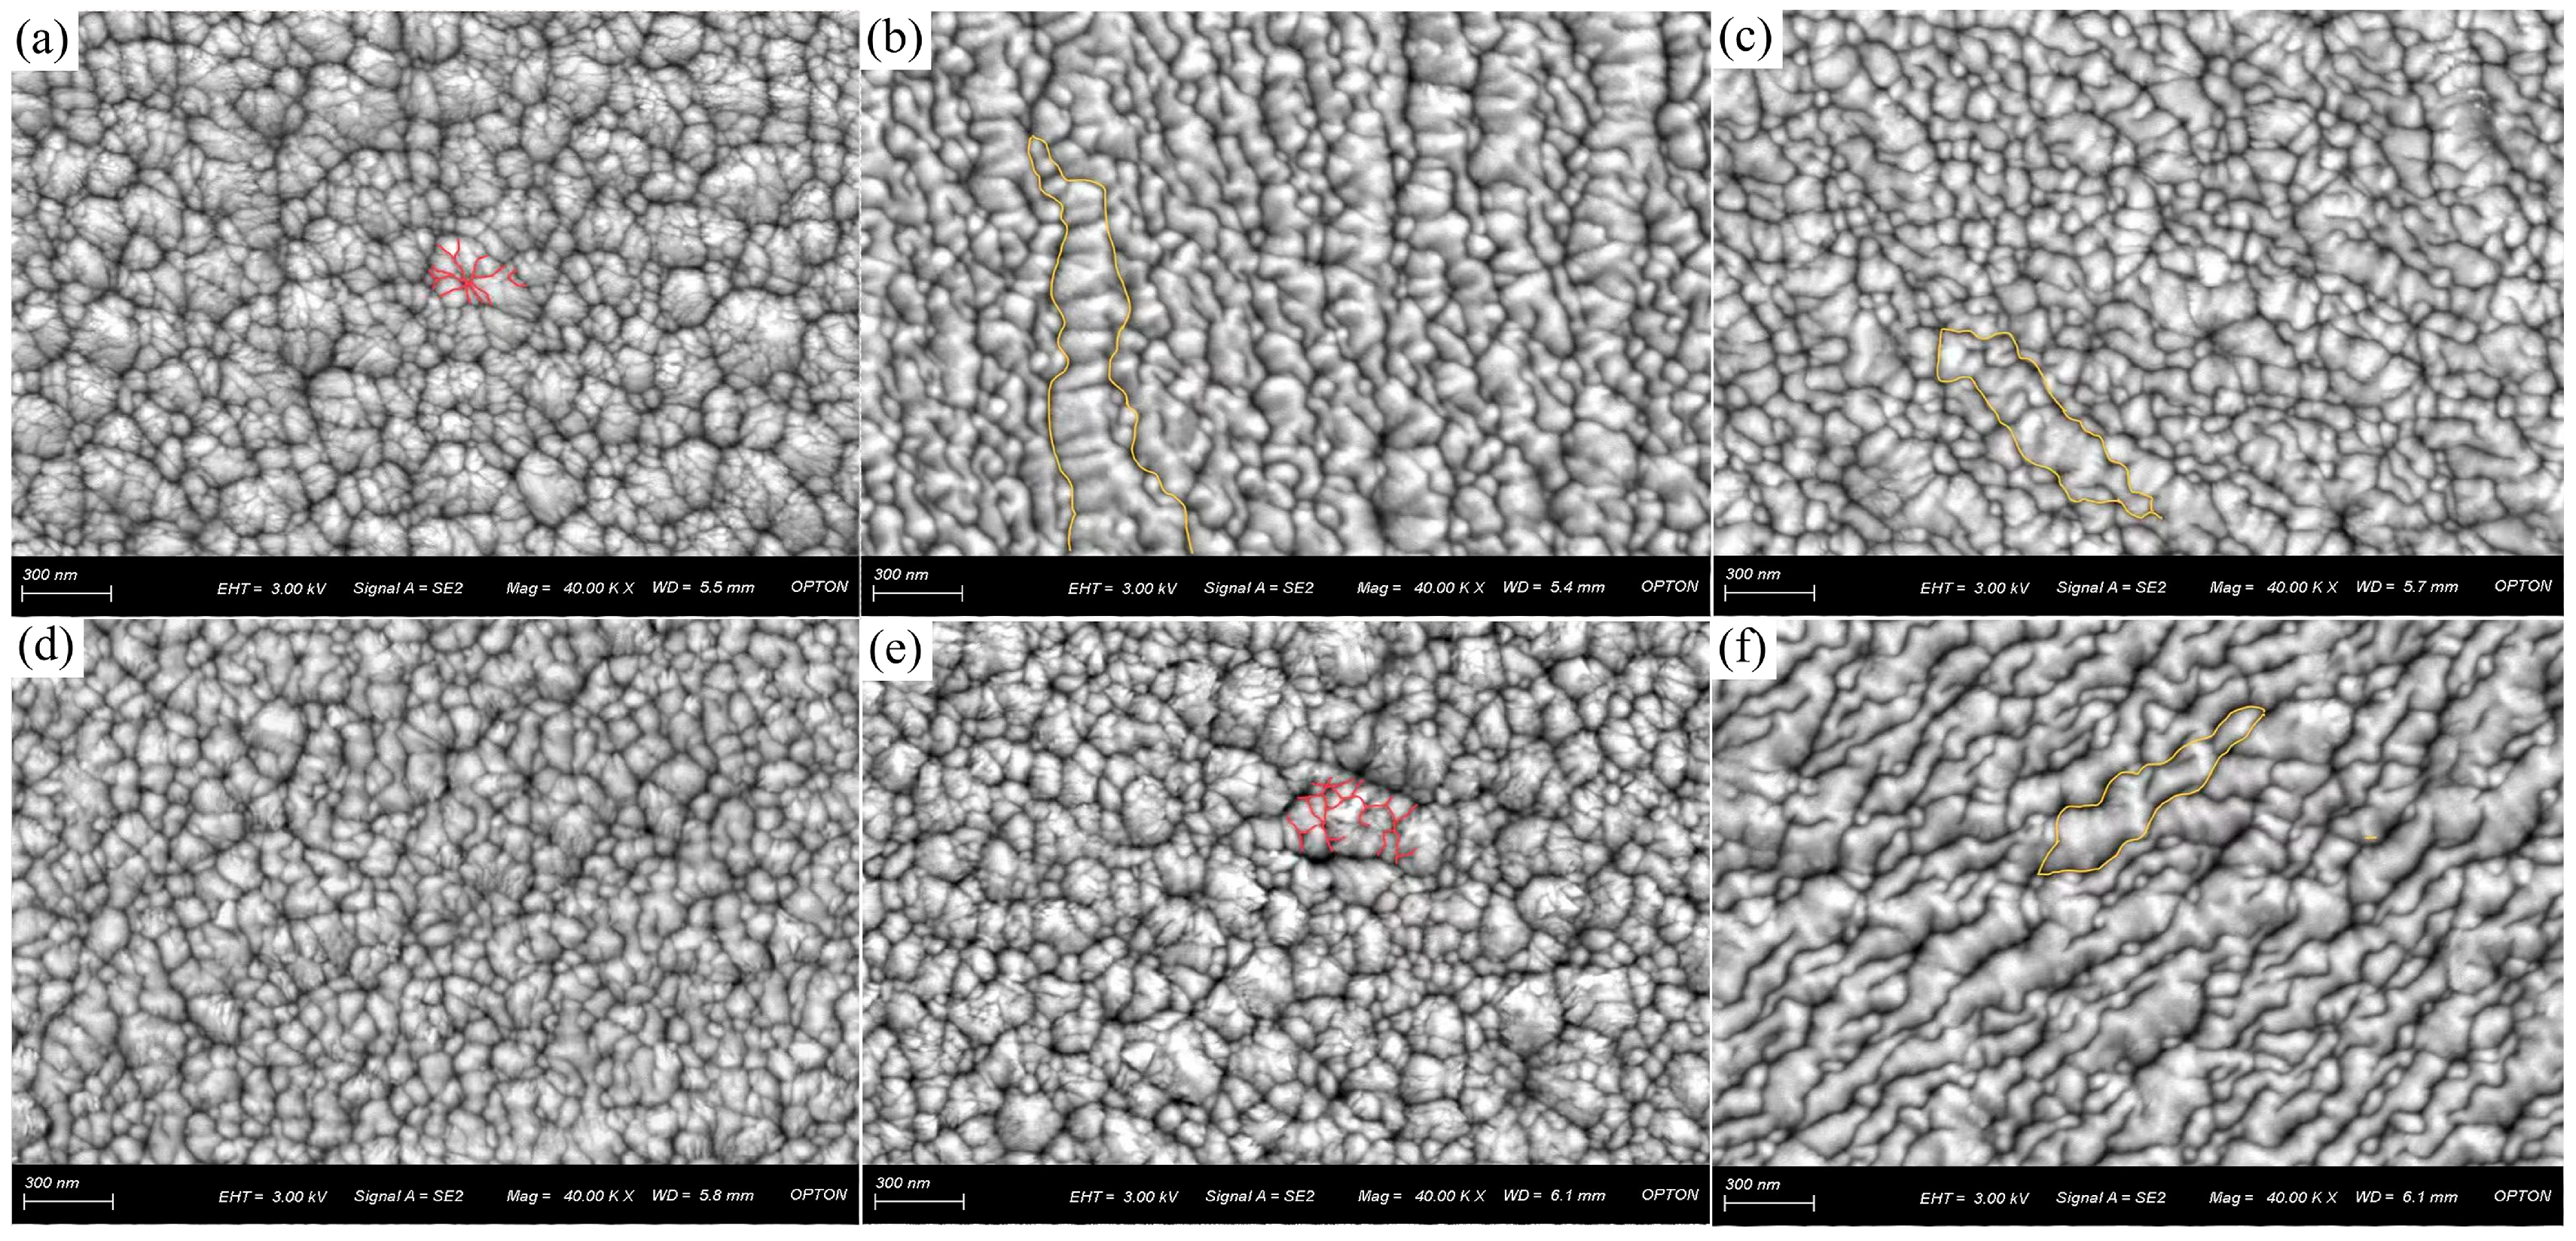
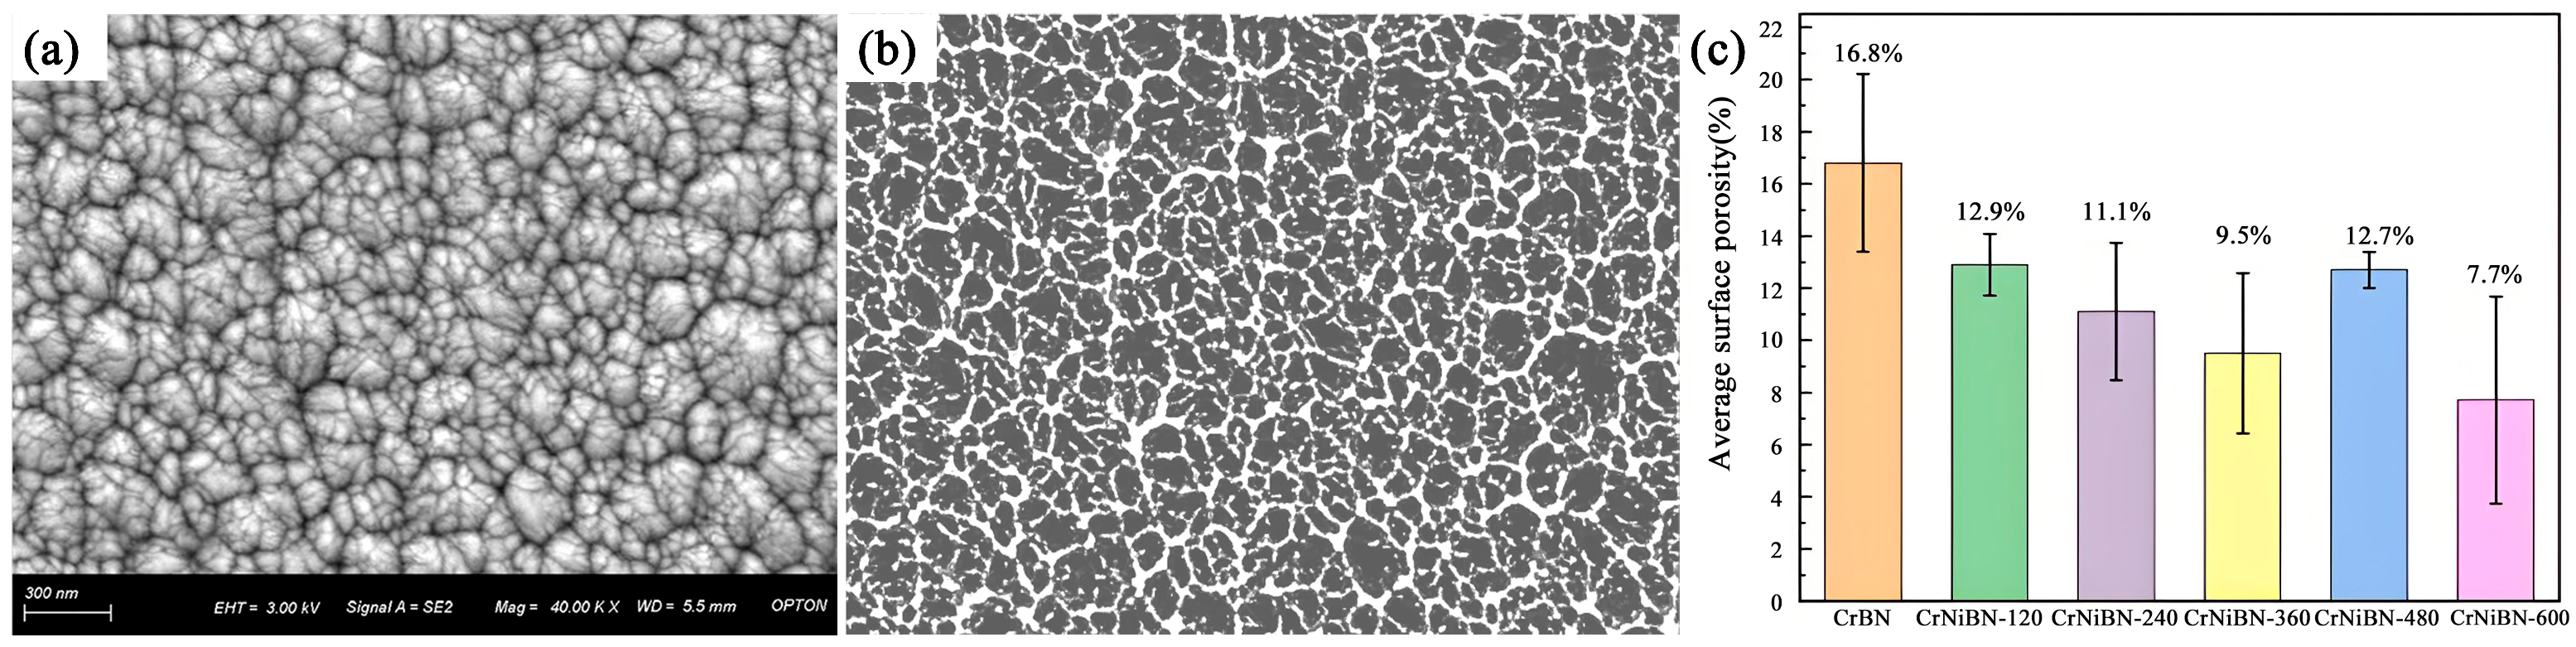
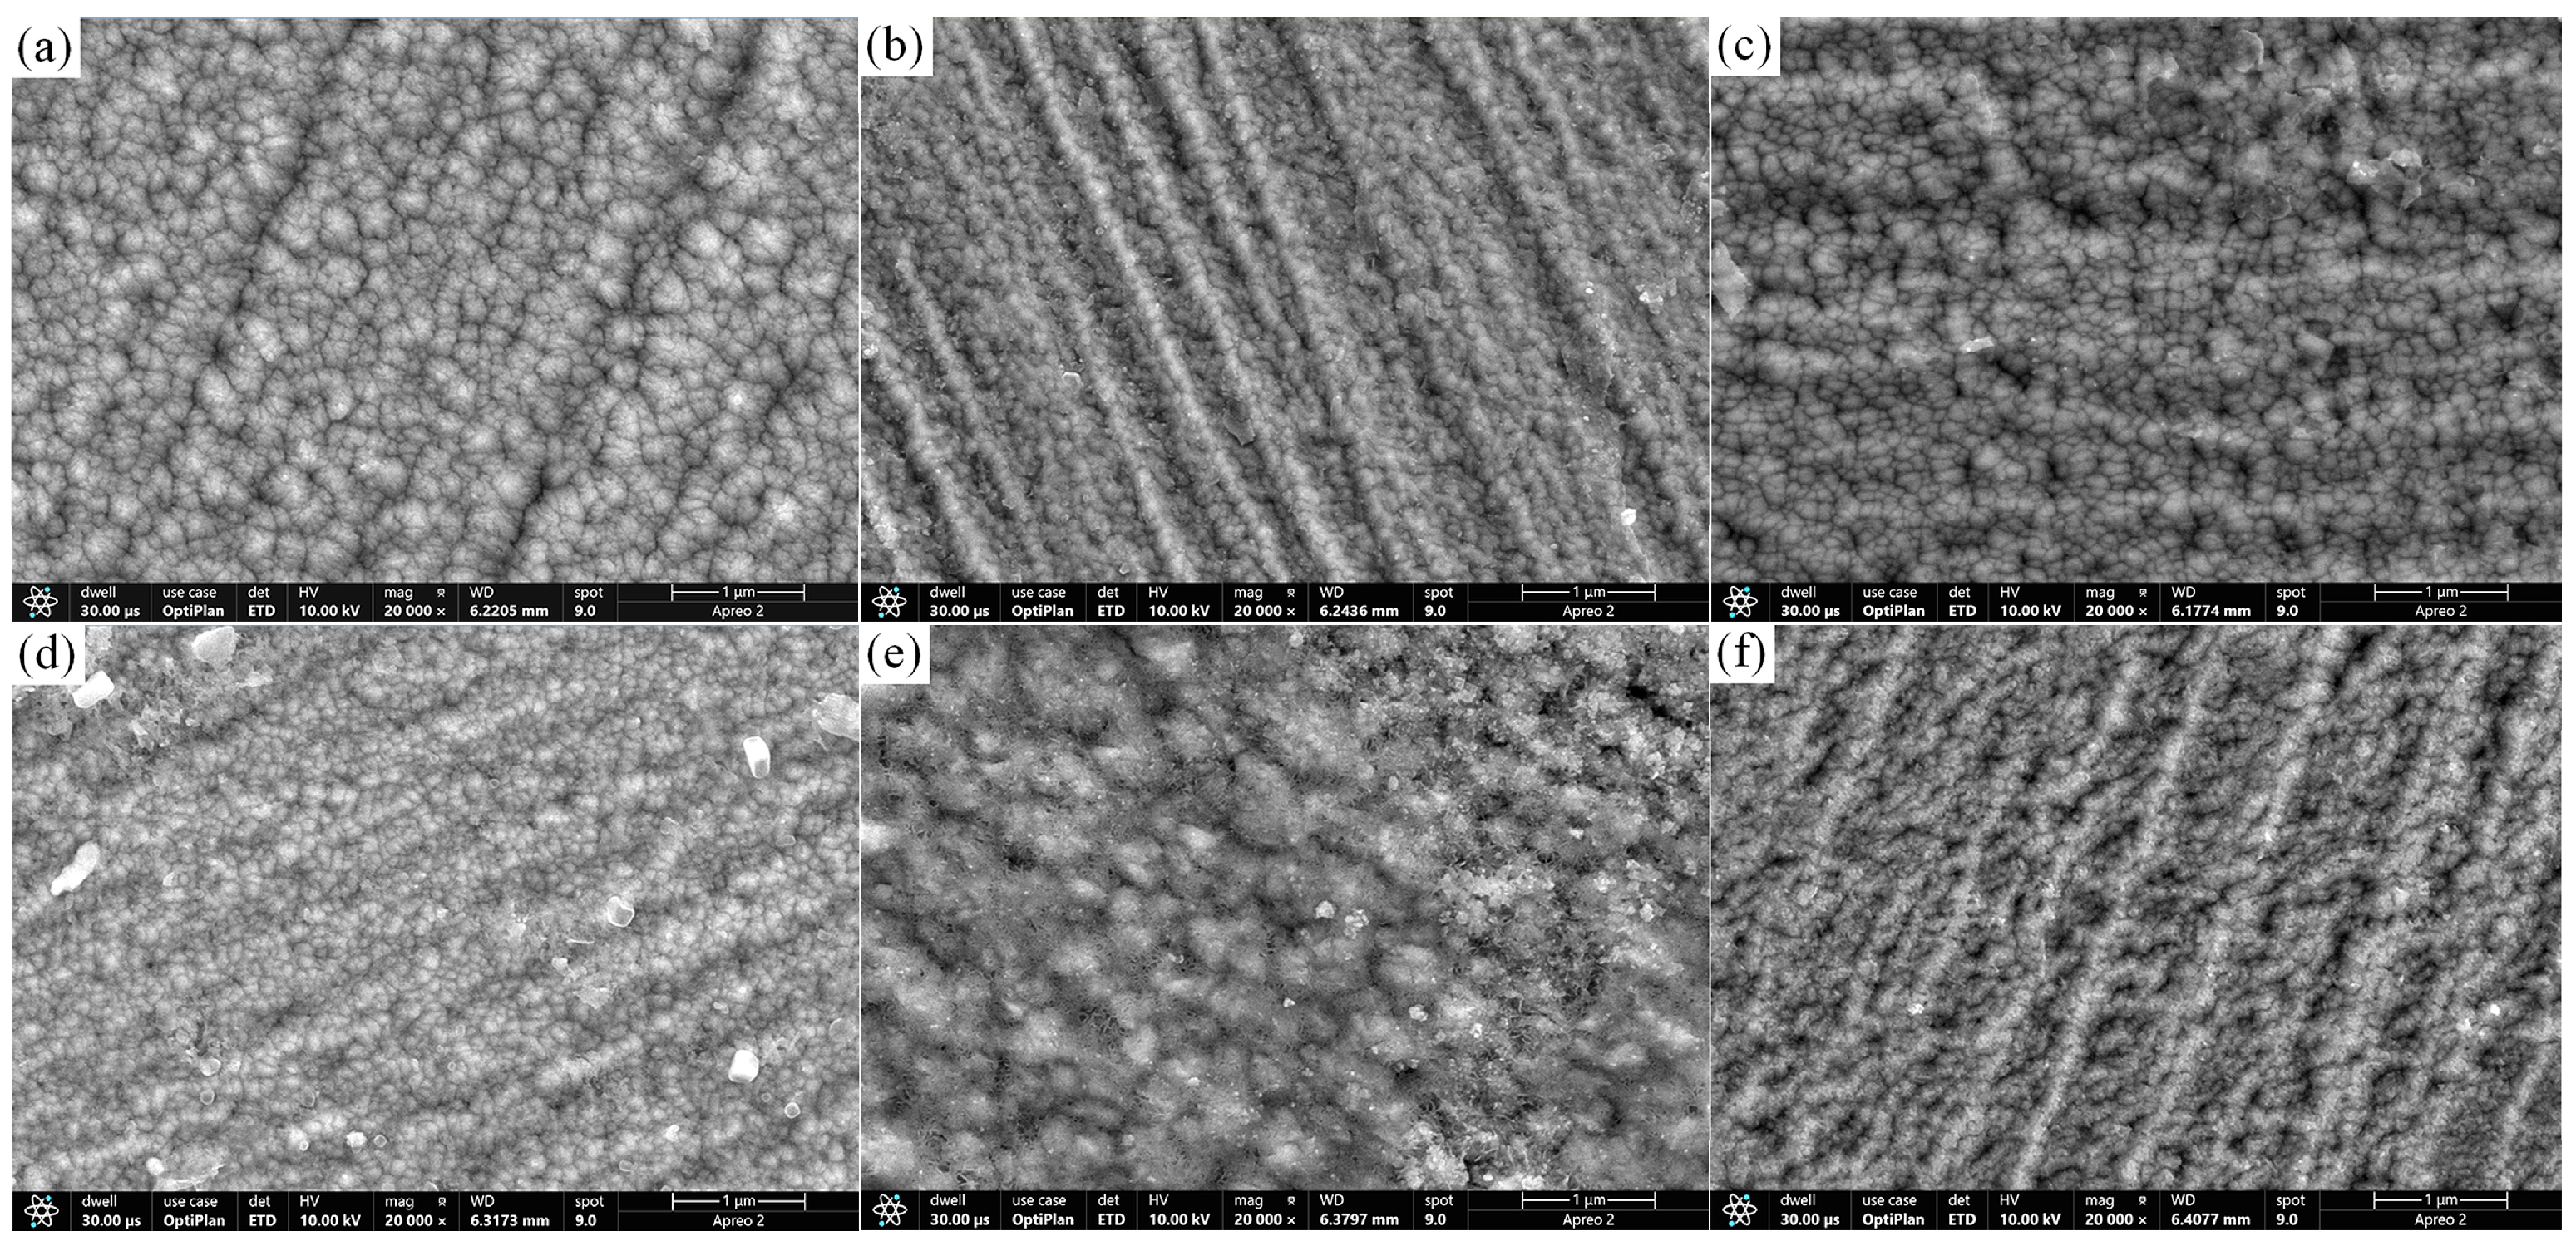
3.2. Surface Morphology and Surface Porosity of CrNiBN Coatings

In order to investigate the influence of Ni concentration on the surface porosity, the surface morphologies of coatings were observed at the magnification of 40,000× under secondary electron mode, which are illustrated in Figure 2. It could be seen that the CrBN coating presents the cauliflower-like morphology, and many small gaps are observed on each crystal column marked by red line in Figure 2a. In contrast, after Ni incorporation, the CrNiBN coatings present smooth morphology without any small gaps on crystal columns. Moreover, some crystal columns connect to each other so as to form big and long crystal columns, which have been marked by a yellow line in Figure 2b,c,e.
Based on the surface morphologies, the surface porosity of coatings was calculated. The calculation process and results of surface porosity are illustrated in Figure 3. The surface morphology as shown in Figure 3a was imported into software ImageJ, and the pore defect was marked manually first. Afterwards, the ImageJ would automatically identify all of the pore defects according to the machine learning and image recognition functions. As shown in Figure 3b, the black marks are pore defects identified by ImageJ. Through this method, the surface porosity of coating could be calculated automatically. As stated in Section 2.2, in order to minimize the measurement error, three images of surface morphologies were used to calculate the surface porosity, and the average results are illustrated in Figure 3c. It could be seen that the surface porosity of CrBN coatings is 16.8% while that of CrNiBN coatings is in the range of 7.7% to 12.9%. Moreover, with the increase in Ni concentration, the surface porosity of CrNiBN coatings shows a decreasing trend from 12.9% to 7.7%. This indicates that the Ni incorporation could make CrBN coating become compact, degree of which is proportional to Ni concentration. As stated in Section 3.1, the existence state of incorporated Ni is amorphous Ni, which could fill in the small gaps between crystal columns and therefore lower the surface porosity. The high surface porosity of 12.7% for CrNiBN-480 coating is attributed to the small gaps on each crystal columns marked by red line in Figure 2e.
The cross-sectional morphologies of CrNiBN coatings are illustrated in Figure 4. The Cr and CrN tiers with the individual thickness of 200 nm could be observed clearly. By contrast, no obvious Cr(Ni)BN tier could be observed. The reason is the gradually changing deposition parameters. To be specific, since the powers of CrB2 and NiCr targets increased from 0 W to 720 W and from 0 W to set point gradually for the deposition of Cr(Ni)BN tier, which subsequently followed by the deposition of CrNiBN top layer. Thus, no interface between the Cr(Ni)BN tier and CrNiBN top layer could be observed in Figure 4. By measurement, the total coating thickness varies in the range of 1.8 μm to 2.1 μm.

3.3. Electrochemical Properties

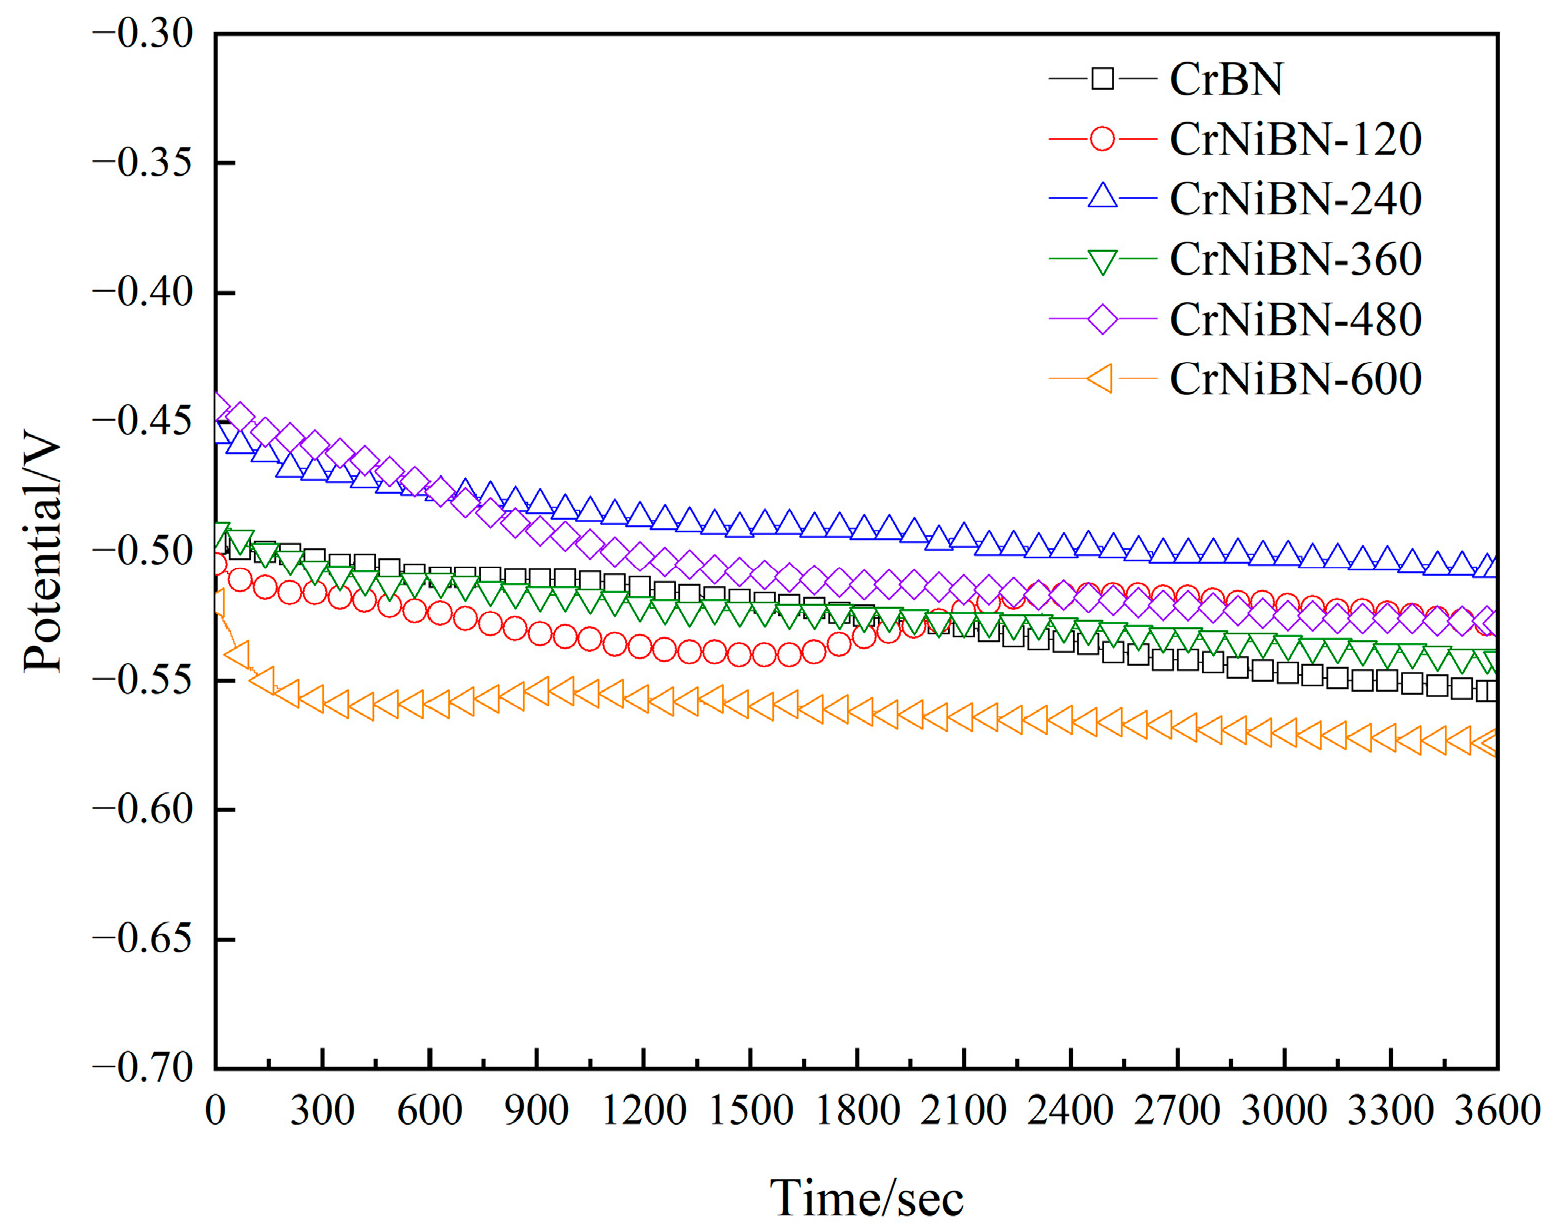
3.3.1. Analysis of Open Circuit Potential Results

The open circuit potential can reflect the occurrence difficulty of corrosion, and therefore the OCP curves of CrBN and CrNiBN coatings are illustrated in Figure 5 for comparison. As is shown, except CrNiBN-600 coating, the OCP of other coatings decreases gradually during the first 900 s owing to the infiltration process of 3.5 wt% NaCl solution. After 900 s, the OCP curves enter relatively steady state. For comparison, the OCP values at the ending point are compared. It is obvious that except for the CrNiBN-600 coating, the other CrNiBN coatings present higher OCP values from −0.507 V to −0.542 V compared to −0.554 V from the CrBN coating due to the incorporation of Ni. This indicates that the moderate incorporation of Ni (4.35 at%−12.62 at%) could lower the corrosion occurrence. Two reasons contribute to this result. The first one is the relative potential. Typically, the potential of saturated calomel electrode relative to standard hydrogen electrode is 0.244 V, and the potential of Ni relative to standard hydrogen electrode is −0.250 V. Therefore, the potential of Ni relative to saturated calomel electrode is −0.494 V. As stated above, the OCP value of CrBN coatings is −0.554 V, which is lower than −0.494 V. Thus, doping Ni into CrBN coatings would shift the OCP more positively, and similar phenomena has been found in Ni-CrSiN coatings system [28]. The second one is the lower surface porosity after Ni incorporation which has been presented in Section 3.2. The low surface porosity would hinder the penetration of 3.5 wt% NaCl solution, thus leading to high OCP values.

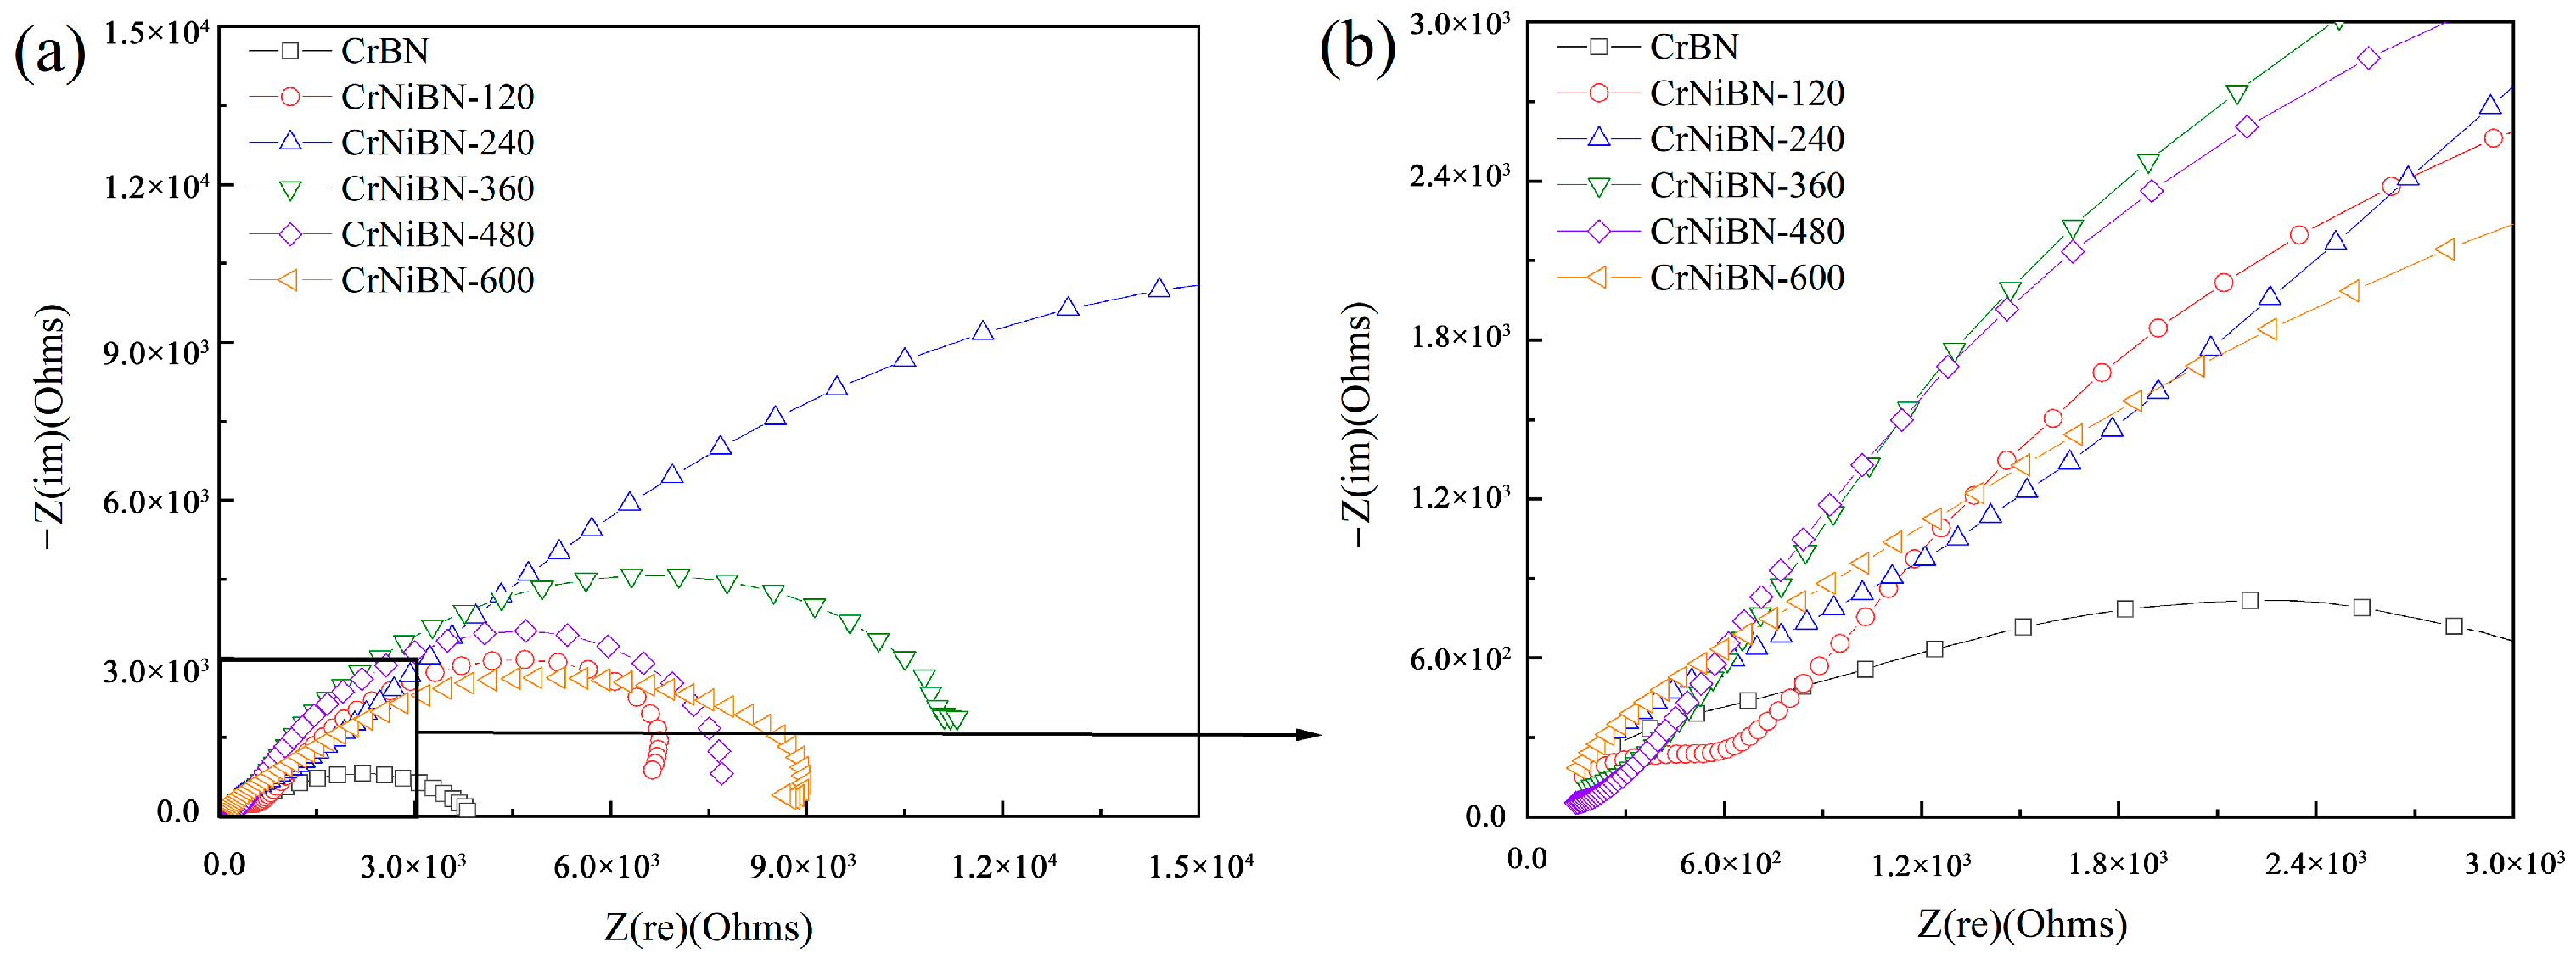
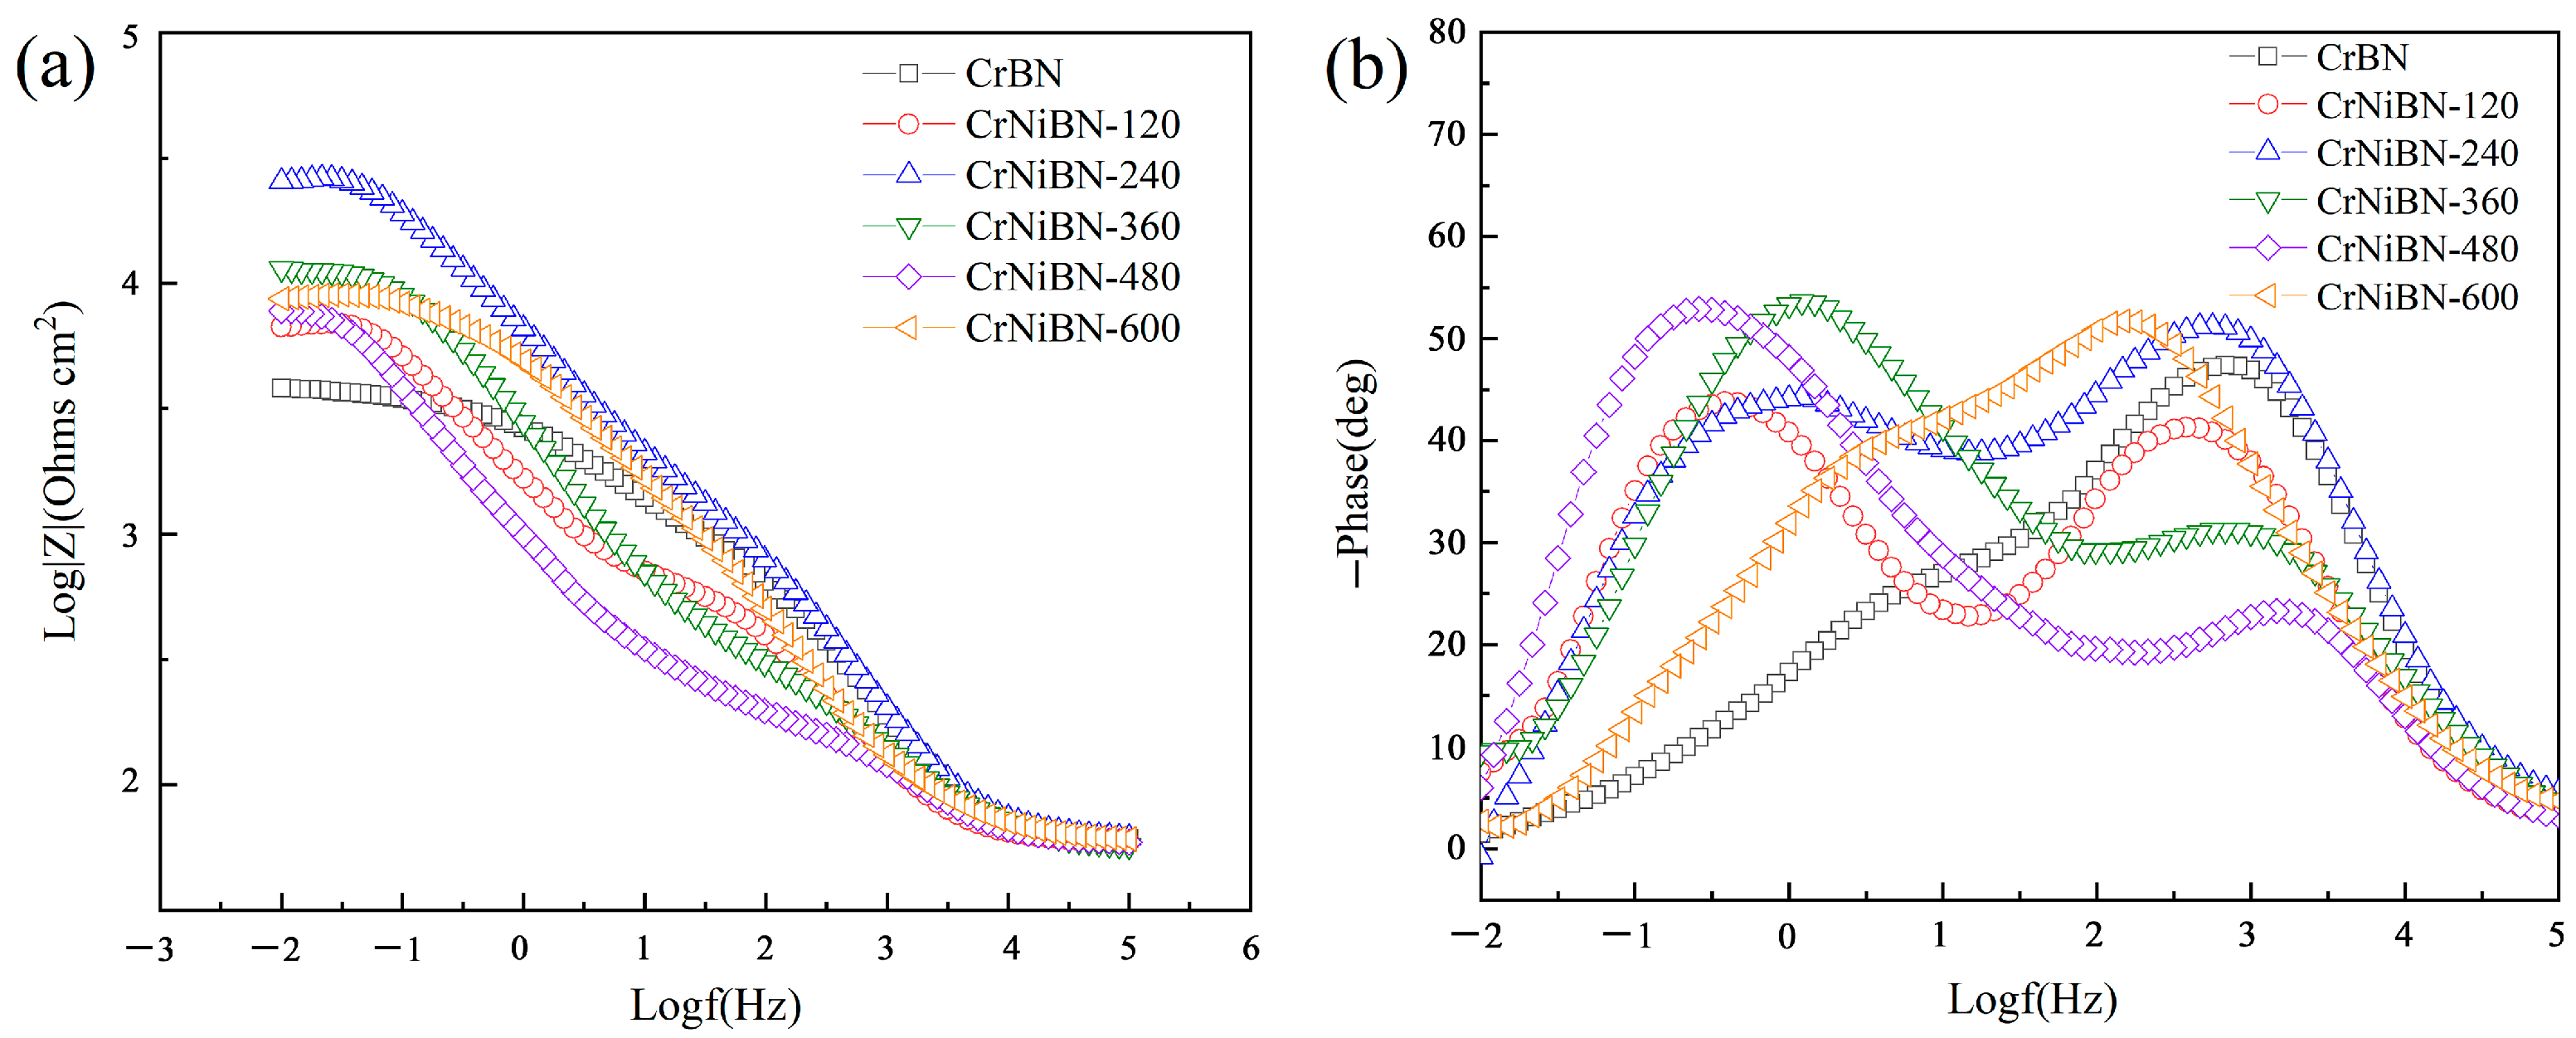
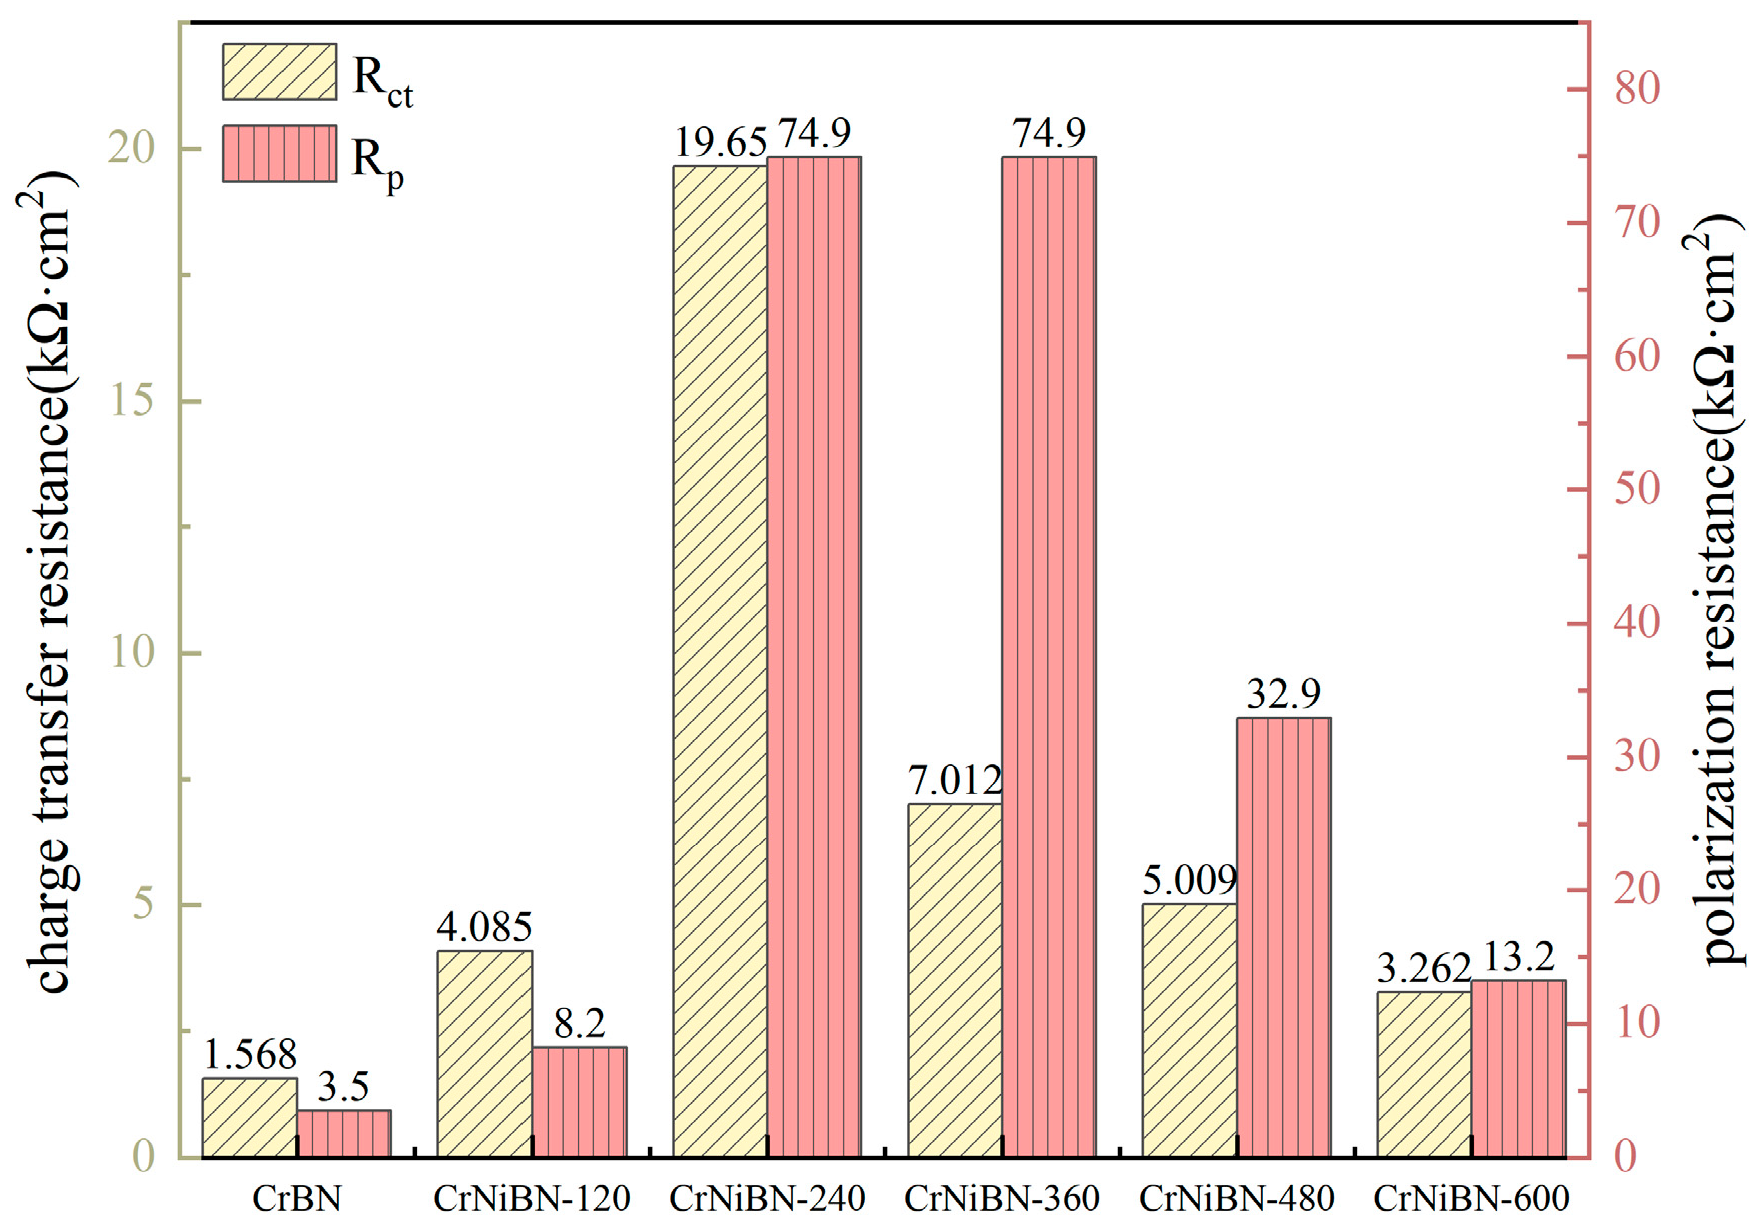
3.3.2. Analysis of Electrochemical Impedance Spectroscopy Results

Electrochemical impedance spectroscopy (EIS) is a frequency domain measurement method that uses small-amplitude sinusoidal potential or current as the perturbation signal. Due to the wide frequency range of measurements, it can provide more kinetic information and electrode interface structure information compared to other conventional electrochemical methods. Figure 6a,b show the whole and local Nyquist curves of CrBN and CrNiBN coatings, respectively. It could be seen that the Nyquist curves of both CrBN and CrNiBN coatings present two incomplete capacitive arcs. It demonstrates that there are two time constants [37]. To compare the second capacitive arc at low frequency, the CrBN coating presents the smallest capacitive arc. As the sputtering power of NiCr alloy target increases from 120 W to 600 W, the radius of the capacitive arc first increases to the maximum for CrNiBN-240 coating and then decreases gradually.
In order to clearly compare the corrosion resistance, the corresponding Bode plots including impedance modulus (|Z|) and phase are illustrated in Figure 7a,b. As shown in Figure 7a, the CrBN coating presents the lowest |Z| of 3813 Ω·cm2 at the frequency of 10 mHz. With the NiCr alloy, target power increases from 120 W to 240 W, the impedance modulus (|Z|) increases to 6701 Ω·cm2 for CrNiBN-120 coating and 25,497 Ω·cm2 for CrNiBN-240 coatings. However, when the NiCr alloy target power keeps increasing to 360 W, 480 W, and 600 W, the impedance modulus (|Z|) decreases gradually to 8661 Ω·cm2. It indicates that the incorporation of Ni could enhance the corrosion resistance of CrBN coatings. More importantly, the optimal incorporation of Ni is 7.28 at% for CrNiBN-240 coating, which is consistent with the variation in capacitive arc shown in Figure 6a. From another point of view, two peaks observed on the phase curve in Figure 7b demonstrate the two time constants as well. Moreover, the phase of CrNiBN-240 fluctuates between 40° and 55° over the frequency range from 100 mHz to 1000 Hz, while the phases of other coatings fluctuate between 15° and 55° at the same frequency range. It demonstrates that the CrNiBN-240 coating exhibits more capacitive characteristics over the same frequency range, providing stronger protection.
In order to understand the electrochemical construction of CrNiBN coatings, the equivalent circuit (EC) was used to fit EIS results [38,39]. Since two capacitive arcs and two peaks are observed in Nyquist and Bode plots, the equivalent circuit with a dual-time-constant as shown in Figure 8 was used to fit the EIS data. In this equivalent circuit, the electrolyte resistance (Rs) originates from the solution ohmic contribution between the working electrode and the reference electrode. The pore resistance (Rpo) reflects the coating’s barrier effect against electrolyte penetration with CPEpo being the corresponding coating capacitance. The charge transfer resistance (Rct) is related to the formation of the double layer at the 45 steel/electrolyte interface with CPEdl being the corresponding double-layer capacitance. Among these, the constant phase element (CPE) is used to describe non-ideal capacitive behavior, and its impedance expression is
Z Q = 1 / [ Y 0 ( j ω ) n ] .
In this formula, Y0 is the capacitance (Fs/n/m2), ω is the angular frequency (rad/s), and n is the CPE index (ideal capacitance when n = 1, non-ideal capacitance when n < 1). The CPE index is related to the electrode surface roughness and non-uniformity.
To ensure the reliability of fitting results by equivalent circuit, the chi-squared values (χ2) were required to achieve magnitude order of ×10−4. The fitting results of the equivalent circuit components by software ZsimpWin are listed in Table 2 with the corresponding chi-squared values (χ2) of 1.035–7.203 × 10⁻⁴. Owing to the systemic error at high frequency [40], the Rs value fluctuates from 2.690 to 2.990 Ω·cm2. With regard to the pore resistance Rpo, CrNiBN-600 coatings present the highest value of 1.390 × 10³ Ω·cm2, which is closely related to its lowest surface porosity of 7.7%. To compare the corrosion resistance of coatings, the charge transfer resistance Rct is commonly used [41,42]. The Rct value of CrBN coating is 1.568 × 10³ Ω·cm2 while the Rct values of CrNiBN coatings are in the range 3.262 × 10³ Ω·cm2 to 1.965 × 10⁴ Ω·cm2. This indicates that doping with Ni enhances the corrosion resistance of the CrBN coating. Moreover, as the NiCr alloy target power increases, Rct first increases to 1.965 × 10⁴ Ω·cm2 for CrNiBN-240 coating and then decreases to 3.262 × 10³ Ω·cm2 for CrNiBN-600 coating. By calculating the ratio of Rct, the corrosion inhibition efficiency increases from 260% to 1253% and then decreases to 220%. It demonstrates that with the increase in Ni content, corrosion resistance becomes stronger first but then becomes weaker. Additionally, over the frequency range from 100 mHz to 1 Hz, the phase of CrBN coating increases from 5° to 25°. The low (CPE-n)dl of 0.5544 is in well agreement. In contrast, the phase of CrNiBN coating fluctuates from 40° to 50°, which is consistent with the high (CPE-n)dl from 0.6128 to 0.7641. As stated in Equation (2), n is the CPE index indicating the deviation degree from an ideal capacitor. Thus, the high (CPE-n)dl of CrNiBN coatings indicates that they act more like a capacitor as compared to CrBN coating.

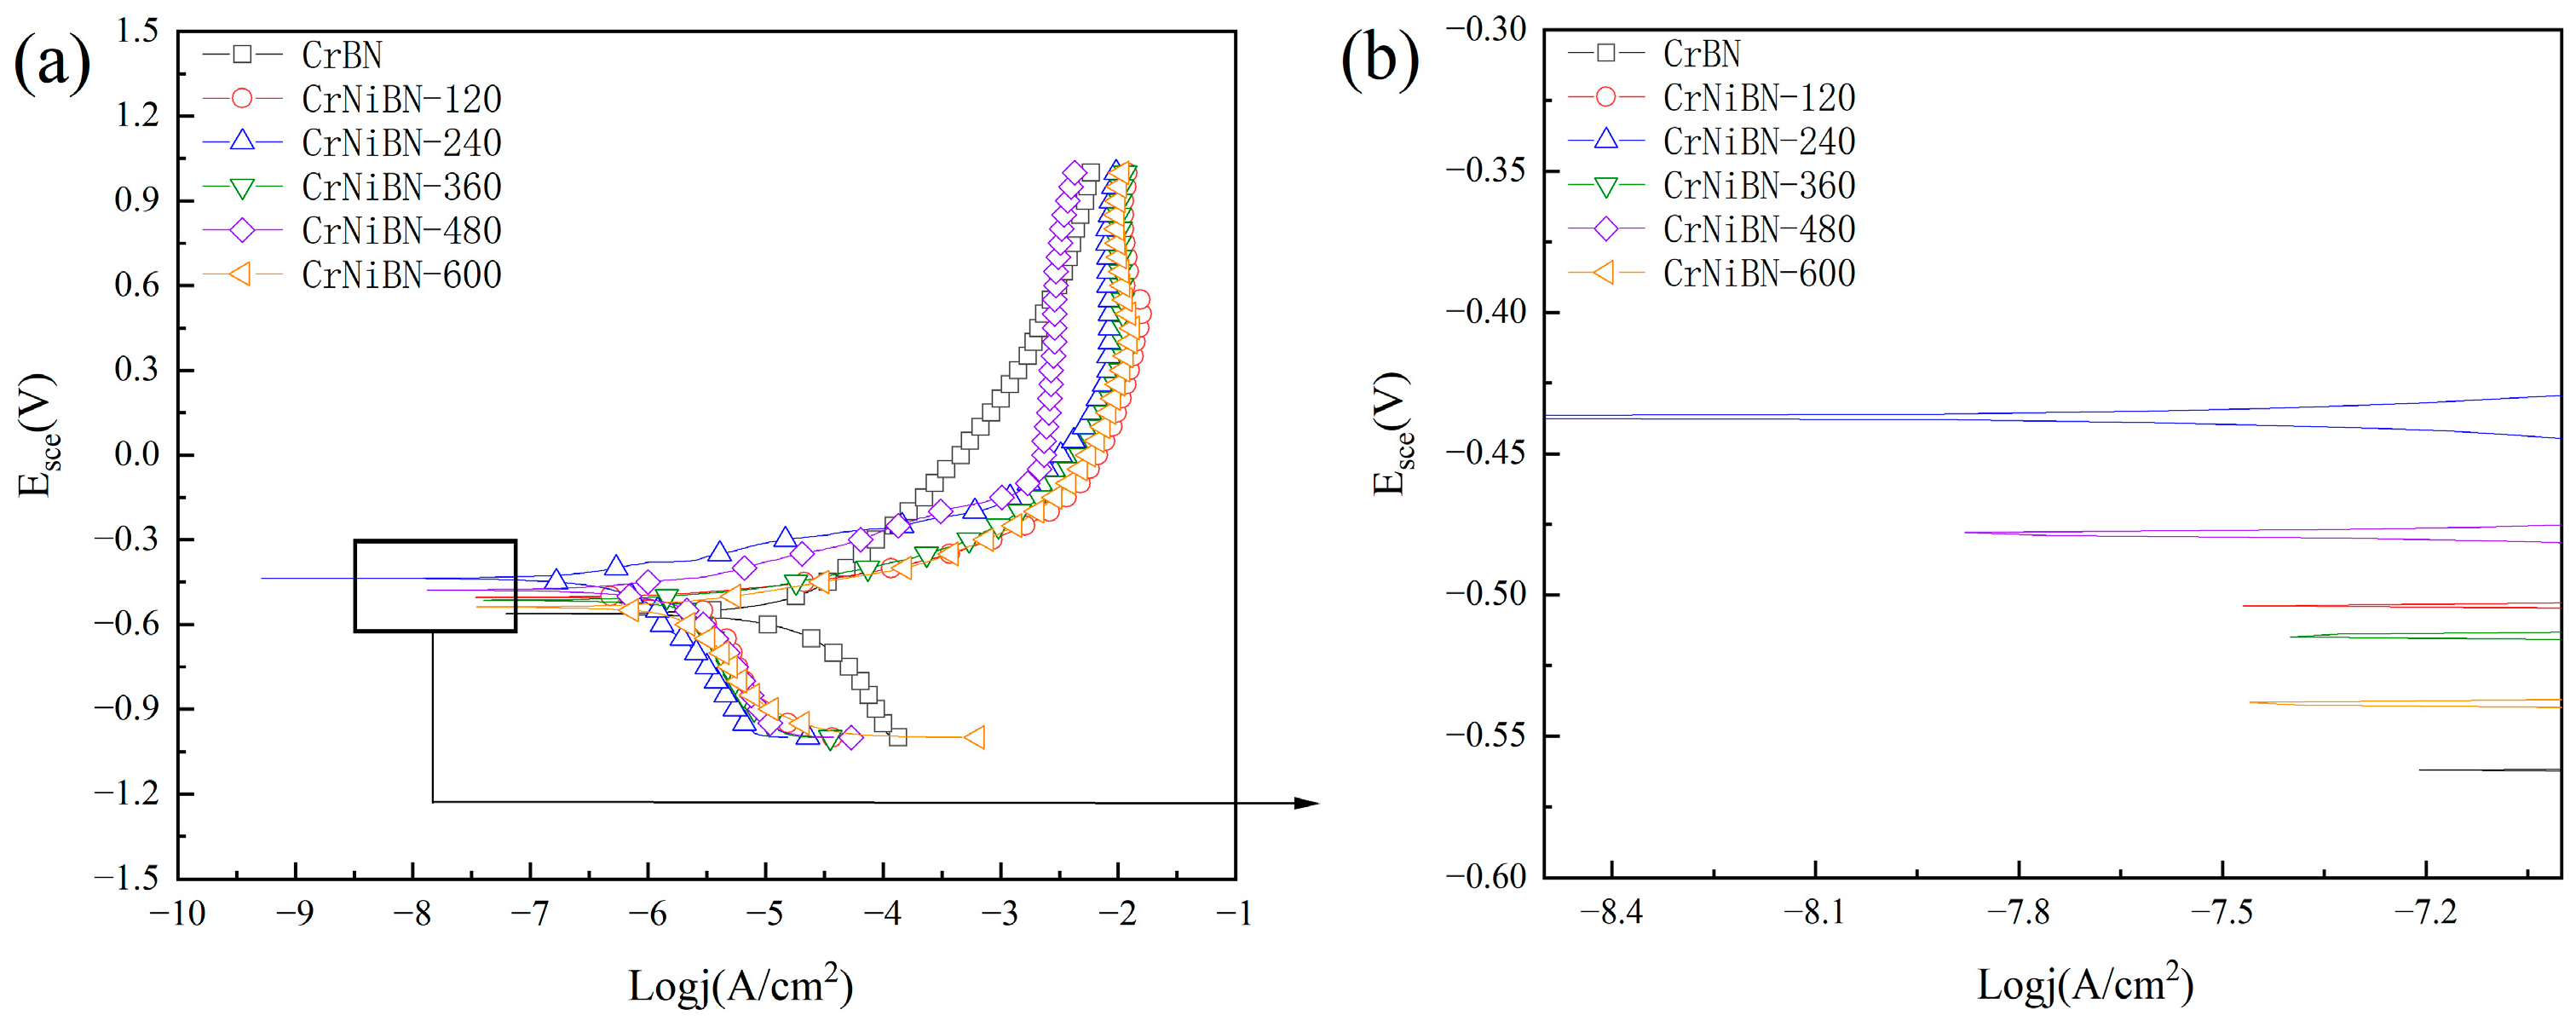
3.3.3. Analysis of Potential Dynamic Polarization Results

Generally, the self-corrosion current density reflects the corrosion rate of coatings from a kinetic perspective. The lower its value, the slower the corrosion rate, indicating better corrosion resistance. Figure 9 shows the polarization curves of CrBN and CrNiBN coatings. First of all, the polarization curves of CrNiBN coatings shift to left direction as compared to that of CrBN coating after Ni incorporation as shown in Figure 9a. Namely, the corrosion current density becomes lower, and corrosion resistance becomes stronger. On the other hand, although CrNiBN-360 coating presents the highest self-corrosion potential of −0.4369 V, CrNiBN-240 coating presents the second highest self-corrosion potential of −0.4379 V as shown in Figure 9b. In contrast, the CrBN coating and CrNiBN-600 coatings present the lowest self-corrosion potential around −0.5411 V. These results of self-corrosion potential are consistent with the OCP results shown in Figure 5.
By using the Tafel curve extrapolation method, the self-corrosion potential (Ecorr), self-corrosion current density (Icorr), anodic Tafel slope (βa), and the slope of the cathode tower (βc) were obtained. Subsequently, the polarization resistance (Rp) was calculated using the Stern–Geary equation as Equation (1). The relevant parameters are listed in Table 3. The results show that the corrosion current densities Icorr of the CrNiBN coatings are in the range of 410.5 to 2898 nA/cm2, which are lower than 12,490 nA/cm2 of the CrBN coating, indicating that the Ni incorporation could significantly slow down the corrosion rate of CrBN coating. Compared with the polarization resistance Rp of the CrBN coating (3.5 kΩ·cm2), the Rp value of the CrNiBN coating first increases to 74.9 kΩ·cm2 for CrNiBN-240, and CrNiBN-360 coatings by an order of magnitude as the Ni content increases. Afterwards, the polarization resistance Rp gradually decreases to 13.2 kΩ·cm2 as the Ni content further increases. As compared with the self-corrosion current density 23 μA/cm2 of 45 steel in the published literature [11], the self-corrosion current densities of CrBN and CrNiBN coatings in this study vary from 12.49 μA/cm2 to 0.4105 μA/cm2. It proves the better corrosion resistance of CrBN and CrNiBN coatings than that of 45 steel.
As shown in Figure 10, the variation in the polarization resistance Rp is consistent with the variation of Rct value. Both EIS and PDP results demonstrate that the moderate Ni incorporation could enhance the corrosion resistance of CrBN coating. It could be found that the CrNiBN-240 coating presents the strongest corrosion resistance. Nevertheless, the more Ni incorporation would weaken the corrosion resistance of CrNiBN coatings. Even so, the corrosion resistance of CrNiBN coatings is better than that of CrBN coatings. Similar results have been reported in study [43], in which the moderate nickel ions implantation of 5 × 10¹⁷ ions/cm2 could enhance the corrosion resistance of CrN coating while the higher nickel ions implantation of 1 × 10¹⁸ ions/cm2 would slightly decrease the corrosion resistance. Nevertheless, the CrN coatings after nickel ions implantation presented better anti-corrosion performance than the un-implanted CrN coatings.
In order to reveal the corrosion mechanism, the surface morphologies of CrBN and CrNiBN coatings after PDP test were observed by SEM. The corresponding SEM images of surfaces after PDP test are illustrated in Figure 11.
As compared to the original surface morphologies shown in Figure 2, the features of the top surface cannot be seen clearly. Namely, the morphologies after the PDP test become blurred. It has been reported that this phenomenon is closely related to the generation of oxides, which would cover on the top surface and lower the conductivity [28]. In order to confirm this deduction, the EDS measurements were conducted on the CrNiBN-480 coatings, and the corresponding spectra results are listed in Table 4.
Since the EDS measurement of the light element such as O and C could be inaccurate, two regions were chosen for measurement to minimize the error. It could be found that 4.61 at% of O element was detected in region 1 while 2.72 at% of O element was detected in region 2. This proves the generation of oxides during PDP tests. According to the Gibbs energies of NiO, CrN, H2O, Cr2O3, and NH3 from Lange’s handbook of chemistry [44], the Gibbs energies of Equations (3) and (4) could be calculated. By comparing the Gibbs energies of −423.4 kJ·mol−1 and −250.10 kJ·mol−1, the formation of NiO is easier than the formation of Cr2O3. For this reason, more Ni incorporation would induce more oxidation even when the surface porosity is low. As a consequence, with increasing Ni content, the CrNiBN-480 and CrNiBN-600 coatings present decreasing charge transfer resistance Rct in Table 2 and polarization resistance Rp in Table 3.
2Ni + O2 → 2NiO
Δ G f 298 = 423.4   kJ mol 1 ,
2CrN + 3H2O → Cr2O3 + 2NH3
Δ G f 298 = 250.10   kJ mol 1
According to the above results, the corrosion resistance of CrNiBN coatings is subject to three factors, which are surface porosity, self-corrosion potential, and oxidation difficulty. It could be concluded that owing to the combination effects of moderate surface porosity, the highest self-corrosion potential and less oxidation, the CrNiBN-240 coating presents the best corrosion resistance.

4. Conclusions

In this study, the Ni with different concentrations was incorporated into CrBN coatings by adjusting sputtering power of NiCr alloy target. The microstructure, surface porosity, and electrochemical properties of CrNiBN coatings in seawater were investigated by open-circuit potential (OCP), electrochemical impedance spectroscopy (EIS), and potentio-dynamic polarization tests. The findings are as follows:
(1)
As compared to the CrBN coating, the surface morphology of CrNiBN coatings became compact with lower surface porosity. It could hinder the penetration channel.
(2)
After Ni incorporation, the open-circuit potential increased from −0.554 V to −0.507 V due to the low surface porosity and relative positive potential of Ni. It indicates that the occurrence of corrosion for CrNiBN coating became hard.
(3)
Owing to the combination effect of moderate surface porosity, the highest self-corrosion potential and less oxidation, the CrNiBN-240 coating presented the best corrosion resistance with the highest charge transfer resistance of 1.965 × 10⁴ Ω·cm2 and the highest polarization resistance of 74.9 kΩ·cm2.

Author Contributions

Conceptualization, Z.Z. (Zhidong Zhou) and Q.W.; methodology, Z.Z. (Zhidong Zhou) and Q.W.; validation, Z.Z. (Zhidong Zhou); X.W. and Q.W.; formal analysis, Z.Z. (Zhidong Zhou); X.W. and Q.W.; investigation, Z.Z. (Zhidong Zhou); X.W. and Q.W.; resources, Q.W.; G.Z. and Z.Z. (Zhifeng Zhou); data curation, Z.Z. (Zhidong Zhou) and X.W.; writing—original draft preparation, Z.Z. (Zhidong Zhou) and X.W.; writing—review and editing, Q.W.; G.Z. and Z.Z. (Zhifeng Zhou); supervision, Q.W.; G.Z. and Z.Z. (Zhifeng Zhou); project administration, Q.W. and G.Z.; funding acquisition, Z.Z. (Zhidong Zhou) All authors have read and agreed to the published version of the manuscript.

Funding

This research was funded by National Students’ Platform for Innovation and Entrepreneurship Training Program (Grant No. 202510287027Z).

Institutional Review Board Statement

Not applicable.

Informed Consent Statement

Not applicable.

Data Availability Statement

The data presented in this study are available on request from the corresponding author. The data are not publicly available due to privacy or ethical restrictions.

Acknowledgments

This work has been supported by National Students’ Platform for Innovation and Entrepreneurship Training Program (Grant No. 202510287027Z). We would like to acknowledge them for their financial support.

Conflicts of Interest

The authors declare no conflicts of interest.

Abbreviations

The following abbreviations are used in this manuscript:
SEMScanning Electron Microscope
EISElectrochemical Impedance Spectroscopy
PDPPotentio-dynamic Polarization
OCPOpen Circuit Potential

References

  1. Li, T.; Long, H.; Qiu, C.; Wang, M.; Li, D.; Dong, Z.; Gui, Y. Multi-objective optimization of process parameters of 45 steel laser cladding Ni60PTA alloy powder. Coatings 2022, 12, 939. [Google Scholar] [CrossRef]
  2. Abbas, A.T.; Sharma, N.; Soliman, M.S.; Rayes, M.M.; Sharma, R.C.; Elkaseer, A. Effect of wiper edge geometry on machining performance while turning AISI 1045 steel in dry conditions using the VIKOR-ML approach. Machines 2013, 11, 719. [Google Scholar] [CrossRef]
  3. Dong, H.; Zhang, J.; Wang, H.; Tian, F.; Wei, Q.; Qin, J.; Luo, G.; Shen, Q. Hardness gradient multilayer coating for enhancing tribological property of AISI 1045 steel. Surf. Coat. Technol. 2025, 512, 132405. [Google Scholar] [CrossRef]
  4. Liu, H.; Wang, C.; Zhang, X.; Jiang, Y.; Cai, C.; Tang, S. Improving the corrosion resistance and mechanical property of 45 steel surface by laser cladding with Ni60CuMoW alloy powder. Surf. Coat. Technol. 2013, 228, S296–S300. [Google Scholar] [CrossRef]
  5. Wang, C.; Li, W.; Xu, Y.; Luo, X.; Li, Z.; Li, W.; Song, C.; Wang, M.; Zhang, Z.; Huang, C. Effect of WC-17Co content on microstructure, mechanical properties and wear resistance of WC-17Co/Ni composites produced with cold spraying. Surf. Coat. Technol. 2024, 493, 131252. [Google Scholar] [CrossRef]
  6. Velasco, S.C.; Cavaleiro, A.; Carvalho, S. Functional properties of ceramic-Ag nanocomposite coatings produced by magnetron sputtering. Prog. Mater. Sci. 2016, 84, 158–191. [Google Scholar] [CrossRef]
  7. Liu, Y.; Yu, S.; Shi, Q.; Ge, X.; Wang, W. Multilayer coatings for tribology: A mini review. Nanomaterials 2022, 12, 1388. [Google Scholar] [CrossRef]
  8. Maskavizan, A.J.; Quintana, J.P.; Dalibón, E.L.; Márquez, A.B.; Brühl, S.P.; Farina, S.B. Evaluation of wear and corrosion resistance in acidic and chloride solutions of cathodic arc PVD chromium nitride coatings on untreated and plasma nitrided AISI 4140 steel. Surf. Coat. Tech. 2024, 494, 131476. [Google Scholar] [CrossRef]
  9. Liu, J.; Liu, C.; Zhang, X.; Yin, X.; Meng, F.; Liu, C. The microstructure and wear resistance of laser cladding Ni60/60%WC composite coatings. Metals 2025, 15, 166. [Google Scholar] [CrossRef]
  10. Ge, F.; Zhu, P.; Meng, F.; Xue, Q.; Huang, F. Achieving very low wear rates in binary transition-metal nitrides: The case of magnetron sputtered dense and highly oriented VN coatings. Surf. Coat. Tech. 2014, 248, 81–90. [Google Scholar] [CrossRef]
  11. Chen, W.; Yang, X.; Li, X.; Chai, C.; Liu, W. Study on microstructure and properties of nickel-based self-lubricating coating by laser cladding. Coatings 2022, 12, 753. [Google Scholar] [CrossRef]
  12. Liu, Y.; Yang, Y.; Liu, X.; Zheng, J.; Zhang, S. Tribocorrosion of CrN coatings on different steel substrates. Surf. Coat. Tech. 2024, 484, 130829. [Google Scholar] [CrossRef]
  13. Chen, K.; Pan, Y.; Tang, G.; Liang, D.; Hu, H.; Liu, X.; Liang, Z. Facile fabrication of TiN coatings to enhance the corrosion resistance of stainless steel. Surf. Coat. Tech. 2024, 494, 131450. [Google Scholar] [CrossRef]
  14. Ruden, A.; Restrepo-Parra, E.; Paladines, A.U.; Sequeda, F. Corrosion resistance of CrN thin films produced by dc magnetron sputtering. Appl. Surf. Sci. 2013, 270, 150–156. [Google Scholar] [CrossRef]
  15. Wang, H.; Shu, X.; Liu, E.; Han, Z.; Li, X.; Tang, B. Assessments on corrosion, tribological and impact fatigue performance of Ti- and TiN-coated stainless steels by plasma surface alloying technique. Surf. Coat. Tech. 2014, 239, 123–131. [Google Scholar] [CrossRef]
  16. Kong, F.; Luan, J.; Xie, F.; Zhang, Z.; Evaristo, M.; Cavaleiro, A. The green lubricant coatings deposited by physical vapor deposition for demanding tribological applications: A review. Coatings 2024, 14, 828. [Google Scholar] [CrossRef]
  17. Hudak, O.E.; Bahr, A.; Kutrowatz, P.; Wojcik, T.; Bohrn, F.; Solyom, L.; Schuster, R.; Shang, L.; Hunold, O.; Polcik, P.; et al. Pitting corrosion—Preferred chloride diffusion pathways in physical vapordeposited AlCrN coatings. Corros. Sci. 2023, 211, 110901. [Google Scholar] [CrossRef]
  18. Wang, Y.; Zhang, S. Toward hard yet tough ceramic coatings. Surf. Coat. Tech. 2014, 258, 1–16. [Google Scholar] [CrossRef]
  19. Su, K.; Liu, D.; Shao, T. Microstructure and mechanical properties of TiAlSiN nano-composite coatings deposited by ion beam assisted deposition. Sci. China Technol. Sci. 2015, 58, 1682–1688. [Google Scholar] [CrossRef]
  20. Wang, L.; Zhang, G.; Wood, R.J.K.; Wang, S.C.; Xue, Q. Fabrication of CrAlN nanocomposite films with high hardness and excellent anti-wear performance for gear application. Surf. Coat. Tech. 2010, 204, 3517–3524. [Google Scholar] [CrossRef]
  21. Martinez, E.; Sanjinés, R.; Karimi, A.; Esteve, J.; Levy, F. Mechanical properties of nanocomposite and multilayered Cr-Si-N sputtered thin films. Surf. Coat. Tech. 2004, 180–181, 570–574. [Google Scholar] [CrossRef]
  22. Park, J.; Chung, W.; Cho, Y.; Kim, K. Synthesis and mechanical properties of Cr-Si-N coatings deposited by a hybrid system of arc ion plating and sputtering techniques. Surf. Coat. Tech. 2004, 188–189, 425–430. [Google Scholar] [CrossRef]
  23. Wang, Q.; Kim, K. Microstructural control of Cr-Si-N films by a hybrid arc ion plating and magnetron sputtering process. Acta Mater. 2009, 57, 4974–4987. [Google Scholar] [CrossRef]
  24. Yoo, Y.; Hong, J.; Kim, G.; Lee, H.; Han, J. Effect of Si addition to CrN coatings on the corrosion resistance of CrN/stainless steel coating/substrate system in a deaerated 3.5 wt.% NaCl solution. Surf. Coat. Tech. 2007, 201, 9518–9523. [Google Scholar] [CrossRef]
  25. Bai, X.; Li, Y.; Guo, C.; Man, J.; Zhang, D.; Wan, Y.; Sun, H. Electrochemical corrosion and tribocorrosion behavior of CrN and CrAlN coatings in artificial seawater. Int. J. Appl. Ceram. Technol. 2024, 21, 3569–3582. [Google Scholar] [CrossRef]
  26. Wang, Y.; Tang, Y.; Wan, W.; Zhang, X. Effect of Ni doping on the microstructure and toughness of CrAlN coatings deposited by magnetron sputtering. Mater. Res. Express 2020, 7, 026414. [Google Scholar] [CrossRef]
  27. Wang, Q.; Lin, Y.; Zhou, F.; Kong, J. The influence of Ni concentration on the structure, mechanical and tribological properties of Ni-CrSiN coatings in seawater. J. Alloys Compd. 2020, 819, 152998. [Google Scholar] [CrossRef]
  28. Wang, Q.; Lin, Y.; Zhou, F.; Kong, J. Electrochemical properties promotion of CrSiN coatings in seawater via Ni incorporation. J. Alloys Compd. 2021, 856, 157450. [Google Scholar] [CrossRef]
  29. Wang, Q.; Jin, X.; Zhou, F. Comparison of mechanical and tribological properties of CrBN coatings modified by Ni or Cu incorporation. Friction 2022, 10, 516–529. [Google Scholar] [CrossRef]
  30. Image Processing and Analysis in Java. Available online: https://imagej.net/ij/.
  31. AlMarzooqi, F.; Bilad, M.; Mansoor, B.; Arafat, H. A comparative study of image analysis and porometry techniques for characterization of porous membranes. J. Mater. Sci. 2016, 51, 2017–2032. [Google Scholar] [CrossRef]
  32. Yan, W.; Wang, Z.; Wu, J.; Zhao, S.; Wang, J.; Wang, S. Enhancing the flux of brackish water TFCRO membrane by improving support surface porosity via a secondary pore-forming method. J. Membr. Sci. 2016, 498, 227–241. [Google Scholar] [CrossRef]
  33. Gao, W.; Wang, L.; Jin, Y.; Yao, Y.; Ding, Z.; Yang, W.; Liu, J. Effect of Si3N4/TaC particles on the structure and properties of microarc oxidation coatings on TC4 alloy. Coatings 2022, 12, 1247. [Google Scholar] [CrossRef]
  34. Tao, H.; Zhylinski, V.; Vereschaka, A.; Chayeuski, V.; Huo, Y.; Milovich, F.; Sotova, C.; Seleznev, A.; Salychits, O. Comparison of the mechanical properties and corrosion resistance of the Cr-CrN, Ti-TiN, Zr-ZrN, and Mo-MoN coatings. Coatings 2023, 13, 750. [Google Scholar] [CrossRef]
  35. Wu, B.; Yao, J.; Dong, H.; Chen, Z.; Liu, X. Enhancing the corrosion resistance of passivation films via the synergistic effects of graphene oxide and epoxy resin. Coatings 2025, 15, 444. [Google Scholar] [CrossRef]
  36. Anandan, C.; Grips, V.; Selvi, V.; Rajam, K. Electrochemical studies of stainless steel implanted with nitrogen and oxygen by plasma immersion ion implantation. Surf. Coat. Technol. 2007, 201, 7873. [Google Scholar] [CrossRef]
  37. Wang, Q.; Zhou, F.; Zhou, Z.; Wang, C.; Zhang, W.; Li, L.; Lee, S. Effect of titanium or chromium content on the electrochemical properties of amorphous carbon coatings in simulated body fluid. Electrochim. Acta 2013, 112, 603–611. [Google Scholar] [CrossRef]
  38. Sui, J.; Cai, W. Effect of bias voltage on the structure and electrochemical corrosion behaviour of hydrogenated amorphous carbon(a-C:H)films on NiTi alloys. Surf. Coat. Technol. 2007, 201, 6906. [Google Scholar] [CrossRef]
  39. Hang, R.; Ma, S.; Chu, P. Corrosion behaviour of titanium alloy in the presence of serum proteins. Diam. Relat. Mater. 2010, 19, 1230. [Google Scholar] [CrossRef]
  40. Zeng, A.; Liu, E.; Zhang, S.; Tan, S.; Hing, P.; Annergren, I.; Gao, J. Impedance study on electrochemical characteristic of sputtered DLC films. Thin Solid Film. 2003, 426, 258–264. [Google Scholar] [CrossRef]
  41. Krawiec, H.; Vignal, V.; Schwarzenboeck, E.; Banas, J. Role of plastic deformation and microstructure in the micro-electrochemical behaviour of Ti-6Al-4V in sodium chloride solution. Electrochim. Acta 2013, 104, 400–406. [Google Scholar] [CrossRef]
  42. Wang, W.; Alfantazi, A. Effect of microstructure and temperature on electrochemical behavior of niobium in phosphate-buffered saline solutions. J. Electrochem. Soc. 2013, 160, C1–C11. [Google Scholar] [CrossRef]
  43. Li, H.; Zhang, C.; Liu, C.; Huang, M. Improvement in corrosion resistance of CrN coatings. Surf. Coat. Technol. 2019, 365, 158–163. [Google Scholar] [CrossRef]
  44. Speight, J.G. Lange’s Handbook of Chemistry, 17th ed.; McGraw-Hill Education: New York, NY, USA, 2016; pp. 6.81–6.142. [Google Scholar]
Figure 1. The variation in element concentration as a function of NiCr alloy target power.
Coatings 15 00804 g001
Figure 2. Surface morphologies of (a) CrBN, (b) CrNiBN-120, (c) CrNiBN-240, (d) CrNiBN-360, (e) CrNiBN-480, (f) CrNiBN-600 coatings.
Coatings 15 00804 g002
Figure 3. (a) SEM image of surface morphology of CrBN coating, (b) output image by ImageJ after obtaining probability process, and (c) average surface porosities of CrBN and CrNiBN coatings.
Coatings 15 00804 g003
Figure 4. The cross-sectional morphologies of (a) CrBN, (b) CrNiBN-120, (c) CrNiBN-240, (d) CrNiBN-360, (e) CrNiBN-480, and (f) CrNiBN-600 coatings.
Coatings 15 00804 g004
Figure 5. The variation in OCP for CrBN and CrNiBN coatings in 3.5 wt% NaCl solution.
Coatings 15 00804 g005
Figure 6. (a) Whole Nyquist plots, (b) local Nyquist plots of CrBN and CrNiBN coatings.
Coatings 15 00804 g006
Figure 7. (a) Variation in log|Z| (b) variation in phase as a function of logf for CrBN and CrNiBN coatings.
Coatings 15 00804 g007
Figure 8. Equivalent circuit for CrBN and CrNiBN coatings.
Coatings 15 00804 g008
Figure 9. (a) Whole potential dynamic polarization curves, (b) local potential dynamic polarization curves for CrBN and CrNiBN coatings.
Coatings 15 00804 g009
Figure 10. The comparison of charge transfer resistance Rct and polarization resistance Rp for CrBN and CrNiBN coatings.
Coatings 15 00804 g010
Figure 11. The SEM images of surfaces for (a) CrBN, (b) CrNiBN-120, (c) CrNiBN-240, (d) CrNiBN-360, (e) CrNiBN-480, (f) CrNiBN-600 coatings after potentio-dynamic polarization test.
Coatings 15 00804 g011
Table 1. Specific deposition parameters of CrNiBN coatings.
ProcessCr Target PowerCrB2 Target PowerNiCr Target PowerAr FlowN2 FlowBias VoltageTime
Multi-layer transition architectureCr tier1150 W----50 sccm--−80 V10 min
CrN tier1150 W----50 sccmOEM 50%−80 V15 min
Cr(Ni)BN tier1150 W0 W → 720 W0 W → Set point50 sccmOEM 50%−80 V15 min
Top layerCrBN1150 W720 WSet point: 0 W50 sccmOEM 50%−80 V80 min
CrNiBN-1201150 W720 WSet point: 120 W50 sccmOEM 50%−80 V75 min
CrNiBN-2401150 W720 WSet point: 240 W50 sccmOEM 50%−80 V70 min
CrNiBN-3601150 W720 WSet point: 360 W50 sccmOEM 50%−80 V65 min
CrNiBN-4801150 W720 WSet point: 480 W50 sccmOEM 50%−80 V60 min
CrNiBN-6001150 W720 WSet point: 600 W50 sccmOEM 50%−80 V55 min
Table 2. Characteristics of the equivalent circuit derived from the EIS spectra.
CoatingsRs
(Ω·cm2)
(CPE-Y0)po
(F/cm2)
(CPE-n)poRpo
(Ω·cm2)
(CPE-Y0)dl
(F/cm2)
(CPE-n)dlRct
(Ω·cm2)
Inhibition Efficiency (%)
CrBN29.758.691 × 10−60.82523.620 × 1021.786 × 10−40.55441.568 × 103--
CrNiBN-12027.974.119 × 10−50.72132.844 × 1024.647 × 10−40.72534.085 × 103260
CrNiBN-24029.791.074 × 10−50.79446.779 × 1029.100 × 10−50.61281.965 × 1041253
CrNiBN-36026.905.624 × 10−50.65642.064 × 1021.292 × 10−40.76417.012 × 103447
CrNiBN-48027.628.501 × 10−50.63901.078 × 1025.046 × 10−40.73965.009 × 103319
CrNiBN-60029.904.026 × 10−50.71271.390 × 1037.644 × 10−50.71493.262 × 103220
Table 3. Results of potentio-dynamic polarization tests.
CoatingsEcorr (E vs. SCE)Icorr (nA/cm2)βa (V)βc (V)Rp (kΩ·cm2)
CrBN−0.5627124900.1970.2083.5
CrNiBN-120−0.504728980.0590.7558.2
CrNiBN-240−0.4379410.50.1010.23774.9
CrNiBN-360−0.4369456.20.1010.35674.9
CrNiBN-480−0.476010200.1020.31732.9
CrNiBN-600−0.541118390.0690.2913.2
Table 4. The EDS results of two regions on the surface of CrNiBN-480 coatings after PDP test.
CrNiBN-480Cr (at%)Ni (at%)B (at%)N (at%)O (at%)
Region 129.906.9010.6547.944.61
Region 230.336.9113.1946.862.72
Disclaimer/Publisher’s Note: The statements, opinions and data contained in all publications are solely those of the individual author(s) and contributor(s) and not of MDPI and/or the editor(s). MDPI and/or the editor(s) disclaim responsibility for any injury to people or property resulting from any ideas, methods, instructions or products referred to in the content.

