Abstract
In shield tunneling, ensuring bonding performance at new-to-old concrete interfaces between segments and linings is crucial for composite lining stability. While extensive research exists on the mechanical bonding behavior of such interfaces, comparative studies on two prevalent treatment methods—scabbling and grooving—remain limited. This study systematically evaluates these techniques’ effects on interfacial bonding via direct shear tests, benchmarking against smooth-interface specimens. Complementary cohesive zone modeling simulations further analyze stress distribution and damage evolution during shear failure. The results demonstrate that scabbled specimens exhibit 10.5%~18.2% higher shear strength than grooved counterparts under increasing normal stress, with both treatments significantly enhancing load–transfer synergy through mechanical interlocking. Furthermore, the energy-based bilinear cohesive model accurately predicts full-interface behavior, providing practical guidance for interface treatment selection in tunneling engineering.
1. Introduction
The rapid development of infrastructure construction has led to a widespread adoption of shield tunneling methods in hydraulic tunnel engineering for water conveyance, drainage, and transportation systems, owing to their operational efficiency and environmental benefits [1]. Under complex geological conditions such as high water pressure and weak strata, the bearing capacity and durability of traditional single-layer linings can no longer meet engineering requirements [2]. Consequently, water conveyance projects have adopted shield tunneling with double-layer composite linings as the structural solution for water tunnels [3]. The focus of research and design theories has consequently shifted to double-layer composite lining systems. Driven by economic considerations and engineering requirements, current double-layer composite structures now predominantly employ reinforced concrete as the inner lining [4]. This has led to the development of a comprehensive structural configuration described as “surrounding rock + precast segments + reinforced concrete lining” [5,6].
As a predominant structural configuration in such projects, composite linings comprising outer precast shield segments and inner cast-in-place reinforced concrete demonstrate a load-bearing capacity and durability fundamentally governed by the synergistic mechanical interaction between these components [7]. However, as the weak link of the composite lining, the interface between the old and new concrete often causes structural hollowing, leakage, and even cracking due to the failure of the interface bonding, which seriously affects the safety of the project [8,9,10]. Previous studies identify three primary causes of insufficient interfacial bond strength: differential shrinkage between concrete layers [11], elevated porosity at the interface [12], and inadequate mechanical interlocking [13]. Conventional section-enlargement reinforcement procedures typically involve four sequential phases: (1) surface preparation involving contaminant removal [14], (2) the application of interface modifiers, (3) formwork installation and fresh concrete casting [15], and (4) specimen curing [16]. Interfacial mechanical analyses reveal a strong positive correlation between substrate surface roughness parameters and bond strength [17,18,19,20]. This empirical relationship provides essential theoretical guidance for optimizing section-enlargement reinforcement methodologies [21].
In this context, surface treatment technologies have emerged as a critical technical approach for enhancing composite lining performance, primarily through densification of the interfacial transition zone and improved mechanical interlocking mechanisms [22]. Yan, Refs. [23,24,25], conducted comparative shear tests on cuboid bond specimens with new-to-old concrete interfaces treated by manual random chiseling and grooving methods. The shear strength analysis revealed comparable mechanical performances between the two techniques, while grooving demonstrated superior construction quality control. Cai [26] systematically evaluated interfacial treatment effects through dual-surface shear tests, four-point bending tests, and splitting tensile strength measurements. The results highlighted that an increased volumetric density of surface treatments significantly enhanced bond strength stability, with groove orientation relative to loading direction proving to be critical to interfacial performance.
Huanhuan Li [27] developed five triangular groove configurations with varying inclination angles (15–90°) based on stochastically rough concrete surfaces created through grouting tests. Direct shear tests comparing sand–concrete interfaces demonstrated: (1) shear strength positively correlated with the groove inclination angle, and (2) randomly rough surfaces exhibited intermediate friction angles between the 70° and 90° grooved specimens. Zhang [28] quantified interface performance across three reinforcement orientations (top, side, and bottom), revealing a 30% shear strength improvement in rebar-anchored systems versus grooved interfaces. The composite treatment combining chiseling, threaded rebar implantation, and epoxy coating achieved optimal shear resistance in bottom reinforcement configurations.
Wangxi Z [29] analyzed 24 Z-shaped specimens (14 without/10 with load transfer dowels) under direct shear, identifying three key findings: (1) non-dowel specimens exhibited brittle shear failure, (2) roughness density dominated shear strength variation, and (3) chiseled interfaces outperformed grooved surfaces in shear resistance. Tian [30] integrated experimental and numerical methods to assess shear-strengthening effects of rebar arrangements, demonstrating that non-reinforced interfaces attained only 30% of monolithic concrete’s shear capacity, while properly reinforced systems achieved 40%–70% performance recovery.
However, existing research lacks comparative studies on the bonding methods between tunnel segments and linings, specifically regarding the grooving method and scabbling method. In particular, there is insufficient simulation methodology for analyzing stress distribution at grooved interfaces between new and old concrete during failure processes. Therefore, this study employs direct shear tests under normal pressure to investigate the shear strength of new-to-old concrete interfaces treated with these two methods. Cohesive elements were adopted to simulate the direct shear behavior, revealing crack propagation patterns and shear resistance characteristics at the interfaces. Furthermore, the influence of different groove depths on stress evolution during interfacial failure was examined. The simulation results were rigorously validated against experimental data, establishing a numerical modeling framework for new-to-old concrete interfaces and providing practical recommendations for engineering applications.
2. Design of Direct Shear Testing Program for New-Old Concrete Interfaces
2.1. Specimen Design
The cement used was Grade 52.5 ordinary Portland cement produced by Zhengzhou Jinlong Cement Plant. Fine aggregates consisted of natural river sand with a fineness modulus of 2.94, while coarse aggregates were continuously graded crushed stones with particle sizes ranging from 5 to 20 mm. The gradation curves of both fine and coarse aggregates are illustrated in Figure 1. A polycarboxylate-based high-performance water reducer was employed as the chemical admixture, with primary components including polyether monomers (TPEG and HPEG), acrylic acid, and ammonium sulfate. This water reducer demonstrated a water reduction rate of 27%, a solid content of approximately 39.7%, and a pH value of 6.0.
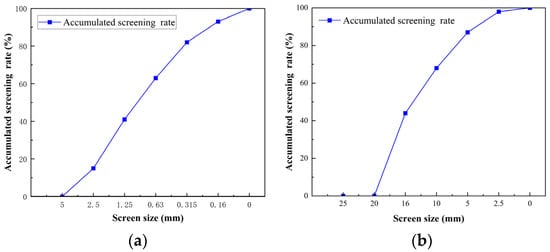
Figure 1.
(a) Grading of coarse aggregates, and (b) Grading of fine aggregates.
According to the grade of concrete commonly used in shield tunnels, the old concrete was designed for C55 compressive strength (55 MPa) while the new concrete targeted a C35 grade (35 MPa). Table 1 details the mixture proportions formulated in compliance with the Chinese Code for Mix Proportion Design of Ordinary Concrete (JGJ 55-2011) [31]. The actual compressive strengths of both concrete types were experimentally determined through standard cube tests.

Table 1.
Concrete Mix Proportion Design.
Before the formal test, the properties of the above two types of concrete were tested according to the relevant specifications [31], and the test results of the test blocks reserved for determining the compressive strength of concrete are shown in Table 2.
Table 2.
Compressive Strength Test Results of New–Old Concrete Cubes.
The compressive strength of the new-to-old concrete can reach more than 85% of the design strength, which meets the requirements of the above specifications, so the above-mentioned mix ratio design meets the strength design standard.
2.2. Design of New-to-Old Concrete Bonded Interfaces
In order to consider the influence of different interface treatment methods on bonding performance, two different treatment methods are adopted for the interface of new-to-old concrete and combined with the interface treatment methods commonly used in current engineering:
- (1)
- The new-to-old concrete interface is treated using the grooving method, in which three different grooving types are set, and “2”, “4” and “6” are used to represent different grooving types, see Figure 2. The interface processing method is as follows: firstly, three cylindrical strips of different sizes are prepared, the bottom width of which is 20 mm, and the height is 2 mm, 4 mm, and 6 mm, respectively. These cylindrical bars are fixed to the ends of the mold and concrete is then poured over them. Once the pouring is complete, it is left to sit for 24 h to ensure that the concrete sufficiently hardens. When the mold is removed, the method of light knocking is used to smoothly separate the wooden column strip from the concrete test block and finally form a slotted cube test block with a size of 150 mm × 150 mm × 75 mm.
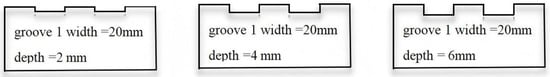 Figure 2. Schematic diagram of grooving type.
Next, the groove surface is finely treated with steel nails and brushes, and the concrete on the surface of the groove is gently removed until the aggregate is fully exposed. The schematic diagram for this is shown in Figure 3.
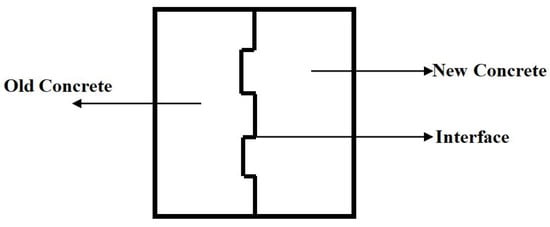
Figure 3.
Schematic diagram of the specimen by grooving method.
The interface between the old and new concrete is manually chiseled, and the specimen of the chiseled hair is represented by “1”. Three different roughnesses are set, and “1-II., 1-IV., and 1-VI.” are used to represent the different roughnesses. The specific method of interface treatment is as follows: firstly, the old concrete test block with a size of 150 mm × 150 mm × 75 mm is selected, the loose particles and cracked parts on its surface are removed, and its natural surface of 150 mm × 150 mm is used as the bonding surface of the old concrete. Subsequently, the surface of the old concrete is treated by artificial chiseling, and the floating slurry and part of the cement stone on the surface are chiseled so that the coarse aggregate is fully exposed and an uneven, rough interface is formed. The aim of this process is to improve the mechanical properties of the interface by increasing the contact area of the bonded surface and the mechanical occlusion force. The schematic diagram for this is shown in Figure 4.
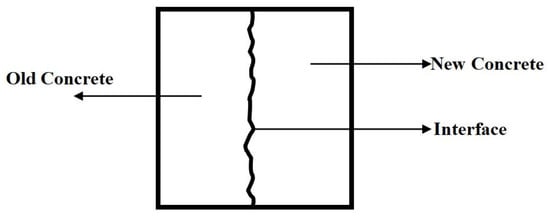
Figure 4.
Schematic diagram of the specimen by manual chiseling method.
Smooth interfaces (“0”) served as the control group. Roughness was measured via the sand patch method (Table 3). Chiseled specimens (“1-II/IV/VI”) matched grooved specimens (“2/4/6”) in roughness parameters.
Table 3.
Measurement results of specimen roughness setting.
In addition, the test also set the case of smooth interfaces as the control group of the test, and the specimen with a smooth interface was indicated by the number “0”. The roughness was measured by the average sand filling method, and the roughness measurement results of the interface are shown in Table 3.
2.3. Fabrication of New-Old Concrete Composite Specimens
The specimen fabrication process comprised three critical phases, the phenomena observed during the experimental process are illustrated in Figure 5:
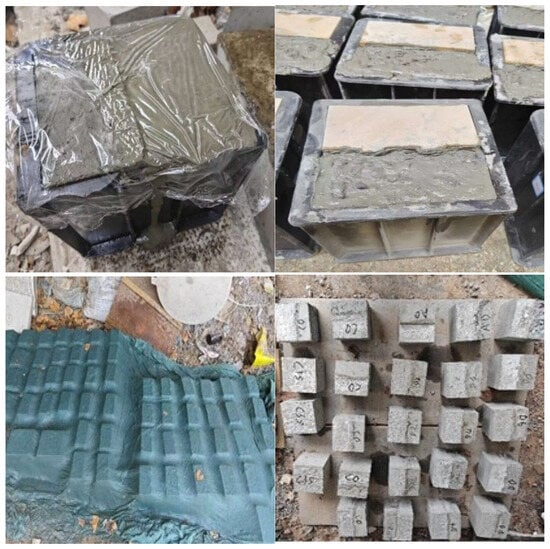
Figure 5.
The main process of making new-to-old concrete bonded specimens.
- Phase 1: Old Concrete Casting
Prefabricated 75 mm3 wooden inserts were positioned in standard 150 × 150 × 150 mm3 molds. Concrete constituents were proportioned per Table 1 and mixed in a planetary mixer for 120 s to ensure homogeneity. The mixture was then cast into molds containing the inserts, followed by 30 s compaction on a vibration table to eliminate air voids. Specimen surfaces were screeded, sealed with polyethylene sheeting to prevent moisture loss, and demolded after 24 h curing. Post-demolding specimens underwent a 28-day moist curing under burlap covers with daily water spraying.
- Phase 2: Interface Preparation
The old concrete specimens are cured after reaching 28 days of strength and then placed in a cool and well-ventilated environment for 24 h to ensure the stability of the specimens. After removing impurities from the bonding surface, they are rinsed with clean water and dried. After that, different types of interface agents are applied evenly on the joint surface, and the specimen is placed into the tryout, ensuring that its position is in the middle of the tryout and perpendicular to the bottom surface.
- Phase 3: New Concrete Integration
Fresh C35 concrete is cast around prepared substrates, compacted identically to Phase 1, and covered with curing membranes. Following 24 h of initial curing, the composite specimens are demolded and subjected to a 28-day standard moist curing.
2.4. Direct Shear Testing Protocol with Normal Stress Control
Conventional bond strength evaluations typically employ pure shear configurations to isolate shear stress states. However, in operational hydraulic tunnels, new-old concrete interfaces are subjected to combined shear–compression stress fields. To accurately simulate these service conditions and obtain critical interface parameters, this study adopted an innovative normal-stress-integrated direct shear testing approach, as schematically illustrated in Figure 6.
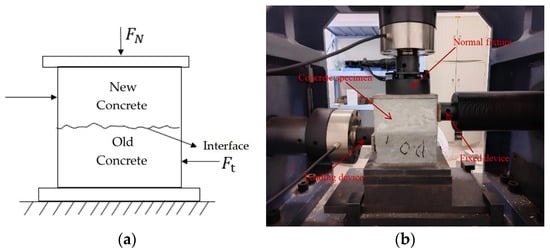
Figure 6.
(a) Normal-stress-controlled direct shear testing configuration, and (b) Sequential failure process of new–old concrete interface under combined stresses.
The experimental procedure, compliant with the Chinese Hydraulic Engineering Concrete Testing Code (SL/T 352-2020) [32], was implemented through the following protocol (Figure 6):
- (1)
- Vertically position the specimen at the midpoint between the upper and lower platens of the rock direct shear apparatus to prevent tilting during loading, ensuring uniform force distribution and test accuracy. Adjust the specimen position to achieve full contact with both platens, avoiding stress concentration due to uneven contact.
- (2)
- Initiate loading using the YDW-1000 rock direct shear system (manufactured by Jinan Yinuo, Shandong, China), applying normal compressive stresses of 1 MPa, 2 MPa, 3 MPa, and 4 MPa to investigate interfacial shear behavior under varying normal stress conditions. Monitor stress states in real-time and record ultimate failure loads at the specimen collapse.
The interfacial shear strength is calculated by dividing the ultimate failure load by the bond area (interface area), as shown in Equation (1), with results precise to 0.01 MPa. Mechanical parameters of the interface are fitted using Equation (2) to quantitatively analyze bond performance evolution.
Shear strength of new-to-old concrete bonding surfaces:
where τ is the interface shear strength (MPa), P2 is the ultimate shear load (N), and A is the nominal bond area (mm2).
The formula for fitting interface parameters is as follows:
where the τ is the shear strength of new-to-old concrete bonding surfaces (MPa), σ is the normal compressive stress, (MPa), and φ is the effective friction angle (°). c is the apparent cohesion (MPa).
3. Direct Shear Test Results
3.1. Failure Characteristics
During initial loading, new–old concrete specimens exhibited characteristic elastic behavior with near-linear stress-displacement relationships. Progressive loading induced microcrack initiation at the interface, followed by stable crack propagation along the bonding plane. Post-peak behavior demonstrated abrupt load capacity degradation, indicating interfacial bond failure.
In the direct shear test, the failure modes of concrete specimens under different roughness levels show significant differences. When the interface roughness is low, the failure of the specimen is accompanied by a low and short sound, the failure surface mainly expands along the joint surface of the new-to-old concrete, and the failure surface is relatively flat, which is a typical interface agent debonding failure, as shown in Figure 7a,b. However, when the interface roughness is high, as shown in Figure 7c, the time required for the specimen to reach oblique shear failure is significantly longer. At the initial stage of loading, there was almost no obvious change on the surface of the specimen. As the load continues to increase, small cracks gradually appear and expand until the specimen reaches the ultimate stress and fails, accompanied by a crisp and rapid sound. The residual crushed coarse aggregate in the depression area can be seen on the failure surface, and the crack not only extends along the joint surface but also extends to the internal normal direction of the specimen. This phenomenon shows that the failure mode at the high-roughness interface not only includes shear failure, but is also significantly affected by normal stress, which reflects the complex role of interface roughness on the failure mechanism.
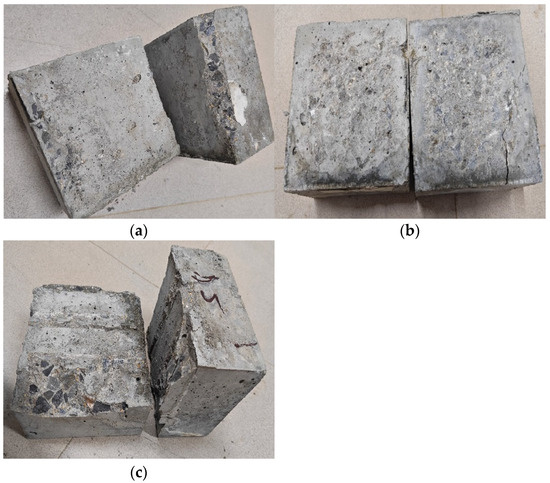
Figure 7.
(a) Failure of smooth interface, (b) Failure of chiseled interface, and (c) Failure of grooving interface.
Figure 7 shows the failure mode of the joint surface of the specimen in the direct shear test. When the interface roughness is low, which is mainly manifested as the debonding failure of the interface agent, the failure surface is relatively flat, and only a slight cement mortar or part of the fine aggregate falls off, as shown in Figure 7a,b. However, when the interface roughness is high, the failure area of the specimen is large, the failure location is mostly concentrated in the protrusion of the groove, and the concrete part of the interface edge falls off, accompanied by an expansion of the overall crack, as shown in Figure 7c.
Through the analysis of the interface failure phenomenon of the specimen in the direct shear test, it can be seen that the shear resistance of the interface can be significantly improved via the chiseling treatment and grooving treatment. This phenomenon may be attributed to the following mechanisms: firstly, the chiseling process enhances the mechanical occlusion and adhesion between the old and new concrete by increasing the roughness of the surface of the old concrete; secondly, the grooving treatment forms a regular notch structure on the surface of the old concrete, which produces a mechanical anchoring effect after combining with the new concrete, thereby significantly improving the shear strength of the interface. In addition, chiseling can effectively reduce micro-cracks at the junction of old and new concrete, as the rough surface better disperses the stress concentrations, thus improving the overall shear strength of the interface. These findings demonstrate that interface roughness fundamentally alters failure mechanisms, providing critical insights for optimizing rehabilitation strategies in concrete structural retrofits.
3.2. Direct Shear Test Data
Employing direct shear strength as a key metric, this study systematically investigated the effects of bonding agent types and interface roughness on new-to-old concrete bonding performance. Triplicate specimens were tested per experimental group, with the mean shear strength of three parallel samples serving as the final measurement to ensure data reliability and representativeness. The resulting shear strength values of all specimens are presented in Table 4, with calculations strictly adhering to standard requirements [32].
Table 4.
Direct shear test results of new-to-old concrete.
3.3. Analysis of Direct Shear Test Data
The interfacial shear strength variations under different treatment methods, surface roughness levels, and normal stress conditions are systematically presented in Figure 8, with error bars indicating sample standard deviations.
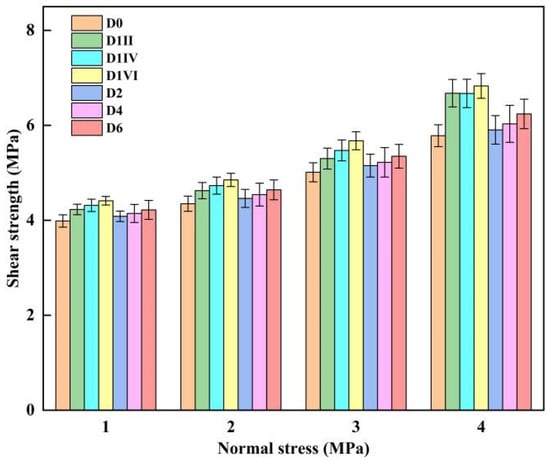
Figure 8.
Shear strength enhancement mechanisms under varying interface treatments and normal stresses.
As shown in Figure 8, the interfacial shear strength increases with rising normal stress, and the specimens treated by chiseling or grooving exhibit higher shear strength than untreated smooth interfaces. Specifically:
At 1 MPa normal stress, the chiseled specimens (D1VI) achieved the maximum shear strength, showing approximately 10.5% enhancement compared to smooth interfaces (D0).
At 2 MPa normal stress, the shear strength of the chiseled specimens (D1VI) increased by about 11.5% relative to D0.
At 3 MPa normal stress, enhancement reached 13.2% for the chiseled specimens (D1VI).
At 4 MPa normal stress, improvement further escalated to 18.2% for the chiseled specimens (D1VI).
These results demonstrate that with gradual increases in normal stress, the chiseled specimens (D1VI) maintain superior shear strength compared to other treatment methods, while their performance advantage over smooth interfaces progressively amplifies.
Figure 8 further demonstrates that under identical normal stress and surface treatment methods, the shear strength increases with enhanced chiseling roughness or grooving depth. Notably, chiseled interfaces exhibit superior shear resistance compared to grooved interfaces:
At 1 MPa normal stress with an average sand patch depth of 0.9 mm, grooved interfaces (D1II) achieved a shear strength of 4.08 MPa, while chiseled interfaces (D2) reached 4.23 MPa, representing a 4% improvement. With increased sand patch depths of 1.4 mm and 1.8 mm, the chiseled interface enhancements rose to 4.1% and 4.5%, respectively. Post-processing analysis revealed that under equivalent roughness and normal stress conditions, the chiseled interfaces consistently outperformed the grooved interfaces by approximately 5%. The most significant enhancement (13.2%) occurred at 4 MPa of normal stress with a 0.9 mm sand patch depth for the chiseled specimens (D1II) versus their grooved counterparts (D2). At this time, it can be seen that the different treatment methods of the interface have a great influence on shear strength, which may be due to the influence of the size effect of the interface treatment method: when the direct shear test is carried out and the interface width is constant, the interface height increases, the ultimate stress of the direct shear specimen gradually decreases, and there is an obvious size effect phenomenon in the height direction; the chiseling treatment can reduce this effect and then improve the shear strength of the interface.
3.4. Calculation of Interface Shear Stiffness Parameters
The displacement–shear stress relationships of specimens under 1 MPa of normal stress with different treatment methods are plotted in Figure 9.
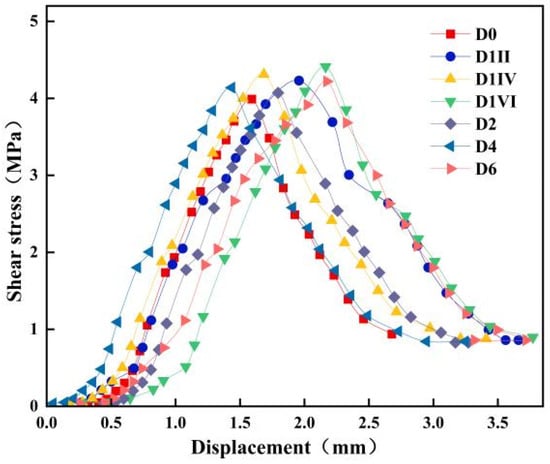
Figure 9.
Displacement–stress curves under different treatment methods.
As shown in Figure 9, the interfacial shear stress exhibits a characteristic trend of a rapid initial increase followed by a gradual decline with increasing tangential displacement. All specimens demonstrate consistent ductile failure behavior, differing primarily in numerical magnitudes. The shear failure process comprises three distinct stages:
- (1)
- Linear elastic stage: A proportional relationship exists between shear stress and tangential displacement, where the curve slope reflects the interface shear stiffness. The shear stiffness of different specimens is calculated from this slope.
- (2)
- Interface damage evolution stage: Shear stress reaches its peak, and interfacial damage is initiated. The corresponding displacement at this point is defined as the initial damage separation displacement.
- (3)
- Interface failure stage: Shear stress gradually decreases, and the displacement at complete failure is termed the complete failure displacement. The energy dissipated during failure, calculated as the area under the shear stress–displacement curve, represents the interface shear fracture energy.
By fitting the experimental data, key parameters including interface shear stiffness, initial damage separation displacement, complete failure displacement, and interface shear fracture energy were quantitatively determined, as summarized in Table 5.
Table 5.
Key parameters of interface shear stiffness.
The findings indicate that interfacial shear stiffness increases with surface roughness. Current research demonstrates that bond failure typically occurs either within the newly cast concrete or at the bonding interface [33,34]. By roughening the interface between the existing and new concrete, the bond strength is enhanced, thereby improving the structural integrity of composite concrete systems. Considering the heterogeneity of concrete materials and the size effects observed during testing, further investigation into bond failure mechanisms is warranted. Subsequent numerical simulations were conducted to analyze stress distribution and damage evolution during interfacial failure.
4. Numerical Simulation of Direct Shear Tests for New–Old Concrete Interfaces
4.1. Establishment of New–Old Concrete Model
A numerical model for the grooved interface direct shear test of new–old concrete was developed through the following steps:
- (1)
- Element Selection and Mesh Generation
The geometric dimensions of the model strictly adhere to the experimental specimens. A three-dimensional geometric model was first established with the following dimensions: new concrete section (75 mm), old concrete section (75 mm), and a 2 mm-thick cohesive element layer inserted at the interface to simulate interfacial behavior [29]. Both new-to-old concrete sections were discretized using C3D8R elements (8-node linear reduced integration solid elements), which ensured computational accuracy while improving efficiency. The cohesive elements were employed to capture the damage evolution process from initial loading to complete failure at the interface.
The mesh configuration of the specimen is shown in Figure 10. To ensure computational accuracy, refined mesh generation was applied to the new–old concrete regions and the interface zone [35]. The mesh size in the interface region was optimized to adequately reflect stress distribution gradients while avoiding excessive computational costs due to overly dense meshing.
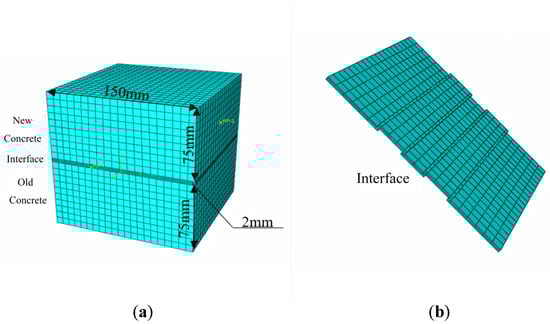
Figure 10.
(a) Overall mesh configuration of specimen, and (b) Cohesive element mesh details.
- (2)
- Material Definition
In the numerical model, distinct material properties were assigned to three components: new concrete, cohesive elements, and old concrete. For the cohesive interface elements, an energy-based damage evolution law was adopted, with control parameters including interface bond fracture energy and shear fracture energy. Material property definitions encompassed three aspects: cohesive behavior, initial damage criterion, and damage evolution law. The density of cohesive elements was consistent with concrete materials to ensure mass distribution fidelity.
- Cohesive Behavior of Interface Elements
During the undamaged cohesive phase, the interface exhibits linear elastic behavior governed by normal bond stiffness and tangential shear stiffness, characterizing elastic responses under normal and shear loading, respectively.
- 2.
- Initial Damage Criterion
Damage initiation was determined using the ABAQUS (2021) intrinsic quadratic nominal stress criterion, which integrates interface normal bond strength and tangential shear strength. Damage commences when the interfacial stress state reaches this critical threshold.
- 3.
- Damage Evolution Law
Post-damage initiation, interface stiffness progressively degrades. The mechanical behavior was defined through energy-based damage evolution, controlled by two parameters: normal bond fracture energy and tangential shear fracture energy. These parameters quantify energy dissipation during damage progression from initiation to complete failure under the respective loading modes.
This material definition framework enables the precise simulation of the complete interfacial failure process—from elastic deformation through damage initiation to final failure—establishing a robust theoretical foundation for the numerical analysis of new–old concrete interface mechanics.
- (3)
- Boundary Condition Definition and Loading Application
In the numerical simulation of new–old concrete direct shear tests, boundary conditions and loading protocols were implemented as follows:
- Reference Point Setup and Coupling Constraints
A reference point was established at the mid-height of the lower left section, with kinematic coupling applied to the old concrete and left fixture contact surfaces. Similarly, another reference point was created on the right side, coupling the new concrete and right fixture contact surfaces. This constraint configuration effectively simulates fixture clamping effects during physical testing.
- 2.
- Boundary Conditions
All degrees of freedom (translational and rotational) at the lower reference point were constrained to replicate fixed support conditions of the bottom fixture.
- 3.
- Loading Protocol
The load is applied via the reference point on the right. First, a leftward displacement constraint of 3 mm is applied to the right reference point to simulate the shear load in a direct shear test. At the same time, a uniform load of 1 MPa is applied in the normal direction to simulate the normal pressure that may exist in the test. The load is applied in Figure 11, the arrows on the surfaces indicate the loads, and the pyramid symbols along the edges represent the constraints.
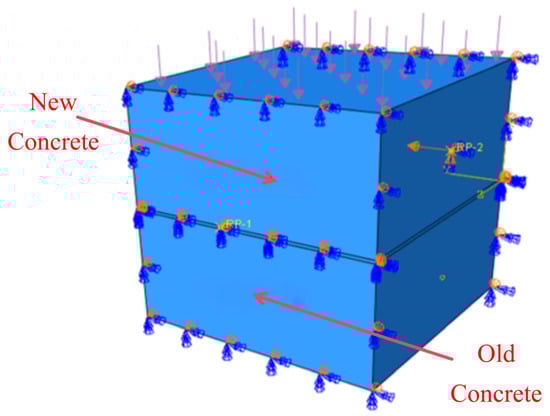
Figure 11.
Numerical simulation loading configuration.
4.2. Analysis of Direct Shear Simulation Results
4.2.1. Stress–Displacement Curve Comparison
To further validate the rationality of the numerical simulation, a systematic analysis was conducted by comparing the stress–displacement curves from the experimental and numerical results. Following the methodology applied to smooth interfaces, all interfacial stresses were characterized using a point set, and stress–displacement curves were plotted.
Figure 12 shows the comparison between the experimental and numerical results under different interface treatments. The simulated stress–displacement curves exhibit high consistency with experimental data, particularly in the elastic phase and damage initiation phase. Although slight deviations exist in the complete failure phase, the overall trends and key mechanical characteristics (e.g., peak stress and failure displacement) are well reproduced. This comparative analysis confirms the accuracy and reliability of the numerical model in simulating the shear behavior of new–old concrete interfaces. The validation based on the stress–displacement curves not only intuitively reflects the rationality of the simulation but also provides critical insights for subsequent parameter optimization and model refinement.
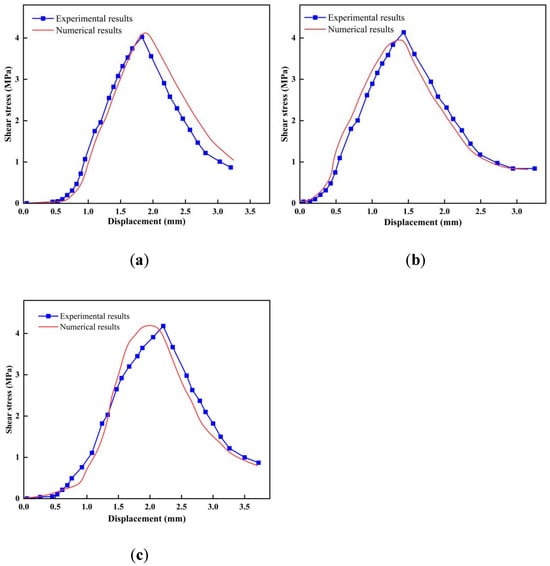
Figure 12.
(a) Comparison of stress–displacement curves under D2 interface treatment, (b) Comparison of stress–displacement curves under D4 interface treatment, and (c) Comparison of stress–displacement curves under D6 interface treatment.
By comparing the numerical and experimental stress–displacement curves under various test conditions, it is evident that both exhibit a high consistency in overall trends and key mechanical characteristics. The numerical results effectively capture the damage evolution stages of the interface, including the cohesive phase, damage initiation phase, and complete failure phase. Notably, the numerical predictions of peak shear strength align closely with experimental measurements, validating the model’s accuracy.
Although minor discrepancies between the numerical and experimental results occurred during the cohesive and damage-phases due to experimental data variability, these deviations remain within acceptable error margins and do not significantly affect the overall trends. In conclusion, the numerical simulation of shear behavior at new–old concrete interfaces—through appropriate parameter settings and the application of a bilinear cohesive zone model—is demonstrated to be rational and effective.
4.2.2. Interface Stress Distribution
The numerical simulations of shear failure processes and stress distributions in the grooved interface specimens revealed failure mechanisms consistent with smooth interfaces but with distinct stress distribution characteristics and failure modes. The simulated failure process similarly comprised three stages:
- Cohesive Phase
During initial loading, the interface exhibited linear elastic behavior with uniform stress distribution, indicating undamaged cohesive interaction.
- 2.
- Damage Initiation Phase
As shear displacement increased, interfacial stresses reached the initial damage threshold. Localized damage first occurred in the groove regions, followed by progressive stress redistribution and damage propagation along the interface.
- 3.
- Complete Failure Phase
Further displacement increments caused continuous damage expansion in the groove zones, ultimately leading to interface failure. Unlike smooth interfaces, the grooved specimens exhibited: stress concentration localization at groove tips and gradual homogenization of global stress distribution post-failure.
Figure 13 shows the stress distribution of rocks, concrete blocks, and cohesive elements in the cohesive behavior of the interface. As can be seen from the figure, the grooving area shows a significant stress concentration phenomenon at the initial stage, and, with the development of damage, the stress gradually expands to the inside of the specimen and finally leads to the complete destruction of the grooving area.
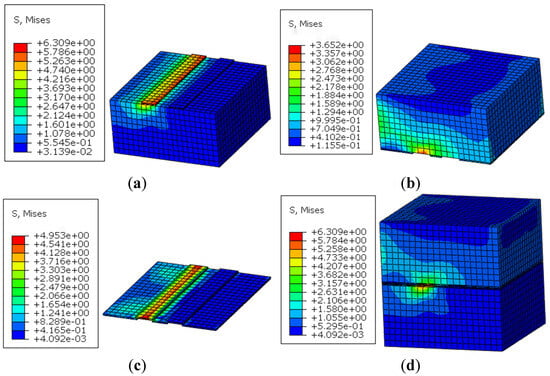
Figure 13.
(a) Stress distribution in new concrete, (b) Stress distribution in old concrete, (c) Cohesive element stress, and (d) Global stress distribution.
As the groove interface damage progresses, extensive adhesive debonding failure gradually develops at the new–old concrete interface. This phase is characterized by a rapid escalation of interfacial stresses within the cohesive elements, accompanied by a marked reduction in the interfacial bond strength, with partial shear resistance now provided by frictional interactions between the surfaces. Concurrently, the cohesive element stresses at the interface reach their critical threshold, signifying the onset of critical damage conditions.
Figure 14 illustrates the stress distribution in concrete blocks and cohesive elements during the interface damage phase. The figure reveals two critical phenomena: firstly, groove regions exhibit particularly pronounced stress concentration phenomena, with cohesive elements attaining peak stress magnitudes. Secondly, adjacent concrete blocks demonstrate marked stress gradient variations near the grooves. These observations confirm that the propagation of interfacial damage not only induces cohesive element failure but also significantly influences stress redistribution within the concrete matrix.
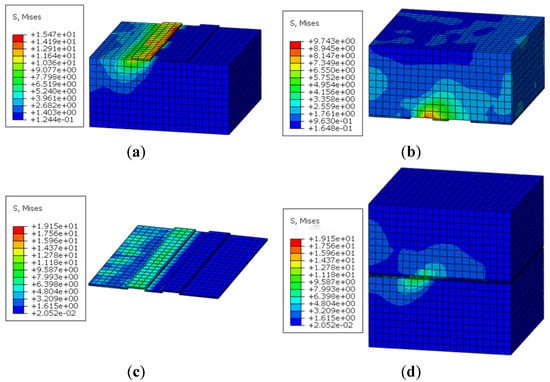
Figure 14.
(a) Stress distribution in new concrete, (b) Stress distribution in old concrete, (c) Stress in cohesive elements, and (d) Global stress distribution.
The simulation results demonstrate that grooved interface specimens exhibit significantly higher global stress levels compared to smooth interface specimens, which is consistent with experimentally measured shear stress values. The results demonstrate that cohesive elements are significantly effective in simulating bond behavior at notched concrete interfaces [11]. In addition, unlike the smooth interface specimens, the stress distribution of the grooving interface specimens shows unique characteristics: in the initial stage, the stress value of the grooving region reaches the maximum value, which becomes the most unfavorable region. With the aggravation of the interface damage, the overall stress distribution of the specimen gradually tends to be uniform.
The above simulation results further verify the effectiveness and reliability of the bilinear cohesion model in simulating the interface shear behavior of new-to-old concrete. By analyzing the stress distribution law on the cohesive unit, it can be found that the interface shear failure usually starts in the edge region in the shear direction of the specimen and gradually expands to the whole interface. This failure mode is consistent with the observed phenomenon, which indicates that the bilinear cohesion model can accurately capture the spatial evolution law of interface shear failure and can effectively simulate the shear behavior of the interface between new-to-old concrete.
5. Conclusions
This study systematically investigated the effects of manual chiseling, grooving, and smooth interface treatments on the bonding performance of new–old concrete through direct shear tests. A numerical model based on cohesive elements successfully simulated interfacial stress distribution and damage evolution. Some conclusions are as follows:
- (1)
- Interface roughness significantly enhances mechanical performance: Chiseled interfaces achieved the highest shear strength, demonstrating a 10.5%~18.4% improvement compared with smooth interfaces. The mechanical interlocking effect, amplified by surface roughness, substantially improved load–transfer synergy. A near-linear proportionality was observed between the interfacial shear strength parameters and roughness metrics.
- (2)
- Experimental–numerical consistency: Through the systematic processing of numerical simulation data, the displacement–stress curves derived from the computational model showed a close alignment with experimental measurements. The numerical results accurately replicated key mechanical behaviors, including post-peak softening characteristics, confirming the validity and precision of the proposed modeling methodology.
- (3)
- Through the data processing of the numerical simulation results, the displacement–stress curve of the calculated model is obtained, and the displacement–stress curve of the test is compared and analyzed. The results show that the cohesive force element can better reflect the mechanical behavior of the grooving interface cracking, which further verifies the rationality and accuracy of the modeling method adopted.
Author Contributions
Validation, Y.J.; Writing—original draft, D.W. and J.Y.; Writing—review & editing, S.S. and Y.H.; Supervision, J.Y.; Project administration, Z.L. All authors have read and agreed to the published version of the manuscript.
Funding
Guangdong Provincial Science and Technology Program: XJLY-2022 HT-62.
Institutional Review Board Statement
Not applicable.
Informed Consent Statement
Not applicable.
Data Availability Statement
The data that support the findings of this study are available from the corresponding author upon reasonable request.
Acknowledgments
This work was supported by the Guangdong Provincial Science and Technology Program (XJLY-2022 HT-62). These sources of support are gratefully acknowledged.
Conflicts of Interest
The authors have no conflicts to disclose.
References
- Blindheim, O.T. Nordic sub sea tunnel projects. Tunn. Undergr. Space Technol. 2005, 20, 570–580. [Google Scholar] [CrossRef]
- Li, H.; Feng, J.; Guo, H.; Xie, X.; Xiong, Z.; Sun, F. Evaluation of structural bearing capacity of super-large diameter submarine shield tunnels: A comparison between traditional segmental linings and double-layer linings. In Proceedings of the 2025 International Federation for Structural Concrete, Munich, Germany, 8 May 2025. [Google Scholar] [CrossRef]
- Tao, J.; Zhu, H.; Su, K.; Wang, H. Design method of a novel composite lining under high internal water pressure: An application in the water conveyance tunnel through urban areas. Int. J. Press. Vessel. Pip. 2025, 216, 105492. [Google Scholar] [CrossRef]
- Wang, S.; Ma, X.; Wang, Y.; Liu, C. Research on the prestress Regulation of double-layer lining of shield water tunnel under high internal water pressure. Tunn. Undergr. Space Technol. 2025, 155, 106133. [Google Scholar] [CrossRef]
- Hosseini, S.; Mousa, S.; Mohamed, H.; Benmokrane, B. Development of strength interaction diagrams for designing precast concrete tunnel lining segments reinforced with GFRP bars. Eng. Struct. 2023, 284, 115976. [Google Scholar] [CrossRef]
- Patel, D.; Pleesudjai, C.; Bakhshi, M.; Nasri, V.; Mobasher, B. Back-calculation of mechanical properties of fiber-reinforced concrete in tunnel lining segments. Struct. Concr. 2025, 19, 28–34. [Google Scholar] [CrossRef]
- Wang, S.; He, X.; Peng, X.; Wang, Y.; Li, Z.; Song, Z. Influence of secondary lining thickness on mechanical behaviours of double-layer lining in large-diameter shield tunnels. Undergr Space 2024, 18, 130150. [Google Scholar] [CrossRef]
- Alibeigibeni, A.; Stochino, F.; Zucca, M.; Gayarre, F.L. Enhancing Concrete Sustainability: A Critical Review of the Performance of Recycled Concrete Aggregates (RCAs) in Structural. Concr. Build. 2025, 15, 1361. [Google Scholar] [CrossRef]
- Zhang, D. Prototype test on failure mechanism of shield tunnel with reinforced concrete inner lining under internal water pressure. China Civ. Eng. J. 2023, 56, 126–135. [Google Scholar]
- Wang, J.; Zhang, W.; Guo, X.; Koizumi, A.; Tanaka, H. Mechanism for buckling of shield tunnel linings under hydrostatic pressure. Tunn. Undergr. Space Technol. 2015, 49, 144–155. [Google Scholar] [CrossRef]
- Li, J.; Sun, Y.; Chen, J.; Niu, J. Study on the interfacial bonding performance and damage mechanism between steel reinforcement and fiber-reinforced self-compacting lightweight aggregate concrete. Constr. Build. Mater. 2025, 484, 141845. [Google Scholar] [CrossRef]
- Ye, X.; Wang, H.; Xue, H.; Li, Q.; Dong, H.; Qin, R.; Zhang, Q. The experimental study on the mechanical and interfacial bonding properties of pumice concrete modified with hydroxyapatite active layer coated pumice. J. Build. Eng. 2025, 111, 113262. [Google Scholar] [CrossRef]
- Li, Y.; Zhuang, X.; Li, Z. The mechanical properties of the interface between concrete–epoxy mortar: Splitting tensile vs. direct shear testing. Constr. Build. Mater. 2024, 422, 135809. [Google Scholar] [CrossRef]
- Zhang, J.; Li, J.; Zhao, Y.; Wang, S.; Guan, Z. Concrete Cover Cracking and Reinforcement Corrosion Behavior in Concrete with New-to-Old Concrete Interfaces. Materials 2023, 16, 5969. [Google Scholar] [CrossRef]
- Mandeep, K.; Himanshu, C.; Naveen, K. Effect of different surface preparation techniques on the bond behavior of normal and fiber-reinforced geopolymer concrete. Constr. Build. Mater. 2024, 417, 135252. [Google Scholar] [CrossRef]
- Feng, S.; Xiao, H.; Liu, M. Shear behaviour of interface between normal-strength concrete and UHPC: Experiment and predictive model. Constr. Build. Mater. 2022, 342, 127919. [Google Scholar] [CrossRef]
- Ayinde, O.O.; Wu, E.; Zhou, G. Influence of interface roughness geometrical parameters on the shear behaviour of old and new concrete interface. Asian J. Civ. Eng. 2022, 23, 229–247. [Google Scholar] [CrossRef]
- Yue, J.; Wang, D.; Jiang, Y.; Shi, S.; Huang, Y. Determination of Shear Strength Parameters of Concrete Materials Based on the Rectangular Section Splitting Method. Materials 2024, 17, 6141. [Google Scholar] [CrossRef]
- Tian, W.; Zhu, R.; Xia, M. Experimental study on the shear performance of the interface between old and new concrete. Build. Technol. 2018, 49, 33–36. [Google Scholar]
- Fan, J.; Wu, L.; Zhang, B. Influence of Old Concrete Age, Interface Roughness and Freeze-Thawing Attack on New-to-Old Concrete Structure. Materials 2021, 14, 1057. [Google Scholar] [CrossRef]
- Liu, Q.; Jin, C.; Li, X. Impact of Interfacial Transition Zone on Concrete Mechanical Properties: A Comparative Analysis of Multiphase Inclusion Theory and Numerical Simulations. Coatings 2024, 14, 698. [Google Scholar] [CrossRef]
- Li, H.; Meng, Z.; Shen, S. Effects of Interface Morphology on the Shear Mechanical Properties of Sand–Concrete Interfaces. Materials 2023, 16, 6122. [Google Scholar] [CrossRef]
- Yan, G.; Wu, W.; Zhang, X. Comparison of bonding performance between old and new concrete by random chipping and grooving methods. Sci. Technol. Consult. Herald. 2007, 3, 72–74. [Google Scholar]
- Yan, G. Experimental Study on the Shear Performance of the Interface Between Old and New Concrete with Grooving Method. Master’s Thesis, Zhengzhou University, Zhengzhou, China, 2006. [Google Scholar]
- Yan, G.; Ouyang, Q.; Han, J. Research and application on mechanical properties of groove and rebar planting method for old and new concrete bonding surfaces. J. Yellow River Conserv. Tech. Inst. 2011, 25, 16–18. [Google Scholar]
- Cai, W. Experimental Study on the Bonding Performance of Desert Sand Self-compacting Concrete. Master’s Thesis, Ningxia University, Ningxia, China, 2023. [Google Scholar]
- Li, H.; Fu, S.; Zhu, D. Experimental study on the effects of triangular groove inclination angles on the mechanical behavior of sand–concrete interfaces. J. Mater. Res. Technol. 2023, 24, 159–172. [Google Scholar] [CrossRef]
- Zhang, T. Experimental Study on the Shear Performance of the Interface Between Old and New Concrete Under the Influence of Multiple Factors. Master’s Thesis, Changsha University of Science & Technology, Changsha, China, 2019. [Google Scholar]
- Zhang, W.; Yan, B.; Ye, Y. Direct shear test study on old and new concrete. J. Build. Eng. 2024, 82, 108391. [Google Scholar] [CrossRef]
- Tian, W.; Song, Z.; Xiao, C. Shear tests and finite element simulation analysis of the bonding surface of old and new concrete with rebar planting. Build. Struct. 2019, 49, 127–133+126. [Google Scholar]
- JGJ 55-2011; Specification for Mix Proportion Design of Ordinary Concrete. AQSIQ: Beijing, China, 2011.
- SL/T 352-2020; Test Code for Hydraulic Concrete. Ministry of Water Resources of the People’s Republic of China: Beijing, China, 2020.
- Manawadu, A.; Qiao, P.; Wen, H. Characterization of Substrate-to-Overlay Interface Bond in Concrete Repairs: A Review. Constr. Build. Mater. 2023, 373, 130828. [Google Scholar] [CrossRef]
- Manawadu, A.; Qiao, P. Cohesive fracture simulation and failure modes of shotcrete-concrete interface bond in Mode II loading. Eng. Fract. Mech. 2024, 299, 109959. [Google Scholar] [CrossRef]
- Al-Fasih, M.; Mohamad, M.; Ibrahim, I. Experimental and numerical evaluations of composite concrete-to-concrete interfacial shear strength under horizontal and normal stresses. PLoS ONE 2021, 16, e0252050. [Google Scholar] [CrossRef]
Disclaimer/Publisher’s Note: The statements, opinions and data contained in all publications are solely those of the individual author(s) and contributor(s) and not of MDPI and/or the editor(s). MDPI and/or the editor(s) disclaim responsibility for any injury to people or property resulting from any ideas, methods, instructions or products referred to in the content. |
© 2025 by the authors. Licensee MDPI, Basel, Switzerland. This article is an open access article distributed under the terms and conditions of the Creative Commons Attribution (CC BY) license (https://creativecommons.org/licenses/by/4.0/).