Article

The Influence of Anisotropic Microstructures on the Ice Adhesion Performance of Rubber Surfaces

1
College of Mechanical and Electrical Engineering, Gansu Agricultural University, Lanzhou 730070, China
2
School of Mechatronics Engineering, Henan University of Science and Technology, Luoyang 471003, China
3
College of Civil Aviation Safety Engineering, Civil Aviation Flight University of China, Guanghan 618307, China
4
Sichuan Key Technology Engineering Research Center for All-Electric Navigable Aircraft, Guanghan 618307, China
5
Civil Aircraft Fire Science and Safety Engineering Key Laboratory of Sichuan Province, Guanghan 618307, China
*
Authors to whom correspondence should be addressed.
Coatings 2025, 15(5), 612; https://doi.org/10.3390/coatings15050612
Submission received: 9 April 2025 / Revised: 9 May 2025 / Accepted: 17 May 2025 / Published: 21 May 2025

Abstract

:
Anti-icing and de-icing technologies are crucial in modern aviation, with optimising ice adhesion performance on material surfaces being a key challenge. This study proposes a straightforward method for fabricating hydrophobic silicone rubber surfaces using a mesh to construct microstructures. The influence of microstructure size and anisotropy on surface wettability and ice adhesion performance is systematically investigated. The experimental results demonstrate that introducing microstructures significantly enhances the hydrophobicity of silicone rubber surfaces, achieving a maximum static contact angle of 149.3 ± 1.3°. For microstructures with identical shapes, dimensional variations affect surface roughness and functional performance. Although the structure with the most significant dimension (600#-SR) exhibits the highest surface roughness, smaller structures (e.g., 1400#-SR) demonstrate superior hydrophobicity and lower ice adhesion strength, likely due to enhanced air entrapment and reduced effective solid–liquid and solid–ice contact areas. Furthermore, due to anisotropic microstructures, a marked directional difference in ice adhesion strength is observed: the lowest strength in the X direction is 38.6 kPa, compared to 63.3 kPa in the Y direction. Fine-tuning the size and configuration of microstructures effectively minimises the ice adhesion strength and enables targeted optimisation of surface properties. This research offers theoretical support for developing innovative, energy-efficient materials with superior anti-icing properties and provides new insights for crafting solutions tailored to various anti-icing needs.

1. Introduction

Ice formation is a common natural phenomenon, and unintended ice accumulation poses significant safety concerns for aircraft [1]. Ice accretion can substantially alter an aircraft’s aerodynamic characteristics, reducing lift and increasing drag, which, in severe cases, may compromise flight safety [2]. Consequently, the effective prevention and removal of ice are critical challenges in aviation, particularly to ensure safe operations in cold climates. Traditional de-icing and anti-icing methods, such as heating and chemical de-icing fluids, have demonstrated limitations in terms of their efficiency, cost, and environmental impact. Therefore, developing innovative, more efficient, and environmentally friendly anti-icing technologies has become a focal point in aerospace research. By suppressing ice nucleation at the ice–substrate interface and reducing the ice adhesion strength [3,4,5], advanced surface engineering offers promising strategies for achieving ice resistance and addressing these challenges effectively.
In recent years, numerous studies have reported the role of microstructures in reducing ice adhesion performance [6,7,8]. Several of these investigations focused on fabricating microstructures using various methods and subsequently evaluating their ice adhesion performance. Common fabrication techniques include vapor deposition [9], sol–gel processing [10], electrochemical methods [11], etching [12], and templating [13]. However, detailed discussions of how these microstructures influence ice adhesion mechanisms are often lacking. Other studies employed numerical simulations and theoretical analyses to explore how microstructures affect ice adhesion [14,15]. For instance, Xie et al. [16] combined simulation and theoretical analysis to develop an adhesion model between rectangular ice blocks and elastic coatings. Similarly, Stendardo et al. [17] investigated the fracture mechanisms at the ice–substrate interface through experimental and simulation approaches. They categorised the fracture mechanisms as stress-dominated or toughness-dominated. Under the stress-dominated mechanism, detachment occurs when the overall interfacial stress exceeds the critical stress. In contrast, toughness-dominated separation is governed by strain energy release. They proposed that reducing the diameter of the ice and increasing its height enhances the probability of stress-dominated separation. Further studies examined how specific morphological characteristics of microstructures influence ice adhesion performance. It has been observed that the shape of microstructures affects the adhesion state of frozen droplets. For example, droplets on open-porous structures can revert to the original Cassie–Baxter state after freezing and thawing cycles. In contrast, those on closed-porous structures transition to a high-adhesion Wenzel state [18]. Additionally, parameters such as the height or depth, spacing, and size of microstructures [19,20,21,22] significantly influence the ice adhesion strength. For instance, Memon et al. [23] demonstrated that under constant conditions, surface roughness reduces the ice adhesion strength. These findings underscore the complex relationship between microstructural characteristics and ice adhesion performance, guiding the development of anti-icing surfaces.
In this study, fabricated silicone rubber surfaces with anisotropic microstructures of systematically varied sizes and orientations were obtained using a templating technique. While microtexturing of hydrophobic elastomers has been widely studied, prior works have predominantly focused on isotropic patterns or randomly distributed textures. In contrast, our work introduces controlled anisotropic microgrooves aligned along orthogonal directions, enabling a direct comparison of ice adhesion behaviour along the X and Y axes. This allows for a mechanistic analysis of directional interlocking effects and anisotropic wetting’s contributions to ice adhesion strength. Furthermore, we demonstrate that there exists an optimal microstructure size (1400#) that minimises ice adhesion due to a balance between roughness-induced adhesion (Fa), adhesion strength due to the interlocking of ice with microstructures (Fb), and adhesion strength from the actual contact area between water and the material (Fc). The findings enhance the fundamental understanding of structure–ice interactions and offer a novel design strategy for developing high-performance anti-icing surfaces tailored through directional microstructuring.

2. Materials and Methods

2.1. Materials

Methyl vinyl silicone rubber (Model: 5150A) was supplied by Dengue Silicone Group Co., Ltd., Shenzhen, China, and the vulcanising agent (NBL-101) was provided by Ningbo Zhenhai Weiqi Rubber & Plastic Technology Co., Ltd., Ningbo, China. Mesh screens with model numbers 600#, 1400#, and 2000# were purchased from Hebei Zhongsi Mesh Manufacturing Co., Ltd., Hebei, China.

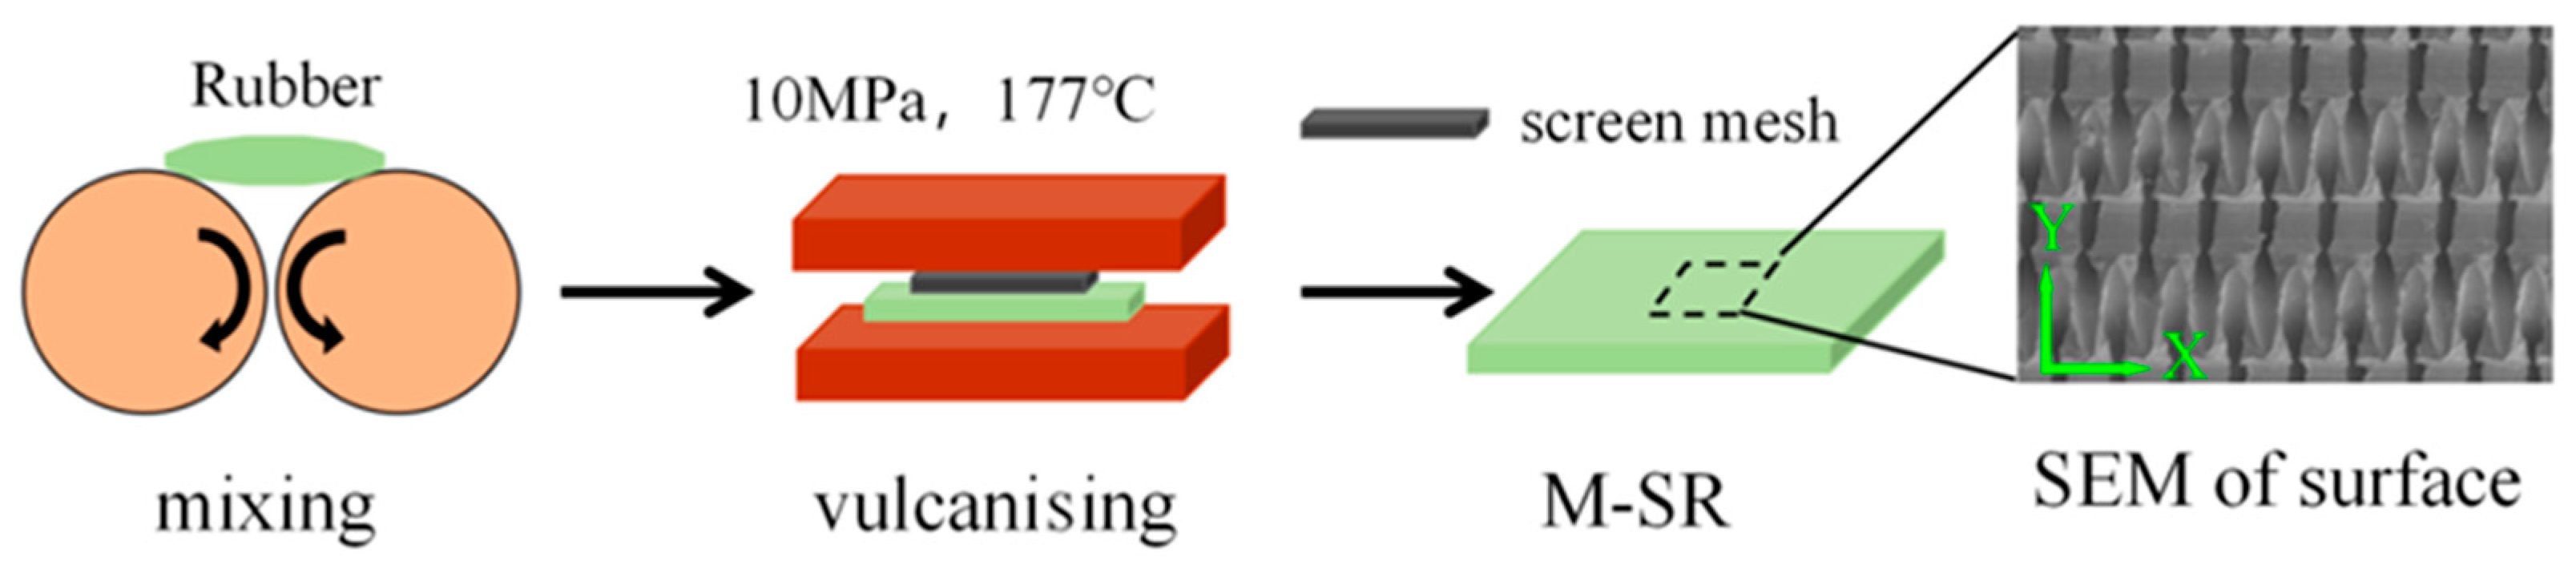
2.2. Preparation of Hydrophobic Silicone Rubber

This study employed a template method to construct microstructures on the surface of silicone rubber. The preparation process is illustrated in Figure 1: First, 100 parts of silicone rubber were mixed using an open mill (KREUI, CREE-6015B-6) until the surface was smooth and free of bubbles. Then, 1.2 phr of the vulcanising agent was added, and the rubber sheet was passed through the mill five times. Next, the roller gap of the mill was adjusted to 2 mm, and the rubber was mixed until its surface was smooth and bubble-free before being removed. The rubber was then cut to the appropriate size, and a mesh screen (600#, 1400#, 2000#) was placed on the surface, followed by vulcanisation in a preheated mould. The vulcanisation parameters were set as follows: pressure at 10 MPa, time at 10 min, and temperature at 177 °C. The samples were labelled as M-SR, where M = 600, 1400, or 2000, representing the mesh size of the screen.

2.3. Ice Adhesion Strength Testing

To better assess the impact of microstructural surface anisotropy on the anti-icing performance of hydrophobic silicone rubber, experiments were conducted using the ice adhesion tester. This system consists of a force sensor probe, a sample fixture, an environmental chamber, and a power supply unit. The force sensor probe is fixed on the X-axis motion platform, while the sample fixture is secured on the XY-axis motion platform. The environmental chamber has temperature and humidity sensors, a cooling plate, and a pressure sensor. To maintain the sample surface temperature at −20 °C, a mould with a diameter of Φ 20 × 30 mm is placed on the sample surface. First, 20 μL of pure water is filled into the mould and frozen, then refilled with pure water. The force sensor probe is driven towards the ice column at a speed of 1 mm/s until the ice column detaches, and the peak force is recorded at that moment. The distance between the lowest point of the force sensor probe and the sample surface is 2 mm. The ice adhesion strength is defined as the ratio of the peak force to the cross-sectional area of the ice column mould.

2.4. Wettability

The static contact angle indicates the extent of infiltration, with lower values indicating superior wettability. A contact angle measuring instrument (Theta Flex, Biolin Scientific, Gothenburg, Sweden) was utilised to ascertain the static contact angle of the hydrophobic silicone rubber surface in both the X and Y directions. A single droplet of 1 μL distilled water was placed on the sample surface, and the contact angle between the droplet and the tangent to the solid surface was measured at 10 s intervals over 300 s. Each sample underwent measurement 10 times.

2.5. Morphology

A scanning electron microscope (Nova NanoSEM 450, FEI, Hillsboro, OR, USA) was operated at an accelerating voltage of 10 kV to study the effect of different mesh sizes on the microstructure of silicone rubber surfaces. The distances between adjacent protrusions in the X and Y directions were specifically measured to further investigate the surface anisotropy. A three-dimensional morphology measuring instrument (NANOVEA ST400, NANOVEA, Irvine, CA, USA) was utilized to scan a 0.5 mm × 0.5 mm area of the sample surface, with a step size set to 0.5 μm, to observe its three-dimensional microstructural morphology and evaluate its surface roughness.

3. Results and Discussion

3.1. Structural Characterisation of M-SR Composites

Figure 2 presents scanning electron microscope (SEM) images of the composite material surface, with (2) being an enlarged section of (1). The surface of the original silicone rubber was relatively smooth, whereas the rubber surfaces processed with various mesh screens displayed microstructures of identical shape but varying sizes. In Figure 2(a1,a2), the bright streaks visible on the original rubber surface are attributed to the hot-press moulding process, where the mould surface was not entirely smooth. Consequently, small groove-like streaks formed on the original rubber surface, significantly smaller than the microstructures on other sample surfaces and with negligible influence on subsequent experimental results.
Upon comparing Figure 2(b1–d2), it is clear that rectangular depression-like microstructures were present on the rubber surface. The microstructures created by the various mesh screens had the same shape but varied in size. For the 600#-SR sample, the width of the rectangular microstructures averaged 36.12 ± 2.5 μm, with an average length of 388.5 ± 1.3 μm. The depth of the rectangular structures is described later, and the average distance between microstructure units was 65.52 ± 2.2 μm. The microstructures on the 600#-SR sample were the largest among the three samples, while the 2000#-SR sample had the smallest microstructures. The average width of the microstructures on the 2000#-SR surface was 19.78 ± 1.3 μm, a reduction of 45.2% compared to the 600#-SR sample. The average length was 201.5 ± 3.2 μm, a 48.1% reduction. The average distance between the microstructure units was 51.81 μm, 20.9% smaller than that for the 600#-SR sample. It is evident from the figures that the surface microstructures were not centrally symmetric, suggesting that the directionality of the microstructures may influence the performance of the composite material.

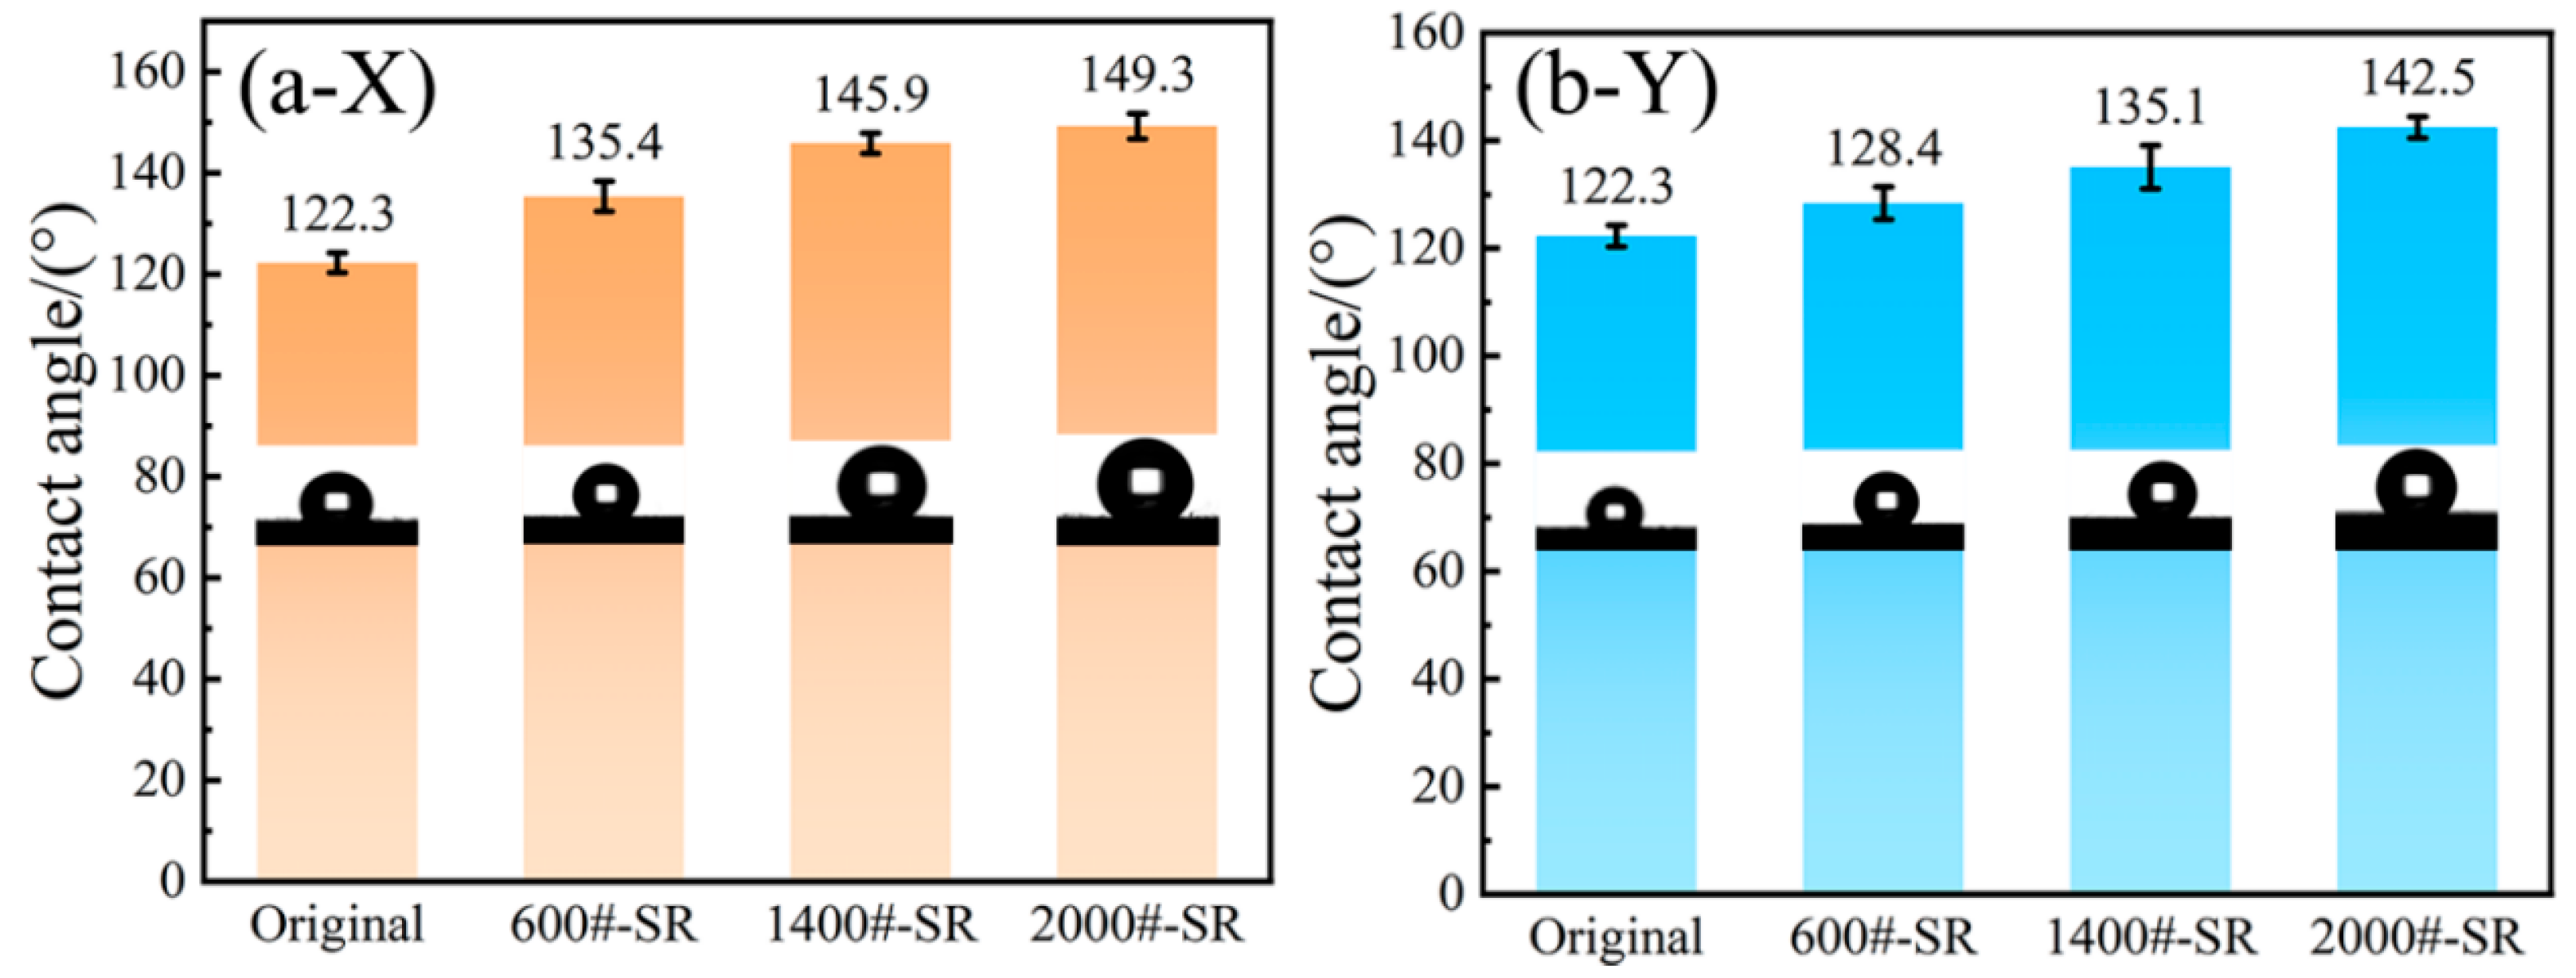
3.2. Anisotropic Wetting Properties of M-SR Composites

The static contact angle is a key parameter reflecting the surface wettability of materials, which is closely correlated with their ice adhesion performance [24,25]. In Figure 3, panels (a-X) and (b-Y) present the static contact angles measured along the X and Y directions, respectively. For the unmodified silicone rubber, the contact angle was 122.3 ± 1.2°, with no directional dependence. As the mesh number increased, the contact angle of the microstructured surfaces also increased. The highest contact angle, observed in the 2000#-SR sample, was 149.3°, and the average value reached 142.5 ± 1.2°. Although these values fall below the conventional superhydrophobic threshold (150°), they indicate substantial water repellency. Notably, all modified surfaces exhibited anisotropic wetting, with contact angles in the X direction approximately 5° higher than those in the Y direction. However, the rolling angles remained above 90°, indicating that the droplets did not roll off easily. While achieving true superhydrophobicity remains a desirable target, our results suggest that engineered anisotropic microstructures can significantly reduce the ice adhesion strength even without superhydrophobicity. This indicates that optimised roughness, directional texture, and limited water penetration into microstructures may yield practical anti-icing performance, making this strategy more robust and scalable than relying solely on extreme water repellency.
The results indicate that the rubber surface’s microstructure, which resembles rectangles with varying lengths and widths, leads to different contact angles when viewed from different directions. However, the pattern of change remains consistent. Creating micron-sized microstructures on the rubber surface can enhance the static contact angle, and the smaller the microstructure, the greater the static contact angle of the rubber surface.
This phenomenon may be attributed to water droplets landing on the microstructured surface of the rubber, creating air bubbles between the droplets and the microstructure. These bubbles exert an upward force on the water droplets, thereby increasing the static contact angle of the sample surface. The static contact angle is larger for smaller-sized microstructures because, at the micrometre scale, smaller microstructures facilitate the formation of bubbles between the droplets and the microstructure.

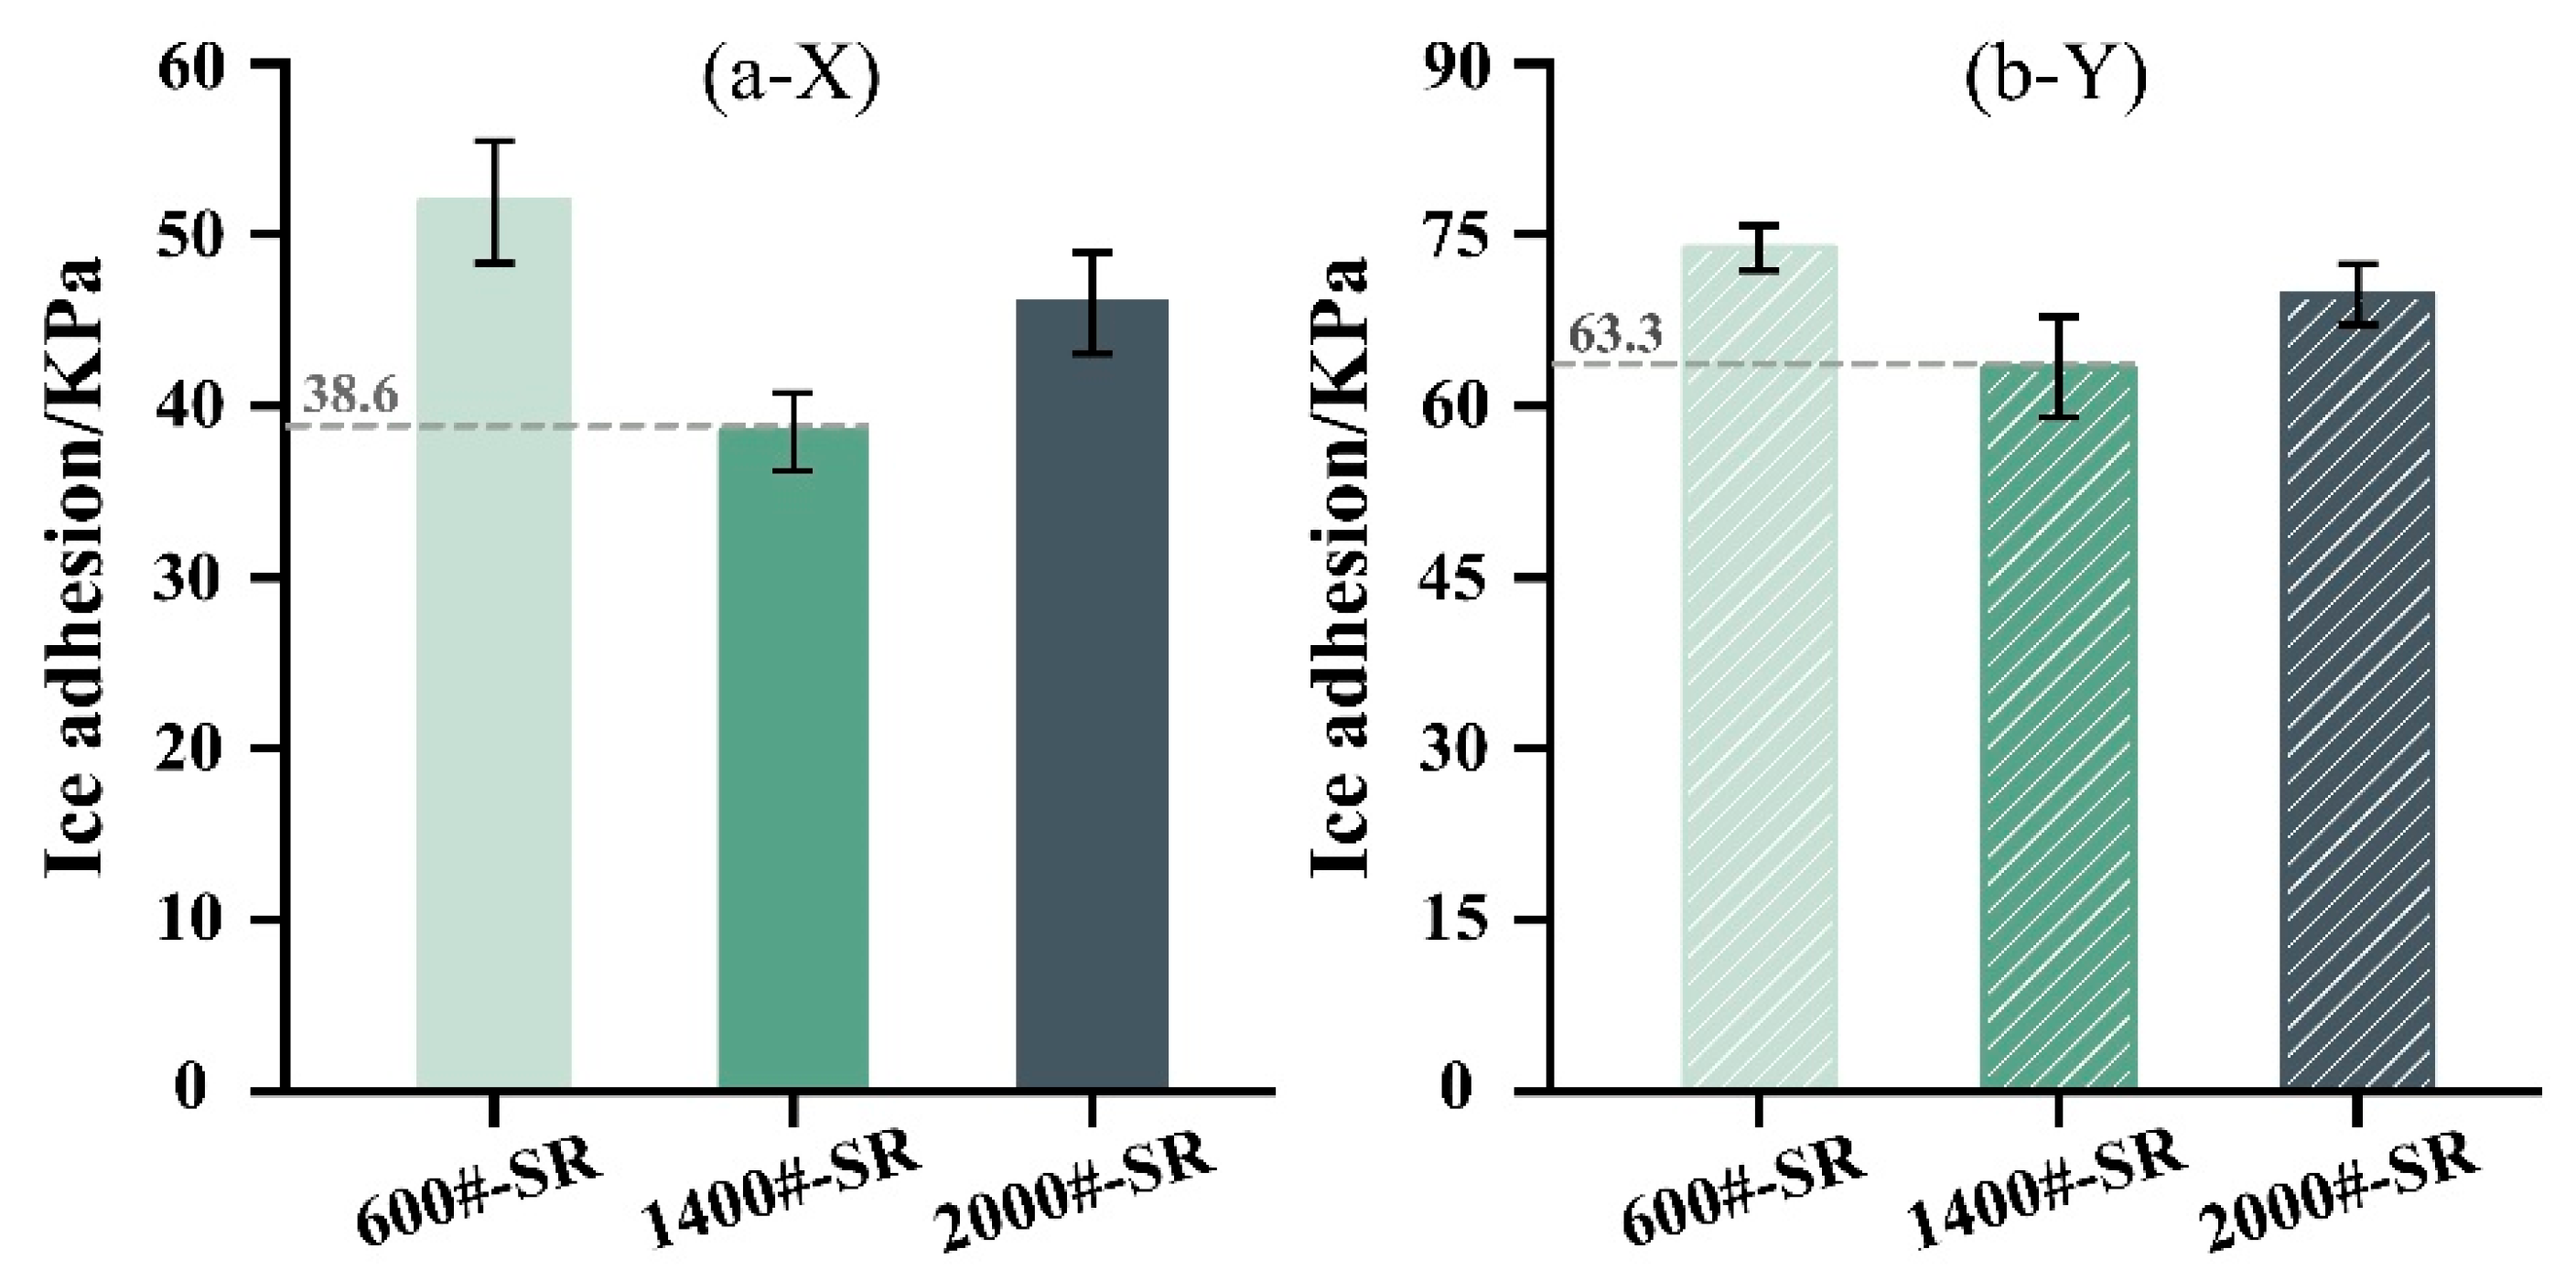
3.3. Ice Adhesion Properties of Anisotropy of M-SR Composite

Ice adhesion is widely recognised as a critical parameter for evaluating the anti-icing performance of materials, with the optimisation of microstructure dimensions playing a key role in reducing the ice adhesion strength [26,27]. In this study, a custom-designed ice adhesion testing apparatus was used to evaluate the ice adhesion properties of composite materials along both the X and Y directions. As shown in Figure 4, when force was applied in the X direction, the ice adhesion strength of the 600#-SR sample reached 51.99 kPa, while the 1400#-SR and 2000#-SR samples showed values of 38.6 kPa and 46.1 kPa, respectively. As the microstructure size decreased, the ice adhesion strength initially declined and then increased, with the 1400#-SR sample exhibiting the lowest adhesion strength.
When force was applied along the Y direction, the ice adhesion strength for the 600#-SR, 1400#-SR, and 2000#-SR samples was 73.8 kPa, 63.3 kPa, and 69.7 kPa, respectively. An analysis of the experimental data revealed that both the microstructure dimensions and the force direction significantly influenced the ice adhesion strength of the silicone rubber samples. Along the X direction, the ice adhesion strength reached a minimum of 38.6 kPa for the 1400#-SR sample, with a slight increase observed for the 2000#-SR sample (46.1 kPa). This non-linear trend suggests the presence of an optimal microstructure configuration—exemplified by the 1400#-SR sample—where both the moderate surface roughness and favourable aspect ratio of the recessed structures collectively minimise the effective ice–substrate contact area and interlocking potential. Therefore, while surface roughness contributes to the observed trend, other geometric parameters, such as the groove width, spacing uniformity, and depth-to-width ratio, also play a significant role in enhancing the icephobic performance. A similar trend was observed in the Y direction, with the 1400#-SR sample again exhibiting the lowest ice adhesion strength (63.3 kPa). However, all samples demonstrated higher ice adhesion strength in the Y direction compared to the X direction, reflecting the anisotropic characteristics of the microstructured surface. This anisotropy arises from the alignment of microstructures, which enhances ice interlocking effects in the Y direction.
These findings underscore the significance of optimising the microstructure design to effectively diminish the ice adhesion strength. Furthermore, the observed anisotropic behaviour offers insights into customising surface properties to fulfil specific anti-icing requirements across various operational conditions, providing valuable guidance for developing advanced anti-icing surfaces.

3.4. Mechanism Analysis of M-SR Composite Surface

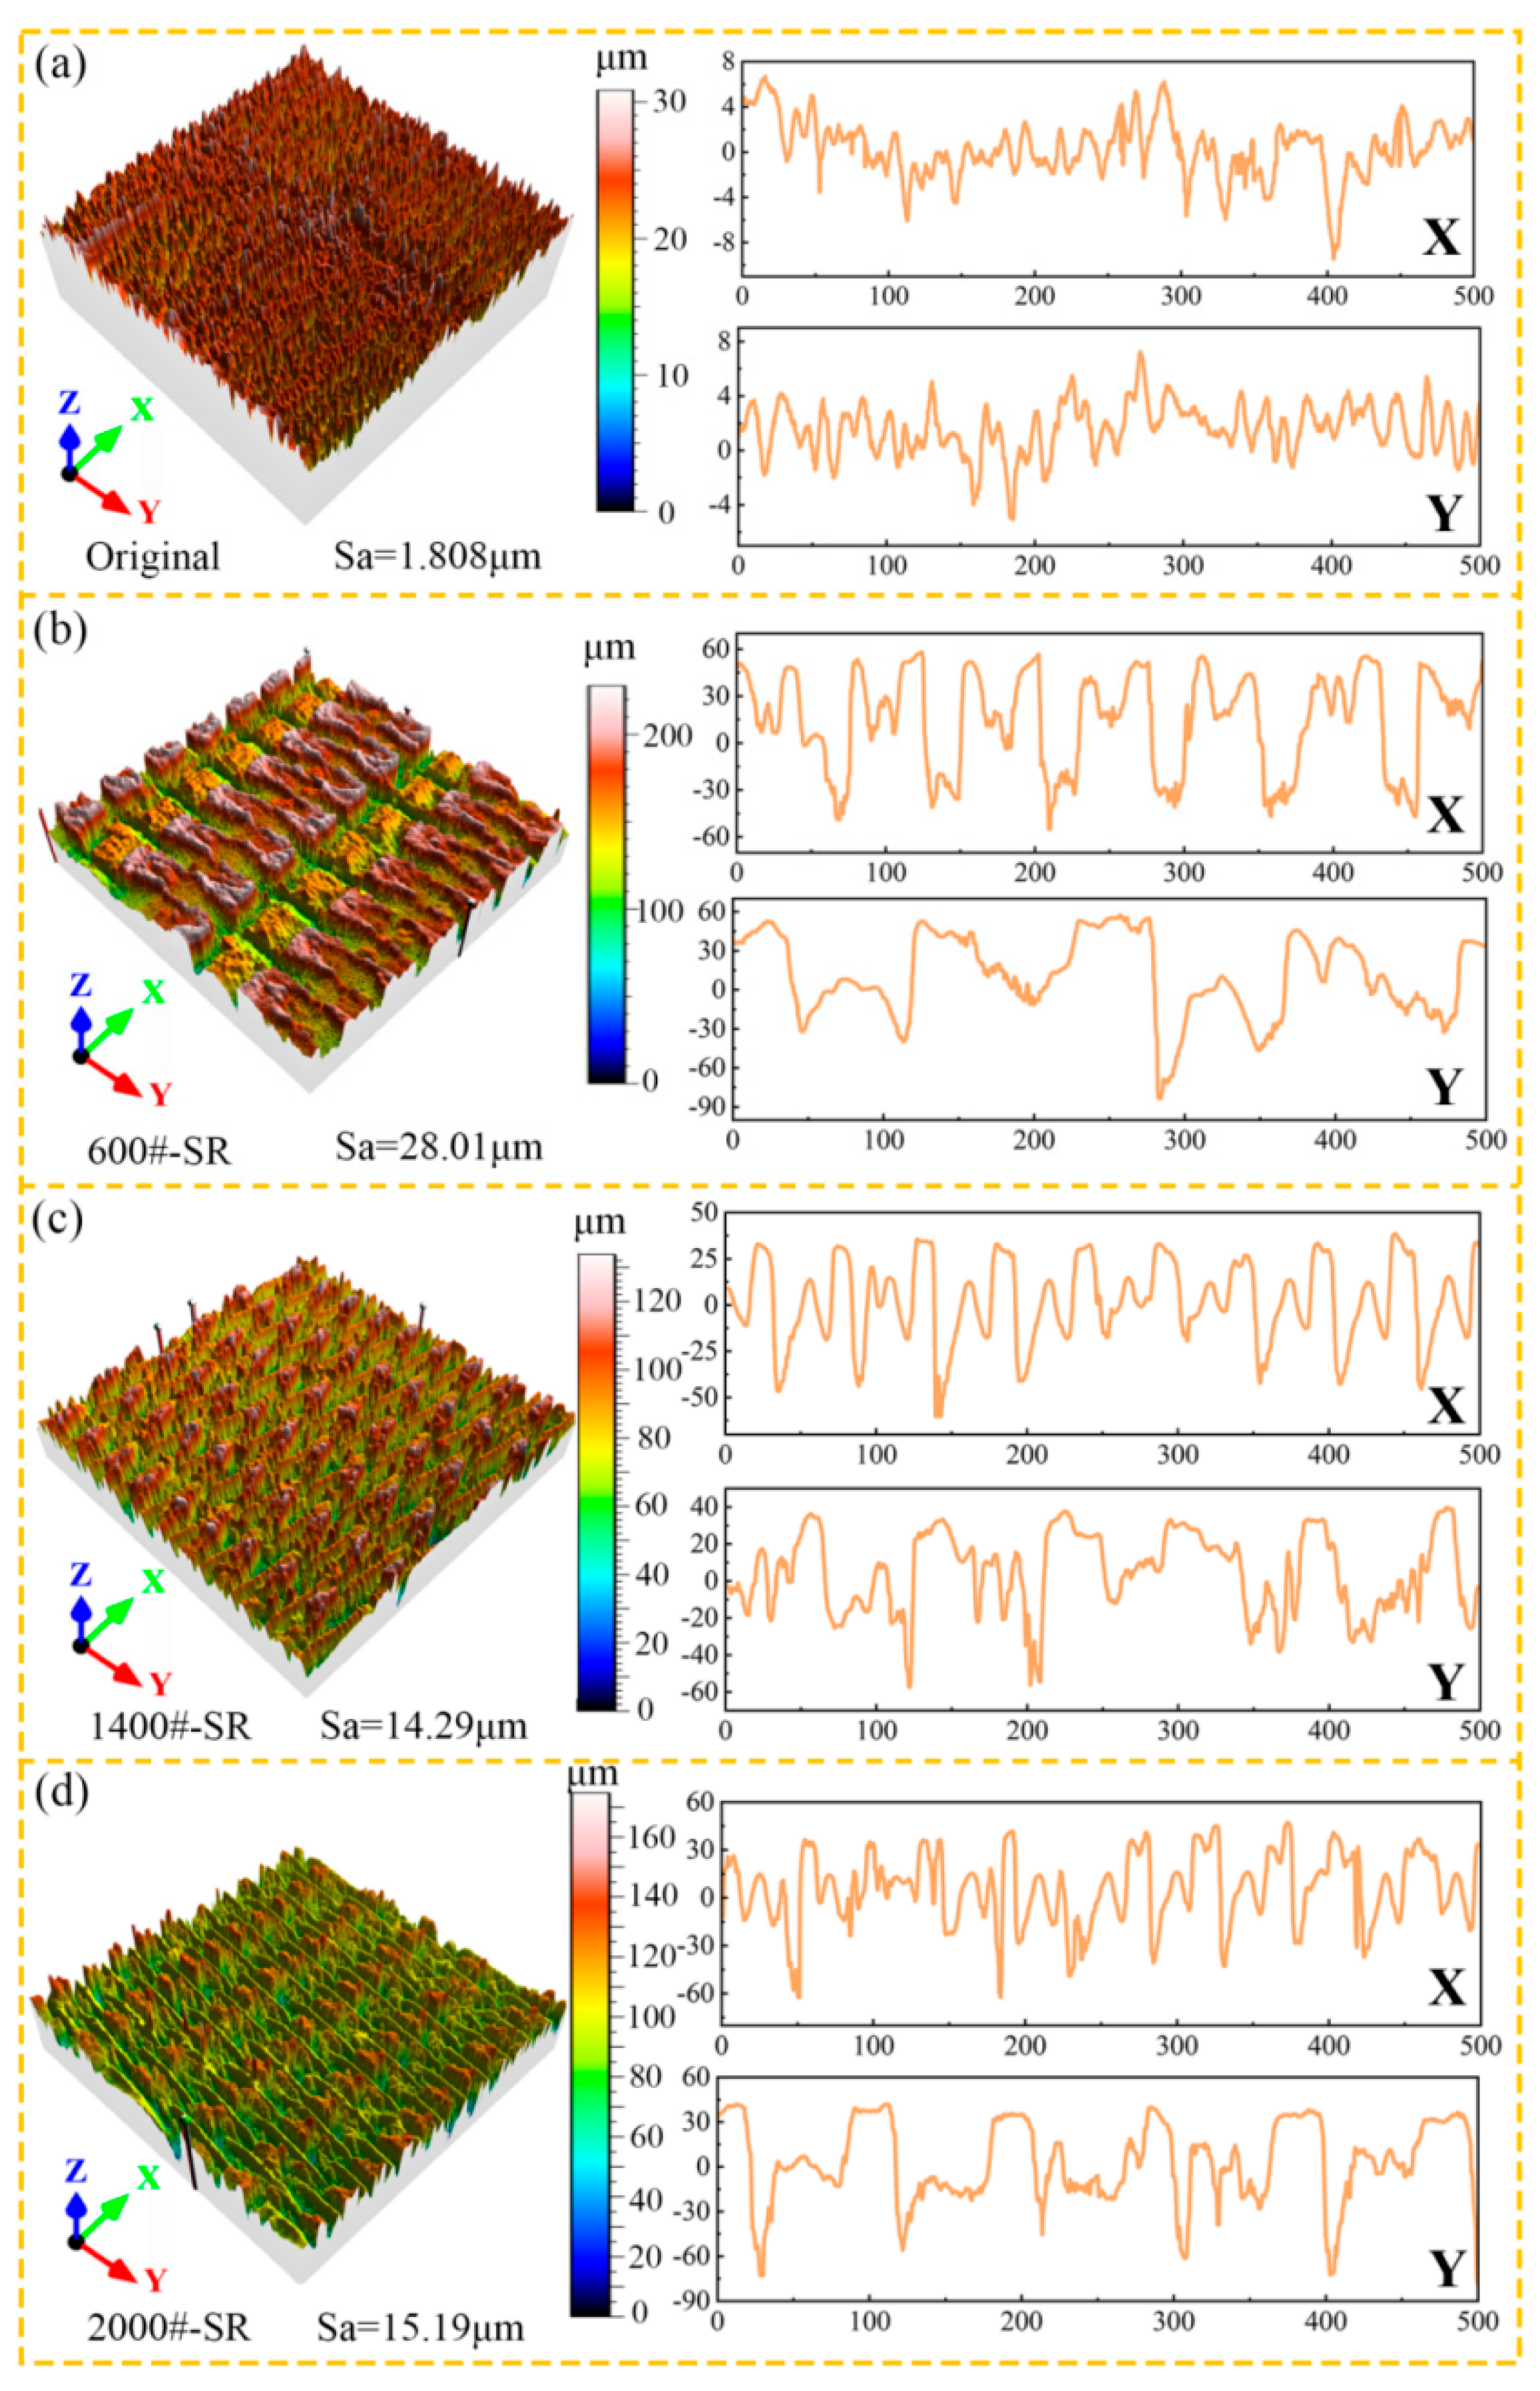
3.4.1. Surface Microstructure Morphology

Figure 5 presents the composites′ three-dimensional morphology and cross-sectional curves; the cross-sectional curves are derived from the centre of the scanned area, with two curves oriented parallel to the X and Y directions, hereafter referred to as the X and Y cross-sectional curves, respectively. As illustrated in Figure 5a, the microscopic surface of the original silicone rubber exhibits small conical peaks. As observed from the X and Y cross-sectional curves, the heights of these peaks range from 0 to 16 μm, indicating their relatively uniform height and a small amplitude of fluctuation in the cross-sectional curves. Consequently, the roughness of the original silicone rubber surface is relatively low, with a Sa value of 1.808 μm. The original silicone rubber surface appears comparatively smooth when viewed on a larger scale.
The three-dimensional morphology of the 600#-SR specimens and their X and Y cross-sectional curves are displayed in Figure 5b. The presence of rectangular microstructures on the surface of the 600#-SR specimen is clear, and based on the electron microscope image in Figure 2, the size of individual microstructures is approximately 100 μm. The X cross-sectional curve of the 600#-SR specimen demonstrates a more systematic arrangement of microstructures, with heights around 120 μm. These microstructures exhibit regularity due to the screen-assisted preparation process. In contrast, the Y cross-sectional curve indicates less regularity, with microstructures in the Y direction exhibiting a height of approximately 150 μm. The increased roughness of the scanning area for the 600#-SR specimen is reflected in its Sa value of 28.01 μm, representing an increase of 1393.7% compared to the original silicone rubber.
Figure 5c presents the three-dimensional surface morphology of the 1400#-SR specimen, together with its cross-sectional profiles along the X and Y directions. Based on the electron microscope image in Figure 2(c1,c2), the individual microstructures were estimated to be around 75 μm. Both the X and Y cross-sectional profiles show microstructure heights of approximately 100 μm. The roughness of the 1400#-SR specimen was recorded as Sa = 14.29 μm, reflecting an increase of 690.4% compared to the original silicone rubber.
The three-dimensional morphology of the 2000#-SR specimen and its corresponding X and Y cross-sectional curves are illustrated in Figure 5d. From the electron microscope image in Figure 2(d1,d2), the size of individual microstructures is approximately 55 μm. The X cross-sectional curve shows a microstructure height of about 120 μm, while the microstructures in the Y direction exhibit a height of approximately 150 μm. The roughness for the 2000#-SR specimen was recorded as Sa = 15.19 μm, indicating that the surface was approximately 740.2% rougher than that of the original silicone rubber.
A comparison of the three-dimensional morphologies of the M-SR specimens indicates that increasing the screen mesh number leads to smaller but consistently rectangular microstructures. The three-dimensional morphology of the 600#-SR specimens more clearly illustrates this trend. The X and Y cross-sectional analyses revealed that the width of individual microstructures and the spacing between adjacent units decreased progressively from the 600#-SR to the 2000#-SR specimen.

3.4.2. Surface Wetting Mechanism

Figure 6 presents the interaction between water droplets and the composite surface. The microstructures on the surface generally resemble recessed rectangular shapes, increasing the rubber′s overall surface area. However, because much of the surface is perpendicularly oriented, the contact area between the droplet and the material is reduced. Due to the inherent surface tension of the droplet, water struggles to spread across such a rough surface [28]. Moreover, when a droplet lands on the composite, air becomes trapped within the microstructures, as highlighted by the blue sections in the diagram. These air pockets are compressed by the droplet′s weight, generating an upward reactive force, which consequently increases the contact angle of the droplet [29].

3.4.3. Ice Adhesion Performance

As shown in Figure 7, the microstructure on the composite material surface differed between the X and Y directions, with a larger microstructure size along the Y direction. Based on the 3D morphology in Figure 5, the recessed areas of the microstructure aligned along the Y direction, simplifying the composite′s microstructure as shown in Figure 7a. Observations from the electron microscopy image in Figure 2 and the 3D morphology in Figure 5 revealed that the surface of the original silicone rubber was relatively smooth. However, the construction of microstructures on the composite material surface resulted in increased roughness and recessed features. The fluidity of water penetrates the microstructures during the freezing process, as shown in Figure 7c. This fluidity causes ice crystals to perfectly conform to the microstructure, creating a mutual locking effect between the ice crystals and the microstructure, significantly enhancing the ice adhesion strength [30,31,32]. Furthermore, the microstructure increases the roughness of the composite surface, making it easier for ice to adhere to the material. Additionally, the microstructure on the composite surface increases the material′s surface area, enlarging the actual contact area between water and the composite surface. Consequently, this enhances the adhesion force between ice and the composite, thereby increasing the ice adhesion strength on the composite material surface. Therefore, the total ice adhesion strength is expressed as follows:
F = Fa + Fb + Fc
In the formula, F represents the total ice adhesion strength on the composite surface, where Fa is the adhesion strength contributed by surface roughness, Fb is the adhesion strength due to the interlocking of ice with microstructures, and Fc is the adhesion strength from the actual contact area between water and the material. Although introducing microstructures theoretically enhances the interlocking component Fb due to water penetration and freezing, the overall ice adhesion strength F was significantly reduced in optimised samples such as 1400#-SR. This is primarily because moderate surface roughness and microstructure geometry decrease the actual contact area (Fc) and promote interfacial stress concentration, facilitating crack propagation at the ice–material interface. Therefore, the net reduction in Fa and Fc, along with favourable interfacial fracture mechanics, outweighs the increase in Fb, leading to an overall reduction in ice adhesion.
As the microstructures′ size decreased, the composite′s roughness, specifically in the 1400#-SR and 2000#-SR samples, was significantly reduced compared to that for the 600#-SR sample, leading to a decrease in the ice adhesion component Fa. The reduction in the microstructure size, combined with the increase in the composite’s static contact angle, limited the water′s ability to fully penetrate the microstructures. This effect greatly reduced Fb, the ice adhesion strength attributed to the interlocking of ice with the microstructures. Additionally, changes in wettability led to a reduction in actual contact area, thereby decreasing Fc. Consequently, the ice adhesion strength of the 1400#-SR and 2000#-SR samples decreased. However, because the roughness of the 2000#-SR composite was greater than that of the 1400#-SR sample, the Fa and Fc values were larger for the 2000#-SR sample, ultimately resulting in a higher overall ice adhesion strength for the 2000#-SR sample than for the 1400#-SR sample.
Additionally, the difference in ice adhesion strength between the X and Y directions arises from the alignment between the applied force and the orientation of the microstructures. When force is applied along the X direction, it intersects the recessed structures perpendicularly, where the groove width is narrower and less continuous compared to the Y direction. Due to this geometric limitation, the effective interlocking area between ice and the surface is significantly reduced, rendering Fb negligible in the X direction. Conversely, when force is applied along the Y direction, it is parallel to the recesses, and, thus, Fb must be considered in assessing the composite’s ice adhesion strength. This analysis demonstrates that microstructures at the micron scale can enhance the composite′s wettability but reduce its ice-shedding ability. Notably, the relationship between roughness and ice adhesion strength is inversely proportional, meaning that higher surface roughness leads to lower ice adhesion, making ice removal more challenging.

4. Conclusions

This study investigated the impact of microstructural size and anisotropy on silicone rubber surfaces′ ice adhesion and wettability properties. The results of using a custom-built ice adhesion testing device revealed significant directional differences in ice adhesion strength along the X and Y axes. In the X direction, the ice adhesion strength exhibited non-linear variation with decreasing microstructure size, with the 1400#-SR sample showing the lowest adhesion strength of 38.6 kPa. This suggests the existence of an optimal microstructure size that balances surface roughness and the actual contact area, thereby minimising the adhesion strength. In contrast, in the Y direction, the 1400#-SR sample also showed the lowest adhesion strength at 63.3 kPa, but all samples demonstrated higher ice adhesion in the Y direction than in the X direction. This difference is attributed to the enhanced ice interlocking effect due to the arrangement of the microstructure, highlighting the importance of surface anisotropic characteristics.
The results indicate that optimising the microstructural design is crucial for effectively reducing the ice adhesion strength. Furthermore, the observed anisotropic characteristics provide a basis for surface design modifications to meet anti-icing requirements under varying conditions. This research deepens the understanding of the interactions between microstructures and ice adhesion and offers significant theoretical and practical support for the development of innovative, low-energy anti-icing materials.

Author Contributions

Conceptualisation, F.Z. and Q.H.; methodology, F.Z.; software, F.Z.; validation, S.Z. and X.W.; formal analysis, F.Z.; investigation, F.Z.; resources, Q.H. and L.L.; data curation, X.W.; writing—original draft preparation, F.Z.; writing—review and editing, X.C., Q.H. and L.L.; visualisation, F.Z.; supervision, Q.H. and L.L.; project administration, Q.H.; funding acquisition, L.L. All authors have read and agreed to the published version of the manuscript.

Funding

This research was funded by Gansu Province Integrated Pilot Project of Research, Development, Production and Application of Machinery (Grant No. 3-3) and Gansu Province Doctoral Scholar Support Project (Grant No. 2024QB-067).

Institutional Review Board Statement

Not applicable.

Informed Consent Statement

Not applicable.

Data Availability Statement

Data are contained within the article.

Conflicts of Interest

The authors declare no conflicts of interest.

References

  1. Wang, F.; Zhuo, Y.; He, Z.; Xiao, S.; He, J.; Zhang, Z. Dynamic Anti-Icing Surfaces (DAIS). Adv. Sci. 2021, 8, e2101163. [Google Scholar] [CrossRef]
  2. He, Q.; Li, K.; Xu, Z.; Wang, J.; Wang, X.; Li, A. Research progress on the construction strategy and technical evaluation of the aircraft icing accretion protection system. Chin. J. Aeronaut. 2023, 36, 1–23. [Google Scholar] [CrossRef]
  3. Zeng, D.; Li, Y.; Huan, D.J.; Liu, H.Q.; Luo, H.Y.; Cui, Y.X.; Zhu, C.L.; Wang, J.X. Robust epoxy-modified superhydrophobic coating for aircraft anti-icing systems. Colloids Surf. A-Physicochem. Eng. Asp. 2021, 628, 127377. [Google Scholar] [CrossRef]
  4. Kim, Y.; Yee, K. Target temperature-based simulation method for predicting performance and designing aircraft thermal anti-icing systems. Int. J. Heat Mass Transf. 2024, 229, 125688. [Google Scholar] [CrossRef]
  5. He, Q.; Jia, Y.; Wang, H.; He, J.; Wang, J.; Xu, Y.; Liu, Y.; Li, A. Triple conversion strategy to build anti-de-icing sheets for the leading edge of the rotor blade. Mater. Des. 2024, 237, 112516. [Google Scholar] [CrossRef]
  6. Jiang, S.; Diao, Y.; Yang, H. Recent advances of bio-inspired anti-icing surfaces. Adv. Colloid Interface Sci. 2022, 308, 102756. [Google Scholar] [CrossRef]
  7. Xuan, S.; Yin, H.; Li, G.; Zhang, Z.; Jiao, Y.; Liao, Z.; Li, J.; Liu, S.; Wang, Y.; Tang, C.; et al. Trifolium repens L.-Like Periodic Micronano Structured Superhydrophobic Surface with Ultralow Ice Adhesion for Efficient Anti-Icing/Deicing. ACS Nano 2023, 17, 21749–21760. [Google Scholar] [CrossRef]
  8. Yang, K.S.; Lin, K.H.; Tu, C.W.; He, Y.Z.; Wang, C.C. Experimental investigation of moist air condensation on hydrophilic, hydrophobic, superhydrophilic, and hybrid hydrophobic-hydrophilic surfaces. Int. J. Heat Mass Transf. 2017, 115, 1032–1041. [Google Scholar] [CrossRef]
  9. Mousavi, S.M.; Sotoudeh, F.; Chun, B.; Lee, B.J.; Karimi, N.; Faroughi, S.A. The potential for anti-icing wing and aircraft applications of mixed-wettability surfaces-A comprehensive review. Cold Reg. Sci. Technol. 2024, 217, 104042. [Google Scholar] [CrossRef]
  10. Liang, Z.; Geng, M.; Dong, B.; Zhao, L.; Wang, S. Transparent and robust SiO2/PDMS composite coatings with self-cleaning. Surf. Eng. 2020, 36, 643–650. [Google Scholar] [CrossRef]
  11. Alwazzan, M.; Egab, K.; Wang, P.T.; Shang, Z.Y.; Liang, X.H.; Khan, J.; Li, C. Condensation heat transfer on nickel tubes: The role of atomic layer deposition of nickel oxide. Int. J. Heat Mass Transf. 2019, 133, 487–493. [Google Scholar] [CrossRef]
  12. Wang, D.; Sun, Q.; Hokkanen, M.J.; Zhang, C.; Lin, F.Y.; Liu, Q.; Zhu, S.P.; Zhou, T.; Chang, Q.; He, B.; et al. Design of robust superhydrophobic surfaces. Nature 2020, 582, 55–59. [Google Scholar] [CrossRef]
  13. Lv, D.M.; Sheng, L.; Wan, J.P.; Dong, J.W.; Ouyang, H.S.; Jiao, H.P.; Liu, J.Q. Bioinspired hierarchically hairy particles for robust superhydrophobic coatings a droplet dynamic template method. Polym. Chem. 2019, 10, 331–335. [Google Scholar] [CrossRef]
  14. Xing, M.B.; Zhang, Z.T.; Wang, Z.Y.; Jing, D.L. Freezing process of water droplet on the cold plate surfaces with different wettability. Int. J. Heat Mass Transf. 2024, 230, 125773. [Google Scholar] [CrossRef]
  15. Memon, H.; De Focatiis, D.S.A.; Choi, K.S.; Hou, X.H. Durability enhancement of low ice adhesion polymeric coatings. Prog. Org. Coat. 2021, 151, 106033. [Google Scholar] [CrossRef]
  16. Xie, Q.; Hao, T.H.; Wang, C.; Kang, Z.H.; Shi, Z.H.; Zhang, J.F. The Mechanical Mechanism and Influencing Factors of Ice Adhesion Strength on Ice-Phobic Coating. J. Mar. Sci. Eng. 2021, 9, 315. [Google Scholar] [CrossRef]
  17. Stendardo, L.; Gastaldo, G.; Budinger, M.; Pommier-Budinger, V.; Tagliaro, I.; Ibáñez-Ibáñez, P.F.; Antonini, C. Reframing ice adhesion mechanisms on a solid surface. Appl. Surf. Sci. 2023, 641, 158462. [Google Scholar] [CrossRef]
  18. Wang, L.; Jiang, G.; Tian, Z.; Chen, C.; Hu, X.; Peng, R.; Zhang, H.; Fan, P.; Zhong, M. Superhydrophobic microstructures for better anti-icing performances: Open-cell or closed-cell? Mater. Horiz. 2023, 10, 209–220. [Google Scholar] [CrossRef]
  19. Shen, F.; Fang, W.Z.; Zhang, S.; Zhang, X.; Yang, C.; Tao, W.Q. Numerical simulations of freezing behaviors of water droplets impacting cold hydrophobic surfaces. Appl. Therm. Eng. 2025, 258, 124521. [Google Scholar] [CrossRef]
  20. Hou, W.Q.; Shen, Y.Z.; Tao, J.; Xu, Y.J.S.; Jiang, J.W.; Chen, H.F.; Jia, Z.F. Anti-icing performance of the superhydrophobic surface with micro-cubic array structures fabricated by plasma etching. Colloids Surf. A-Physicochem. Eng. Asp. 2020, 586, 124180. [Google Scholar] [CrossRef]
  21. Omidali, F.; Azizian, S.; Sohrabi, B.; Shabanlou, E.; Jaleh, B. Fabrication of highly-hydrophobic steel meshes using pulsed laser ablation and surface modification methods for oil/water separation. Surf. Interfaces 2025, 64, 106402. [Google Scholar] [CrossRef]
  22. Jiang, J.; Sheng, Q.; Tang, G.H.; Yang, M.Y.; Guo, L. Anti-icing propagation and icephobicity of slippery liquid-infused porous surface for condensation frosting. Int. J. Heat Mass Transf. 2022, 190, 122730. [Google Scholar] [CrossRef]
  23. Memon, H.; Liu, J.P.; De Focatiis, D.S.A.; Choi, K.S.; Hou, X.H. Intrinsic dependence of ice adhesion strength on surface roughness. Surf. Coat. Technol. 2020, 385, 125382. [Google Scholar] [CrossRef]
  24. Tong, W.; Xiong, D.S.; Wang, N.; Wu, Z.; Zhou, H.J. Mechanically robust superhydrophobic coating for aeronautical composite against ice accretion and ice adhesion. Compos. Part B-Eng. 2019, 176, 107267. [Google Scholar] [CrossRef]
  25. Pan, R.; Zhang, H.; Zhong, M. Triple-Scale Superhydrophobic Surface with Excellent Anti-Icing and Icephobic Performance via Ultrafast Laser Hybrid Fabrication. ACS Appl. Mater. Interfaces 2021, 13, 1743–1753. [Google Scholar] [CrossRef] [PubMed]
  26. Moon, C.H.; Yasmeen, S.; Park, K.; Gaiji, H.; Chung, C.; Kim, H.; Moon, H.S.; Choi, J.W.; Lee, H.B. Icephobic Coating through a Self-Formed Superhydrophobic Surface Using a Polymer and Microsized Particles. ACS Appl. Mater. Interfaces 2022, 14, 3334–3343. [Google Scholar] [CrossRef]
  27. Yang, Q.; Au, S.; Dijvejin, Z.A.; Zarasvand, K.A.; Dolatabadi, A.; Golovin, K. Superhydrophobic Surfaces Exhibiting Low Interfacial Toughness with Ice. Chem. Eng. J. 2025, 508, 160929. [Google Scholar] [CrossRef]
  28. Liu, Y.; Zhang, H.; Wang, P.; He, Z.Y.; Dong, G.N. 3D-printed bionic superhydrophobic surface with petal-like microstructures for droplet manipulation, oil-water separation, and drag reduction. Mater. Des. 2022, 219, 110765. [Google Scholar] [CrossRef]
  29. Xiang, Y.X.; He, Y.; Zhang, W.; Li, B.G.; Li, H.J.; Wang, Y.Q.; Yin, X.Y.; Tang, W.W.; Li, Z.Y.; He, Z. Superhydrophobic LDH/TTOS composite surface based on microstructure for the anti-corrosion, anti-fouling and oil-water separation application. Colloids Surf. A-Physicochem. Eng. Asp. 2021, 622, 126558. [Google Scholar] [CrossRef]
  30. Tian, Z.; Fan, P.X.; Zhu, D.Y.; Wang, L.Z.; Zhao, H.Y.; Chen, C.C.; Peng, R.; Li, D.Z.; Zhang, H.J.; Zhong, M.L. Anti-ice-pinning superhydrophobic surfaces for extremely low ice adhesion. Chem. Eng. J. 2023, 473, 145382. [Google Scholar] [CrossRef]
  31. Chen, C.; Tian, Z.; Luo, X.; Jiang, G.; Hu, X.; Wang, L.; Peng, R.; Zhang, H.; Zhong, M. Micro-Nano-Nanowire Triple Structure-Held PDMS Superhydrophobic Surfaces for Robust Ultra-Long-Term Icephobic Performance. ACS Appl. Mater. Interfaces 2022, 14, 23973–23982. [Google Scholar] [CrossRef] [PubMed]
  32. Wang, L.; Tian, Z.; Jiang, G.; Luo, X.; Chen, C.; Hu, X.; Zhang, H.; Zhong, M. Spontaneous dewetting transitions of droplets during icing & melting cycle. Nat. Commun. 2022, 13, 378. [Google Scholar] [CrossRef] [PubMed]
Figure 1. Preparation process of hydrophobic silicone rubber.
Coatings 15 00612 g001
Figure 2. Scanning electron microscope (SEM) images of the composite material surfaces: (a1,a2) original surface; (b1,b2) 600#-SR; (c1,c2) 1400#-SR; (d1,d2) 2000#-SR.
Coatings 15 00612 g002
Figure 3. Static contact angles of anisotropy of composite materials: (a-X) X direction; (b-Y) Y direction.
Coatings 15 00612 g003
Figure 4. Anisotropic ice adhesion strength of composites.
Coatings 15 00612 g004
Figure 5. Three-dimensional surface morphology and cross-sectional curves of composite materials: (a) original; (b) 600#-SR; (c) 1400#-SR; (d) 2000#-SR.
Coatings 15 00612 g005
Figure 6. Illustration of the hydrophobic mechanism of M-SR composite materials: (a-X) X direction; (b-Y) Y direction.
Coatings 15 00612 g006
Figure 7. Schematic diagram of ice adhesion strength.
Coatings 15 00612 g007
Disclaimer/Publisher’s Note: The statements, opinions and data contained in all publications are solely those of the individual author(s) and contributor(s) and not of MDPI and/or the editor(s). MDPI and/or the editor(s) disclaim responsibility for any injury to people or property resulting from any ideas, methods, instructions or products referred to in the content.

