4.1. Experimental Results
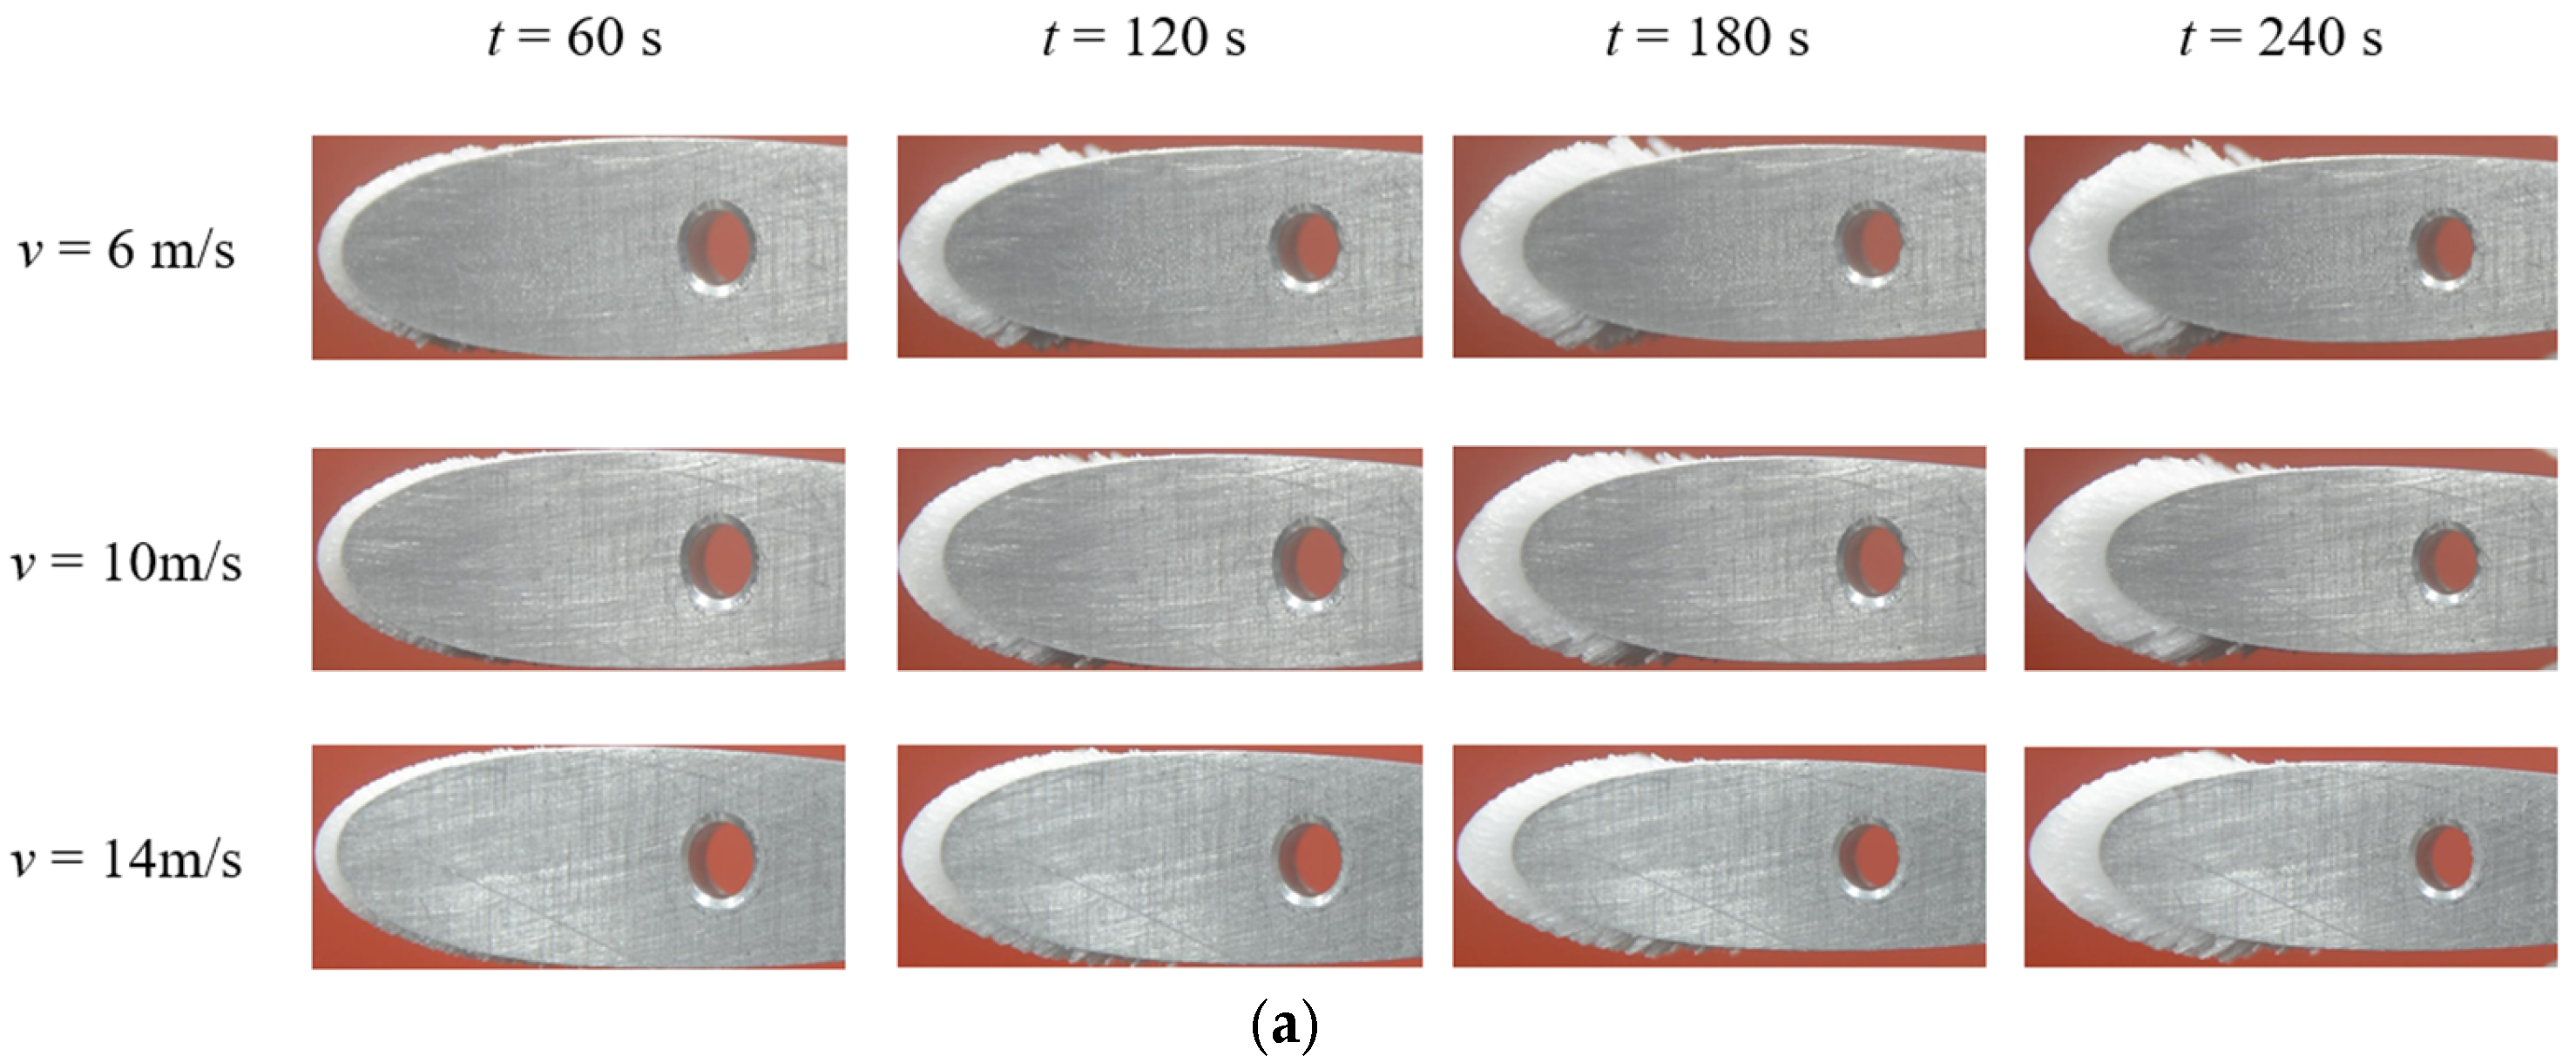
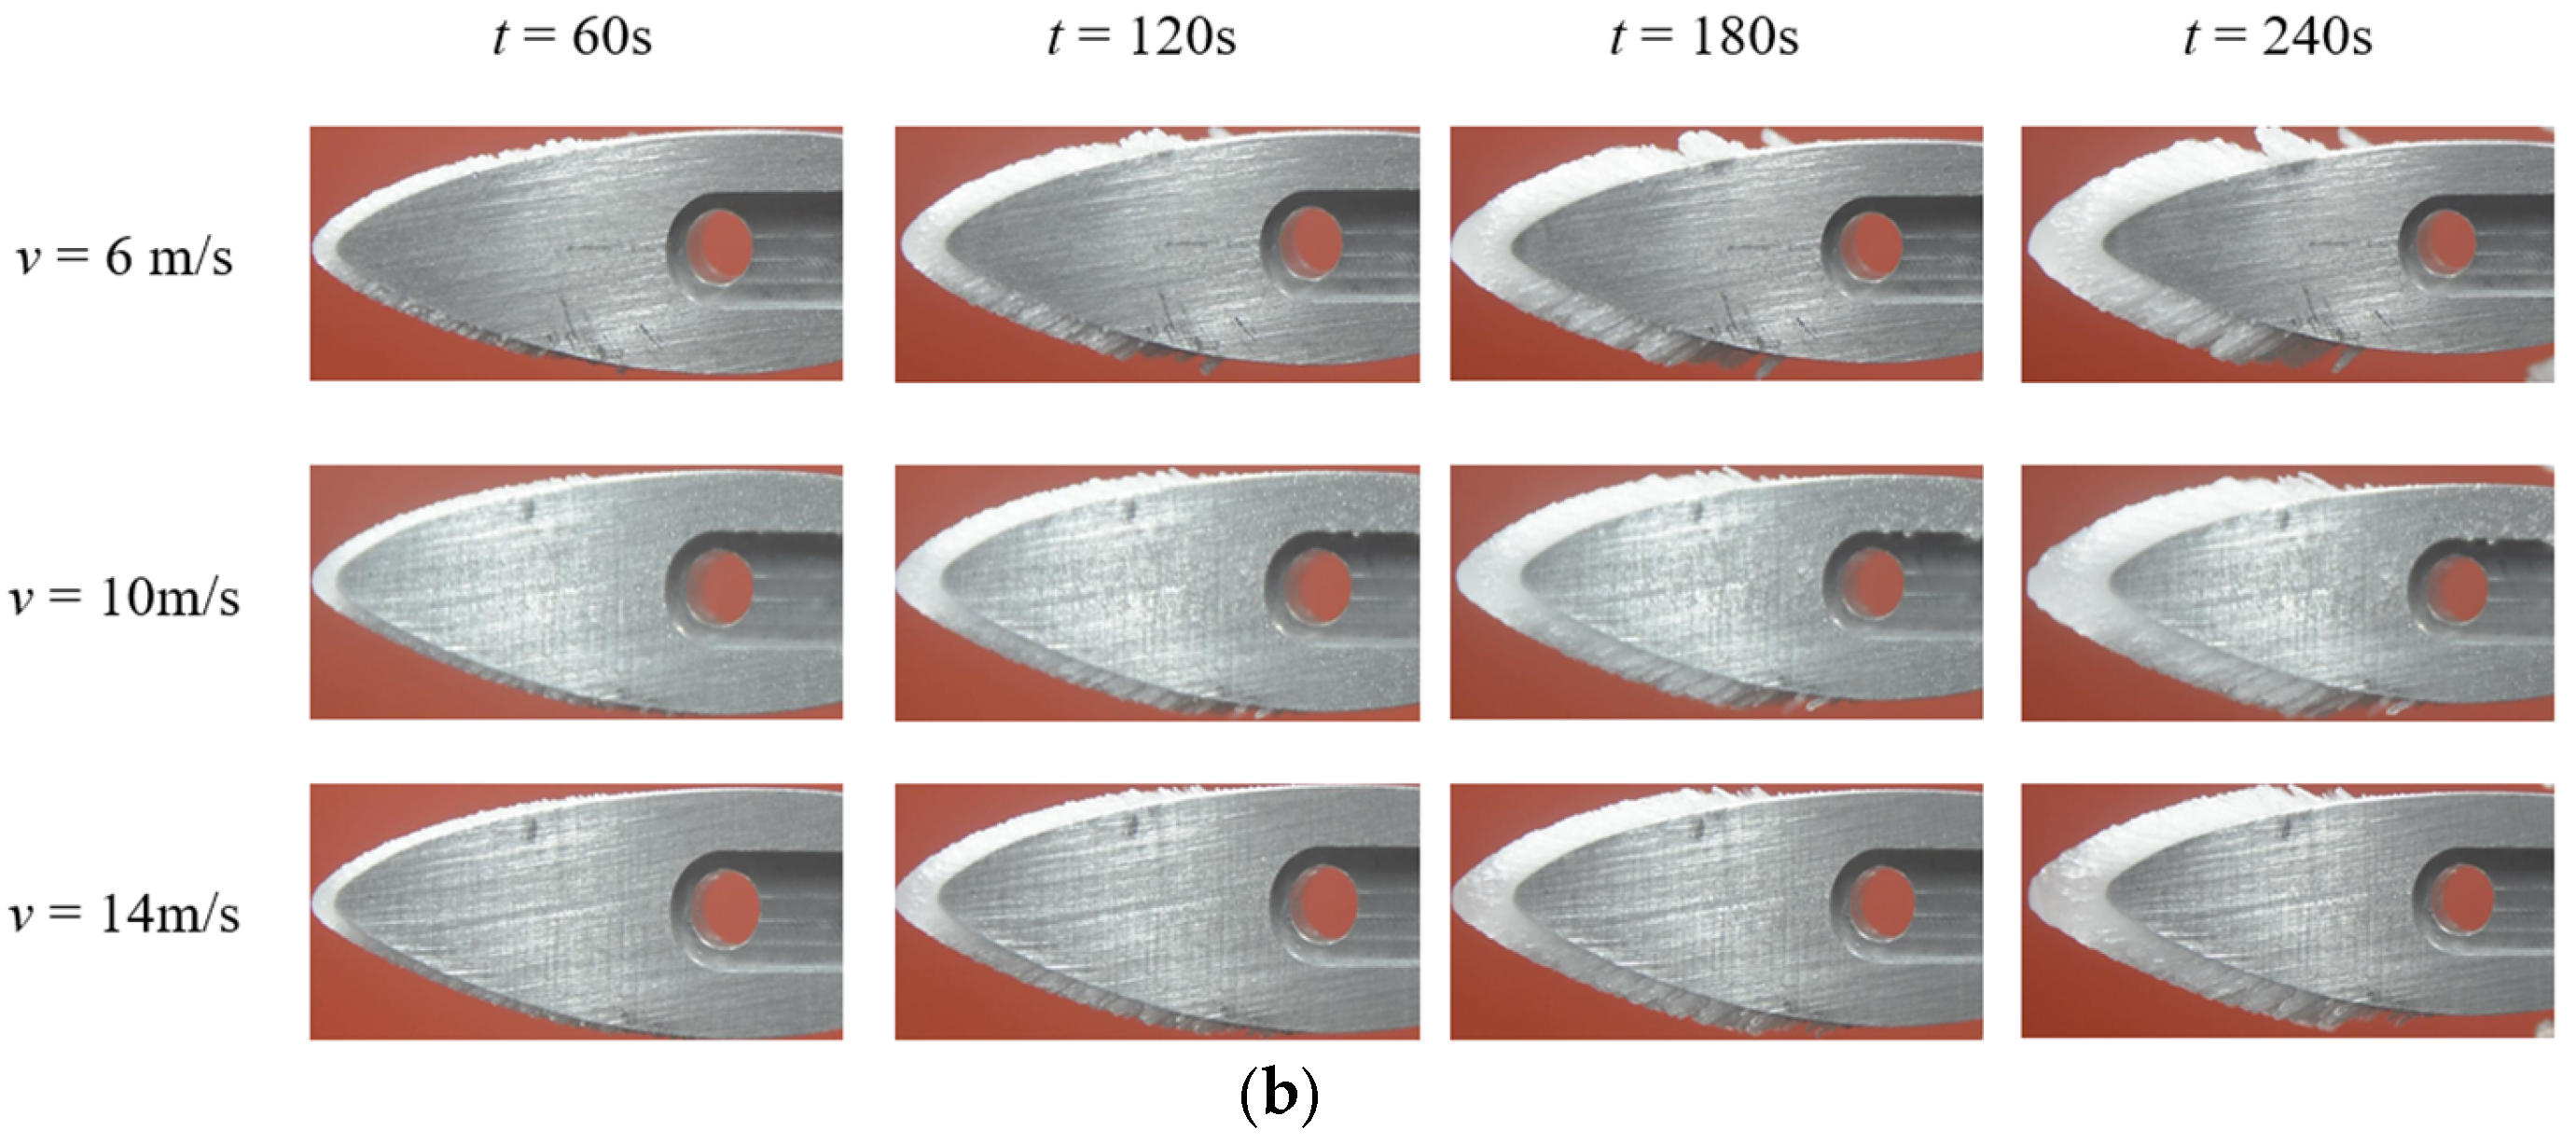
Icing tests were carried out on the NACA0018 and S809 airfoils using the experimental schemes and systems described above. To ensure the credibility of the experimental results, each icing condition was tested at least five times. Additionally, considering the potential for minor differences in temperature between the icing tests due to the variation in outdoor temperature over a day, the icing temperature was controlled to within a range of −15 ± 1 °C. The ice formed on the NACA0018 and the S809 airfoils under different icing conditions is shown in
Figure 6.
Figure 6 shows how ice forms on the different airfoil surfaces under each icing condition. The time interval between images was 30 s, and the total icing time was 4 min. It was found that icing events occurred mainly at the leading edge, and the type of ice formed was rime ice. The macro-scale surface morphology of the ice formed on both airfoils changed along their profile, moving from smooth to rough from the leading edge to the tailing edge. The ice damaged the aerodynamic profiles of the airfoils dramatically. The variation in their morphology was the result of a change in the flow state of the air and is quantitatively analyzed in
Section 4.3. As the air flowed across the airfoil, the flow state of the air changed from a laminar flow to a vortex. Under laminar flow conditions, the surface morphology of the ice, which was generated layer by layer, was smooth. In contrast, under vortex conditions, the water droplets swirled in the air, resulting in an increase in the variation in the surface morphology of the ice. The ice was not generated layer by layer, and it was thorny in shape. Additionally, the area covered with ice on the surface of the S809 airfoil was larger than that on the surface of the NACA0018 airfoil. This was a result of the distribution of the pressure field along the profile of the airfoils and is explained in detail in
Section 4.3.
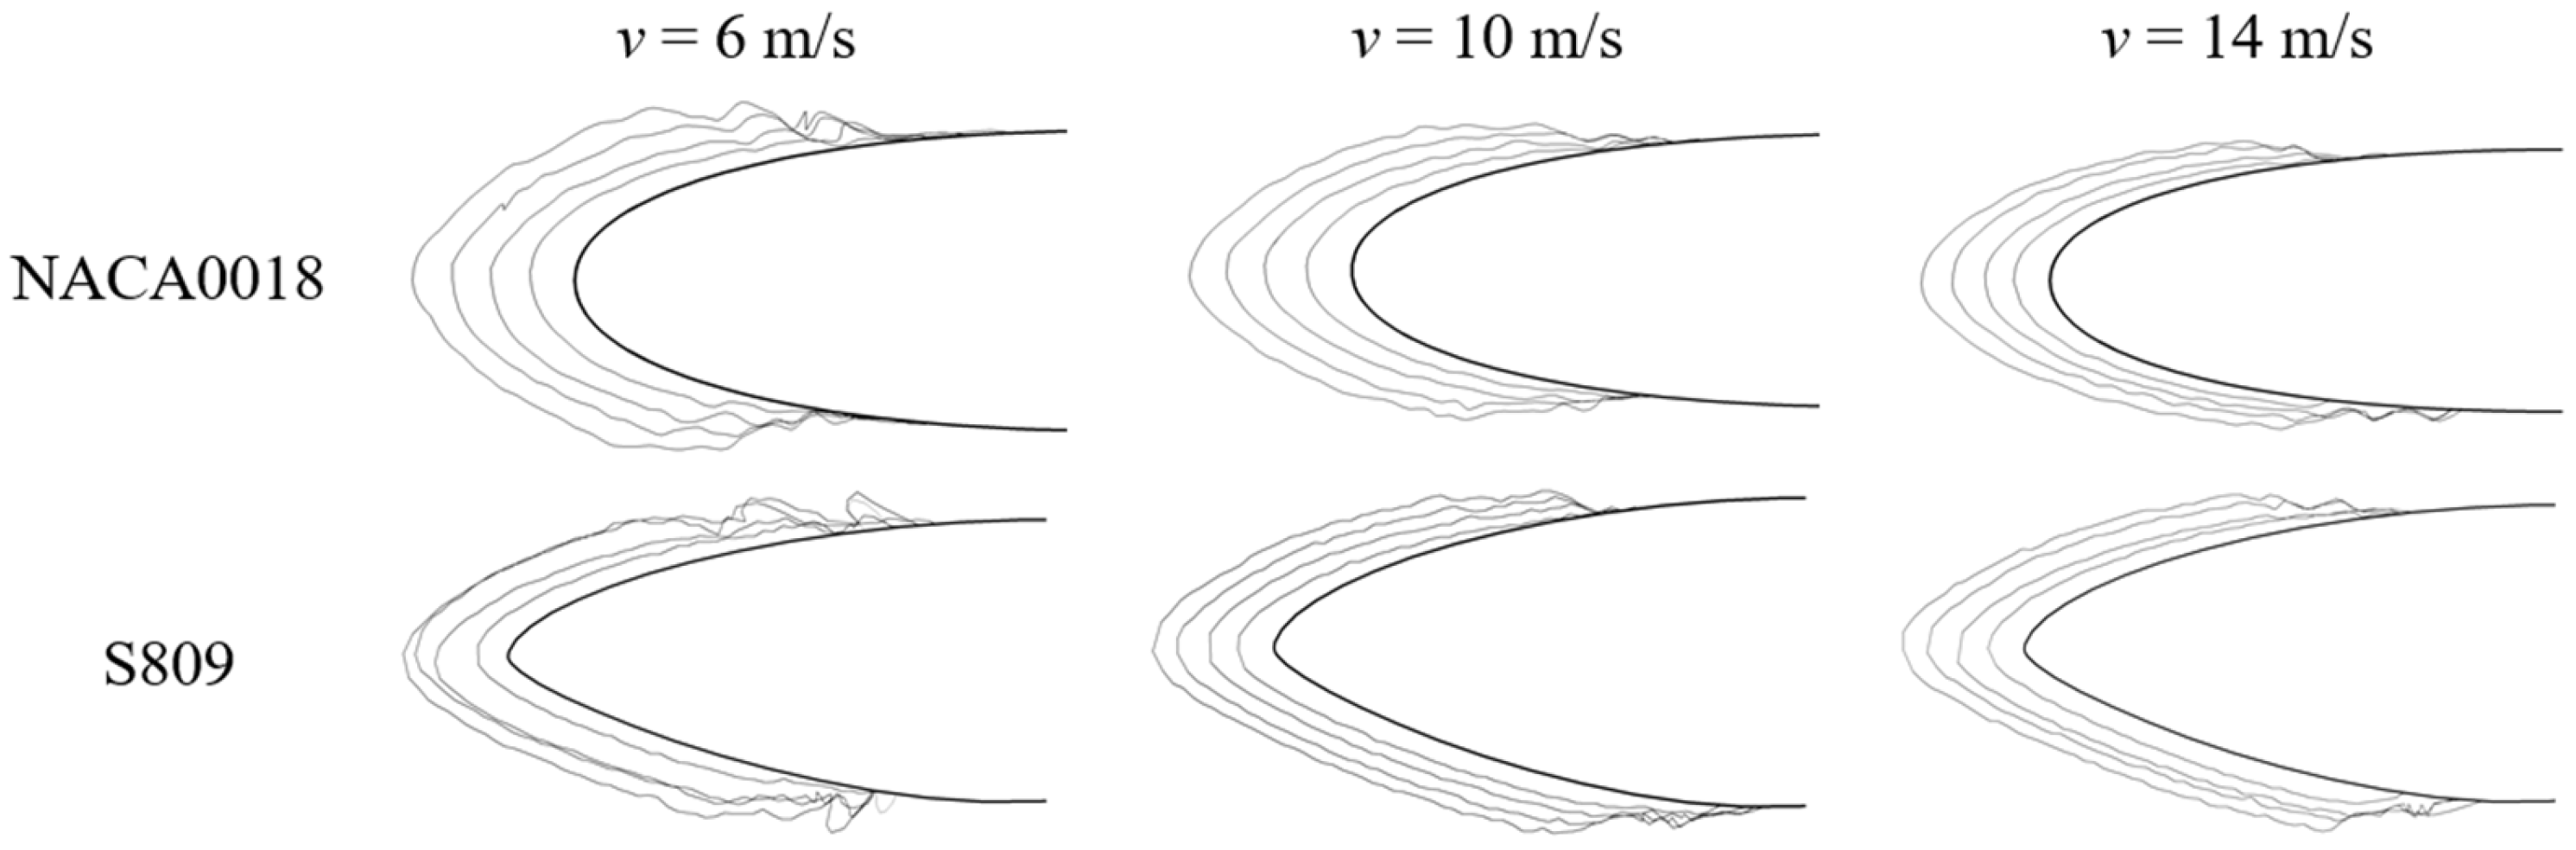
To analyze the characteristics of the ice on the airfoils, the profiles of the iced airfoils were obtained using MATLAB 2022 software and are shown in
Figure 7.
As shown in
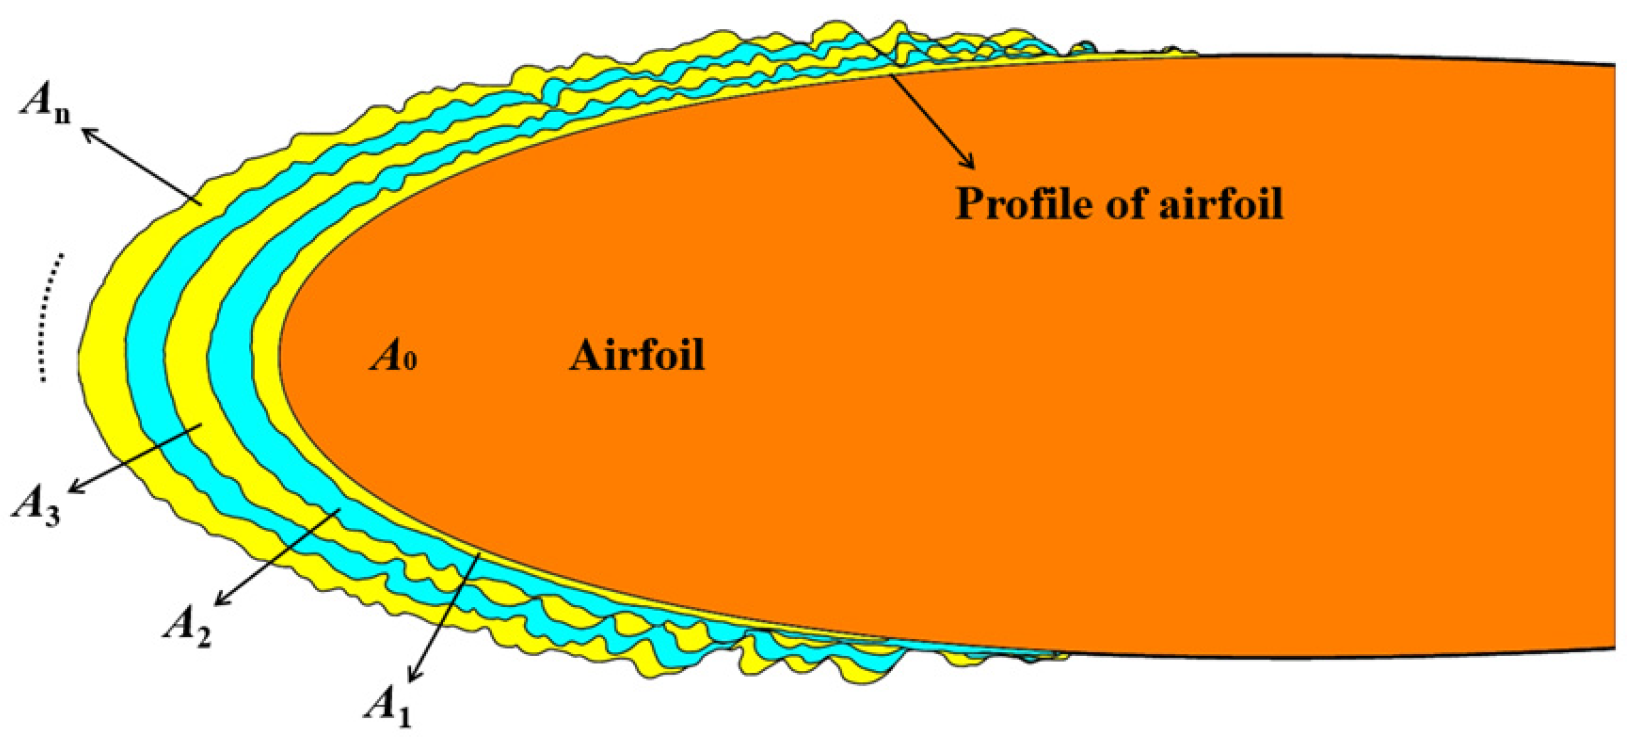
Figure 7, the ice increased layer by layer with the icing time. To analyze the process quantitatively, we defined several parameters, including the Total Icing Area (TIA), the Growth Rate of the Icing Area (GRIA), the Ice Thickness (IT), and the Growth Rate of the Thickness (GRA). The definitions of these parameters are given below.
The Total Icing Area (TIA) is an important parameter that characterizes the amount of ice on an airfoil. Its definition is as shown and expressed in
Figure 8 and Equation (1).
where TIA is the Total Icing Area and
Ai is the icing area generated in the
ith time interval, which was 40 s in the present study.
Figure 8 shows a cross-section of the ice formed on the airfoil segment. In the present study, the cross-sectional area of the ice formed is used to evaluate icing characteristics such as the amount of ice formed, the thickness of the ice, and the icing range. However, the thickness of the wingspan of the two airfoil segments was small, only 20 mm. For this reason, it was assumed that the ice on the leading edge was distributed evenly along the wingspan. Therefore, the iced area seen at the end face of the airfoil segment was used instead of a cross-section from a random position along the wingspan.
As discussed above, the ice area can be used to determine the amount of ice formed. Similarly, the thickness of the ice can characterize the variation in the profile and the decrease in the aerodynamic performance of the airfoil. Therefore, the distribution of different thicknesses of ice on the airfoil surface was analyzed in the present study. The definition and method used for analyzing the thickness of the ice are shown in
Figure 9.
As shown in
Figure 9, in order to analyze the distribution of the thickness of the ice along the airfoil segment, the airfoil was divided into two chords: an upper surface and a lower surface chord. Using this division, parameter a, which was used to locate the relative position of the ice layer along the airfoil segment, was defined. This parameter is expressed in Equation (2).
where
a is the relative position of any point
xi (shown in
Figure 8) on the chord;
l is the distance of the point
xi from the leading edge; and
c is the chord length of the airfoil.
Additionally, the variation in the surface morphology of the ice was also quantitatively analyzed using the definition of the distribution of the ice’s thickness. Considering the difficulty encountered in measuring the surface morphology of the ice directly, the image processing results were also used. To obtain an equation for the variation in the ice’s thickness, five or six evenly spaced positions on the iced surface of the chord of the airfoil were selected. Then, the average value of the variation in the surface morphology at each position was calculated according to Equation (3).
where
Ra is the average value of the variation in the surface morphology of the ice at each position;
n is the number of points sampled in one position;
δi is the thickness of ice at the
ith point sampled in that position; and
δa is the average thickness of the ice at one position.
According to the above definition, the variation in the thickness of the ice formed along the leading edge can be characterized using the parameter of position a. For example, as shown in
Figure 9, the thickness of ice is
δ1 at a given point on the airfoil’s surface. The position of that point on the chord is
xi. The position
xi is the projection of the point on the airfoil’s surface to the chord. The thickness of the ice,
δ1, is the vertical distance from the surface of the ice to the airfoil’s surface. Similarly, with the point
x1, there also exists another corresponding point on the lower surface of the airfoil segment, where the thickness of ice,
δ2, may be different. Therefore, in order to distinguish between two points projected from the same position on the chord, we defined points on the upper surface of the airfoil as positive, while points on the lower surface are negative. The frontmost point of the leading edge is taken as the origin. For instance, the distance from the front of the specimen to point
x1 is l. The value of
x1 is positive (+l) when it is on the upper surface is −l when it is on the lower surface. We used this definition to analyze the distribution of ice thicknesses along the chord.
4.2. Icing Area
Using the experimental results and the parametric definitions above, the variations in the TIAs of the NACA0018 and S809 airfoils are shown in
Figure 10.
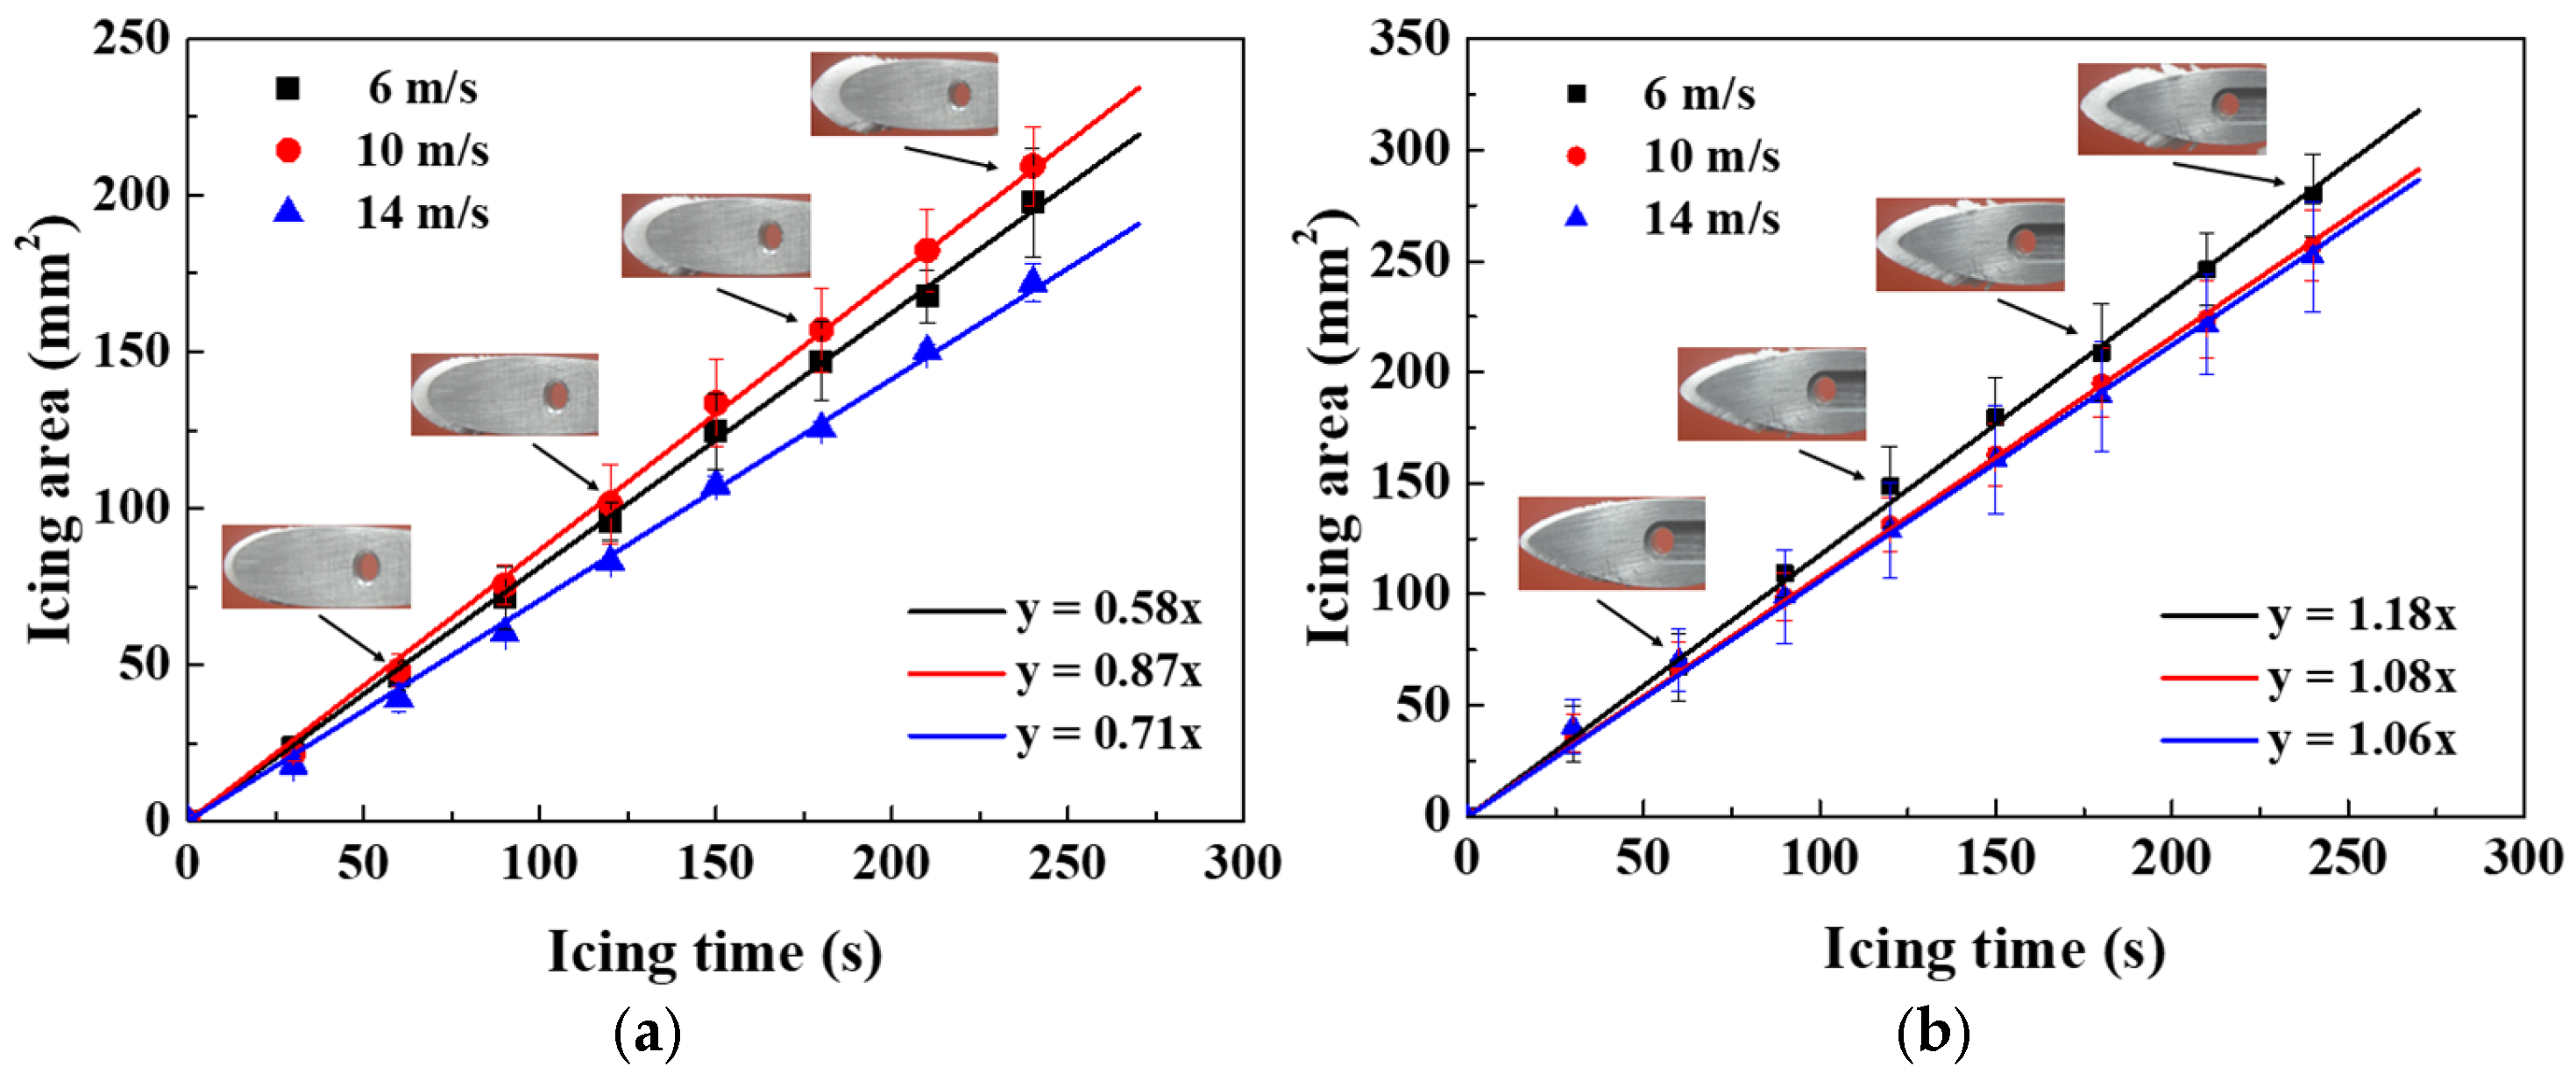
As shown in
Figure 10, the iced areas of the NACA0018 and S809 airfoils increased linearly at different wind speeds. The type of airfoil had little effect on the variation seen in the iced area. However, as shown in the figures, the wind speed had different effects on the different airfoils. For the NACA0018 airfoil, the iced area increased first and then decreased with the increase in the wind speed; the largest icing area was seen at a wind speed of 10 m/s and the smallest at a wind speed of 14 m/s. However, for the S809 airfoil, the iced area decreased with the increase in wind speed. The experimental results showed that at high wind speeds, such as 14 m/s, the amount of ice formed decreased in comparison to that formed at low wind speeds, such as 6 m/s. The reason for this is that the high wind speed blew away some of the lighter water droplets, which therefore could not freeze on the surface of the airfoil segment. This led to a decrease in the amount of ice formed. In addition, under high wind speed conditions, convective heat transfer between the water droplets and the air is also intensified. This led to some small water droplets freezing before impact with the airfoil segment’s surface, which also resulted in a decrease in the iced area. Additionally, at a relatively low wind speed, 10 m/s, the S809 airfoil accumulated less ice than it did under 6 m/s conditions. This may be due to the large curvature at the tip of the leading edge of the S809 airfoil; with the increase in the wind speed, the curvature of the airflow at the tip of the leading edge increased, which led to a decrease in the number of water droplets hitting the surface of the airfoil.
Additionally, in the initial stages of icing (i.e., the first minute), the iced areas formed under different wind speeds displayed minor discrepancies. At this stage, the water droplets made direct contact with the airfoil segment surface, which allowed them to freeze quickly, as the high thermal conductivity of aluminum, which is about 167~180 W/(m·K), led to a high rate of heat transfer between the water droplets and the airfoil segment. As the icing process continued, the leading edge of the airfoil became covered by a layer of ice. Subsequently, further water droplets could not make direct contact with the airfoil surface, and their freezing rate decreased because of the low thermal conductivity of ice, which is about 2.22 W/(m·K). Additionally, at high wind speeds, the intensity with which water droplets hit the airfoil segment increased, causing them to splash before freezing and reducing the iced area further.
Moreover, as shown in
Figure 10, the profiles of the airfoils also had an effect on the iced area. The icing area was larger for the S809 airfoil than for the NACA0018 airfoil under the same wind speed conditions. This is because the S809 airfoil has a larger front projection area compared to the NACA0018 airfoil; the maximum thickness of the S809 airfoil, which has a chord length of 100 mm, is 21 mm, making it larger than that of the NACA0018 airfoil, which has a maximum thickness of 18 mm and the same chord length. These measurements indicate that the front projection area of the S809 airfoil is 16.67% larger than that of the NACA0018 airfoil. Based on our experimental results, we carried out regression analyses of the iced areas formed on the airfoils at the different wind speeds; these are expressed as solid lines in
Figure 9. The growth rates of the iced areas of the NACA0018 airfoil were 0.58 mm
2/s, 0.87 mm
2/s and 0.71 mm
2/s under the wind speeds of 6 m/s, 10 m/s and 14 m/s, respectively. Similarly, the ones of the S809 airfoil were 1.18 mm
2/s, 1.08 mm
2/s and 1.06 mm
2/s, respectively, which were 103%, 24.14%, and 49.3% higher than those of the NACA0018 airfoil. The above analyses showed that the maximum thickness of the airfoil had a significant effect on the amount of ice formed, especially at low wind speeds, and showed that the ice also destroyed the aerodynamic profile and performance of the airfoils.
4.3. Ice Thickness
Building upon our analyses of the areas of ice formed on different airfoils at different wind speeds, we analyzed the maximum thickness and distribution of the ice formed along the airfoil surface in the present study. The variations in the maximum thicknesses of ice seen at different wind speeds and on different airfoils are shown in
Figure 11.
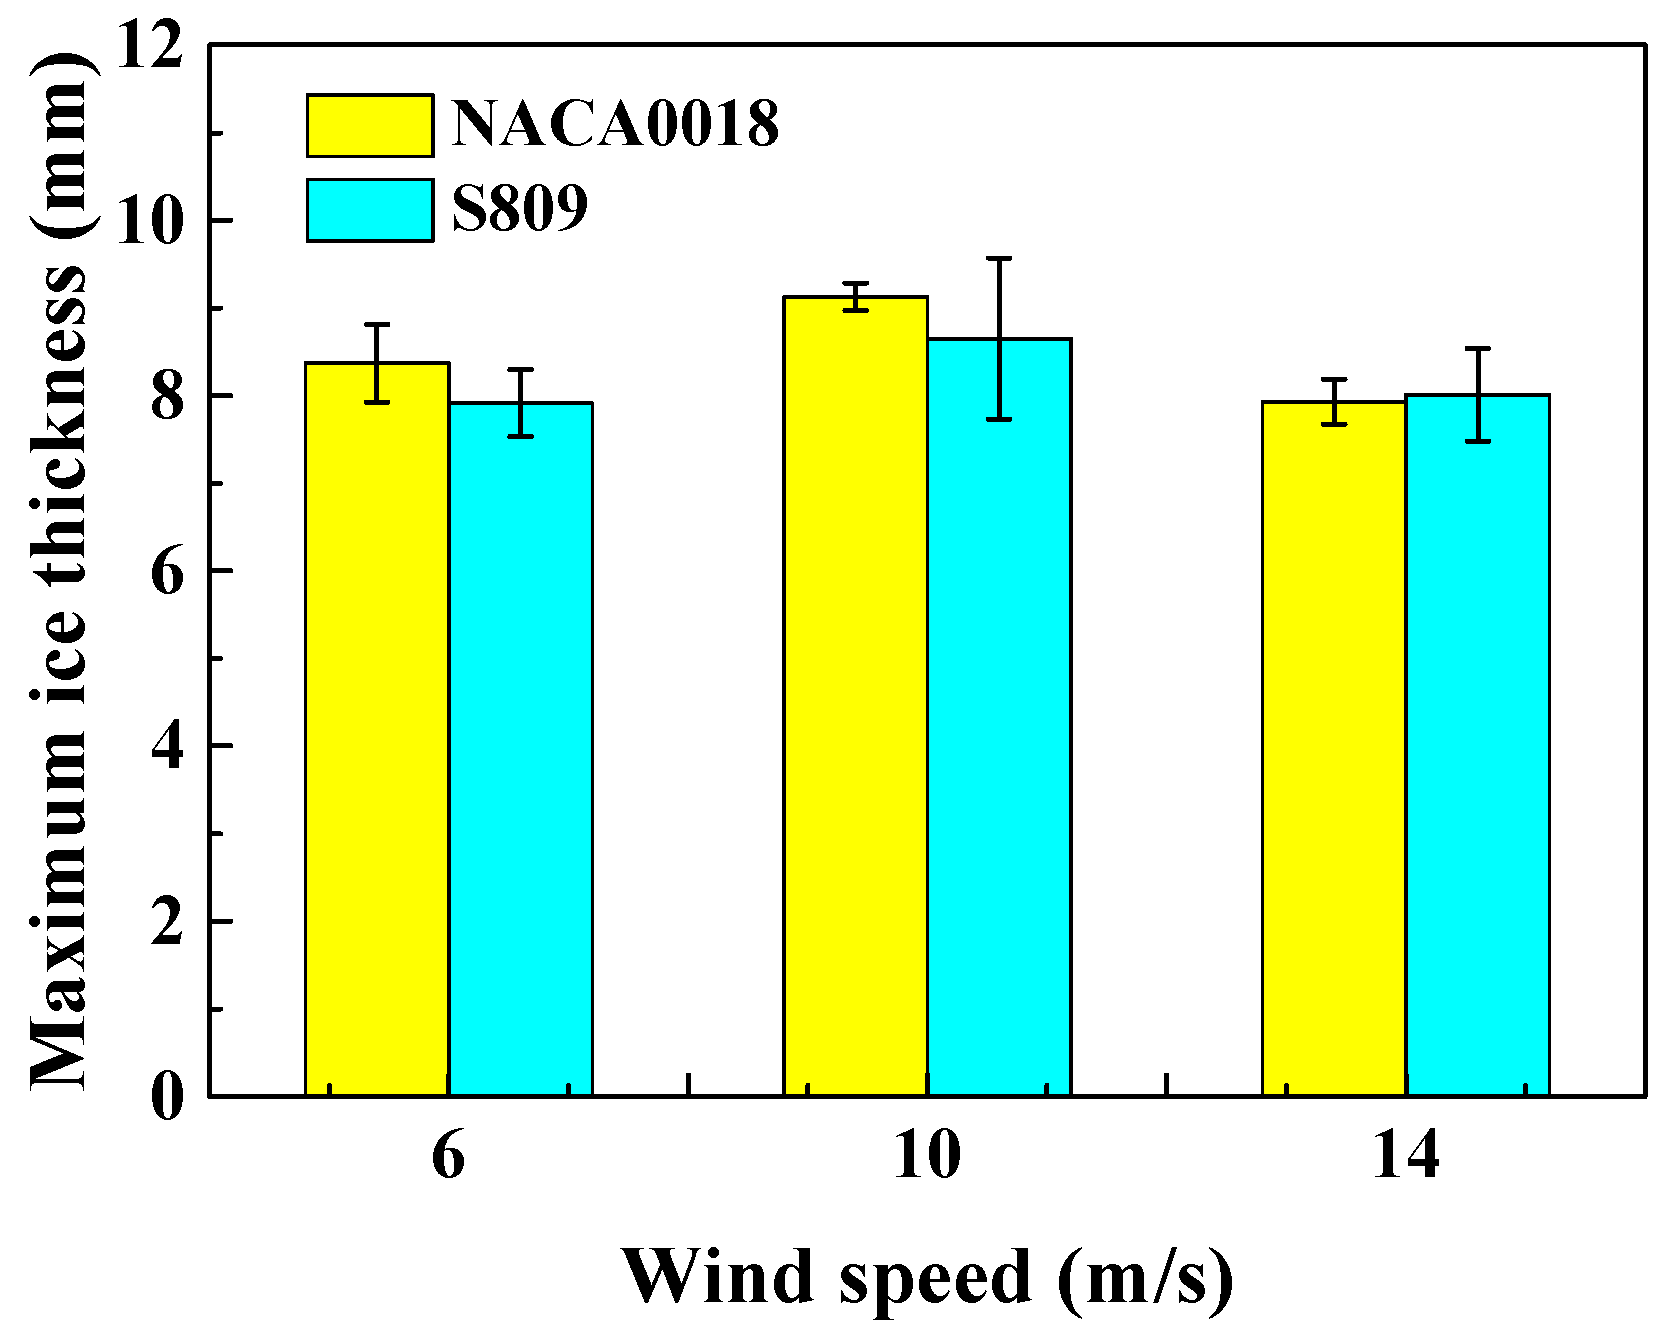
As shown in
Figure 11, the wind speed and the airfoil profile had an effect on the maximum thicknesses of the ice formed. With the increase in wind speed, the maximum ice thickness first increased and then decreased for both airfoils. As discussed previously, at low wind speeds, such as 6 m/s and 10 m/s, the speed of the water droplets increased with the wind speed, causing more droplets to make contact with the airfoil’s surface. The rate of convective heat transfer between the water droplet and the airflow also increased with time, which led to a proportional increase in the maximum ice thicknesses measured. However, at high wind speeds, such as 14 m/s, some small water droplets in the airflow are blown away without colliding with the airfoil surface. Additionally, some water droplets freeze before hitting the airfoil surface because of the increase in the convective heat transfer at high wind speeds, leading to a decrease in the thickness of the ice that formed.
Moreover, as shown in
Figure 11, at low wind speeds, the maximum thickness of the ice formed on the NACA0018 airfoil was a little larger than that on the S809 airfoil. On the contrary, at a higher wind speed, the maximum thickness of the ice on the NACA0018 airfoil was a little smaller than that on the S809 airfoil, which shows that the airfoil’s profile had a minor effect on the maximum thickness of the ice formed. However, our previous analyses showed that the iced area of the S809 airfoil was obviously larger than that of the NACA0018 airfoil. This means that the distributions of ice thicknesses along the surfaces of two airfoils were significantly different. In order to analyze these distributions quantitatively, the variations in the thickness of the ice formed on the airfoil surfaces were acquired from the image processing results and are shown in
Figure 12.
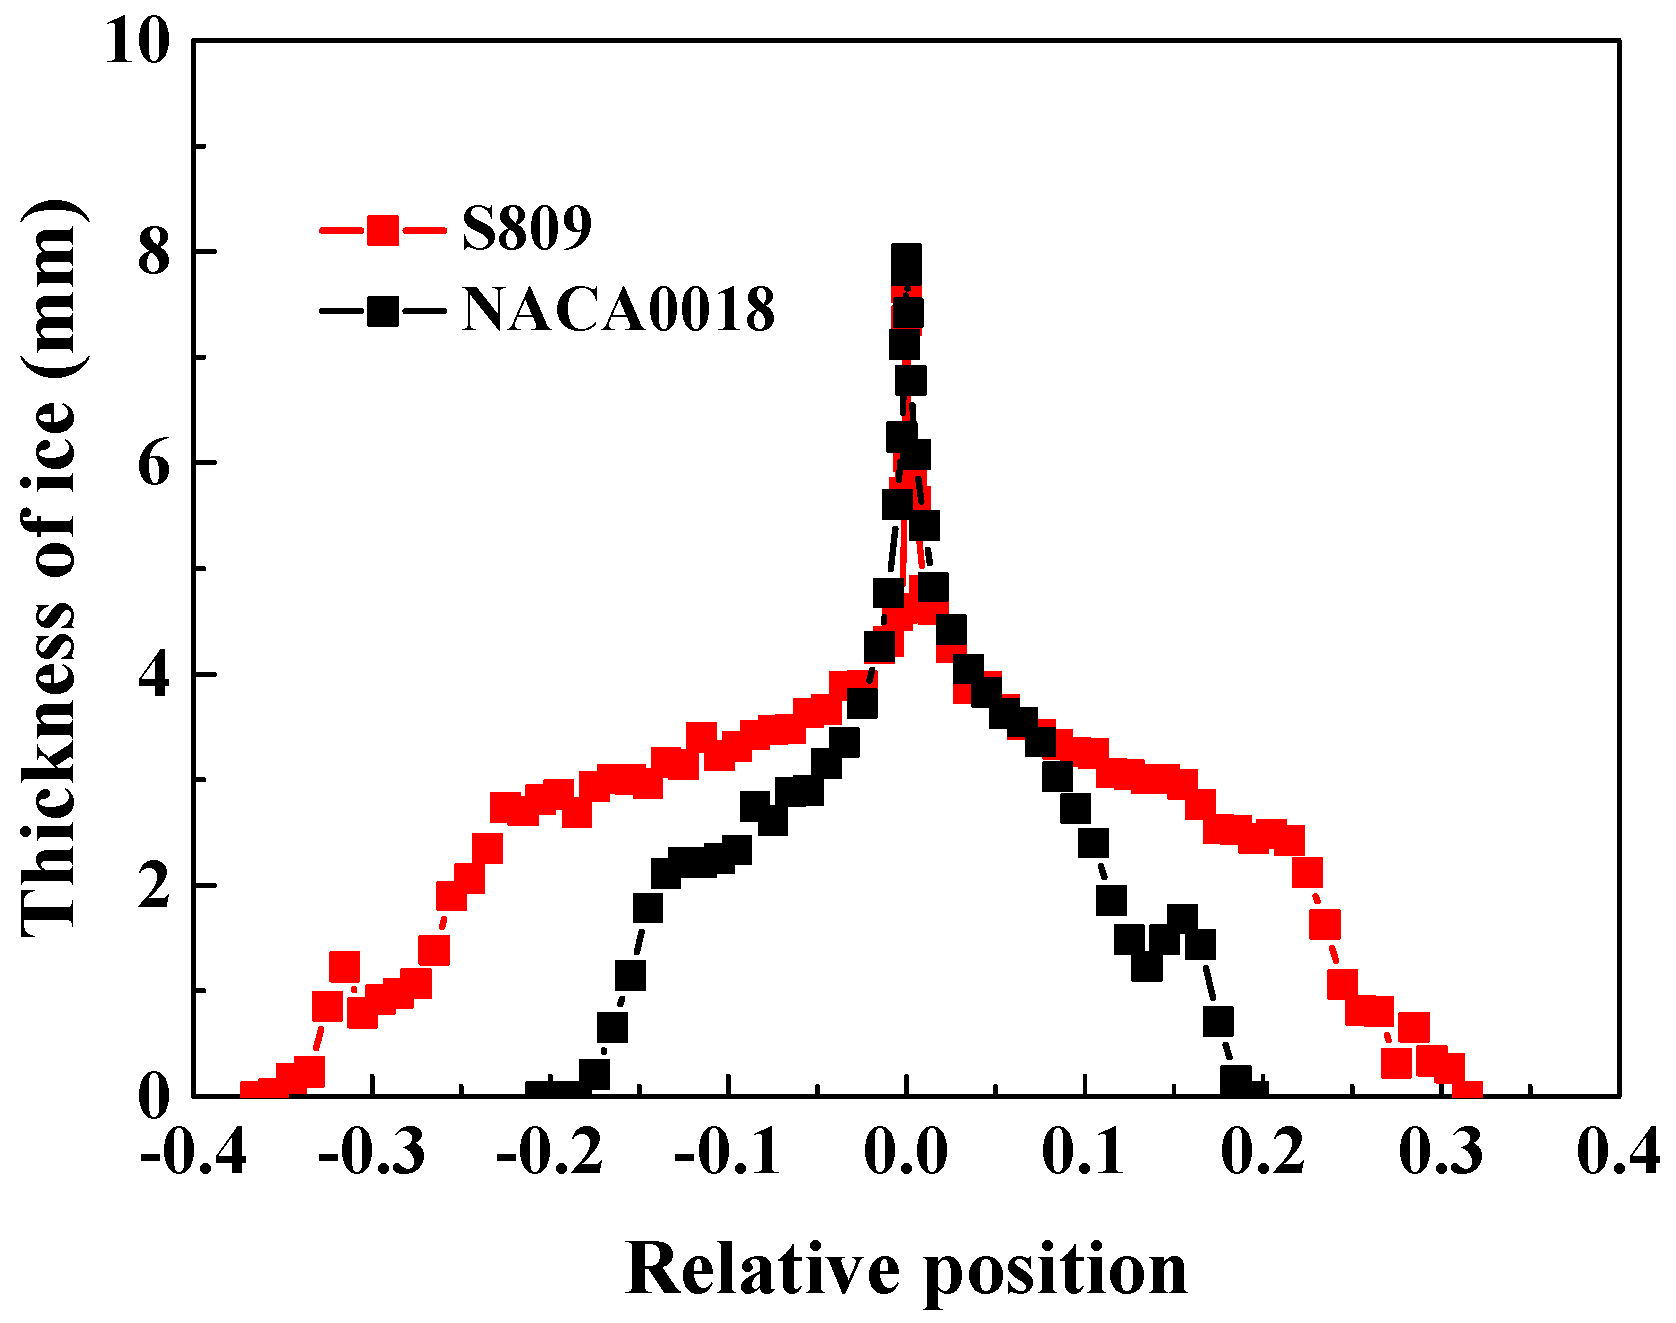
Figure 12 reveals that significant differences exist in the thickness and the range of the ice formed on the NACA0018 and S809 airfoils. The maximum thicknesses of the ice were approximate and located near the front of the leading edge for both types of airfoils. For the NACA0018 airfoil, the range of ice thicknesses seen along the chord was about −0.2~0.2, which accounted for 20% of the chord, with the thicknesses of the ice formed on the upper and lower surfaces being approximately the same. In contrast, the range of ice thicknesses seen on the S809 airfoil was about −0.37~0.31, which was larger than that of the NACA0018. Additionally, the upper surface of the blade was noticeably less covered than the lower surface. The thicknesses of the ice formed near the leading edges of the two airfoils were similar, within a range of −0.025~0.065. Further along their profile, the thickness of the ice on the NACA0018 airfoil gradually became lower than that on the S809 airfoil.
To explore the distributions of the ice across both types of airfoils, the pressure fields on the airfoil’s surfaces were analyzed using FLUENT and are shown in
Figure 13.
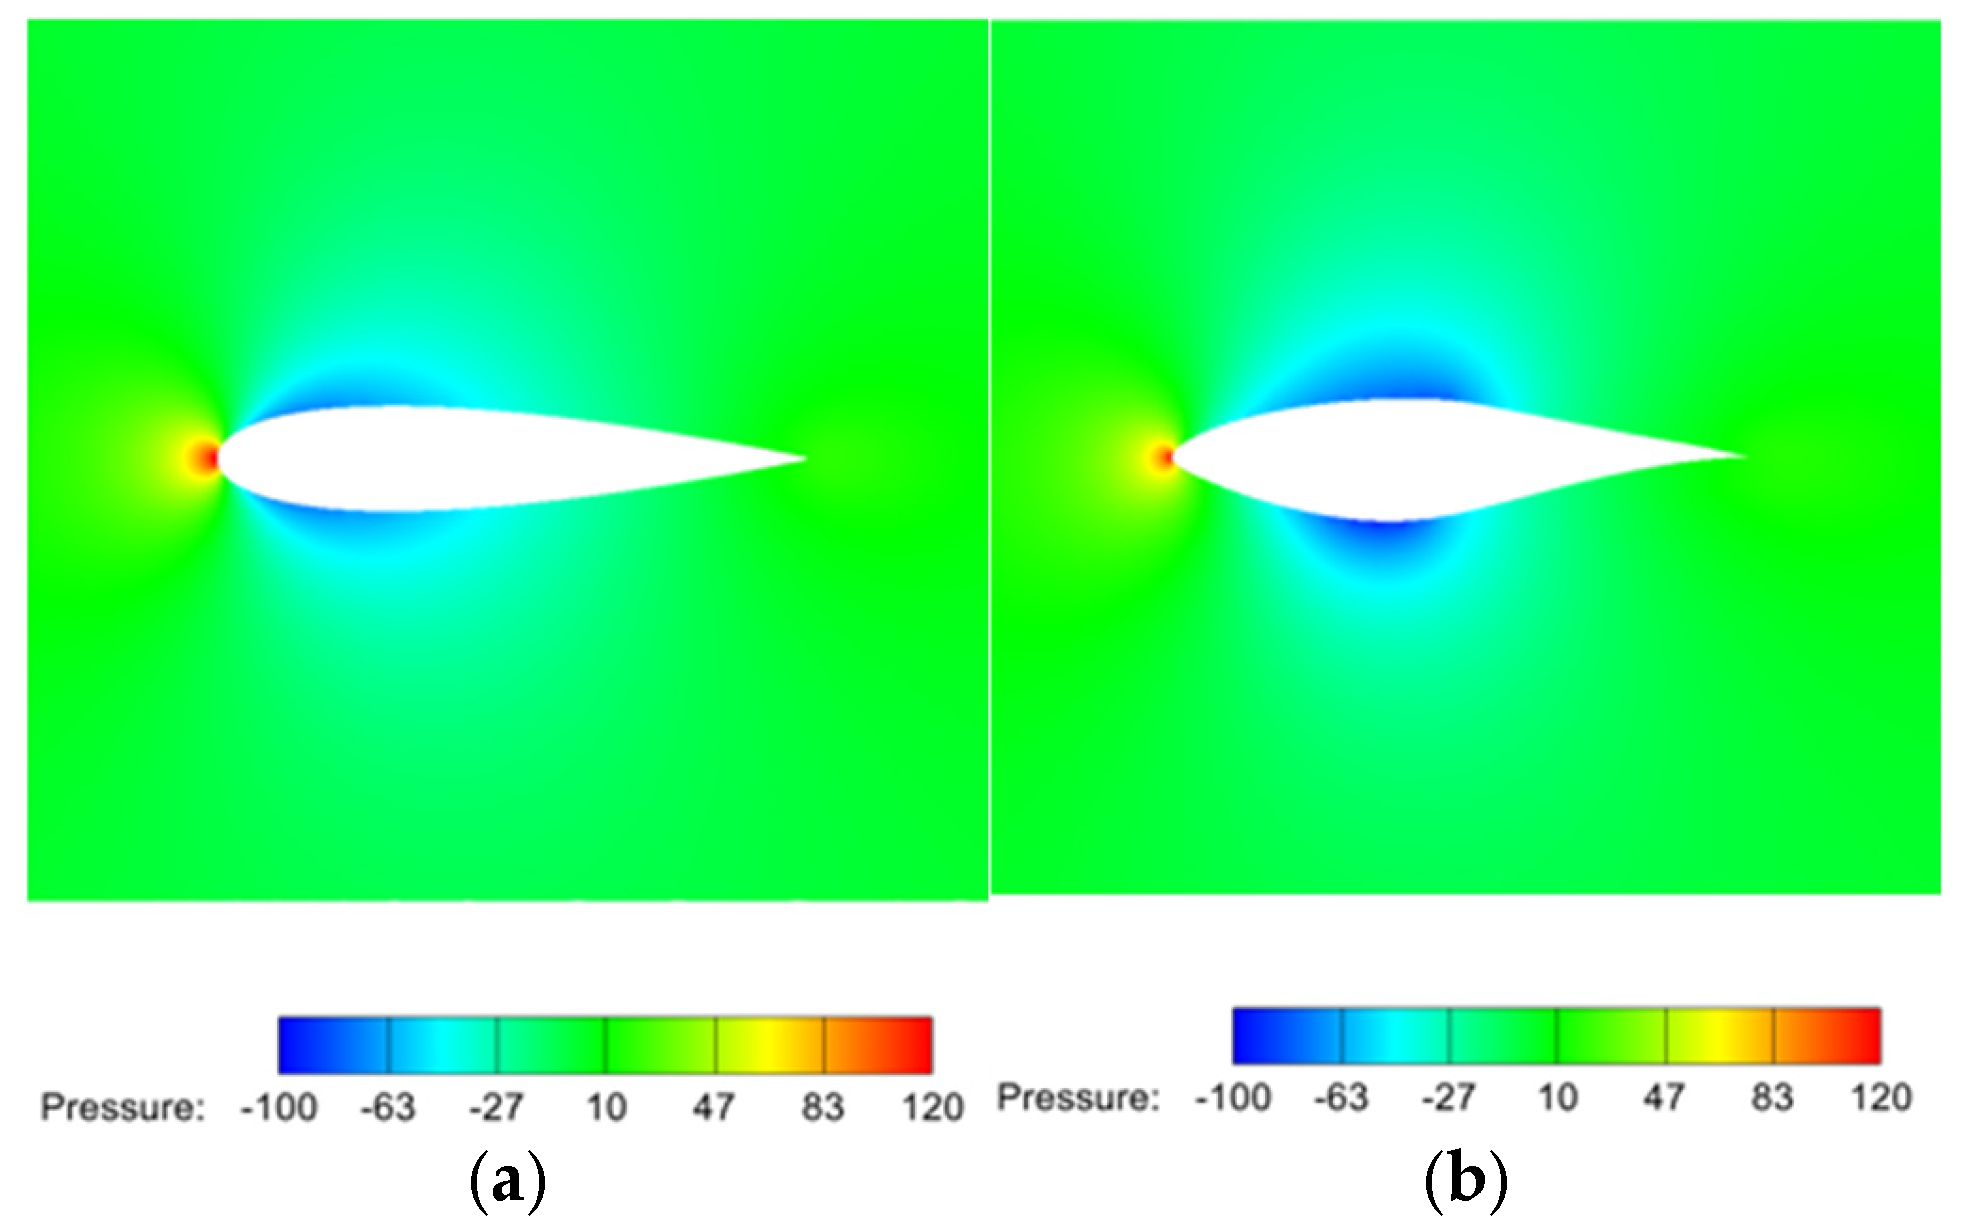
Figure 13 shows the distribution of the pressure fields along the airfoil surfaces at a wind speed of 14 m/s and an attack angle of 0°. The pressure on both airfoils was far higher at their leading edges than in other areas. More water droplets hit the tip of the leading edge due to this high pressure, making the ice in this area thicker than that in other areas. The area of the NACA0018 airfoil experiencing high pressure is larger than that of the S809 airfoil, which is why the thickness of the ice at the tip of its leading edge is larger than that of the S809 airfoil.
After the water droplets hit and are frozen to the tip of the leading edge, surplus water droplets flow along the airfoil surface with the air and freeze gradually. As shown in
Figure 13, three pressure fields are created by this flow of air. At the leading edge and trailing edge, the pressure is positive, while a negative-pressure area is seen in the middle of the airfoil segments. In the area around the leading edge where positive pressure occurred, the velocity of the air increased gradually, and the water droplets made contact with the airfoil surface because of the high curvature of the airfoil. This was the primary region in which airfoil icing occurred, and the ice that formed was thick. With the increase in the velocity of the air, the pressure in the middle of the airfoil profile decreased. Although the intensity with which the water droplets attached to the airfoil weakened, the negative pressure made the water droplets move to the airfoil surface. After that, with the flow of air towards the tailing edge, the pressure increased again. Based on the above analysis, it can be concluded that the distribution of pressure has a significant effect on the distribution of ice.
As shown in
Figure 13, the distance between the negative-pressure region and the tip of the leading edge is larger for the S809 airfoil than for the NACA0018 airfoil. This is because the leading edge of the NACA0018 airfoil is more curved than that of the S809 airfoil. This leads to an increase in the velocity of air and a decrease in the pressure at the airfoil’s leading edge, which causes a negative-pressure region to emerge nearer the leading edge. As discussed previously, in positive-pressure areas, the icing events that happen rely on water droplets hitting the airfoil surface under the action of positive pressure. This is the key factor of affecting ice generation and the reason why icing events mainly happen at the leading edge. The S809 airfoil has a larger positive-pressure region at its leading edge than the NACA0018 airfoil, which resulted in a larger amount of ice being formed at its leading edge. Additionally, regions with negative pressure have the ability to adsorb water droplets onto the airfoil surface, leading to further ice generation. The negative pressure region of the S809 airfoil was farther from the tip of its leading edge than that of the NACA0018 airfoil, which resulted in an increase in the range of icing seen on the S809 airfoil. Further, for the NACA0018 airfoil, the range over which ice formed on the upper blade surface and lower blade surface were approximately the same. However, for the S809 airfoil, the range over which ice formed on the lower blade surface was larger than the range over which ice was seen on the upper blade surface. When examining the distributions of the pressure along the surfaces of both airfoils, it was concluded that the NACA0018 airfoil had a symmetric profile at an attack angle of 0°, which generated a symmetric distribution of the pressure field along its chords. In contrast, the asymmetric profile of the S809 airfoil led to an asymmetric pressure field. On the lower blade surface, the negative-pressure region was farther from the leading edge than it was on the upper blade surface. Therefore, the range over which ice was formed was larger on the lower blade surface than on the upper blade surface.
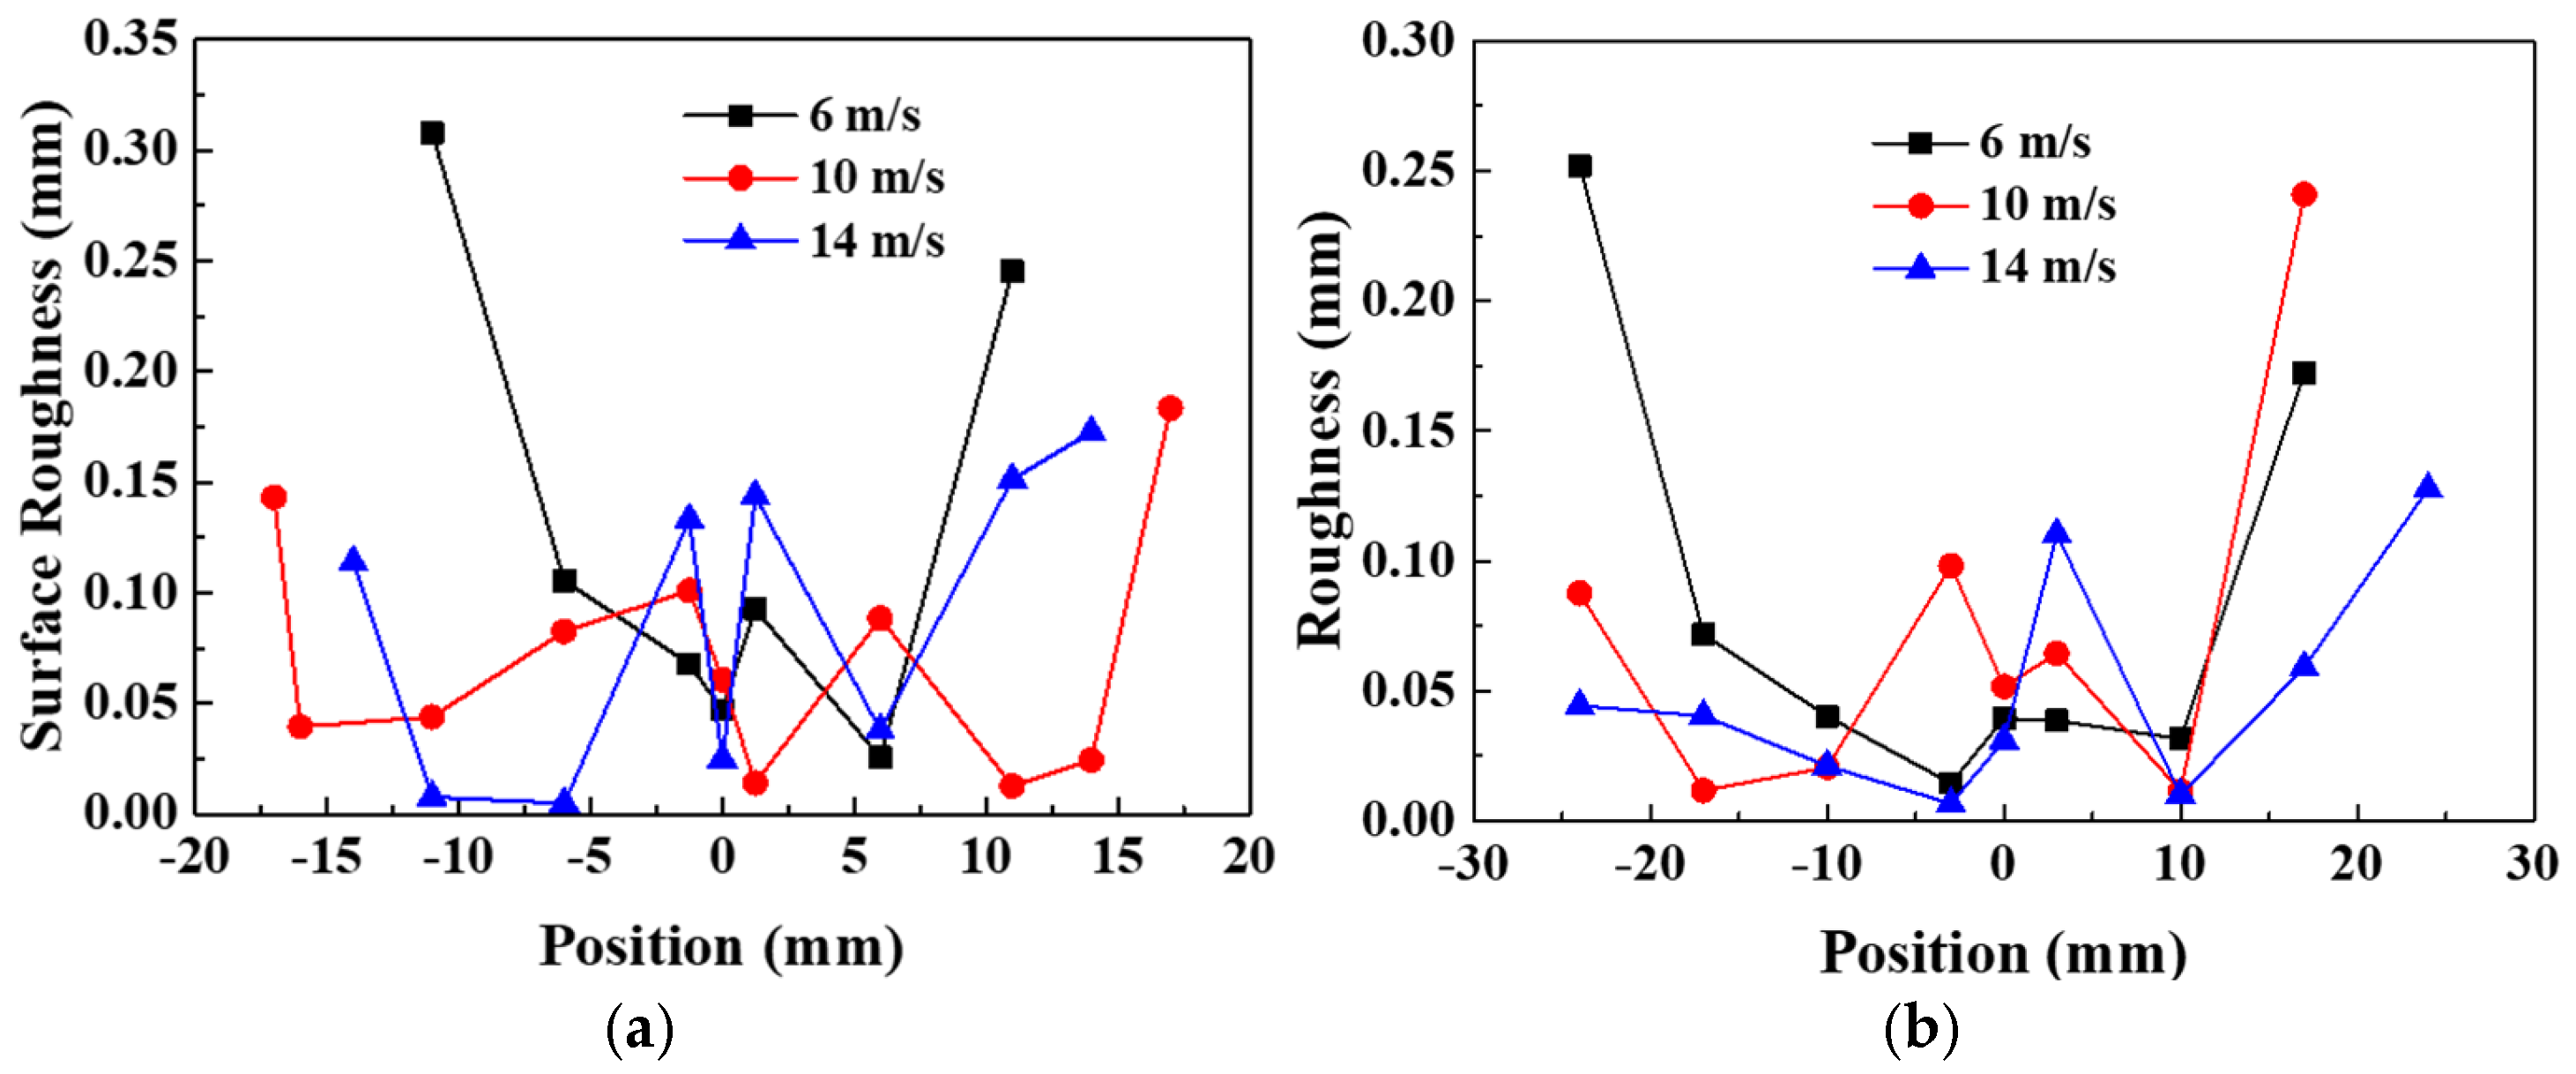
Based on our exploration of the distribution of the thickness of ice formed on airfoils, we were able to calculate the variation in surface morphology using Equation (3). The results of these calculations are shown in
Figure 14.
In
Figure 14, the abscissa expresses the position along the airfoil chord, from the leading edge to the tailing edge, at which the measurement was taken. The positive and negative values refer to the upper and lower surfaces of the iced airfoil, respectively. This figure shows that the surface morphology of both types of airfoils fluctuated along their surface and then increased, before changing dramatically at the end of the icing field. As discussed in
Section 4.1, the vortex of air at the end of the icing region resulted in this dramatic variation. Additionally, as the wind speed increased, the overall variation decreased. The reason for this was that the water droplets impacting on the airfoil surface became more extended as the wind speed increased, which made the surface smoother.


