1. Introduction
Concrete is the most extensively utilized construction material, prompting a necessity to investigate its mechanical and dynamic properties. Due to its inherently brittle nature, low tensile strength, and low energy absorption capacity, enhancing its properties is of critical importance.
One effective approach to enhancing concrete properties involves coating the aggregate surface. This process enhances various surface attributes of aggregates [
1,
2], including impact value [
3,
4], crushing strength [
5], bond strength [
6,
7,
8], appearance, and more.
Surface coating with geopolymer [
6], polyethylene terephthalate [
8], polymers and epoxy [
9], and other particles is used to improve aggregate properties.
The properties of concrete with coated aggregates can be investigated using experimental studies. However, conducting such studies is often time-consuming and costly. Therefore, numerical simulation can be used in investigating concrete properties, as it can allow users to predict performance characteristics without the need for extensive laboratory work in a short time [
10].
Numerical simulations have become essential tools for examining various concrete properties, such as strength, stiffness, cracking behavior, and damping ratio. Several studies have utilized different simulation modeling tools like VCCTL-v9.5, ATENA v5.3, Abaqus/CAE 6.14-1, and ANSYS 17.0 to investigate these properties.
Numerical simulations have enabled researchers to make notable advancements in studying the damping properties of concrete. However, there are still research gaps, particularly in the effect of coating thickness and aggregate size on the damping behavior of concrete with coated aggregates, which has been rarely addressed in existing numerical studies. Therefore, this research focuses on investigating the effects of coating thickness and aggregate size on the damping properties of concrete with coated aggregates, using epoxy, silicone, and rubber coatings through numerical simulations.
Recent research has focused on improving the mechanical and damping properties of concrete through engineered inclusions, coatings, and modified aggregates. Numerical simulations have been widely used to analyze these effects, particularly through frequency response function (FRF) analysis.
Some findings from the literature that have used both experimental tests and simulation tools to explore the effects of aggregate coatings on concrete properties are summarized below, with a focus on how coating thickness and material type affect the properties of concrete.
For instance, the mechanical and dynamic properties of concrete with epoxy, epoxy sand, and silicone-coated aggregates were experimentally investigated. The results showed that both compressive strength and dynamic modulus of elasticity increased with higher percentages of epoxy-sand-coated aggregate replacement [
11].
D. Darwin and F. O. Slate investigated the effect of coating aggregates with polystyrene on paste–aggregate bond strength. Tests were conducted using various coating layers: eight coats of the 10% solution and three coats of the 5% solution. A notable reduction in compressive shear paste–aggregate bond strength was exhibited. In particular, the thick coating (with eight coats of the 10% solution) led to a reduction in compressive strength compared to concrete specimens with uncoated aggregates [
12]. Moreover, K. Sun et al. [
13] examined the effect of paste thickness on coated aggregates in high-density sulphoaluminate cement concrete. The concrete mixtures contained aggregates coated with three different paste thicknesses. The results indicated that the compressive strength of concrete increased as the paste thickness on the coated aggregates increased.
However, several studies have investigated the properties of concrete with engineered aggregates using simulation tools. For example, the study conducted by M. Ansari et al. [
14] focused on engineered inclusions in concrete and examined the damping ratio of concrete. Concrete beams with stainless steel spherical cores coated with silicone showed improved damping behavior in frequency response function (FRF) simulations using Abaqus compared to the uncoated control beam [
14]. Similarly, polyurea coatings applied to cementitious materials were found to enhance structural performance in Abaqus finite element models, increasing flexural capacity, improving stress–strain responses, and reducing deflections under both static and dynamic loading [
15].
Simulations using Abaqus demonstrated that incorporating stainless steel core inclusions coated with silicone of varying thicknesses into concrete improves its damping performance; specifically, coatings of 7 mm and 11 mm increased the damping ratio by 28% and 37%, respectively, compared to uncoated samples [
14]. Similarly, ANSYS-based numerical models analyzed the impact of different coating materials, such as silicone, natural rubber, and nylon, on concrete containing randomly distributed aggregates up to 24 mm in size. The results showed a clear improvement in damping behavior, with the highest damping ratio observed for a rubber coating with a 1.0 mm thickness [
16].
Other research has explored more complex engineered aggregates in meta-concrete systems. A study using LS-DYNA modeled concrete with magnetite core aggregates, soft polyurethane coatings, and additional enhanced coatings made from epoxy resin, steel, or ultra-high-performance concrete (UHPC). These 3D mesoscale simulations revealed that the inclusion of an enhanced outer layer slightly altered the material’s frequency bandgap and reduced its energy absorption capacity. However, UHPC layers significantly improved the spall strength of meta-concrete, suggesting its effectiveness for enhancing structural performance in addition to damping [
17].
Additionally, the research conducted by [
13,
18] investigated the effect of coating thickness on coated aggregates on the properties of concrete. The results indicated that the compressive strength of concrete increased with the increase in the coating thickness on the coated aggregates. Using a thicker coating thickness, the strength of the interface between the paste and coarse aggregate was increased and, together with the rising volumetric porosity, caused the porous ecological concrete strength to increase. On the other hand, the porous ecological concrete with a thinner coating thickness possessed better pore structure features.
S.J. Mitchell [
19] examined metaconcrete with coated lead core aggregates, using Abaqus simulations for modal analysis. The study demonstrated that metaconcrete with coated lead core aggregates with coating thickness varying between 1.0 mm and 3.0 mm outperformed conventional concrete under dynamic loading, highlighting the potential benefits of coated aggregates in improving damping performance. Similarly, Cheng Xu et al. [
20] focused on the dynamic response and damping properties of metaconcrete with rubber-coated steel balls, varying in size from 15 mm to 22 mm, each coated with rubber with 1.2 mm and 1.5 mm thicknesses. Their findings showed that rubber-coated aggregates provided a higher damping ratio compared to plain mortar, with increasing rubber volume fractions further enhancing the damping properties. Notably, the damping ratio was most significantly improved when the volume fraction of rubber-coated aggregates increased from 9.2% to 22.9% [
20].
Aggregate characteristics have also been studied, and the findings indicate that increasing the maximum size of coarse aggregates does not necessarily lead to improved compressive or flexural strength, as demonstrated by tests on a range of aggregate sizes from 3/8 to 2½ inches [
21]. Moreover, the effects of specimen size and aggregate size on the concrete properties of Rock-Filled Concrete (RFC) have been investigated using numerical analysis and experimental works using spherical aggregate shape. Results showed that large-sized aggregates have poor overall deformation coordination ability. Experimental results also showed that the compressive strength of the RFC with an aggregate size 150 mm was found to be higher than that of 75 mm and 50 mm [
22].
Previous studies have primarily focused on the effects of coating thickness on concrete properties, such as damping ratio, compressive strength, and tensile strength under various loading conditions. However, this study investigates the effects of varying both aggregate size and coating thickness on the damping behavior of concrete through modal analyses using Abaqus/CAE 6.14-1 simulation software.
2. Modeling Concrete Specimen
To analyze concrete properties with coated aggregates using a 2D beam model in Abaqus, the process starts by generating three distinct components by developing a script using the Python 3.12.4 programming language: a rectangular part, non-overlapping elliptical parts representing coarse aggregates, and concentric elliptical ring parts representing coating materials, which vary in size based on desired fractions. These components are randomly generated and utilized to simulate the behavior of the beam in 2D simulations. Additionally, the thickness of the coating material (thickness of the elliptical ring) is adjusted as required for the analysis.
2.1. Materials (Aggregate Size and Coating Thickness)
In this study, coating materials (epoxy, silicone, and rubber) with a coating thickness of 0.4 mm and randomly distributed aggregates with two groups, varying in size from 8.0 mm to 25.0 mm and from 8.0 mm to 32.0 mm, are used. Moreover, different coating thicknesses ranging from 0.4 mm to 5.0 mm are considered.
2.2. Aggregate Size Distribution
For most concrete, the coarse aggregate represents about 40% to 50% of the concrete volume [
23,
24]. However, the total volume fraction of the aggregate in a concrete sample can be estimated using the following equation [
24]:
where υ
p is the total aggregate’s volume fraction, w
p is the total weight of aggregate particles in concrete, ρ
p is the specific weight of aggregate particles, and V is the total volume of the concrete specimen.
The Fuller ideal grading curve characterizes how aggregate gradation is distributed within a concrete sample. Utilizing this curve ensures that the concrete mix achieves optimal aggregate compaction and strength [
25]. The Fuller curve is given by the following expression:
where P(d
i) is the cumulative percentage of particles passing the ith sieve, d
i is the opening size of the sieve, d
max is the maximum size of aggregate particles, and
n is the power of Fuller’s curve.
The power of the Fuller’s curve ranges from 0.45 to 0.70 [
24]. However, C. L. Hwang et al. [
26] propose
n values between 0.33 and 0.5 for aggregate gradation. The optimal
n value for concrete is suggested to be 0.5 [
26].
After determining the size distribution of aggregate particles using the Fuller grading curve, the volume fraction of aggregate particles within a specific grading class [d
i+1, d
i] can be computed as follows [
24].
where V
agg[d
i+1, d
i] is the volume fraction of aggregate within the grading class, d
min is the minimum size of coarse aggregate particles, and d
max is the maximum size of coarse aggregate particles.
To implement Fuller’s curve, the aggregates for each group are subdivided into five aggregate classes, as shown in
Table 1 and
Table 2. To calculate the volume fraction within the class, the
n value of the Fuller’s curve is taken to be 0.5 [
26], and the total aggregate volume fraction is calculated using Equation (1) and equals 0.45.
Each aggregate class involves calculating the cumulative percentage of particles passing the ith sieve and the volume fraction of aggregates, which are determined using Equations (2) and (3), respectively. Based on these calculations, the amount of aggregate to be generated within each grading class can then be determined accordingly.
2.3. Generating Random Aggregates
Elliptical aggregates and rings are generated using a loop that continues attempting to create ellipses and elliptical rings until either the desired area of elliptical aggregates is achieved or the maximum number of attempts within the grading class is reached. In this process, a uniform distribution is utilized to randomly generate these elliptical aggregates and concentric elliptical rings within predefined rectangular boundaries.
The rings are determined based on the desired coating fraction. The area of aggregates within the grading class [d
i+1, d
i] can be calculated using the following equation.
where A
agg[d
i+1, d
i] is the area of aggregates within the grading class and A
con is the area of the concrete specimen.
The 2D beam model has dimensions of 500 mm by 100 mm, and the area of aggregates within the grading class is determined using Equation (4).
Table 1 and
Table 2 provide details on the aggregate size distribution, volume, and area fraction within the grading class for coarse aggregates with maximum sizes of 25 mm (Group 1) and 32 mm (Group 2), respectively.
In each attempt to generate an ellipse, randomly selected semi-major and semi-minor axes, along with an arbitrary position (x
i, y
i) within the specified rectangular boundaries, are used. Then, a new randomly generated ellipse is created with its center at (x
i+1, y
i+1). Subsequently, a function is developed using the distance formula to assess whether the new ellipse overlaps with existing ellipses. The distance (d
i) between the centers of the new ellipse c
i+1(x
i+1, y
i+1) and an existing ellipse c
i(x
i, y
i) is calculated as follows:
If the distance d
i between the centers of two ellipses is greater than the sum of their semi-major axes, they do not overlap, allowing for the generation of a new ellipse. This process continues until either the smallest size is generated or the desired volume fraction within the grading class is achieved. The mathematical condition ensuring non-overlapping ellipses is expressed as follows:
where a
i and a
i+1 are the semi-major axes of adjacent ellipses and d
i is the distance between their centers.
In addition to the condition specified in Equation (6), the thickness of the mortar film is crucial in ensuring that each aggregate particle is adequately covered. In their study, Schlangen and Van Mier utilized a minimum gap width of 0.1(d
A + d
B)/2 between adjacent particles, where d
A and d
B represent the sizes of the particles [
27]. Determining the exact minimum thickness of the mortar film is not easy because there is no simple theory available for its evaluation [
23].
During the simulation, along with the mortar film, a portion of the aggregate volume is coated with material having a thickness of
t. Consequently, the minimum gap width between adjacent particles is considered as 0.1(a
i + a
i+1) + 2t, and Equation (7) is used to express this condition mathematically.
where a
i and a
i+1 are the semi-major axes of adjacent ellipses and
t is the coating thickness.
Moreover, a minimum distance of bi between the edge of a particle and the boundary of the concrete specimen is considered, where bi is the semi-minor axis of the particle.
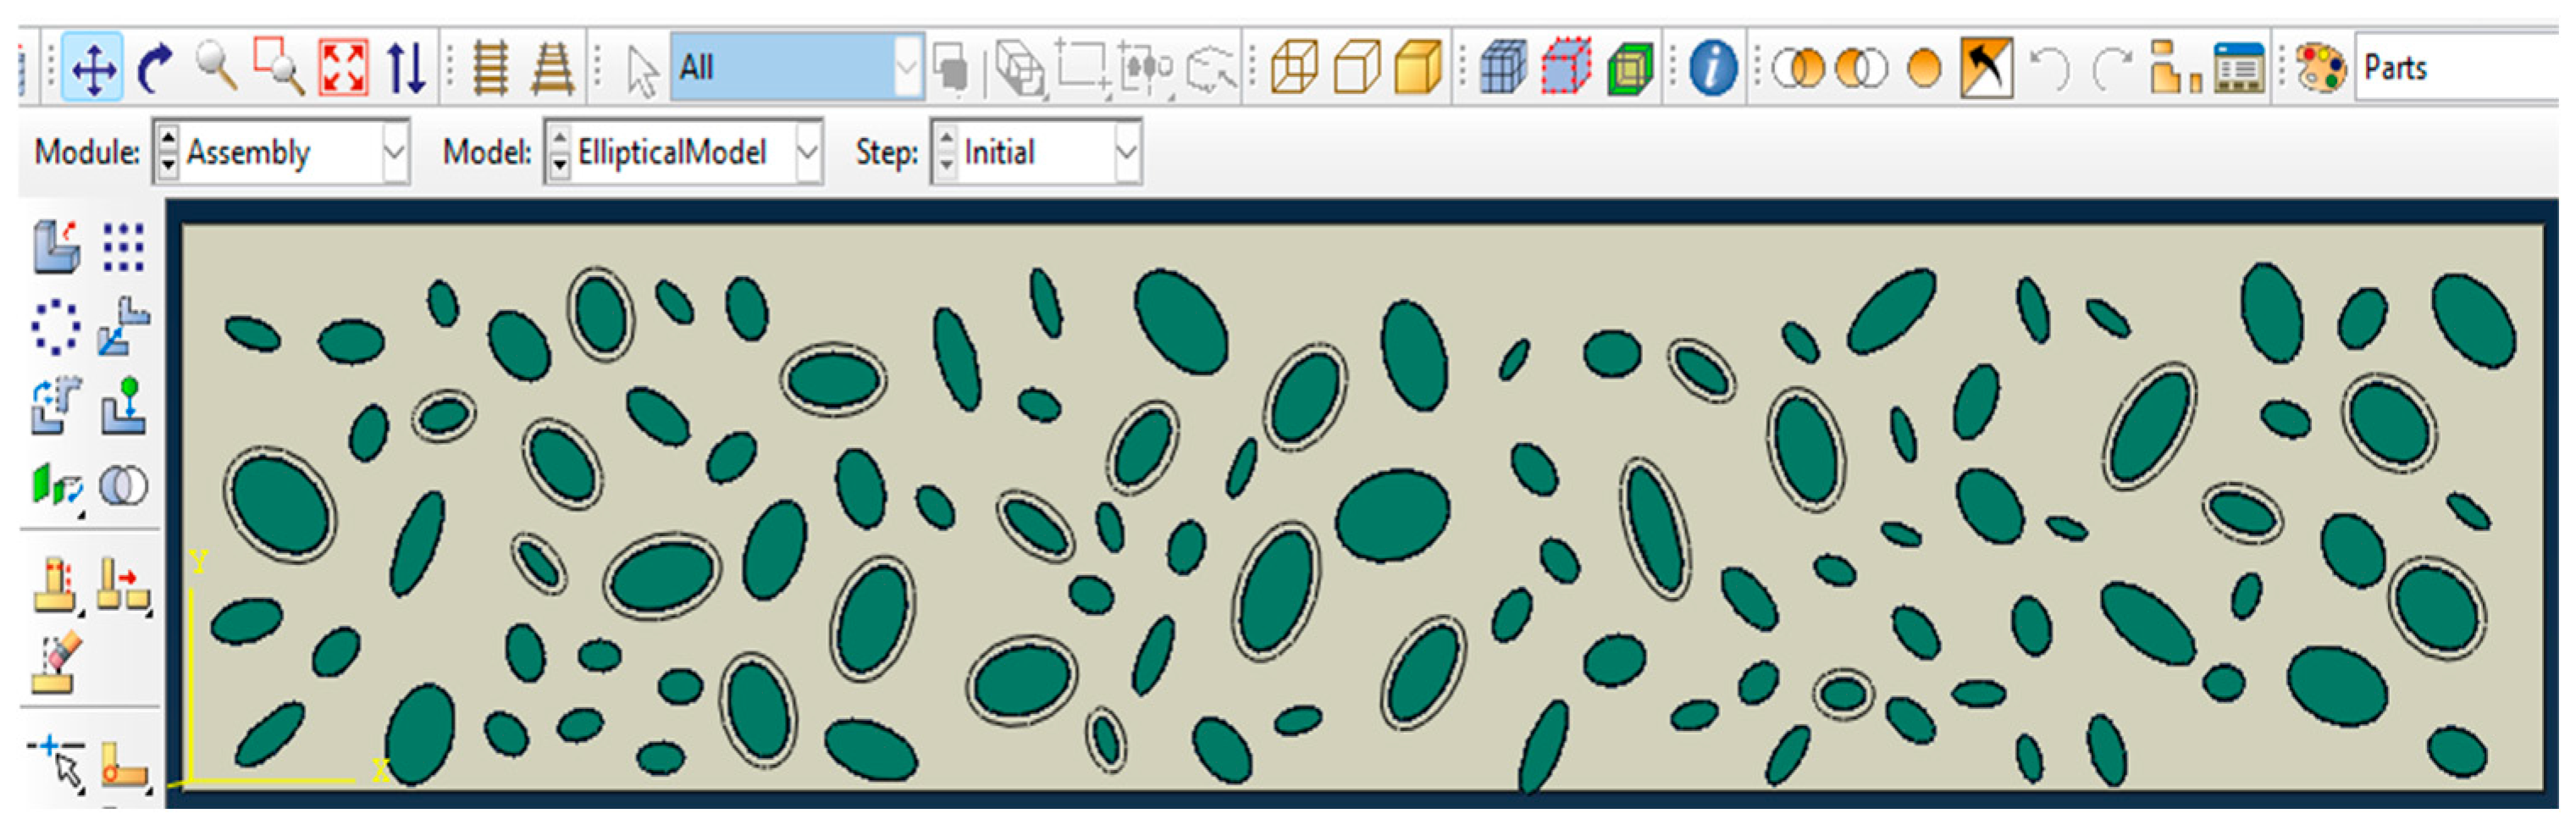
The schematic representation of ellipses and concentric elliptical rings generated within rectangular boundaries is shown in
Figure 1.
2.4. Steps to Generate Random Elliptical Aggregates
The steps for generating random elliptical aggregates and concentric elliptical rings within specified rectangular boundaries are summarized as follows:
Create a rectangular region (2D concrete beam specimen) with specified dimensions.
Generate an ellipse with the randomly selected major and minor axes from a given interval at a random position (xi,yi) within rectangular bounds. In this case, random rotation angles are applied to the ellipses.
Generate a new ellipse and verify whether or not it intersects with the existing ellipses using Equation (7).
Calculate the volume fraction and area of aggregates within each grading class using Equations (3) and (4), respectively.
Continue generating an ellipse until the desired area of aggregates or volume fraction is reached.
Generate randomly distributed concentric elliptical rings with a ring thickness t, where the inner semi-major and semi-minor axes equal to those of the generated ellipse. The elliptical ring thickness t represents the coating layer thickness. Concentric elliptical rings are generated based on the desired fractions relative to the total volume fraction of elliptical aggregates.
At each step, check whether all the conditions are satisfied (such as the area of aggregates, the minimum gap width between adjacent particles, non-overlapping criteria, etc.).
Continue these steps until all ellipses and elliptical rings are successfully generated and placed within the boundaries of the rectangular concrete specimen.
Elliptical aggregates and concentric elliptical rings were generated within a rectangular area measuring 500 mm by 100 mm, using a volume fraction of 45%, and a coating thickness of 0.4 mm.
Figure 2 and
Figure 3 show randomly generated elliptical aggregates and elliptical rings, respectively.
2.5. Notation and Designation
For concrete with partial replacement of coarse aggregate by coated aggregates by epoxy, silicone, and rubber, the designations are as follows: the control mix with uncoated aggregate is designated as CM-0, concrete with epoxy-coated aggregates are designated as ECA-n, silicone-coated aggregates are designated as SiCA-n, and rubber-coated aggregates are designated as RCA-n. The letter n indicates the replacement level (e.g., SiCA-10 represents concrete with a 10% replacement of coarse aggregate by silicone-coated aggregates).
3. Model Simulations
After creating randomly distributed elliptical aggregates and rings (coating layers) within specified rectangular boundaries using a Python script, the subsequent step is to import the script and perform simulations using Abaqus/CAE 6.14-1 software to analyze the concrete damping ratio.
3.1. Material Properties
For an isotropic model, material properties for concrete, aggregates, and coating materials such as density, Young’s modulus, and Poisson’s ratio are defined and assigned in the “Edit Material” option. The properties of the coating materials, cement mortar, and aggregates used in the simulation models are presented in
Table 3.
3.1.1. Assembly of a Model
The three components—the rectangular part, elliptical aggregates, and concentric rings—are autonomous, and each has its own coordinate system within the model. To integrate them into the global coordinate system, the assembly module is employed to instantiate these parts. Each part is meshed separately when it is independent, whereas a dependent part instance is meshed based on the original part’s mesh configuration [
28].
During the assembly process, a geometric intersection condition is applied when creating instances of individual parts. This is achieved by selecting the “Intersection Boundaries Retain” option in the Assembly module. This option ensures that boundaries between parts at intersections are not merged, maintaining separate boundary conditions for each part. As a result, a new part is created and automatically instantiated into the assembly. The assembled part is shown in
Figure 4.
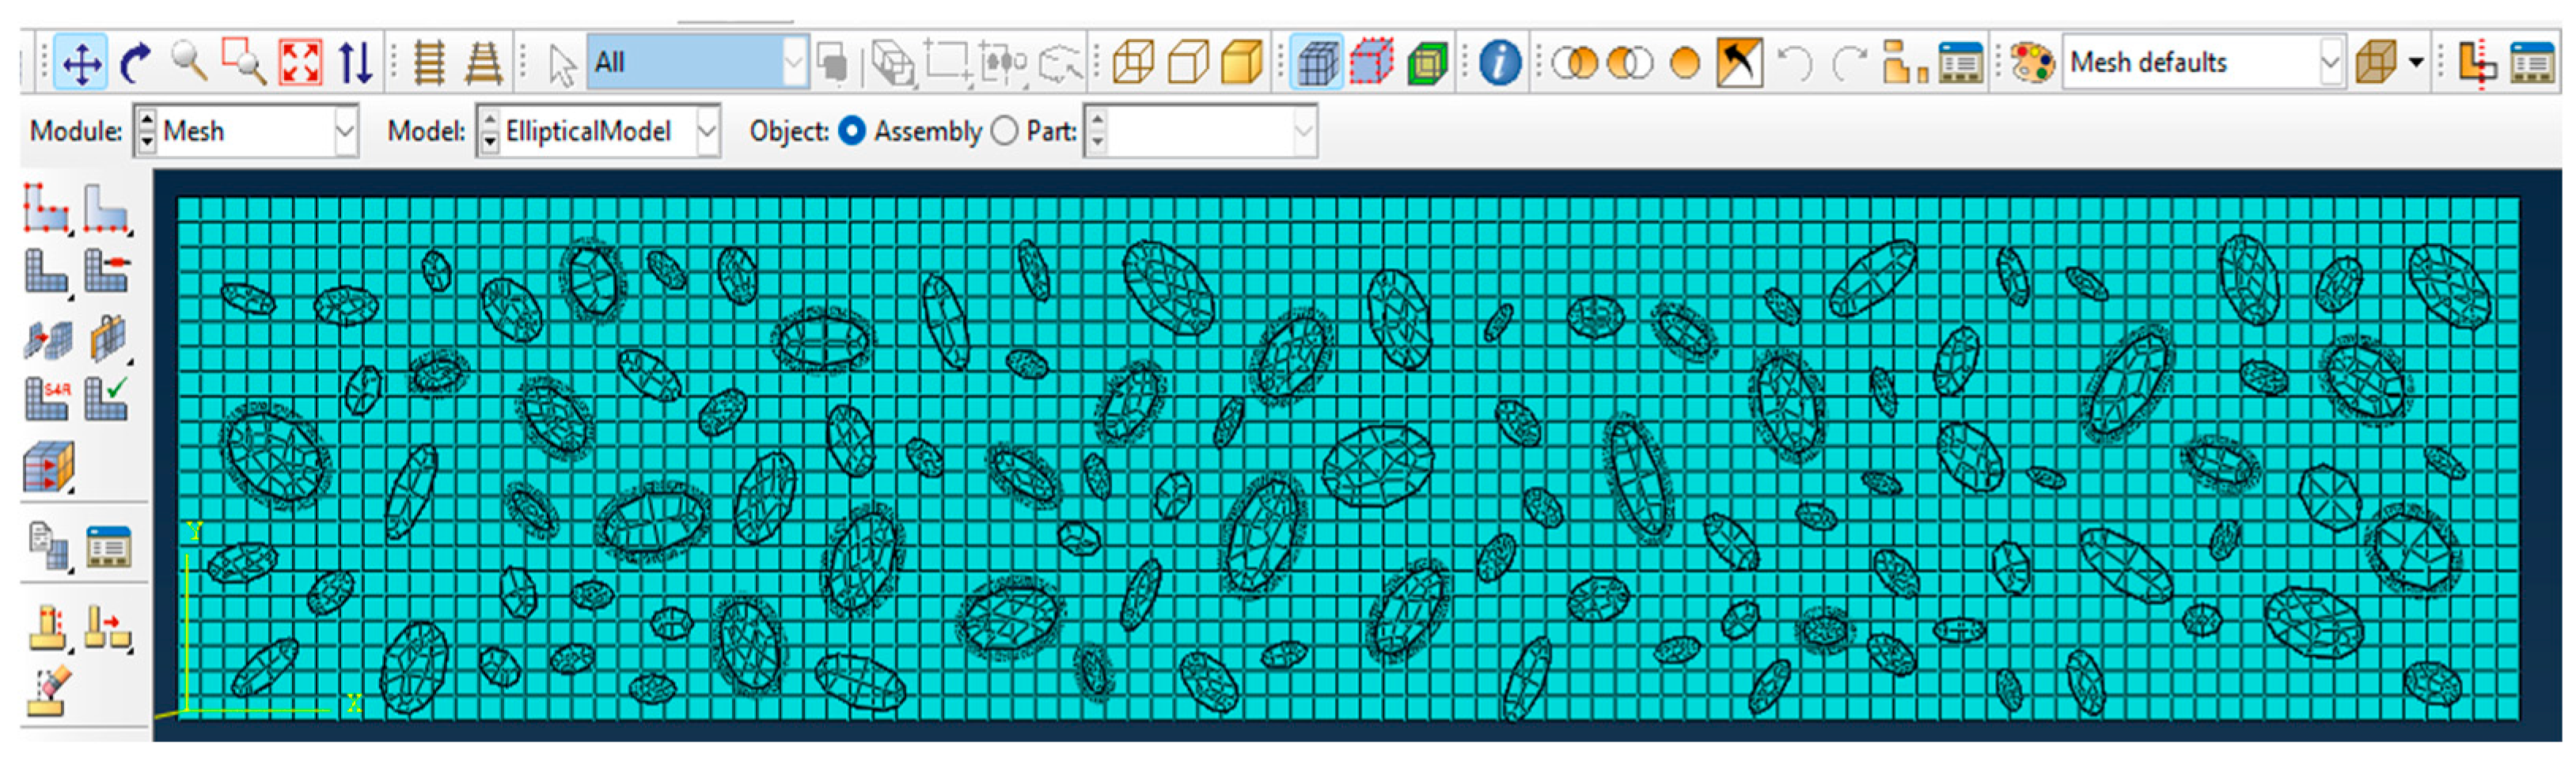
3.1.2. Meshing
In the finite element model, meshing tools are utilized with a global seed size of 10 mm and a free meshing technique employing quadratic tetrahedral element type C3D10 to discretize the model into smaller elements.
Figure 5 depicts the assembled model with tetrahedral elements using free meshing.
The process of meshing ensures that the geometry of the model is accurately represented, enabling the application of boundary conditions and loads. A well-structured mesh is essential for achieving reliable simulation results in Abaqus. To refine and improve the accuracy of the finite element model, a mesh convergence was performed.
3.1.3. Boundary Conditions
To create a numerical model beam, a 2D cantilever beam model was created, and the beam setup is shown in
Figure 6.
3.2. Frequency Response Function (FRF) Analysis
In FRF analysis, two sequential steps are utilized. Initially, a modal analysis is conducted to determine the natural frequencies of the system, employing the eigenfrequency extraction method. Within Abaqus, the “Frequency” type is chosen under the linear perturbation procedure, utilizing the “Lanczos” eigensolver. The Lanczos solver is configured to determine the first ten natural frequencies of the system by setting a value of 10. Following this analysis step, the corresponding mode shapes of the beam are identified.
In the second step of the analysis, the “steady-state dynamic modal” option is selected within the linear perturbation procedure. This step involves specifying the frequency range and the number of points between each mode shape. The lower and upper frequencies are determined based on the results obtained from the modal analysis. Additionally, an eigenfrequency interval is established using a default bias parameter of 3.0.
Furthermore, a harmonic point load with an amplitude of 1N is applied at the free end of the cantilever beam. The model’s response to this harmonic excitation within the specified frequency range is then examined.
Due to the random nature of generating ellipses and concentric elliptical rings, each configuration involved generating these components ten times with specific volume fractions. Following this, FRF analysis was conducted for each configuration, and the frequency responses were analyzed to determine the damping ratio of the concrete.
3.3. Validation of Numerical Simulation
The simulation model was calibrated using experimental results obtained from tests conducted as part of this study. Specifically, damping ratios measured from impact testing of concrete specimens with coated aggregates were used to validate the numerical model. The material properties (e.g., modulus of elasticity and density) used in Abaqus were adjusted to match the experimental response, particularly focusing on the frequency response and damping behavior.
To validate the accuracy of the numerical simulations, an experimental test was conducted at Addis Ababa University (AAU)—College of Technology and Built Environment (CTBE), School of Civil and Environmental Engineering, Materials Testing Laboratory. In both the experimental and numerical simulations, a similar aggregate size distribution and grading class were used to strengthen the reliability of the comparison between the two approaches. Damping ratios obtained from the simulation were then compared with those obtained from the physical tests. The comparison between the simulation results and the corresponding test results is presented in
Table 4.
As shown in
Table 4, the damping ratios of concrete with epoxy-, silicone-, and rubber-coated aggregates exhibit a variation margin ranging from 2% to 4% between the simulated and experimental values.
This margin can be considered good for numerical simulations of concrete with different coatings. This level of accuracy indicates that the simulation results closely align with the experimental data, suggesting that the simulation model is reliable for predicting the damping ratio under these conditions.
4. Results and Discussion
While this study employs a 2D finite element model to investigate the damping behavior of concrete with coated aggregates, this approach inherently simplifies the 3D nature of concrete and assumes perfect bonding at material interfaces. These assumptions may lead to deviations in predicted damping responses, particularly where out-of-plane stresses or imperfect bond conditions are significant. Future studies are encouraged to adopt 3D modeling approaches and incorporate realistic interfacial properties to improve the accuracy and applicability of the findings.
Despite these limitations, the numerical simulation provides valuable insights into the behavior of a structure under various conditions, such as stress distributions, nodal displacements, natural frequencies, mode shapes, and more.
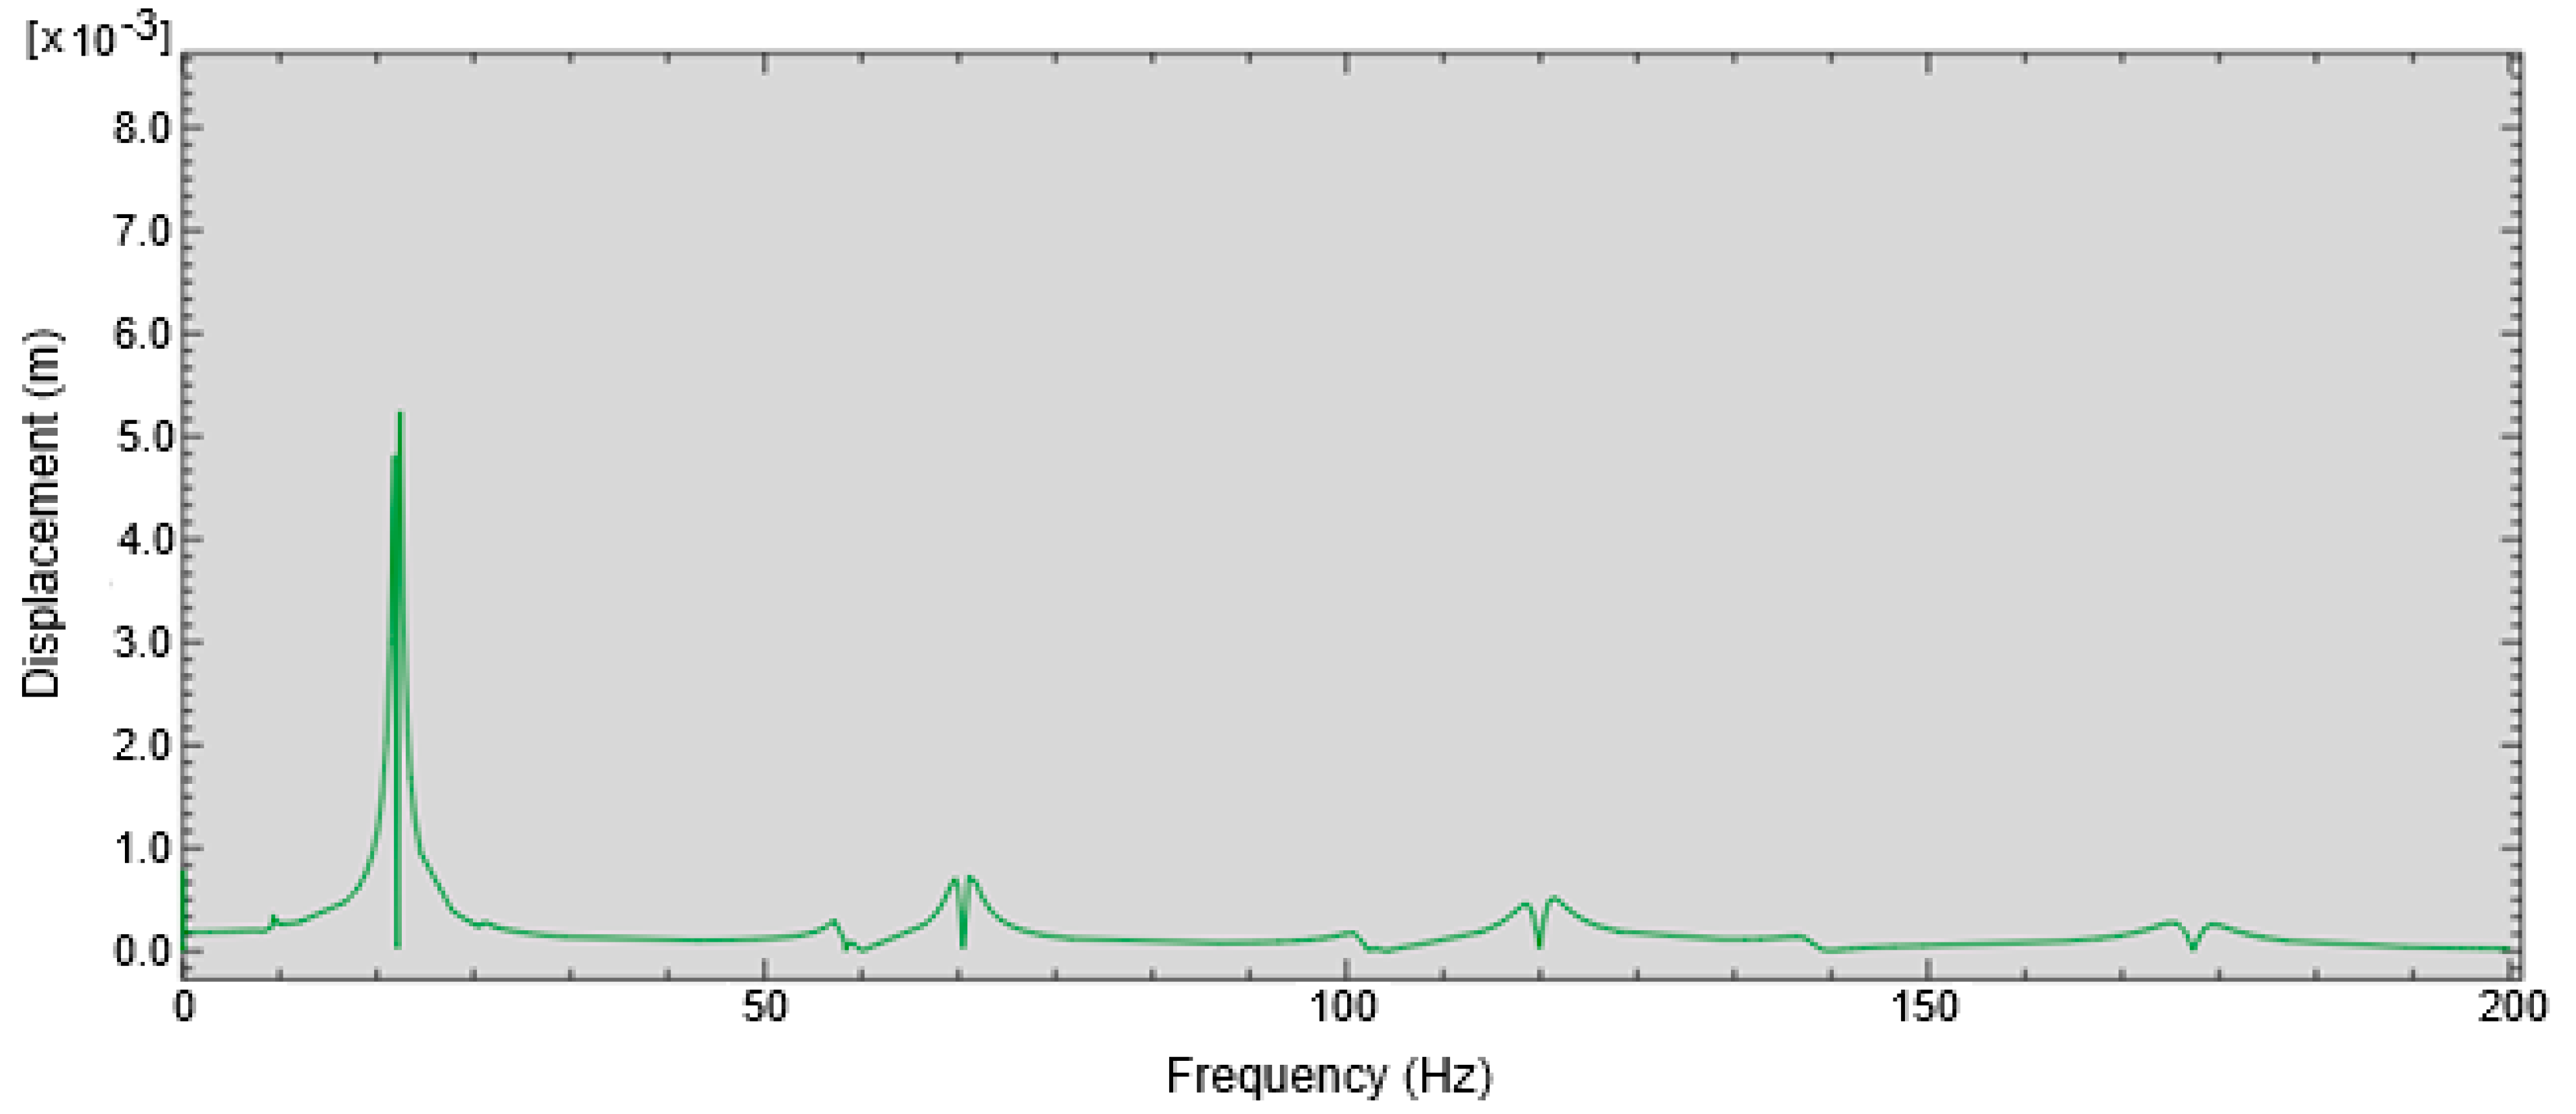
Furthermore, the frequency response through FRF analysis for concrete specimens with coated aggregates at different volume fractions of coating materials was determined. A sample frequency response for RCA-20 from group 1 concrete specimens is presented in
Figure 7.
4.1. Determination of Damping Ratio
Once the frequency response is obtained from FRF analysis, the damping ratio is calculated using the ASTM standard, specifically the half-power bandwidth method, and given by the following expression [
29].
where ξ is the damping ratio, f
o is the resonance frequency, and f
1 and f
2 are the frequencies at the half-power amplitude Y
max/
.
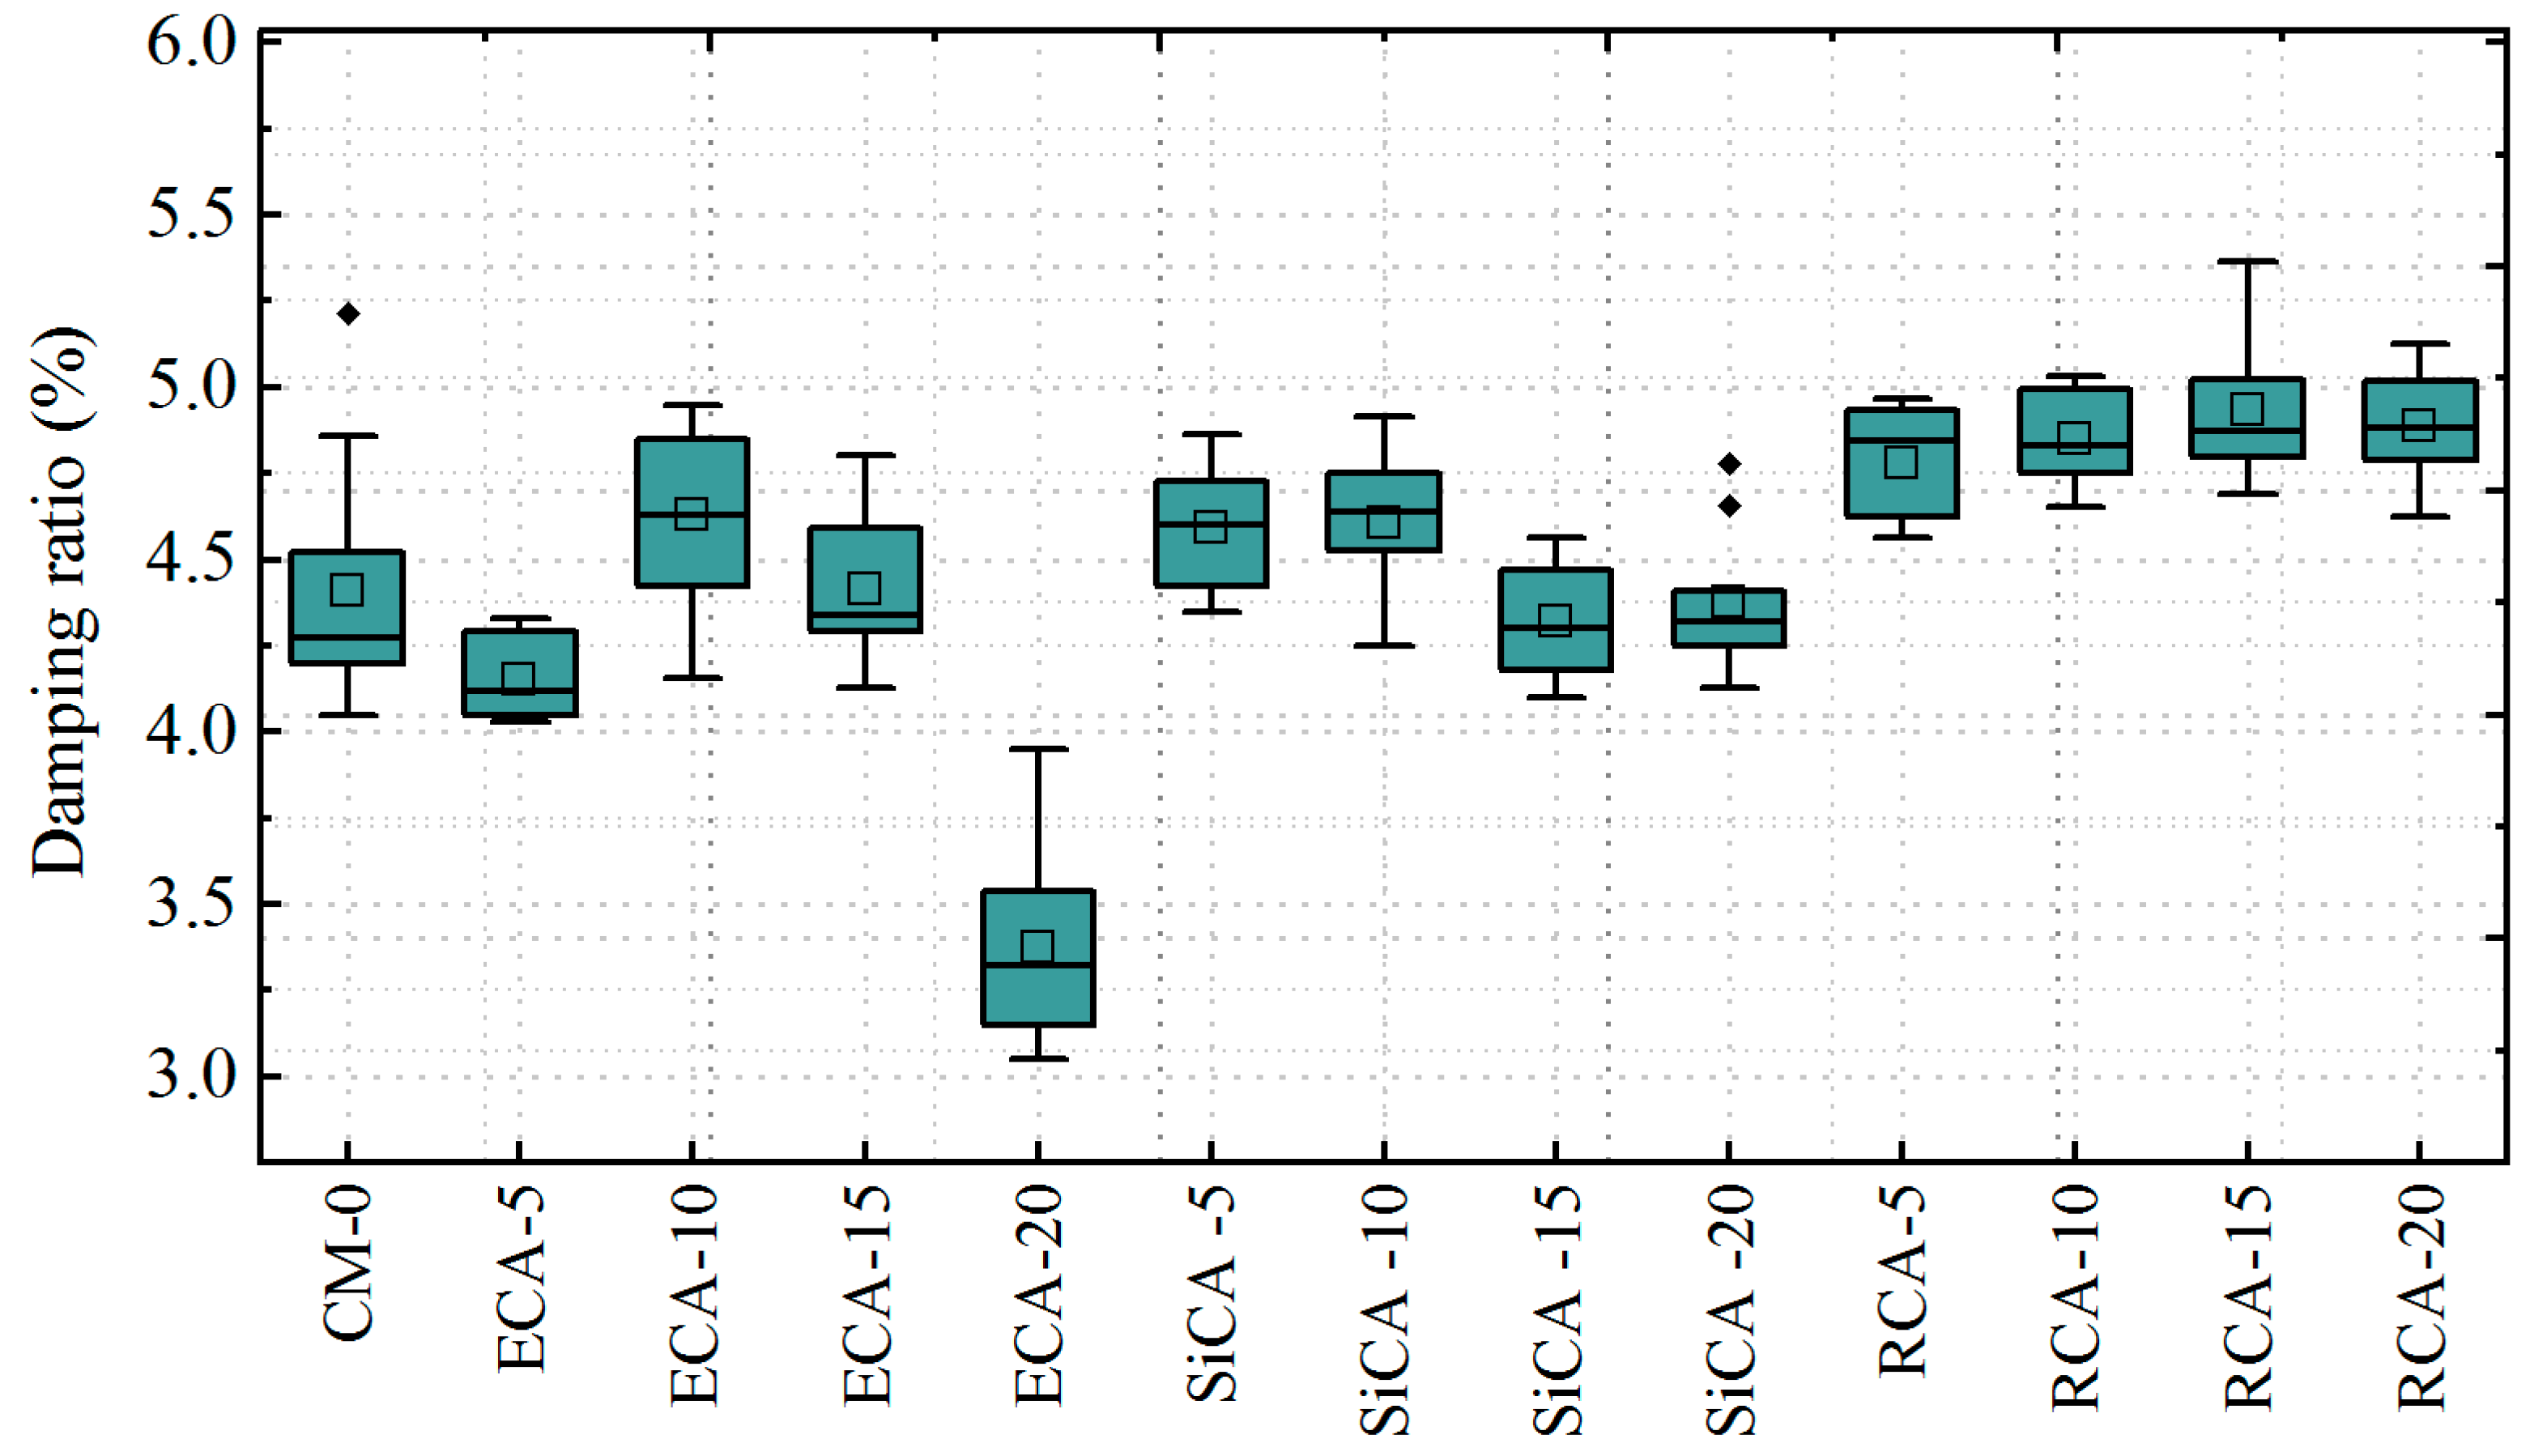
The resulting damping ratio of concrete with epoxy-, silicone-, and rubber-coated aggregates with a 0.4 mm coating thickness, obtained from numerical simulations repeated ten times for each configuration, are displayed in the boxplots shown in
Figure 8 and
Figure 9 for Group 1 and Group 2 concrete specimens, respectively.
The boxplot illustrates the variability and distribution of the damping ratio for different coating materials with different replacement levels of coarse aggregate across ten repeated simulations, highlighting the median, quartiles, and potential outliers. In the boxplot, outliers are indicated by black diamond symbols.
As presented in
Figure 8, the damping ratio results for each simulation are generally consistent across successive runs. However, the ECA-15, ECA-20, and SiCA-10 concrete samples exhibit outliers, yielding significantly higher damping ratios than the others. Moreover,
Figure 9 shows that CM-0 and SiCA-15 present notable outliers in the simulations, yielding significantly higher damping ratios than the others. These outliers were excluded, as they likely resulted from particularly favorable random distributions of aggregates and coating configurations in those specific cases, which may not represent typical behavior of the system being studied.
Moreover, the damping ratio of concrete obtained by numerical simulation for the two groups of concrete specimens are summarized in
Table 5. The table presents the average values of the damping ratios, with outliers excluded from the computations.
As indicated in
Table 5 below, the damping ratio ranges from 4.03% to 5.75% for Group 1 concrete specimens and from 3.37% to 4.93% for Group 2 concrete specimens. Additionally, the difference in damping ratio between the two groups across different replacement levels ranges from 2% to 16%.
The maximum increments in the damping ratio compared to conventional concrete are 22.85% (RCA-20) for Group 1 and 11.8% (RCA-15) for Group 2 concrete samples, respectively. This suggests that rubber coatings enhance the damping ratio of concrete, likely due to the inherent damping characteristics of rubber materials. The results are consistent with those of Cheng Xu et al. [
20], showing that as the volume fraction of rubber-coated increases, the damping ratio also increases.
Moreover, when comparing these two groups of aggregate sizes, (8–25) mm and (8–32) mm, the damping ratio of concrete with coated aggregates decreases as the aggregate size increases. That is, larger aggregate sizes result in lower damping ratios. This result indicates that aggregate size distribution affects the damping properties, which is consistent with the study conducted by Cheng Xu et al. [
20]. Moreover, concrete properties are affected by aggregate size, as investigated by Xiang Li et al. [
22].
The properties of concrete with coated aggregates, such as compressive strength, modulus of elasticity, and damping ratio, depends on various factors, such as type of coating material, types of coating, and coating thickness. However, this study focuses on investigating the effect of coating thickness on the damping ratio of concrete.
In line with this,
Table 5 shows that the damping ratio of Group 1 samples is higher than that of Group 2 samples. Therefore, the investigation focuses on Group 1 samples to explore the effect of coating thickness on the damping ratio of concrete.
As presented in
Table 5, the statistical analysis of the simulation outputs shows that for Group 1 concrete samples, the standard deviation values range from 0.102 to 0.189, while for Group 2, the values range from 0.113 to 0.203. These relatively low standard deviation values for both groups indicate insignificant variability across repeated simulations, suggesting that the model produces consistent and reliable results for specific volume fractions of aggregates and coatings, even when the aggregate distribution and coating configurations were randomly generated.
In summary, the low standard deviation values confirm that the numerical simulations yield stable and dependable outputs, forming a solid basis for further analysis of the effects of coating materials on the damping ratio of concrete. These values also demonstrate that the model produces consistent results under repeated simulations for each scenario, despite variations in input conditions such as aggregate distribution and coating configuration. This consistency reflects the reliability of the simulation setup, including meshing strategy, boundary conditions, and material property definitions.
4.2. Damping Ratio with Various Coating Thickness
For the determination of the damping properties of concrete using Abaqus for different coating thicknesses, the same procedures stated in the previous sections are followed, with the only variation being the coating thickness.
Various coating thicknesses ranging from 0.4 mm to 5.0 mm, with different coating materials (epoxy, silicone, and rubber), are considered to investigate their effect on the damping ratio of concrete.
In this section, as well, the ellipse and concentric elliptical rings were repeatedly generated ten times for each configuration due to their random generation. Subsequently, FRF analysis was performed, and the damping ratio was determined for each configuration. The average damping ratios for various coating thicknesses are presented in
Table 6.
Table 6 illustrates that the RCA-20 concrete sample exhibits a damping ratio ranging from 5.75% to 6.21%. This represents an increase of 22.85% to 32.7% compared to other coating materials, across coating thicknesses ranging from 0.4 mm to 5.0 mm. Several authors have reported that as the thickness of the rubber coating increases, the damping ratio of concrete also increases (T. Tesfaye [
16] and S.J. Mitchell [
19]).
Furthermore, compared to the control mix, concrete incorporating silicone-coated aggregates at replacement levels ranging from 5% to 20%, with coating thicknesses varying from 0.4 mm to 5.0 mm, demonstrates an increment in its damping ratio. This result follows the same trend as the study by M. Ansari et al. [
14], which indicated that as the silicone coating thickness increased, there was an improvement in the damping ratio.
Concrete with silicone- and rubber-coated aggregates effectively enhances the damping properties of concrete, potentially due to their material characteristics and interaction with the concrete matrix.
The maximum reduction observed was 23.0% (for ECA-20 with a 5.0 mm coating thickness) compared to the control mix. Thus, epoxy coatings are not suitable for improving the damping behavior of concrete.
For the damping ratio of concrete with coated aggregates of various coating thicknesses ranging from 0.4 mm to 5.0 mm across different samples, the standard deviation values range from 0.102 to 0.197. These relatively small standard deviation values indicate low variability across repeated simulations for each configuration.


 ,
, 


