Article

Research on Multi-Orbital Scanning Laser Bending Process of Polyvinyl Chloride Sheets

by
Fuchao Kan
1,
Haojie Xu
1,
You Zhou
1,
Kangmei Li
1 and
Jun Hu
2,3,*
1
College of Mechanical Engineering, Donghua University, Shanghai 201620, China
2
Engineering Research Center of Artificial Intelligence for Textile Industry Ministry of Education, Donghua University, Shanghai 201620, China
3
Institute of Artificial Intelligence, Donghua University, Shanghai 201620, China
*
Author to whom correspondence should be addressed.
Coatings 2025, 15(5), 609; https://doi.org/10.3390/coatings15050609
Submission received: 19 April 2025 / Revised: 11 May 2025 / Accepted: 17 May 2025 / Published: 20 May 2025
(This article belongs to the Special Issue Laser Technology of Thin Film and Coatings)

Abstract

:
To make up for the lack of research on the laser bending process in the field of non-metals, this paper innovatively proposes a method to achieve controlled bending deformation of non-metallic components using laser processing of polyvinyl chloride (PVC) thin sheets. The main processing parameters affecting the deformation were analyzed by experimental comparison, and the multi-orbital laser application bending process was carried out with the illumination length and the thickness of the sheet as the variables, which revealed the deformation mechanism of PVC sheets under the laser effect. The surface morphology examinations of the exploration results were also compared to confirm the damage status of the objects. The bending mechanism was revealed by using the change in molecular chain status in the theory of polymer phase transition. This study proves the reliability of laser multi-orbital scanning of PVC sheets to achieve controlled bending deformation, providing a fundamental theoretical and experimental basis for the laser bending process of non-metallic components.

1. Introduction

The bending process is widely used because of its high efficiency, the possibility of manufacturing complex parts, and the saving of raw materials, while it is increasingly favored in various industries due to its aerodynamic, structural, mechanical, and aesthetic advantages [1,2]. For example, thin-walled bent tubes have become important components in the aerospace, shipbuilding, and chemical industries [3,4]. Production quality has become critical considering the transport of fluids and gases [5].
Currently, the bending process generally involves the usage of molds to heat and pressurize the components, etc., to produce a certain bending deformation, and the mechanical external force during the process may cause a large rebound or a stress flaw in the bending zone of the formed components [6]. While the laser bending process does not require the use of molds to apply mechanical external forces, it is a flexible bending method that compensates for the deficiencies of springback and stress flaws in the bending zone [7]. In addition, the laser processing method has the advantages of low operation and maintenance costs, easy operation, and high efficiency, which promote the development of laser applications [8,9]. Nowadays, in the field of metallic materials, the laser bending process is well developed. Sharma Y.P. achieved 8.81° bending of steel plate under forced cooling conditions using a high-power laser and low-speed scanning and achieved a hardness value of 198.5 HV, which significantly improves the potential of the laser bending effect [10]. Based on the effect of the number of scans, the role of section modulus, and inter-channel cooling, Khandai B.K. obtained a correspondence between the heat accumulation effect and the bending angle [11]. Sala S.T. successfully achieved sacrificial coverings of plates by varying and laser blasting parameters, increasing the plate bending by 50% [12].
Although there are many achievements in the laser bending process, they are all concentrated in the field related to metallic materials. However, with the development of 4D printing and soft robotics, the bending and forming of non-metallic components is also playing an increasingly important role in many fields [13,14]. In the medical field, Im S.H. proposed the theory of shape memory polymer (SMP) stents for the treatment of thrombosis, which has great advantages in terms of compatibility and the absence of a second surgery, reducing the pain of patients to a large extent [15,16]. Bukala J. prepared a self-bending and deforming coronary stent that provides an effective tool for the design and evaluation of absorbable stents [17]. In the aerospace field, Leng J.S. used SMP to fabricate an integrated hinge that can be bent or reverted, with an unfolding rate of up to 100 per cent in space, which greatly achieved lightweighting [18]. In the field of soft robots, many scholars have achieved many achievements in the areas of structure, materials, mechanical properties, and control systems [19]. Zhang Y.F. presented an ‘Ω’ bending and deforming bionic inchworm soft-bodied robot that can crawl on horizontal surfaces and vertical walls and can even carry a 500 g object in water. Therefore, the bending process of non-metallic materials has a promising future [20].
However, in the field of non-metals, no research has been retrieved on the achievement of bending deformation by applying lasers. From the properties of thermoplastic materials, it is known that softening bending deformation occurs when the sheet temperature reaches a certain range [21]. And laser, as an efficient and low-cost heat source, has great research value in this field. In order to fill the gap in this particular research area, this paper carries out a laser bending process study of non-metallic materials using a nanosecond laser system with a PVC sheet as the object. The main processing parameters affecting the deformation were analyzed, the bending thermal deformation mechanism of laser application PVC sheets was revealed, and the results of the exploration were analyzed in terms of surface morphology examinations, proving the reliability of laser processing of non-metallic components for bending.

2. Experimental Design

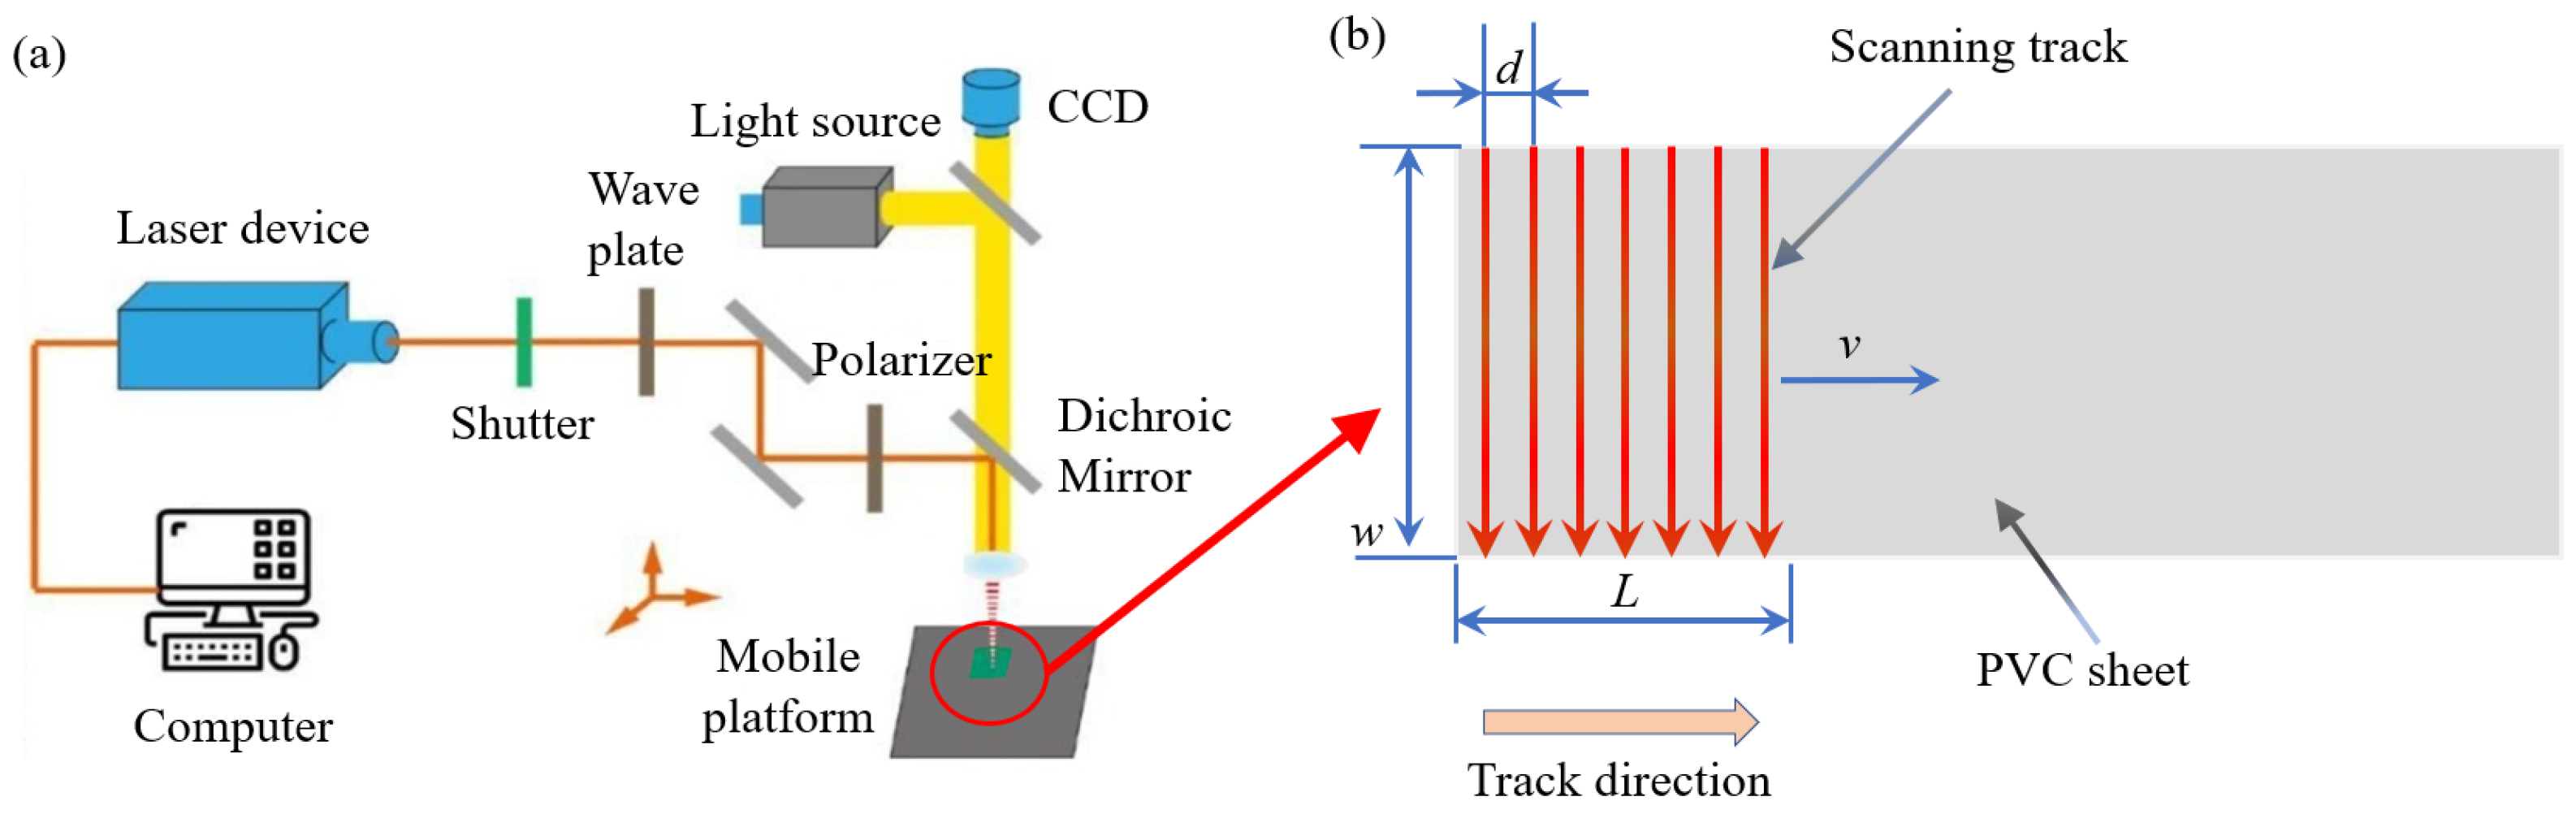
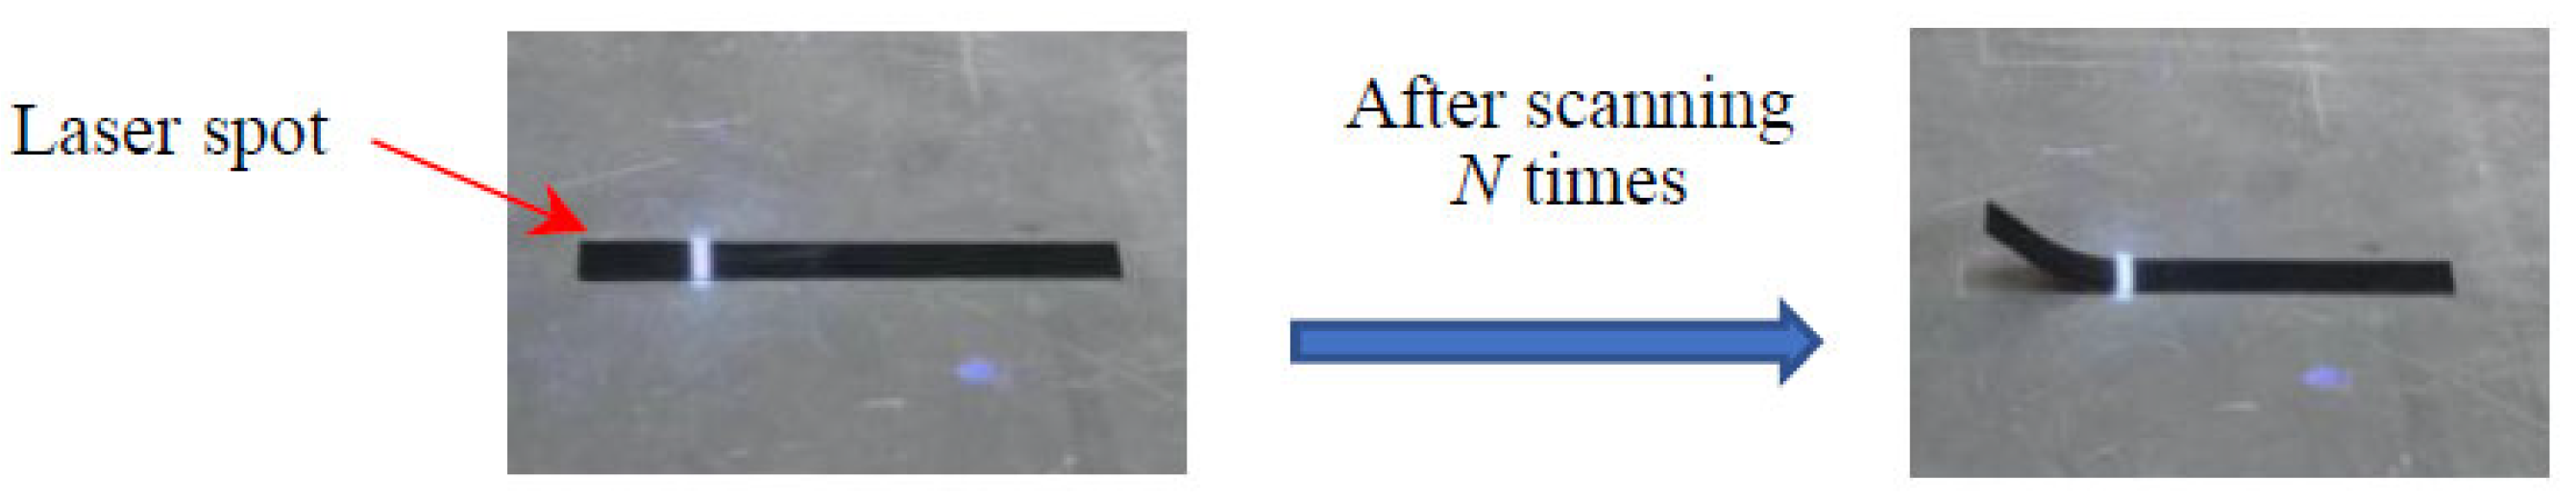
2.1. Experimental Methods

In this paper, the adopted laser system is a Nd: YVO4 nanosecond UV laser system (Wuhan Ruike, Wuhan, China). The parameters are shown in Table 1.
The material used is PVC, and in order to improve the efficiency and effectiveness of the experiment, combined with the advantages of better consistency of the components, sheets of thickness from 0.25 mm to 1.00 mm were chosen as the experimental object.
The experimental method is shown in Figure 1. The laser system is shown in Figure 1a. The scanning path on the surface of the thin plate is shown in Figure 1b, and the laser spot scans several times unidirectionally in multiple orbits perpendicular to the long edge of the thin plate and parallel to the short edge.

2.2. Parametric Analysis

Plastic components are susceptible to ablation damage under the high energy density of the laser, so the energy density needs to be reduced and fed into the material at an appropriate rate, and it is necessary to discuss the main factors affecting the processing results.
The influencing factors will be analyzed based on the laser energy distribution function in Equation (1) [22] and the experimental results. Since the aim of this study is not to deeply investigate the influencing factors, we base our analysis on the parameters obtained from the orthogonal tests of each factor, with no interference from other factors when analyzing one of them.
Q = 2 η I p exp 2 x 2 + y 2 D s 2 T p t
where η is the absorption coefficient of the laser energy by the thin plate, Ip is the peak laser intensity, Ds is the beam diameter, x and y are position vectors, and Tp(t) is a Gaussian time pulse train.

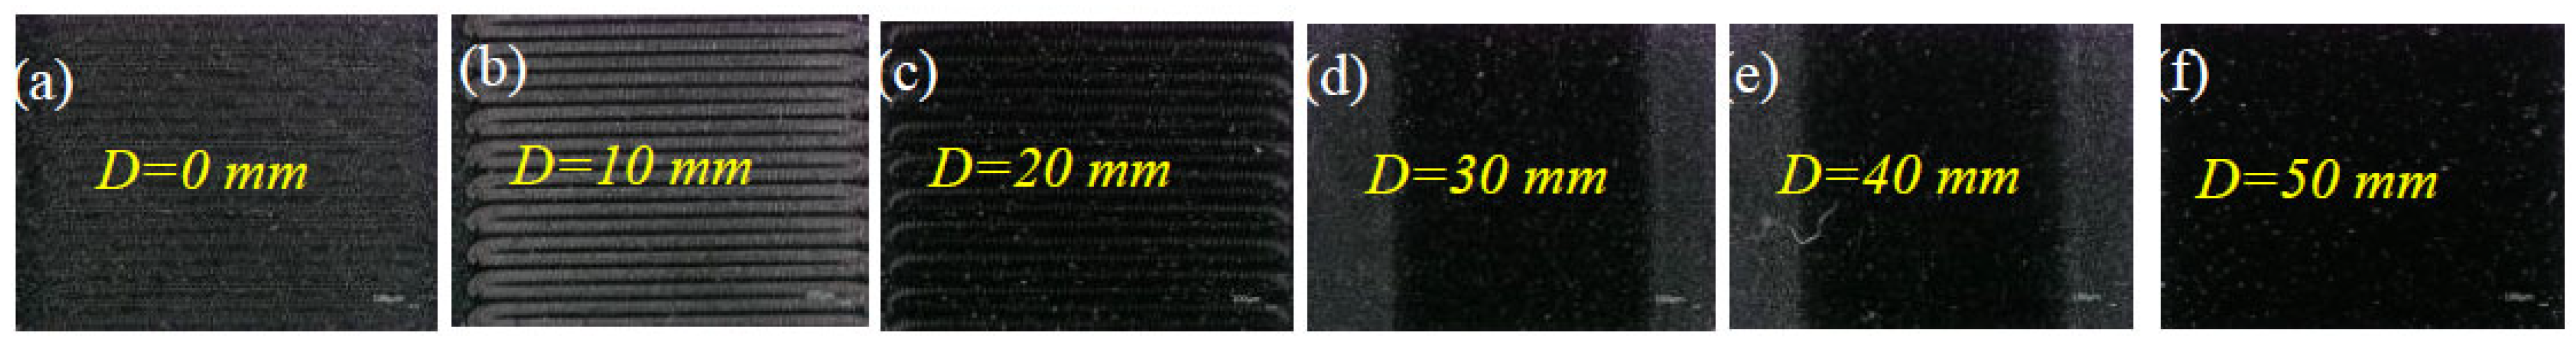
2.2.1. Processing Distance

The processing distance D is defined as the vertical distance from the laser focus to the surface of the sheet. From Equation (1), it can be seen that as D increases, the spot area increases and the energy density decreases.
The experiment results of the thin plate surface corresponding to the distance gradient are shown in Figure 2. In this paper, a surface measuring digital microscope (Model and number: Keyence VHX-S600E, Osaka, Japan) is adopted to characterize the experimental results. (a) shows that pits appear on the surface when D is small, indicating poor heat conversion and transfer. (b) and (c) show surfaces with more significant ablation, indicating more severe surface damage of the sheet in this parameter range. (d) and (e) show that the scanning results are better and the surface material allows better energy conversion and transfer. However, multiple scans are required to achieve bending, and (d) remains susceptible to damage. (f) shows that when D is large, the rate of energy conversion is slower, affecting processing efficiency.

2.2.2. Scanning Path Spacing

From Equation (1), it can be seen that the edge of the spot has a lower energy density with respect to the center part, and in order to increase the energy of the edge part, we set the scanning path spacing d to be smaller than the spot diameter. If the spacing is not suitable, the surface will be unevenly heated, which is expressed visually as a larger surface roughness measured by the digital microscope, and Sa is defined as the surface roughness of the illumination area. Shown in Figure 3 are the experiment results corresponding to the d gradient; Sa decreases and then increases with the increase in d. This is because when the spacing is small, the energy density of the overlapping part of the path is high, which generates damage on the surface, leading to a larger Sa value; when the spacing is large, after a certain number of scans, the difference between the Sa values inside and outside the path region gradually increases, leading to an increase in the Sa on the surface. Where the surface roughness is minimum when d = 0.25.

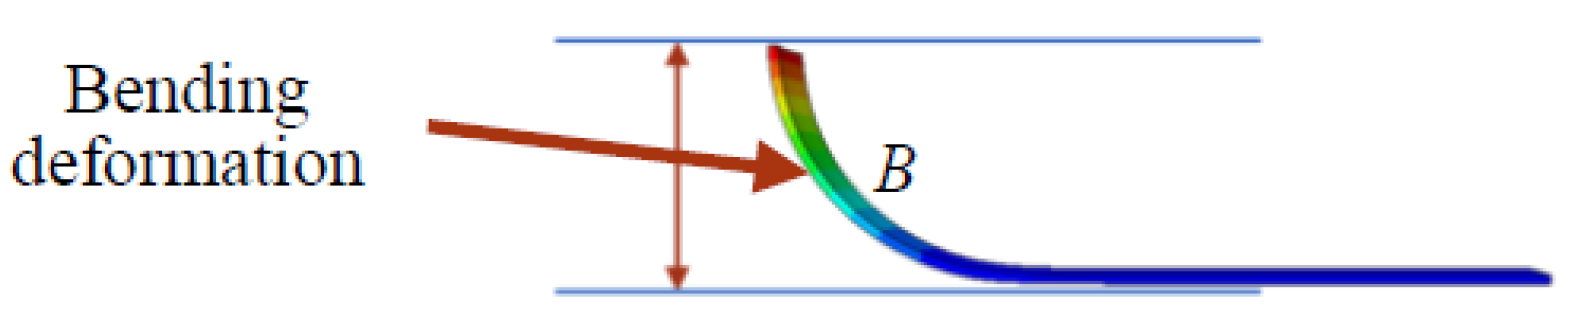
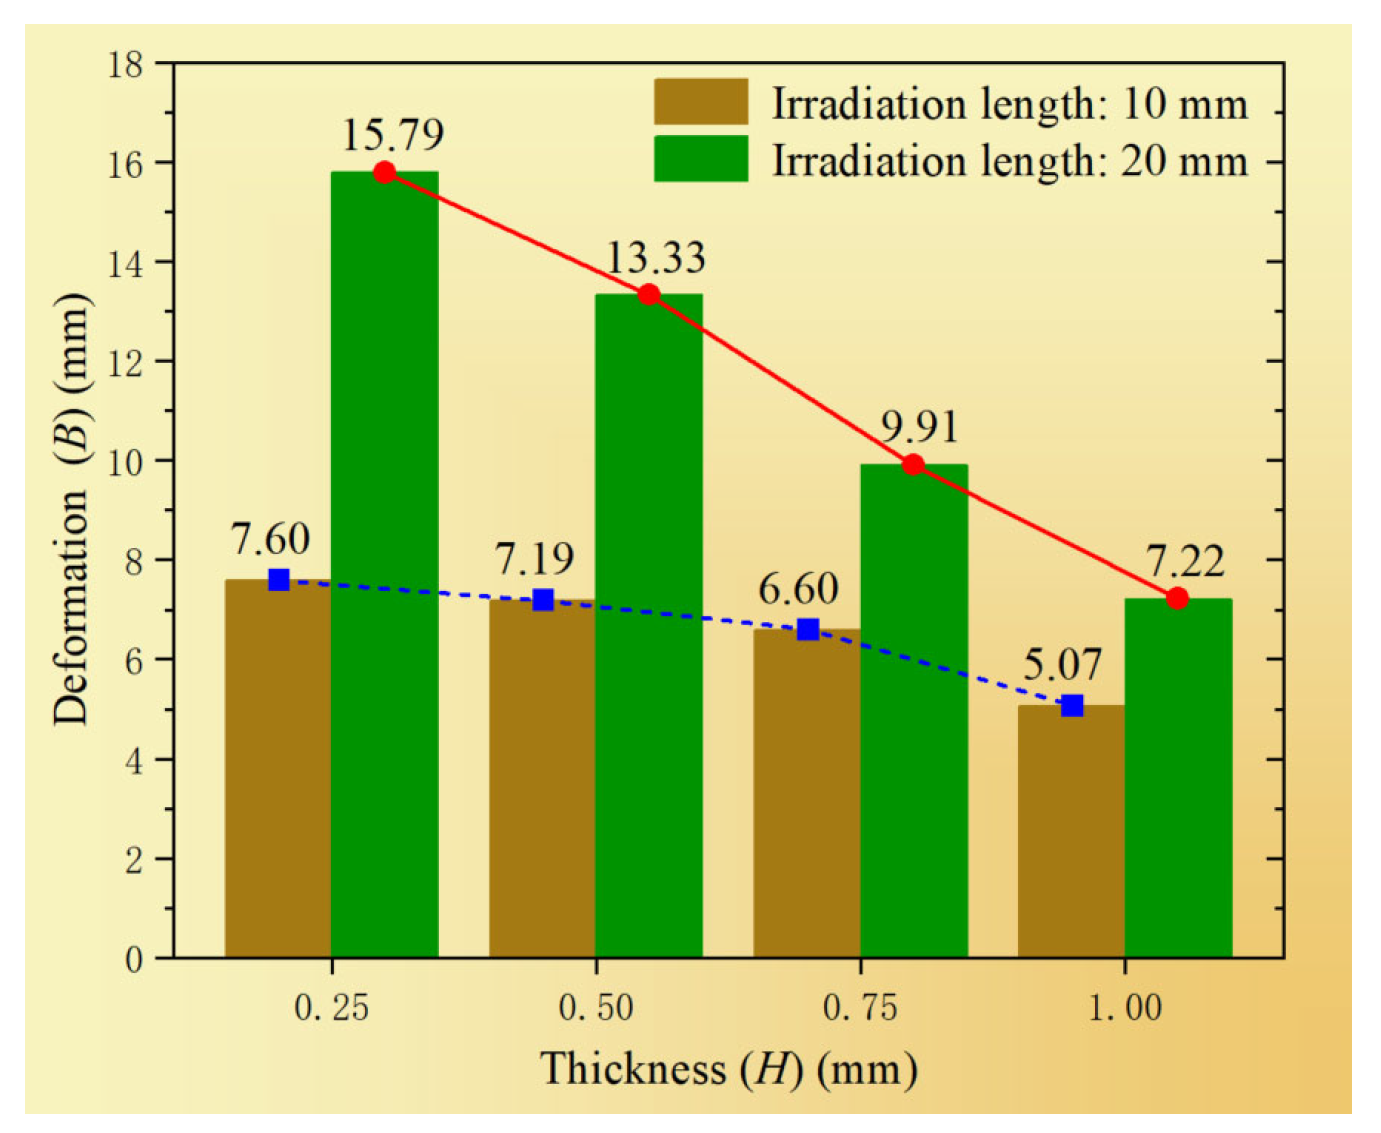
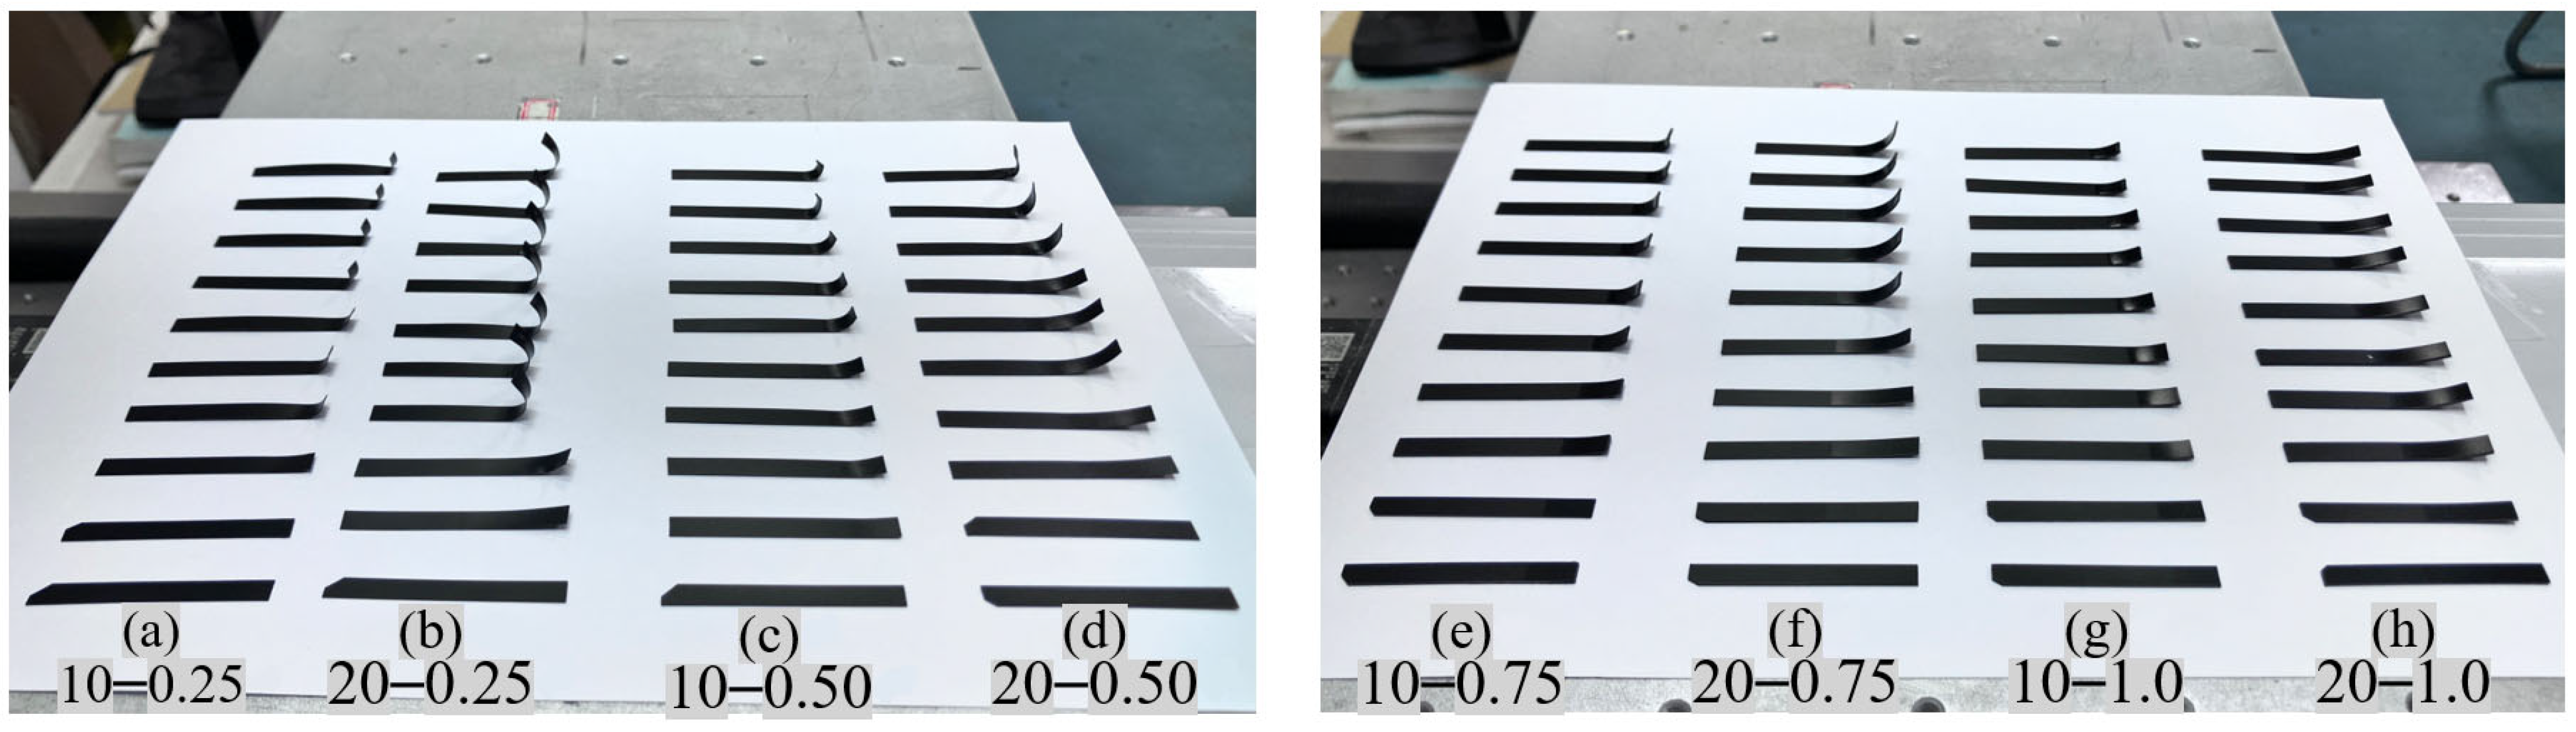
2.2.3. Illumination Length and Sheet Width

Since the material dissipates heat as it is heated, if the time interval between two scans of the same area is too long, the temperature cannot rise, and, ultimately, the sheet will not reach the conditions for deformation. The parameters that determine this interval are the illumination length and the sheet width. In order to explore the better bending effect under the existing experimental conditions, the chosen width of the sheet w is 5 mm; meanwhile, as a control, the illumination length L is 10 mm and 20 mm.

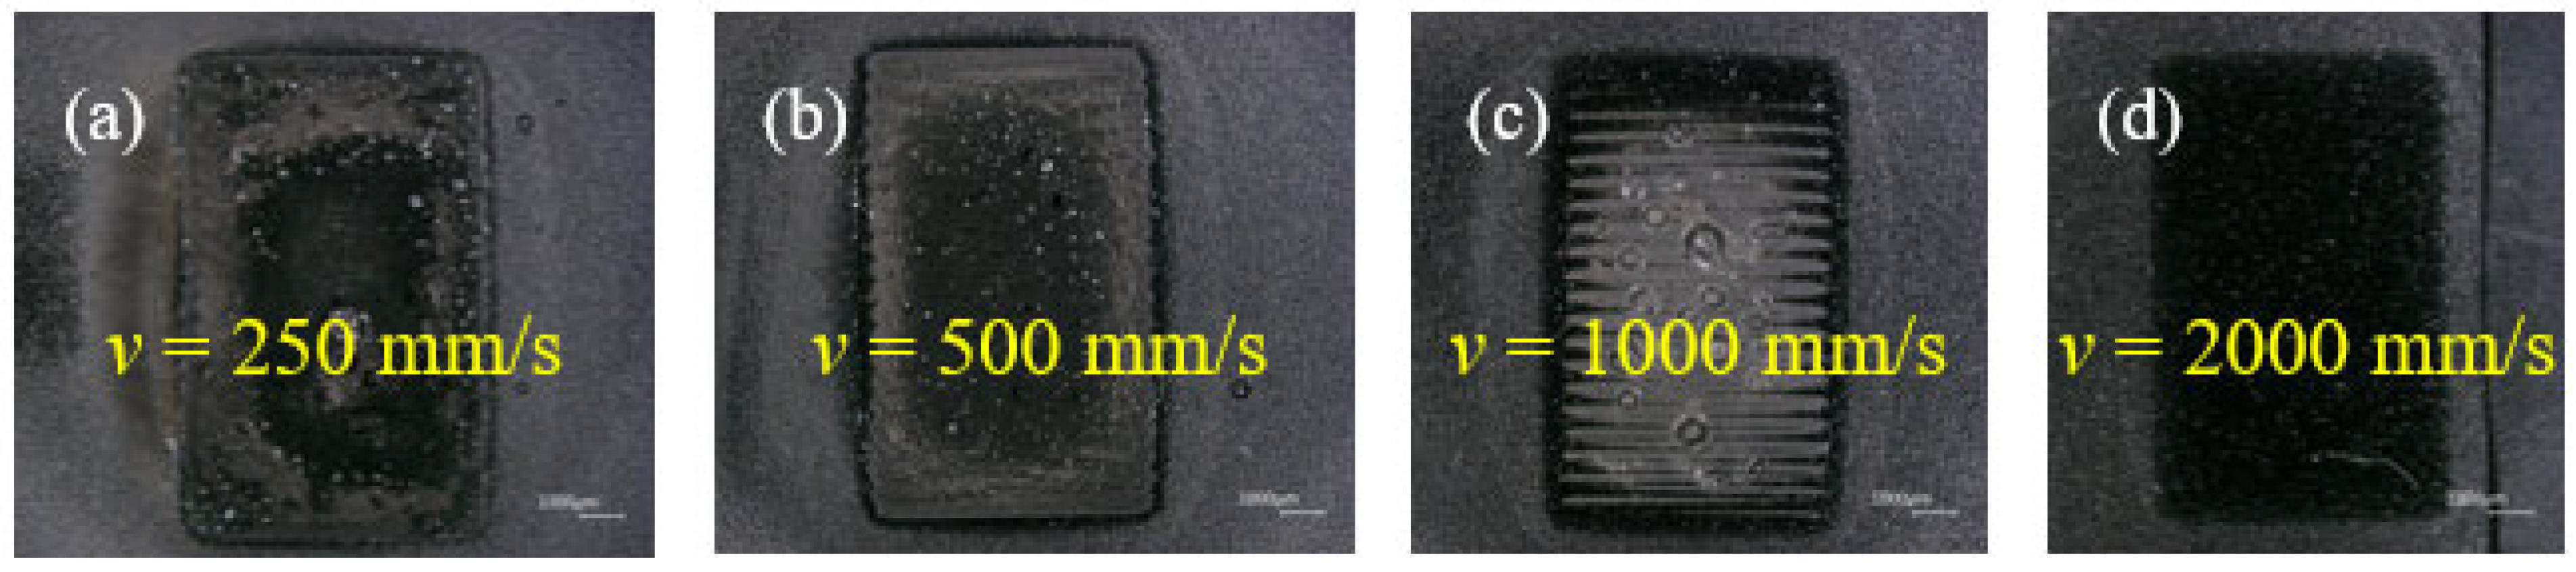
2.2.4. Scanning Speed

If the scanning speed v is small, much energy is gained in the same region on the surface, and due to the slow heat transfer rate of the polymer, energy accumulates in this region, resulting in ablation damage. If v is large, little energy is gained on the same scanning area, and at the same time, little energy is transferred from the surface to the interior due to the effect of heat dissipation, which seriously affects the bending efficiency. Therefore, it is necessary to adjust the scanning speed appropriately to enable the energy gained on the surface to be transferred to the interior at a stable and efficient rate without damage caused by energy build-up. As shown in Figure 4, (a) and (b) indicate that the surface of the sheet was overablated and showed carbonization when v was too small; (c) shows the occurrence of large granular damage; and (d) presents a better heat transfer.
In summary, the parameters selected for this study are as follows (Table 2):

3. Simulation and Experiment
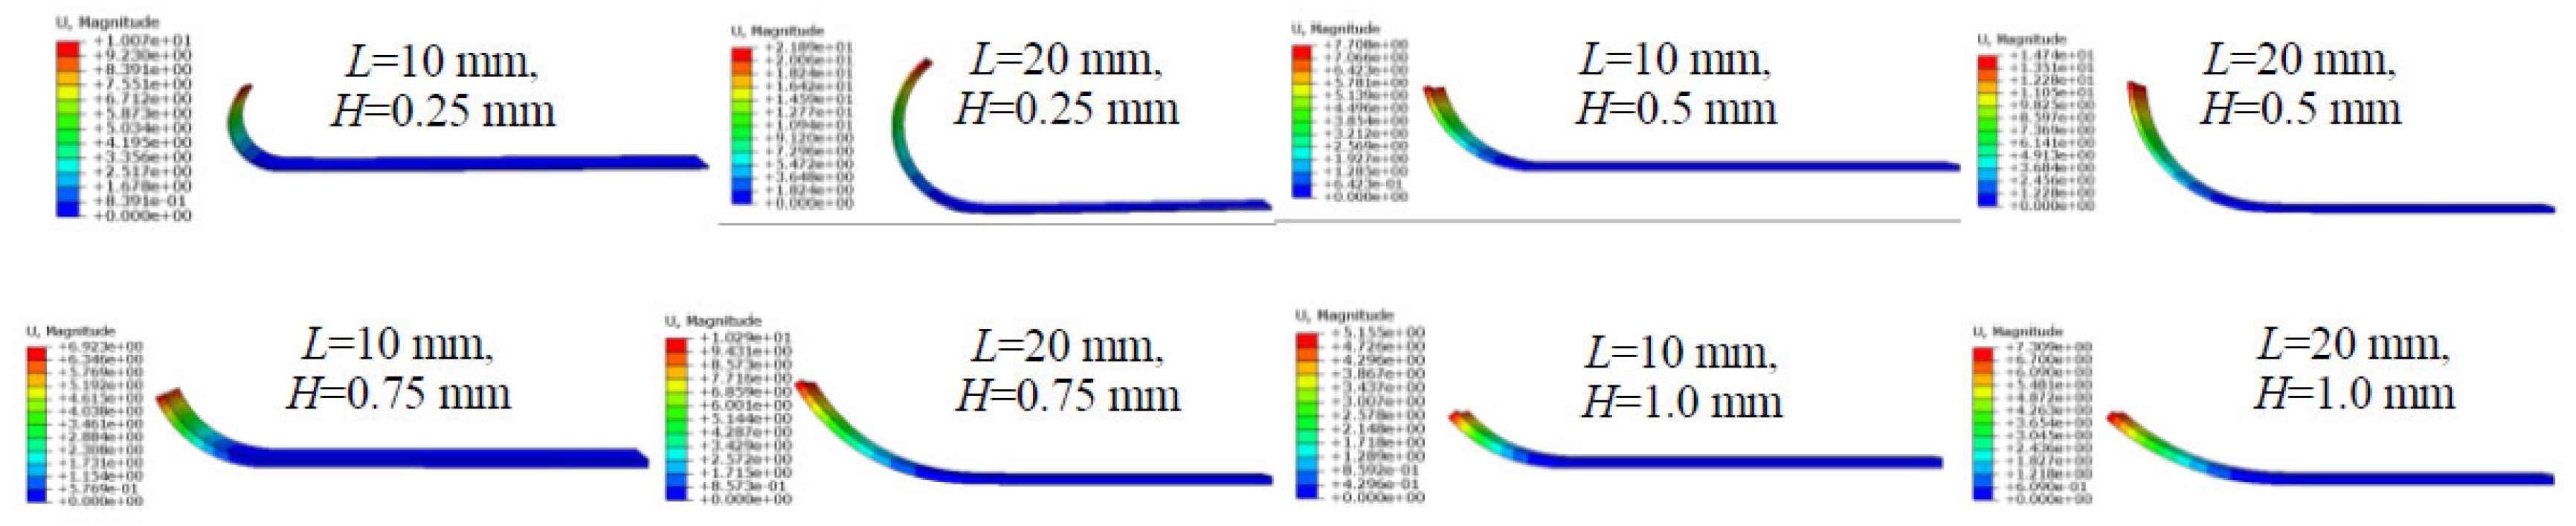
Based on Table 2, simulation calculations and laser application experiments were carried out using PVC sheets with thicknesses of 0.25 mm, 0.50 mm, 0.75 mm, and 1.0 mm as control groups. H is defined as the thickness of the sheet.

3.1. Simulation

In order to investigate the deformation status of the PVC sheet under laser application, Abaqus was used to establish a finite element model of the PVC sheet. Parameters and boundary conditions were set based on the experimental design with a power of 40 W, an energy density obeying Equation (1), a diameter of 317 μm, an absorption coefficient of 0.6, and an illumination area grid size of 0.5 mm × 0.5 mm × 0.125 mm. The number of scanning cycles was N. The material parameters of PVC are as follows: the density of 1.38 × 10⁻⁹ t/mm3, the elasticity modulus of 2900 MPa, the Poisson’s ratio of 0.35, the thermal conductivity of 0.16 W/(m∙K), the specific heat capacity of 1.05 × 10⁹ mJ/(tone∙K), and the thermal expansion of 8 × 10⁻⁵/K.
The maximum deformation results are shown in Figure 5. In order to facilitate the observation of the deformation mechanism, as shown in Figure 6, deformation B is defined as the maximum value in the vertical direction of the thin plate. As shown in Figure 5, when the illumination length is the same, the deformation decreases with the increase in thickness. When the thickness is the same, the longer the length of the illumination, the larger the deformation will be. In order to further analyze the relationship between the experiment parameters and the deformation, the simulation results are statistically presented in Figure 7.
As can be seen from Figure 7, under the same illumination length, the deformation decreases linearly with increasing thickness; under the same thickness, the deformation of the illumination length of 20 mm is larger than that of 10 mm, and the difference between the two values decreases as the thickness increases.

3.2. Laser Application Experiments

Based on Table 2, the laser application experiment was carried out. Taking the parameters of sample thickness of 0.5 mm and illumination length of 20 mm as an example, the photographs of the application experiment are shown in Figure 8.
The experiment results are shown in Figure 9 (due to the large number of samples, only the main deformation trends are shown here), and the number of scans–deformation curves (N–B) are collated as shown in Figure 10.
As can be seen from Figure 10, the deformation pattern is the same for different illumination lengths. The data marked in the figures represent the maximum deformation and corresponding scanning times under different parameters. As the number of scans increases, the amount of deformation first increases slowly, then increases rapidly, and finally tends to stabilize. The times of scans required for the rapid increase in deformation and its stabilization increase along with the thickness, and, at the same thickness, the times are less correlated with the illumination length. The maximum deformation decreases linearly with the increase in thickness for the same illumination length. When the thickness is 0.25 mm and the illumination length is 20 mm, a maximum deformation of 14.27 mm is obtained. Under the same thickness, the maximum deformation obtained with an illumination length of 10 mm is less than 20 mm. Additionally, the ratio of the two decreases as the thickness increases. The difference is 52.9% when the thickness is 0.25 mm and 28.9% when the thickness is 1.0 mm.

4. Result Analysis

According to the results, the PVC sheets illuminated by laser have a stable and regular bending deformation. The bending deformation mechanism is analyzed below.

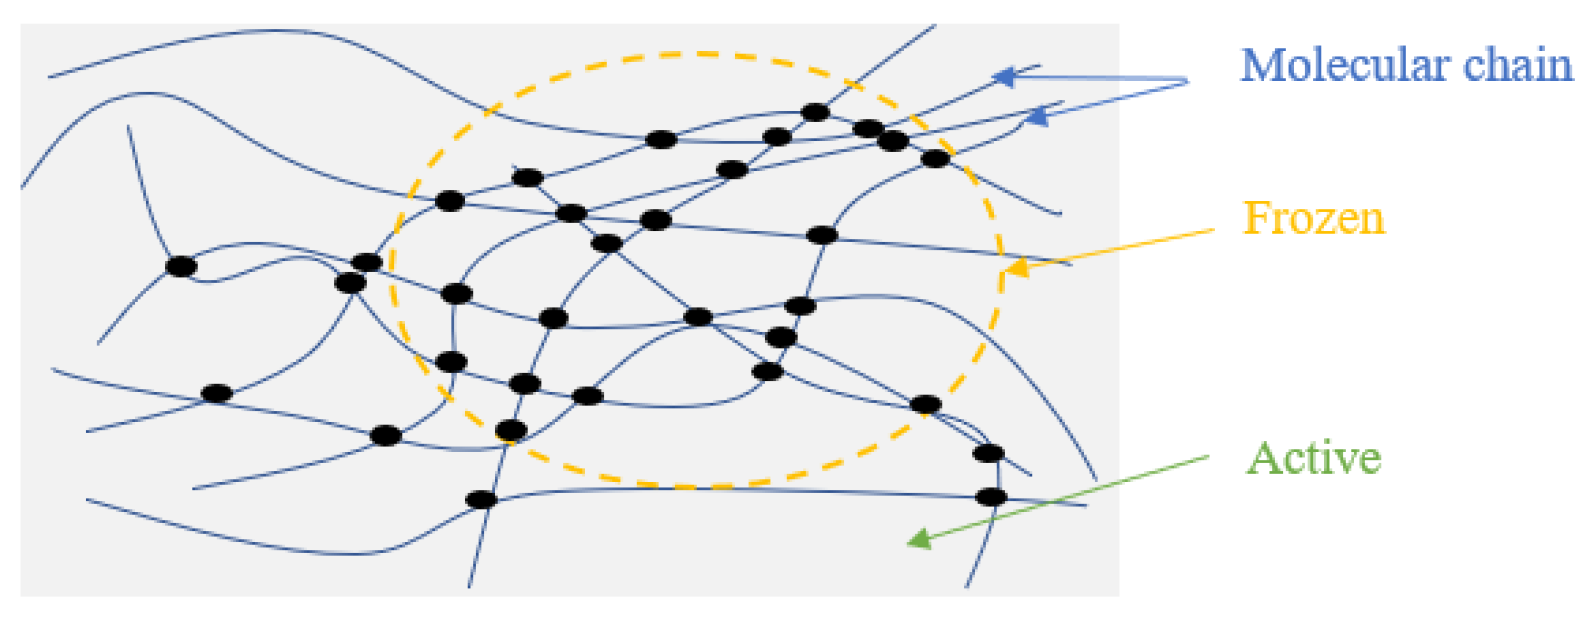
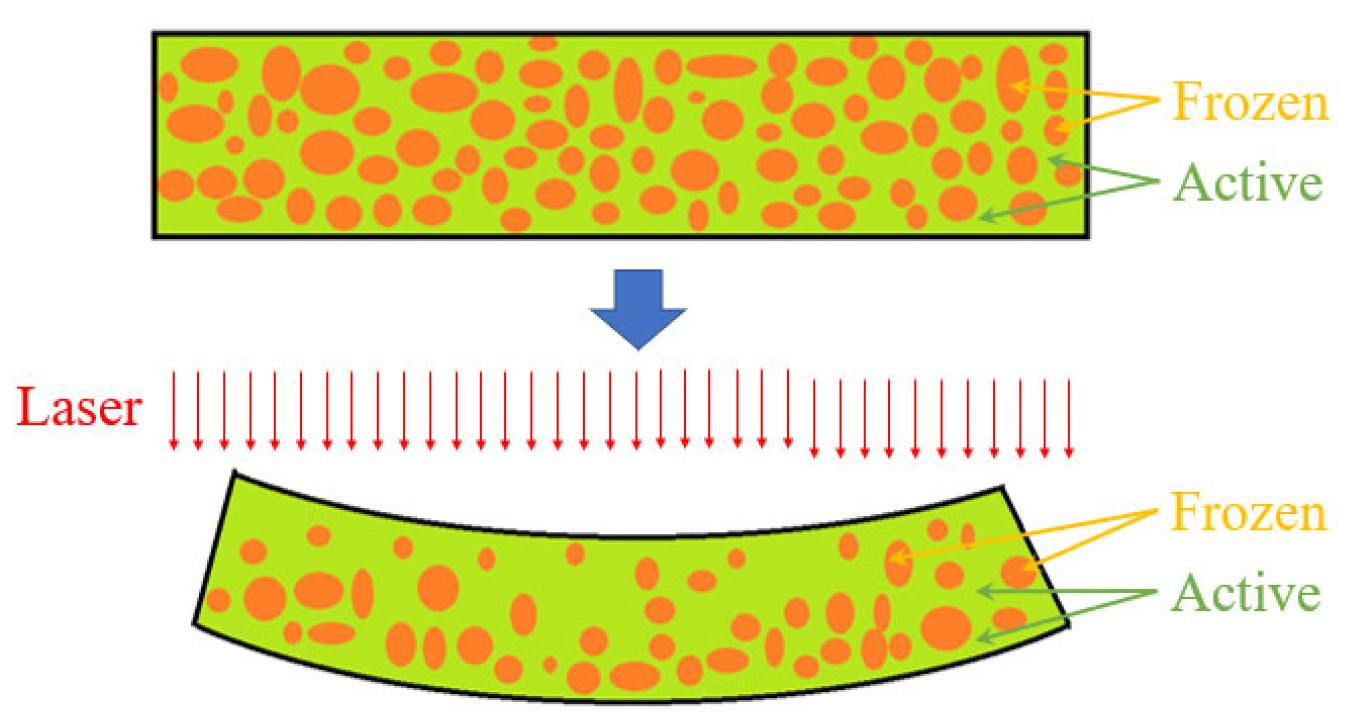
4.1. Analysis of Bending Deformation Mechanism

Since the PVC material consists of randomly wound molecular chains, the molecular chains have randomly distributed tangled nodes between them [23], as shown in Figure 11. When many nodes cluster in one area, this section appears to be ‘harder’ and less susceptible to external interference, and this region is called the freezing phase, playing a role in hindering deformation. When there are fewer nodes, this part is ‘softer’ and susceptible to external interference, and this region is called the active phase, as shown in Figure 11. In other words, the material consists of frozen phases and active phases.
On the other hand, PVC is manufactured into a sheet after being extruded in the fused state and then cooled instantly in a mold, where the molecular chains are stretched. The residual stress, which gives the molecular chains a tendency to shrink, is stored during the process [24]. When the sheet is illuminated by the laser, the light energy is converted into internal energy, and the molecular chains inside the active phase release the residual stresses immediately. As the scanning continues, the frozen phase gradually releases the residual stresses, giving rise to a deformation response in the sheet. Molecular chains shrink around the junction at this stage, causing the volume of frozen phases to decrease and the volume of active phases to increase. In short, a phase transition occurs [25], as shown in Figure 12.

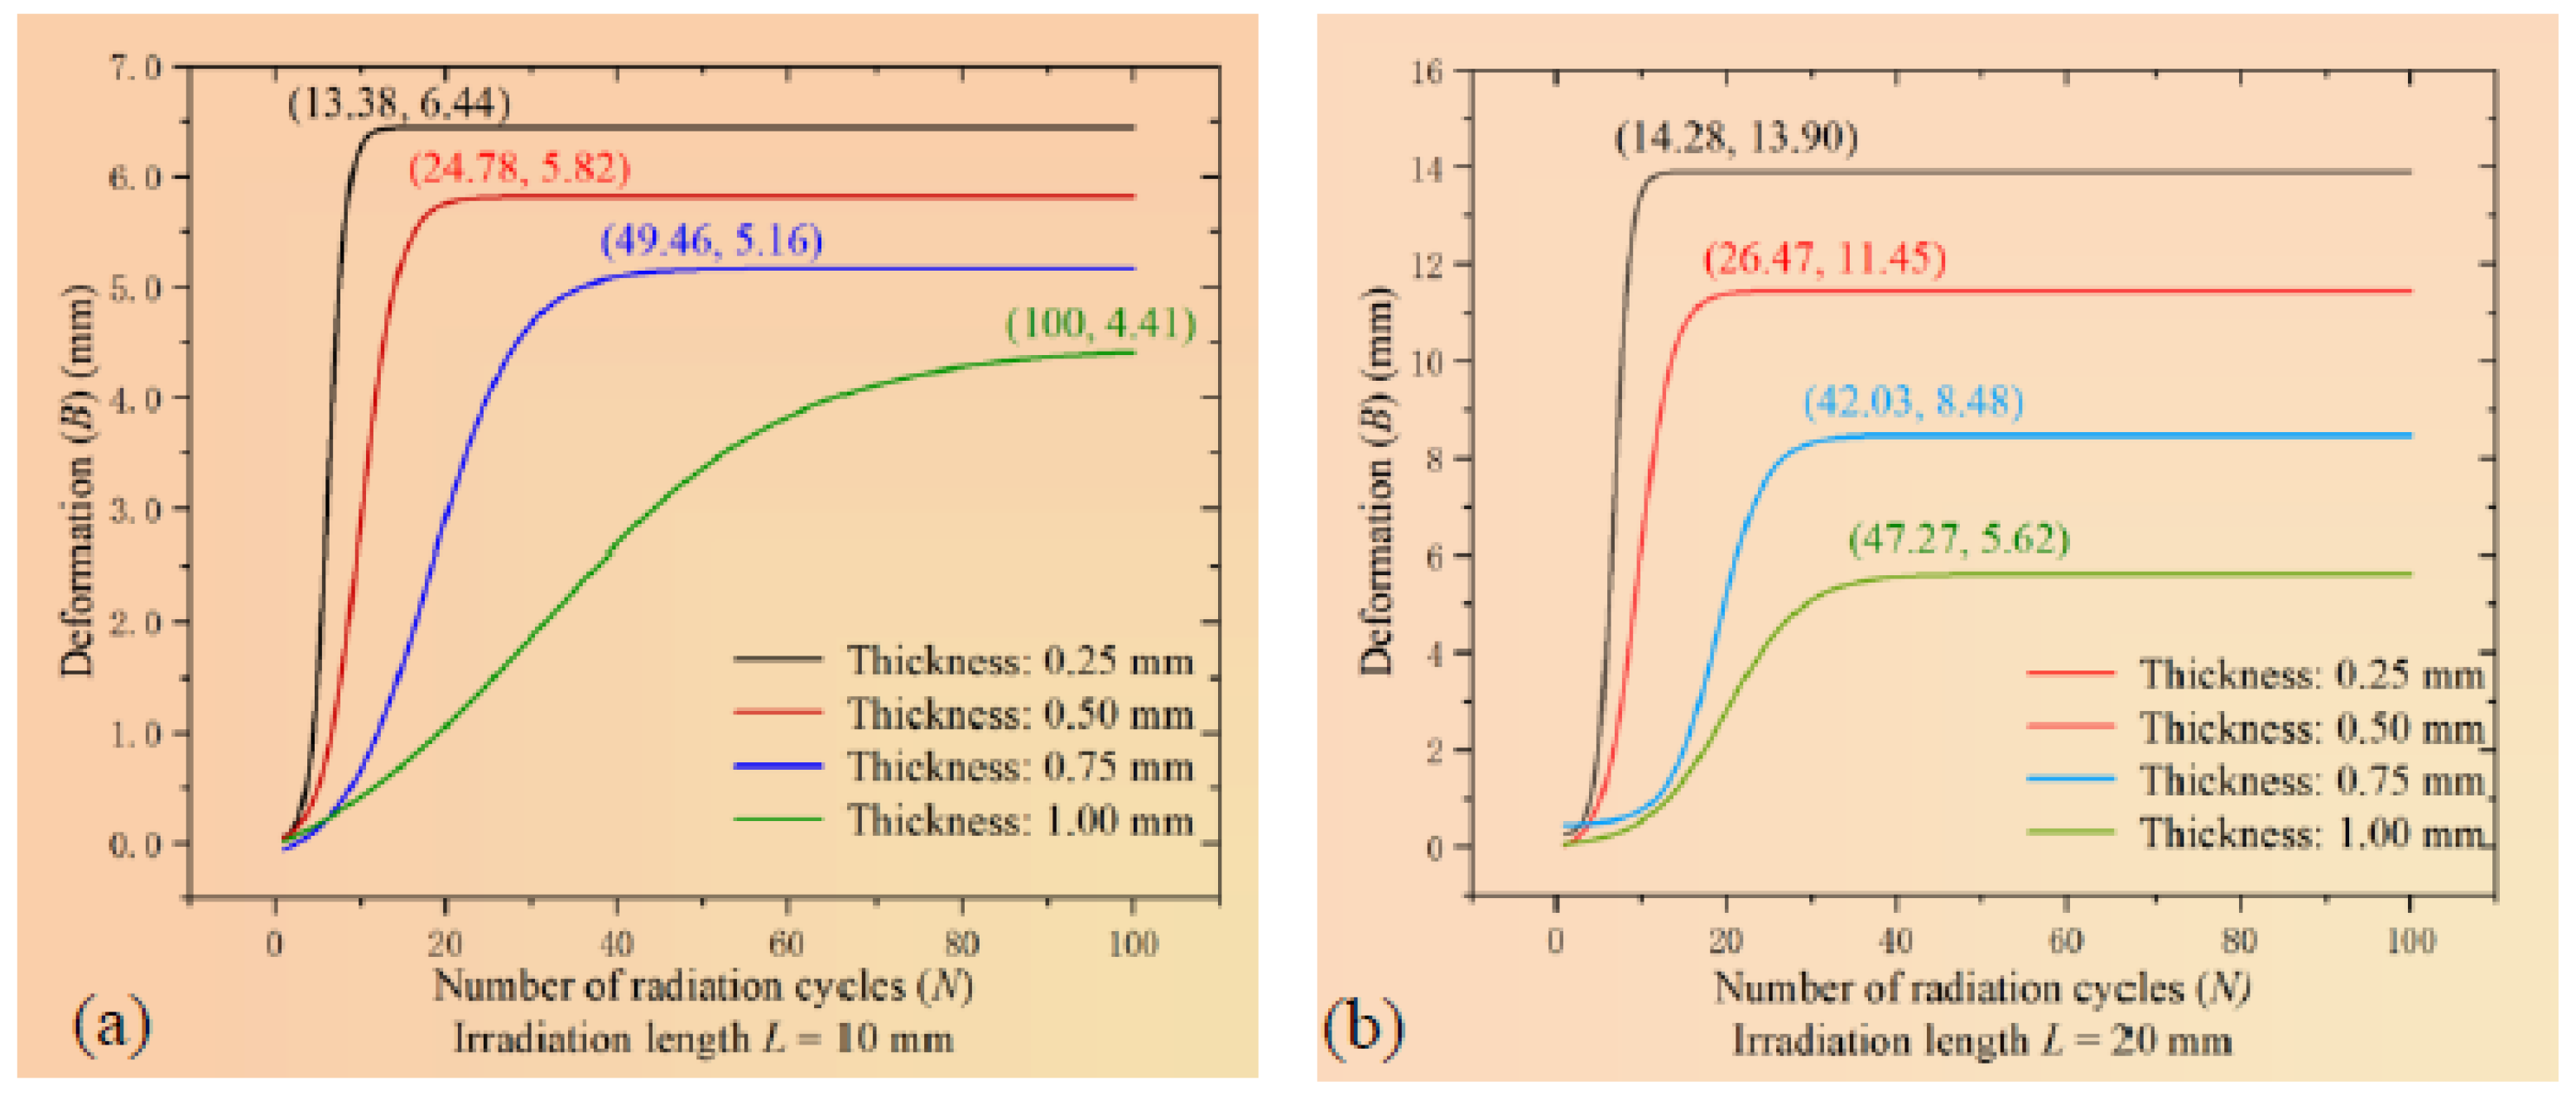
4.2. N–B Law Mechanism Analysis

As can be seen in Figure 10, when the number of scans is small, the deformation is small; when the number increases to a certain range, the deformation increases rapidly; when the number exceeds the range, the increment becomes slow momentarily; and as the number increases, the deformation stabilizes. This feature is consistent with the Boltzmann function, with the expression in Equation (2) [26].
y = B 1 B max 1 + e x x max / d x + B max
where B1 is the initial value, Bmax is the stable value, xmax is the independent variable corresponding to the threshold, and dx is the time constant.
The laser experimental data were substituted into this equation for fitting, the Boltzmann fitting curves under each parameter set were obtained, and the curves are shown in Figure 13. The data marked represents xmax scanning times and Bmax deformation under different parameters.
Comparing Figure 10 with Figure 13, it can be observed that the bending pattern of the PVC sheet with the application of the laser is consistent with the curve of Boltzmann’s equation.
When the scanning number is lower, active phases release less residual stress, which is not enough to break the resting state of the sheet. Due to the small specific heat capacity of the material, the temperature rises rapidly as the laser continues scanning after the total energy reaches the lower limit required for deformation, then more frozen phases are converted to active phases, and more residual stresses are released, resulting in a rapid deformation of the component. As the energy input continues, frozen phases that can be converted into the active phase decrease, and the deformation slows down. When the scanning number reaches a certain limit, the phase transformation ends, and the residual stresses are all consumed. At this point, the deformation ends and reaches its maximum value [27]. This also explains that as the PVC sheet is thinner, the residual stresses have less resistance to overcome, allowing the deformation to end more quickly. In summary, the phase transition process of the internal material is consistent with the deformation law at the relevant parameters, as well as with the curves of the Boltzmann equation.

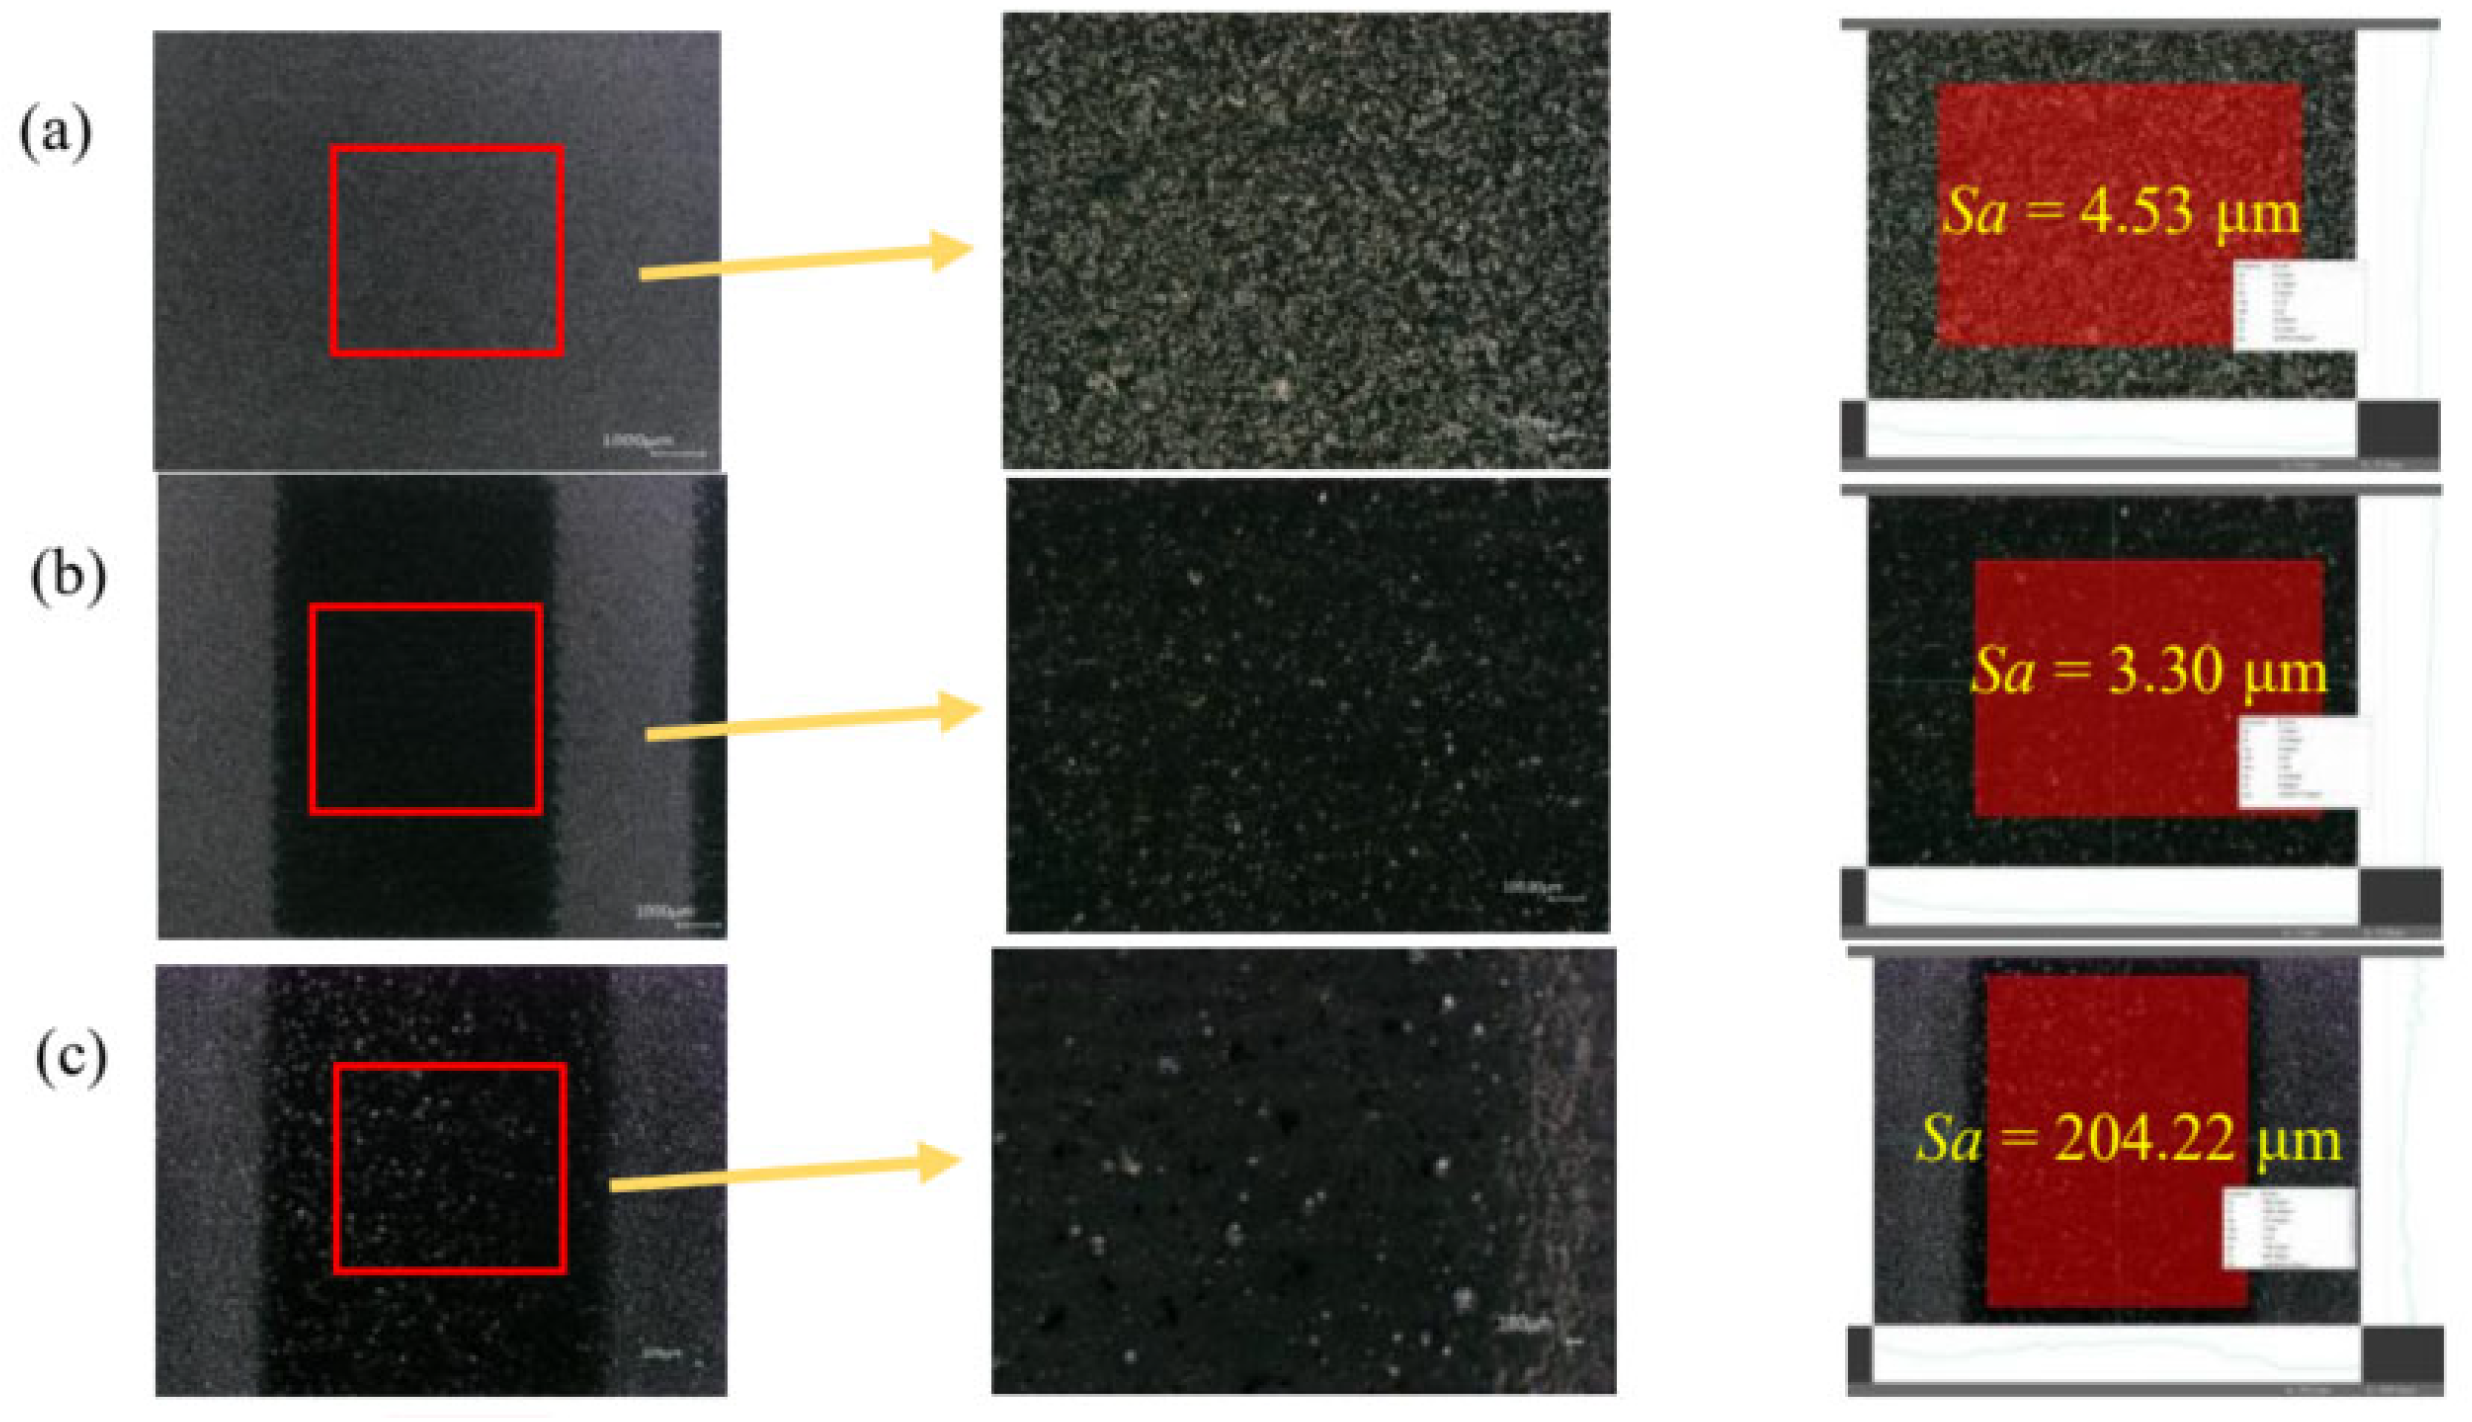
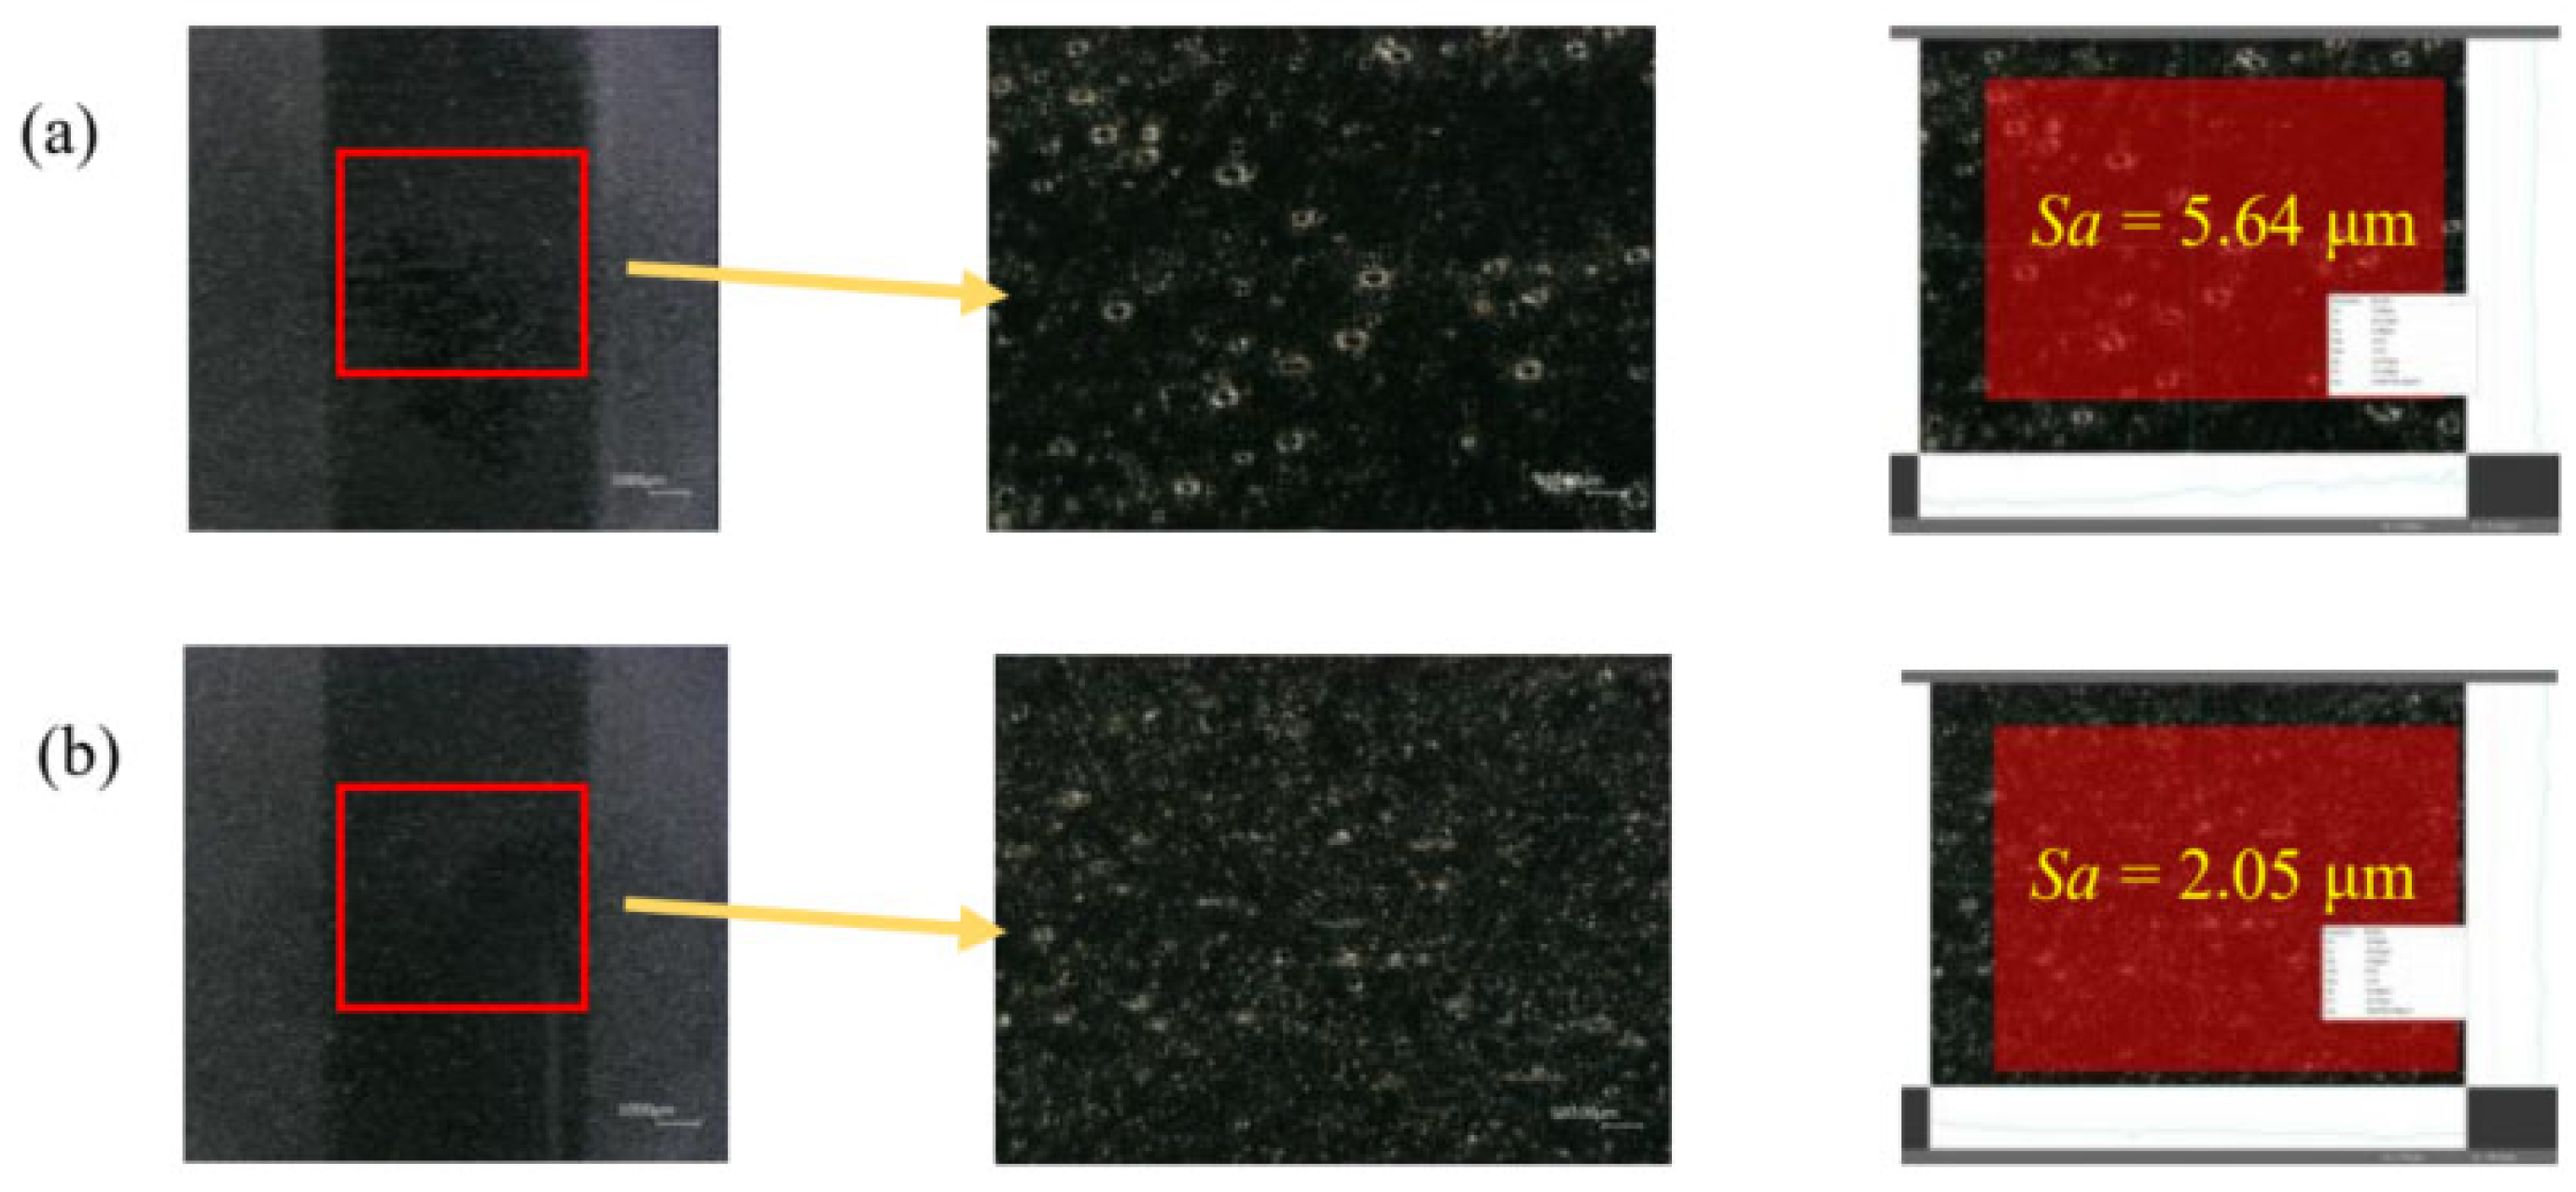
4.3. Surface Morphology Analysis

Due to the high laser energy density, the component surface may have particles, voids, and other damages after several scans, so the surface of the illuminated sheet needs examination. In this section, the surface roughness Sa is used as a reference [28].
Figure 14 shows the surface morphology corresponding to an illumination length of 10 mm and scanning times of 0, 50, and 79. Comparing Figure 14a,b, it can be seen that after 50 times, the surface becomes smoother and the roughness Sa is reduced from 4.53 μm to 3.3 μm. At this time, there is no damage, and, from Figure 10, it can be seen that the deformation of the sheet with thicknesses of 0.25 mm, 0.5 mm, and 0.75 mm has reached the maximum, while the deformation of the sheet with a thickness of 1.0 mm has not reached the maximum. As shown in Figure 14c, when the number of times is 79, Sa reaches 204.22 μm, and there is a granular bulge, indicating that obvious damages occurred on the sheet, while the deformation still has not reached the maximum with a thickness of 1.0 mm.
Figure 15 shows the surface morphology for an illumination length of 20 mm, and a comparison between (a) and (b) shows that when the number of scans is not more than 100, the surfaces are all relatively smooth, and Sa decreases gradually. When N = 100, Sa is 2.05 μm, and there is no obvious phenomenon such as bumps and holes, indicating no damages, and Figure 10 shows that all thicknesses of the sheets have reached the maximum deformation. It can be seen that an illumination length of 20 mm ensures maximum deformation of the sheet without damage.

5. Conclusions

In this paper, the research on the laser bending process of non-metallic components was carried out by employing a nanosecond laser system with a PVC sheet as the research object. The main factors affecting the bending effect were analyzed independently, and controlled laser bending deformation was achieved by simulation and experiment, taking the illumination length and the thickness of the sheet as the control group. The deformation mechanism is in the form of a Boltzmann curve, and the maximum deformation decreases linearly with increasing thickness while increasing linearly correlated with the illumination length. A maximum deformation of 14.27 mm was obtained when the illumination length was 20 mm and the thickness was 0.25 mm. The theory of PVC phase transition with residual stress during scanning was introduced to reveal the mechanism of the bending process, and the rate of change in the phase transition was adopted to explain the mechanism of deformation conforming to the Boltzmann function curve. Surface morphology examinations were analyzed to identify any damage to the illuminated sheets, and when the illumination length was 20 mm, the processing provided the maximum deformation without damaging the component.
The results verify the reliability of the process, making up for the shortcomings of the laser bending process for non-metallic components and providing a fundamental theoretical and empirical basis for further research in this field.

Author Contributions

F.K.: data curation, investigation, methodology, project administration, writing—original draft. H.X.: formal analysis, methodology, visualization. Y.Z.: investigation, software. K.L.: project administration, resources, supervision, writing—review and editing. J.H.: funding acquisition, writing—review and editing. All authors have read and agreed to the published version of the manuscript.

Funding

This project is supported by the Fundamental Research Funds for the Centra Universities (2232024G-14).

Institutional Review Board Statement

Not applicable.

Informed Consent Statement

Not applicable.

Data Availability Statement

Data will be made available on request.

Conflicts of Interest

The authors declare no conflicts of interest.

References

  1. Xu, L.; Pei, Y.S.; Liu, Z.; Gao, C.; Xie, P.F.; Xu, C.C.; Li, L.X. Manufacturing of curved profiles using an extrusion-bending continuous forming process. Thin Wall. Struct. 2024, 199, 111831. [Google Scholar] [CrossRef]
  2. Elyasi, M.; Talebi-Ghadikolaee, H.; Zeinolabedin-Beygi, A.; Modanloo, V.; Khatir, F.A. The effect of aging heat treatment on the formability and microstructure of the AA6063 tube in the rotary draw bending process. J. Eng. Res. 2023, 13, 283–293. [Google Scholar] [CrossRef]
  3. Hu, S.H.; Cheng, C.; El-Aty, A.A.; Zheng, S.; Wu, C.; Luo, H.R.; Guo, X.Z.; Tao, J. Forming characteristics of thin-walled tubes manufactured by free bending process-based nontangential rotation bending die. Thin Wall. Struct. 2024, 194, 111313. [Google Scholar] [CrossRef]
  4. Wang, M.Y.; Yan, M.; Yang, C.Y.; Liu, Y.; Huang, H.G. A study on the evolution mechanism of small diameter thin-walled stainless steel bellows during a bending process. Eng. Fail. Anal. 2023, 152, 107462. [Google Scholar] [CrossRef]
  5. Malekipour, E.; Sharifi, E. Effect of high-power ultrasonic vibration on the flexible bending process of thin-walled circular tubes: Numerical and experimental research. Ultrasonics 2023, 134, 107059. [Google Scholar] [CrossRef]
  6. Mendes-Fonseca, N.; Diab, M.; Kang, J.D.; Wilkinson, D.S. A comparative study on the bendability of a Dual Phase steel: Three-point bend versus V-die test. J. Mater. Res. Technol. 2025, 36, 7603–7614. [Google Scholar] [CrossRef]
  7. Safari, M.; Babaei, A.M.; Zamzami, B.; Sousa, R.A. Experimental investigation, statistical modeling and optimization of laser bending process of perforated sheets. Opt. Laser. Technol. 2024, 175, 110810. [Google Scholar] [CrossRef]
  8. Cheng, Z.H.; El-Aty, A.A.; Zhang, R.; Cheng, C.; Guo, X.Z.; Tao, J. Finite element modeling and experimental investigation on manufacturing TA18 alloy pipes via hot free bending forming technology: Forming characteristics and process optimization. J. Mater. Res. Technol. 2024, 29, 5225–5240. [Google Scholar] [CrossRef]
  9. Zhang, Z.C.; Furushima, T.; Manabe, K. Microstructure and mechanical properties evolution of 65Cu-35Zn brass tube during cyclic rotating-bending process. Trans. Nonferr. Metal. Soc. 2022, 32, 3610–3622. [Google Scholar] [CrossRef]
  10. Sharma, Y.P.; Kant, R.; Sidhu, B.S.; Yadav, R. Mechanical behaviour of mild steel during multi-scan laser bending with forced cooling. Opt. Laser. Technol. 2024, 171, 110417. [Google Scholar] [CrossRef]
  11. Khandai, B.K.; Shukla, S.; Muvvala, G. Real-time monitoring of temperature gradients and bending mechanism in multi-scan laser forming process. J. Manuf. Process. 2024, 119, 975–986. [Google Scholar] [CrossRef]
  12. Sala, S.T.; Keller, S.; Chupakhin, S.; Poltl, D.; Klusemann, B.; Kashaev, N. Effect of laser peen forming process parameters on bending and surface quality of Ti-6Al-4V sheets. J. Mater. Process. Technol. 2022, 305, 117578. [Google Scholar] [CrossRef]
  13. Baig, A.; Barse, R.; Paryekar, A.; Jagtap, V. Evolution of pharmaceuticals using 3D and 4D printing. Intell. Pharm. 2024, 2, 804–813. [Google Scholar] [CrossRef]
  14. Rahmatabadi, D.; Bayati, A.; Khajepour, M.; Mirasadi, K.; Ghasemi, I.; Baniassadi, M.; Abrinia, K.; Bodaghi, M.; Baghani, M. Poly(ethylene terephthalate) glycol/carbon black composites for 4D printing, Materials Chemistry and Physics. Mater. Chem. Phys. 2024, 325, 129737. [Google Scholar] [CrossRef]
  15. Im, S.H.; Jung, Y.; Kim, S.H. Current status and future direction of biodegradable metallic and polymeric vascular scaffolds for next-generation stents. Acta. Biomater. 2017, 60, 3–22. [Google Scholar] [CrossRef]
  16. Rahmatabadi, D.; Khajepour, M.; Bayati, A.; Mirasadi, K.; Yousefi, M.A.; Shegeft, A.; Ghasemi, I.; Baniassadi, M.; Abrinia, K.; Bodaghi, M.; et al. Advancing sustainable shape memory polymers through 4D printing of polylactic acid-polybutylene adipate terephthalate blends. Eur. Polym. J. 2024, 216, 113289. [Google Scholar] [CrossRef]
  17. Bukala, J.; Buszman, P.P.; Małachowski, J.; Mazurkiewicz, L.; Sybilski, K. Experimental tests, FEM constitutive modeling and validation of PLGA bioresorbable polymer for stent applications. Materials 2020, 13, 2003. [Google Scholar] [CrossRef]
  18. Liu, T.Z.; Liu, L.W.; Yu, M.; Li, Q.F.; Zeng, C.J.; Lan, X.; Liu, Y.J.; Leng, J.S. Integrative hinge based on shape memory polymer composites: Material, design, properties and application. Compos. Struct. 2018, 206, 164–176. [Google Scholar] [CrossRef]
  19. Kajia, M.; Bita, H.; Taifi, N.; Malaoui, A. Analytical and numerical study of rectangular reinforced concrete beam using robot structural analysis software. Mater. Today Proc. 2023; in press. [Google Scholar] [CrossRef]
  20. Zhang, Y.F.; Yang, D.Z.; Yan, P.N.; Zhou, P.W.; Zou, J.; Gu, G.Y. Inchworm inspired multimodal soft robots with crawling, climbing, and transitioning locomotion. IEEE. Trans. Robot. 2022, 38, 1806–1819. [Google Scholar] [CrossRef]
  21. Ullah, H.; Khan, R.U.; Silberschmidt, V.V. Assessing pseudo-ductile behavior of woven thermoplastic composites under tension and bending. Compos. Sci. Technol. 2024, 248, 110465. [Google Scholar] [CrossRef]
  22. Zhang, J.; Hu, J.; Su, C.; Hua, H.L. Finite element simulation of the removal mechanism and ablation morphology of HA bio-coating by nanosecond laser ablation. Opt. Laser. Technol. 2025, 180, 111448. [Google Scholar] [CrossRef]
  23. Leng, J.S.; Lan, X.; Liu, Y.J.; Du, S.Y. Shape-memory polymers and their composites: Stimulus methods and applications. Prog. Mater. Sci. 2011, 56, 1077–1135. [Google Scholar] [CrossRef]
  24. Bhattacharyya, A. Isothermal mechanical response of shape memory polymer (SMP)-based hybrid models and SMP-composites. J. Mech. Behav. Mater. 2004, 15, 1–2. [Google Scholar] [CrossRef]
  25. Reun, A.L.; Louët, V.L.; Corre, S.L.; Sobotka, V. Numerical simulation at the micro-scale for the heat transfer modelling in the thermoplastic composites laser-assisted AFP process. Compos. Part A—Appl. Sci. Manuf. 2024, 179, 108010. [Google Scholar] [CrossRef]
  26. Ran, W.G.; Zhang, Z.C.; Ma, X.L.; Sun, G.S.; Yan, T.J. A novel optical temperature sensor based on Boltzmann function in BiZn2PO6 phosphor. J. Lumin. 2023, 255, 119562. [Google Scholar] [CrossRef]
  27. Flayyih, A.H.; Al-Khursan, A.H. Theory of four-wave mixing in quantum dot semiconductor optical amplifiers. J. Phys. D Appl. Phys. 2013, 46, 445102. [Google Scholar] [CrossRef]
  28. Obilor, A.F.; Pacella, M.; Wilson, A.; Silberschmidt, V.V. Micro-texturing of polymer surfaces using lasers: A review. Int. J. Adv. Manuf. Technol. 2022, 120, 103–135. [Google Scholar] [CrossRef]
Figure 1. Experimental methodology: (a) laser system; (b) laser scanning path planning (d: track spacing, w: sheet width, L: irradiation length, v: spot travelling speed).
Coatings 15 00609 g001
Figure 2. Photographs of laser application results with gradient processing distance.
Coatings 15 00609 g002
Figure 3. Photographs of experiment results for gradient spacing.
Coatings 15 00609 g003
Figure 4. Photographs of scanning speed gradient test results.
Coatings 15 00609 g004
Figure 5. Maximum deformation state.
Coatings 15 00609 g005
Figure 6. Schematic diagram of the deformation volume.
Coatings 15 00609 g006
Figure 7. Deformation–thickness curve calculated by simulation.
Coatings 15 00609 g007
Figure 8. Photographs of laser application experiments.
Coatings 15 00609 g008
Figure 9. Photographs of application experiment results (units: mm).
Coatings 15 00609 g009
Figure 10. Deformation curves: (a) N–B curve for illumination length of 10 mm. (b) N–B curve for illumination length of 20 mm. (c) Thickness-deformation curves.
Coatings 15 00609 g010
Figure 11. Schematic diagram of frozen and active phases of PVC materials.
Coatings 15 00609 g011
Figure 12. Schematic diagram of the transformation of the frozen phase into the active phase under the influence of laser.
Coatings 15 00609 g012
Figure 13. N–B fitting curves: (a) L = 10 mm; (b) L = 20 mm.
Coatings 15 00609 g013
Figure 14. Surface morphology scanned N times with illumination length of 10 mm: (a) N = 0 (b) N = 50 (c) N = 79.
Coatings 15 00609 g014
Figure 15. Surface morphology scanned N times with illumination length of 20 mm: (a) N = 50 (b) N = 100.
Coatings 15 00609 g015
Table 1. Laser system parameters.
Rated power20 WPulse energy0.4 mJ
Pulse width50 nsPeak power7.5 kW
Wavelength475 nmPeak intensity7.8 × 108 W/cm2
Frequency range20~50 kHzLaser flux41.6 J/cm2
Spot diameter50 μm
Table 2. Experimental parameters.
ParametersApplication Distance DScanning Path Spacing dSheet Width wIllumination Length lScanning Speed v
Value35 mm0.25 mm5 mm10 mm and 20 mm2000 mm/s
Disclaimer/Publisher’s Note: The statements, opinions and data contained in all publications are solely those of the individual author(s) and contributor(s) and not of MDPI and/or the editor(s). MDPI and/or the editor(s) disclaim responsibility for any injury to people or property resulting from any ideas, methods, instructions or products referred to in the content.

