3.2. Morphology of Welding Layer
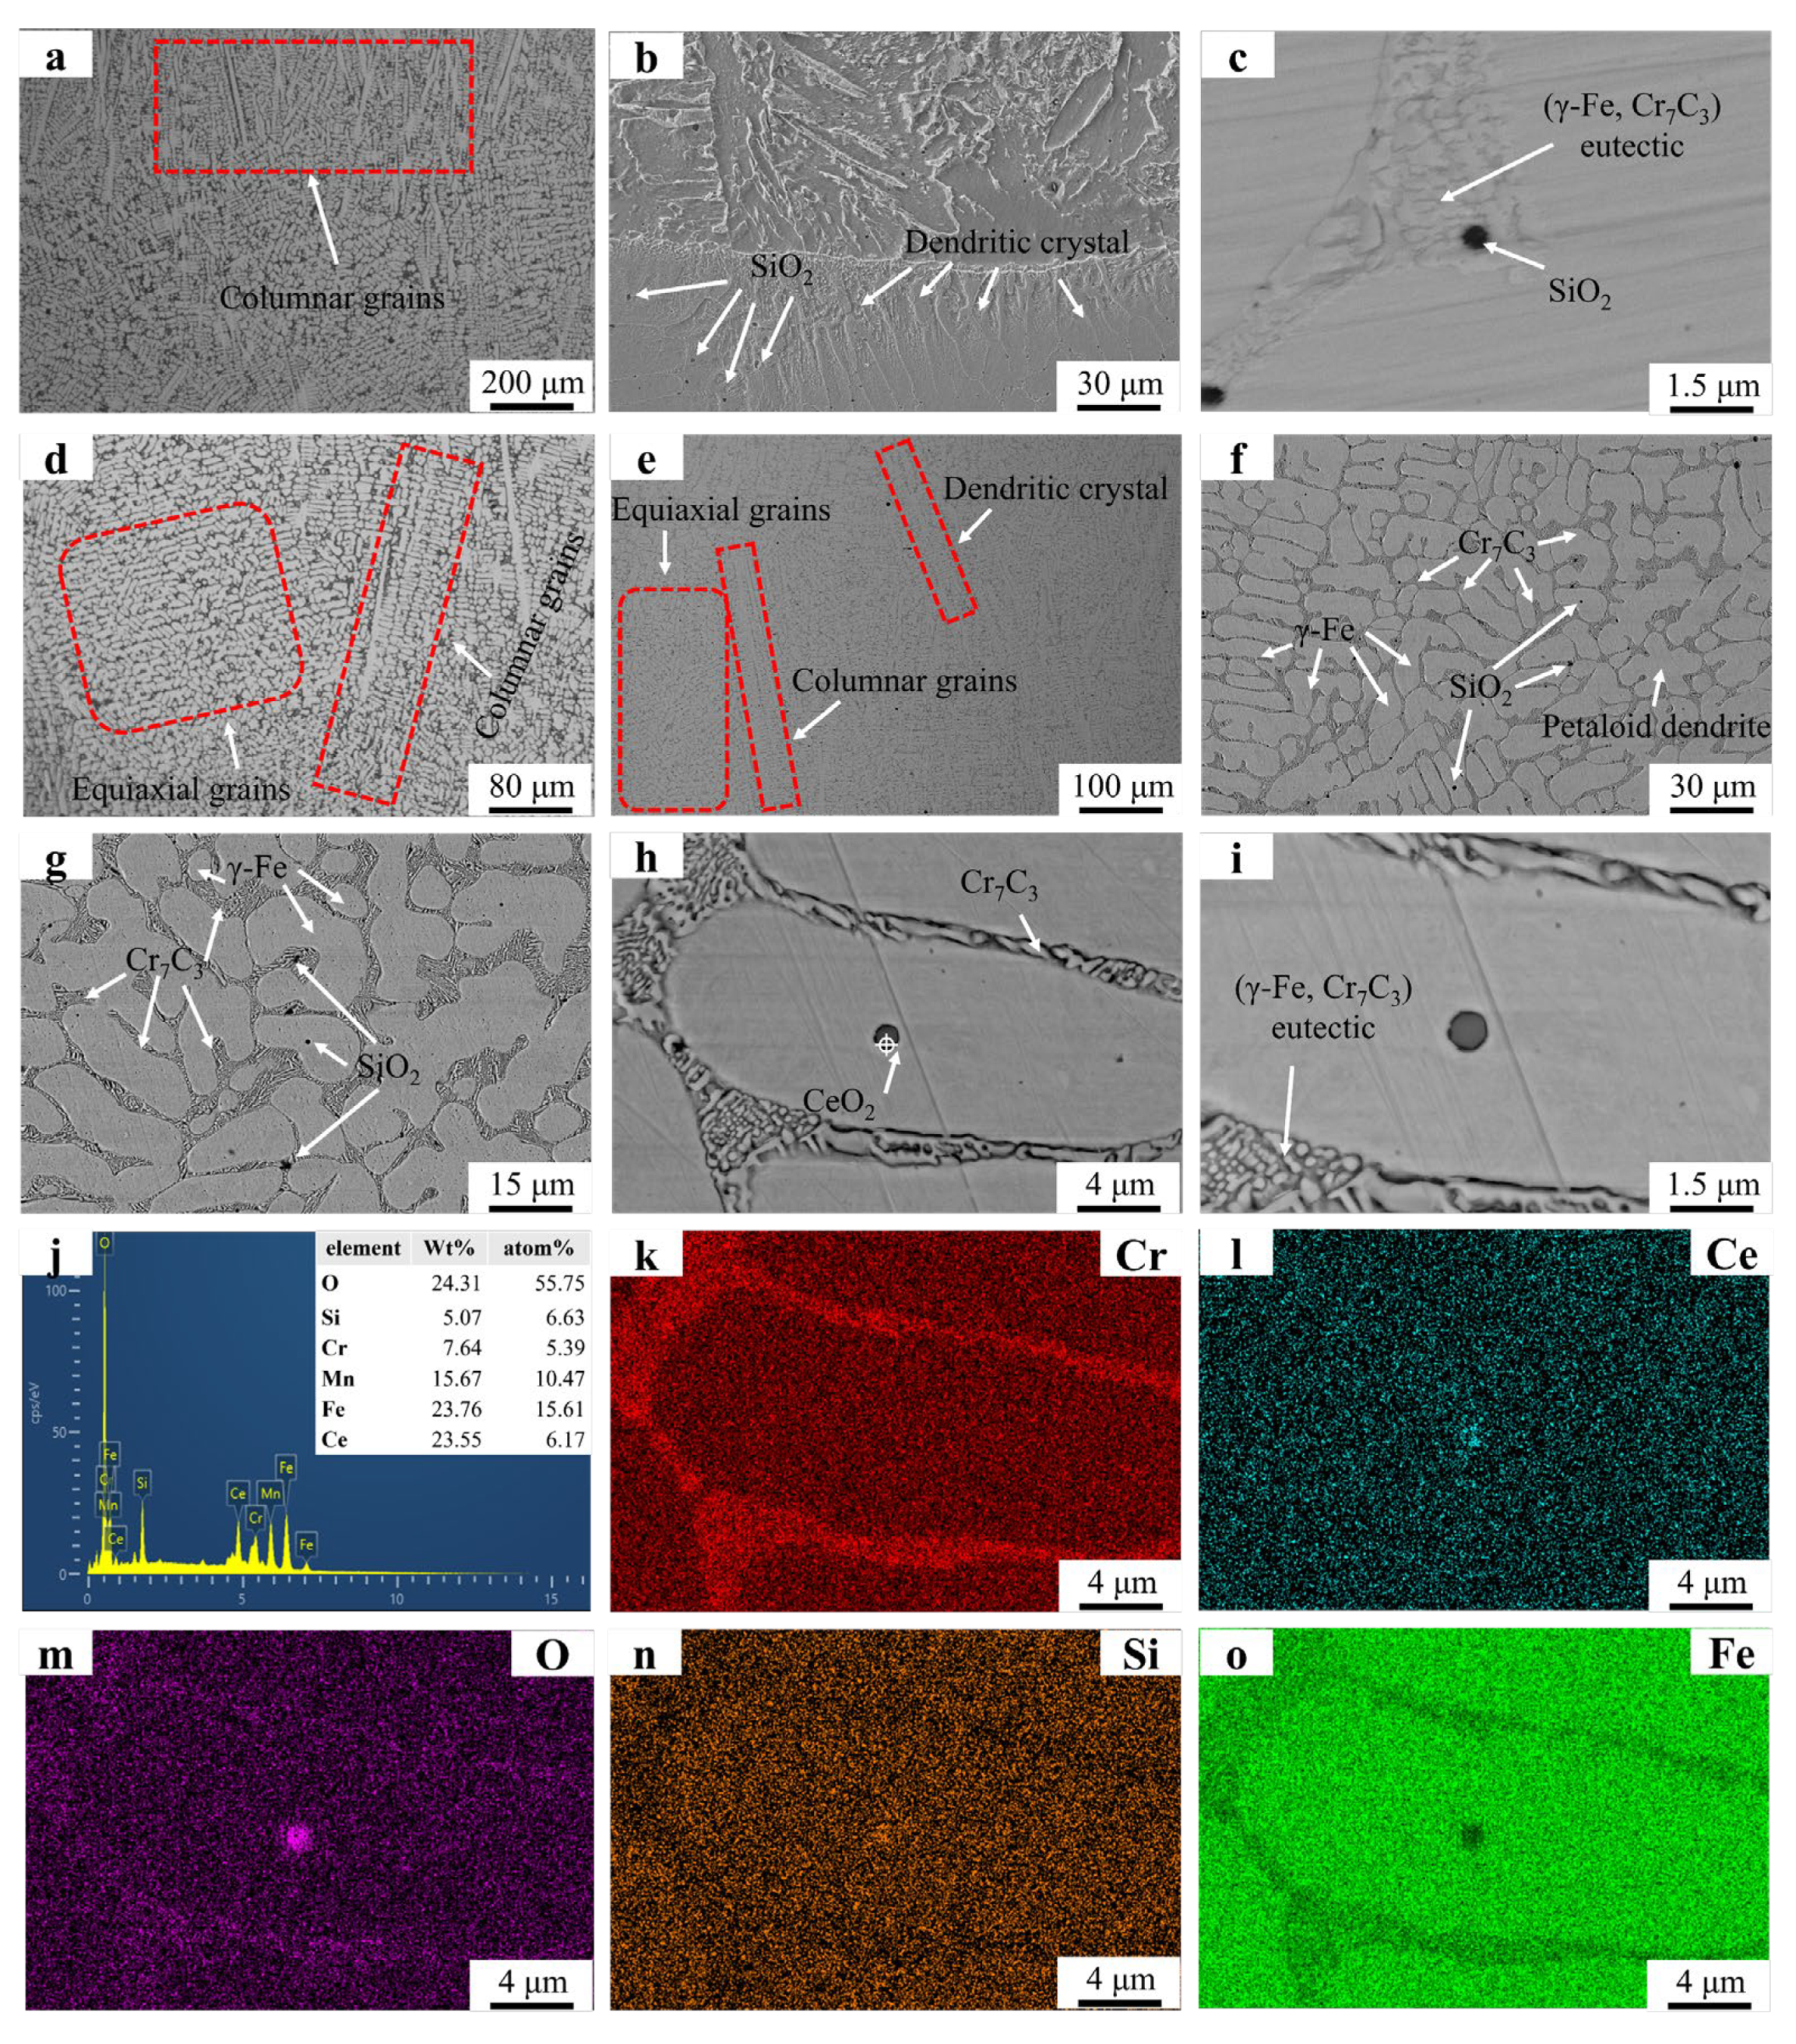
Figure 3 presents the microstructural morphology and EDS mapping results of the FC2 and Fe55 samples.
Figure 3a shows the coexistence of columnar grains and irregular equiaxed grains in specific regions. The irregular shape of these equiaxed grains suggests they likely formed through partial coalescence of columnar grains before complete solidification, resulting in incomplete equiaxed grain formation.
Figure 3b reveals a predominantly dendritic structure near the substrate–coating interface. The extensive merging of columnar grains during solidification limits the observable columnar grains in this region. The petaloid grains in
Figure 3 originated from the coalescence of columnar grains rather than the expansion of equiaxed grains. SiO
2 particles are distributed at both grain boundaries and grain interiors. Low-melting-point SiO
2 precipitated after Cr
7C
3 formation, with Cr
7C
3 acting as nucleation sites for SiO
2. In grain interiors, SiO
2 particles solidified spontaneously due to the absence of nucleation sites, leading to higher SiO
2 amount at grain boundaries. Cr
7C
3 carbides within the eutectic structure exhibit significant refinement in size compared to those in Fe55. However, the overall eutectic structure dimensions in FC2 are larger than in Fe55, indicating distinct structural differences.
Figure 3g confirms CeO
2 enrichment in specific regions.
Figure 3h–j (EDS mapping of
Figure 3e) show O signal clusters in CeO
2-rich zones and weak O signals near eutectic structures, suggesting trace CeO
2 act as the nucleation sites during solidification.
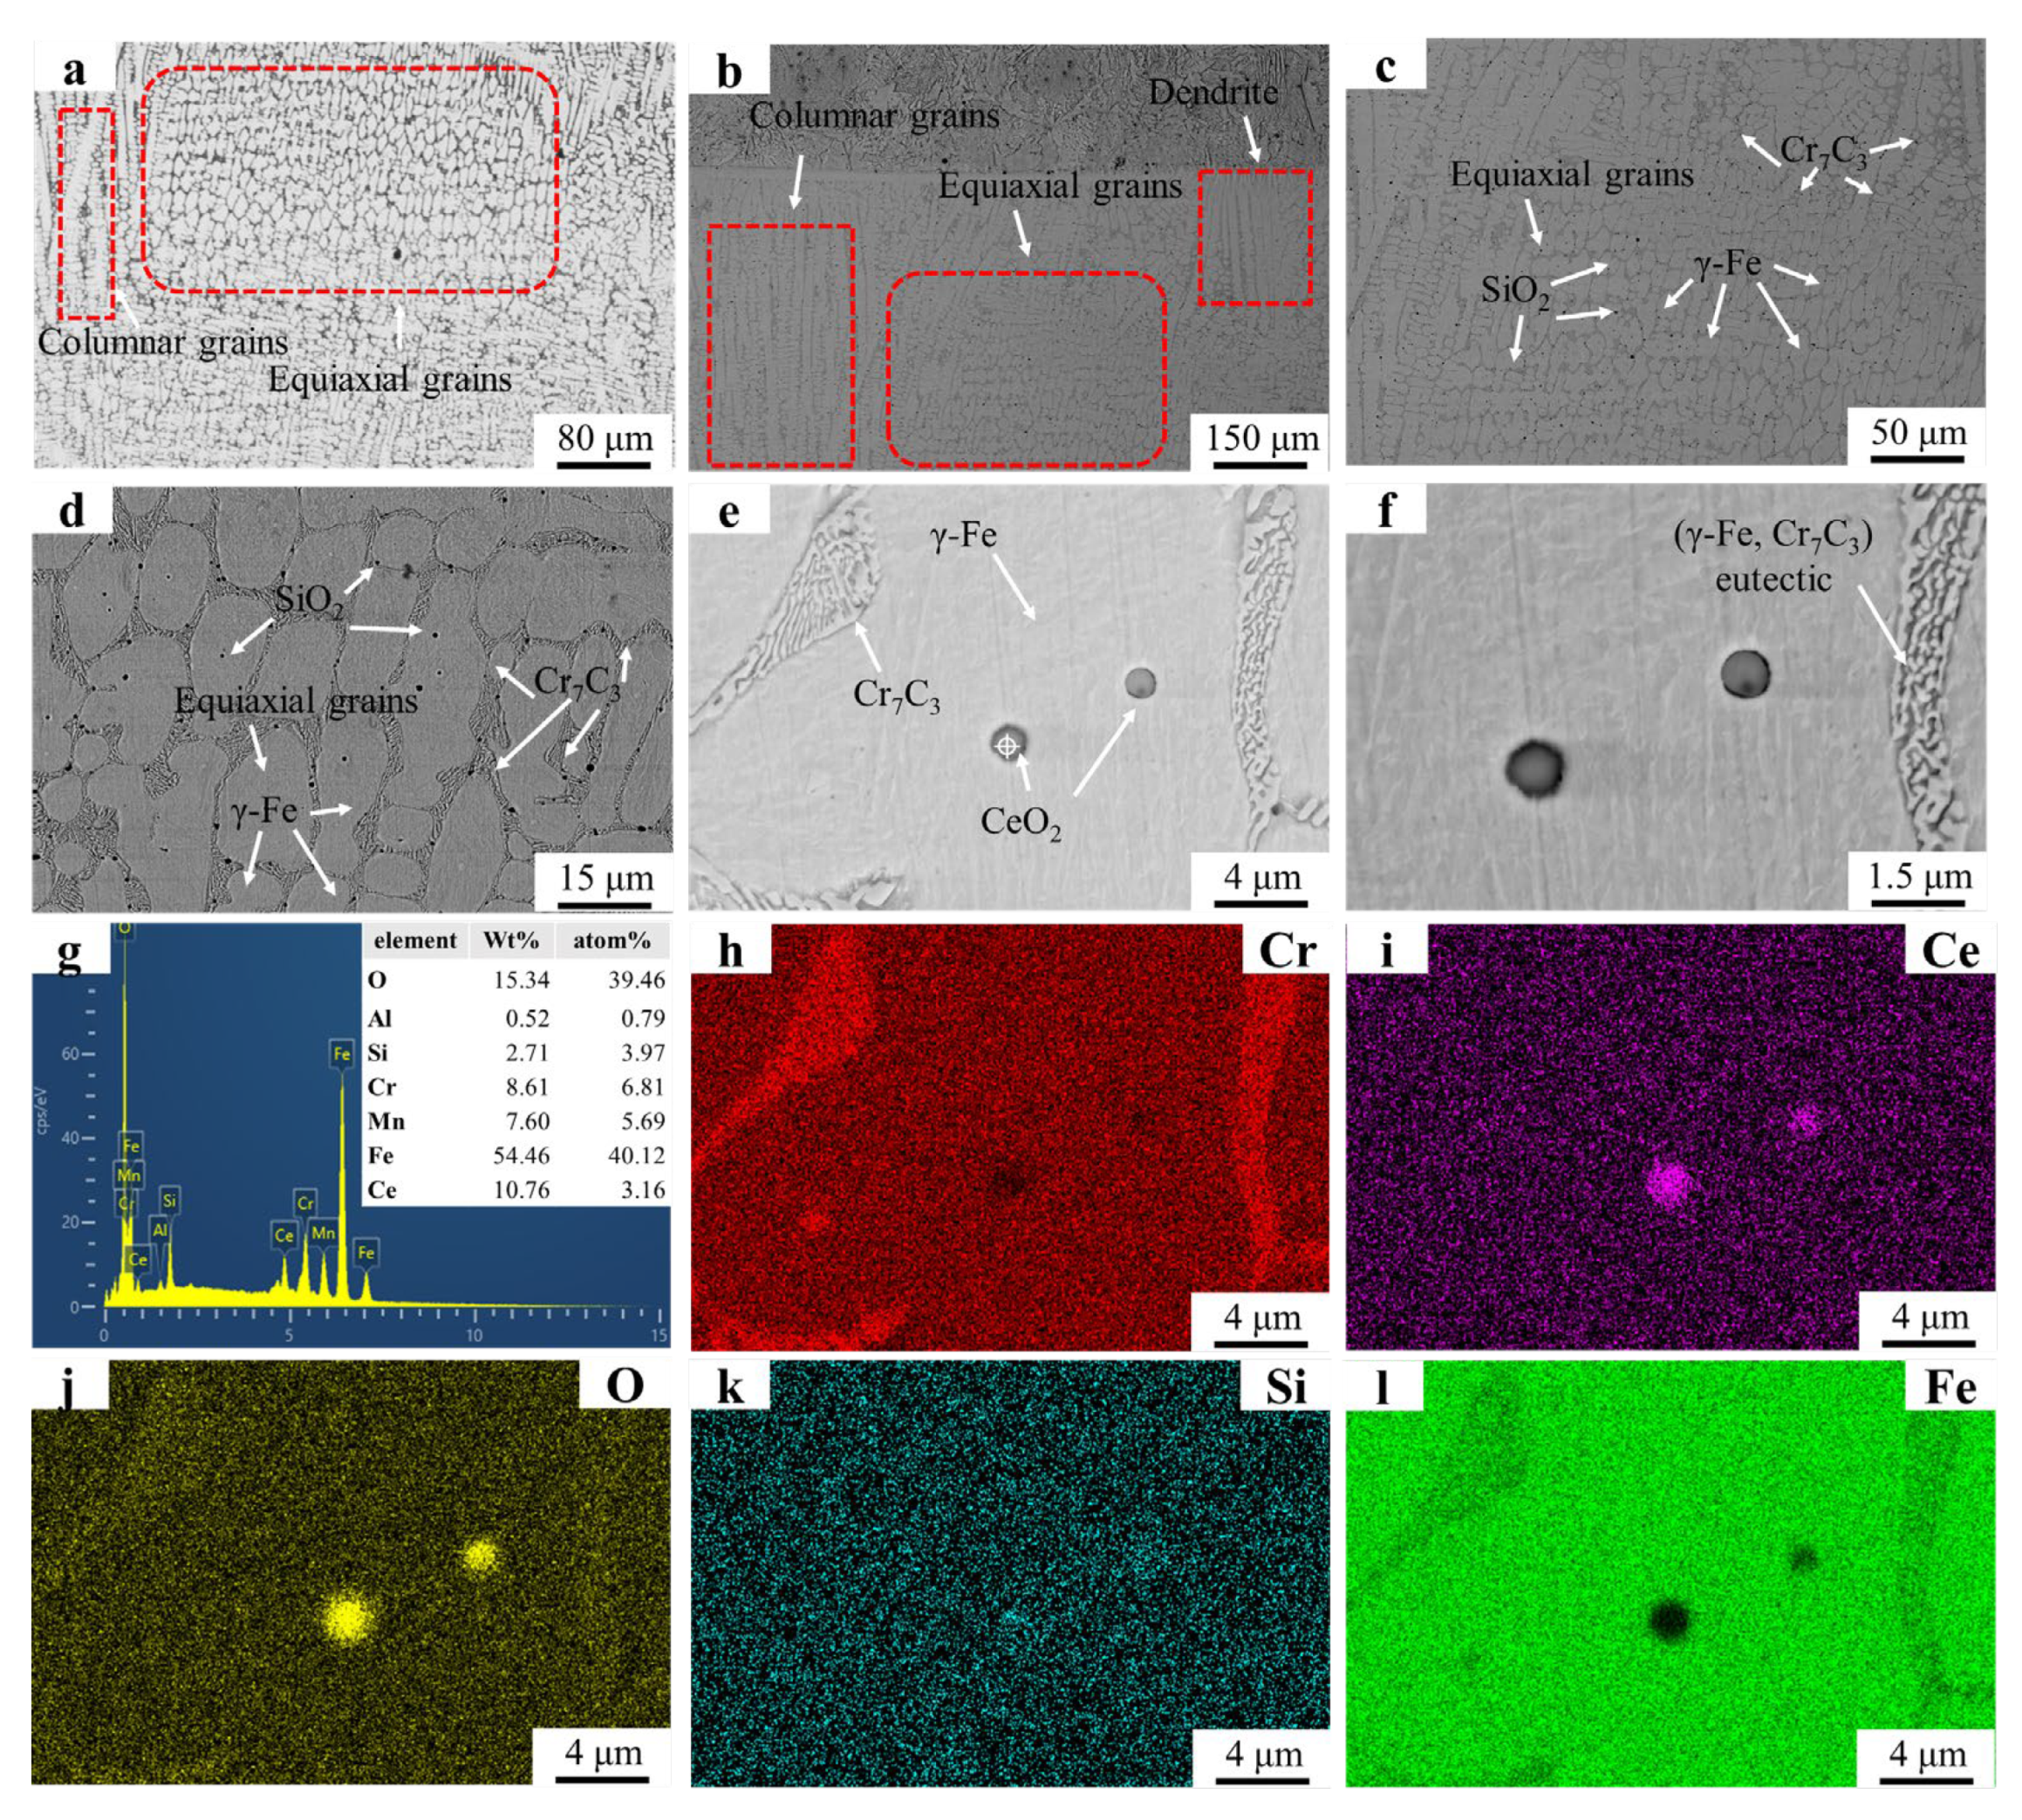
Figure 4 displays the microstructural morphology and EDS mapping results of the FC4 sample. The columnar grain coalescence has led to the formation of equiaxed grains were observed in
Figure 4a, which are larger in size compared to those observed in
Figure 4a. The elongated morphology of these equiaxed grains along the temperature gradient direction aligns with the grain boundary drag effects reported in prior studies [
28].
Figure 4b shows areas where columnar grains remain unmerged, suggesting lower CeO
2 content in these regions compared to equiaxed grain-dominated zones.
Figure 4c,d demonstrate an increased density of SiO
2 particles relative to the FC2 sample. SiO
2 is distributed not only at grain boundaries but also extensively within grain interiors.
Figure 4g confirms localized CeO
2 enrichment in the region shown in
Figure 4e.
Figure 4h–j (EDS mapping of
Figure 4e) exhibit overlapping signals of O, Si, and Ce in CeO
2-rich zones, indicating that SiO
2 particles may utilize CeO
2 as nucleation sites during solidification. Cr
7C
3 carbides within the eutectic structure retain their refined characteristics. However, the increase in grains amount disperses eutectic structures along grain boundaries, resulting in a smaller eutectic structure compared to FC2.
Based on the aforementioned findings, it is reasonable to conclude that the addition of CeO2 promotes the coalescence of columnar grains into equiaxed grains. Increased CeO2 content further enhances equiaxed grain growth. However, the grain boundary drag effect induced by CeO2 in molten steel may account for the elongation of equiaxed grains along thermal gradients.
CeO2 facilitates both the coarsening of eutectic structures and the dispersion of Cr7C3 carbides. Concurrently, the increase in grain amounts due to equiaxed grain growth leads to reduced eutectic structure dimensions. Consequently, an optimal CeO2 concentration effectively suppresses columnar grain development and promotes their transition to equiaxed morphology. Nevertheless, excessive CeO2 additions may exacerbate grain boundary drag effects and result in inhomogeneous Ce distribution, ultimately degrading microstructural uniformity.
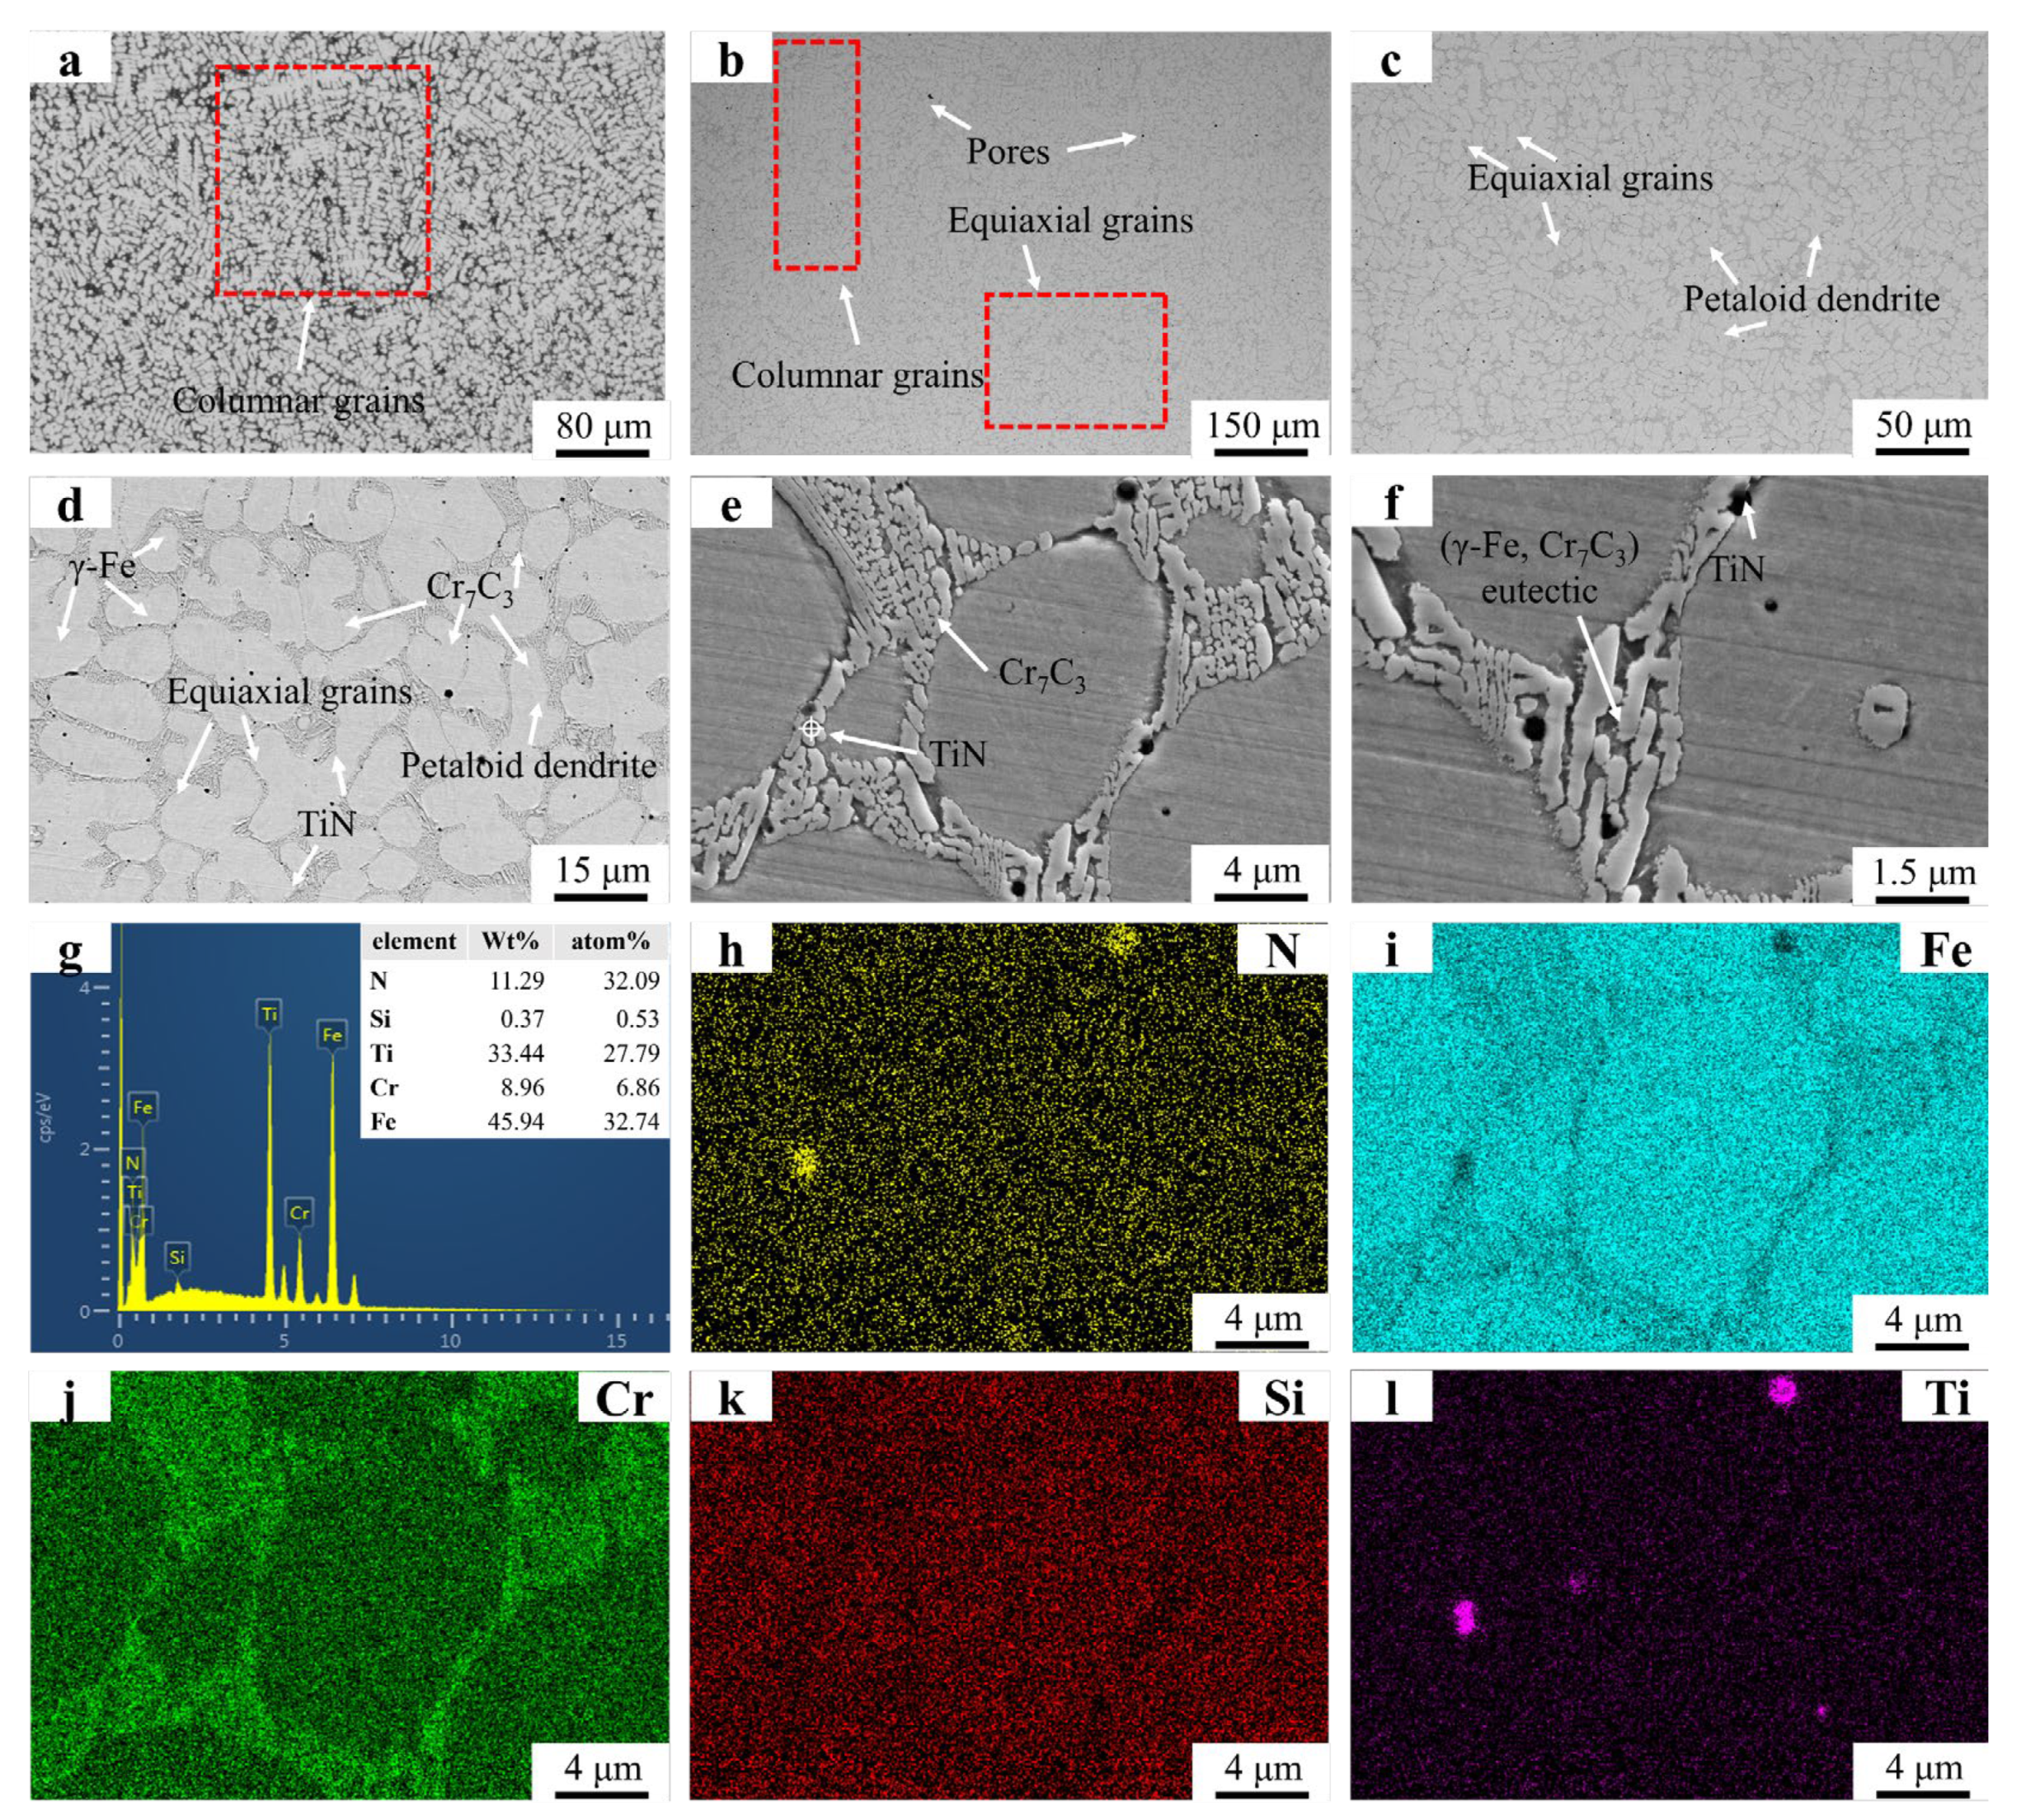
Figure 5 presents the microstructural morphology and EDS mapping results of the FT1 sample.
Figure 5a shows the absence of dendritic structures, with a notable reduction in columnar grain size, indicating TiN’s significant inhibitory effect on columnar grain growth.
Figure 5b reveals the presence of pores, likely caused by N
2 gas release from partial decomposition of TiN particles [
29]. Although TiN’s melting point exceeds the molten pool temperature, smaller TiN particles may still undergo decomposition.
Figure 5c,d exhibit equiaxed grains and petaloid grains. No TiN particles are observed within the petaloid grains. The addition of TiN promotes equiaxed grain nucleation. When the equiaxed grain density reaches a critical threshold and TiN particles no longer impede growth, these grains spontaneously coalesce into petaloid configurations to minimize grain boundary energy.
Figure 5g (EDS of the particle in
Figure 5e) confirms the presence of TiN within eutectic structures.
Figure 5 h–j (EDS mapping of
Figure 5e) show limited Ti signal enrichment due to the low concentration and fine size of precipitated TiN particles.
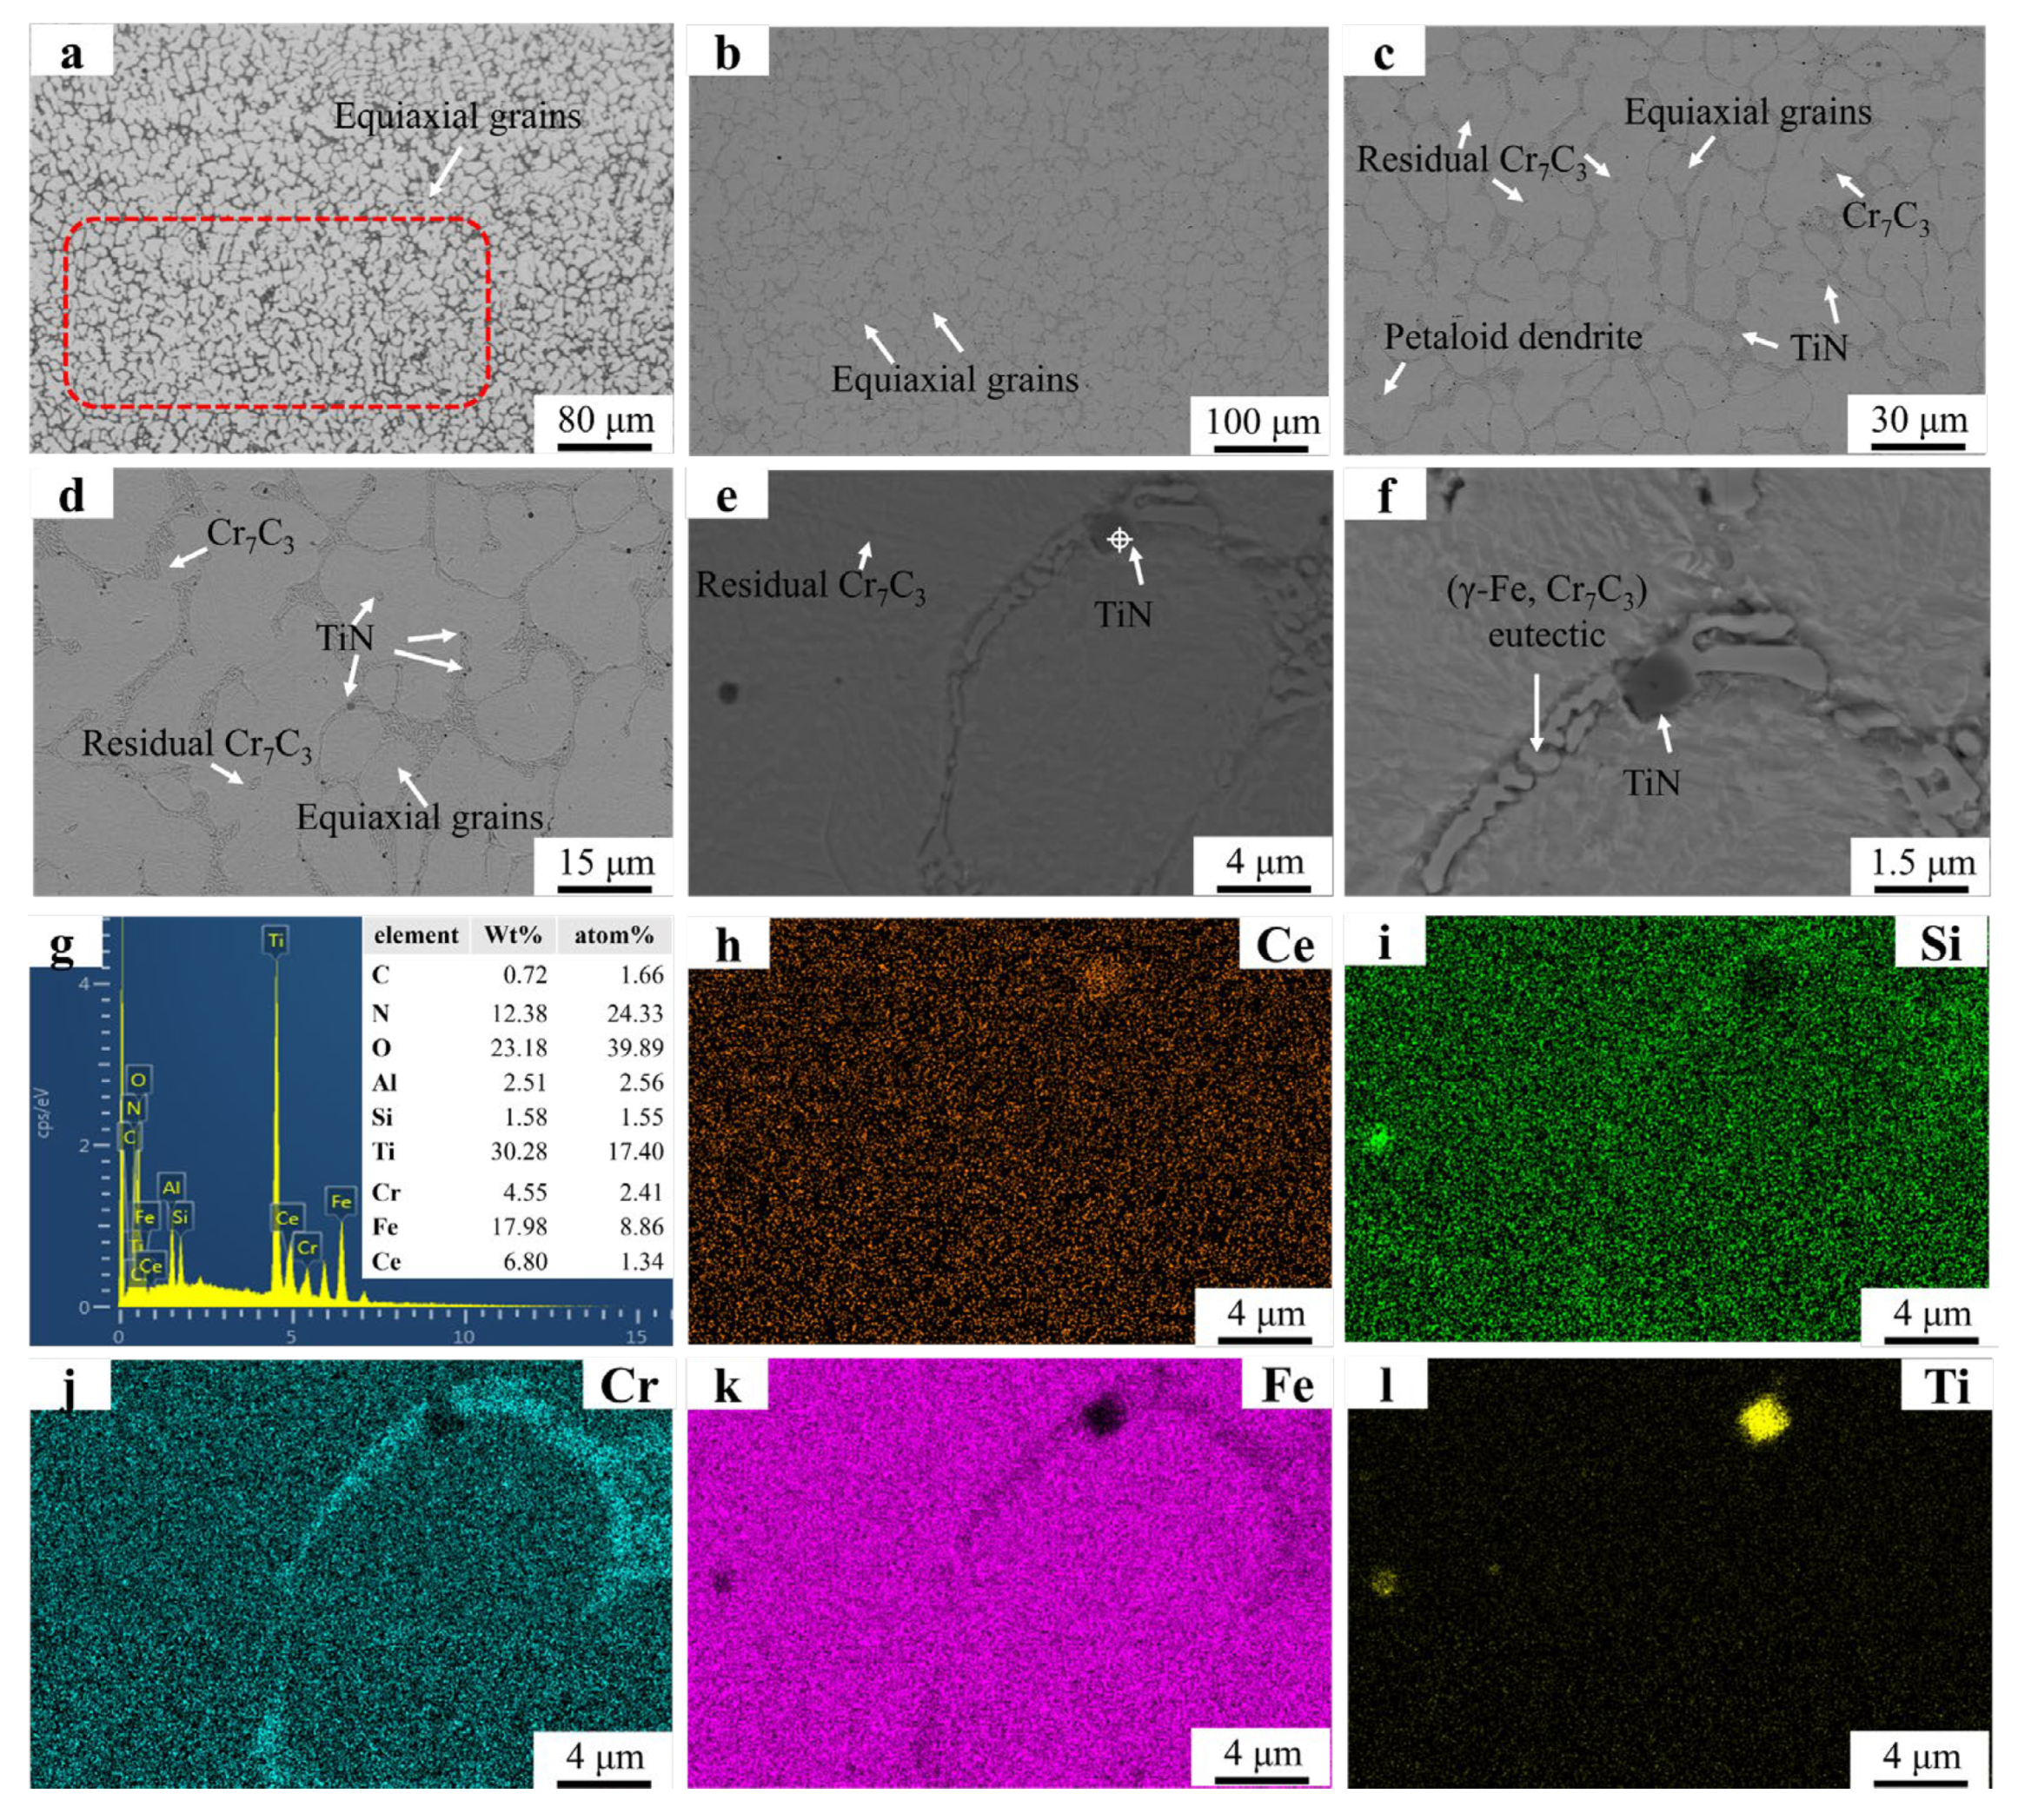
Figure 6 presents the microstructural morphology and EDS mapping results of the FT2 sample.
Figure 6a reveals a microstructure dominated by equiaxed grains, with residual dendritic structures observed near the substrate–coating interface. This contrasts with the FT1 sample, where partially suppressed dendritic remnants persist in the mid-coating region. The complete absence of dendrites in the central zone of FT2 highlights the enhanced inhibitory effect of increased TiN addition on dendritic growth.
Figure 6b,c display petaloid grains, whose formation mechanism aligns with observations in the FT1 sample and parallels findings reported in prior studies. TiN particles in
Figure 6e exhibit significantly larger dimensions compared to those in
Figure 6e. The elevated TiN content increases [Ti] and [N] concentrations in the molten pool, promoting the growth of precipitated TiN during solidification. As demonstrated in previous studies, coarsened precipitates exert stronger grain boundary drag effects, explaining the increased equiaxed grain amount with higher TiN addition. Overlapping Ti and N signals in the EDS maps confirm TiN predominantly distributes along grain boundaries, where it pins boundaries to facilitate equiaxed grain formation. In regions devoid of TiN particles, unimpeded grain boundary migration enables petaloid grain development through spontaneous coalescence.
These results indicate that TiN primarily contributes to grain refinement by providing additional nucleation sites, resulting in an increased number of grains and grain boundaries [
30]. As the quantity of grain boundaries increases, the Cr
7C
3 within the eutectic structure, serving as a constituent of grain boundaries, diminishes in size to accommodate the formation of additional boundaries. Furthermore, TiN also acts as nucleation sites for Cr
7C
3 in the eutectic structure, thereby promoting grain boundary formation. However, when the TiN addition level is low, dendritic growth remains not fully suppressed, leading to the observed substantial residual dendrites in the figure. When the TiN content increases to 2%, the precipitated TiN particles exhibit enlarged dimensions, which enhances their grain boundary inhibition effectiveness and consequently reduces dendritic formation.
The experimental findings demonstrate that with 0.02% CeO2 addition, dendritic coalescence in the welding layer is promoted. However, when the CeO2 content elevates to 0.04%, although equiaxed grains emerge, significant grain boundary dragging effects become apparent and lead to grain expansion. The co-addition of CeO2 and TiN may potentially induce unnecessary grain expansion, thus the optimal CeO2 content is determined as 0.02% to achieve a structurally homogeneous welding layer. Concurrently, when TiN addition reaches 2%, effective suppression of dendritic growth is observed, thereby establishing 2% as the optimal TiN addition level.
The microstructure and EDS mapping results of the FC2T2 sample are illustrated in
Figure 7. In
Figure 7a, only a small number of dendrites are observed near the substrate region. These dendritic formations are difficult to avoid due to the significant temperature gradient between the substrate and the welding layer.
Figure 7b,c reveal the presence of petaloid grains and equiaxed grains, whose formation mechanisms align with those described earlier. In
Figure 7d, residual eutectic structures are observed at the centers of the petaloid grains. The grain boundary dragging effect induced by CeO
2 prevents complete contraction of the grain boundaries formed during the coalescence of equiaxed grains, resulting in spherical remnants of these boundaries under surface tension.
Figure 7e,f demonstrate the distribution of TiN particles within the grains and along grain boundaries. Notably, the TiN particles exhibit significantly smaller dimensions compared to those in the FT2 sample, indicating that CeO
2 addition promotes both spheroidization and dispersion of TiN particles. This enhanced distribution enables the precipitated TiN to generate more nucleation sites and grain boundary pinning points, consistent with previous reports. These mechanisms collectively explain why the FC2T2 sample exhibits markedly superior dendritic suppression compared to the FT2 sample.
The above study has identified the FC2T2 sample as possessing the most uniform microstructure. To further determine the influence of the co-addition of CeO
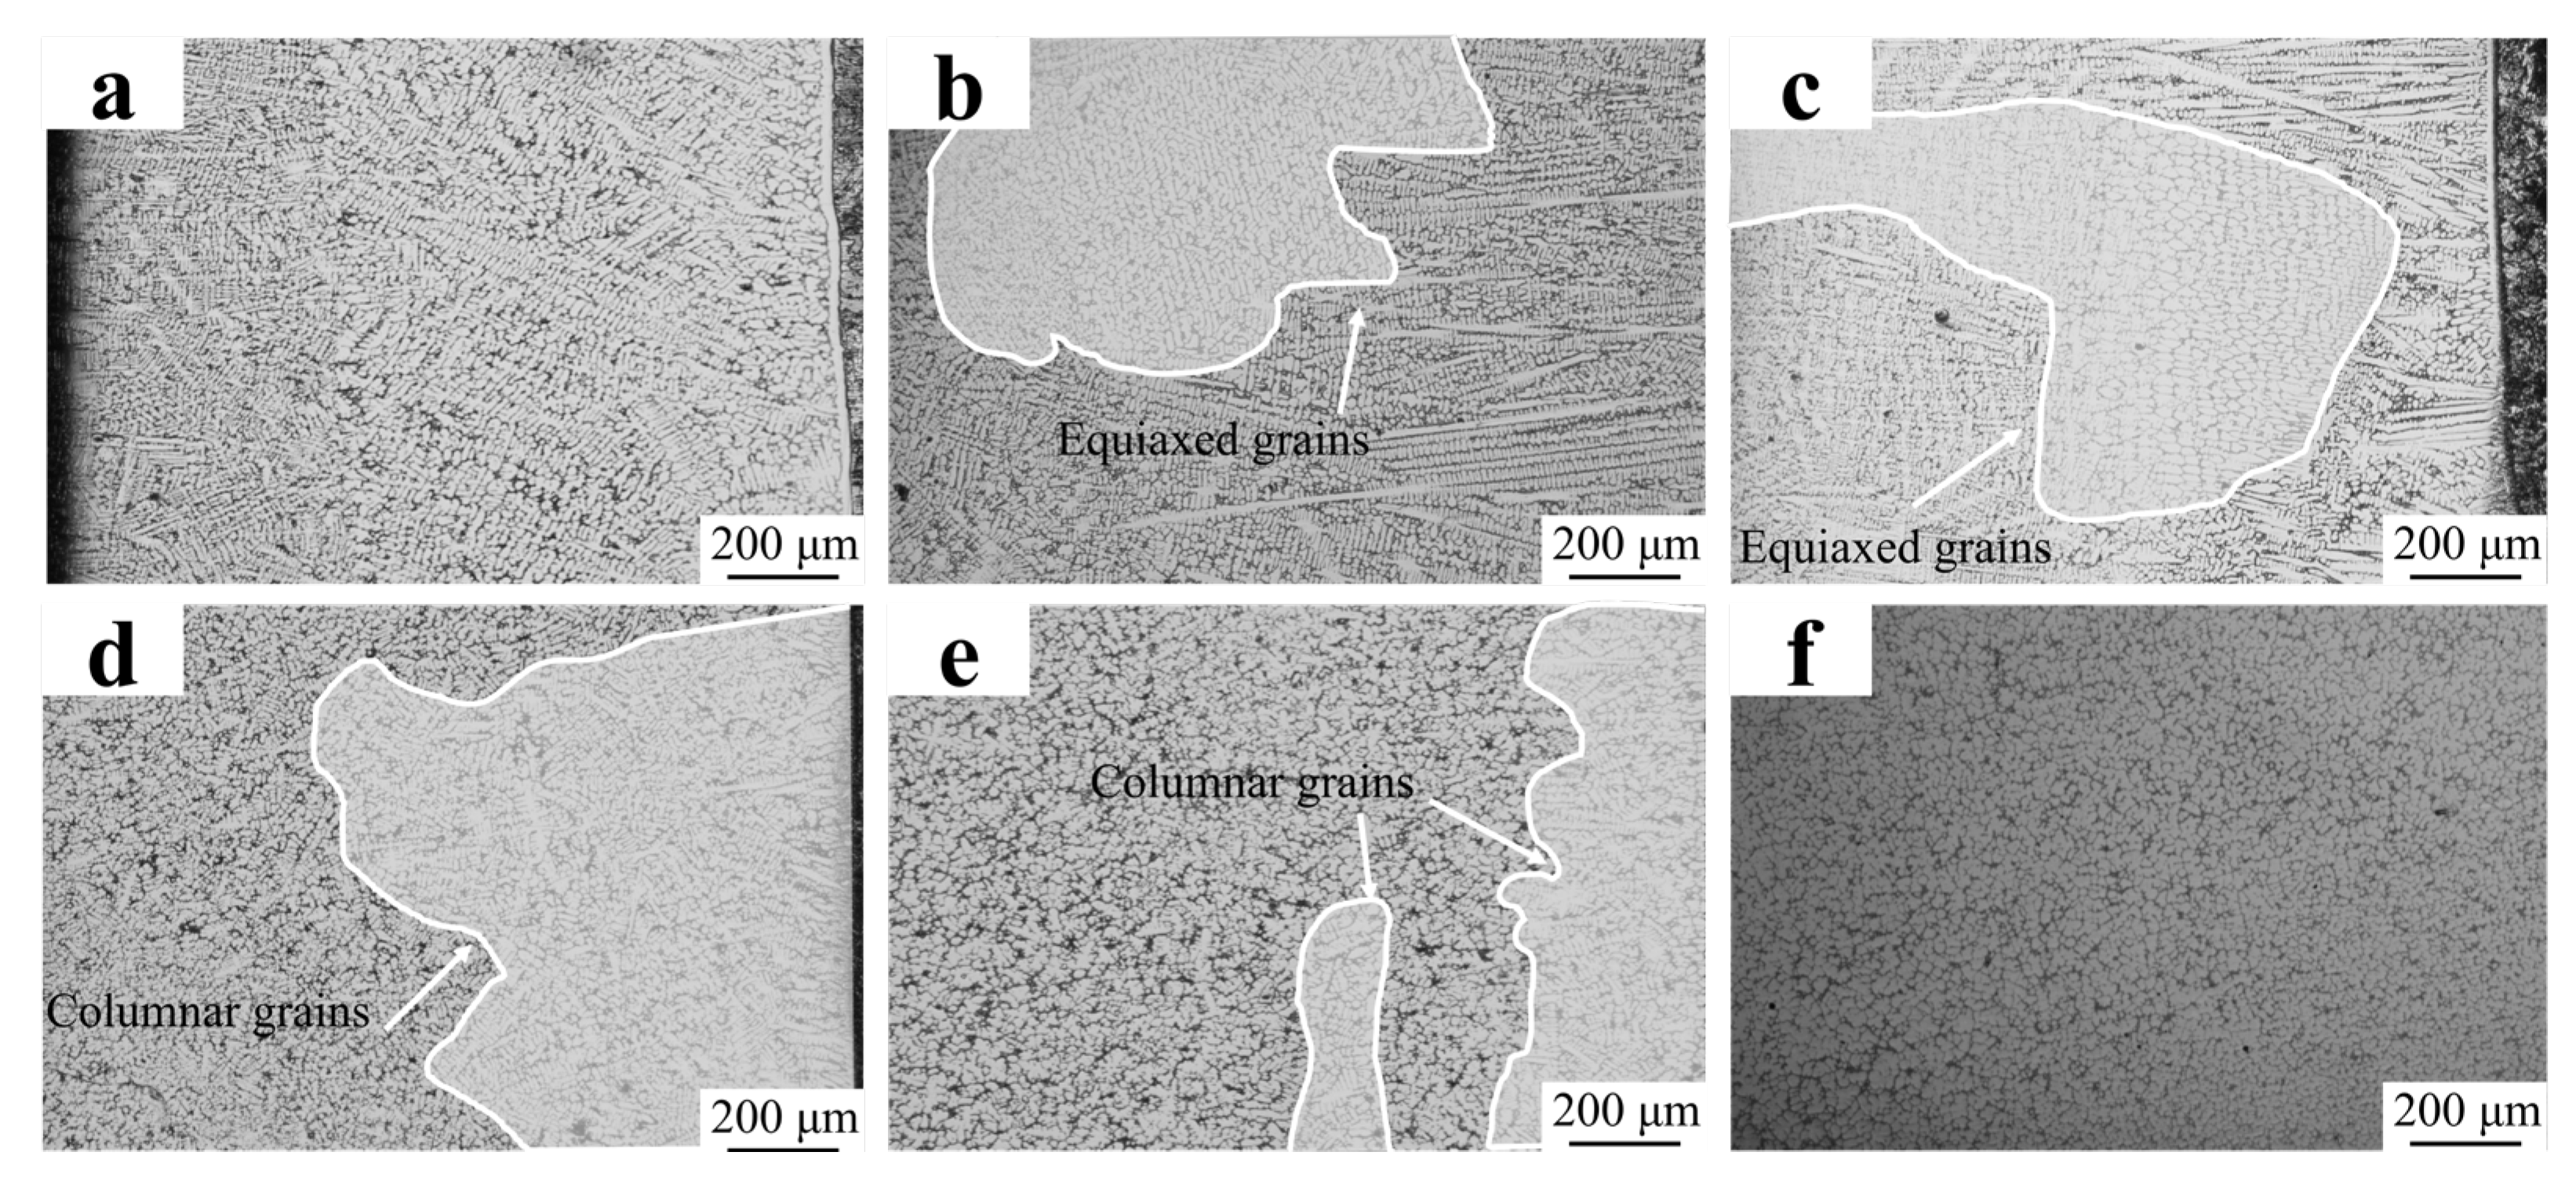
2 and TiN on the equiaxed/columnar grain ratio, low-magnification optical microscopy (OM) images were obtained to statistically quantify this ratio across different compositional conditions, as shown in
Figure 8. The equiaxed/columnar grain ratio(
Table 3) was quantified using ImageJ(1.8.0) software. As shown in
Figure 8a, columnar grains accounted for 100%, indicating that the columnar grain growth in the Fe55 welding layer was not inhibited during solidification. The fine columnar grains observed at the top of the welding layer originated from air convection caused by the protective gas, which stirred the molten steel and increased the nucleation rate.
At a CeO2 addition of 0.02%, the proportion of columnar grains decreased slightly to approximately 81.38%. However, the subgrain size within the columnar grains was significantly reduced, dropping from 45 μm in the Fe55 sample to approximately 20 μm. Concurrently, some columnar grain boundaries fused and began to transition toward equiaxed grain formation. Despite these structural adjustments, the microstructure of the welding layer remained highly non-uniform at this stage.
At a CeO2 addition of 0.04%, the columnar grain proportion dropped to 64.23%, marking a significant reduction. Concurrently, prominent grain drag phenomena were observed in the equiaxed region, confirming the manifestation of the grain boundary drag effect. The equiaxed grains reached approximately 60 μm in size, significantly larger than those of the FC2 sample. Near the equiaxed region, merging columnar grains were observed, though their grain size exceeded that of the FC2 sample’s grains.
The results depicted in
Figure 8d reveal that the columnar grain proportion in the FT1 sample decreased to 51.08%, with an average grain size of 32.5 μm. Residual columnar grains were observed at the top and bottom of the welding layer, attributed to insufficient TiN particle addition, which limited nucleation sites required for equiaxed grain formation. As shown in
Figure 8e, increasing the TiN addition to 2% further reduced the columnar grain proportion to 27.48%, with equiaxed grains averaging approximately 27.6 μm in size. The notable reduction in columnar grain count and grain size can be attributed to the increase in nucleation sites provided by increased TiN content, which simultaneously suppressed grain coarsening. However, residual columnar grains remained identifiable in the microstructure. Notably, the columnar regions in both FT1 and FT2 samples are predominantly localized at the bottom, where elevated superheat levels impeded TiN precipitation, thereby limiting its grain-refining effect.
The results depicted in
Figure 8e indicate that the FC2T2 sample exhibited a non- columnar grain structure and the smallest equiaxed grain size (20.32 μm). The disappearance in columnar equiaxed grains at the bottom can be attributed to the combined effects of CeO
2 addition and TiN precipitation mechanisms. Specifically, CeO
2 promoted the formation of composite inclusions with TiN, thereby enhancing TiN precipitation at high temperature, which forced the residual columnar grains to transform into equiaxed grains—a phenomenon consistent with the findings of Chen et al. [
31].
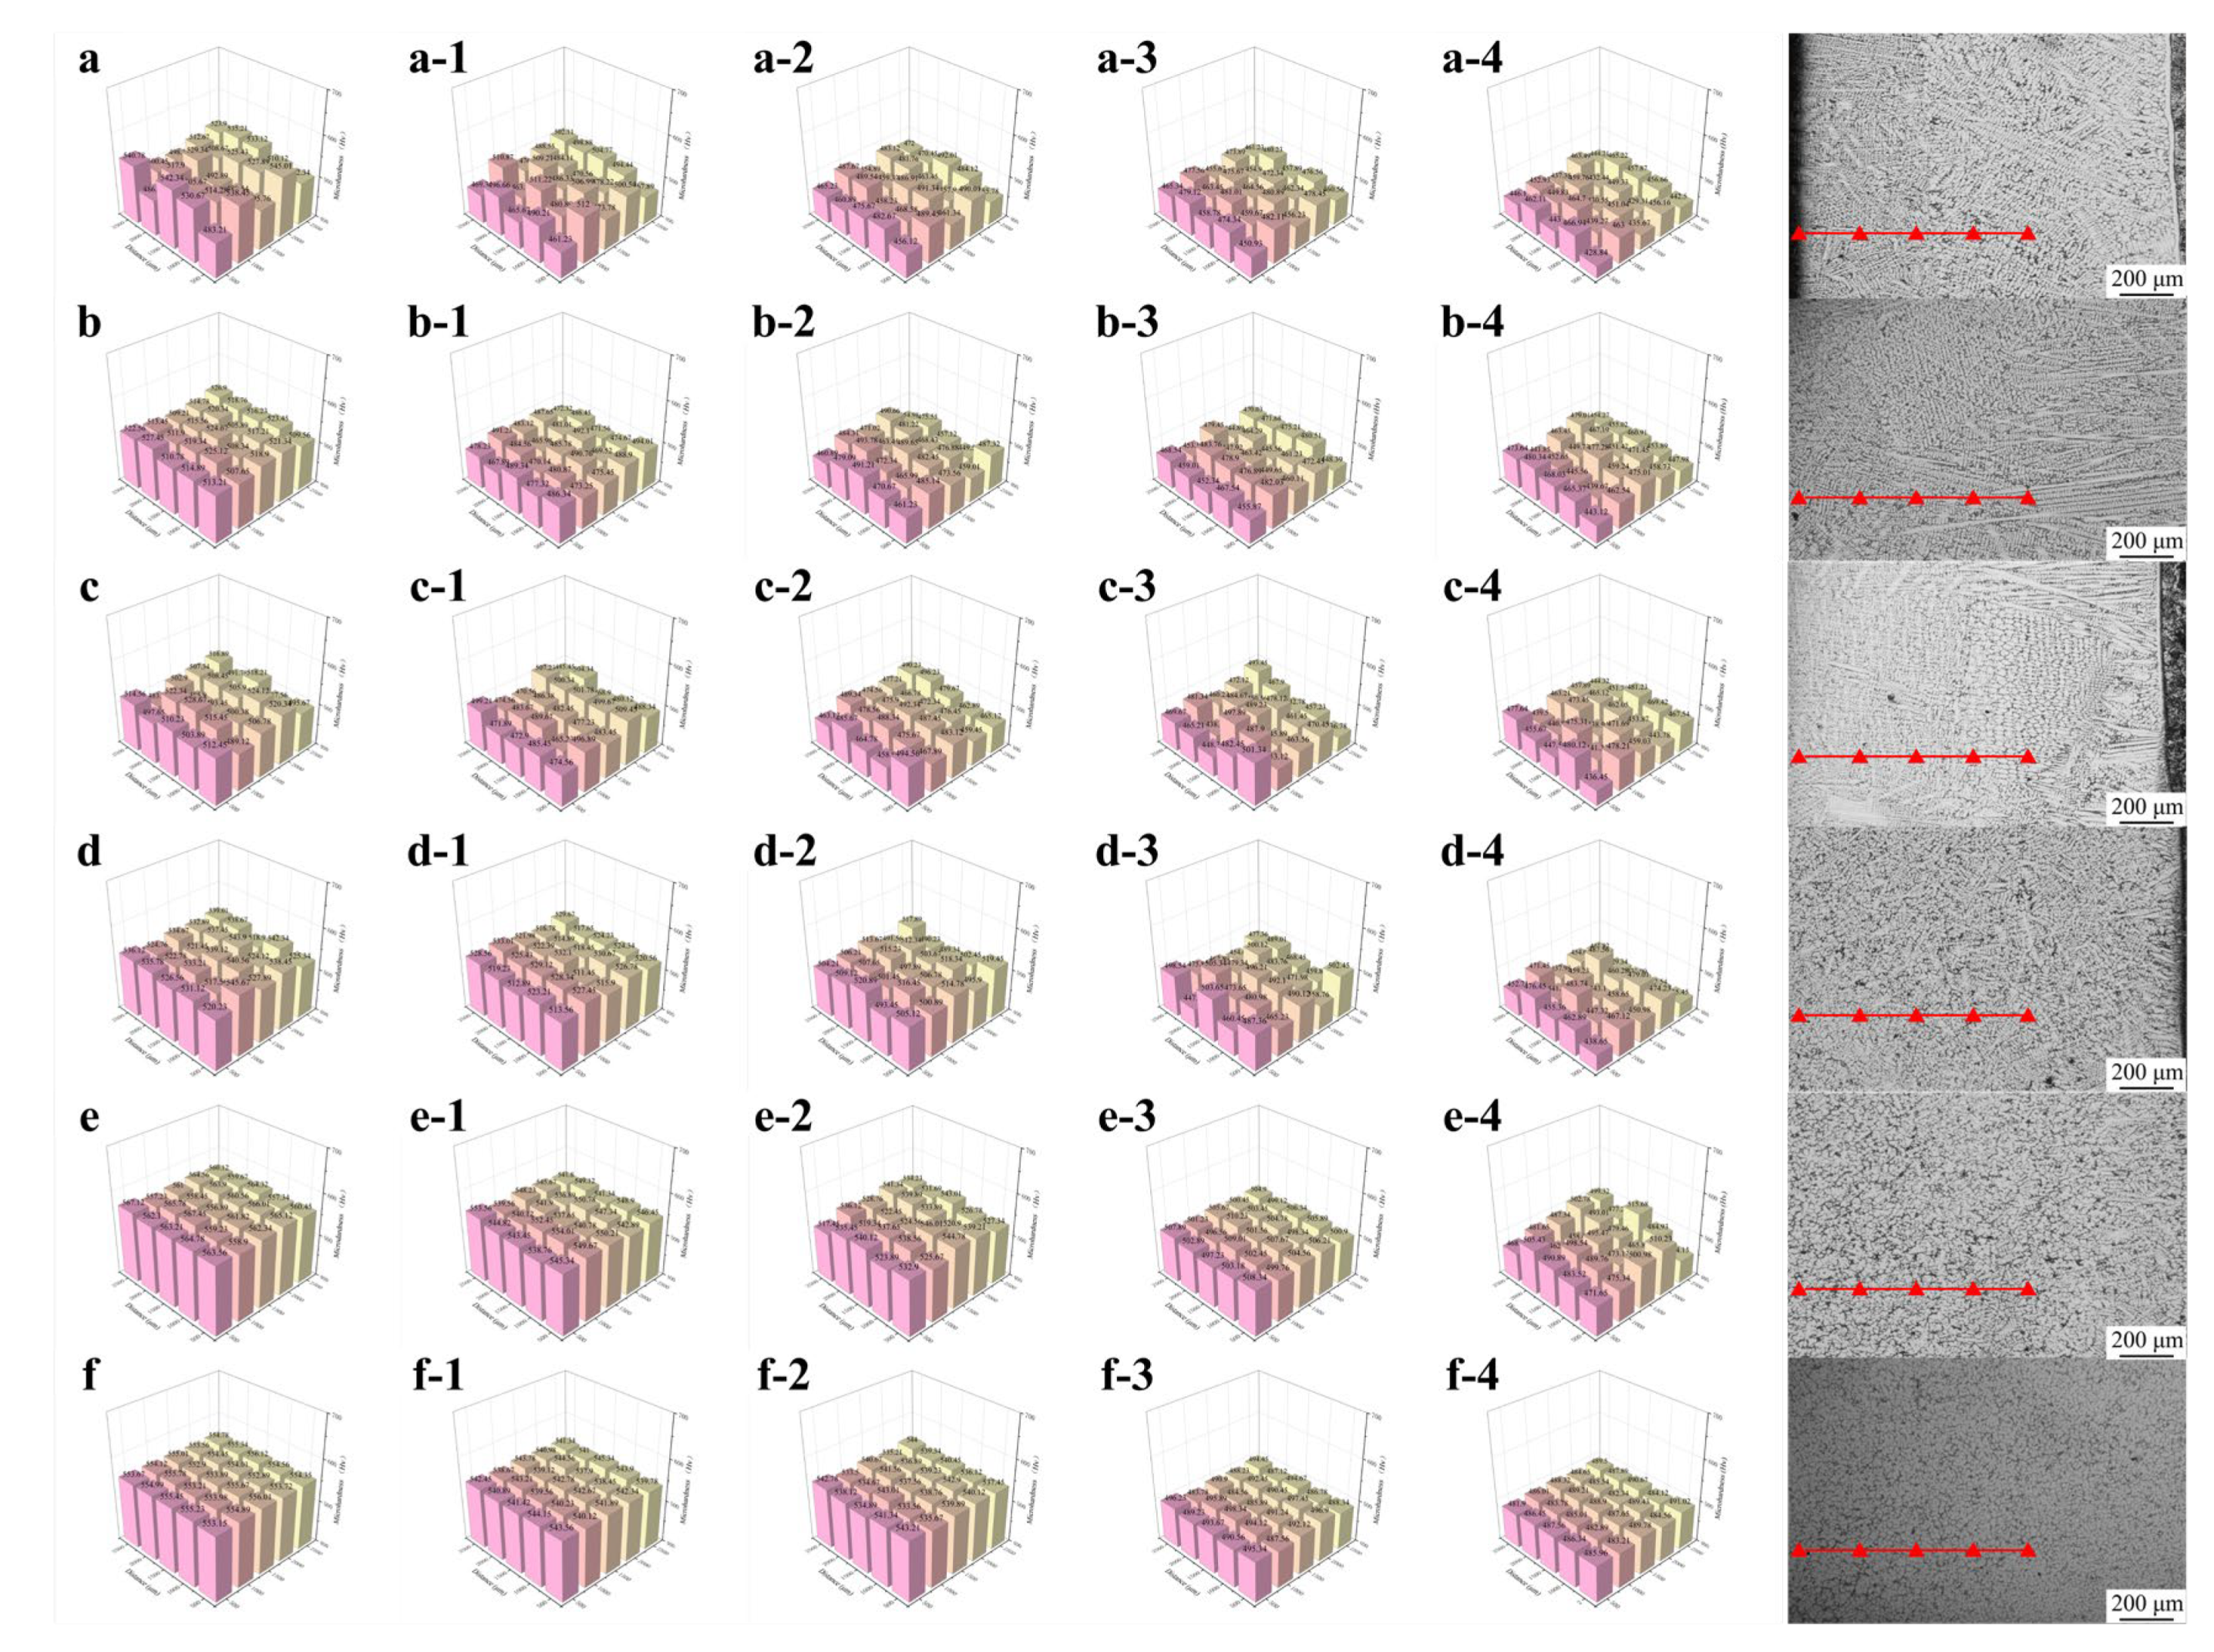
The results presented in
Figure 9 and
Table 4 illustrate the surface hardness uniformity at varying depths from the welding layer surface. As shown in
Figure 9a, the surface exhibited a highly non-uniform hardness distribution due to the entirely columnar grain structure within the welding layer. The maximum hardness reached approximately 540, while the minimum value was approximately 480. Notably, this trend of non-uniform hardness distribution persisted without significant changes as the depth increased. High-hardness regions were concentrated in zones enriched with Cr
7C
3, whereas low-hardness areas corresponded to regions dominated by γ-Fe. The non-uniform distribution of hard and soft phases directly resulted in substantial fluctuations in hardness values across the welding layer.
The hardness uniformity test results for welding layers with varying CeO
2 contents are presented in
Figure 9b,c. Microstructural analyses revealed that CeO
2 addition promoted grain refinement and increased the proportion of equiaxed grains. These structural changes lead to a more uniform distribution of hard and soft phases, thereby reducing hardness fluctuations in the welding layer. However, the persistent high columnar grain proportion and non-uniform grain distribution still resulted in significant hardness variations.
Figure 9d,e show the microhardness test results of welding layers with different TiN contents. The top regions of all welding layers were composed of equiaxed grains, exhibiting uniform distributions of hard and soft phases. This outcome suggests that the prevalence of equiaxed grains is the primary factor enhancing hardness uniformity. However, FT1 samples displayed significant hardness fluctuations at shallower depths than FT2 samples. This disparity arises from the higher proportion of columnar grain regions in FT1 compared to FT2. Consequently, the hypothesis that columnar grains induce substantial hardness fluctuations is justified. In FT2 samples, the columnar regions mainly formed at the bottom of the welding layer, resulting in low hardness fluctuations across most areas. As proximity to the heat-affected zone (HAZ) increases, the number of residual columnar grains rises, which accounts for the onset of hardness fluctuations observed in FT2 samples at a test depth of 1000 μm.
Figure 9f demonstrates that the FC2T2 sample exhibited the highest hardness uniformity, which remained consistent without significant variation with increasing depth. This can be attributed to its fully equiaxed microstructure, characterized by refined grain sizes and the absence of columnar grains in the welding layer. The uniform distribution of hard and soft phases significantly enhanced this hardness uniformity. Consequently, in subsequent friction and wear experiments, only the wear behaviors of the FC2T2 and Fe55 samples will be compared to investigate the relationship between their substantial differences in hardness uniformity and wear performance.
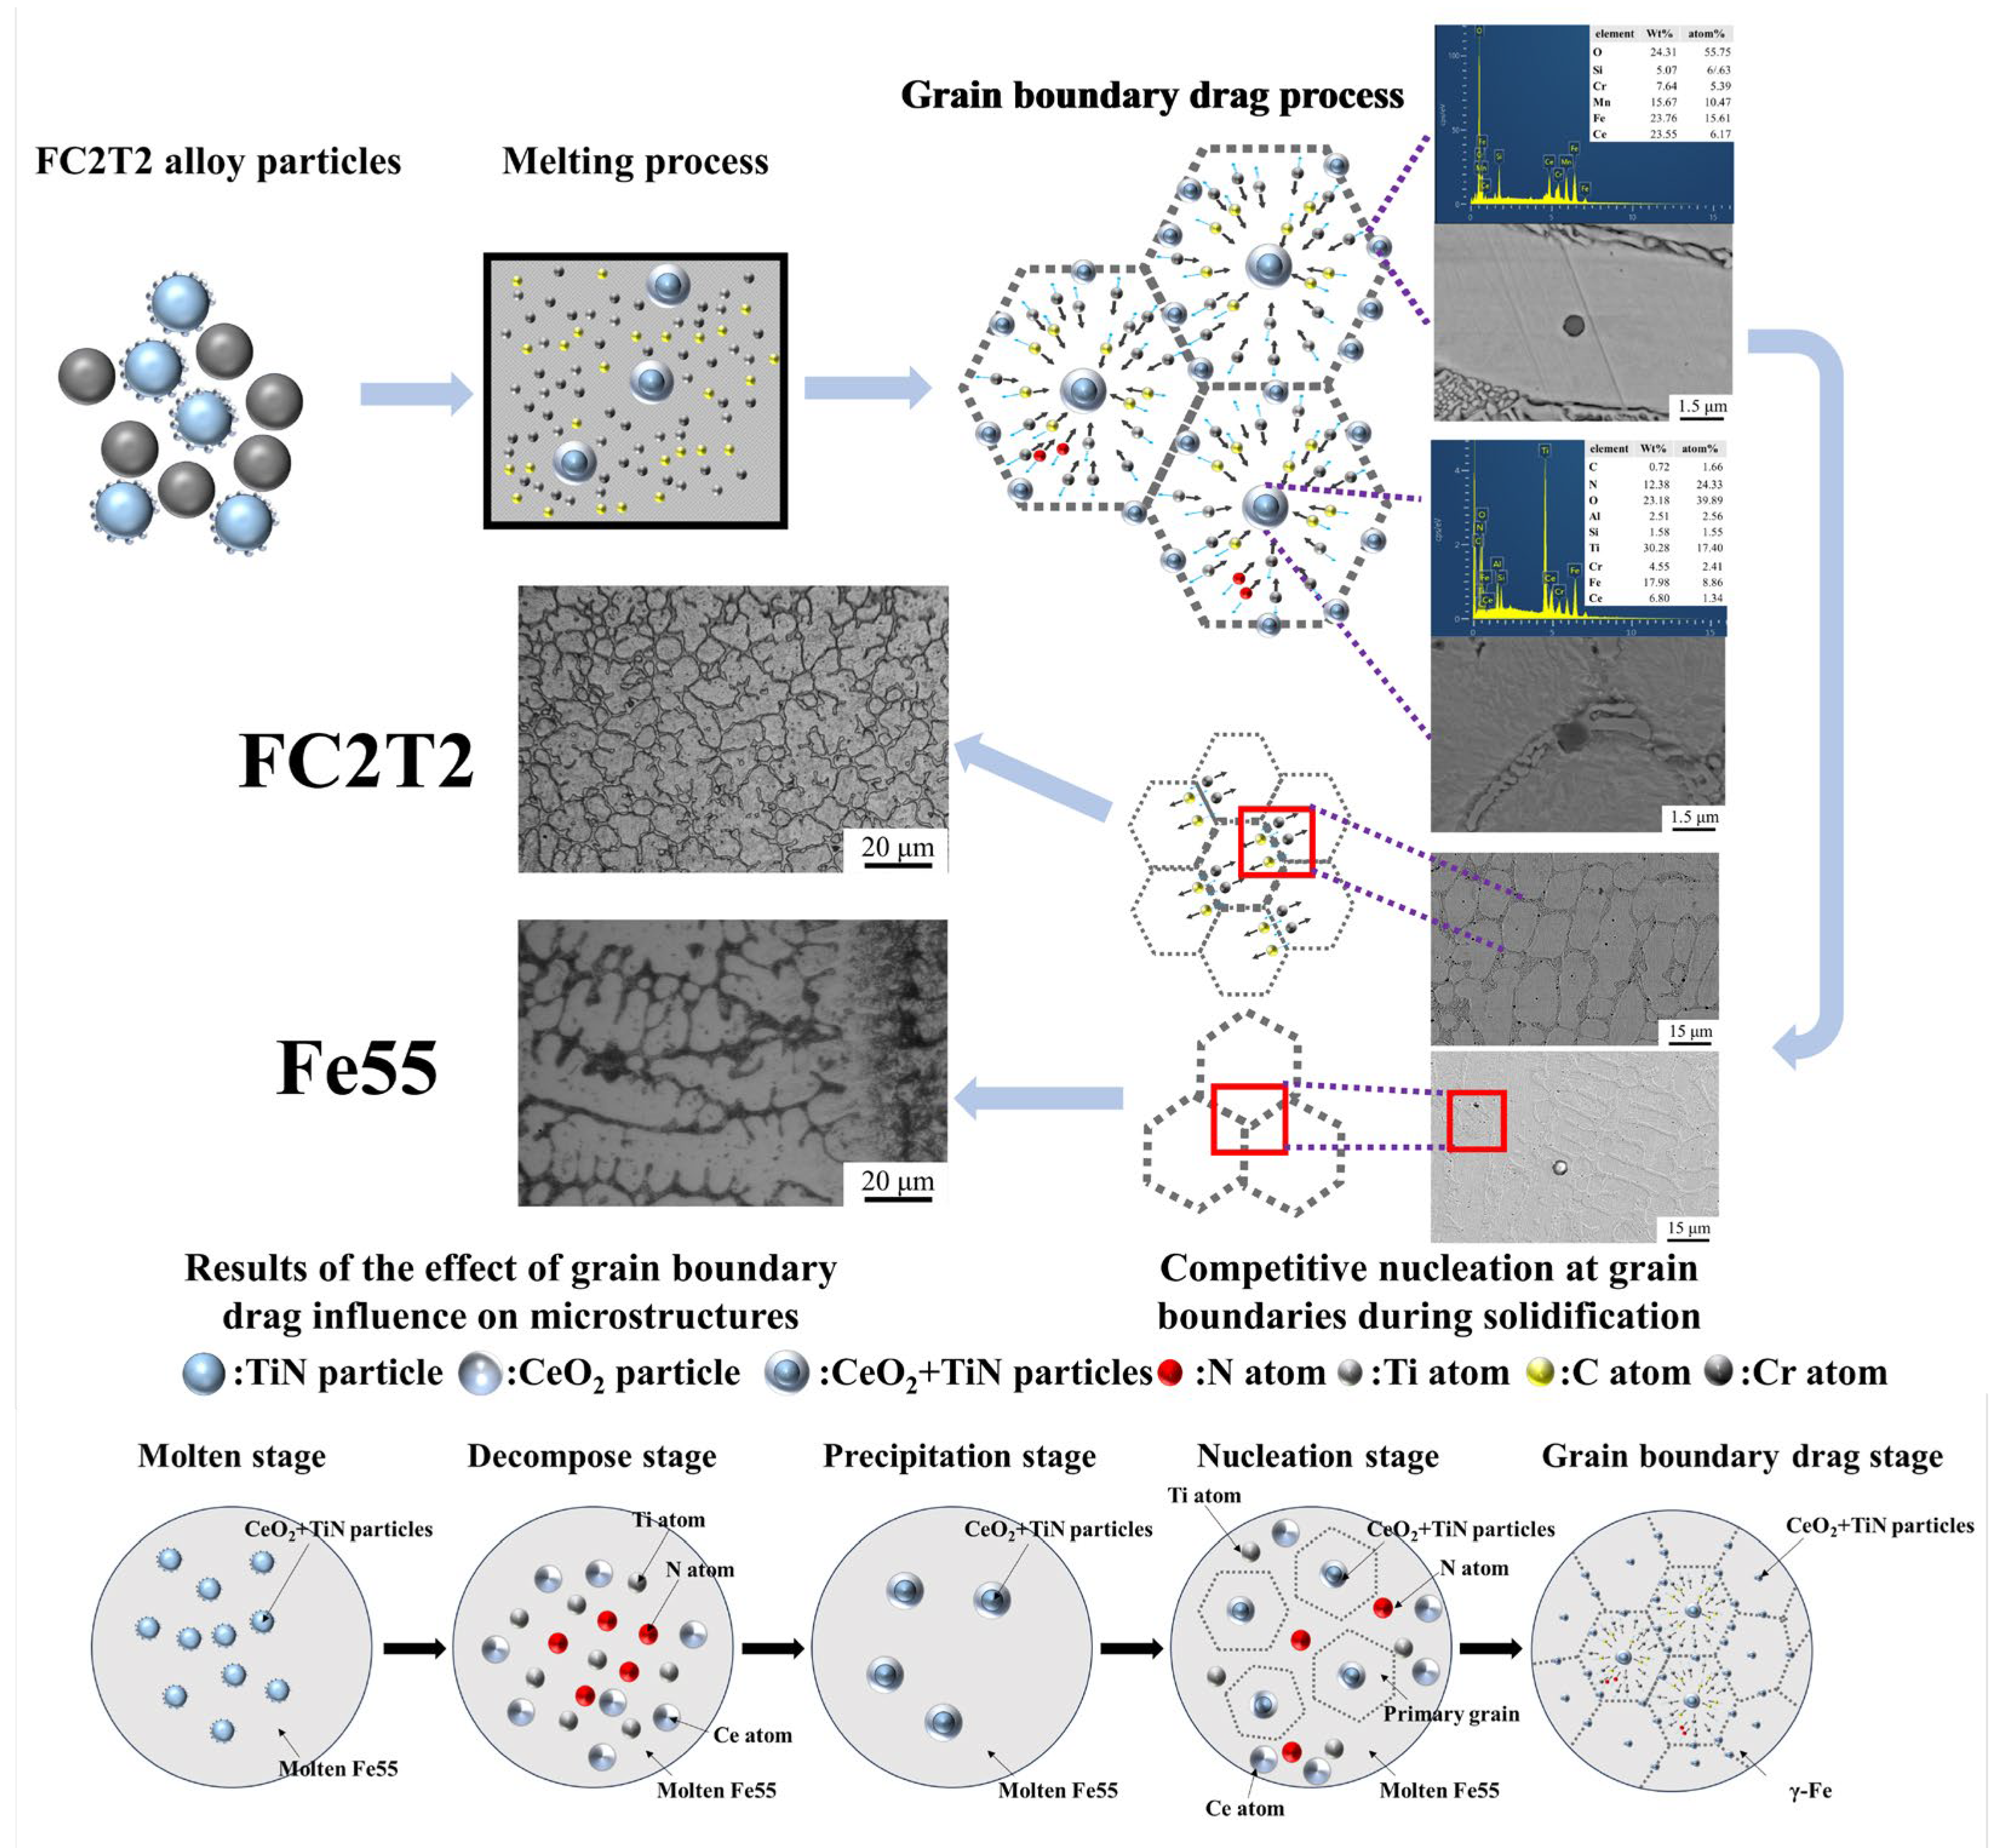
Figure 10 illustrates the process and mechanism of grain boundary drag effects on the microstructure of the welding layer. Initially, CeO
2 adheres to the surfaces of TiN particles and becomes uniformly mixed with Fe55 alloy powder. When the powder is subjected to a high-temperature plasma arc, it melts into molten steel liquid containing alloying elements such as Cr, C and Si. Under elevated temperatures, TiN reacts with and decomposes in the molten steel. However, due to the encapsulation by CeO
2 on TiN surfaces, a portion of TiN particles survives and subsequently acts as nucleation sites or grain boundary pinning points during solidification.
As the welding layer initiates solidification, the high chemical activity of Ce drives CeO2-encapsulated TiN particles within grains to drag solute atoms (e.g., C, Cr, Si) from the molten steel to form new intermetallic compounds. This process reduces atomic diffusion coefficients and increases the viscosity of the molten steel. Since Cr and C are essential constituents of grain boundaries, a competitive mechanism emerges between CeO2-encapsulated TiN particles within grains and the grain boundaries. The expansion of grain boundaries requires additional solute atoms to form the (γ-Fe, Cr7C3) eutectic structure, and this competition impedes grain expansion. However, the high activity of Ce simultaneously promotes the formation of Cr7C3 hard phases, resulting in smaller Cr7C3 dimensions within the eutectic structure.
Furthermore, the CeO2-encapsulated TiN particles exert drag effects on solute atoms across all directions, favoring the development of equiaxed grains. Although grain refinement increases the number of grain boundaries, insufficient solute atoms are available in the welding layer to sustain boundary formation. Consequently, solute atoms are competitively consumed during grain boundary formation, leading to a reduction in eutectic structure dimensions. Thus, the addition of CeO2 introduces two competitive mechanisms: (1) competition between CeO2-encapsulated TiN particles and grain boundaries; (2) competition among grain boundaries for solute atoms to form eutectic structures. Under the combined effects of these mechanisms, the microstructure becomes more homogeneous and preferentially evolves into equiaxed grains. In contrast, the Fe55 welding layer lacks such competitive mechanisms, allowing sufficient solute atoms for unrestricted grain boundary formation during nucleation. This results in a predominantly columnar grain structure rather than equiaxed grains in Fe55.
The FC2T2 sample underwent five distinct stages: melting, decomposition, precipitation, grain nucleation, and grain boundary drag. During the melting stage, CeO2 was adsorbed onto the surface of TiN particles. When the plasma arc further elevated the temperature of the molten steel, TiN and CeO2 decomposed into [Ce], [Ti], and [N]. In the cooling stage, complex inclusions containing Ti, N, and Ce began to precipitate from the molten steel and subsequently acted as nucleation sites for primary grains during the nucleation phase. As the grains continued to grow, these Ti-N-Ce-containing complex inclusions dragged grain boundaries, ultimately promoting the formation of equiaxed grains.
3.3. Wear Morphology
Figure 11 displays the surface morphology of the FC2T2 welding layer after wet friction testing. Densely distributed plowing furrows with curled edges are observed in
Figure 11a, while deflected furrows are absent. This phenomenon can be attributed to the homogeneous distribution of Cr
7C
3 hard phases shown in
Figure 11i. As Cr
7C
3 uniformly resists abrasive particle cutting on the worn surface, no microscale wear heterogeneity occurs, a result corroborated by the significantly enhanced Cr signal in
Figure 11i compared to
Figure 11c. In the FC2T2 welding layer, both Cr
7C
3 and γ-Fe are simultaneously removed during wear, whereas the Fe55 welding layer primarily loses γ-Fe in worn regions. This explains the markedly higher Cr signal intensity in FC2T2 wear debris compared to Fe55. In the red dashed area of
Figure 11c γ-Fe-rich zones align with the deflection direction of particles in
Figure 11a. The deflected plowing furrows follow the distribution orientation of Cr
7C
3, suggesting that SiC abrasives preferentially cut γ-Fe-rich regions during wear. As the kinetic energy of SiC abrasives dissipates progressively during cutting, they become incapable of removing adjacent Cr
7C
3 hard phase-rich zones, ultimately being redirected along and blocked by these regions.
Our previous work demonstrated that γ-Fe functions as a supportive matrix for Cr
7C
3 [
26]. Once the ductile γ-Fe is worn away, Cr
7C
3 undergoes brittle fracture under abrasive particle impact, ultimately leading to material surface degradation. In Fe55 welding layers, the absence of Cr
7C
3 reinforcement in γ-Fe-rich regions results in more severe abrasive cutting, explaining the largest wear debris dimensions in Fe55. In contrast,
Figure 11j shows significantly reduced debris sizes compared to
Figure 11d, primarily due to FC2T2’s dominant equiaxed microstructure with uniform distribution of high-toughness γ-Fe and high-hardness Cr
7C
3. When SiC abrasives attempt to cut soft γ-Fe regions, Cr
7C
3 hard phases obstruct the abrasives, mitigating γ-Fe wear and preserving the ductile matrix. This protective mechanism conversely prevents Cr
7C
3 hard phases from detaching under SiC impact. The synergistic interaction between γ-Fe and Cr
7C
3 mutually reduces material loss: Cr
7C
3 mitigates γ-Fe cutting, while γ-Fe retention prevents Cr
7C
3 dislodgement. Consequently, each abrasive cutting event produces substantially less material removal, explaining the markedly smaller debris sizes in FC2T2.
Furthermore, Ti signals detected in
Figure 11k indicate that TiN not only serves as grain nucleation sites but also partially bears the frictional load during wear. Comparative analysis of
Figure 11d,j reveals distinct debris morphologies: Fe55 debris primarily exhibits lamellar structures (~20 μm), whereas FC2T2 debris contains spherical particles (~10 μm) that agglomerate due to high surface energy and undergo corrosion. Lamellar debris suggests brittle spallation, while spherical debris implies uniform micro-cutting with consistent material removal per abrasive event. This limited the micro-cutting on FC2T2 surfaces generates finer debris, reflecting enhanced wear resistance.
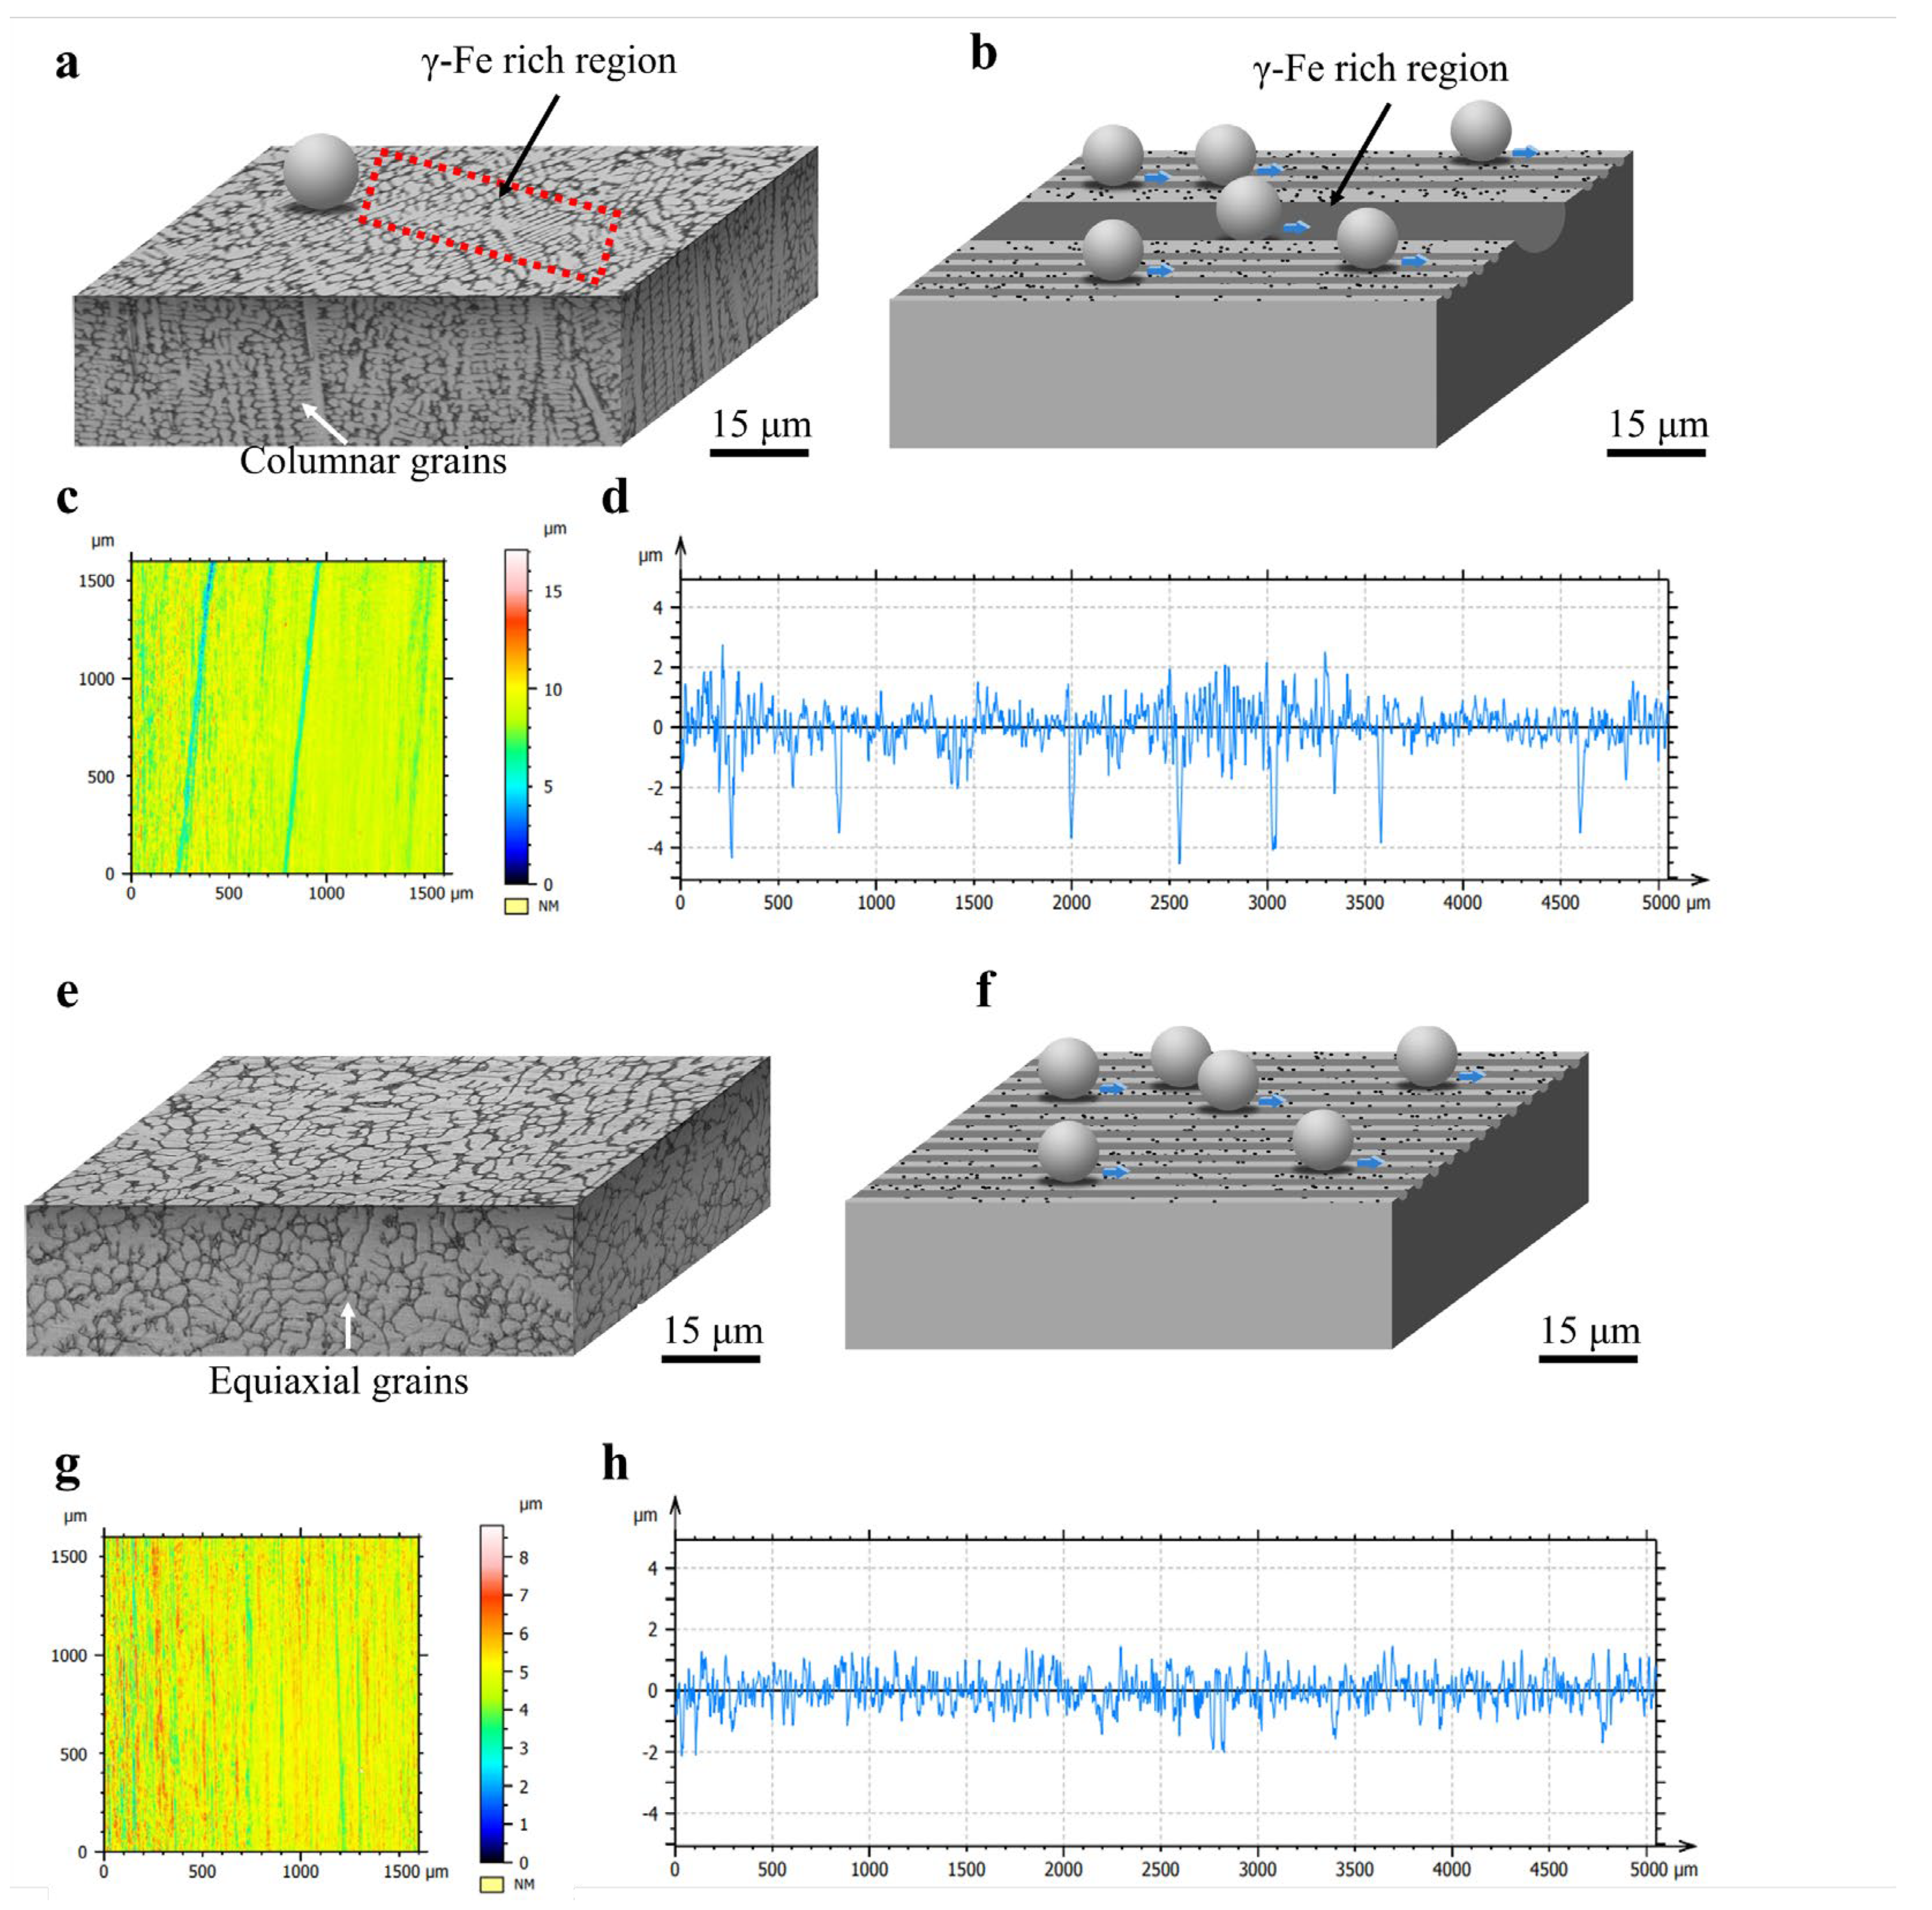
Figure 12a,b present schematic diagrams of the three-dimensional microstructure and wear process of Fe55. In
Figure 12a, the cross-sectional structure of Fe55 predominantly consists of columnar grains, with numerous γ-Fe-rich zones existing on the wear surface. These γ-Fe-rich zones are susceptible to cutting, forming deep furrows. Research by Zum et al. demonstrated that micro-cutting generates additional abrasive particles [
32]. However, during wet friction processes, these secondary abrasives may be carried away by water, partially mitigating three-body abrasion. Notably, owing to the high toughness of γ-Fe, friction energy is dissipated not only through micro-cutting but also via micro-ploughing-induced plastic deformation. The curled edges observed in
Figure 11g result from high-energy abrasives interacting with the surface at shallow attack angles. With water acting as a boundary lubricant, insufficient energy remains to cause micro-cutting, leading kinetic energy dissipation through micro-ploughing.
Figure 12b illustrates the mechanism of non-uniform wear in Fe55. In regions with homogeneous Cr
7C
3 hard phase distribution, micro-cutting depths remain consistent. In contrast, γ-Fe undergoes plastic deformation in micro-ploughing-dominated regions, but excessive deformation is constrained by Cr
7C
3. These γ-Fe zones neither detach from the surface nor contribute to wear loss. The γ-Fe-rich zones typically correspond to columnar grain cores, where Cr
7C
3 hard phases are absent. Consequently, the wear depth in these regions matches columnar grain lengths, resulting in unmitigated severe wear.
Figure 12c,d display the surface morphology and roughness profile of Fe55 after wet friction testing. Blue regions in
Figure 12c represent γ-Fe-rich zones exhibiting deeper plowing furrows compared to yellow regions with uniform Cr
7C
3 distribution. The minimal color variation in yellow zones indicates homogeneous wear. The roughness profile in
Figure 12d confirms Fe55’s non-uniform wear characteristics through observed deep furrow formations.
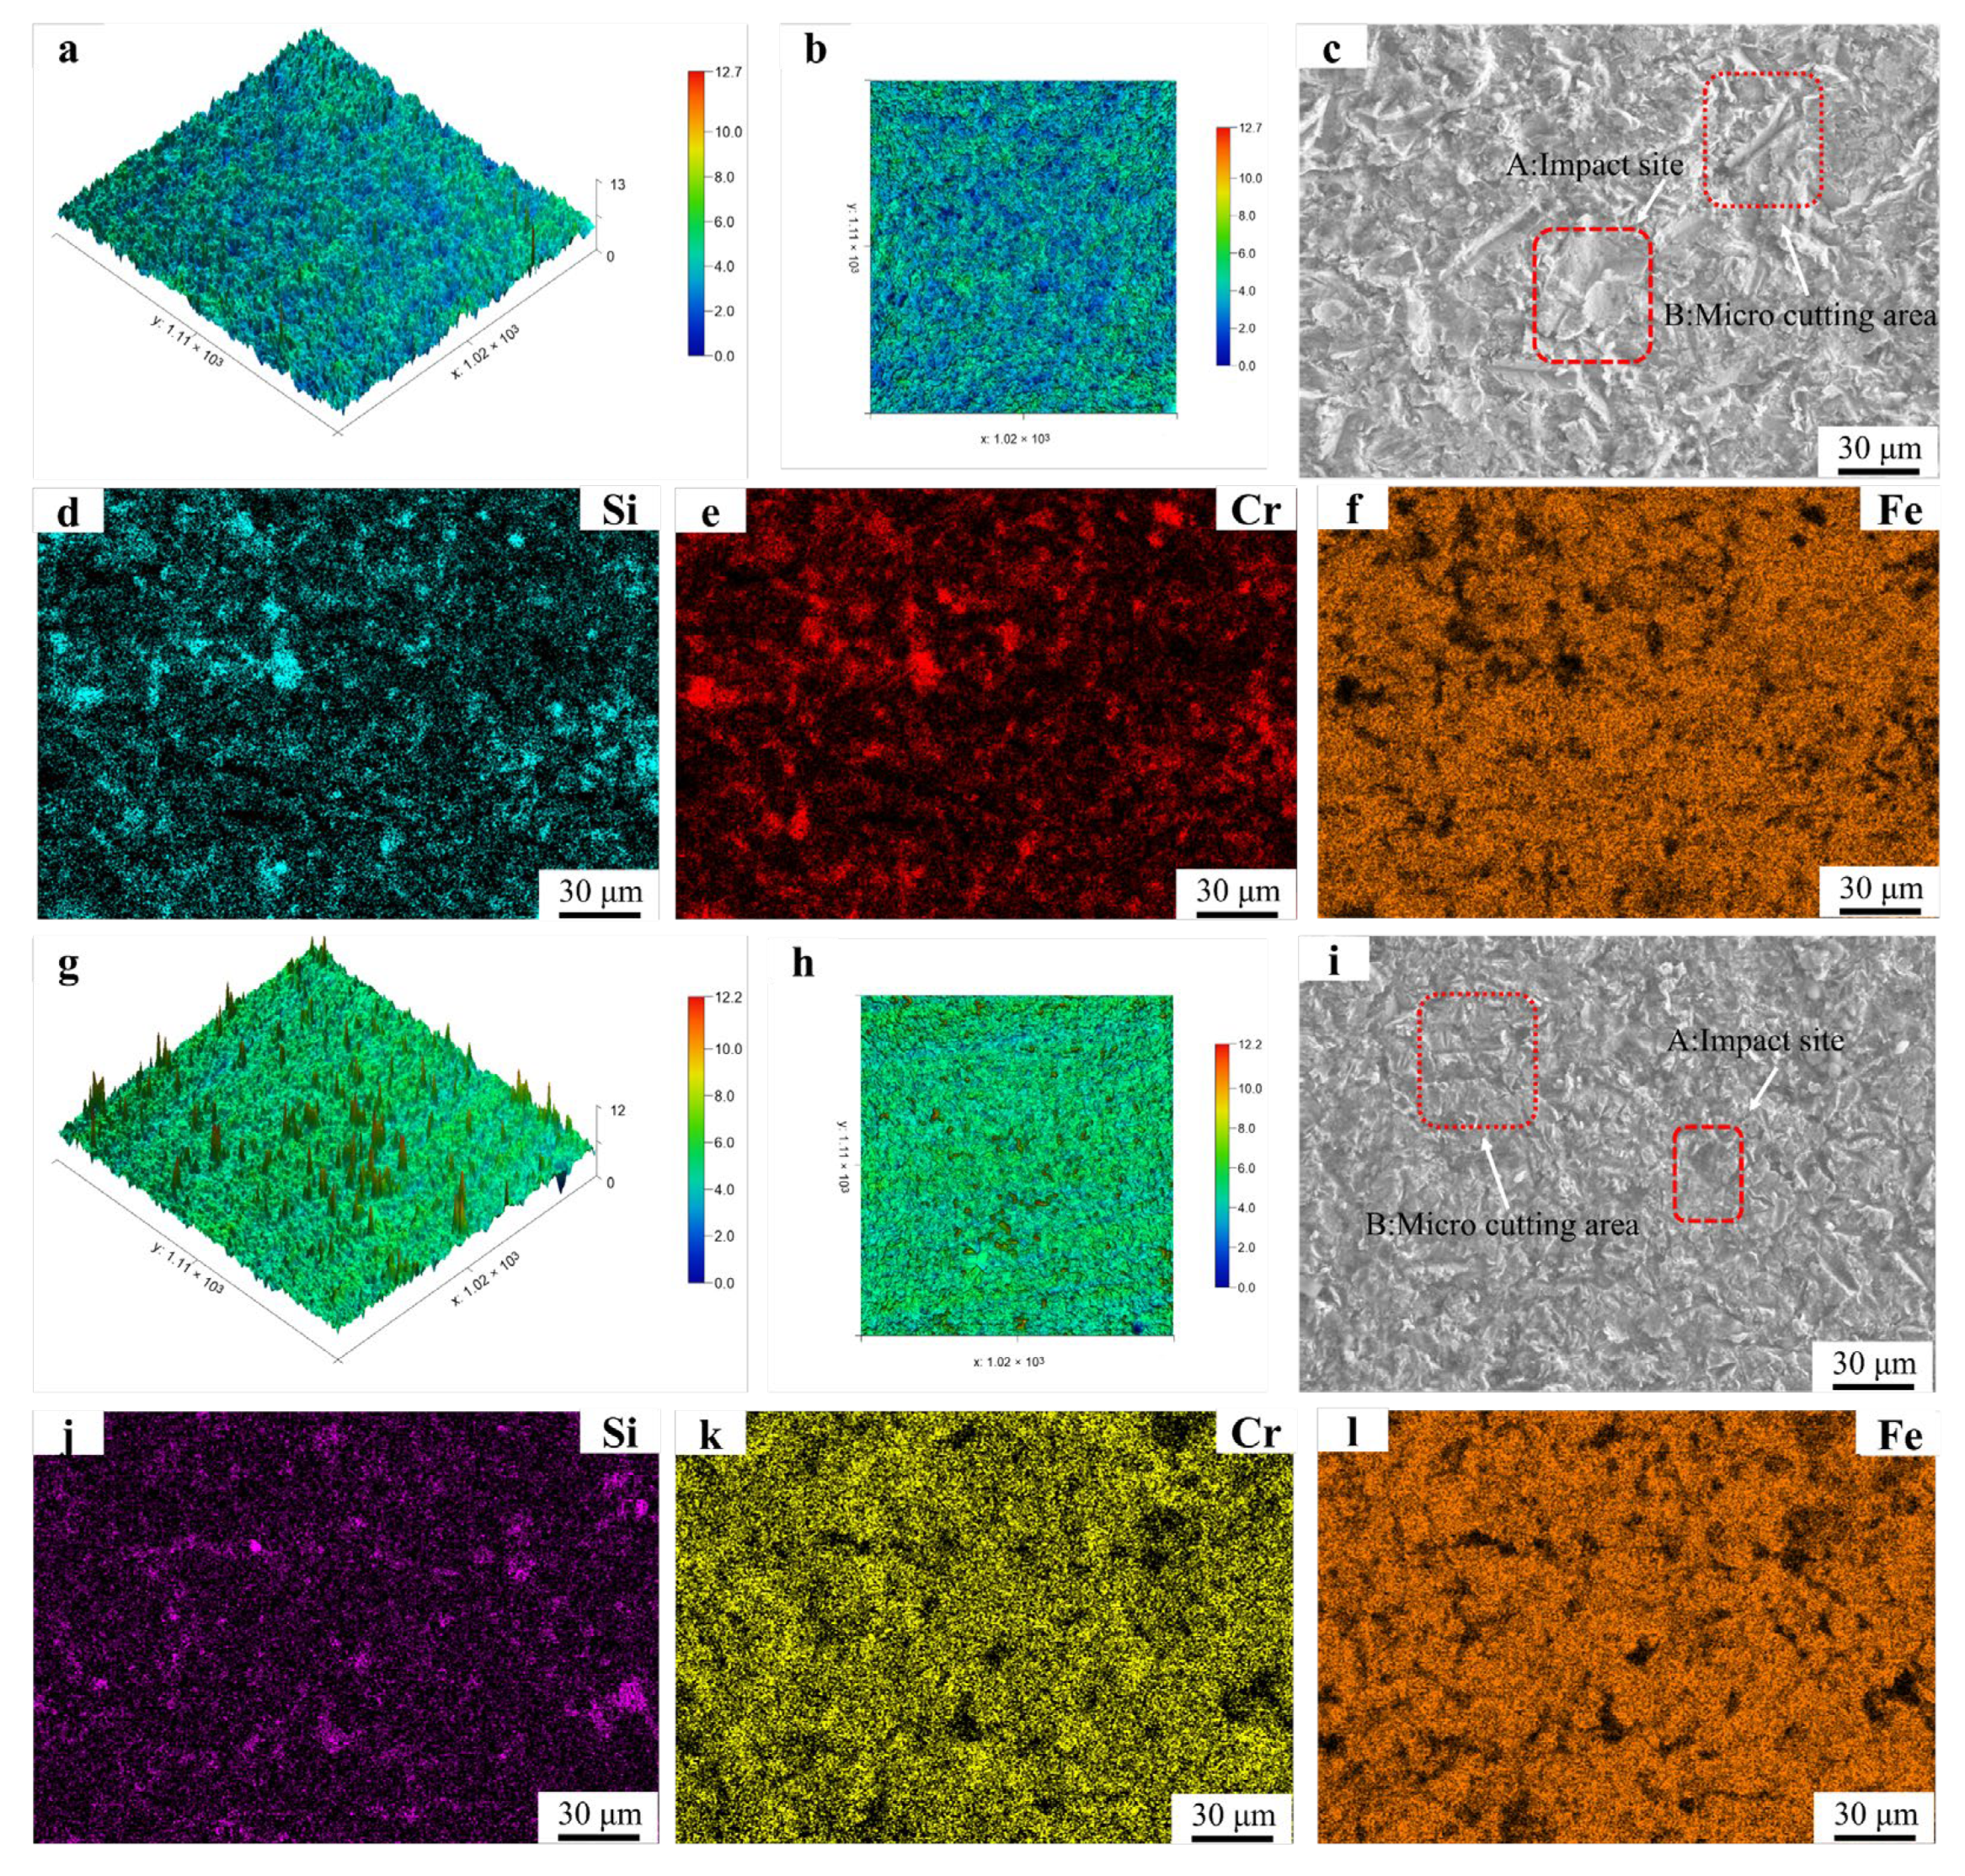
Figure 13 presents the erosion mass loss and surface morphology of the Fe55 welding layer. At each erosion stage, the erosion mass loss of Fe55 consistently exceeds that of FC2T2, which can be partially attributed to Fe55’s lower average hardness compared to FC2T2. However, the hardness discrepancy alone cannot fully account for the substantial wear loss difference. Additionally, comparative analysis of
Figure 14a,b,g,h reveals significantly higher surface roughness in Fe55 than in FC2T2. Beyond micro-cutting, the primary wear mechanisms during erosion include micro-ploughing induced by high-velocity particle impacts. Unlike wet friction processes, erosion continuously removes soft γ-Fe regions without the secondary embedding of wear debris into the surface (as observed in wet friction tests with rubber wheels). All generated debris is flushed away by slurry flow. Thus, no debris is embedded on worn surface.
The columnar grain-dominated microstructure of Fe55 further exacerbates wear. Once the upper soft γ-Fe regions are removed, the absence of grain boundary Cr
7C
3 hard phases beneath allows SiC abrasives to progressively deepen their cutting into γ-Fe-rich zones, ultimately forming deep cutting pores and high wear loss, as illustrated in Process A of
Figure 15.
Moreover, high-velocity SiC particles in the slurry induce plastic deformation in unprotected γ-Fe regions (lacking Cr
7C
3 constraints), leading to plastic fatigue wear [
33]. The combined effects of these two wear mechanisms explain Fe55’s substantially higher mass loss compared to FC2T2.
Figure 14g displays the three-dimensional erosion morphology of FC2T2. The observed sharp protrusions originate from brittle SiC particles fracturing and embedding into the surface during impacts. These embedded fragments exhibit higher reflectivity during laser scanning, creating topographic peaks. The uniform color distribution across FC2T2’s surface indicates homogeneous wear resistance, benefiting from its equiaxed grains microstructure. When surface γ-Fe undergoes micro-cutting by SiC abrasives, Cr
7C
3 hard phases inhibit excessive material removal. Even if γ-Fe within grains is completely damaged, underlying Cr
7C
3-rich grain boundaries continue to protect against further wear, as shown in Process B of
Figure 15.
Furthermore, Cr
7C
3 restricts excessive plastic deformation of γ-Fe under abrasive impacts, mitigating plastic fatigue wear. This uniform Cr
7C
3 distribution effectively suppresses wear progression. EDS mapping in
Figure 14j–l reveals minimal Si signals but strong Cr signals on FC2T2’s worn surface. This confirms that after γ-Fe removal, exposed Cr
7C
3 from eutectic structures bears the erosive loads. The predominant Cr
7C
3 coverage prevents SiC abrasives from embedding into the surface, explaining the scarce Si detection. However, in
Figure 14d–f, the Si signal exhibit distinct clustering, indicating that SiC particles have embedded into the surface of the Fe55 sample during erosion. This provides experimental evidence of the inferior erosion resistance of Fe55.
Figure 14i(A) displays traces left by SiC particles during erosion. As the particles engage the surface at a 45° attack angle with high velocity, their trajectories are truncated (approximately 20 μm) upon encountering Cr
7C
3 hard phases, which either deflect or block the abrasives. In contrast, regions subjected to micro-ploughing (e.g.,
Figure 14i(B)) exhibit flatter topography due to Cr
7C
3’s suppression of γ-Fe plastic deformation.
The wear surface morphology of Fe55 in
Figure 14c demonstrates concurrent micro-cutting and micro-ploughing. The abrasive trajectories in Fe55 (e.g.,
Figure 14c(A)) extend up to 50 μm, significantly longer than those in FC2T2, corresponding to greater micro-cutting depths and consistent with Fe55’s higher friction mass loss. Plastic deformation zones induced by particle impacts are observed in
Figure 14c(B), measuring ~40 μm in width. Comparable regions in FC2T2 (
Figure 14i(B)) show substantially reduced widths (~20 μm). This improvement stems from two mechanisms: (1) Cr
7C
3 hard phases restrict excessive γ-Fe plastic deformation; (2) TiN addition enhances surface hardness.
EDS mapping reveals intensified Cr signals in FC2T2 (
Figure 14k) compared to Fe55 (
Figure 14e), indicating preferential removal of γ-Fe from grains during erosion that exposes Cr
7C
3-rich grain boundaries. Notably, Cr signal absence in multiple Fe55 regions under identical erosion durations confirms the lack of Cr
7C
3 support beneath columnar grains, directly explaining the deep crater formation in
Figure 14b. These observations align with Verma et al.’s findings on erosion morphology in dual-phase steels [
34,
35].
Analysis of the erosion behavior reveals that the FC2T2 welding layer exhibits the lowest material removal rate and roughness during wet friction. When SiC abrasives induce micro-cutting and micro-ploughing on the wear surface, the homogeneous distribution of hard (Cr7C3) and soft (γ-Fe) phases synergistically mitigates material loss: Cr7C3 blocks abrasive progression during micro-cutting, while γ-Fe’s plastic deformation is suppressed during micro-ploughing, thereby avoiding mass loss and roughness elevation caused by abrasive wear and plastic fatigue.
Table 5 compares surface roughness results of Fe55 and FC2T2 after erosion testing. The Ra value of FC2T2 measures approximately 41% of Fe55, consistent with the three-dimensional morphologies in
Figure 14a,g. This demonstrates that welding layers with uniform microstructures maintain stable surface roughness under abrasive or erosive wear conditions, as localized wear intensification is prevented. In addition, it is worth noting that Rt and Rv showed significant reductions. The reduction in the Rt value indicates a significant decrease in the value between the highest contour peaks and lowest valleys on the sample surface. This can be explained by the microstructural changes in the worn surface. In Fe55, the γ-Fe-enriched regions of columnar grains underwent preferential wear, while some Cr
7C
3-enriched regions with lower wear became contour peaks. This may become the starting point of leakage during the service of valve sealing surfaces. The Rt value of the FC2T2 sample decreased by 74% compared to Fe55, which proves that the difference between the highest point and lowest point in the FC2T2 sample is only 2.094 μm, proving the occurrence of Process B in
Figure 15 during erosion. The particle diameter in slurry transportation is generally approximately 5–100 μm. The Rt value being lower than the slurry particle diameter means that the FC2T2 sample reduces the potential leakage risk when used as a valve sealing surface. The reduction in the Rv value indicates a significant decrease in the cutting depth of the sample surface. This test result also proves the separate occurrence of Processes A and B in
Figure 15. The uniform distribution of soft phases and hard phases acts an important role in resisting erosion wear.


 ,
, 


