Article

Spatiotemporal Thermal Analysis of Large-Volume Concrete Girders: Distributed Fiber Sensing and Hydration Heat Simulation

1
State Key Laboratory of Optical Fiber and Cable Manufacture Technology, Yangtze Optical Fibre and Cable Joint Stock Limited Company (YOFC), Wuhan 430073, China
2
Engineering Research Center of Industrial Construction in Civil Engineering of Zhejiang Province, Ningbo University of Technology, Ningbo 315211, China
*
Author to whom correspondence should be addressed.
Coatings 2025, 15(4), 453; https://doi.org/10.3390/coatings15040453
Submission received: 11 March 2025 / Revised: 29 March 2025 / Accepted: 10 April 2025 / Published: 11 April 2025

Abstract

:
To investigate the spatiotemporal distribution of early-age hydration heat-induced temperature fields, this study integrates distributed fiber optic sensing (DFOS) technology with a thermal parameter finite element model (FEM). First, a high-precision DFOS system and traditional point-type semiconductor sensors were deployed to continuously monitor the temperature of a 50 m large-volume concrete box girder (LVBG) over 100 h. Experimental results show that full-field LVBG temperature changes can be measured by DFOS compared to traditional point sensors. DFOS, leveraging its full-scale spatial coverage capability, revealed a three-stage temperature evolution: rapid heating (peak temperature of 79.4 °C at 40 h), sustained high temperatures (>75 °C for 20 h), and gradual cooling (rate: 0.45 °C/h). In contrast, conventional point sensors may miss localized hotspots due to insufficient spatial coverage. Second, a FEM was developed on the ABAQUS 2021 (finite element analysis software) platform, incorporating a UMATHT (user material thermal) subroutine to update temperature-dependent thermal conductivity and specific heat in real time during hydration heat transfer simulations. The proposed model significantly improved prediction accuracy by integrating parameter mechanisms (equivalent age), and it improved prediction accuracy by about 40% compared to static-parameter models. The FEM results exhibited strong consistency with DFOS-measured data, validating the model’s reliability in capturing thermal gradients in geometrically complex structures. This validated framework offers a robust tool for optimizing thermal management strategies in large-scale infrastructure projects. The research results of this paper can serve as a reference for the temperature measurement and prediction of large-volume concrete.

1. Introduction

Distributed fiber optic sensing (DFOS) technology is characterized by its compact size, extended measurement range, high sensitivity, and electrical insulation properties. These attributes make it particularly suitable for monitoring large-scale structures in complex environments, owing to its ultra-high spatial resolution (<1 cm) and real-time strain/temperature measurement capabilities [1,2,3,4]. Unlike conventional methods, DFOS enables continuous monitoring of structural stress and temperature fields with full spatial coverage, positioning it as a transformative technology for structural health monitoring.
Large-volume concrete box girders (LVBGs), as critical components in high-grade highway bridges [5,6], are favored for their rapid construction, high rigidity, and superior mechanical performance. However, the early hydration process in LVBGs generates substantial heat, creating complex thermal effects that critically influence construction quality. High-strength concrete exhibits pronounced temperature sensitivity, where uneven thermal distributions can compromise structural integrity [7]. The geometric complexity of LVBGs exacerbates heat dissipation challenges, leading to steep core-surface temperature gradients (often exceeding 50 °C) that induce premature cracking and threaten long-term durability. Despite decades of research on hydration-induced temperature fields, progress remains hindered by methodological limitations, with early cracking persisting as a prevalent issue in practice [8].
During the fluid-to-solid transition of early-age LVBG concrete, dramatic temperature fluctuations occur. Previous numerical studies by Zhang et al. [7] (ANSYS, finite element software) and Wang et al. [9] (Midas FEA, finite element analysis tool) on prestressed rigid bridges simplified thermal parameters as constants, neglecting temperature-dependent variations in hydration kinetics, thermal conductivity, and specific heat. Similarly, Zhang et al. [10] investigated steel-concrete beams but overlooked thermal parameter dynamics. Such oversimplifications fail to capture the spatiotemporal heterogeneity of hydration reactions in LVBGs, where localized temperature variations significantly alter heat generation and transfer rates. Traditional monitoring approaches relying on point sensors face inherent limitations: sparse spatial sampling and high installation costs often miss critical temperature hotspots [11,12].
Recent advances in DFOS address these gaps by enabling real-time, full-scale temperature monitoring. Concurrently, numerical models require refinement to incorporate dynamic thermal parameters. While Zeng et al. [13] simulated early temperature fields using fixed thermal properties, their approach yielded discrepancies exceeding 15% against field data. Empirical evidence confirms that concrete’s thermal conductivity and specific heat vary nonlinearly with temperature during hydration [14,15], necessitating dynamic parameterization for accurate simulations.
This study aims to resolve two key challenges: (1) achieving synchronized, full-field temperature monitoring in LVBGs, and (2) enhancing numerical accuracy through dynamic thermal parameter modeling. We deploy DFOS to obtain high-resolution temperature data from a 50 m LVBG over 100 h. A finite element model (FEM) is developed in ABAQUS, integrated with a UMATHT [16] subroutine to dynamically update thermal conductivity and specific heat based on equivalent age and temperature-dependent hydration kinetics. Parametric analyses further investigate temperature field evolution under varied construction conditions. The validated framework provides critical insights for optimizing thermal control strategies and mitigating early cracking risks in LVBG applications.

2. Experimental Programs

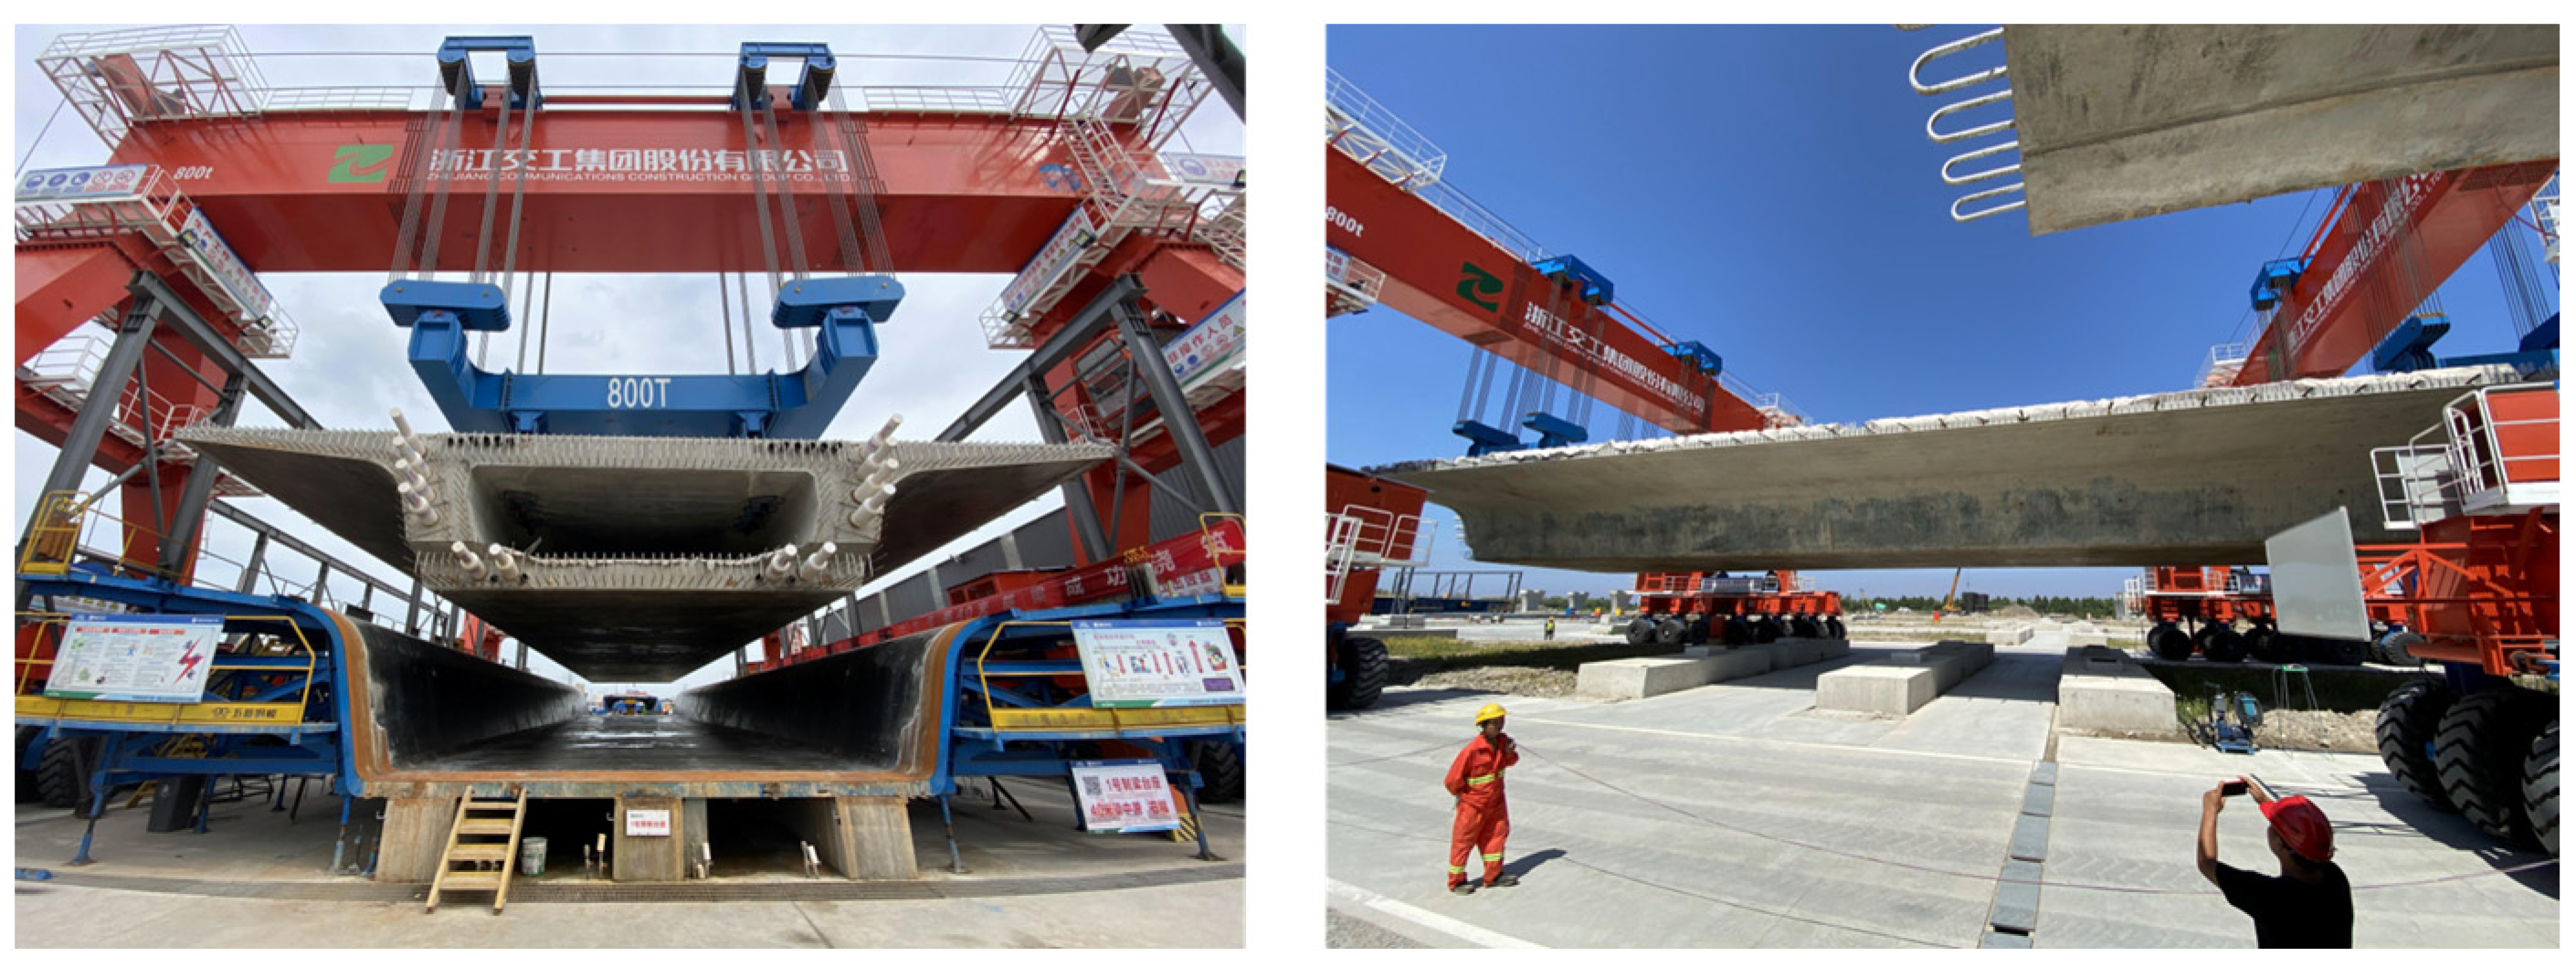
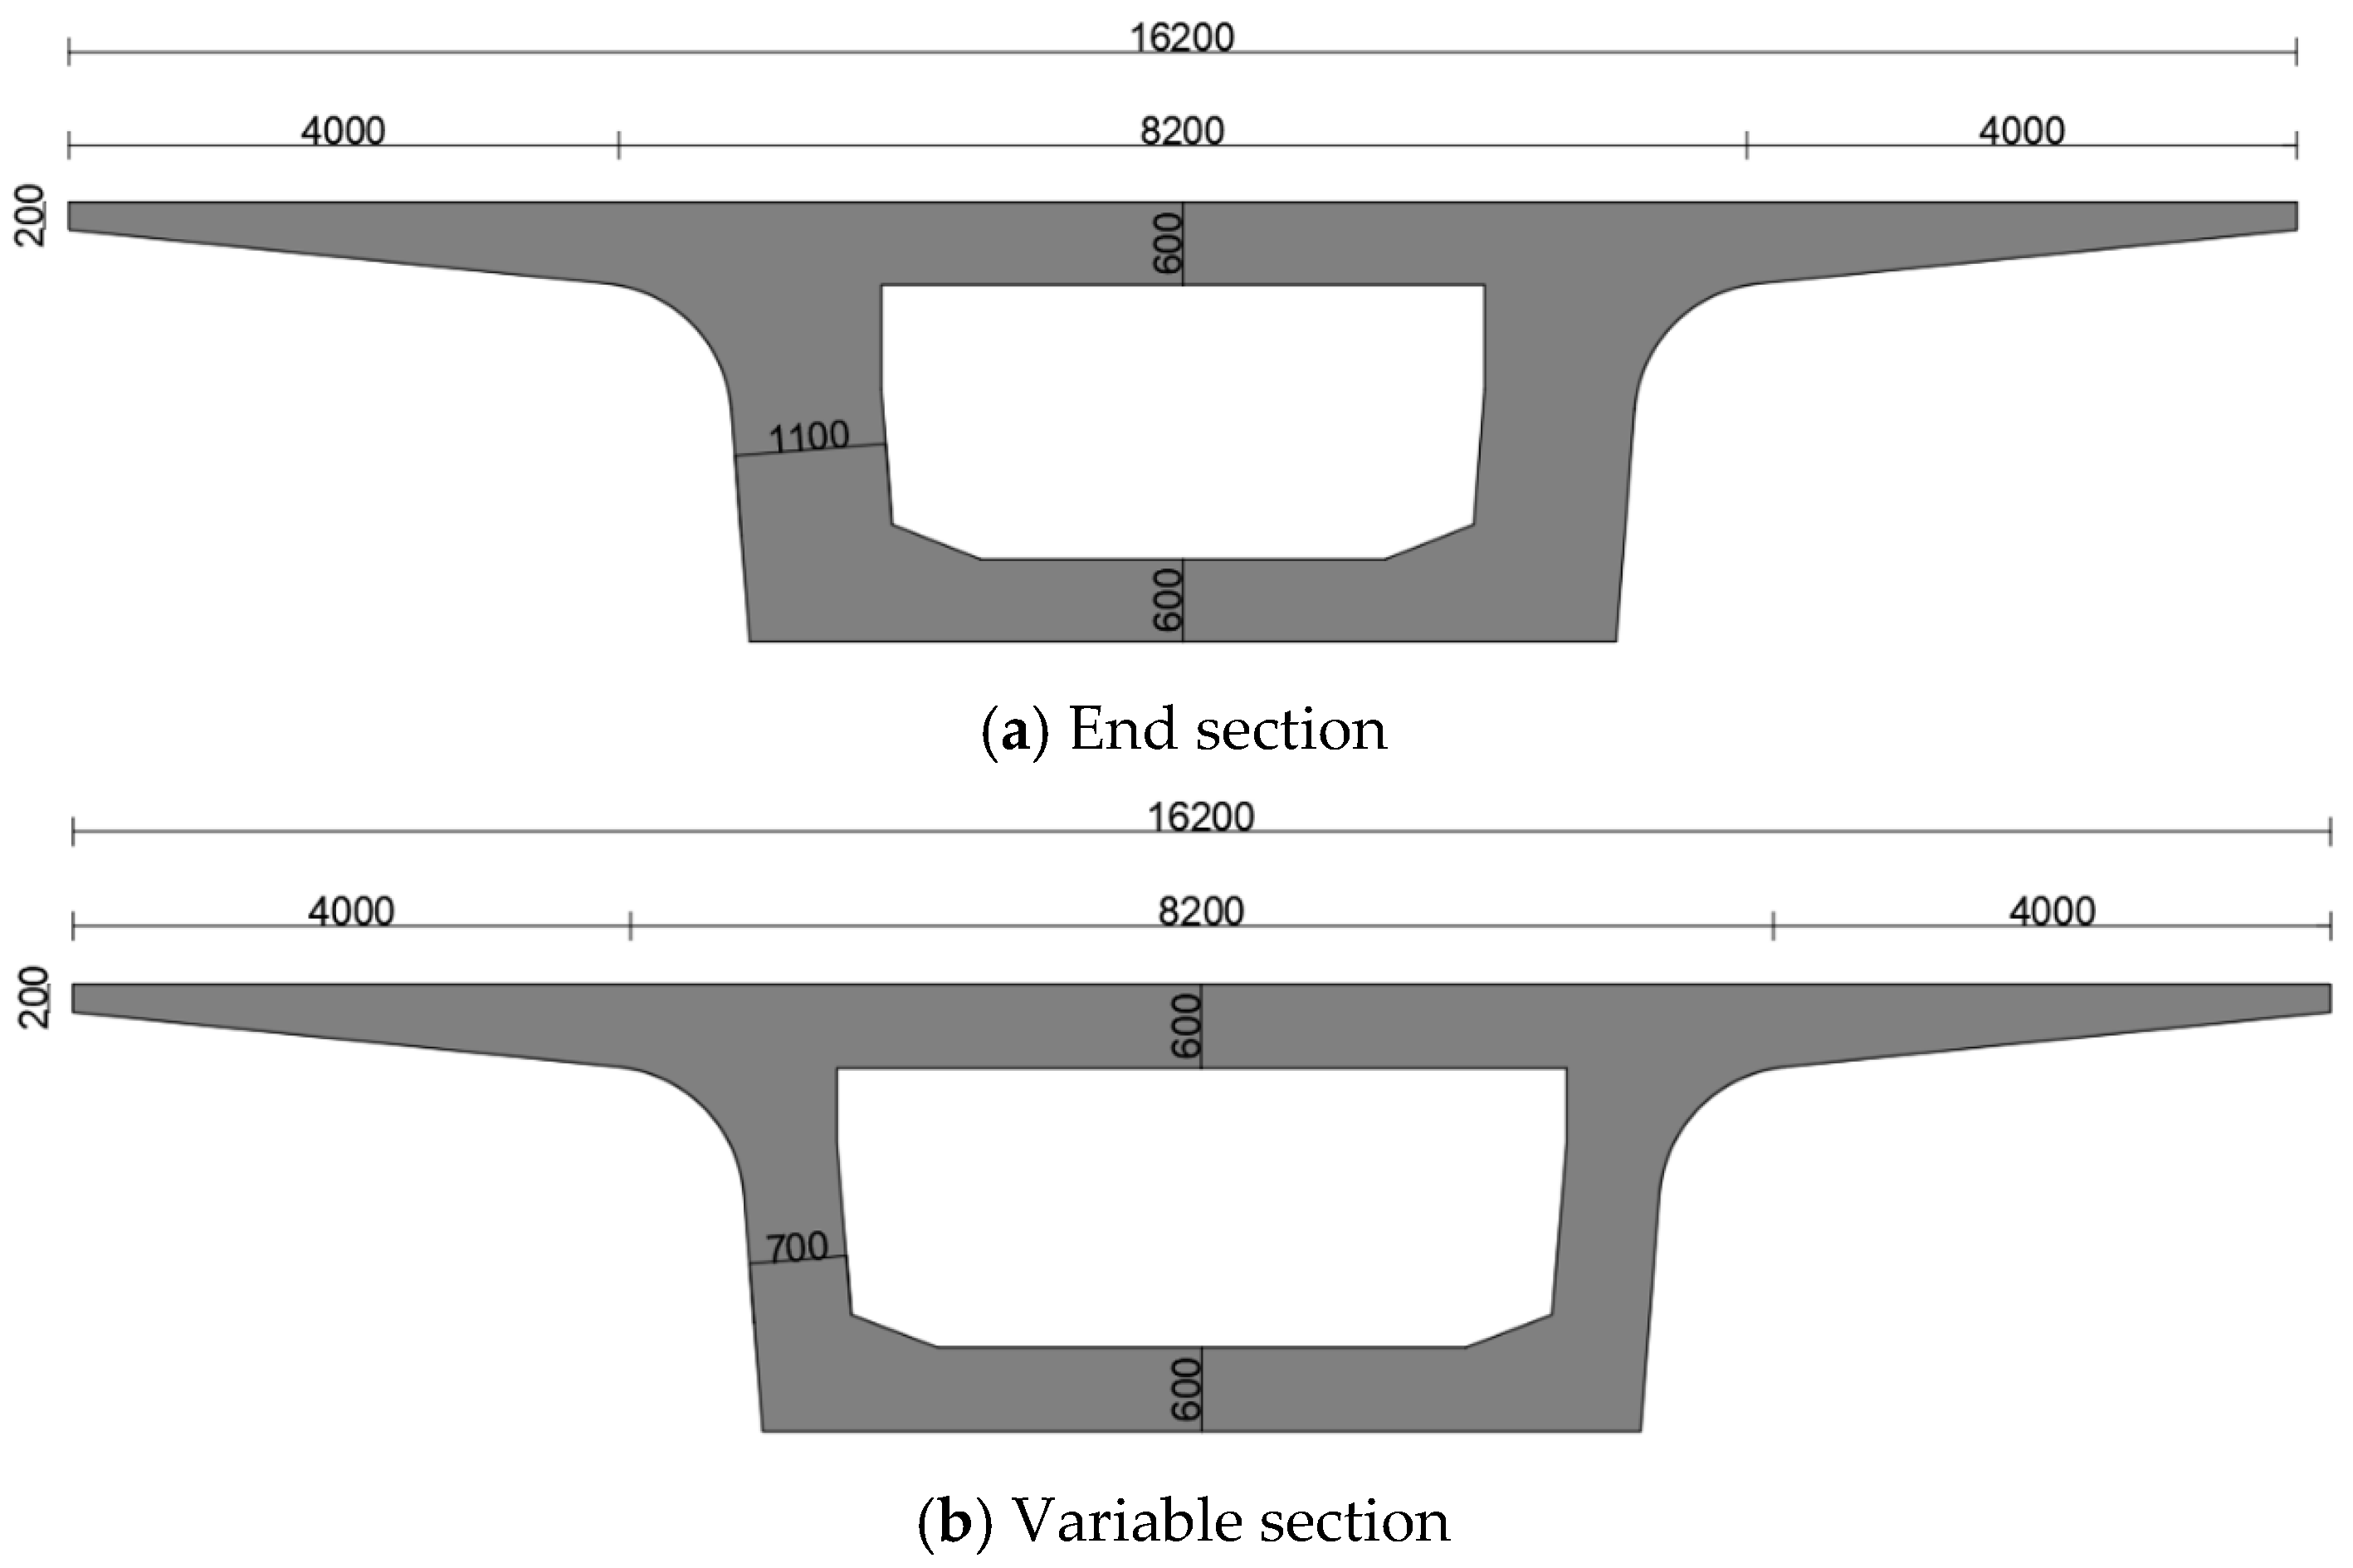
2.1. Project Overview

A 50 m long LVBG from a bridge construction project was selected as the experimental subject. Mix design and material proportions of concrete for large-volume box girders are as shown in Table 1. The LVBG had overall dimensions of 50 m in length, 16.3 m in width, and 3.2 m in height, with a height-to-span ratio of 1:15.625 (Figure 1). The flange cantilever extended 4 m, with a thickness of 20 cm at the tip and 60 cm at the root. The top plate thickness was 28 cm at mid-span, increasing to 60 cm near the pivot points. Similarly, the bottom plate measured 27 cm in thickness at mid-span and thickened to 60 cm near the pier supports. The web thickness varied along the girder length: 50 cm at mid-span, transitioning to 70 cm and 110 cm near the pivot zones.
Figure 2 illustrates the cross-sectional configurations at three critical locations: the end section (maximum web thickness of 110 cm), the variable section (transitional web thickness of 70 cm), and the mid-span section (minimum web thickness of 50 cm).

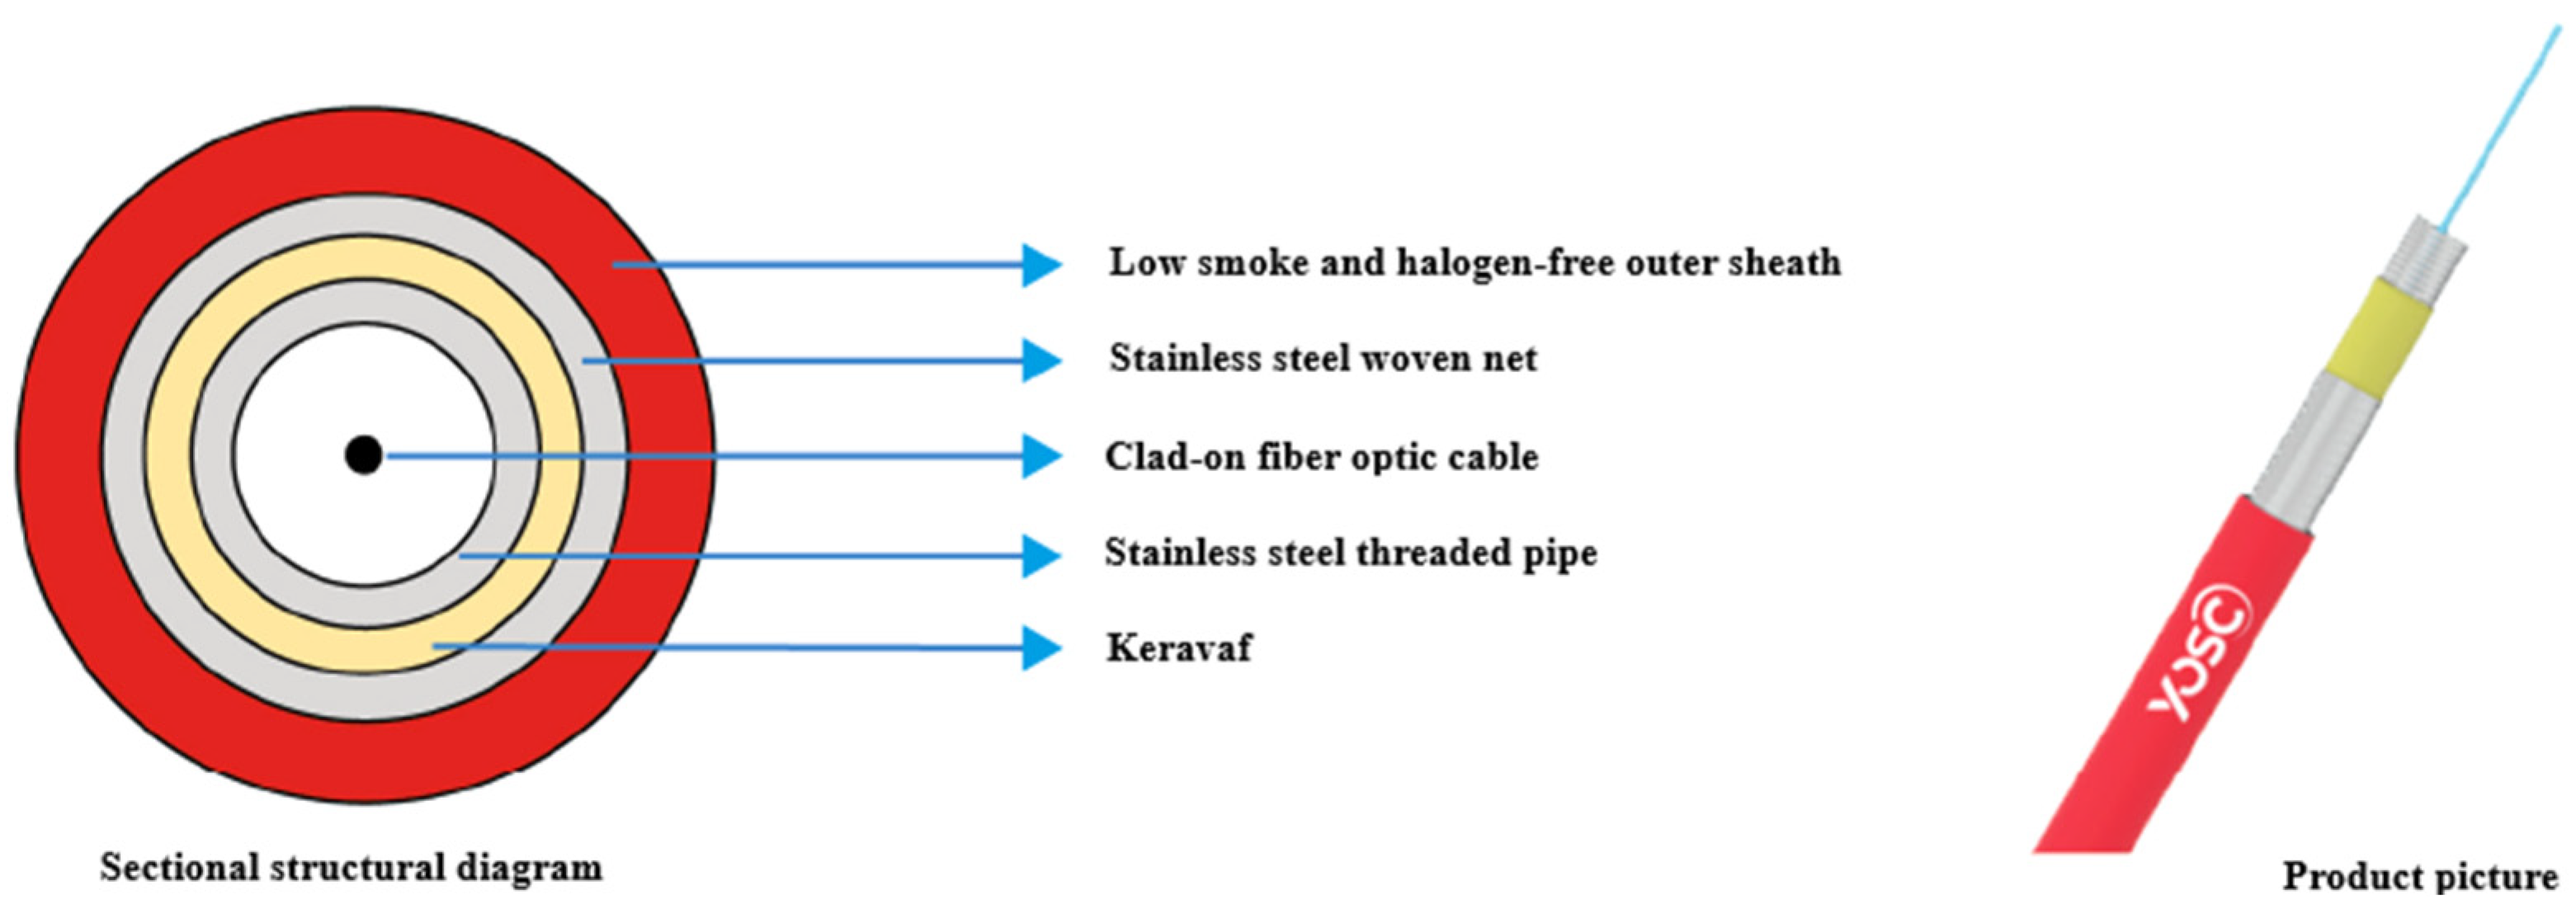
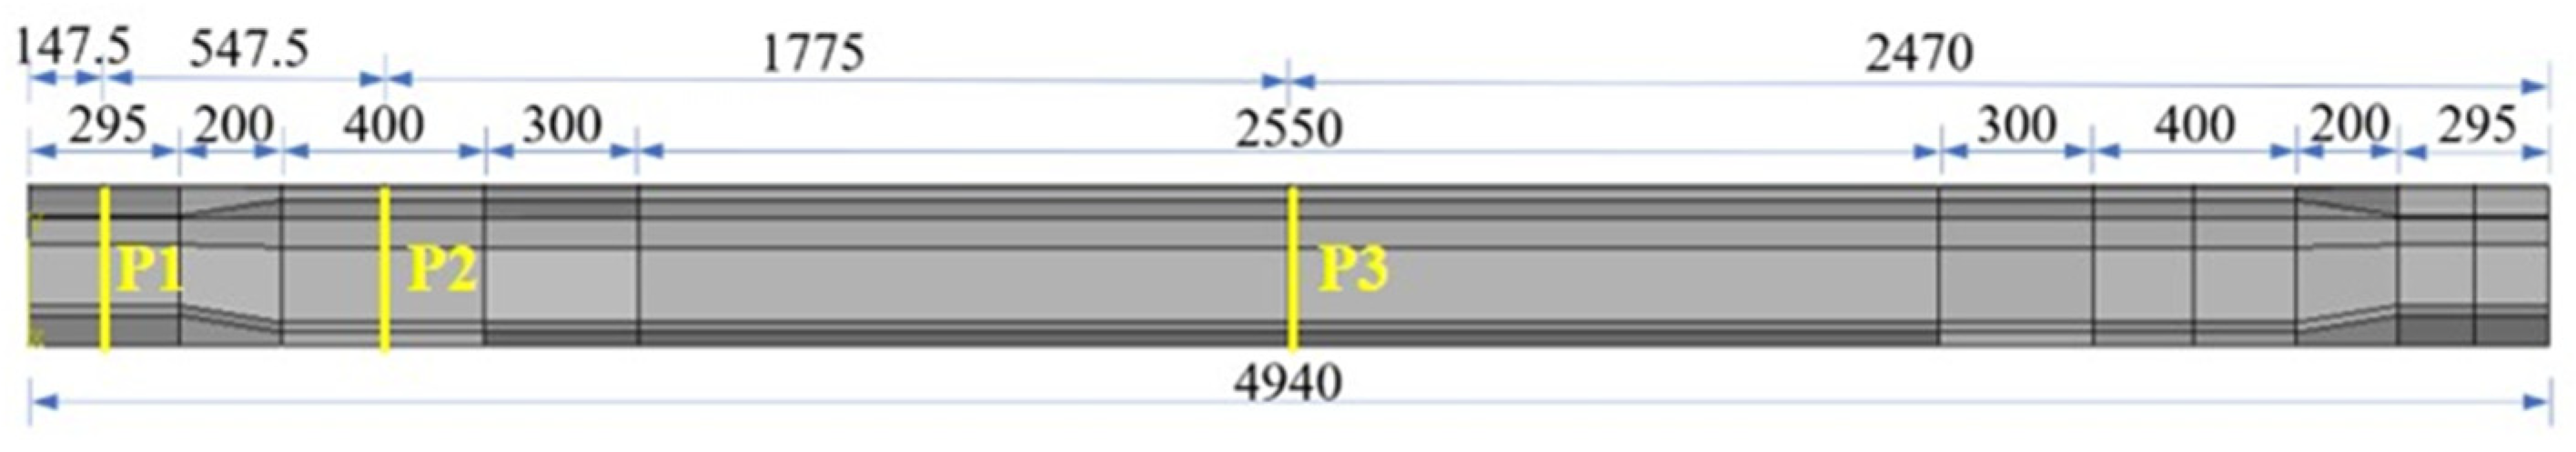
2.2. Instrumentation Layout

A distributed temperature fiber optic sensor system (RP-T-03-MR model, Yangtze Optical Fibre and Cable Joint Stock Limited Company, Wuhan, China) was deployed to monitor the global temperature evolution of the LVBG. As illustrated in Figure 3, Raman scattering-based distributed temperature sensing (DTS) system employs a multi-mode armored sensing cable with stainless steel helical tube reinforcement, providing IP68-rated mechanical protection and strain isolation. Featuring a compact 3.0 mm outer diameter with a LSZH (low smoke zero halogen) jacket, the cable integrates high-temperature resistant acrylate-coated multi-mode optical fiber (OFS Specialty Coatings) to ensure ±0.5 °C measurement accuracy across the operational temperature range of −40 °C to 85 °C [17]. Three continuous optical fibers were installed along the longitudinal axis of the LVBG, with two fibers symmetrically positioned on the upper and lower slab reinforcement layers (Figure 4). A total of eight full-length fibers provided comprehensive coverage across critical zones, enabling spatially resolved temperature measurements.
To validate the DFOS data, point-type semiconductor temperature sensors (JMT-36B, Changsha Jinma Company, Changsha, China, ±0.5 °C accuracy) were co-deployed at three representative cross-sections: the end section (P1), variable section (P2), and mid-span section (P3). As shown in Figure 5, each section included sensors distributed at the core and surface regions of webs, top slabs, and bottom slabs. This dual-sensing strategy allowed direct comparison between distributed and point measurements while ensuring data redundancy.

2.3. Measurement Program

The monitoring protocol was aligned with the LVBG production timeline to capture early-age thermal behavior. A fiber optic demodulator system was used for continuous acquisition, initiating immediately after concrete pouring and spanning 100 h to track the full hydration cycle. Point-type temperature sensors (JMT-36B semiconductor temperature sensors, Changsha Jinma Company, Changsha, China, ±0.5 °C accuracy) were synchronously sampled with distributed temperature fiber optic sensors. This dual-rate strategy balanced spatial resolution (DFOS: 0.1 m spacing) with validation fidelity (point sensors), ensuring temporal synchronization through GPS-timestamped data logging.

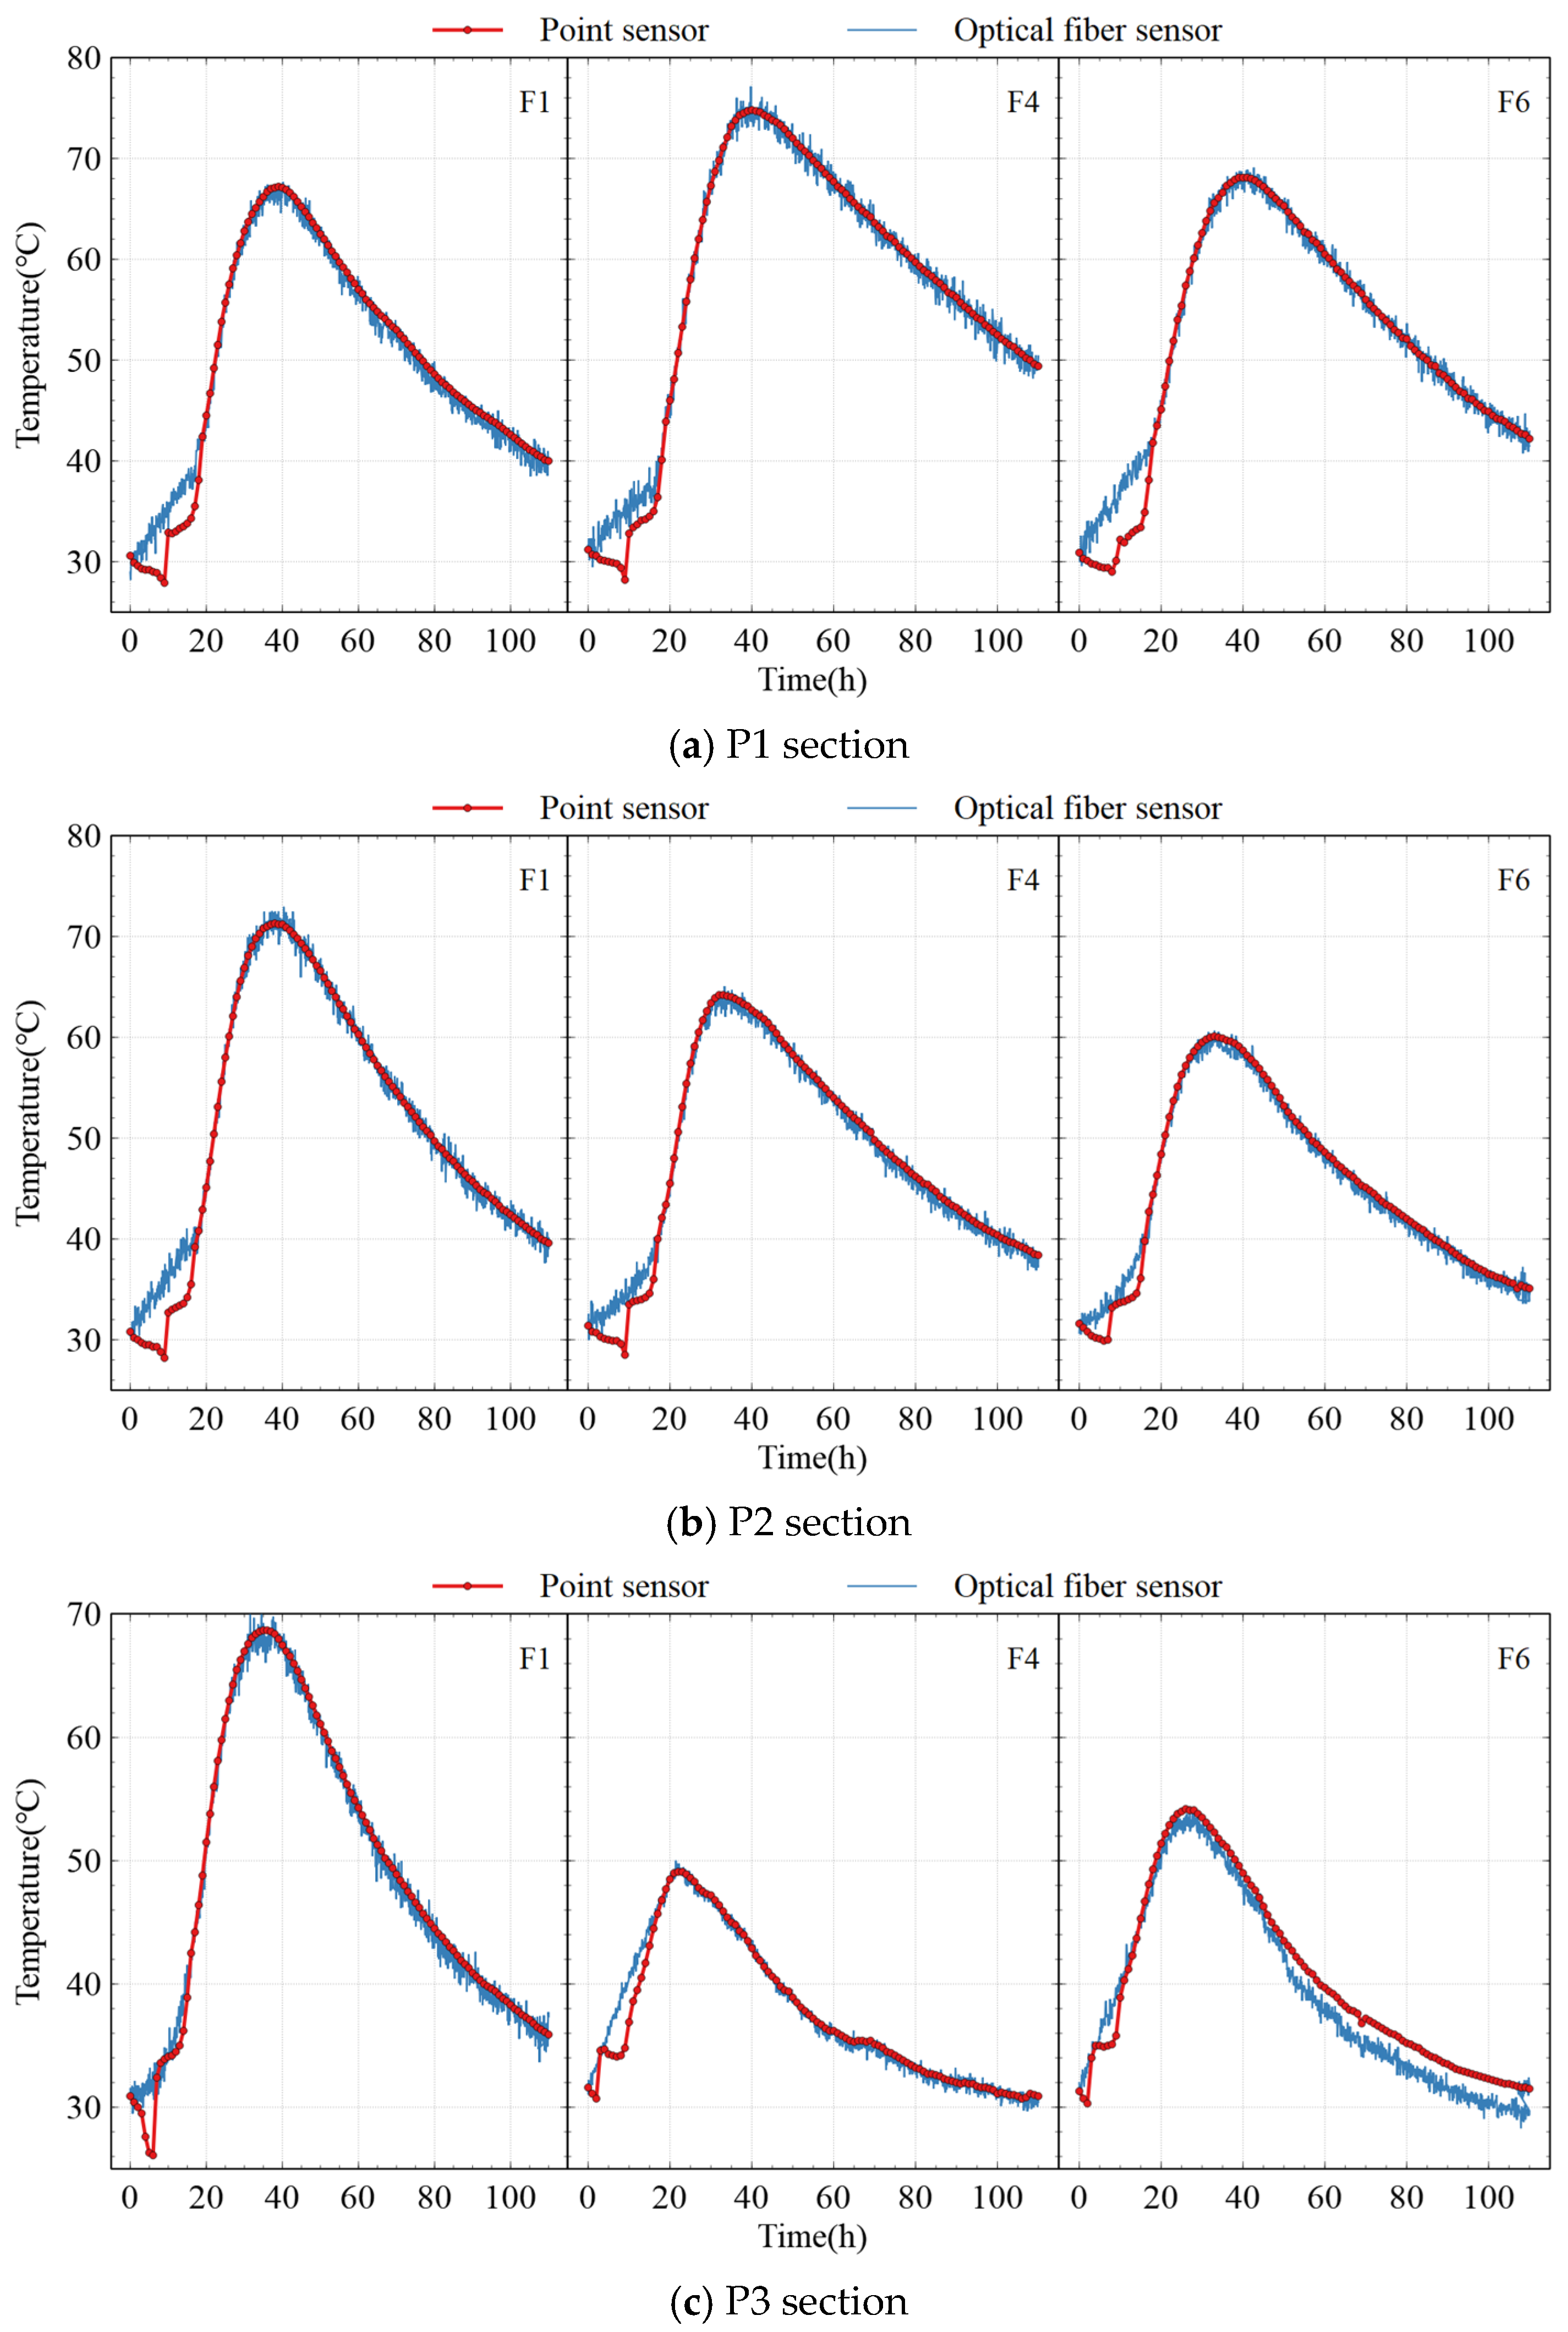
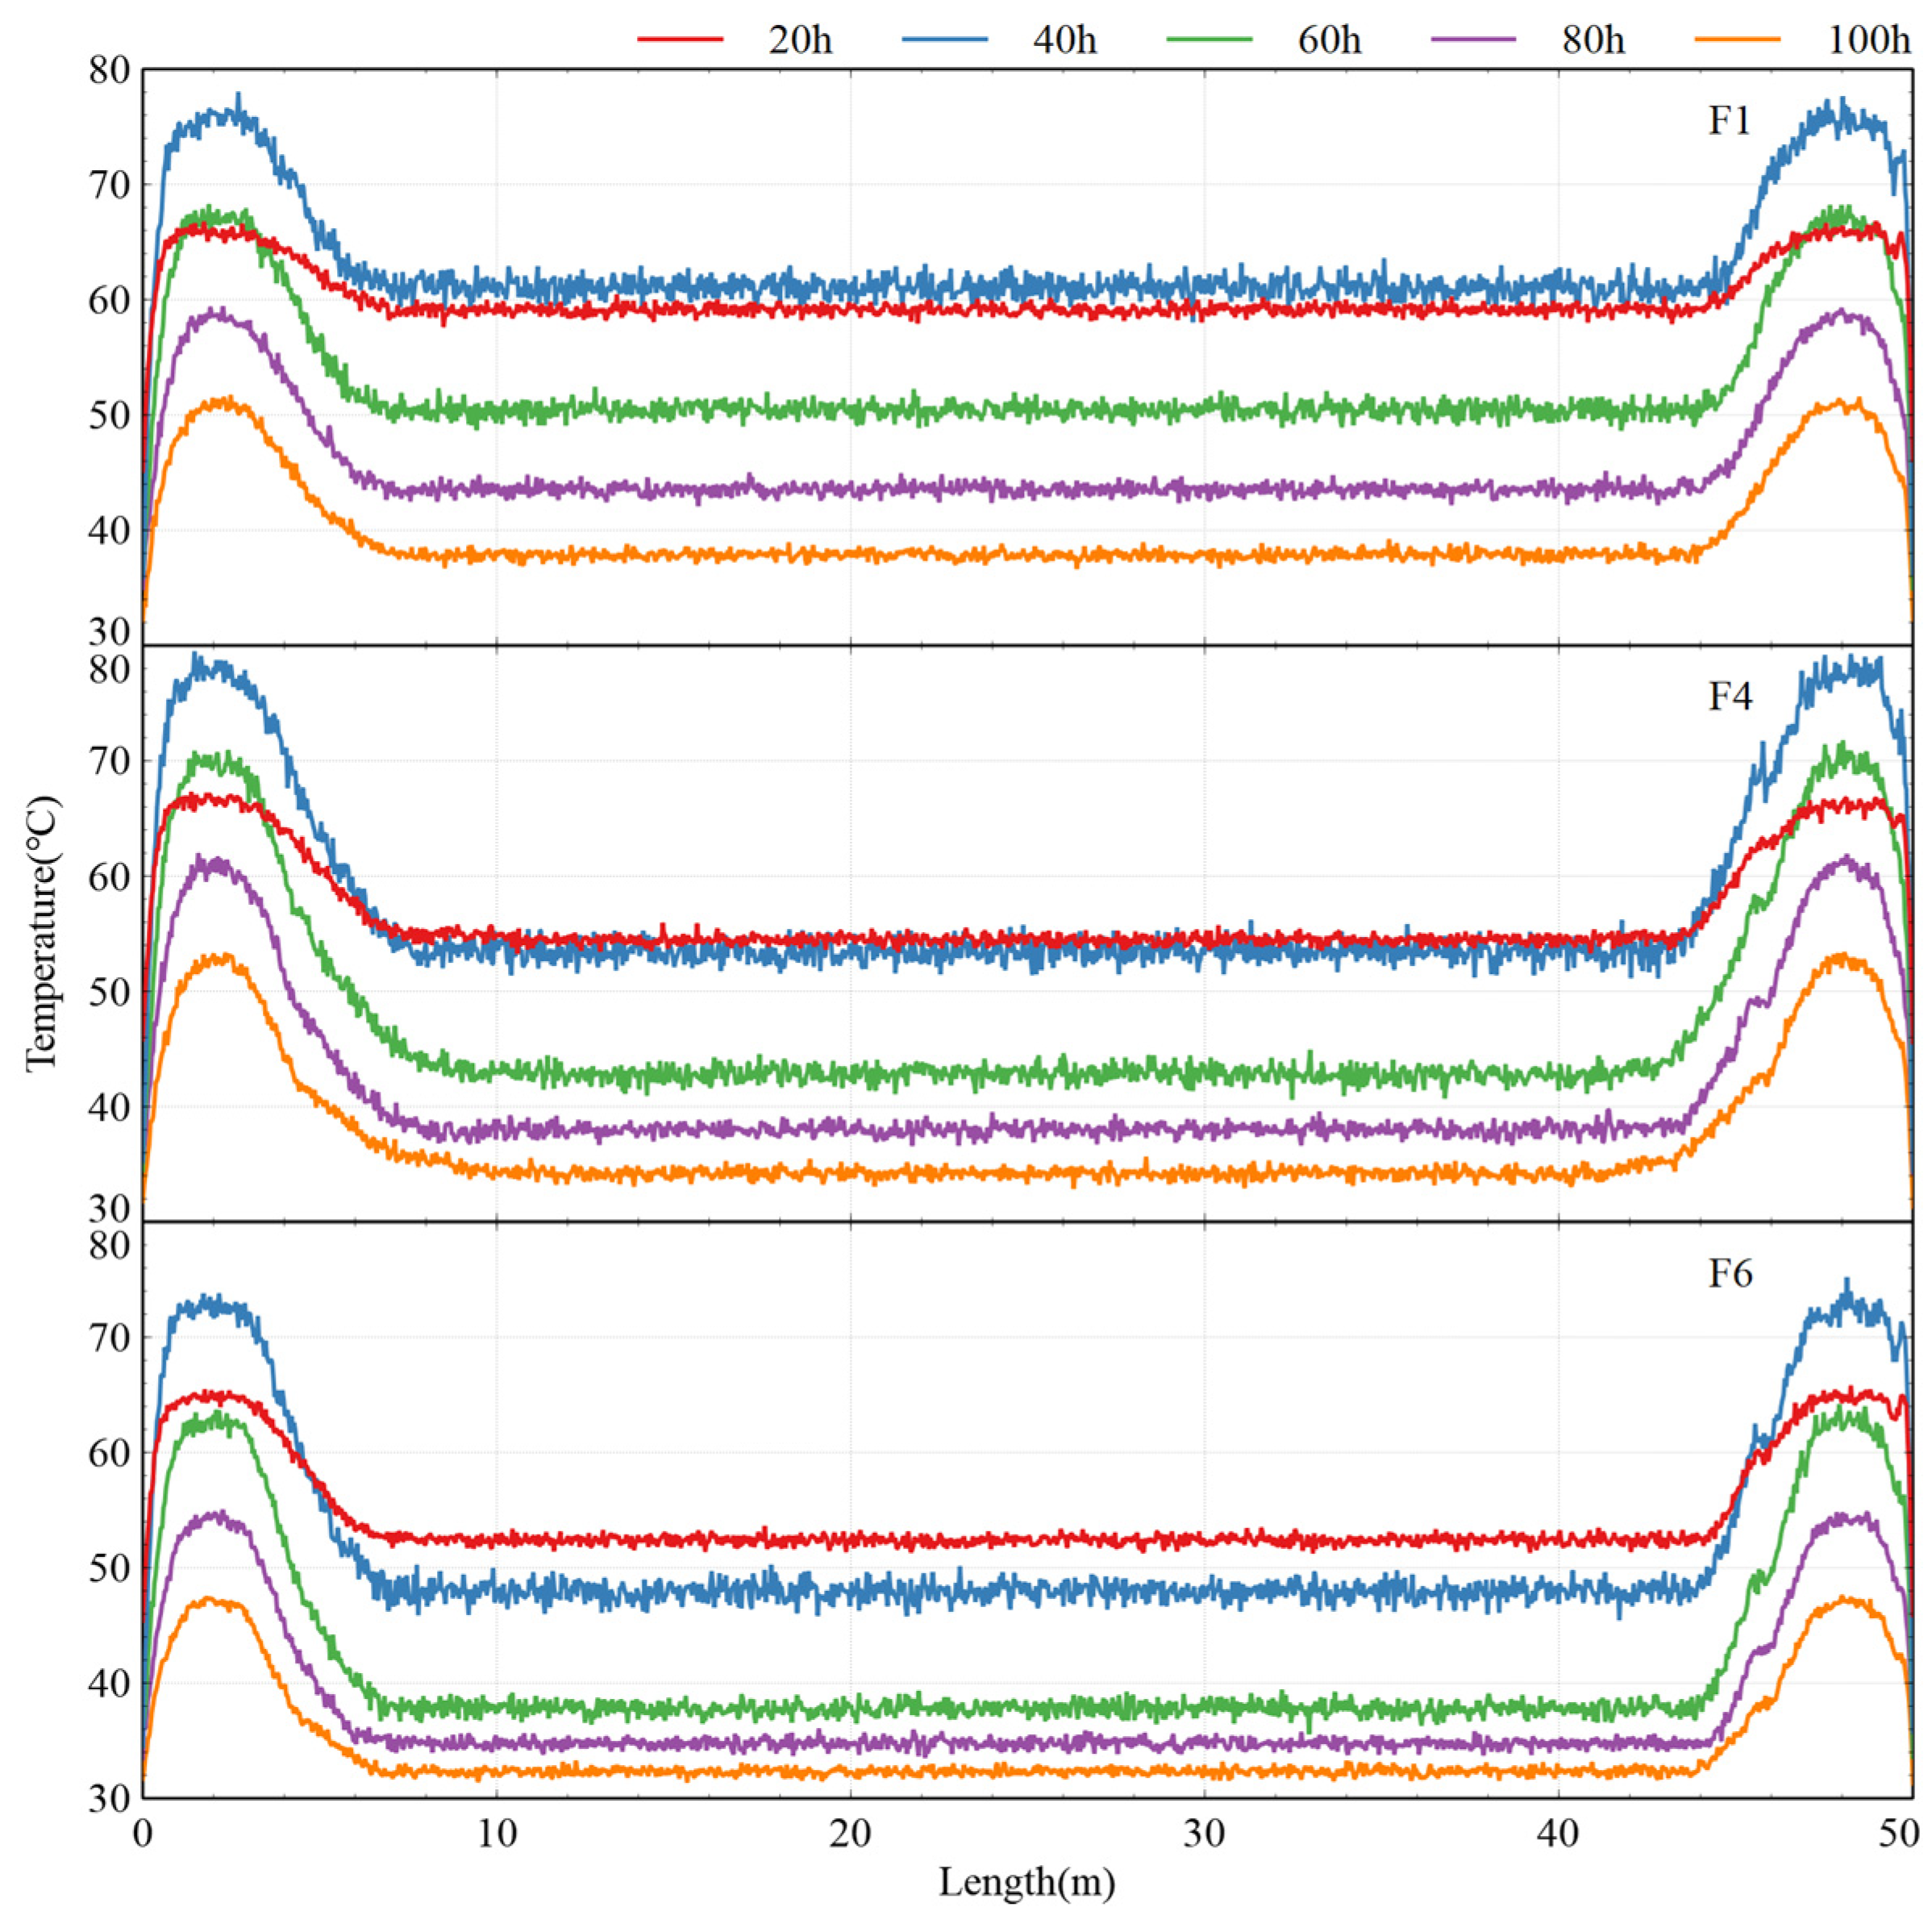
3. Field Test Results

The temperature evolution of the LVBG test section over time is illustrated in Figure 6. Measurements from both DFOS and point-type sensors showed consistent trends, confirming the reliability of the DFOS technology. The LVBG exhibited a distinct three-phase temperature evolution. During the first 40 h, rapid heating dominated due to intense hydration reactions, with core temperatures rising at an average rate of 1.88 °C/h to reach a peak of 79.4 °C. This was followed by a sustained high-temperature phase (40–60 h), where thermal inertia maintained core temperatures above 75 °C, particularly in web regions with limited heat dissipation. Beyond 60 h, gradual cooling prevailed at a rate of 0.45 °C/h as hydration weakened and natural convection became the primary heat transfer mechanism. The thicker web at the end of the P1 section resulted in a higher temperature peak, compared to the other two sections. At the top and bottom plates of the LVBG, the generated peak temperature was lower, due to the lower heat output and efficient heat dissipation, the experimental results align with the three-stage hydration temperature evolution pattern (rapid heating, sustained high temperature, and gradual cooling) reported by Sun et al. [18] for mass concrete structures, confirming the universality of hydration-driven thermal dynamics. However, notable differences exist in peak temperature magnitudes and timing. For instance, our measured peak temperatures of 77 °C–79.4 °C exceed the 72 °C–77 °C range observed by Sun, likely due to differences in binder composition—our optimized mix incorporated higher proportions of slag and fly ash (50% of total cementitious materials) to mitigate early heat release, whereas their study utilized conventional high-cement mixes. Additionally, our peak temperature occurred at 40–60 h, delayed compared to their 30–40-h range, a divergence attributable to improved insulation measures (e.g., steam curing and windbreak fabrics) that slowed surface heat dissipation. These variations underscore the critical role of material design and environmental control in modulating hydration kinetics. Hence, hydration heat issues are rare in these areas.
Compared to traditional point sensors, DFOS technology enables comprehensive longitudinal temperature monitoring across the entire LVBG. Figure 7 illustrates the longitudinal temperature distribution at five critical time points (20, 40, 60, 80, and 100 h) during the hydration process. The results reveal a distinct spatial pattern characterized by lower temperatures at mid-span and elevated temperatures toward both ends. This phenomenon arises from heat accumulation in thicker web regions near the girder ends (110 cm thickness at P1) and efficient heat dissipation in thinner mid-span sections (50 cm thickness). The DFOS system captured this gradient with a spatial resolution of 0.1 m, demonstrating its capability to resolve localized thermal anomalies that point sensors may overlook. Such spatially resolved data provide critical insights for optimizing formwork insulation and cooling strategies in LVBG construction.

4. Parametric Analysis of Residual Stress

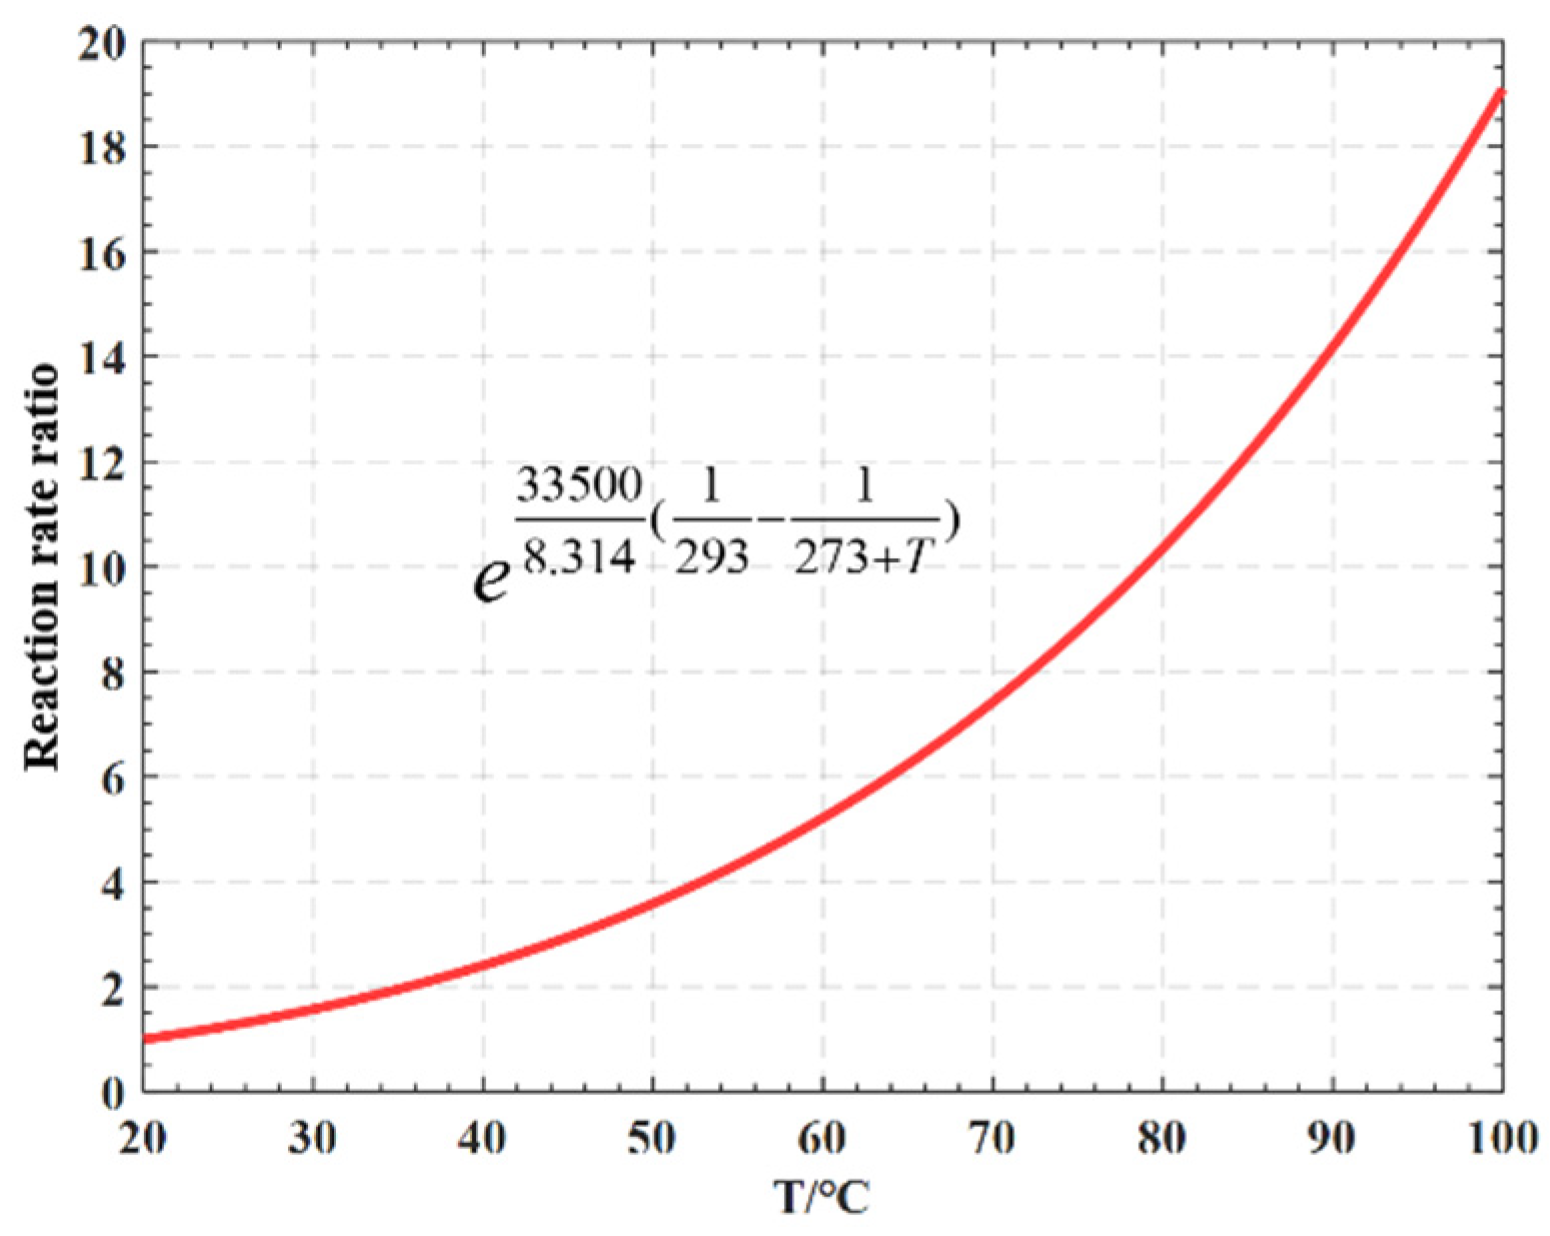
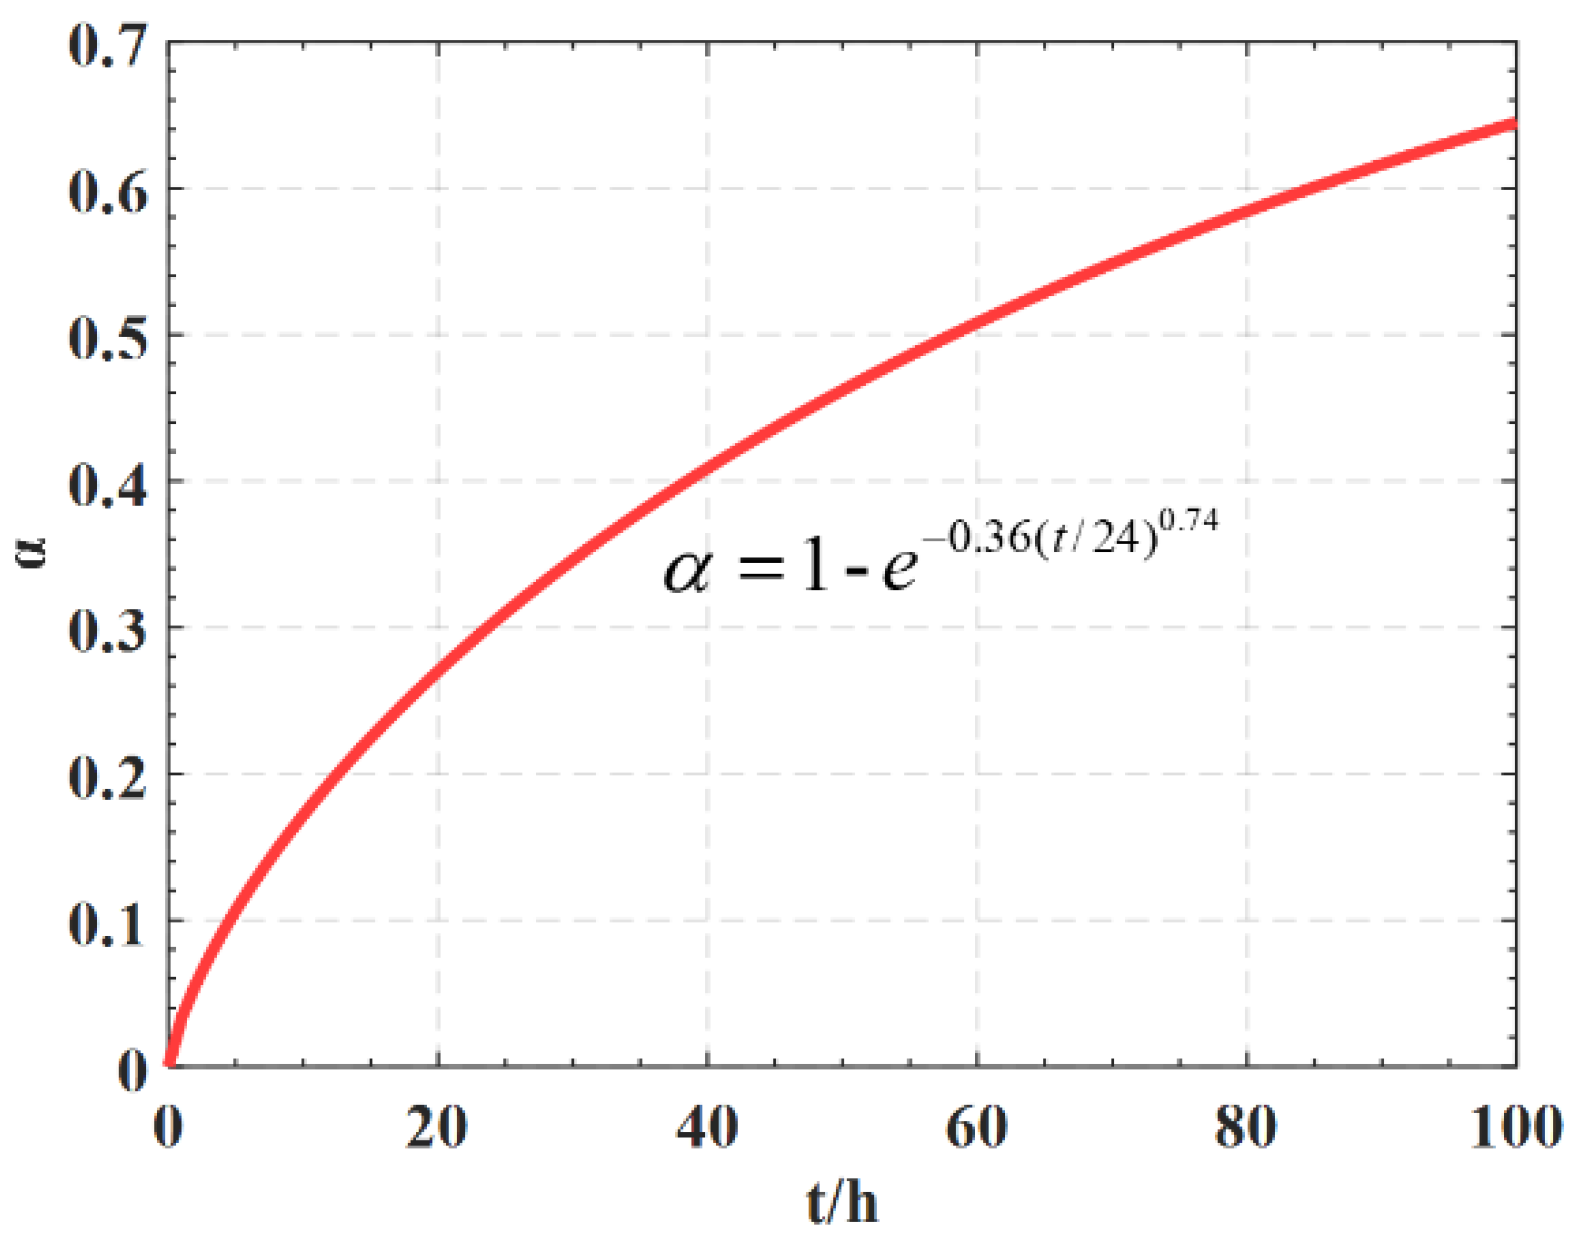
4.1. Principle of Temperature Field Calculation
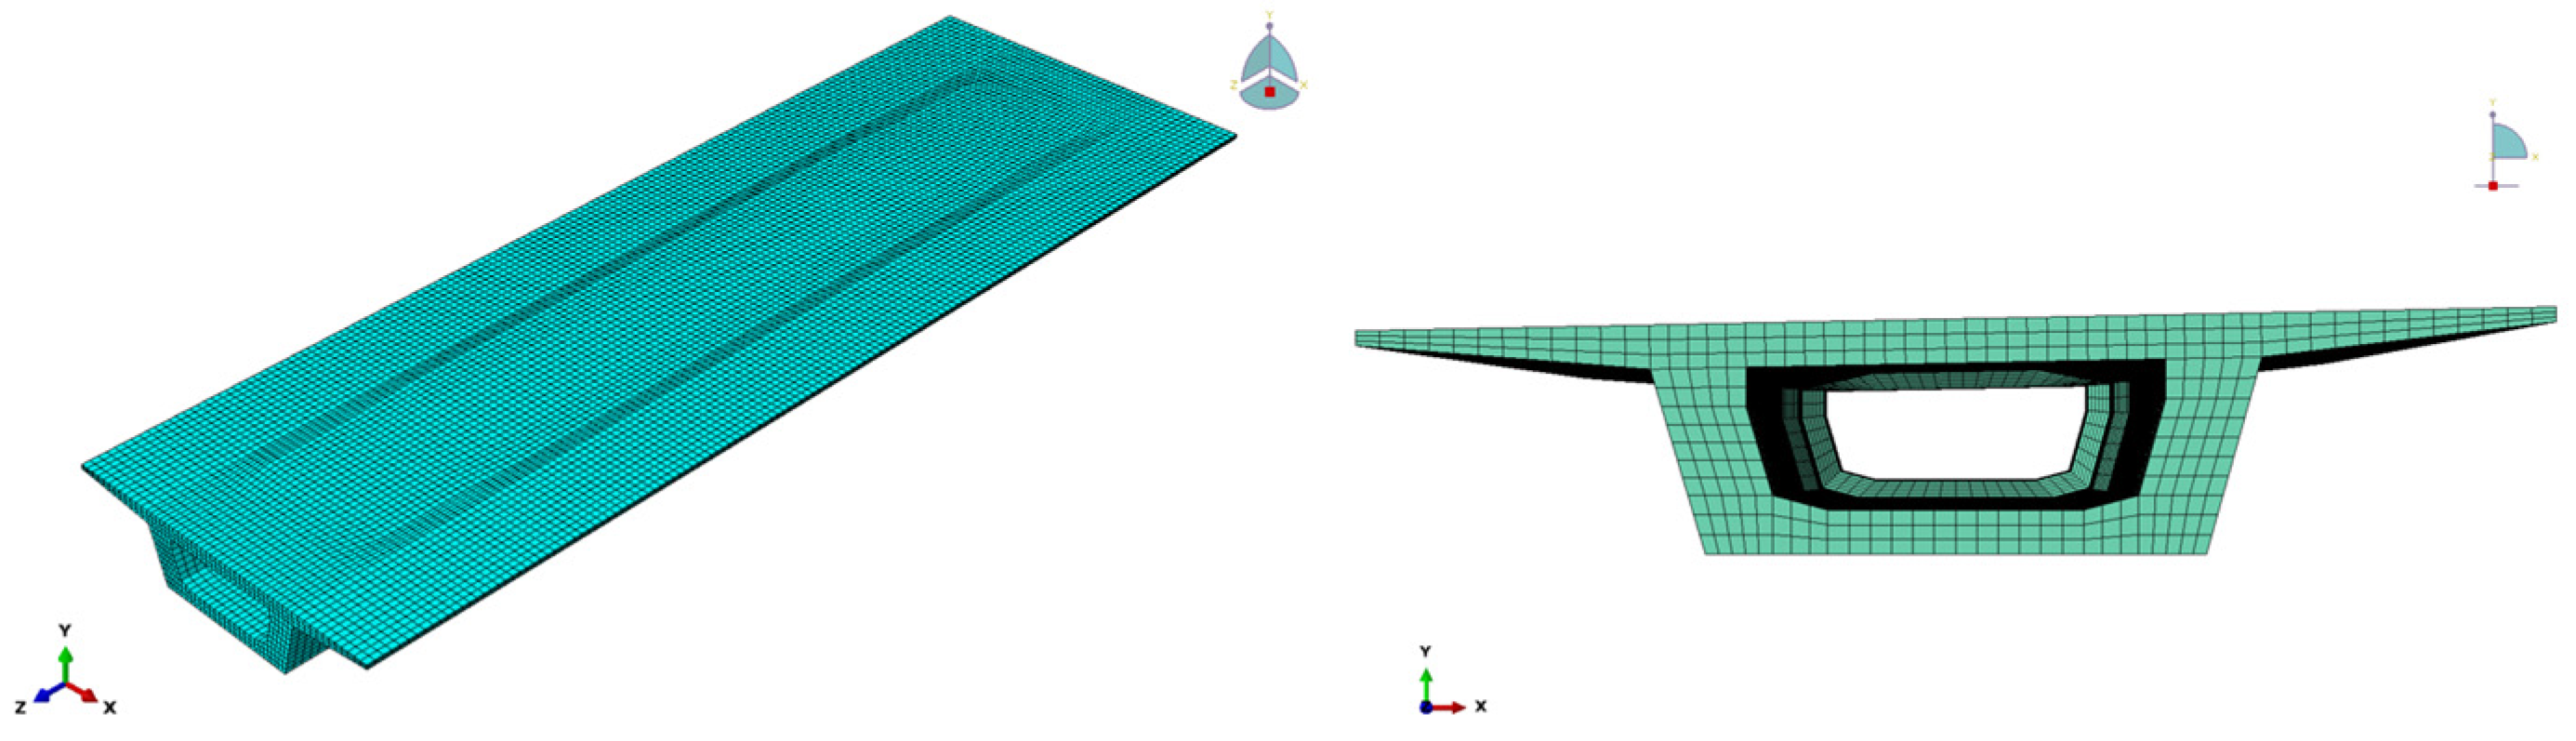
The basic equation for temperature field calculation is the Fourier differential equation, as shown in Equation (1). In Equation (1), λ is the thermal conductivity coefficient, kJ/(m·h·°C); T is the temperature, °C; Q is the heat generated by the hydration of cement per unit volume; ρ is the density, kg/m3; c is the specific heat, kJ/(kg·°C), τ denotes time, h.
λ ( 2 T x 2 + 2 T y 2 + 2 T z 2 ) + Q = ρ c T τ
Accurately predicting temperature evolution in cementitious systems requires integrating multiple interdependent factors—including chemical kinetics, thermal parameter variations, and environmental boundary conditions—posing significant modeling challenges. Traditional approaches oversimplify hydration heat simulations by assuming uniform heat release across spatial domains and considering only age-dependent hydration rates. This neglects temperature-dependent reaction kinetics, leading to prediction inaccuracies in thick concrete sections where self-heating dominates.
To address these limitations, the equivalent age concept was introduced through the following Arrhenius-based formulation:
t e = 0 t exp [ E a R ( 1 T ( τ ) 1 T ref ) d τ ]
where t e is the equivalent age (h), E a denotes the apparent activation energy (kJ/mol), R is the universal gas constant (8.314 J/(mol·K)), T(τ) represents the time-dependent temperature (K), and T ref is the reference temperature (typically 293 K). This formulation quantifies the cumulative thermal effect on hydration progress, enabling temperature-compensated age calculations critical for simulating realistic thermochemical behavior in LVBG.
From Equation (2), the relationship between chemical reaction rate and temperature was derived, as illustrated in Figure 8. The results demonstrate an exponential acceleration of hydration kinetics with increasing temperature. Specifically, at 100 °C, the reaction rate reaches 19 times its value at the reference temperature of 20 °C (293 K). This pronounced temperature dependence underscores the necessity of incorporating thermal effects into hydration heat simulations for early-age concrete. Ignoring this relationship introduces significant prediction errors—exceeding 30% in thick-web regions—rendering numerical models unreliable for crack risk assessment. Consequently, temperature-aware hydration modeling is critical for accurate thermal stress analysis and preventive strategy optimization in LVBG applications.
The hydration degree, defined as the extent of cementitious material reaction at a given curing age, serves as a critical metric for quantifying hydration progress. This parameter is intrinsically linked to the adiabatic temperature rise (θ) through a linear relationship with the cumulative heat release (Q) from hydration reactions. Specifically, the proportionality between hydration degree and θ is expressed in Equation (3), derived from calorimetric and thermochemical analyses. This correlation enables indirect determination of hydration kinetics via temperature measurements, providing a practical framework for modeling time-dependent thermal behavior in early-age concrete systems.
α ( t e ) = Q ( t e ) Q 0 = θ ( t e ) θ 0
In Equation (3), Q t e and θ t e denote the cumulative hydration heat ( k J / m 3 ) and adiabatic temperature rise (°C) at equivalent age t e , respectively, while their ultimate values Q 0 (total hydration heat) and θ 0 (total adiabatic temperature rise) jointly define the hydration degree α t e via linear proportionality.
In practical engineering, the hydration heat release of concrete is typically characterized through adiabatic temperature rise experiments. When experimental data are unavailable, the adiabatic temperature rise can be modeled using a combined exponential function (Equation (4)). This formulation is widely adopted due to its capability to replicate the nonlinear evolution of hydration heat, particularly during the early stages of cementitious reactions.
θ ( t e ) = θ 0 ( 1 - e a t b )
where θ 0 denotes the ultimate hydration heat (350 kJ/kg), t represents curing time in days, and parameters a = 0.36 and b = 0.74 were calibrated at 20 °C. By substituting Equation (4) into the thermochemical coupling framework and converting the temporal unit from days to hours ( τ = 24 t), we derive this age-dependent hydration degree function:
α = 1 - e 0.36 ( t / 24 ) 0.74
The hydration degree evolution predicted by Equation (5) is illustrated in Figure 9. Without accounting for equivalent age effects, the hydration degree reaches 64.5% at 100 h after pouring. However, this value represents an idealized scenario under constant reference temperature (20 °C). In practice, temperature fluctuations significantly alter hydration kinetics: elevated temperatures (e.g., >30 °C) accelerate reaction rates, increasing the hydration degree beyond 64.5%, while lower temperatures (e.g., <10 °C) decelerate reactions, reducing it proportionally. This temperature dependence arises from the Arrhenius relationship embedded in the equivalent age formulation (Equation (2)), which dynamically adjusts the effective hydration time based on thermal history. For instance, a 10 °C temperature increase can elevate the equivalent age by ~25%, corresponding to a hydration degree increase of 5–8 percentage points under typical curing conditions. These findings underscore the necessity of temperature-compensated modeling for accurate hydration progress prediction in LVBG.
Under adiabatic conditions, the temperature evolution of concrete due to cement hydration is governed by
θ t = Q c ρ = W q c ρ
where θ denotes the adiabatic temperature rise ( ° C ), W is the cement content ( kg / m 3 ), q represents the hydration heat release rate per unit mass of cement ( kJ / kg h ), c is the specific heat capacity of concrete ( kJ / kg C ), and ρ is the density of concrete ( kg / m 3 ).
Substituting Equations (3) and (6) into Equation (1), the governing heat conduction equation for early-age concrete is derived as
[ λ ( α ) T ] + ρ c ( α ) θ t = ρ c ( α ) T t
where λ α denotes the thermal conductivity dependent on hydration degree α (kJ/(m·h·°C)), c α represents the specific heat capacity varying with α (kJ/(kg·°C)), ρ is the density of concrete (kg/m3), T signifies the temperature field (°C), θ stands for the adiabatic temperature rise (°C) as a function of equivalent age t e , and t indicates the pouring age of concrete (hours).

4.2. FEM

The transient temperature field induced by early hydration heat in the 50 m precast LVBG was simulated using ABAQUS software. A three-dimensional eight-node linear heat transfer hexahedral element (DC3D8) was adopted for thermal analysis. The FEM comprised 275,480 elements with a uniform mesh size of 300 mm, ensuring a balance between computational efficiency and spatial resolution. Figure 10 illustrates the meshing configuration of the LVBG, highlighting refined discretization near critical regions such as web-core zones and thickened flange sections. This meshing strategy effectively resolves steep thermal gradients while maintaining numerical stability during transient simulations.
The LVBG concrete, with a specified strength grade of C50 and density of 2405.6 kg/m3, exhibits hydration-dependent thermal conductivity during hardening. This relationship is described by Equation (8) [19].
λ ( α ) = λ f × ( 1.33 0.33 α )
where λ α denotes the thermal conductivity of concrete ( κ /(m·h °C)) at hydration degree α , λ f = 9.185 represents the final thermal conductivity of fully hardened concrete, and α is the hydration degree ranging from 0 (fresh) to 1 (fully hydrated).
The specific heat of early concrete is affected by the concrete mix ratio and hydration level, which can be described by Equation (9) [20].
c = W c α c c e f + W c 1 α c c + W α c a + W w c w ρ
where c and W denote specific heat and mass, with subscripts indicating cement c, aggregate a, and water w, respectively. ρ is the density of concrete, c c e f is the assumed specific heat, c c e f = 0.0084 T c + 0.339 , T c is the current temperature, c c is the specific heat of cement taken as 1140 J / ( k g ° C ) , c a is the specific heat of concrete taken as 678 J / ( k g ° C ) , and c w is the specific heat of cement taken as 4187 J / ( k g ° C ) .
The exothermic coefficient β of a solid surface correlates with its roughness and the surrounding wind speed v a . The calculation of the exothermic coefficient of a rough surface can be described by Equation (10) [21].
β = 21.06 + 17.58 ν a 0.910
The variables are defined as follows: β represents the heat transfer coefficient (W/(m2·°C)) and Va denotes the air velocity (m/s).
The transient thermal behavior of the precast concrete box girder during the initial 100 h was simulated using ABAQUS software integrated with a UMATHT subroutine, which dynamically updated hydration-dependent thermal parameters (thermal conductivity and specific heat) based on equivalent age. Initial conditions were set to a concrete mold temperature of 30 °C, while ambient temperatures were imported from field measurements. As shown in Figure 11, the analysis revealed a distinct three-stage evolution of the temperature field.
During the first 40 h, rapid heating dominated as hydration reactions intensified, driving core temperatures to a peak of 79.4 °C. This phase highlighted the significant heat accumulation in thick-web regions, particularly in the 110 cm web-core zone.
The temperature evolution exhibited distinct phase-specific characteristics. During the 40–60 h period, thermal inertia sustained core temperatures above 75 °C, while limited surface cooling maintained elevated thermal gradients, exacerbated by the thick-web geometry (110 cm) that impeded efficient heat dissipation. Beyond 60 h, gradual cooling prevailed as hydration weakened and natural convection dominated heat transfer, with core temperatures declining steadily at 0.45 °C/h to 53.8 °C at 100 h and core-surface gradients diminishing to 26.1 °C. Spatially, the thick-web core region demonstrated the highest thermal risk, whereas thin-walled components (27–28 cm top/bottom plates) maintained thermal stability with peak temperatures below 35 °C due to rapid heat dissipation. Numerical results aligned closely with field data, validating the thermal parameter model and underscoring the necessity of region-specific thermal management strategies.

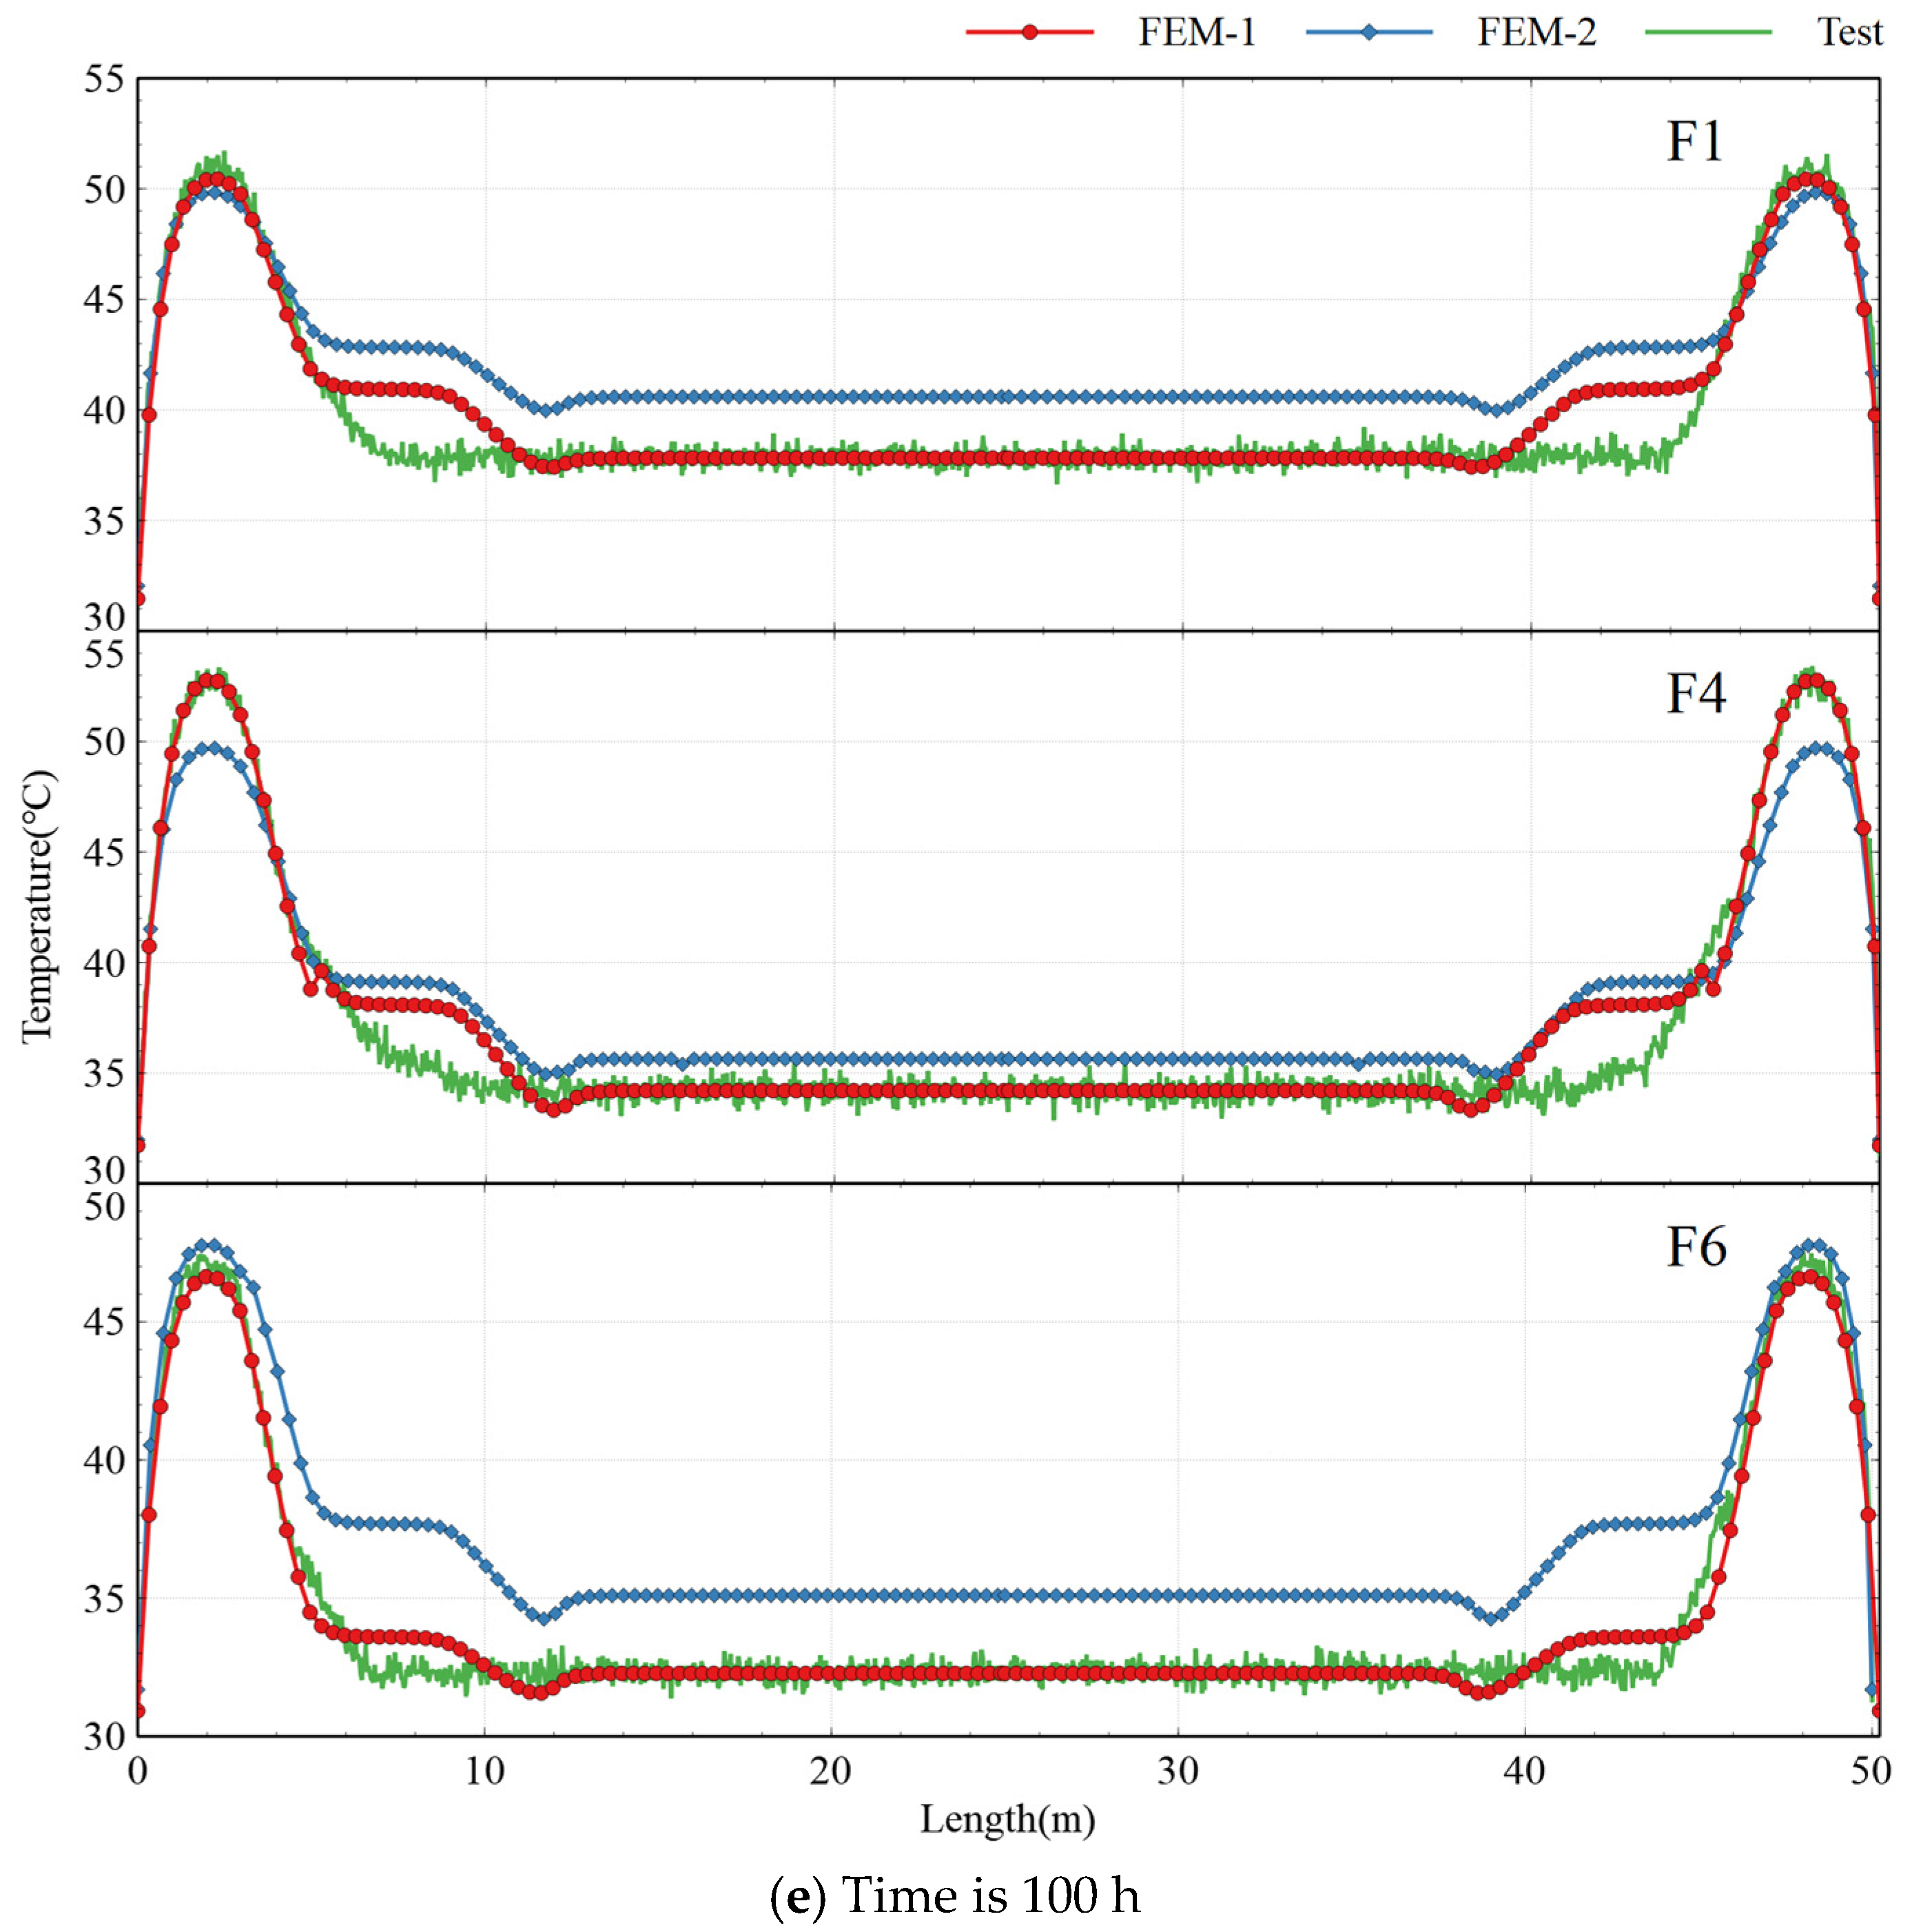
4.3. Model Validation

Figure 12 compares the experimental results (test) with two sets of numerical simulations: one incorporating hydration degree and temperature-dependent thermal parameters (FEM-1), and another neglecting these factors (FEM-2). The comparative analysis demonstrates that FEM-1 achieves significantly better agreement with experimental data, while FEM-2 exhibits substantial deviations, with a maximum error of 40%. The integration of a hydration degree dynamic model based on equivalent age significantly enhances the accuracy of temperature field predictions in this study, complementing and extending the temperature-dependent reaction kinetics framework proposed by Alexander et al. [22]. As noted in [22], traditional static thermal parameter models often yield substantial prediction deviations (exceeding 30%) in core temperature peaks due to their neglect of nonlinear variations in thermal conductivity and specific heat during hydration. In contrast, our approach dynamically updates hydration-dependent thermo-physical parameters (Equations (8) and (9)) through a UMATHT subroutine, reducing prediction errors to 8.6% (Figure 12) and demonstrating superior adaptability in capturing thermal gradients within thick web regions (110 cm). Specifically, the temperature peaks consistently localize at the web of the P1 end section. At point F4, the measured maximum temperature reaches 74.8 °C, closely matching the FEM-1 prediction of 74.0 °C, thereby validating the model’s capability to replicate real-world thermal behavior. This alignment in both peak location and magnitude confirms the reliability of the hydration degree- and thermal parameter-integrated FEM in predicting temperature fields, particularly in critical thick-web regions prone to steep thermal gradients.

5. Conclusions

This study investigates the variation patterns of the temperature field in LVBGs. Field experiments were conducted on a LVBG, utilizing DFOS to obtain temperature data along the entire length of the LVBG, which was subsequently compared with data from traditional point sensors. Furthermore, a refined finite element model was developed using ABAQUS and the UMATHT subroutine through secondary development, incorporating the effects of hydration degree, thermal conductivity, and specific heat as functions of equivalent age. The main conclusions are as follows:
  • DFOS demonstrated significant advantages over conventional point-type sensors, enabling comprehensive, real-time temperature monitoring across the entire structure with high spatial resolution (±0.5 °C accuracy). The alignment between DFOS measurements and validation data confirmed its reliability in capturing critical thermal gradients, particularly in complex geometries.
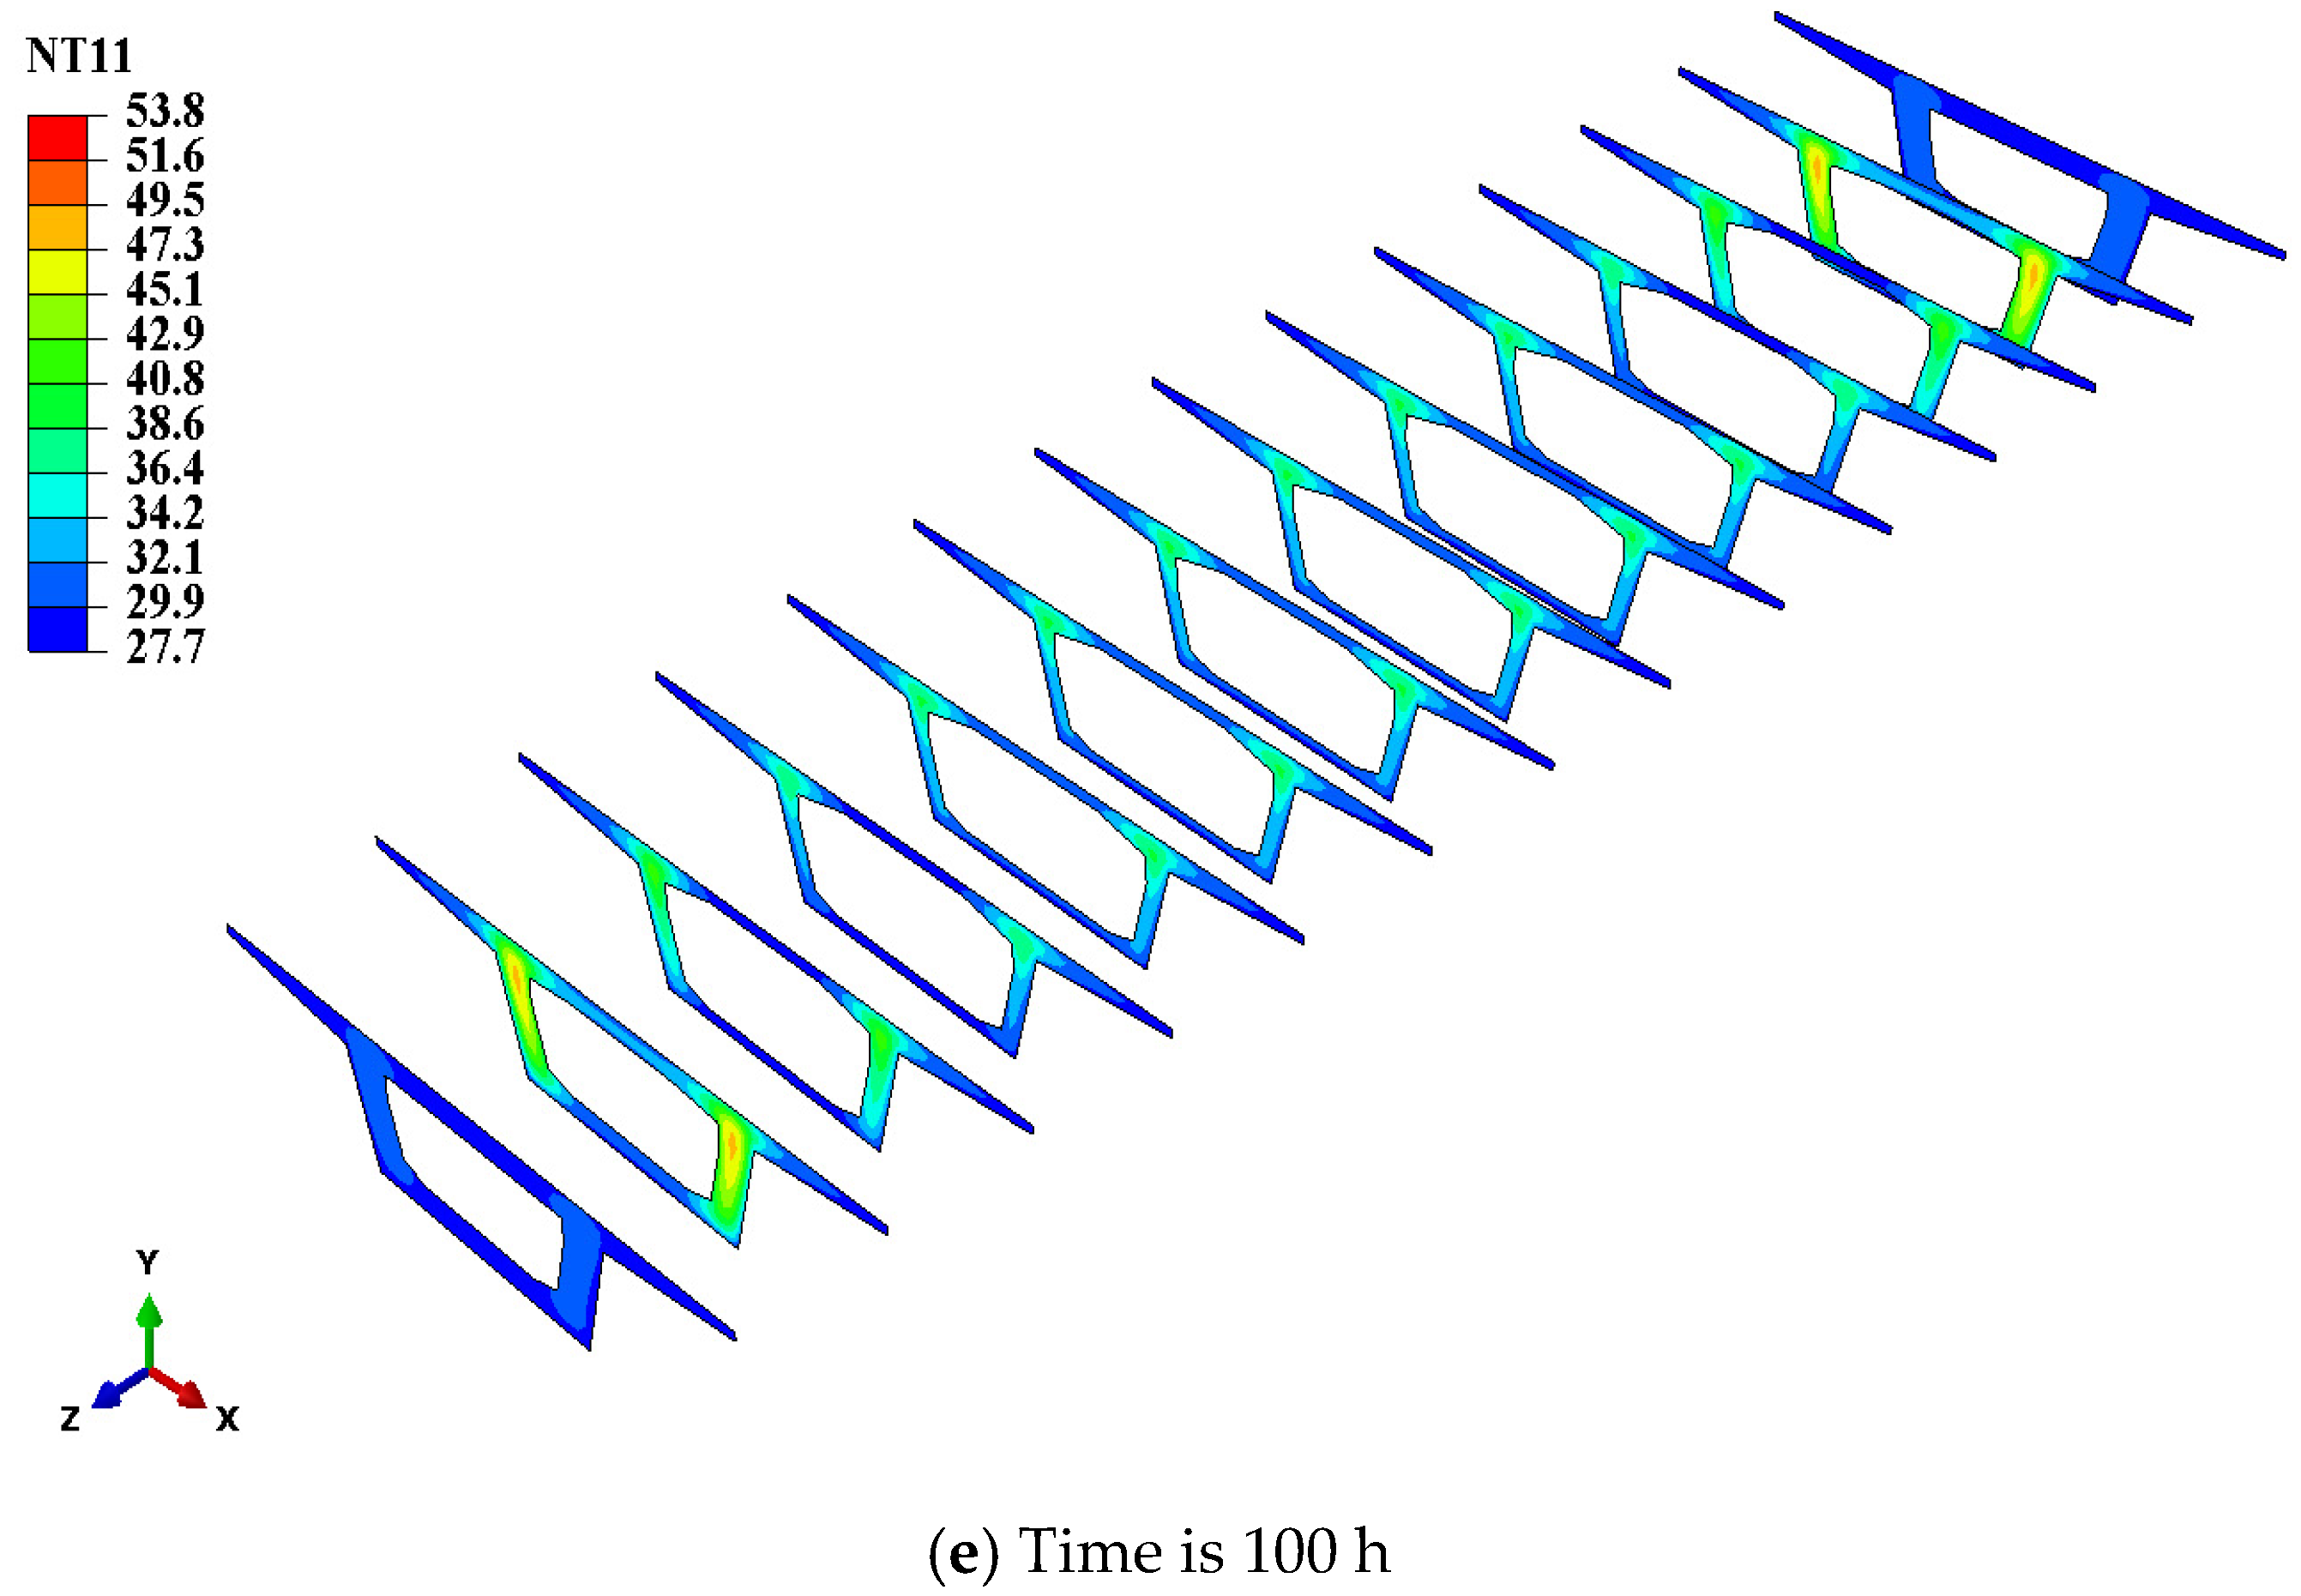
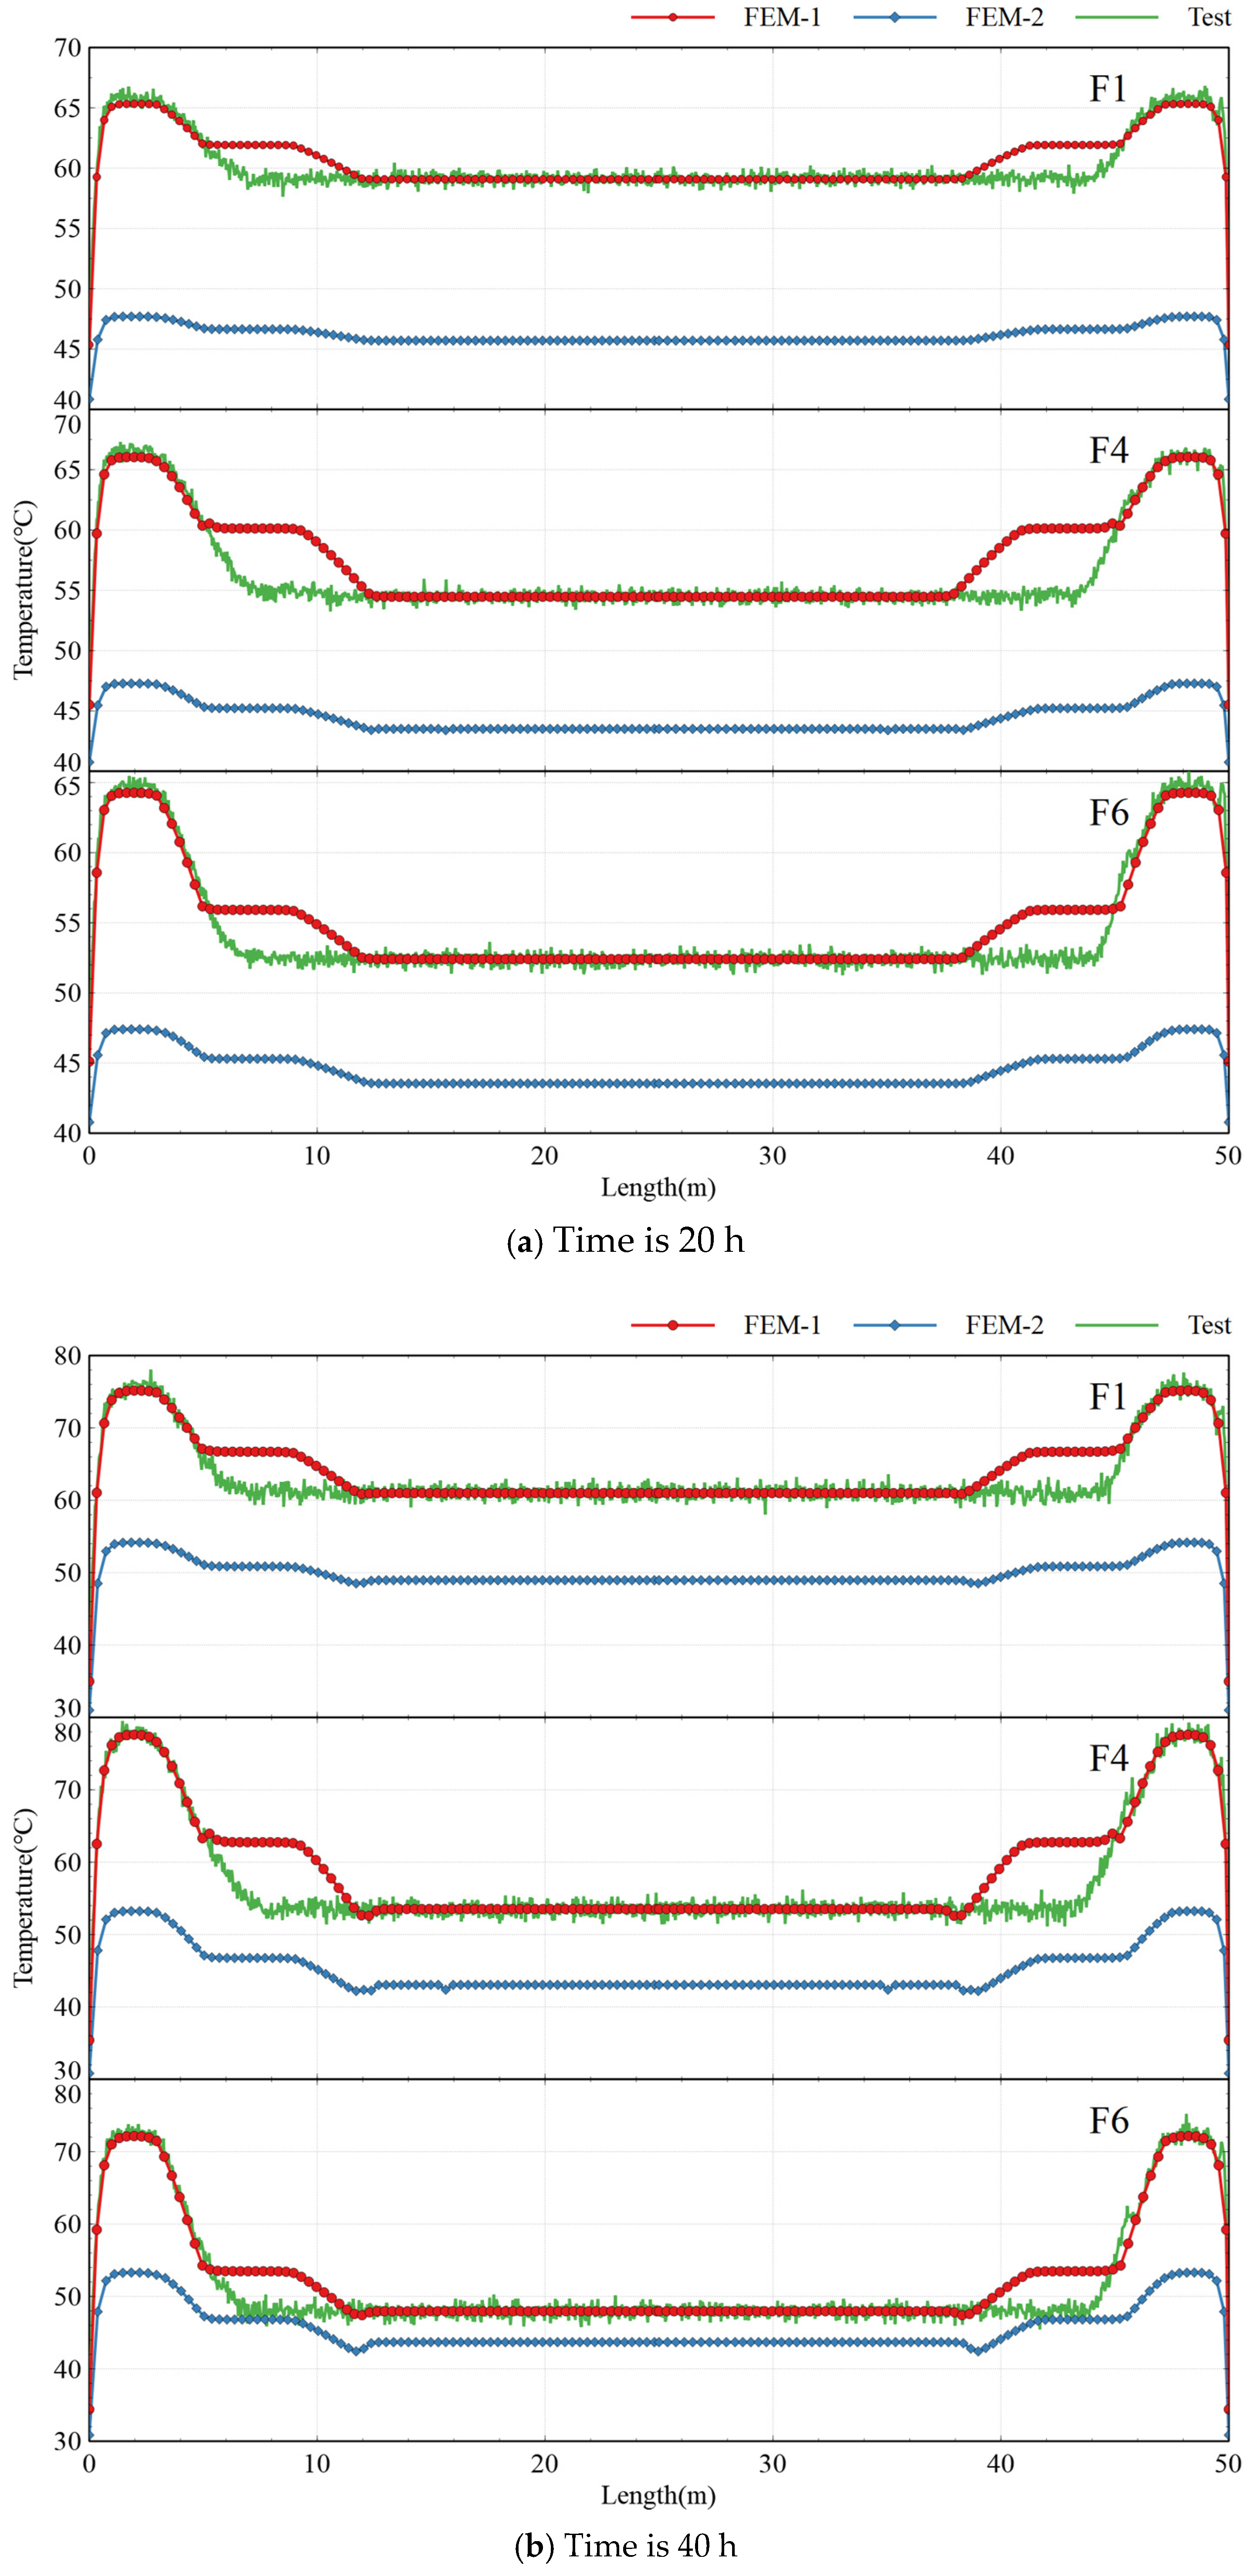
  • Distinct temperature profiles were observed among cross-sections. The end section exhibited the highest peak temperature (74.8 °C) due to reduced heat dissipation in thicker web regions (110 cm), while the mid-span section showed lower peak values (53.8 °C) due to efficient surface cooling, emphasizing the vulnerability of web-core zones to thermal stress.
  • The proposed finite element model (FEM), incorporating thermal parameters through equivalent age framework and UMATHT subroutine, demonstrated high-fidelity alignment with experimental data. The model accurately replicated the three-phase thermal evolution—rapid heating (0–40 h, peak 79.4 °C), sustained high-temperature plateau (40–60 h, >75 °C), and gradual cooling (60–100 h, 0.45 °C/h)—in geometrically complex LVBG, outperforming conventional static-parameter models by reducing prediction errors by up to 40%. This validated framework offers a robust computational tool for optimizing thermal management strategies to mitigate early-age cracking risks in large-scale concrete structures.

Author Contributions

Y.F.: Methodology, Data curation, Writing—original draft, Validation, Investigation. D.X.: Methodology, Data curation. D.H.: Resources, Validation. F.W. and Q.Y.: Funding acquisition, Conceptualization, Resources, Writing—review and editing, Supervision. X.F.: Investigation, Data curation. All authors have read and agreed to the published version of the manuscript.

Funding

This research was supported by the Open Projects Foundation (No. SKLD2106) of State Key Laboratory of Optical Fiber and Cable Manufacture Technology (YOFC).

Institutional Review Board Statement

Not applicable.

Informed Consent Statement

Not applicable.

Data Availability Statement

Data are contained within the article.

Conflicts of Interest

Authors Yuanji Fan, Deng Hong, Fei Wang, Xu Feng were employed by the company Yangtze Optical Fibre and Cable Joint Stock Limited Company (YOFC). The remaining authors declare that the research was conducted in the absence of any commercial or financial relationships that could be construed as a potential conflict of interest.

Abbreviations

The following abbreviations are used in this manuscript:
DFOSDistributed fiber optic sensing
FEMFinite element model
LVBGLarge-volume concrete box girder

References

  1. Xie, J.; Wang, X.; Qiao, W. In Situ Monitoring and Analysis of the Development Characteristics of Separation in Internal Overburden. Appl. Sci. 2024, 14, 6935. [Google Scholar] [CrossRef]
  2. Wang, J.; Garg, A.; Satyam, N.; Zhussupbekov, A.; Sushkova, S. DFOS Technology in Geoengineering Monitoring in the Past 35 Years: A Bibliometric Analysis. Sensors 2024, 24, 5051. [Google Scholar] [CrossRef] [PubMed]
  3. Weisbrich, M.; Messerer, D.; Holzer, F.; Trommler, U.; Roland, U.; Holschemacher, K. The Impact of Liquids and Saturated Salt Solutions on Polymer-Coated Fiber Optic Sensors for Distributed Strain and Temperature Measurement. Sensors 2024, 24, 4659. [Google Scholar] [CrossRef]
  4. Tyler, S.W.; Silvia, M.E.; Jakuba, M.V.; Durante, B.M.; Winebrenner, D.P. Impacts of Hydrostatic Pressure on Distributed Temperature-Sensing Optical Fibers for Extreme Ocean and Ice Environments. Photonics 2024, 11, 630. [Google Scholar] [CrossRef]
  5. Jiang, X.; Ban, X.; Ma, L.; Su, Y.; Cao, Q.; Zhang, Z.; Guo, J. Prestressed Concrete Box Girder with High-Capacity Strands-Monitoring and Analysis during Fabrication. Buildings 2022, 12, 911. [Google Scholar] [CrossRef]
  6. Nassr, A.A.; Abd-el-Rahim, H.H.A.; Kaiser, F.; El-sokkary, A.E. Topology optimization of horizontally curved box girder diaphragms. Eng. Struct. 2022, 256, 113959. [Google Scholar] [CrossRef]
  7. Zhang, P.; Xiong, H.; Wang, R. Measurements and numerical simulations for cast temperature field and early-age thermal stress in zero blocks of high-strength concrete box girders. Adv. Mech. Eng. 2022, 14, 168781322210915. [Google Scholar] [CrossRef]
  8. Schackow, A.; Effting, C.; Gomes, I.R.; Patruni, I.Z.; Vicenzi, F.; Kramel, C. Temperature variation in concrete samples due to cement hydration. Appl. Therm. Eng. 2016, 103, 1362–1369. [Google Scholar] [CrossRef]
  9. Wang, J.Q.; Fang, Z.; Liu, J. Measurement and Analysis of Hydration Heat of Long Span PC Box Girders. Bridge Constr. 2016, 46, 29–34. (In Chinese) [Google Scholar]
  10. Zhang, Z.; Liu, Y.; Liu, J.; Zhang, N. Thermo-mechanical behavior simulation and cracking risk evaluation on steel-concrete composite girders during hydration process. Structures 2021, 33, 3912–3928. [Google Scholar] [CrossRef]
  11. Yu, F.; Tong, J.; Peng, Y.; Chen, L.; Wang, S. A Case Study on the Application of 3D Scanning Technology in Deformation Monitoring of Slope Stabilization Structure. Buildings 2023, 13, 1589. [Google Scholar] [CrossRef]
  12. Li, H.; Yang, M. Application Study of Distributed Optical Fiber Seepage Monitoring Technology on Embankment Engineering. Appl. Sci. 2024, 14, 5362. [Google Scholar] [CrossRef]
  13. Zeng, Y.; Zeng, Y.; Jiang, D.; Liu, S.; Tan, H.; Zhou, J. Curing parameters’ influences of early-age temperature field in concrete continuous rigid frame bridge. J. Clean. Prod. 2021, 313, 127571. [Google Scholar] [CrossRef]
  14. Chen, B.; Guan, B.; Lu, X.; Tian, B.; Li, Y. Thermal conductivity evolution of early-age concrete under variable curing temperature: Effect mechanism and prediction model. Constr. Build. Mater. 2022, 319, 126078. [Google Scholar] [CrossRef]
  15. Dai, J.; Wang, Q.; Bi, R.; Wang, C.; Han, Z.; Du, W.; Chen, Z. Research on influencing factors and time-varying model of thermal conductivity of concrete at early age. Constr. Build. Mater. 2022, 315, 125638. [Google Scholar] [CrossRef]
  16. Zhuang, Z. Finite Element Analysis and Application Based on ABAQUS, 1st ed.; Tsinghua University Publishing House Co., Ltd.: Beijing, China, 2009. [Google Scholar]
  17. Zhang, X.; Zhu, H.; Jiang, X.; Broere, W. Distributed fiber optic sensors for tunnel monitoring: A state-of-the-art review. J. Rock Mech. Geotech. Eng. 2024, 16, 3841–3863. [Google Scholar] [CrossRef]
  18. Sun, J.; Meng, F.B.; Gu, Q.L. Analysis and Control Method of Hydration Heat Crack of 1000-Ton Whole-Hole Precast Box Girder Concrete. Qual. Eng. 2024, 42, 32–40. (In Chinese) [Google Scholar]
  19. Schindler, A.K. Concrete Hydration, Temperature Development, and Setting at Early-Ages. Ph.D. Thesis, The University of Texas at Austin, Austin, TX, USA, 2002. [Google Scholar]
  20. Van Breugel, K. Simulation of Hydration and Formation of Structure in Hardening Cement-Based Materials; Delft University Press: Delft, NL, USA, 1997. [Google Scholar]
  21. Zhu, B.F. Temperature Stresses and Temperature Control in Mass Concrete, 2nd ed; China Water Conservancy and Hydropower Press: Beijing, China, 2012. (In Chinese) [Google Scholar]
  22. Almeida Del Savio, A.; La Torre Esquivel, D.; Pasquel Carbajal, E.; De Andrade Silva, F. Experimental and Analytical Study of Temperatures Developed by the Heat of Hydration of High-Strength Self-Compacting Mass Concrete. Case Stud. Constr. Mater. 2025, 22, e04098. [Google Scholar] [CrossRef]
Figure 1. LVBG (large-volume concrete box girder).
Coatings 15 00453 g001
Figure 2. The end section, variable section, and mid-span section of LVBG (mm).
Coatings 15 00453 g002aCoatings 15 00453 g002b
Figure 3. Multi-mode armored sensing cable.
Coatings 15 00453 g003
Figure 4. The arrangement of distributed temperature optical fiber sensors.
Coatings 15 00453 g004
Figure 5. Section of point sensor arrangement.
Coatings 15 00453 g005
Figure 6. Time history curve of temperature measurement points.
Coatings 15 00453 g006
Figure 7. Temperature of LVBG at different times along the longitudinal direction.
Coatings 15 00453 g007
Figure 8. Change in chemical reaction rate with temperature.
Coatings 15 00453 g008
Figure 9. Variation in hydration degree with time.
Coatings 15 00453 g009
Figure 10. Precast 50 m LVBG hydration heat model (unit: cm).
Coatings 15 00453 g010
Figure 11. Temperature field of 50 m box girder test sections at various times (NT11: nodal temperature output (unit: °C) from ABAQUS simulations).
Coatings 15 00453 g011aCoatings 15 00453 g011bCoatings 15 00453 g011c
Figure 12. Comparison of measured and simulated temperature distributions.
Coatings 15 00453 g012aCoatings 15 00453 g012bCoatings 15 00453 g012c
Table 1. Mix design and material proportions of concrete for large-volume box girders.
ParameterMaterial CompositionQuantity (kg/m3)
Binder systemCement236
Fly Ash118
Slag118
Aggregate gradationCoarse aggregate (crushed stone)1045
Fine aggregate (sand)727
Water-to-binder ratioWater-to-binder ratio0.39 (Water content: 156 kg/m3)
WorkabilityPolycarboxylate superplasticizer0.23% (5.66 kg/m3)
Disclaimer/Publisher’s Note: The statements, opinions and data contained in all publications are solely those of the individual author(s) and contributor(s) and not of MDPI and/or the editor(s). MDPI and/or the editor(s) disclaim responsibility for any injury to people or property resulting from any ideas, methods, instructions or products referred to in the content.

