Article

Effect of Negative Substrate Bias Voltage and Pressure on the Structure and Properties of Tungsten Films Deposited by Magnetron Sputtering Technique

1
Institute for Plasma Science and Technology, National Research Council, Via R. Cozzi 53, 20125 Milano, Italy
2
Department of Physics, University of Genoa, Via Dodecaneso 33, 16146 Genova, Italy
3
Institute of Condensed Matter Chemistry and Technologies for Energy, National Research Council, Corso Stati Uniti 4, 35127 Padova, Italy
4
Department of Physics, University of Milano-Bicocca, Piazza della Scienza, 20126 Milano, Italy
5
National Institute of Nuclear Physics (INFN) of Milano-Bicocca, Piazza della Scienza, 20126 Milano, Italy
*
Author to whom correspondence should be addressed.
Coatings 2025, 15(3), 319; https://doi.org/10.3390/coatings15030319
Submission received: 31 January 2025 / Revised: 5 March 2025 / Accepted: 6 March 2025 / Published: 10 March 2025

Abstract

:
This paper investigates how negative substrate bias voltage and sputtering pressure influence tungsten coatings deposited via radiofrequency magnetron sputtering. Increasing the absolute value of negative bias voltage (up to −150 V) of the substrate results in higher mass density, higher surface roughness, better crystallinity, improved adhesion, and lower electrical resistivity. Raising the sputtering pressure (from 1 to 5 Pa) causes a reduction in bulk density, a decrease in crystallinity, increased electrical resistivity, lower conductivity, and weaker adhesion. These findings highlight the importance of carefully optimizing negative substrate bias voltage and sputtering pressure to tailor the microstructural, mechanical, and electrical properties of tungsten coatings to specific applications.

1. Introduction

Tungsten (W) coatings exhibit unique properties such as radiation hardness, a high melting point, good electrical and heat conductivity, strong resistance to thermal loads, chemical stability, and high wear resistance [1,2]. These characteristics make W-based materials highly desirable for numerous industrial applications. To tailor these properties for specific applications, W films can be deposited using various techniques, including chemical vapor deposition (CVD) [3,4], pulsed laser deposition [5], electron-beam (e-beam) evaporation [6], and magnetron sputtering [7,8]. Among these, magnetron sputtering is a versatile method that can utilize either direct current (DC) or radiofrequency (RF) power sources [9,10,11] for depositing refractory metals. Since most of the studies have investigated the influence of deposition parameters on the structure, morphology, and optical properties of metallic W films produced using DC magnetron sputtering [7,12,13,14,15,16,17,18,19], this experimental work explored this topic in the context of RF magnetron sputtering. It is worth noting that the ionization efficiency is higher in RF, allowing for operation at lower pressures. Working at lower pressures during the deposition process helps produce purer, denser, more adherent, and directional films, ultimately enhancing the overall quality and performance, particularly for possible high-tech applications. In RF plasma magnetron systems [20], particle bombardment during film growth significantly influences the microstructure and physical properties of the deposited films. By adjusting the deposition parameters, such as process pressure and power supplied to the target, changes can be induced in the electron temperature (Te), plasma density (ne), average ion energy (εi), and ion flux (Γi), at both the target and substrate. Another critical deposition parameter is the negative potential (Vneg) applied to the substrate sample holder. Applying a negative bias accelerates positive ions in the plasma towards the substrate, increasing their kinetic energy. Vneg therefore determines the kinetic bombardment energies of the ions during film growth and can significantly affect the adhesion, microstructure, crystallinity, and residual stresses in the as-deposited films [21,22,23,24], with positive effects in mechanical properties such as hardness, toughness, and wear resistance [25,26], as well as physical properties such as electrical resistivity [27]. Controlling ion energy is crucial as it directly influences the mobility, arrangement, and interactions of atoms within the film. Ion bombardment significantly impacts intrinsic stress within coatings. While moderate ion energies can relieve stress, excessive ion bombardment may induce tensile or compressive stresses, leading to deformation or delamination. High biases could also result in re-sputtering, which degrades coating crystallinity, modifies thickness and morphology, and potentially compromises functional properties [28,29]. Despite numerous studies on the influence of Vneg on the microstructure and properties of various metal coatings deposited by RF plasma magnetron methods, there are limited reports on the specific use of substrate bias to modify the properties of W coatings [30,31]; indeed, as already mentioned for pressure, most of the articles refer to DC sources. The effect of substrate bias voltage on DC and RF sputtered coatings can be quite different. For example, E. Eser et al. [32] reported on the different microstructure of WC-Co coatings, which was generated during the DC and RF sputtering process with the same voltage applied to the substrate. Therefore, this study investigates the effects of Vneg (ranging from 0 to −150 V) and process pressure (1–5 Pa) on the microstructure, mechanical, and physical properties of RF magnetron-sputtered W coatings. The impact of deposition parameters on coating mass density is also evaluated. Additionally, plasma parameters such as electron temperature (Te) and electron density (ne), which influence the interaction of atoms and ions during film growth, were estimated using a Langmuir probe (LP) [33,34,35].

2. Materials and Methods

2.1. Experimental Apparatus

The plasma plant [36] consists of a cylindrical stainless-steel vacuum chamber with a volume of 0.05 m3 equipped with a magnetron sputtering cathode (balanced type, produced by Angstrom Sciences, Duquesne, PA, USA). The cathode is water-cooled and connected to a separate radiofrequency (ωrf/2π = 13.56 MHz) power supply (300 W, TRUMPF Hüttinger, Ditzingen, Germany), which operates in a steady state, coupled with an automatic impedance matching unit to minimize the reflected power. A tungsten (W) target with a diameter of 76.2 mm (purity: 99.9%, thickness: 6.35 mm) was installed on the working cathode with a power input value of 75 W (power density 1.7 W/cm2). The stainless-steel substrate holder, facing the target, is constructed to electrically float to apply the electrical bias. An argon plasma with a constant flux rate of 20 sccm in different operative conditions was used. The working Ar flux and pressure were monitored by a Mass Flow controller (MKS) and a capacitive vacuum gauge (Pfeiffer CMR 365, Aßlar, Germany), respectively. The sputtering chamber was evacuated by a high vacuum pumping system, composed of a series of rotary (TRIVAC 24 m3/h, Leybold, Cologne, Germany) and turbo-molecular (TURBOVAC 150 l/s, Leybold, Cologne, Germany) pumps, which provided a base pressure of 1 × 10⁻⁴ Pa.

2.2. Plasma Diagnostics

A Langmuir probe (Hiden ESPION, Warrington, UK) was used to characterize the plasma parameters at different operative conditions. Measurements were performed at about 40 mm from the target using a negligible B field. The probe consists of a tungsten tip with a 0.1 mm diameter and 15 mm length. The Langmuir probe (LP) is radiofrequency compensated. Plasma parameters such as ne and Te were obtained from 10 scans, and the average operation of each current-voltage (I-V) curve was obtained through the semi-automatics data analysis mode. The current-voltage (I-V) curves were acquired by applying ±40 V on the LP. The probe tip was cleaned after each measurement (30 V was applied to the probe for an exposure time of 100 ms). For a probe in the orbital motion limited (OML) regime [37] and assuming a Maxwellian distribution, the average Te was determined as Te (eV) = 1/slope of the plot of the natural logarithm of the I-V curve of the probe in the region between the floating potential (Vf) and plasma potential (Vp), while the ne was calculated from the electron current saturation region [34,38]. Samples were placed on the lower electrode (sample holder), which was at a floating potential in all experiments. The target-sample holder distance was 60 mm.

2.3. Mass Density (ρ) Measurements

The ρ of the W coatings was estimated by weighing the Si wafer before and after the W deposition (∆m) on a balance accurate at least to the nearest 10−5 g (Model Sartorius SECURA225D-1S). As the coating thickness (d) was known due to the surface profilometer characterization, the coating density was found from the formula:
ρ = ∆m/(d · A), A = Si wafer area.

2.4. Materials

Silicon (Si) substrates, chosen for their perfectly flat surfaces, were used to characterize the morphology, deposition rate, and mass density, enabling the detection of minor differences in deposit structure without interference from substrate roughness (Si, p-type (100), 1 cm × 1 cm, thickness 400 microns, average roughness ≈ 1 nm). To mimic the realistic condition of adhesion coating/substrate, tungsten plates (99.95 wt% purity) cut into 15 mm × 10 mm × 0.5 mm specimens were used as substrates in scratch test measurements. Argon (99.999% purity) gas was a Sapio Group product.

2.5. Characterization of Coatings

W coatings were deposited on silicon substrates, and no heating of the sample holder was used. The thickness of the deposited coatings was evaluated by covering with a silicon mask a portion of the samples during the process. Upon removing the mask, it was possible to measure the step formed between deposited and non-deposited portions of samples with a P15 surface profiler (KLA Tencor, San Jose, CA, USA), using a KLA profilometer (Tencor model). The morphological features of the samples were examined by AFM (Core AFM, Nanosurf GmbH, Langen, Germany) in dynamic mode and High-Resolution SEM (Tescan mod. MIRA III, Brno, Czech Republic). The AFM was used under ambient conditions with probes Dyn190Al (force constant 28–75 N/m and tip radius 10 nm). Three AFM images on a scan area of 3 μm × 3 μm were scanned to evaluate the surface roughness Ra. W coatings (approximately 500 nm in thickness) were deposited onto silicon (Si) wafers. Elemental compositions of coatings were analyzed using energy-dispersive X-ray (EDX) spectroscopy. The EDX measurements were conducted at three distinct points on the coating surface to ensure the reliability and uniformity of the compositional data. The analyses were performed using a high-resolution Scanning Electron Microscope (SEM), specifically the Hitachi SU70 model (Hitachi High-Technologies, Minato-ku, Tokyo, Japan), which was equipped with the NORAN 6 EDX system by Thermo Scientific (Waltham, MA, USA). To minimize the interaction volume and to accurately measure the composition of the coatings without interference from the underlying substrate, the electron beam was operated at an acceleration voltage of 5 kV. The cross-sectional views of sputtered W coatings were performed by means of CrossBeam 1540 XB (Carl Zeiss AG, Oberkochen, Germany). The CrossBeam is equipped with a Focused Ion Beam (FIB) with a resolution of 7 nm and a Field Emission SEM (FESEM) with a resolution of 1.1 nm. FIB was used to mill the samples and FESEM was used to image sample surfaces and their cross sections. The DC electrical resistivity (Rρ300 K) of the W coatings was evaluated at room temperature by the four-point probe measurement technique (van der Pauw method [39,40]) on a specimen of approximately 1 cm × 1 cm. Measurement was carried out using the 4200A-SCS parameter analyzer referring to the Keithley application note [41]. Probes were put in place using the FormFactor Summit 200 probe station. We measure all samples with five different currents: from 0.2 mA to 1 mA, 0.2 mA steps. These current values ensure that the voltage difference between the two voltage sensing terminals does not exceed 25 mV for all samples, as suggested in the application note. XRD patterns were collected by an Empyrean diffractometer (Malvern PANAlytical, Malvern, UK) equipped with a PIXcel3D Detector using Cu-kα radiation (λ = 1.5405 Å). Measurements were performed at 40 kV and 40 mA, at room temperature, in GIXRD mode with ω = 1° and within the 30–110° 2θ range. The X-ray beam was filtered using a primary mask of 14 mm and a secondary mask of 2 mm, a divergence slit of ¼ cm, a 0.03 rad primary Soller slit, and a 0.04 rad secondary Soller slit. The phase identification was performed by using the Match!® Software v3.8 using ICSD database. The reference pattern used to recognize W cubic structure as the principal phase observed in the samples was ICSD card #653433. For coatings deposited on tungsten substrates, micrometer-scale roughness was measured using a Dektak XT stylus profiler (Bruker, Billerica, MA, USA) equipped with a 2 μm tip. The adhesion of the deposited coatings was studied by scratch testing, using a UMT-2 tribotester (Bruker, Billerica, MA, USA) equipped with a standard Rockwell C diamond indenter with a 200 μm tip radius. Test parameters were chosen according to ISO 20502:2005 standard for ceramic materials in the progressive loading scratch test (PLST) mode [42]. Three tracks were performed on each sample for reproducibility and statistical purposes. In particular, the load was applied linearly from 0.2 N to 9.6 N, with a loading rate of 10 N/min over a scratch length of 9.4 mm with an indenter traverse speed of 10 mm/min. Optical images of the sample surface and produced tracks were acquired (Wild/Leica M3Z stereomicroscope equipped with a Lumenera Infinity lite camera, Wetzlar, Germany). Critical loads in the scratch test were assessed by comparing the collected signals of normal force (Fz), coefficient of friction (COF), and acoustic emission (AE), with the optical images of the produced scratch tracks, following the classification given in the standard.

3. Results

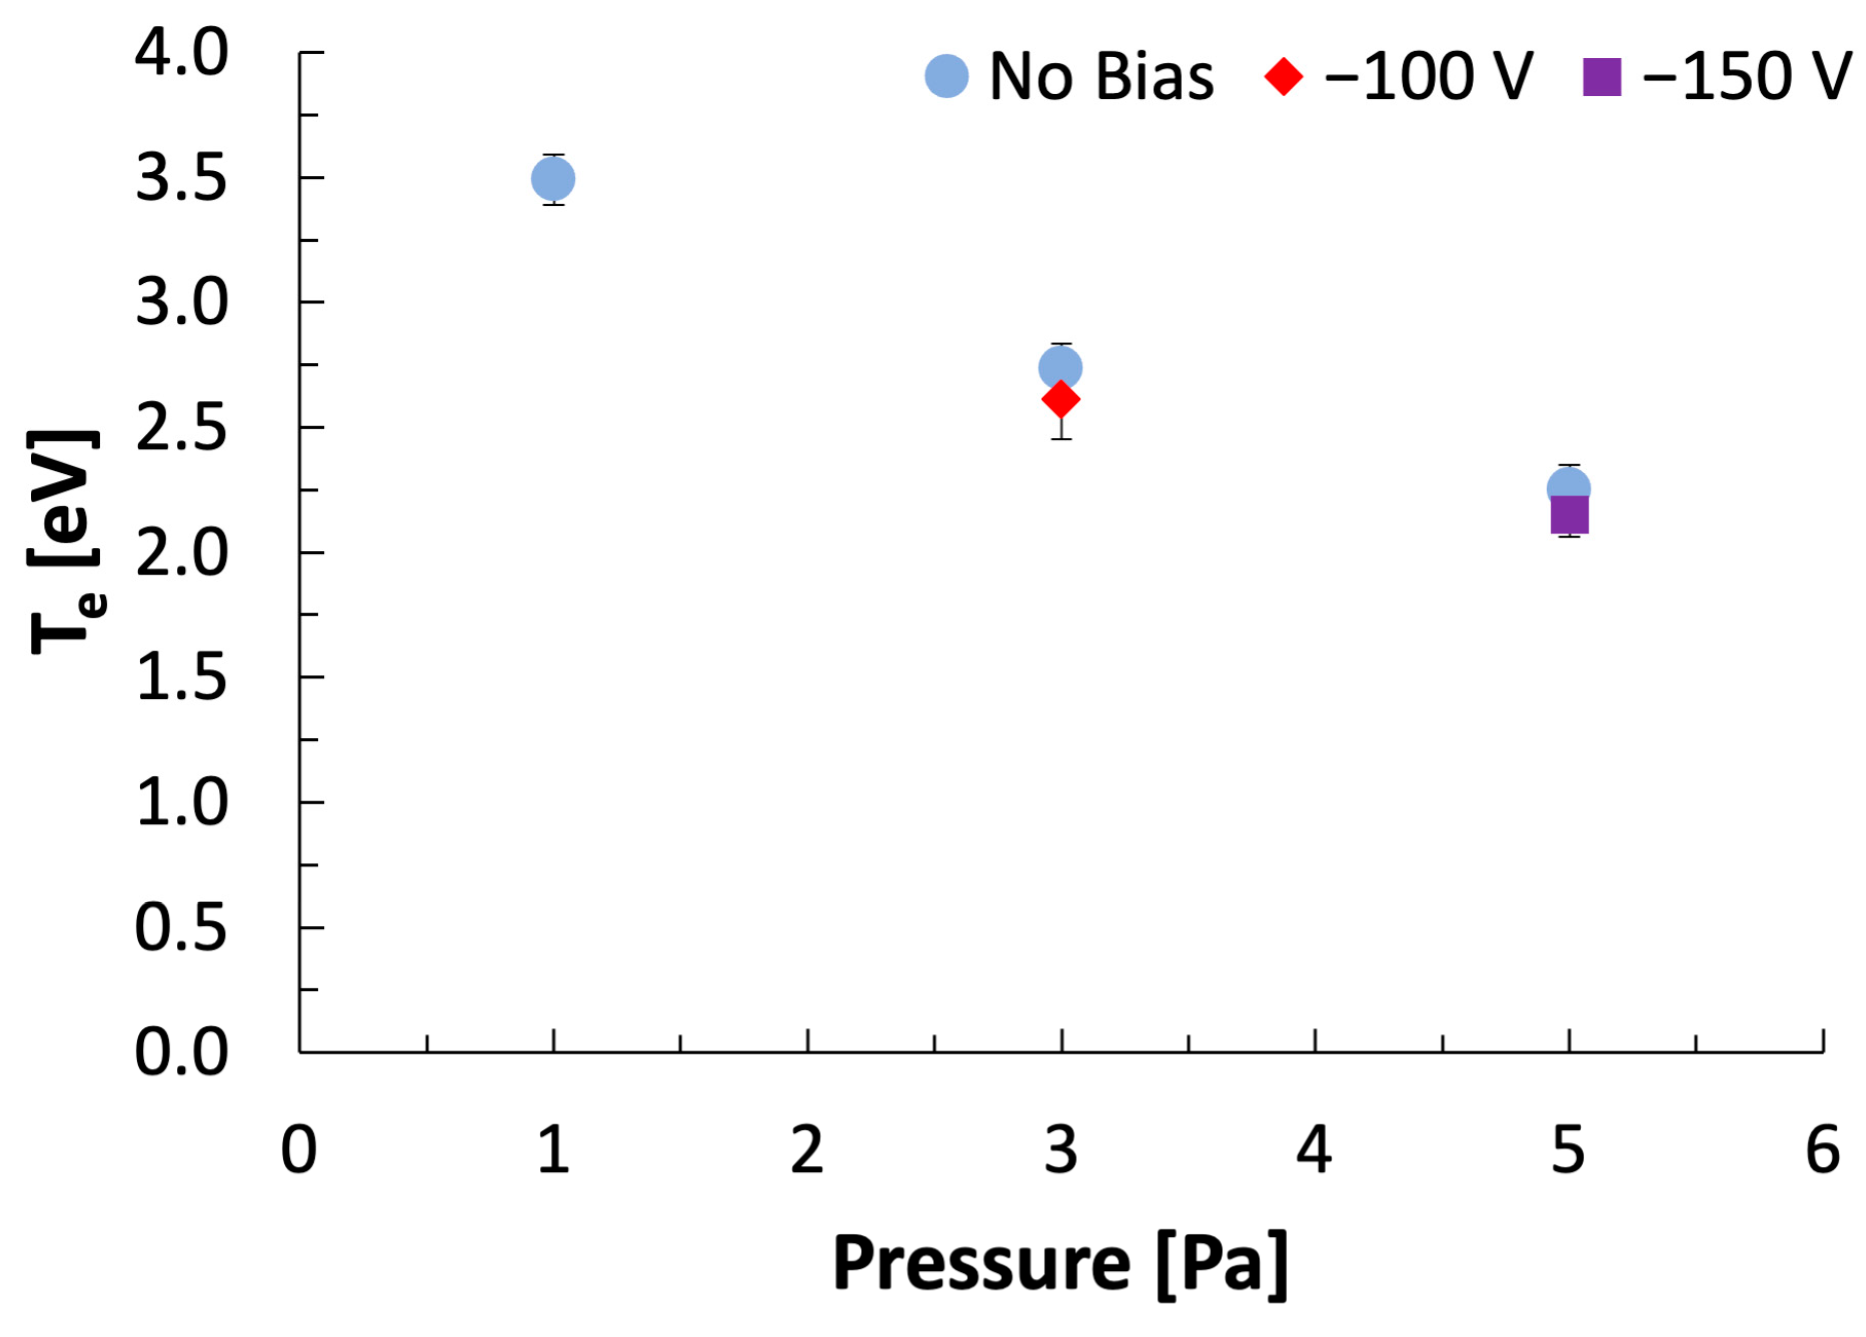
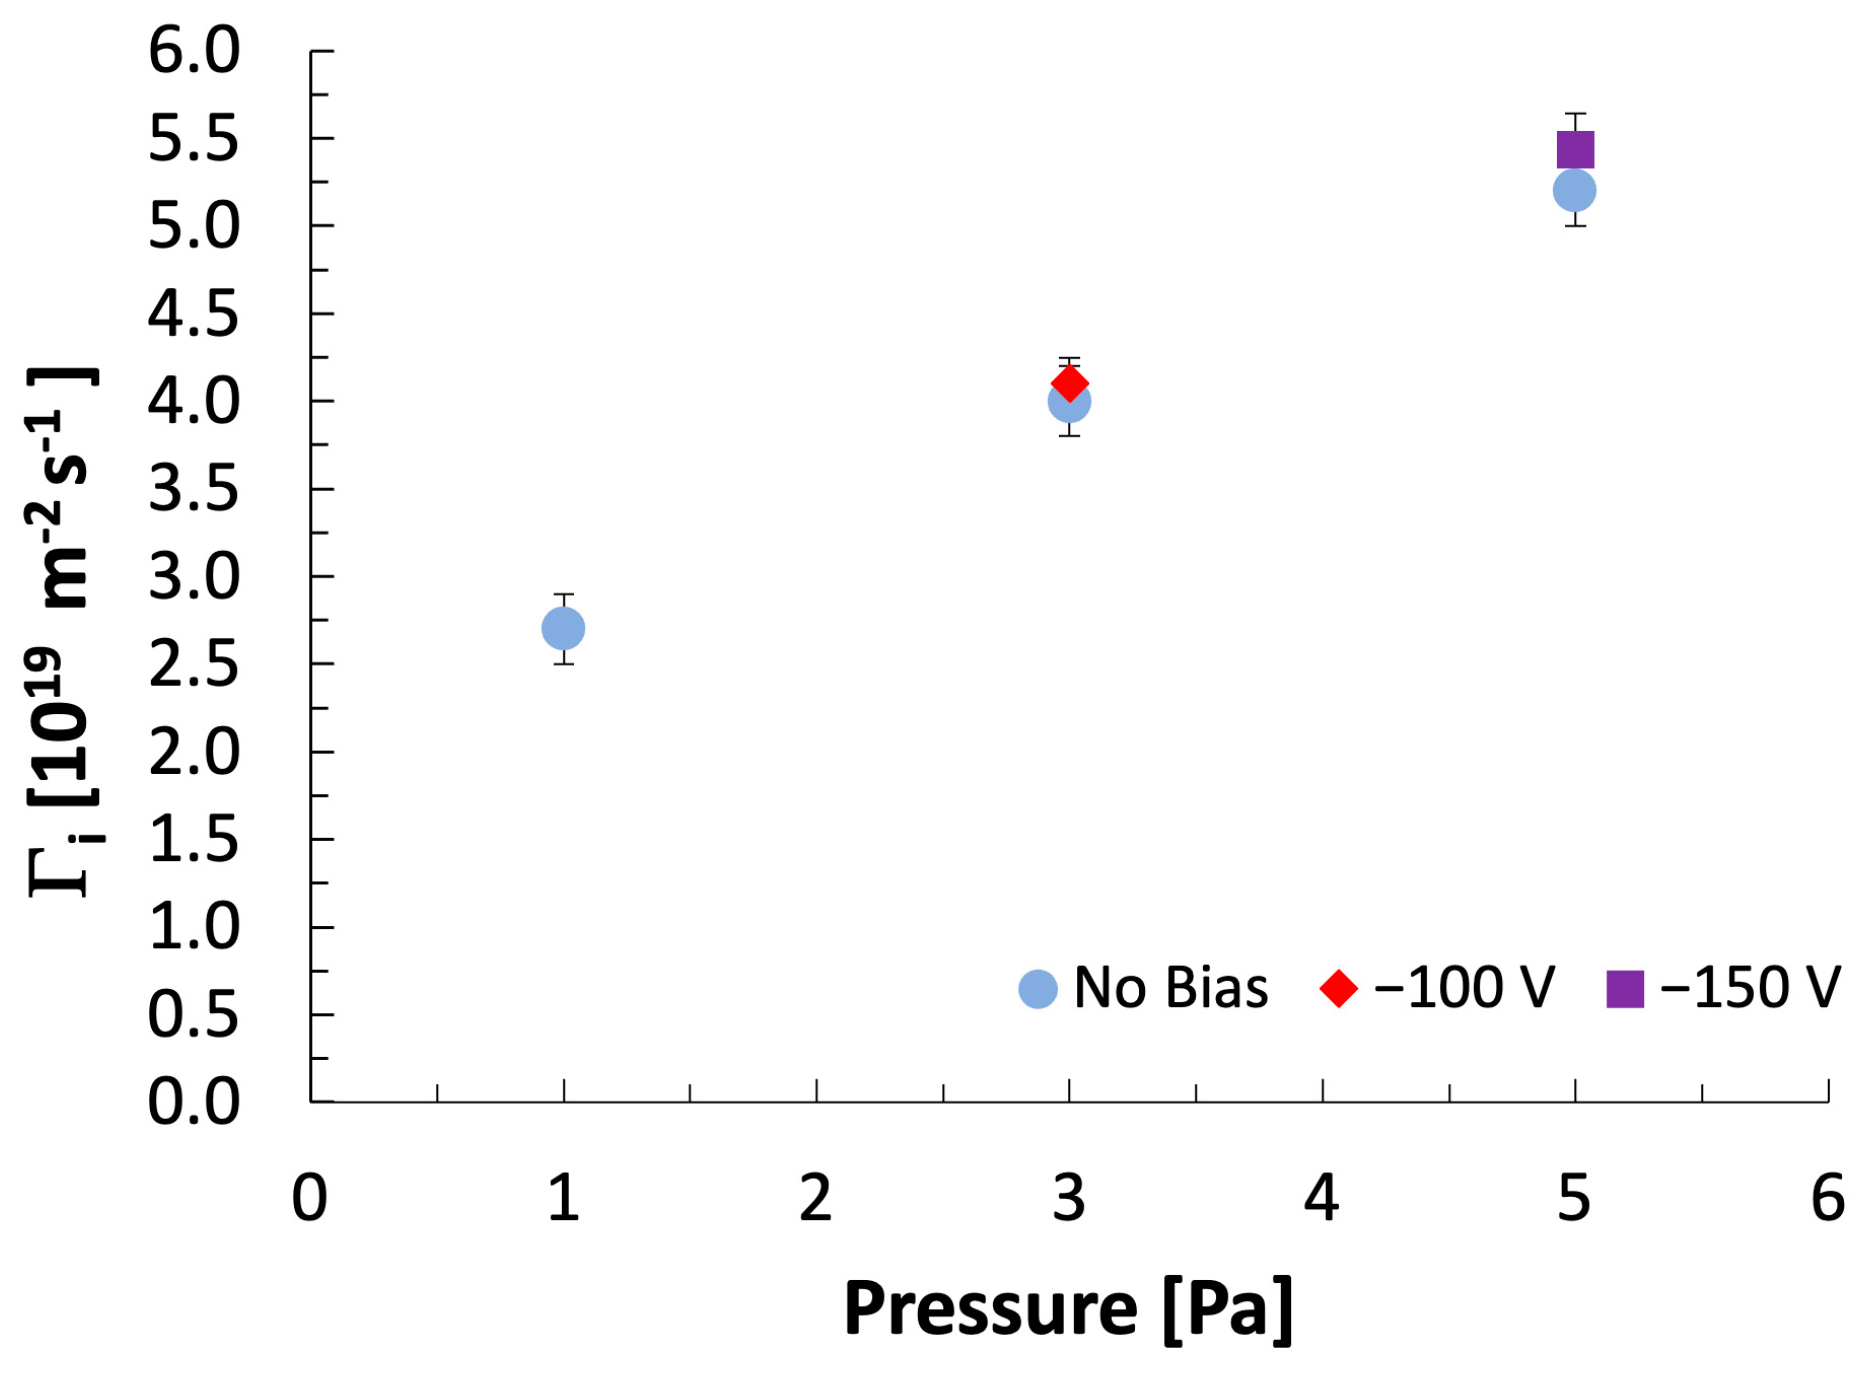
3.1. Plasma Characterization

In plasma processing, it is well established that plasma parameters such as electron density (ne) and electron temperature (Te) play a crucial role in determining the characteristics of the coatings produced. This study investigates the behavior of ne and Te during tungsten (W) deposition, focusing on their dependence on the negative substrate bias (Vneg) and process pressure. Under the experimental conditions employed, the applied Vneg showed no significant impact on ne and Te (see Figure 1, Figure 2 and Figure 3). This observation is likely related to the positioning of the Langmuir probe (LP), as measurements were conducted approximately 20 mm from the substrate. At this distance, the direct influence of Vneg on plasma parameters appears to be negligible. At a process pressure of 3 Pa, Vneg was varied from 0 to −100 V, and at a process pressure of 5 Pa, Vneg was varied from 0 to −150 V. In Figure 1, Figure 2 and Figure 3, only the data points that correspond to the effect of the maximum polarization value at a given pressure are displayed. As explained below (see Section 3.2), at 1 Pa, the application of a Vneg (even at very low values) caused significant stress on the coating. Consequently, the study of the coating characteristics as a function of Vneg was primarily focused on pressures of 3 Pa and 5 Pa. The observed trends in ne and Te as a function of pressure are primarily attributed to an increase in the collision rate between the electrons and other plasma species as the working pressure rises. This increased collisional interaction facilitates energy transfer via impact ionization, leading to charge multiplication (increasing ionization frequency) [43], and consequently, an increase in plasma density. Simultaneously, the Te decreases due to energy losses caused by the frequent collisional processes, a phenomenon known as collisional electron cooling [44,45].
Ion flux (Γi) was also estimated (Figure 3) using the ne and Te assuming Bohm conditions [46]. The Γi increases with increasing pressure, at fixed discharge power, while the ion energies (Ei) are calculated using Equation (1),
Ei = e (VsubVp)
where e is the electronic charge, Vsub is the substrate potential, and Vp is the plasma potential determined from the maximum value of the first derivative I′(Vprobe) of the probe current with respect to the probe polarization (Vprobe) and was found to be in the range of 25–21 V with increasing pressure. The application of a negative substrate bias voltage increases ion energy, which depends on the Vneg and Vp. While higher ion energy can enhance certain deposition characteristics, it also induces high stress and potential delamination. Consequently (as explained in the next paragraph), the deposition process was optimized to the threshold where stress phenomena emerge, which in our case was −100 V at 3 Pa and −150 V at 5 Pa.

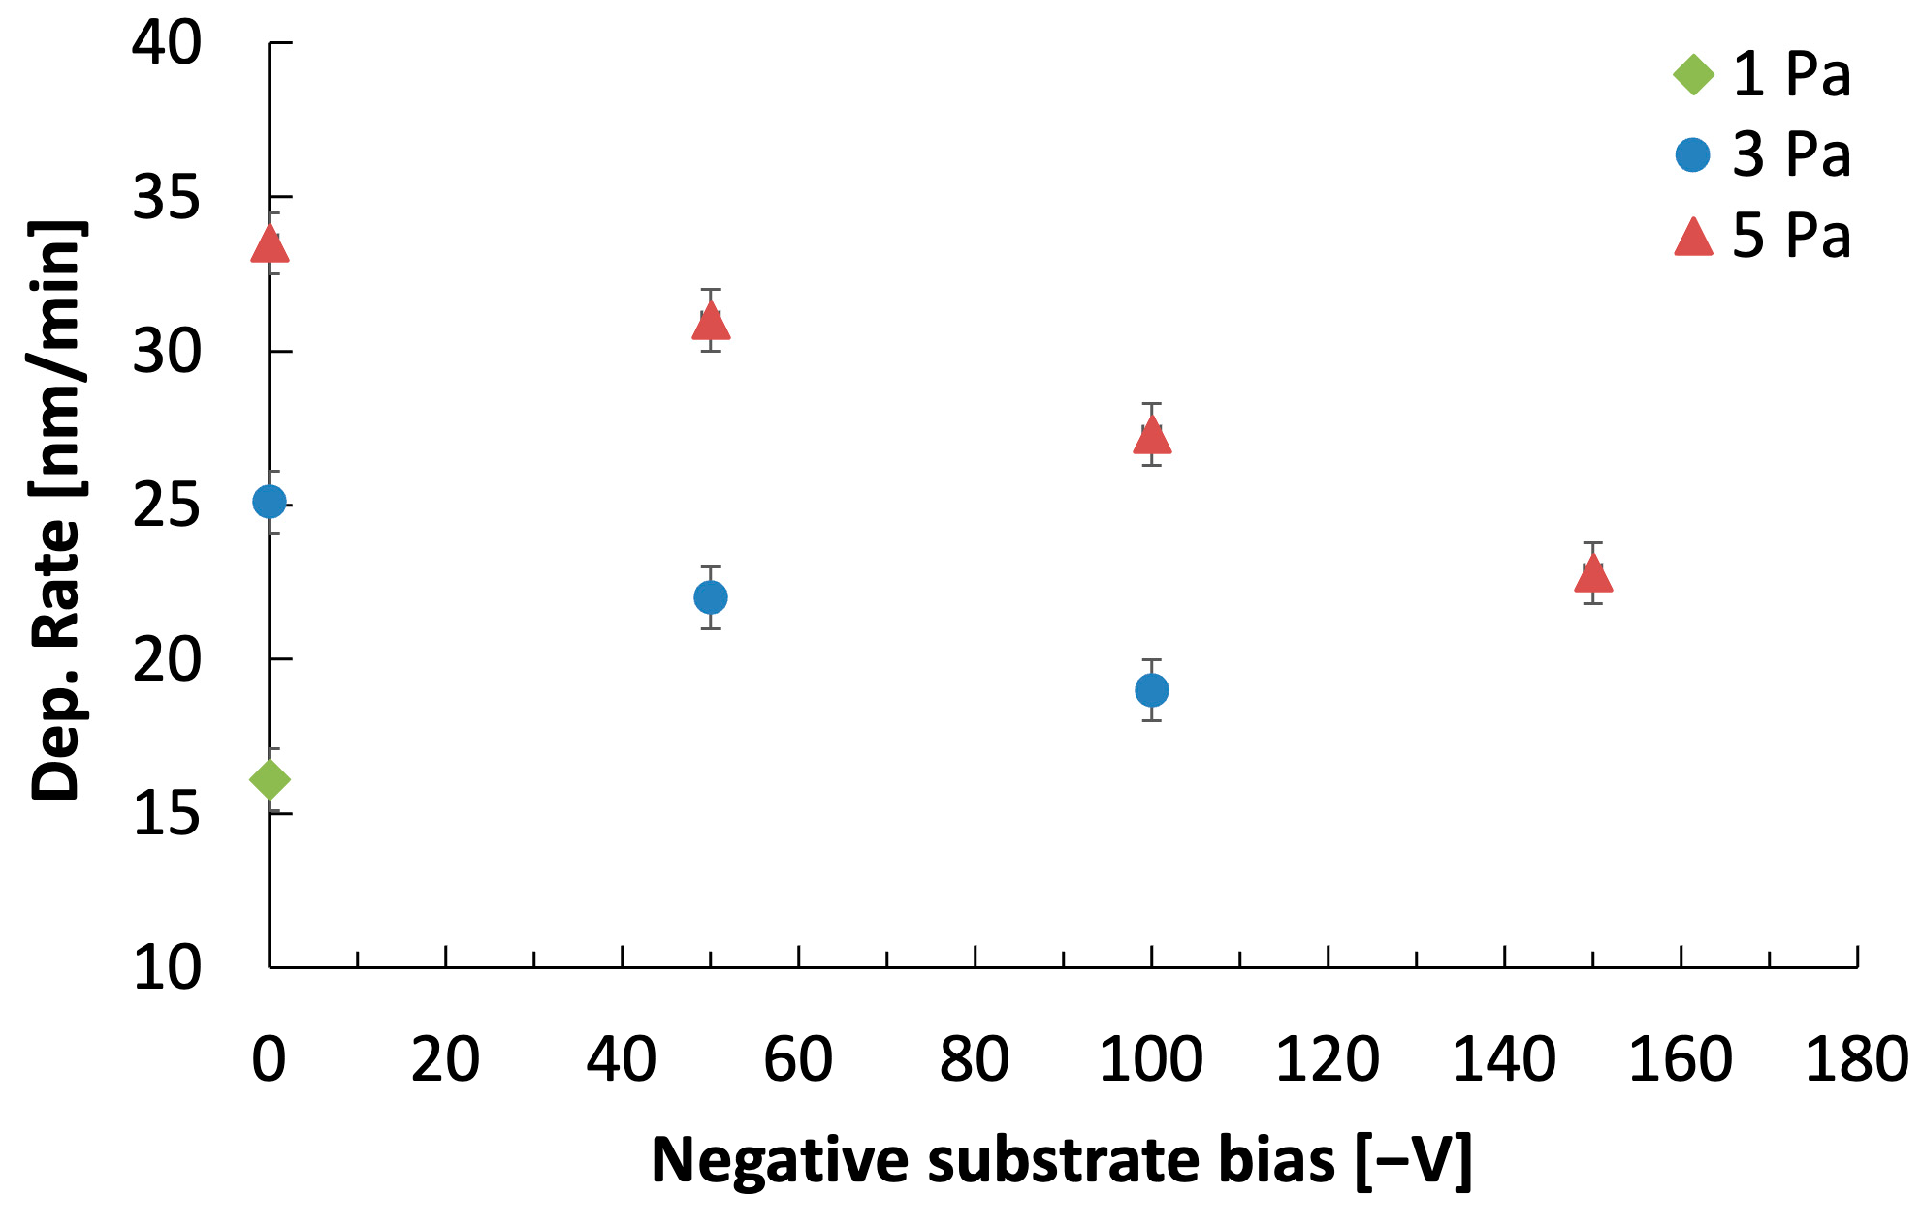
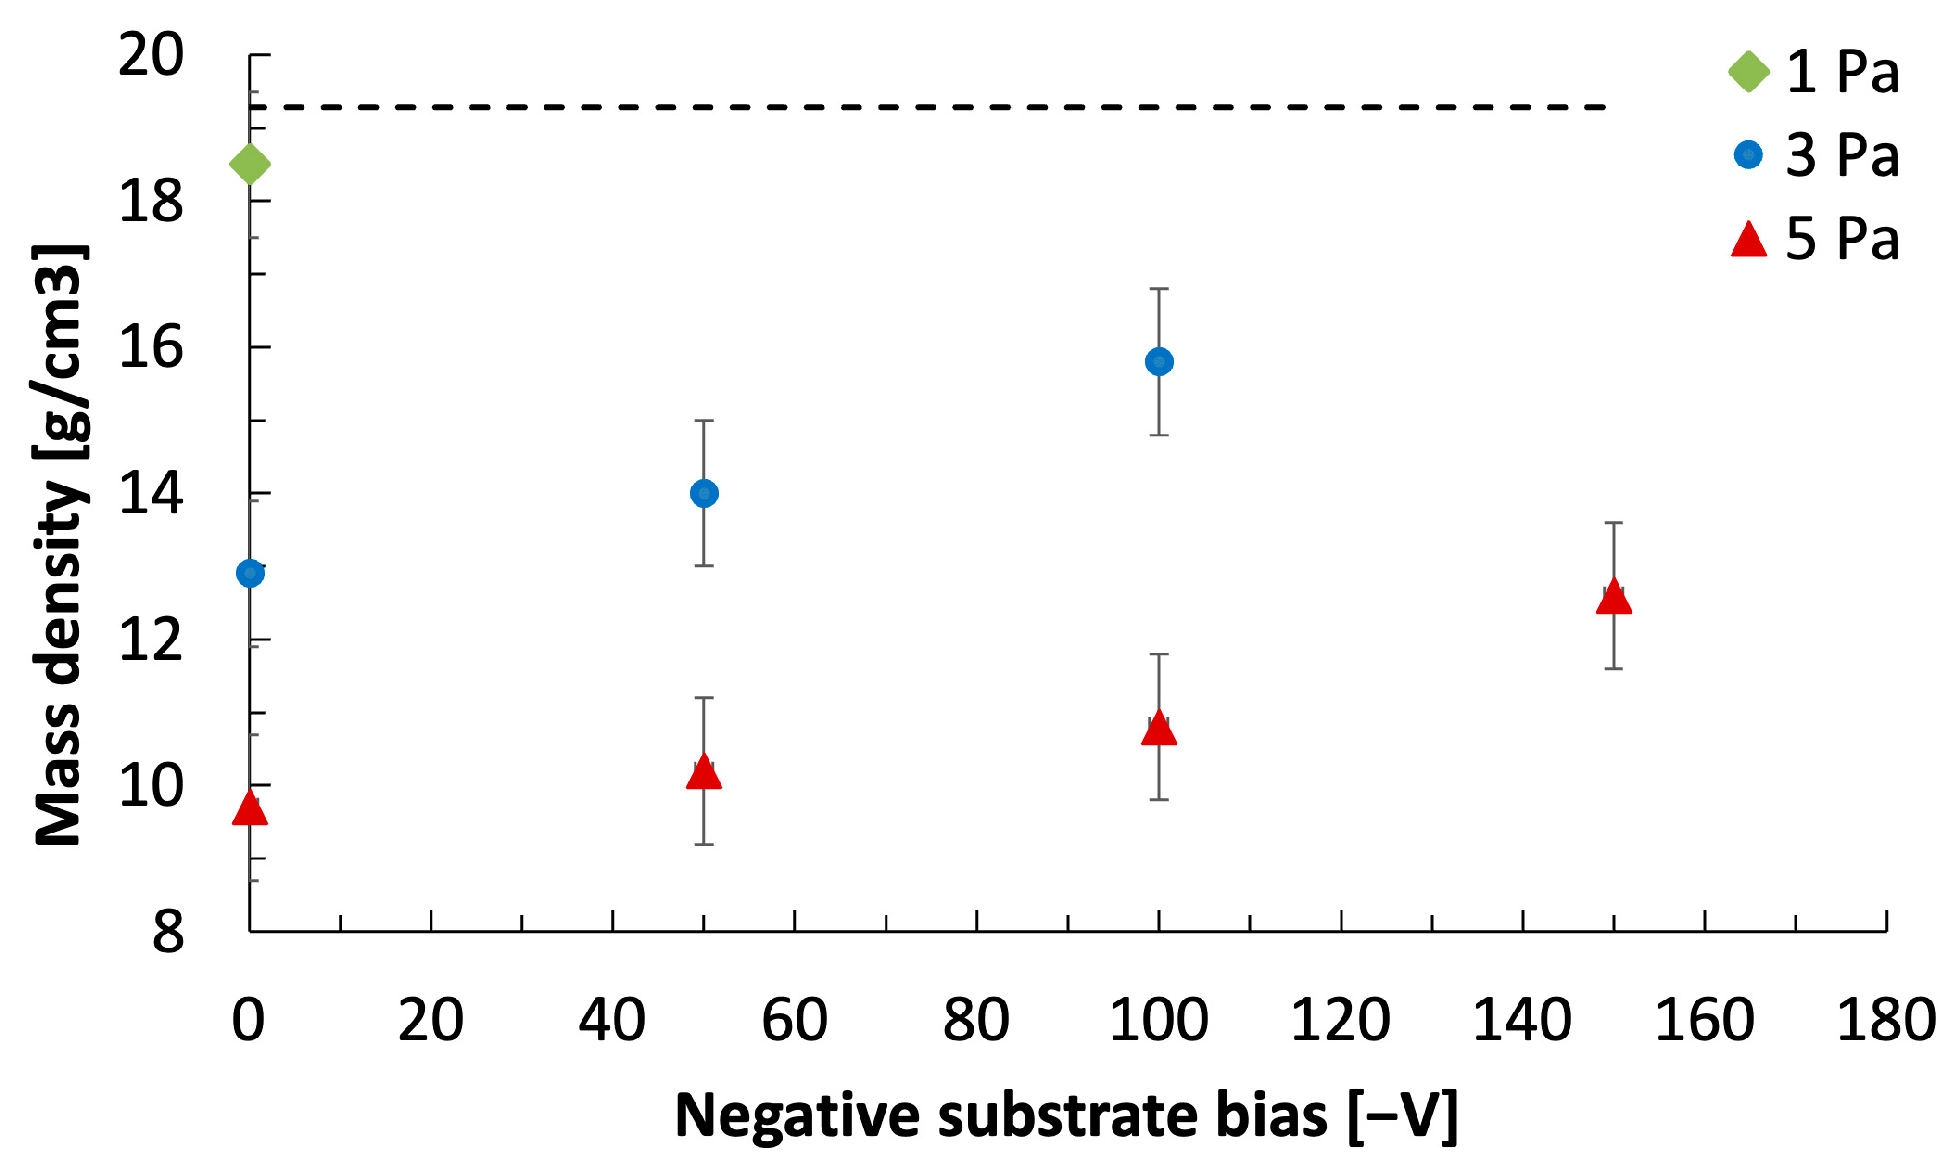
3.2. Characterization of the As-Deposited Films

Figure 4 illustrates the dependence of the tungsten deposition rate (DR) on the negative substrate bias voltage (in absolute value) at various pressures. For the lowest pressure, only the deposition rate without a Vneg is shown. This is because even a small application of substrate bias (a few volts) induced stress phenomena, ultimately leading to delamination. This failure is attributed to the coating density. As discussed later in this paper, the densest coating was achieved at the lowest pressure without a Vneg. Under these conditions, the bombardment of the growing coating by energetic gas particles created a highly compact structure with inherent residual stress [47,48,49,50,51,52,53]. Consequently, even a minimal application of negative substrate bias voltage generated an electric field that accelerated ions toward the sample, increasing compression and ultimately causing delamination. At pressures above 1 Pa, the thickness of the W coatings, expressed as the DR, was found to strongly depend on the Vneg during deposition. The coating thickness decreased as the Vneg increased. A similar behavior regarding the effects of substrate bias on DR was reported by Vüllers et al. [54]. This reduction can be attributed to the re-sputtering of the growing coating caused by surface bombardment from ions highly energized by the negative substrate bias voltage [55]. Simultaneously, these energetic ions bombard the growing film, enhancing its packing density by filling voids and partially suppressing columnar growth.
As the experimental data show, there is a clear and expected dependence of DR on the pressure (range 1–5 Pa), similarly as observed in [56]. At low pressures, a low density of sputtering gas produces a lower sputtering rate, leading to a consequent reduction in the DR. Under our experimental conditions, at higher pressures, a high sputter gas density enhances the sputtering rate, resulting in a greater DR, as described in theory [57].
This increase in DR can be largely attributed to the rise in Γi, a key parameter governing the sputtering process. Γi increases with pressure primarily because of the increased ne arising from enhanced collisional ionization. Although the Te decreases with pressure due to collisional cooling, its overall impact on Γi is less pronounced. While Te appears in the Bohm velocity equation (vb = √(eTe /Mi), where e is the elementary charge and Mi is the ion mass), the square root relationship moderates its influence. Therefore, the dominant effect of the increasing ne leads to a net increase in Γi, which in turn enhances the sputtering yield, and consequently, the DR.
Regarding the coating density ρ, an increase in pressure results in a lower mass density. This occurs because increasing the pressure reduces the mean free path (λmfp) of the sputtered atoms due to collisions between particles (Figure 5). For example, the λmfp at 1 Pa is approximately 18 mm, which is less than one-third of the target-to-substrate distance in our system. Therefore, when sputtering in the pressure range of 1–5 Pa, the atoms lose much of their original energy through collisions in the gas phase, are not sufficiently energetic when they arrive at the growing surface, and are unable to diffuse efficiently on the substrate surface, thus reducing their densification ability. Furthermore, while the increase in ne promotes ionization and sputtering, the concurrent decrease in Te can influence the energy of ions reaching the substrate indirectly via its effect on the plasma potential. This complex interplay between pressure, ne, and Te plays a critical role in determining the final coating density and structure. Thus, the observed trends in DR and ρ are consistent with the variations in plasma parameters, demonstrating how fundamental plasma characteristics significantly influence both the DR and the resulting coating properties.
In terms of the Vneg, when the bias (in absolute value) is increased to certain values (Figure 6) at constant pressure, the effect is an increase in ρ due to the increased ion energy. The strong ion bombardment induced by the Vneg raises the energy of the adatoms, enhancing their mobility and consequent increase in densification. However, when the Vneg is further increased (exceeding 100 V at 3 Pa and 150 V at 5 Pa), a further increase in ρ is not achieved. This is mainly caused by excessively high ion energy, which produces both sputtering and defects (voids) in the growing coating, and concurrently, delamination points are detected.
Nevertheless, the densest coating (18.7 g/cm3) was obtained at the lowest pressure (1 Pa) without Vneg, and it was close to the theoretical density of W bulk at 300 K, which is 19.28 g/cm3 [58].

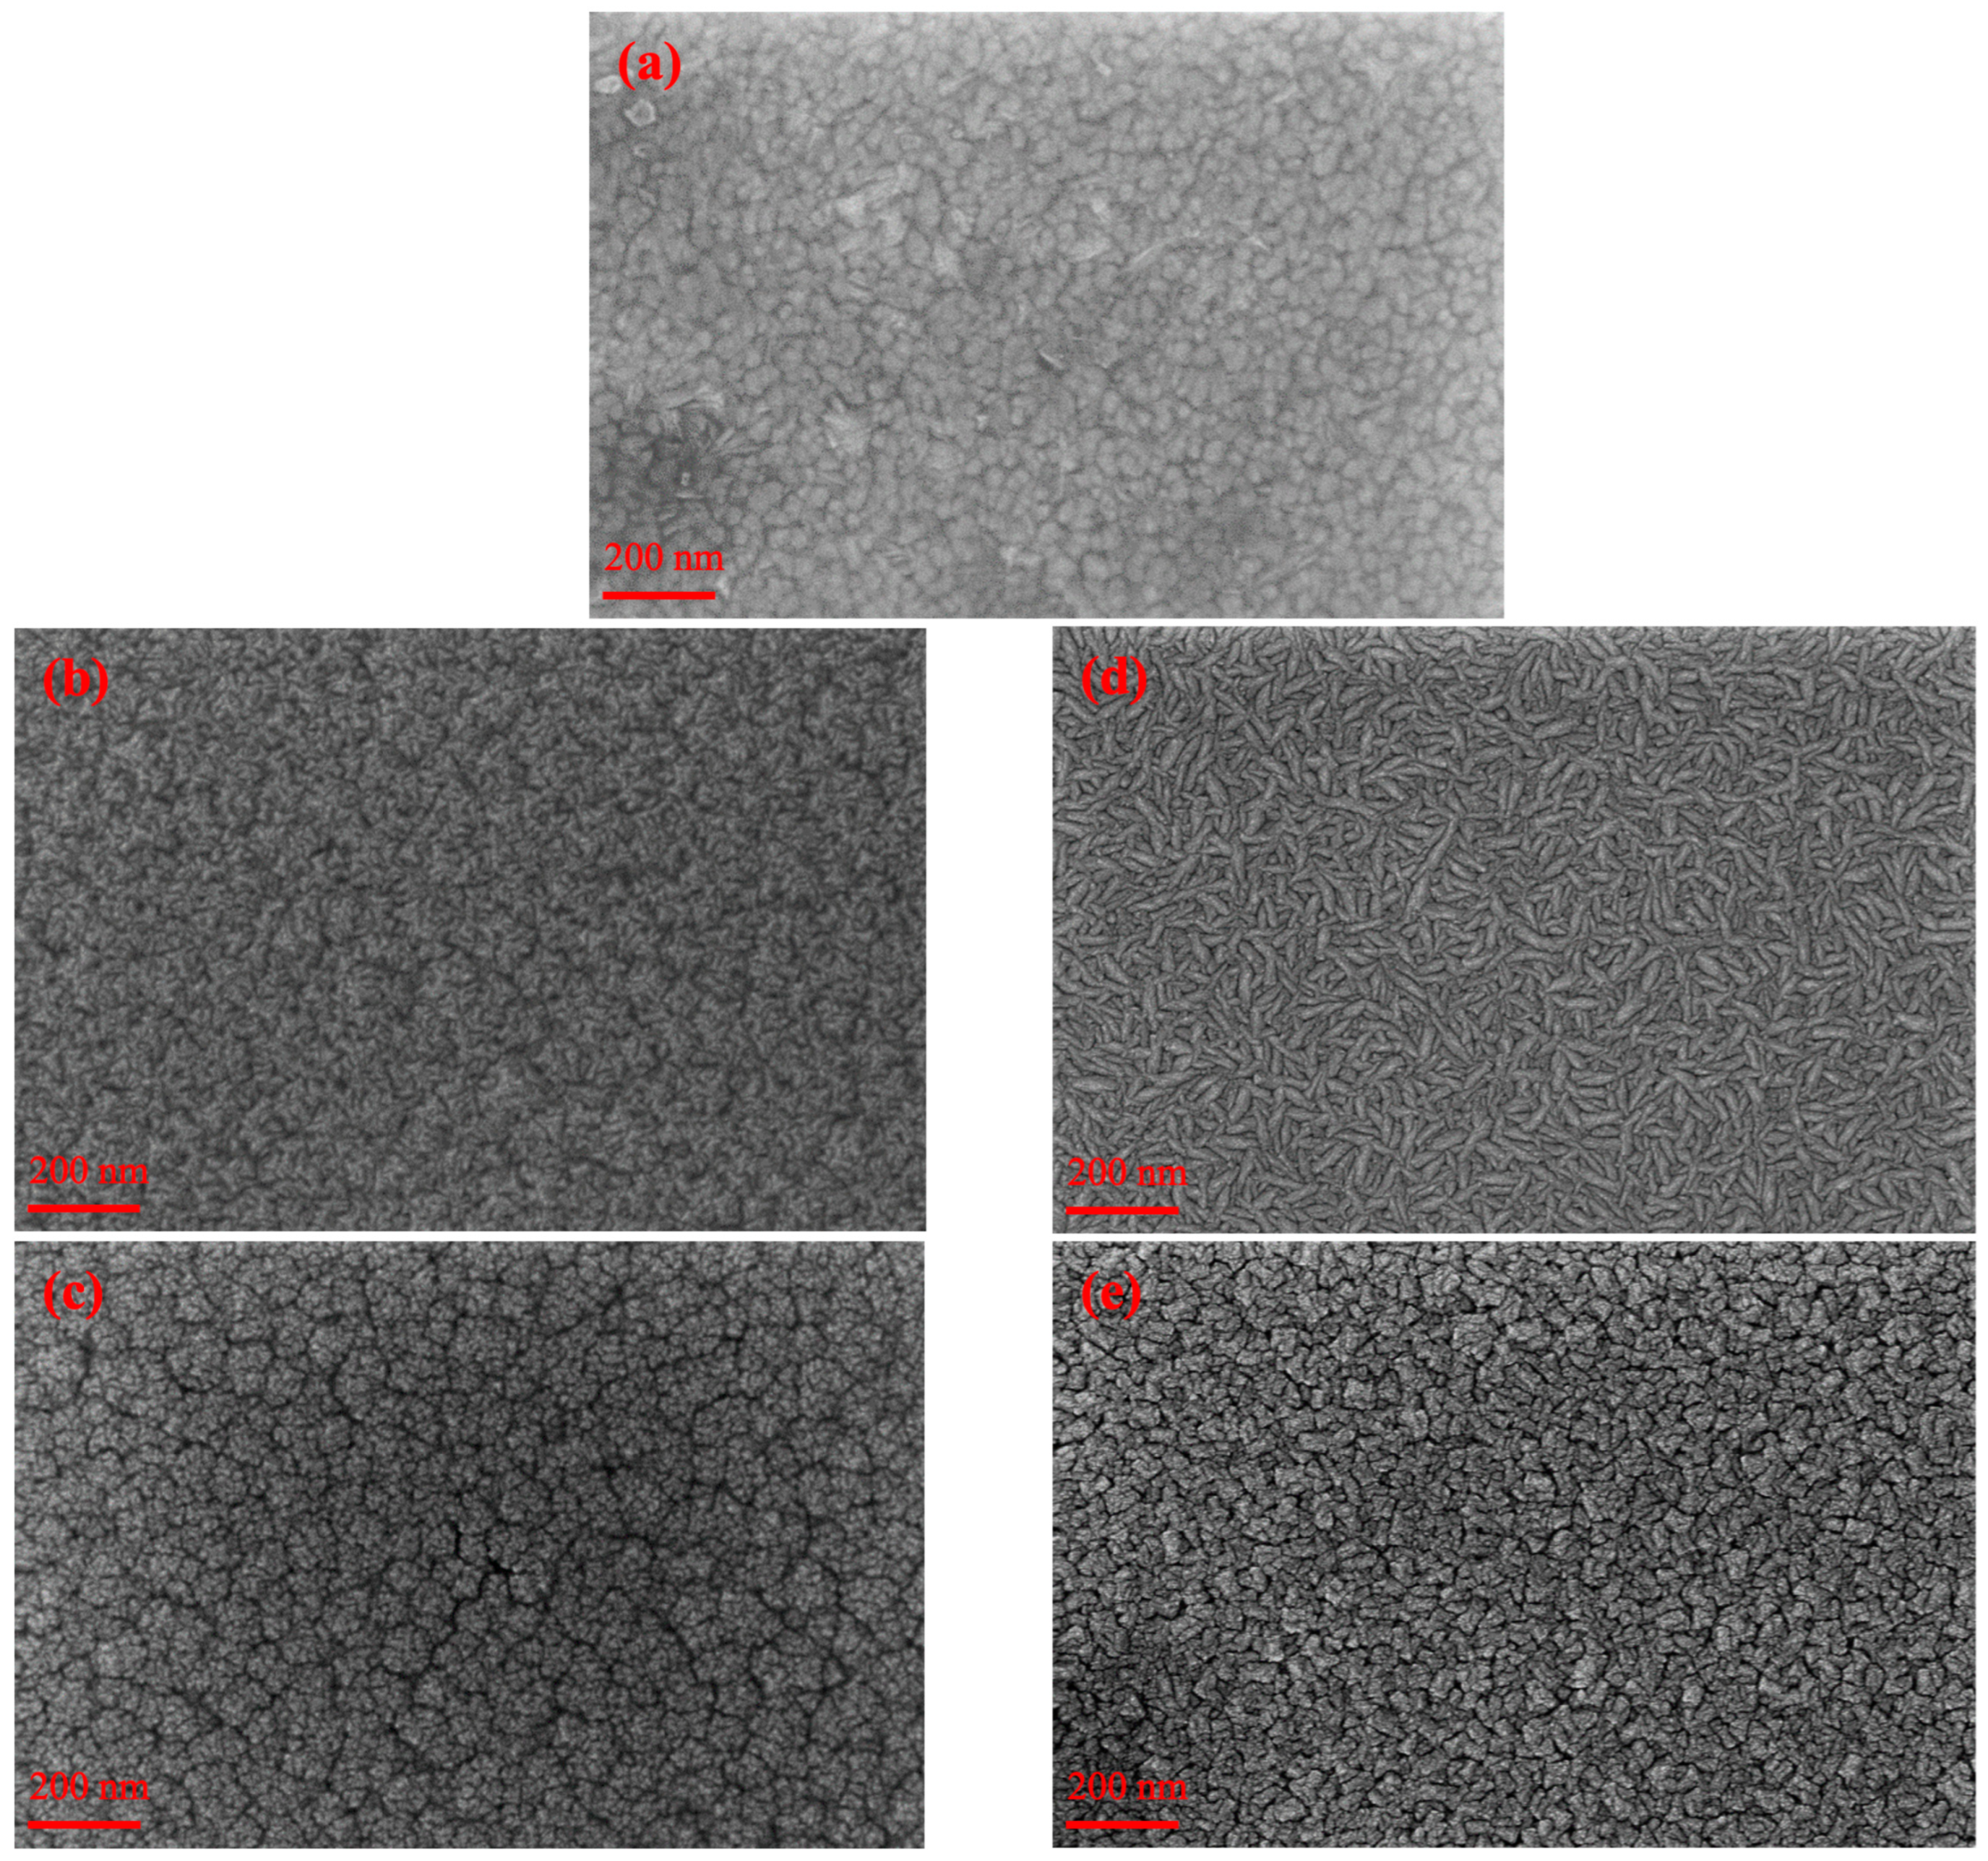
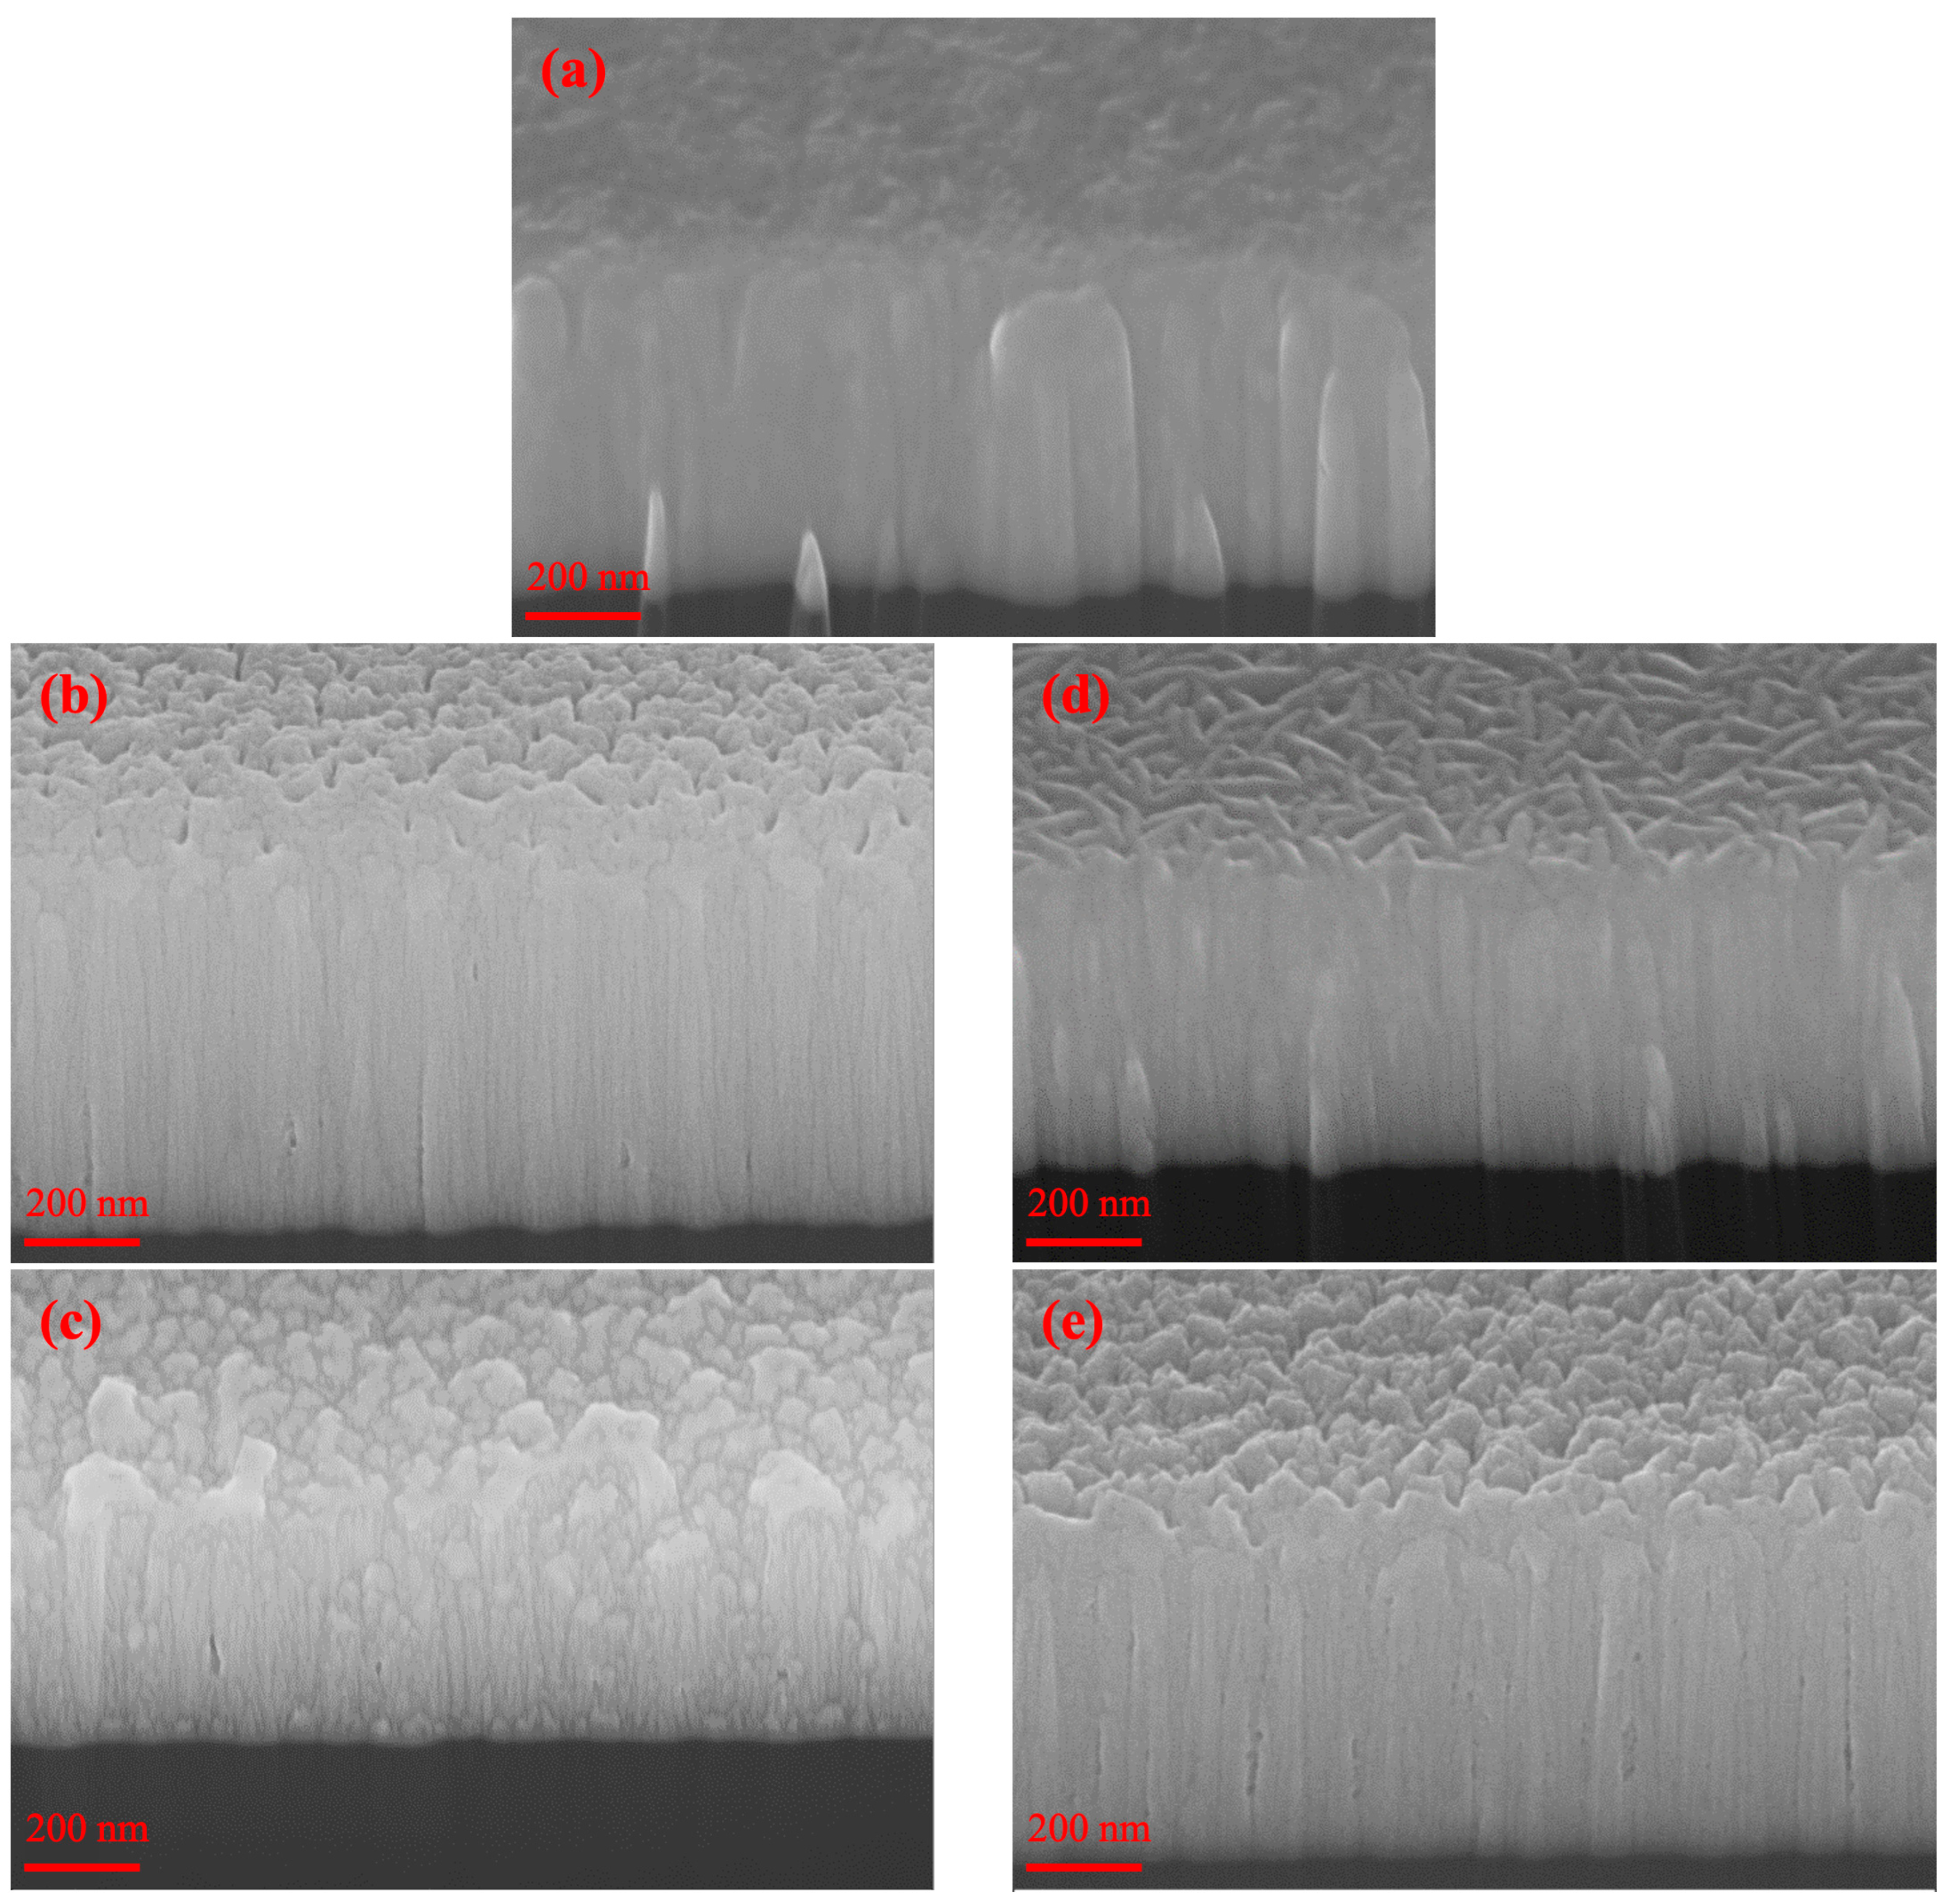
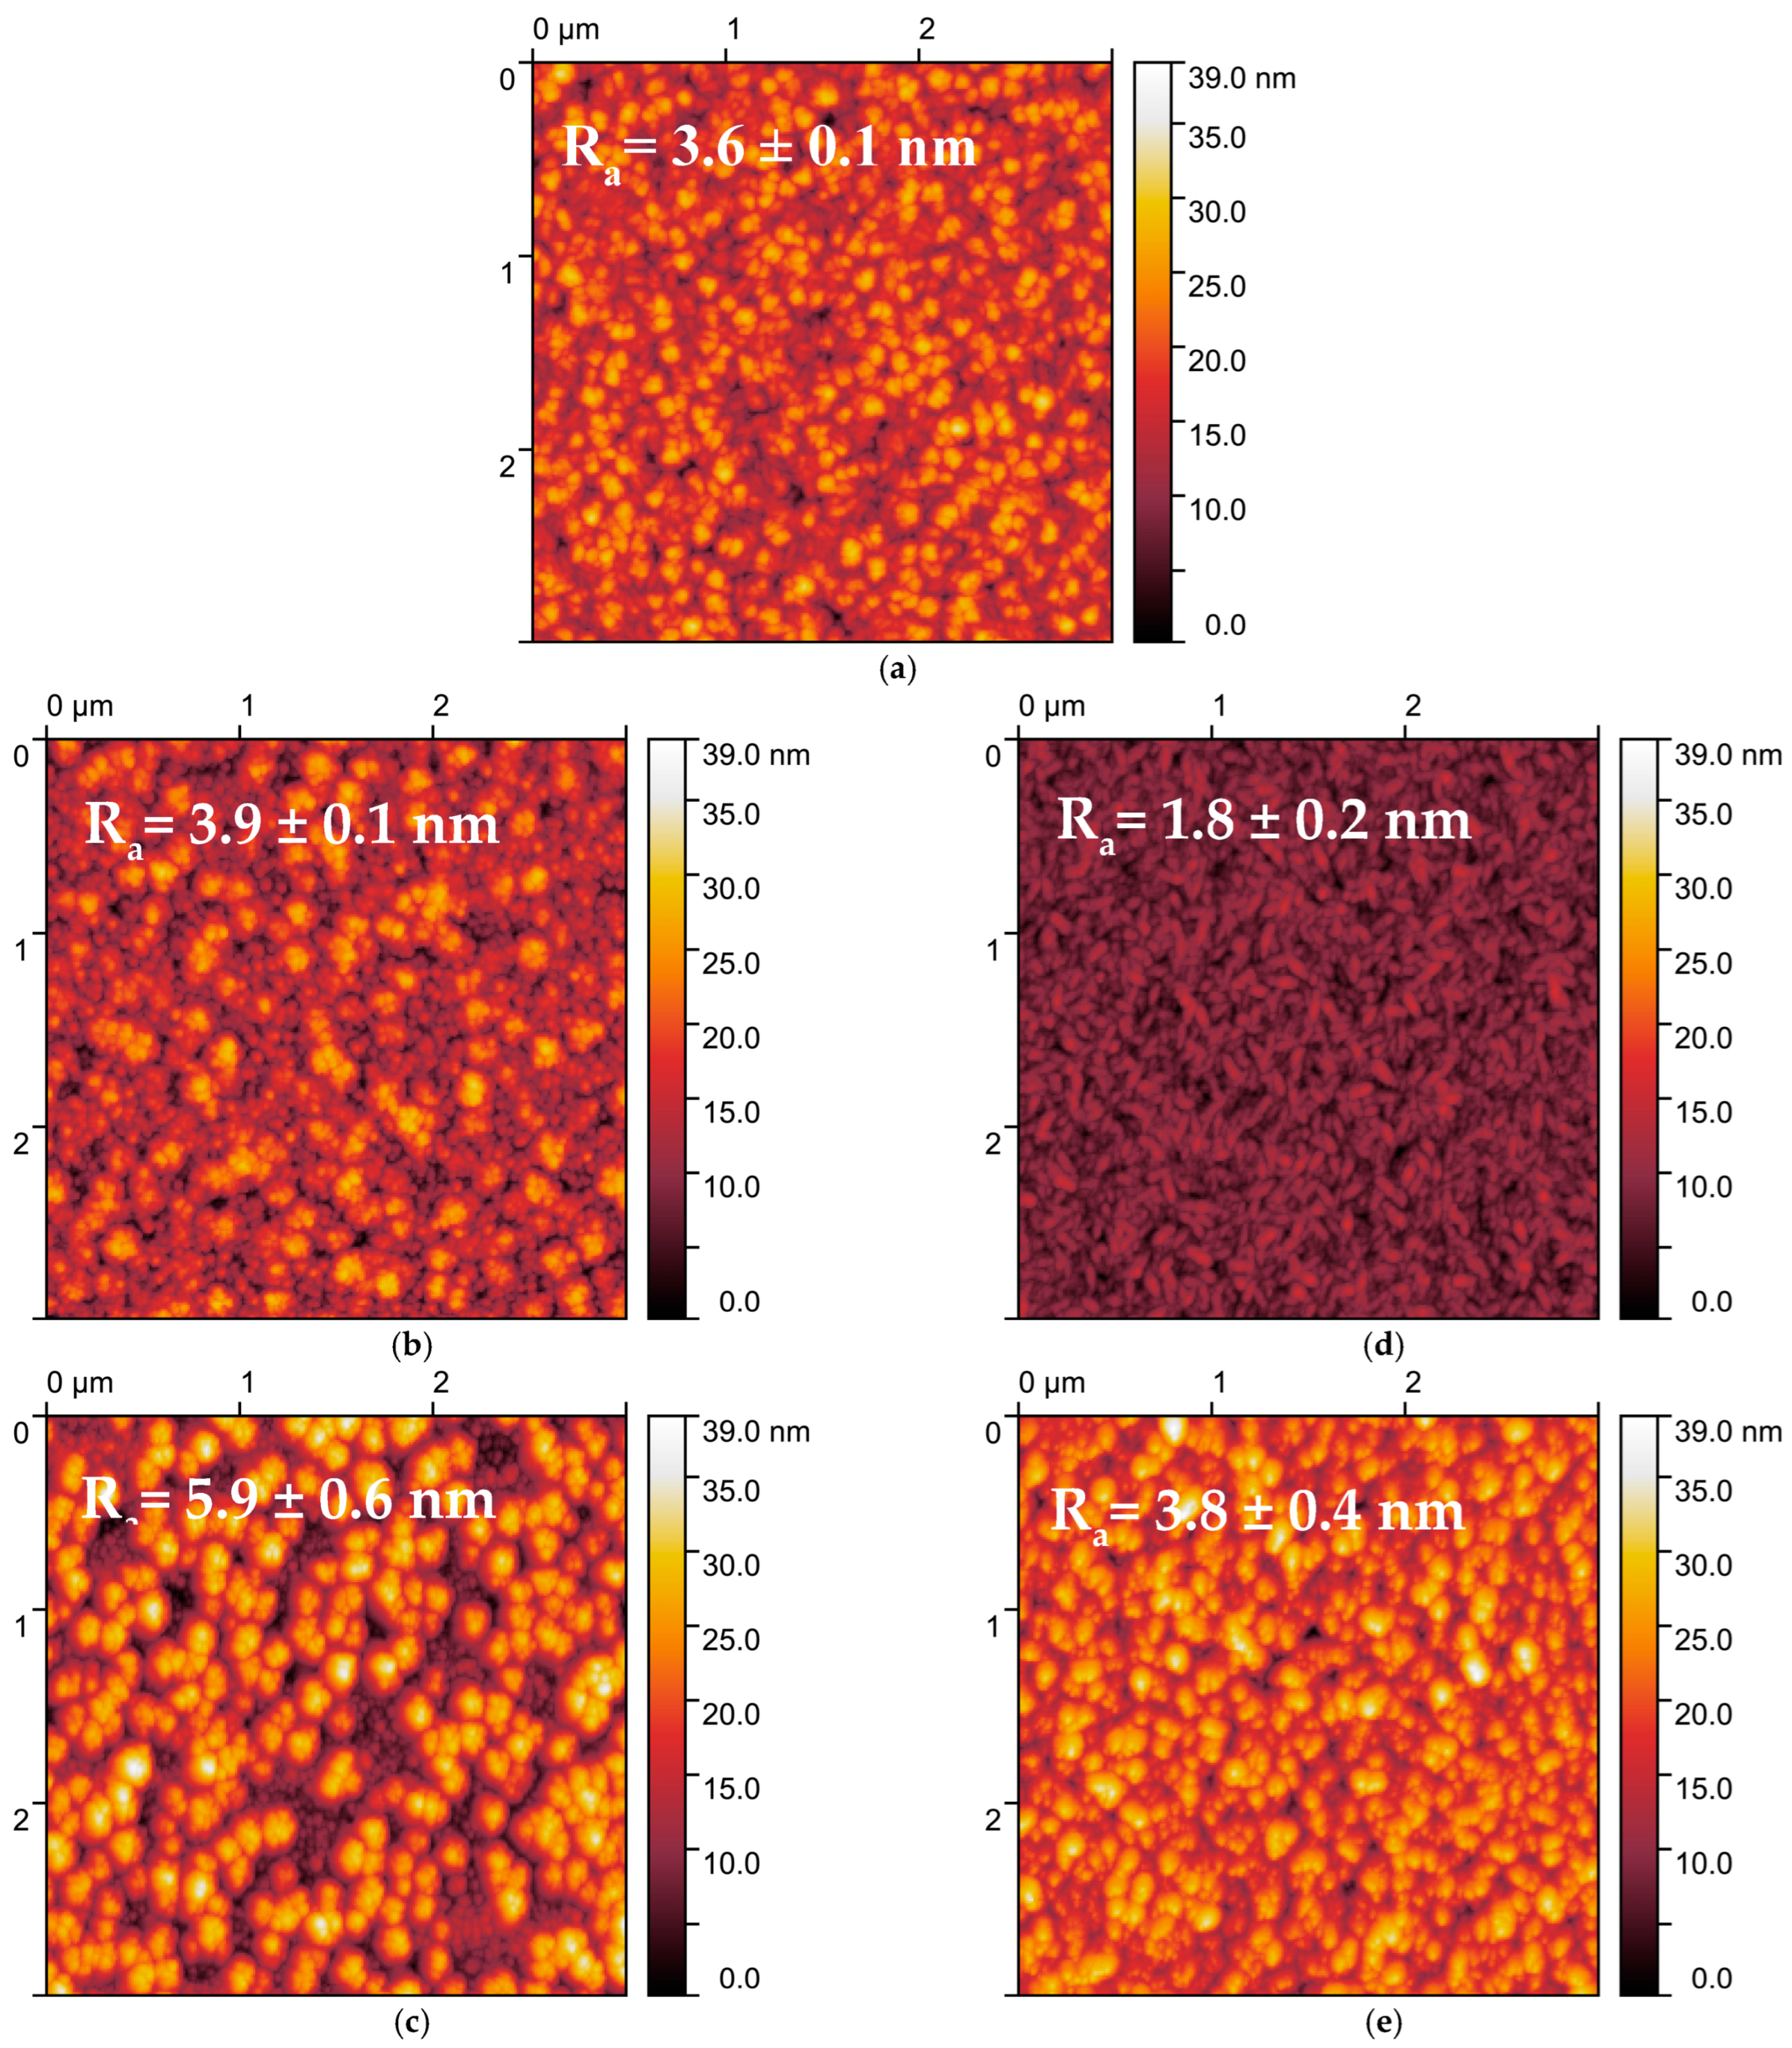
3.2.1. Surface Morphology and Microstructural Characterization (SEM, AFM and XRD)

Figure 7 and Figure 8 show SEM images at magnification M = 200 KX of the top view and cross-sectional view of sputtered W coatings as a function of pressure and with different negative biases.
W coatings exhibit a typical columnar structure, which varies as a function of pressure (a–c). As discussed previously, increasing the pressure leads to an increase in ne and a decrease in Te. This increase in ne enhances the ion flux towards the substrate, while the decrease in Te (electrons are cooled down due to collisions with gas atoms) reduces their energy by lowering the plasma potential and reducing the electric field that accelerates ions toward the substrate. The lower ion energy favors the growth of thinner and more porous columns, as adatoms have less energy to diffuse and fill voids. This effect is evident in the coating morphology: At 1 Pa, the columns are wide and compact, with a density close to that of bulk W (Figure 6). At 3 Pa, the column dimensions decrease, and some pores appear, leading to a reduction in density to approximately 13 g/cm3. At 5 Pa, the columns become even smaller, with a further increase in porosity and a density drop to around 10 g/cm3. Applying a bias voltage (d–e) significantly modifies these trends by directly increasing the energy of ions bombarding the surface. Unlike pressure, which influences ion energy indirectly through changes in Te and plasma potential, the application of Vneg directly accelerates ions towards the substrate, providing a more directional and controllable energy source. Furthermore, while reducing the pressure from 5 Pa to 1 Pa increases the plasma potential by approximately 4 V—leading to a minor increase in ion energy—the application of Vneg has a much greater effect. This has a pronounced densification effect: at 3 Pa, applying −100 V increases the column width, making some structures resemble those at 1 Pa, while eliminating pores and raising the density to approximately 16 g/cm3. For the more porous 5 Pa coating, applying −150 V results in a columnar structure similar to the unbiased 3 Pa sample, with only a few residual pores and a comparable density of around 13 g/cm3. This effect aligns with prior findings in the literature [59].
AFM images (Figure 9) display that the deposited W coatings grow in columnar mode, confirming the SEM analyses. As illustrated, the coatings present a surface composed of nm-sized globular domains whose size increases with the gas pressure. Consequently, the roughness follows the same trend. According to the relationship between the working pressure and kinetic energy of the sputtered particles, at low pressure, the particles reach the substrate with very few collisions, maintaining such energy that allows them to spread and fill the voids in the growing coating, leading to smooth thin films. On the other hand, at higher gas pressures, sputtered atoms undergo more collisions before reaching the substrate. This reduces their kinetic energy, and adatoms tend to spread more slowly and aggregate into larger grains rather than forming a denser, fine-grained structure. As might be expected, an application of Vneg (Figure 9d,e) produces, in addition to greater densification of the coating, a smoother surface.
Collected XRD patterns are reported in Figure 10. In each sample, the α-W bcc microstructure [7] is clearly visible, characterized by broad peaks typical of nanostructured materials. In particular, the width of detected peaks appears to increase with the increase of the deposition pressure and, at the same pressure, it decreases with the application of polarization to the substrate during the deposition process. A smaller width of the peaks is generally associated with higher crystallinity and larger crystalline domains in the deposited films. The observed trends suggest that the energy of the ions impinging on the growth surface plays a critical role in determining the crystallinity of the films. Specifically, the variation in peak width with pressure and bias indicates that higher ion energies promote the formation of larger crystalline domains and improved crystallinity, while lower ion energies result in smaller domains and reduced crystallinity.
In two samples, namely in the coatings deposited at 1 Pa and 3 Pa plus bias of −100 V, a secondary crystalline phase appears, which is compatible with the metastable crystalline β-W, an A3B phase having A15 type crystal structure, which has already been observed by other authors [60,61]. The formation of β-W is described as a result of the interstitial incorporation of Ar, O, and self-interstitials during deposition [17,62]. In all other samples, no β-W phase was detected. According to Shen and Mai [49], oxygen contamination can result from the residual oxygen in the W sputter target used during the magnetron sputtering process or from outgassing from chamber walls, because the system is not supplied with a bake-out device. As the oxygen content increases (see the following paragraph), the formation of the β-W phase is favored. Contrary to expectations, the β-W phase is clearly visible only in the 1 Pa/0 V and 3 Pa/−100 V films; this experimental evidence might be due to the higher mobility of the adatoms, which led to an improved crystallinity and made the formation of the β-W crystalline phase possible.

3.2.2. Elemental Compositional Analysis

Table 1 represents the elemental compositional analysis obtained from EDX spectroscopy for W coatings grown as a function of sputtering pressures. Varying sputtering pressure has a significant impact on film composition as regards the amount of oxygen. As the pressure increases, the value of oxygen weight % increases, without the formation of crystallized oxide phases, since no signals could be observed in the XRD patterns.

3.2.3. Electrical Resistivity

As expected, the DC electrical resistivity (Rρ300 K) of W coatings deposited on Si substrate changed as a function of the pressure from ≈ 3.2·10−5 to 7.7·10−7 Ω·m at lower pressure (Figure 11). The resistivity of films depends mainly on the microstructure of the film. Indeed, as highlighted in the previous section, the increase in pressure led to a less dense coating and a smaller crystal size, which explains the increase of the Rρ300 K with the pressure increase (1–5 Pa). Rρ300 K also changed with the polarization of the substrate holder. At 3 Pa (bias −100 V), the Rρ300 K decreased by a factor of two, while at 5 Pa (bias −150 V), the Rρ300 K decreased by a factor of five. Even in this case, we can attribute this variation of Rρ300 K to the microstructure. Indeed, with polarization, both the mass density and size of the crystal increased, and consequently, the Rρ300 K decreased. Lastly, we note that only the experiment at 1 Pa produced an Rρ300 K like that of the W bulk, with a ρ300 K range from 5×10⁻⁸ to 5×10⁻⁷ Ω m [63]. Although in the literature [17,53], the increase in resistivity has been associated with the presence of β-W, assuming high-pressure coatings have the same density as low-pressure coatings, and vice versa, our results indicate that the coating density is the main factor to be controlled in order to have a low resistivity.

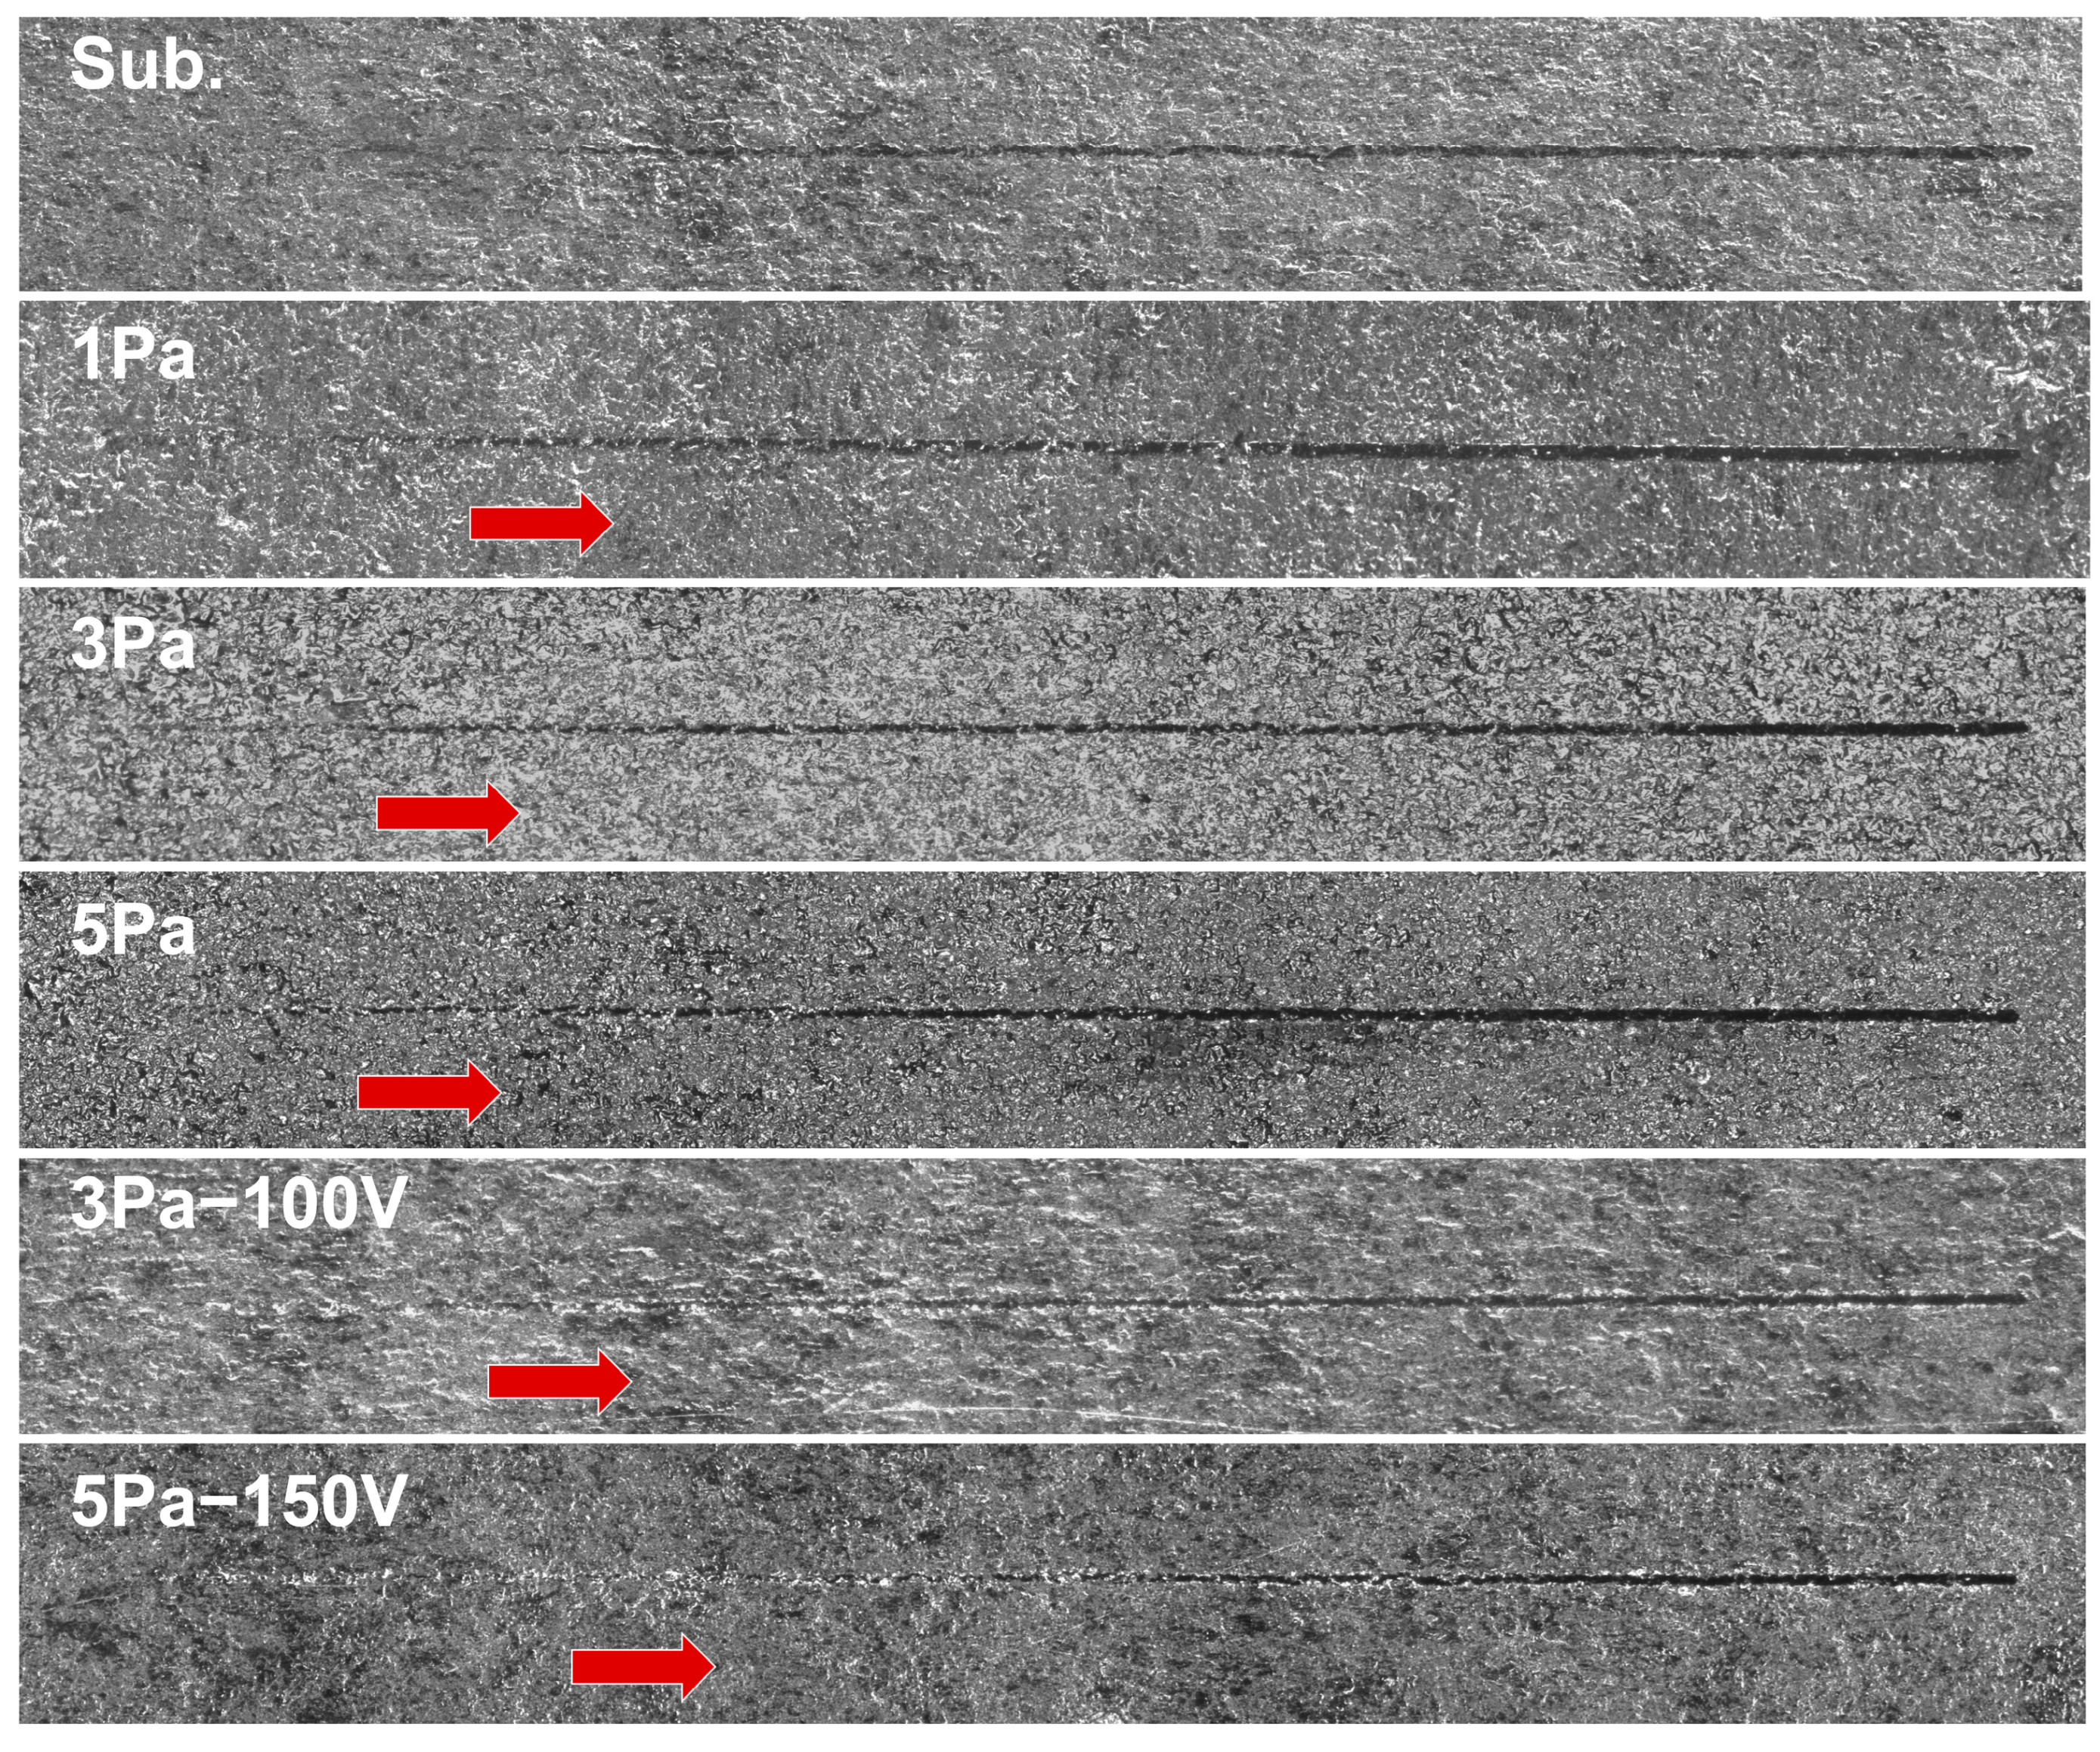
3.2.4. Mechanical Properties

In Figure 12 are reported some optical microscope images with a magnification of 40× of the surface of the W substrate and of the different W films produced. In Figure 13, the corresponding values of average roughness are displayed.
The roughness of the coatings was found to depend on both the deposition pressure and the sample Vneg bias. In particular, this increases with increasing chamber pressure. Furthermore, at the same deposition pressure, it decreases by applying a bias to the substrate during film growth. The roughness values measured for the sample produced at 3 Pa were found to be particularly dispersed. Therefore, the samples deposited under higher energetic conditions were found to be less rough, as confirmed by the trend of AFM measurements (Figure 9), which refer to a different roughness range due to the different roughness of the silicon substrate. The adhesion of W coatings deposited on W substrates was studied by scratch test measurements. Figure 14 shows some of the traces obtained on the different samples produced. Since the surface finishing and the color of the coatings are very similar to the underlying substrate, to discriminate more clearly the different failure points of the coating, the trace produced on the bare substrate is also shown in Figure 13. As can be seen from the graph, the average surface roughness Ra of the substrate is close to 0.5 μm. Starting from such a high value, the average surface roughness of several samples also exceeds this limit. Despite this high roughness, and despite W coatings typically breaking in a brittle way, it was possible to estimate Lc3 values. Table 2 reports the approximate values that were obtained.
The adhesion of these coatings was also found to depend on both the deposition pressure and the Vneg. The observed trend was inversely proportional to that of the roughness. Indeed, the Lc3 value decreases with increasing chamber pressure. Moreover, at the same deposition pressure, it increases by applying a negative bias. Therefore, the samples deposited at higher energy conditions were found to be more adherent to the substrate.

4. Conclusions

The effects of the negative substrate bias voltage (Vneg) and sputtering pressure on the structure and properties of the W coatings deposited using an RF magnetron sputtering system have been investigated. The W films showed an increase in mass density, crystallinity, and adhesion, and a decrease in surface roughness and electrical resistivity, with the application of a suitable Vneg at fixed pressure. These improvements in the film properties with Vneg can be attributed to the increased energy of ions impinging on the substrate, which enhances adatom mobility and promotes densification. At the same time, it was found that a further increase in Vneg produced residual stress, which led to delamination phenomena. Regarding the plasma parameter, Vneg applied to the substrate showed no significant effect on the electron density (ne) and (Te); this can be attributed to the measuring position of the probe, which acquires the signal from the plasma bulk out of the sample holder sheath. Regarding the sputtering pressure variation (1–5 Pa), plasma parameters were found to be strongly influenced. The electron collision rate affects the energy balance of the electrons and impacts both electron density and electron temperature. Specifically, increasing the pressure leads to a higher ne and a lower Te, which has a significant impact on the ion flux and the energy of ions reaching the substrate. At low pressures, the mean free path of electrons is relatively large, and collisions are not very frequent. Therefore, ionization processes are limited, leading to lower ne (and consequently, a lower ion flux). For Te, this tends to be higher because electrons lose energy less frequently in collisions. As the pressure increases, the density of neutral particles increases. This leads to more frequent electron collisions that promote more ionization processes, resulting in a higher ne. At the same time, frequent electronic collisions result in more energy transfer from the electrons to the heavy particles. This produces the overall collisional cooling effect, diminishing the Te. As a result of the coatings, the pressure increase led to a decrease in the mass density, crystallinity, and adhesion and an increase in the surface roughness and electrical resistivity. This degradation of the film properties with increasing pressure can be directly linked to the changes in ne and Te, which result in a modified ion flux and a reduced ion energy at the substrate.

Author Contributions

Investigation, E.V., M.P., M.S., D.M., G.F., E.M., S.M.D., V.Z., D.R. and L.O.; Project administration, E.V.; Writing—original draft, E.V. and M.P.; Writing—review and editing, E.V., M.P., M.S., D.M., G.F., E.M., S.M.D., V.Z., D.R. and L.O. All authors have read and agreed to the published version of the manuscript.

Funding

This research received no external funding.

Institutional Review Board Statement

Not applicable.

Informed Consent Statement

Not applicable.

Data Availability Statement

Data are contained within the article.

Conflicts of Interest

The authors declare no conflicts of interest.

References

  1. Lassner, E.; Schubert, W.-D. Tungsten: Properties, Chemistry, Technology of the Element, Alloys, and Chemical Compounds; Springer: New York, NY, USA, 1999. [Google Scholar]
  2. Rollinson, C.L. The Chemistry of Chromium, Molybdenum, and Tungsten; Pergamon Press: New York, NY, USA, 1975. [Google Scholar]
  3. Raumann, L.; Coenen, J.W.; Riesch, J.; Mao, Y.; Gietl, H.; Höschen, T.; Linsmeier, C.; Guillon, O. Modeling and validation of chemical vapor deposition of tungsten for tungsten fiber reinforced tungsten composites. Surf. Coat. Technol. 2020, 381, 124745. [Google Scholar] [CrossRef]
  4. Yeh, W.K.; Chen, M.C.; Wang, P.J.; Liu, L.M.; Lin, M.S. Deposition properties of selective tungsten chemical vapor deposition. Mater. Chem. Phys. 1996, 45, 284–287. [Google Scholar] [CrossRef]
  5. Dellasega, D.; Merlo, G.; Conti, C.; Bottani, C.E.; Passoni, M. Nanostructured and amorphous-like tungsten films grown by pulsed laser deposition. J. Appl. Phys. 2012, 112, 084328. [Google Scholar] [CrossRef]
  6. Souk, J.H.; O’Hanlon, J.F.; Angillelo, J. Characterization of electron-beam deposited tungsten films on sapphire and silicon. J. Vac. Sci. Technol. A 1985, 3, 2289–2292. [Google Scholar] [CrossRef]
  7. Shen, Y.G.; Mai, Y.M.; Zhang, Q.C.; McKenzie, D.R.; McFall, W.D.; McBride, W.R. Residual stress, microstructure, and structure of tungsten thin films deposited by magnetron sputtering. J. Appl. Phys. 2000, 87, 177–187. [Google Scholar] [CrossRef]
  8. Xu, Y.F.; Xu, Y.; Luo, L.M.; Zan, X.; Wu, Y.C. Manufacturing of magnetron sputtering tungsten coatings and irradiation damage behaviour under helium plasma exposure. Vacuum 2022, 205, 111411. [Google Scholar] [CrossRef]
  9. Abdelhameed, A.H.; Angloher, G.; Bauer, P.; Bento, A.; Bertoldo, E.; Canonica, L.; Fuchs, D.; Hauff, D.; Ferreiro Iachellini, N.; Mancuso, M.; et al. Deposition of tungsten thin films by magnetron sputtering for large-scale production of tungsten-based transition-edge sensors. J. Low Temp. Phys. 2020, 199, 401–407. [Google Scholar] [CrossRef]
  10. Verbrugghe, N.; Fasquelle, D.; Duponchel, B.; Députier, S. Study of tungsten films deposited by DC sputtering dedicated to integrated heaters. J. Vac. Sci. Technol. B 2017, 35, 031204. [Google Scholar] [CrossRef]
  11. Bouziane, K.; Mamor, M.; Meyer, F. DC magnetron sputtered tungsten: W film properties and electrical properties of W/Si Schottky diodes. Appl. Phys. A 2005, 81, 209–215. [Google Scholar] [CrossRef]
  12. Chen, G.S.; Yang, L.C.; Tian, H.S.; Hsu, C.S. Evaluating substrate bias on the phase-forming behavior of tungsten thin films deposited by diode and ionized magnetron sputtering. Thin Solid Films 2005, 484, 83–89. [Google Scholar] [CrossRef]
  13. Vijaya, G.; Muralidhar Singh, M.; Krupashankara, M.S.; Kulkarni, R.S. Effect of Argon Gas Flow Rate on the Optical and Mechanical Properties of Sputtered Tungsten Thin Film Coatings. IOP Conf. Ser. Mater. Sci. Eng. 2016, 149, 012075. [Google Scholar] [CrossRef]
  14. Chargui, A.; El Beainou, R.; Mosset, A.; Euphrasie, S.; Potin, V.; Vairac, P.; Martin, N. Influence of Thickness and Sputtering Pressure on Electrical Resistivity and Elastic Wave Propagation in Oriented Columnar Tungsten Thin Films. Nanomaterials 2020, 10, 81. [Google Scholar] [CrossRef] [PubMed]
  15. Zhu, L.; Li, G.; Wang, H.; Xu, B.; Zhuang, D.; Liu, J. Microstructures and nano mechanical properties of the metal tungsten film. Curr. Appl. Phys. 2009, 9, 510–514. [Google Scholar] [CrossRef]
  16. Maier, J.L.H.; Balden, M.; Linke, J.; Koch, F.; Bolt, H. Properties of tungsten coatings deposited onto fine grain graphite by different methods. Surf. Coat. Technol. 2001, 142-144, 733–737. [Google Scholar] [CrossRef]
  17. O’Keefe, M.J.; Grant, J.T.; Solomon, J.S. Magnetron sputter deposition of A-15 and bcc crystal structure tungsten thin films. J. Electron. Mater. 1995, 24, 961–967. [Google Scholar] [CrossRef]
  18. Zheng, P.; Ozsdolay, B.D.; Gall, D. Epitaxial growth of tungsten layers on MgO(001). J. Vac. Sci. Technol. A 2015, 33, 061505. [Google Scholar] [CrossRef]
  19. Rane, G.K.; Menzel, S.; Gemming, T.; Eckert, J. Microstructure, electrical resistivity and stresses in sputter deposited W and Mo films and the influence of the interface on bilayer properties. Thin Solid Films 2014, 571, 1–8. [Google Scholar] [CrossRef]
  20. Conrads, H.; Schmidt, M. Plasma generation and plasma sources. Plasma Sources Sci. Technol. 2000, 9, 441–454. [Google Scholar] [CrossRef]
  21. Smith, D.L. Thin Film Deposition: Principles and Practice; McGraw-Hill: New York, NY, USA, 1995. [Google Scholar]
  22. Amos, R.S.; Breyer, P.E.; Huang, H.H.; Lichtenberger, A.W. Stress and source conditions of DC magnetron sputtered Nb films. IEEE Trans. Appl. Supercond. 1995, 5, 2326–2329. [Google Scholar] [CrossRef]
  23. Xie, Q.; Fu, Z.; Wei, X.; Li, X.; Yue, W.; Kang, J.; Zhu, L.; Wang, C.; Meng, J. Effect of substrate bias current on structure and properties of CrNx films deposited by plasma enhanced magnetron sputtering. Surf. Coat. Technol. 2019, 365, 134–142. [Google Scholar] [CrossRef]
  24. Cao, F.; Munroe, P.; Zhou, Z.; Xie, Z. Influence of substrate bias on microstructural evolution and mechanical properties of TiAlSiN thin films deposited by pulsed-DC magnetron sputtering. Thin Solid Films 2017, 639, 137–144. [Google Scholar] [CrossRef]
  25. Ding, J.C.; Wang, Q.M.; Liu, Z.R.; Jeong, S.; Zhang, T.F.; Kim, K.H. Influence of bias voltage on the microstructure, mechanical and corrosion properties of AlSiN films deposited by HiPIMS technique. J. Alloys Compd. 2019, 772, 112–121. [Google Scholar] [CrossRef]
  26. Hajihoseini, H.; Kateb, M.; Ingvarsson, S.; Gudmundsson, J.T. Effect of substrate bias on properties of HiPIMS deposited vanadium nitride films. Thin Solid Films 2018, 663, 126–130. [Google Scholar] [CrossRef]
  27. Zenga, Y.; Tana, Z.; Zhou, L.; Jianga, M.; Qiua, Y.; Fanga, F.; Huanga, H.; Zhanga, X.; Jiang, J. Effects of bias voltage on Fen films prepared by magnetron sputtering. Mater. Res. 2015, 18, 115–119. [Google Scholar] [CrossRef]
  28. Wang, Z.; Zhang, D.; Ke, P.; Liu, X.; Wang, A. Influence of substrate negative bias on structure and properties of TiN coatings prepared by hybrid HIPIMS method. J. Mater. Sci. Technol. 2015, 31, 37–42. [Google Scholar] [CrossRef]
  29. Fan, Q.; Guo, M.; Wu, Z.; Hao, X.; Cao, F.; Liu, Y.; Wang, T. Effects of bias voltage on the microstructure and properties of AlCrN/AlTiN nanoscale multilayer coatings. Vacuum 2023, 215, 112327. [Google Scholar] [CrossRef]
  30. Ahn, S.M.; Jang, G.S.; Kim, D.Y.; Hwang, N.M. Effects of substrate bias and Ar pressure on growth of α-phase in W thin films deposited by RF magnetron sputtering. Electron. Mater. Lett. 2023, 19, 298–308. [Google Scholar] [CrossRef]
  31. Hugon, M.C.; Varniere, F.; Agius, B.; Froment, M.; Arena, C.; Bessot, J. Stresses, microstructure and resistivity of thin tungsten films deposited by RF magnetron sputtering. Appl. Surf. Sci. 1989, 38, 269–285. [Google Scholar] [CrossRef]
  32. Eser, E.; Ogilvie, R.E.; Taylor, K.A. The effect of bias on d.c. and r.f. sputtered WC-Co coatings. Thin Solid Films 1980, 67, 265. [Google Scholar] [CrossRef]
  33. Irimiciuc, S.A.; Chertopalov, S.; Lancok, J.; Craciun, V. Langmuir probe technique for plasma characterization during pulsed laser deposition process. Coatings 2021, 11, 762. [Google Scholar] [CrossRef]
  34. Chen, F.F. Electric Probes. In Plasma Diagnostic Techniques; Huddlestone, R.H., Leonard, S.L., Eds.; Academic Press: New York, NY, USA, 1965; Chapter 4; pp. 113–200. [Google Scholar]
  35. Chen, F.F.; Chang, J.P. Langmuir Probes. In Lecture Notes on Principles of Plasma Processing; Springer: Boston, MA, USA, 2003. [Google Scholar]
  36. Vassallo, E.; Pedroni, M.; Aloisio, M.; Minelli, D.; Nardone, A.; Chen, H.; Pietralunga, S.M.; Stinchelli, A.; Di Fonzo, F. Study of process parameters and characteristics properties of W coatings deposited by rf plasma sputtering. J. Vac. Sci. Technol. B 2023, 41, 032802. [Google Scholar] [CrossRef]
  37. Chung, P.M.; Talbot, L.; Touryan, K.J. Electric Probes in Stationary and Flowing Plasma; Springer: New York, NY, USA, 1975. [Google Scholar]
  38. Heidenreich, J.E., III.; Paraszczak, J.R.; Moisan, M.; Suave, G. Electrostatic probe analysis of microwave plasmas used for polymer etching. J. Vac. Sci. Technol. B 1987, 5, 347–354. [Google Scholar] [CrossRef]
  39. Lim, S.H.N.; McKenzie, D.R.; Bilek, M.M.M. Van der Pauw method for measuring resistivity of a plane sample with distant boundaries. Rev. Sci. Instrum. 2009, 80, 075109. [Google Scholar] [CrossRef]
  40. Van der Pauw, L.J. A method of measuring specific resistivity and Hall effect of discs of arbitrary shape. Philips Res. Rep. 1958, 13, 1–9. [Google Scholar]
  41. Keithley Application Note: Making van der Pauw Resistivity and Hall Voltage Measurements Using the 4200A-SCS Parameter Analyzer—Tektronix. Available online: https://www.tek.com (accessed on 1 February 2024).
  42. ISO 20502:2005; Fine Ceramics (Advanced Ceramics, Advanced Technical Ceramics)—Determination of Adhesion of Ceramic Coatings by Scratch Testing. ISO: Geneva, Switzerland, 2005.
  43. Dodd, R.; You, S.D.; Bryant, P.M.; Bradley, J.W. Negative ion density measurements in reactive magnetron sputtering. Plasma Process. Polym. 2009, 6, S615–S619. [Google Scholar] [CrossRef]
  44. Lieberman, M.A.; Lichtenberg, A.J. Principles of Plasma Discharges and Materials Processing, 2nd ed.; Wiley: Hoboken, NJ, USA, 2005. [Google Scholar]
  45. Legorreta, J.R.; Yousif, F.B.; Fuentes, E.B.; Vázquez, F.; Valencia, H.M. Interpretations of Langmuir probe data for positive ion number density of N2O DC plasma discharge. IEEE Trans. Plasma Sci. 2014, 42, 813–819. [Google Scholar] [CrossRef]
  46. Chen, F.F. Introduction to Plasma Physics and Controlled Fusion, 3rd ed.; Springer: New York, NY, USA, 2015. [Google Scholar]
  47. Holfman, W.; Thornton, J.A. Internal stresses in sputtered chromium. Thin Solid Films 1977, 40, 355–363. [Google Scholar] [CrossRef]
  48. Holfman, W.; Thornton, J.A. The compressive stress transition in Al, V, Zr, Nb and W metal films sputtered at low working pressures. Thin Solid Films 1977, 45, 387–396. [Google Scholar] [CrossRef]
  49. Holfman, W.; Thornton, J.A. Effects of substrate orientation and rotation on internal stresses in sputtered metal films. J. Vac. Sci. Technol. 1979, 16, 134–137. [Google Scholar] [CrossRef]
  50. Thornton, J.A.; Tabock, J.; Holfman, W.O. Internal stresses in metallic films deposited by cylindrical magnetron sputtering. Thin Solid Films 1979, 64, 111–119. [Google Scholar] [CrossRef]
  51. Holfman, W.; Thornton, J.A. Compressive stress and inert gas in Mo films sputtered from a cylindrical-post magnetron with Ne, Ar, Kr, and Xe. J. Vac. Sci. Technol. 1980, 17, 380–383. [Google Scholar] [CrossRef]
  52. Holfman, W.; Thornton, J.A. Internal stresses in Cr, Mo, Ta, and Pt films deposited by sputtering from a planar magnetron source. J. Vac. Sci. Technol. 1982, 20, 355–358. [Google Scholar] [CrossRef]
  53. Hoffman, D.W. Stress and property control in sputtered metal films without substrate bias. Thin Solid Films 1983, 107, 353–358. [Google Scholar] [CrossRef]
  54. Vüllers, F.T.N.; Spolenak, R. Alpha- vs. beta-W nanocrystalline thin films: A comprehensive study of sputter parameters and resulting materials’ properties. Thin Solid Films 2015, 577, 26–34. [Google Scholar] [CrossRef]
  55. Lee, M.K.; Kang, H.S. Characteristics of TiN film deposited on stellite using reactive magnetron sputter ion plating. J. Mater. Res. 1997, 12, 2393–2400. [Google Scholar] [CrossRef]
  56. Salamon, K.; Milat, O.; Radic, N.; Dubcek, P.; Jercinovic, M.; Bernstorff, S. Structure and morphology of magnetron sputtered W films studied by x-ray methods. J. Phys. D Appl. Phys. 2013, 46, 095304. [Google Scholar] [CrossRef]
  57. Maissel, L.I.; Glang, R. Handbook of Thin Film Technology; McGraw–Hill: New York, NY, USA, 1970. [Google Scholar]
  58. Brandes, E.A.; Brook, G.B. Smithells Metals Reference Book, 7th ed.; Butterworth-Heinemann: Oxford, UK, 1992. [Google Scholar]
  59. Lin, J.; Sproul, W.D.; Moore, J.J.; Wu, Z.L.; Lee, S.L. Effect of negative substrate bias voltage on the structure and properties of CrN films deposited by modulated pulsed power (MPP) magnetron sputtering. J. Phys. D Appl. Phys. 2011, 44, 425305. [Google Scholar] [CrossRef]
  60. Shen, Y.G.; Mai, Y.W. Influences of oxygen on the formation and stability of A15 β-W thin films. Mater. Sci. Eng. A 2000, 284, 176–183. [Google Scholar] [CrossRef]
  61. Ahangarani Farahani, F.; Depla, D. Phase composition of sputter deposited tungsten thin films. Surf. Coat. Technol. 2024, 494, 131447. [Google Scholar] [CrossRef]
  62. Weerasekera, I.A.; Shah, S.I.; Baxter, D.V.; Unruh, K.M. Structure and stability of sputter deposited beta-tungsten thin films. Appl. Phys. Lett. 1994, 64, 3231–3233. [Google Scholar] [CrossRef]
  63. Desai, P.D.; Chu, T.K.; James, H.M.; Ho, C.Y. Electrical resistivity of selected elements. J. Phys. Chem. Ref. Data 1984, 13, 1069–1096. [Google Scholar] [CrossRef]
Figure 1. Measured plasma density versus pressure and substrate bias voltage.
Coatings 15 00319 g001
Figure 2. Measured electron temperature versus pressure and substrate bias voltage.
Coatings 15 00319 g002
Figure 3. Measured ion flux versus pressure and substrate bias voltage.
Coatings 15 00319 g003
Figure 4. Deposition rate of W coatings as a function of the pressure and negative substrate bias.
Coatings 15 00319 g004
Figure 5. Estimated value of the mean free path of the W atoms at various Ar pressures at a fixed power.
Coatings 15 00319 g005
Figure 6. W coating density as a function of the pressure and negative substrate bias.
Coatings 15 00319 g006
Figure 7. Surface SEM images of the deposited W coatings at pressure: (a) 1 Pa, (b) 3 Pa, (c) 5 Pa with the bias voltage, (d) −100 V (3 Pa), (e) −150 V (5 Pa).
Coatings 15 00319 g007
Figure 8. Cross-sectional SEM images of the deposited W coatings at pressure: (a) 1 Pa, (b) 3 Pa, (c) 5 Pa with the bias voltage, (d) −100 V (3 Pa), (e) −150 V (5 Pa).
Coatings 15 00319 g008
Figure 9. AFM images of the deposited W coatings at pressure: (a) 1 Pa, (b) 3 Pa, (c) 5 Pa with the bias voltage, (d) −100 V (3 Pa), (e) −150 V (5 Pa).
Coatings 15 00319 g009
Figure 10. XRD patterns of deposited W-based coatings.
Coatings 15 00319 g010
Figure 11. Rρ300 K and mass density (ρ) of W coatings as a function of sputtering pressure and Vneg at a fixed power of 75 W. The error bars are not visible in the graph because the calculated standard deviation is two orders of magnitude lower than the value.
Coatings 15 00319 g011
Figure 12. Optical images of the W substrate and coated samples.
Coatings 15 00319 g012
Figure 13. Average roughness Ra of W substrate and coated samples.
Coatings 15 00319 g013
Figure 14. Optical images of the scratch for W coatings. The indentor displaced from the left to the right. The beginning of the red arrow indicates the point of the trace corresponding to the load value Lc3.
Coatings 15 00319 g014
Table 1. EDS analysis of W samples as a function of pressure.
Sputtering Pressure [Pa]ElementElement [Wt %]±SD
1W99.471.05
O0.530.10
3W96.600.91
O3.400.17
5W96.101.10
O3.900.20
Table 2. Estimated values for the Lc3 load associated with the adhesion of the coating to the substrate for the different samples deposited on W substrate.
1 Pa3 Pa5 Pa 3 Pa −100 V5 Pa −150 V
Lc3 (N)2.0 ± 0.11.7 ± 0.31.6 ± 0.12.2 ± 0.42.7 ± 0.2
Disclaimer/Publisher’s Note: The statements, opinions and data contained in all publications are solely those of the individual author(s) and contributor(s) and not of MDPI and/or the editor(s). MDPI and/or the editor(s) disclaim responsibility for any injury to people or property resulting from any ideas, methods, instructions or products referred to in the content.

