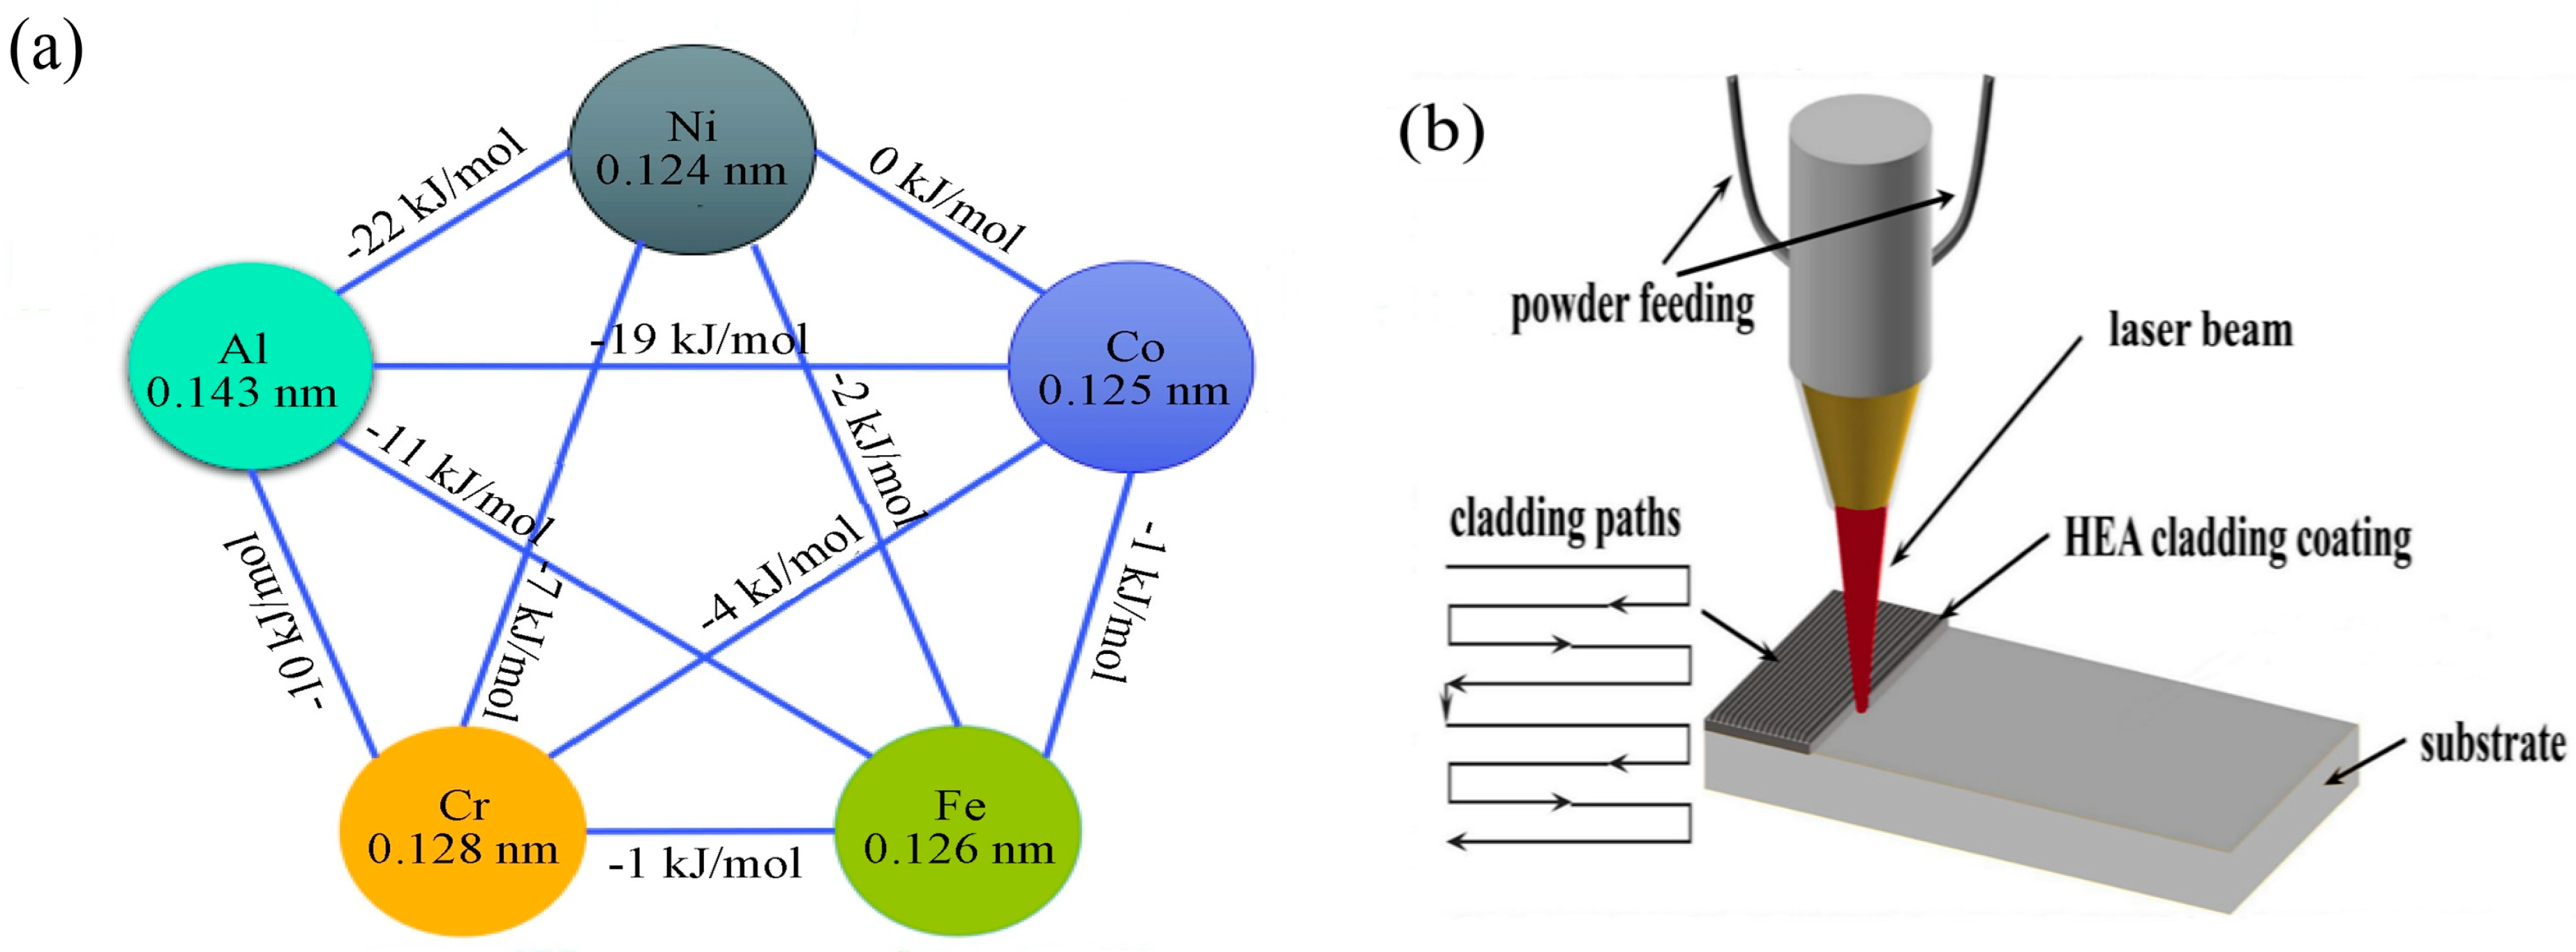
3.1. Cross-Section of Obtained Coatings Analysis
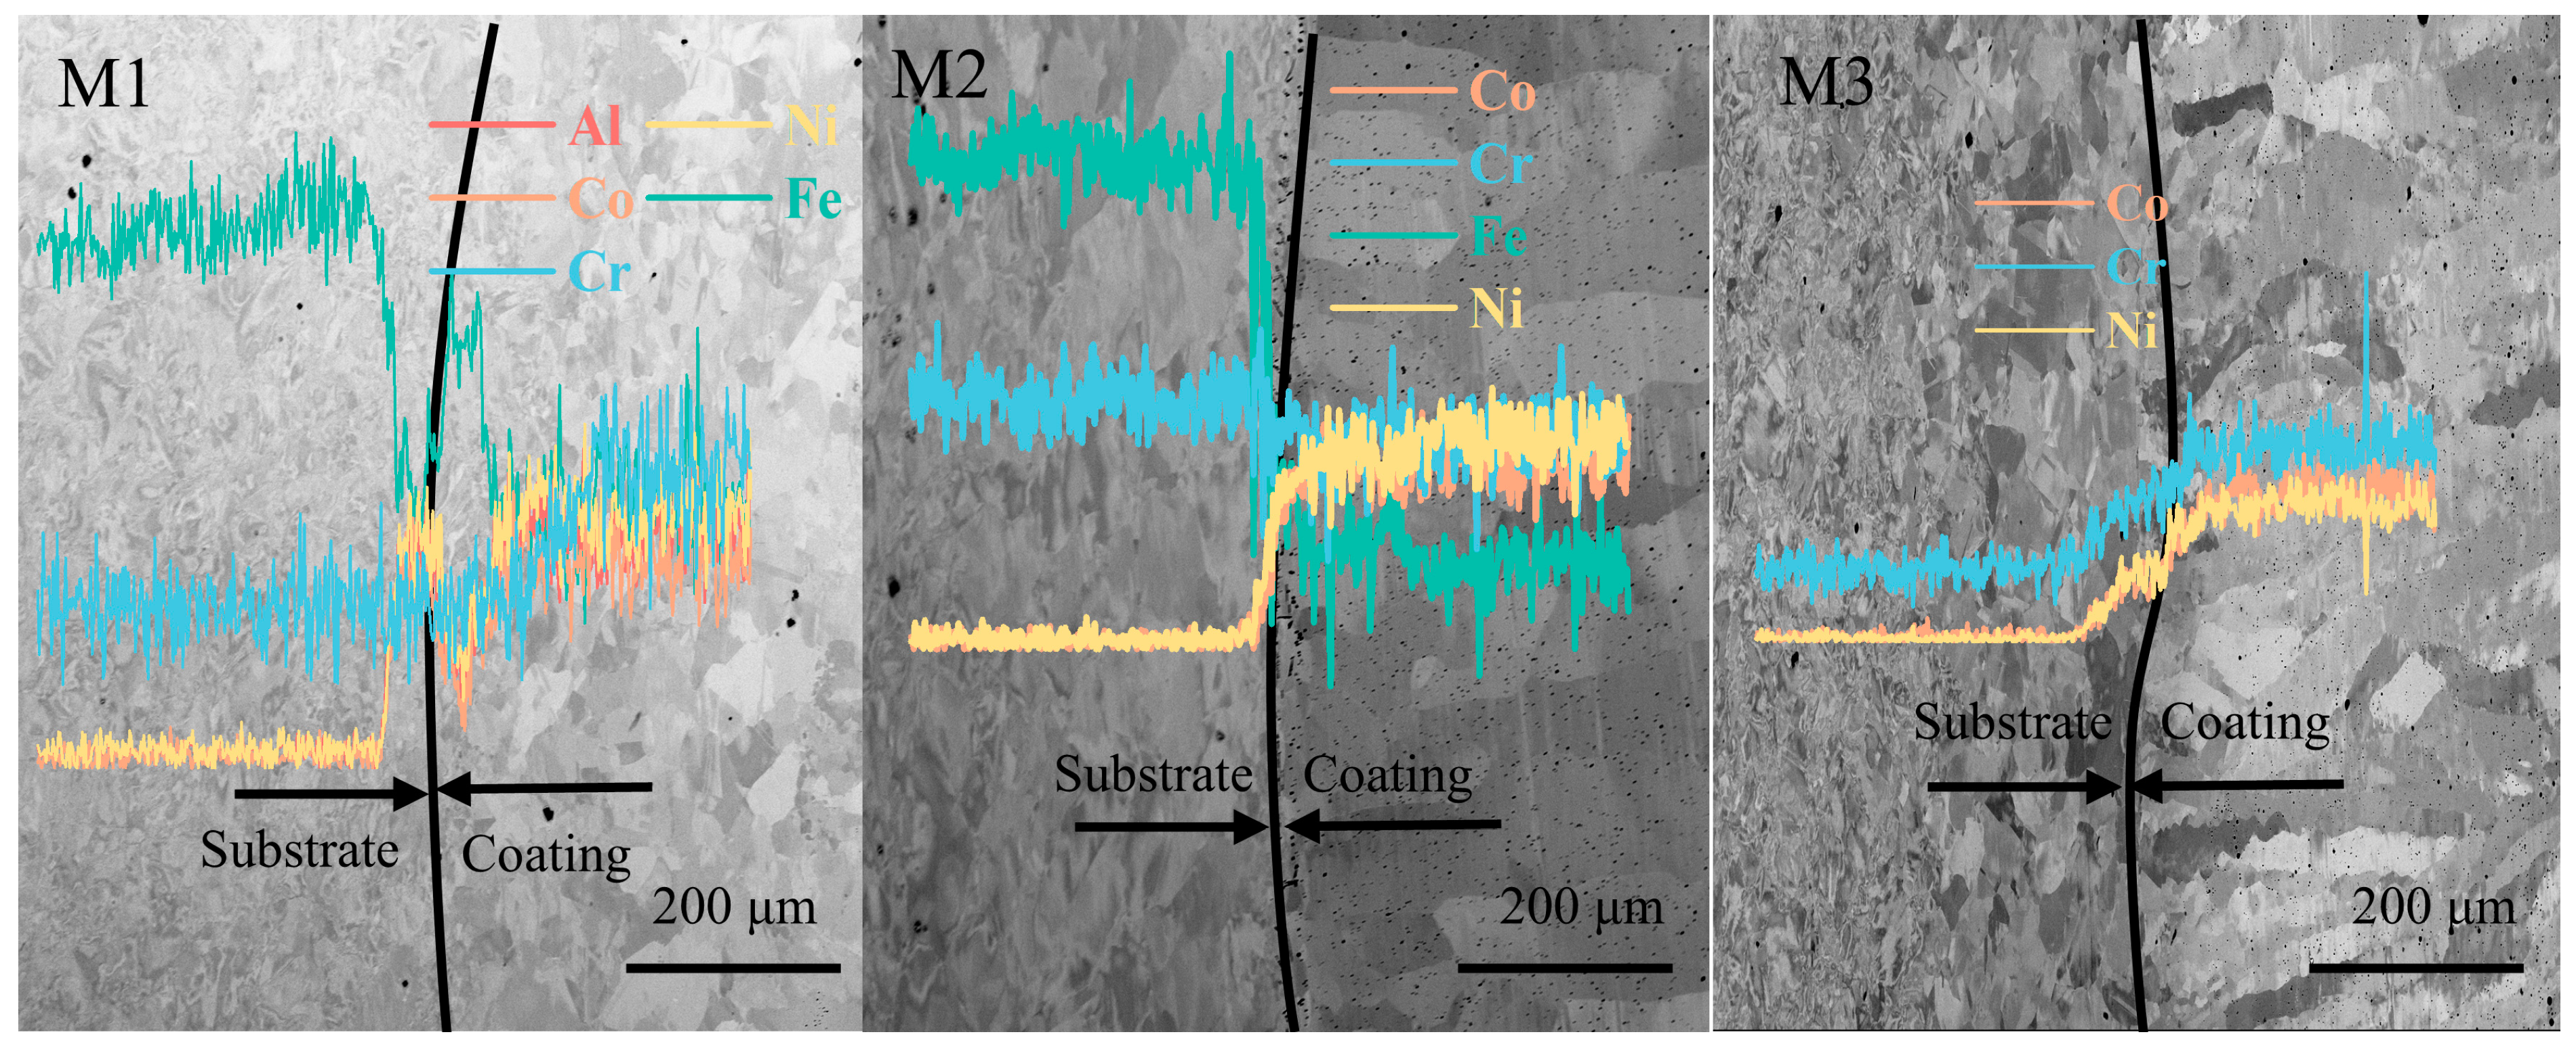
Figure 3 shows the cross-section maps of M1, M2, and M3 coatings using SEM. The three coatings exhibit different morphology appearances, with obvious elongated columnar crystals observed in M2 and M3 but not in M1. However, approximately the same coating thickness is observed, around 440 μm. According to the extensively used classical heat input equation [
23], Equation (1), for LC, the generated heat input K in the melt pool is considered the same when under the same process parameters. Berger and Uporov’s studies [
24,
25] have shown that there is no significant statistical difference in the thermophysical properties of the three alloys, such as thermal conductivity and coefficient of thermal expansion.
where W is the laser power (w),
v is the scanning speed (mm·s
−1), and
d is the laser spot diameter (mm).
In addition, Zhou’s [
26] study reveals that coatings prepared with the same process have the same thickness. Thus, these factors contribute to the approximately identical thickness of coatings M1, M2, and M3.
An element line scan was further used to understand the dissolution of the coating elements. The element line scan results are also attached in
Figure 3. The content of the Fe element shows a significant decreasing trend due to the high proportion of Fe in the substrate (about 64%) and the lower proportion in the coating. For coating M1, the Al, Co, and Ni elements show an upward trend. In addition, the elements in the coating are not completely equal to the nominal due to the dilution of the Cr element in the substrate into the coating, while some of the other elements are burned off during the fusion cladding process. This dilution makes coatings form a good metallurgical bond with the substrate, which does not easily fall off and protects the substrate well.
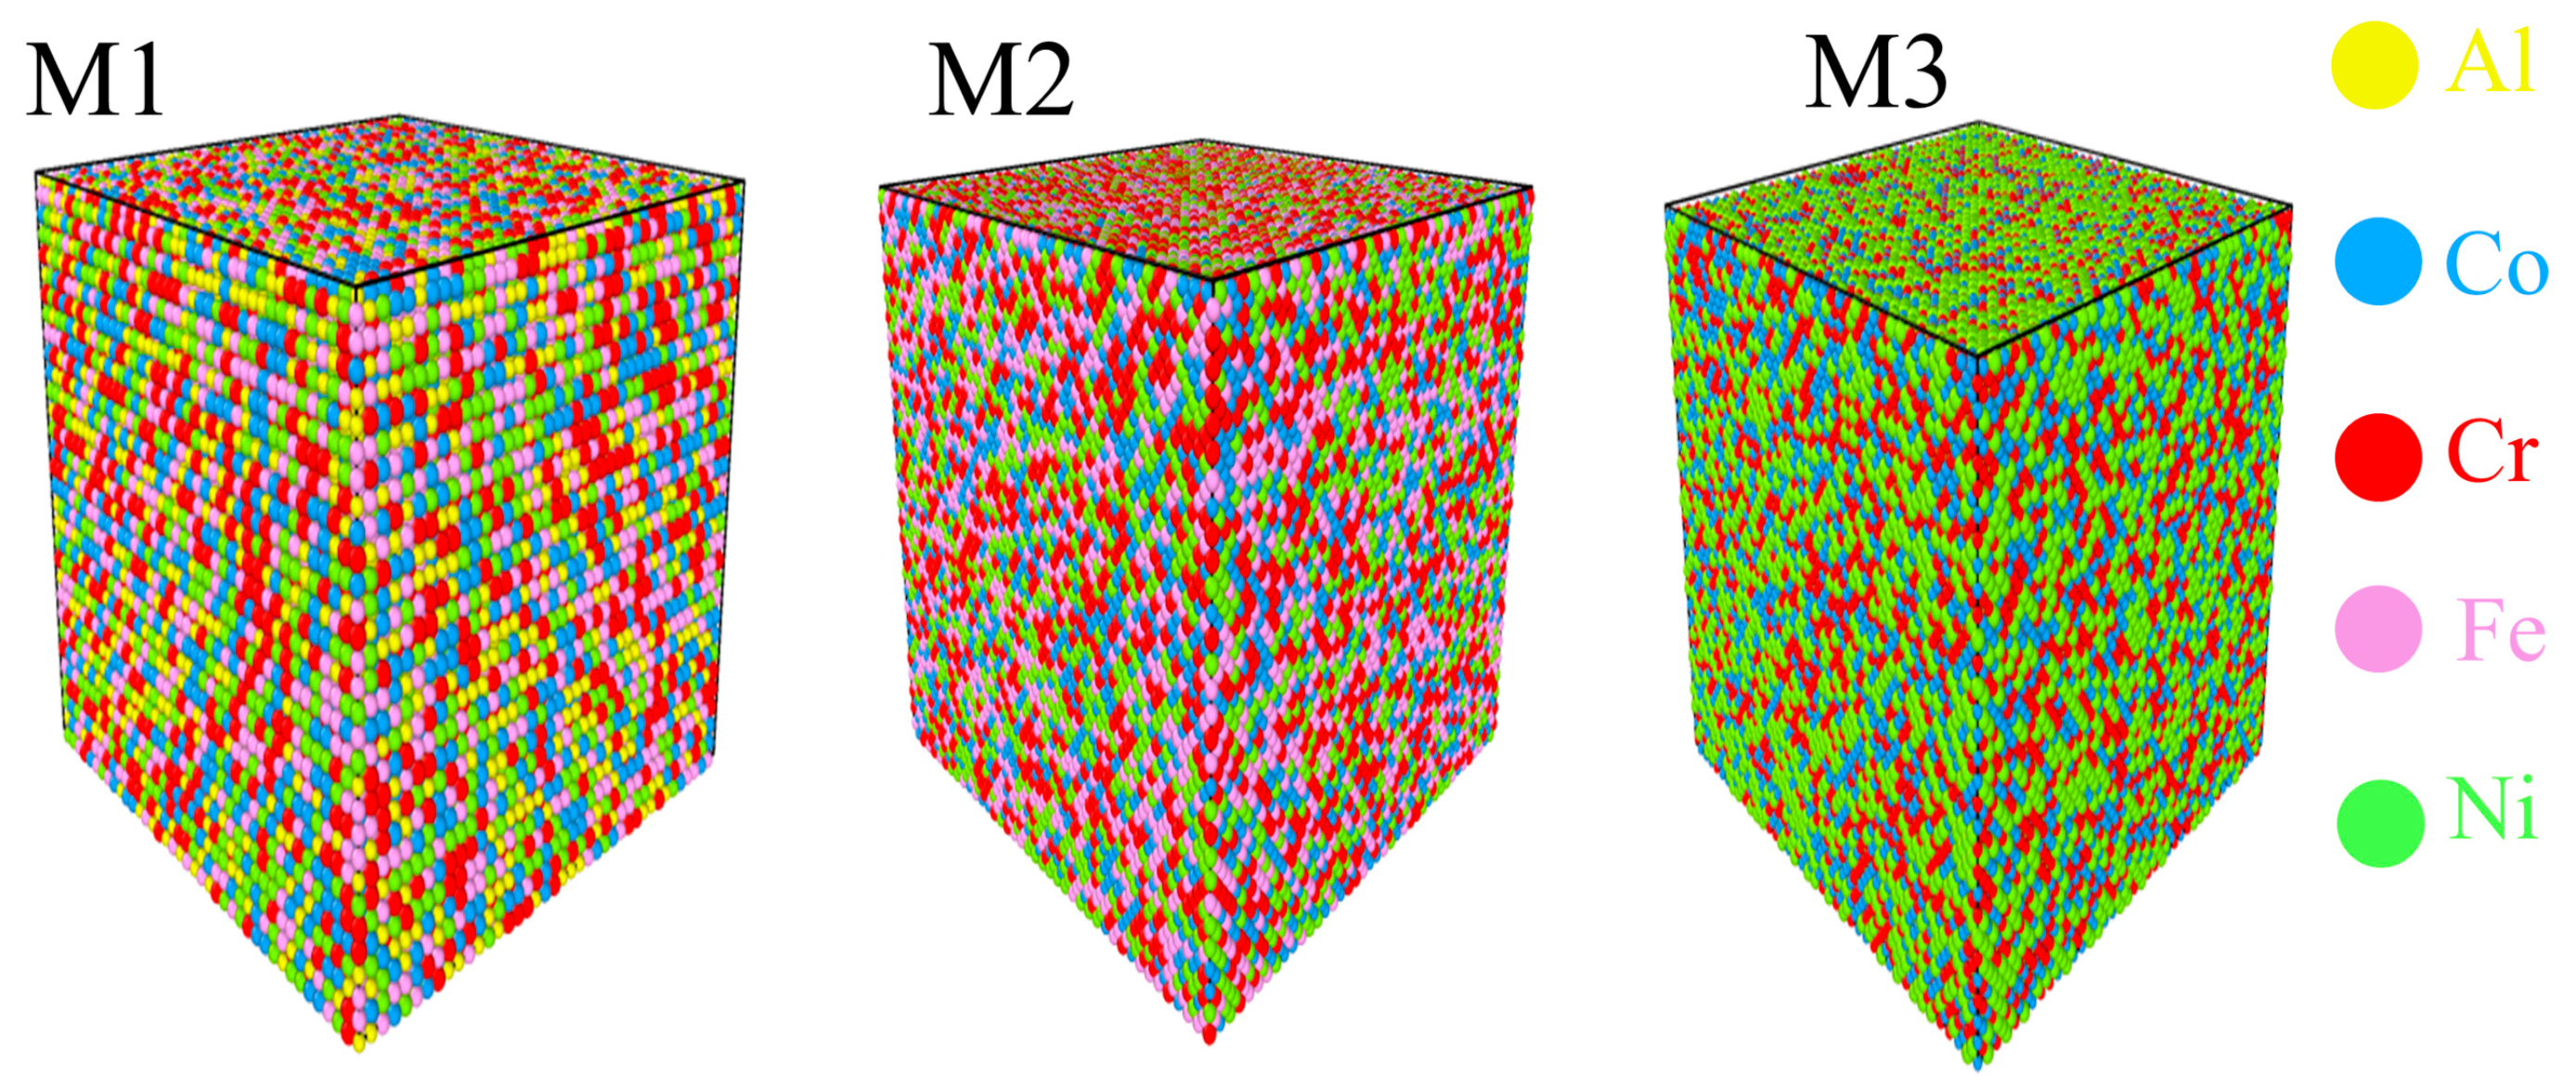
Based on the empirical parameters of the medium-entropy alloys, it is predictable whether a solid solution can be formed, as well as the type of structure of the solid solution. The calculated results of M1, M2, and M3 MEAs are listed in
Table 3, based on Equations (2)–(6) below:
where
is the atomic fraction (at.),
is the atomic radius,
is the valence electrons,
is the average radius,
δ is atomic radius discrepancy, Δ
Smix is mixing entropy, and
is the mixing enthalpy.
Based on the calculation results and comparison with empirical parameters [
27], M2 and M3 MEAs can form a single solid solution in a typical non-equilibrium state, while M1 does not satisfy this condition.
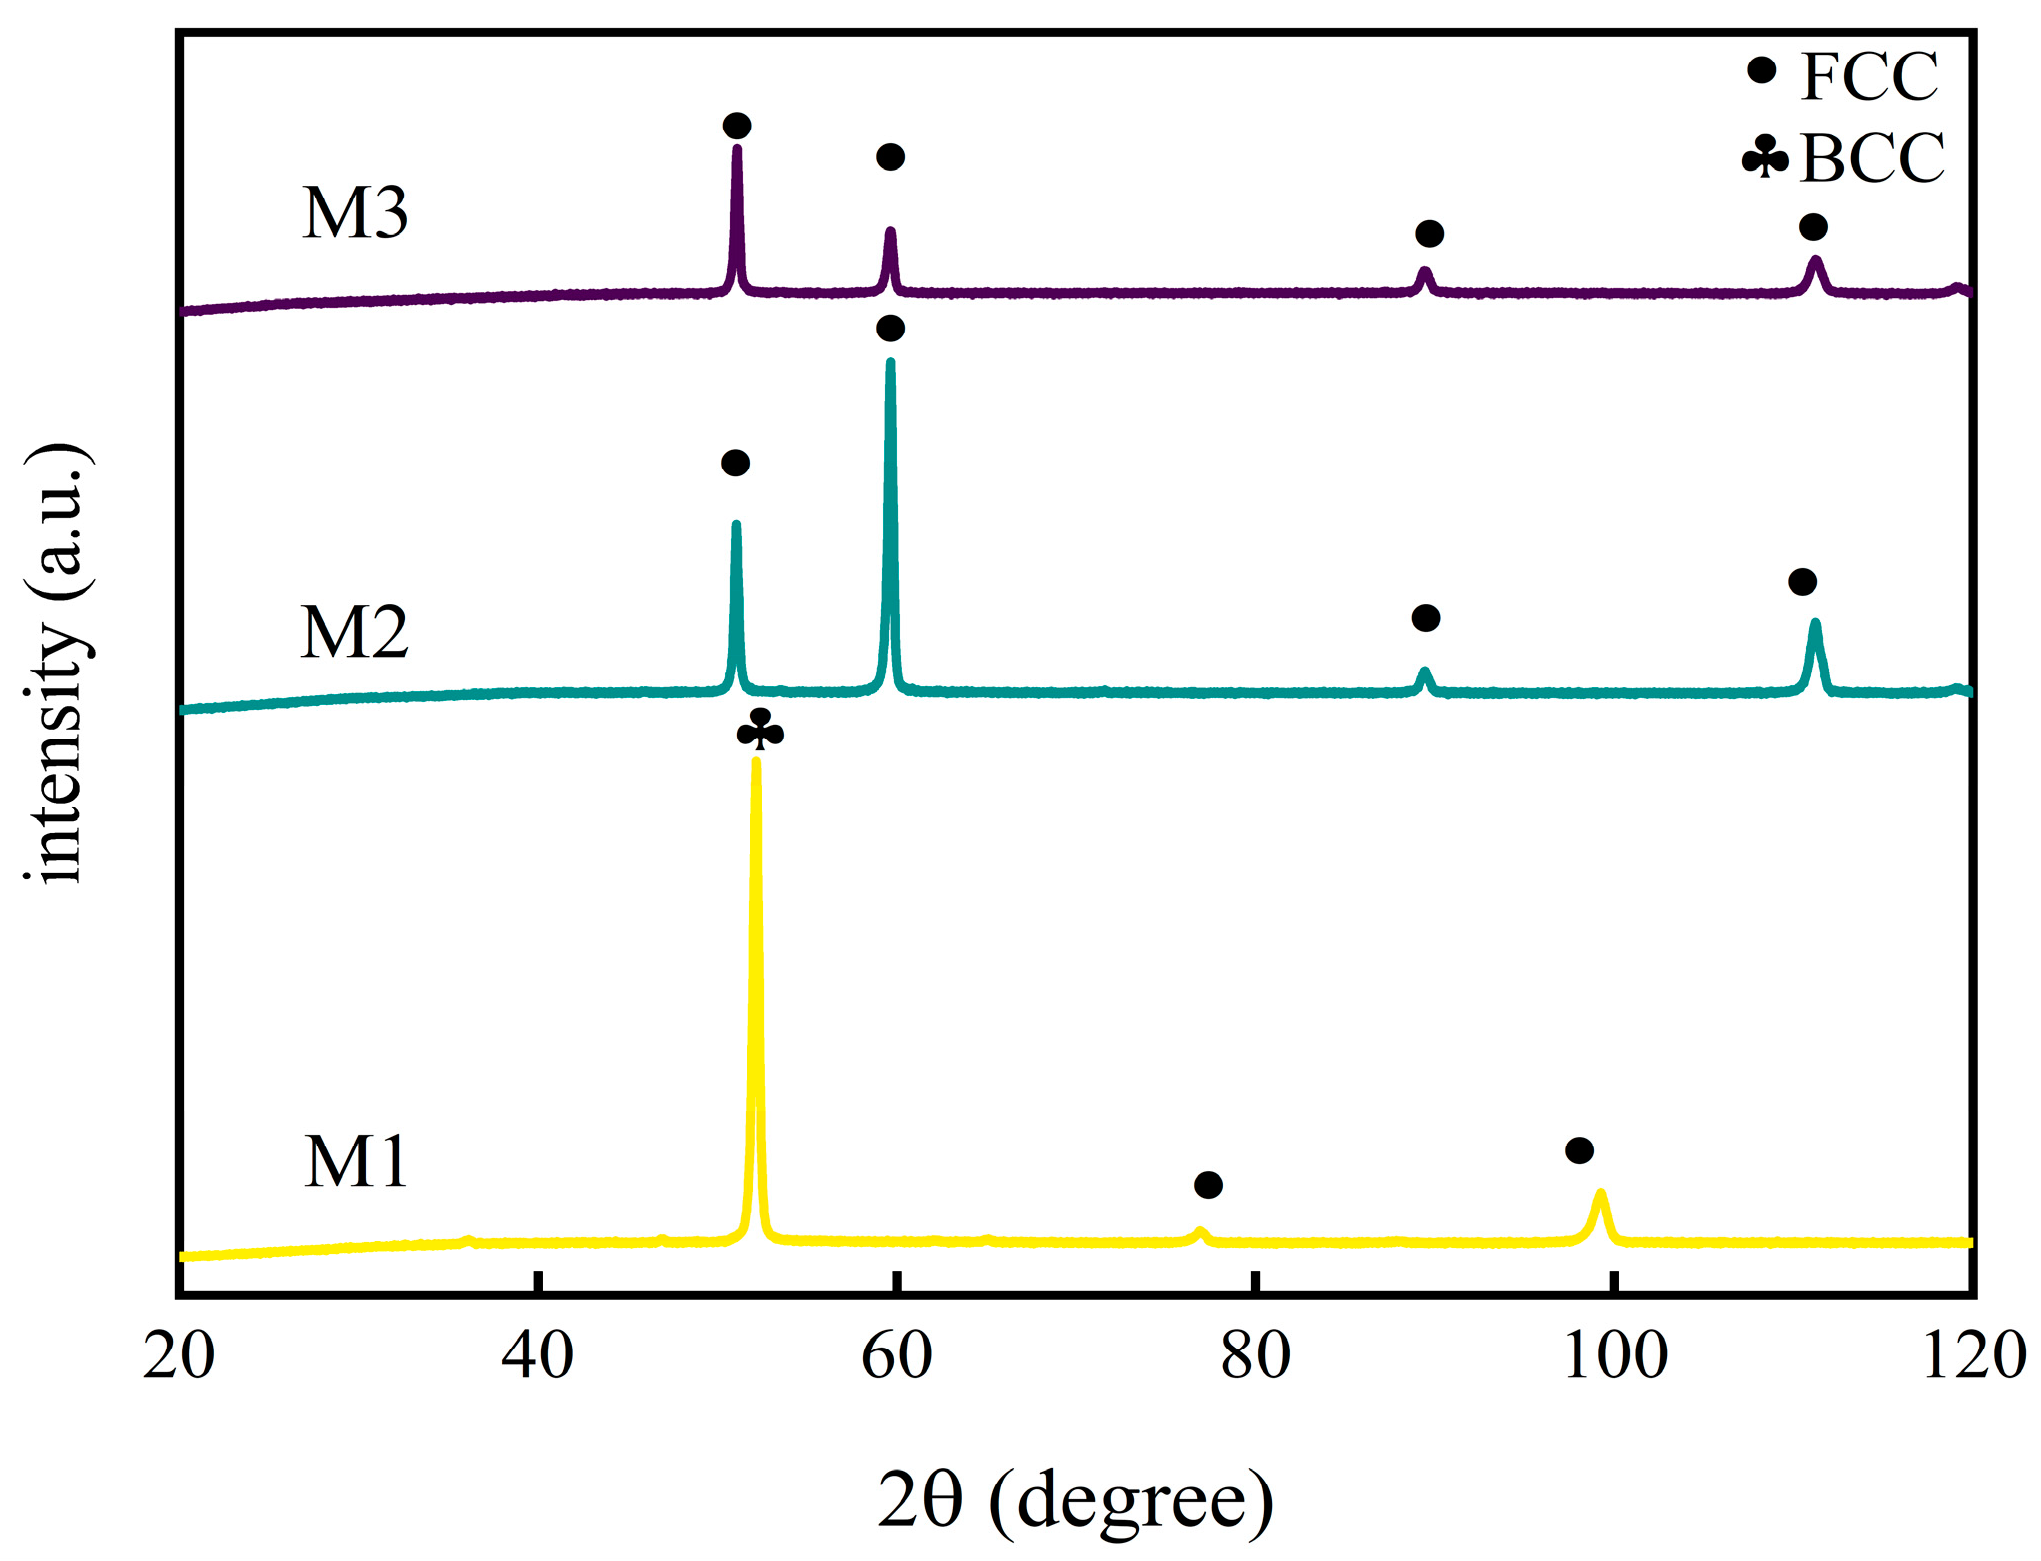
Figure 4 shows the XRD curves of M1, M2, and M3 coatings. The M2 and M3 coatings show approximately the same characteristic peaks of the FCC structure, while M1 shows an FCC structure with some BCC structures, which is consistent with the previous parameter calculations. In addition, the fast cooling rate of the coating surface during LC makes the martensitic transformation easy to realize and promotes the precipitation of the BCC phase structure [
28]. In M1, the BCC phase is an (α-Fe, AlNi)-based solid solution, while the FCC phase is an FeNi-based solid solution. In M2, the coating consists of a single FCC (PDF#47–1417) phase. In M3, the XRD peak is assigned as the (111) peak of FCC CoCrNi (with reference to ICDD 00-033-0945). Lou and Liu et al. [
29] found that when solute atoms of a larger radius entered the solid solution structure, it led to lattice distortion in the solid solution, which would show up as shifted peaks on the XRD peak spectra.
Table 4 shows the atomic radii. Shifts observed in
Figure 4 of the M2 and M3 coatings are inferred to be lattice distortion caused by the dissolution of Fe into the CoCrNi solid solution, and the specific mechanism of the effect will be described below. For M1, new phases are created, which will be discussed later.
3.2. Grain Structure Analysis
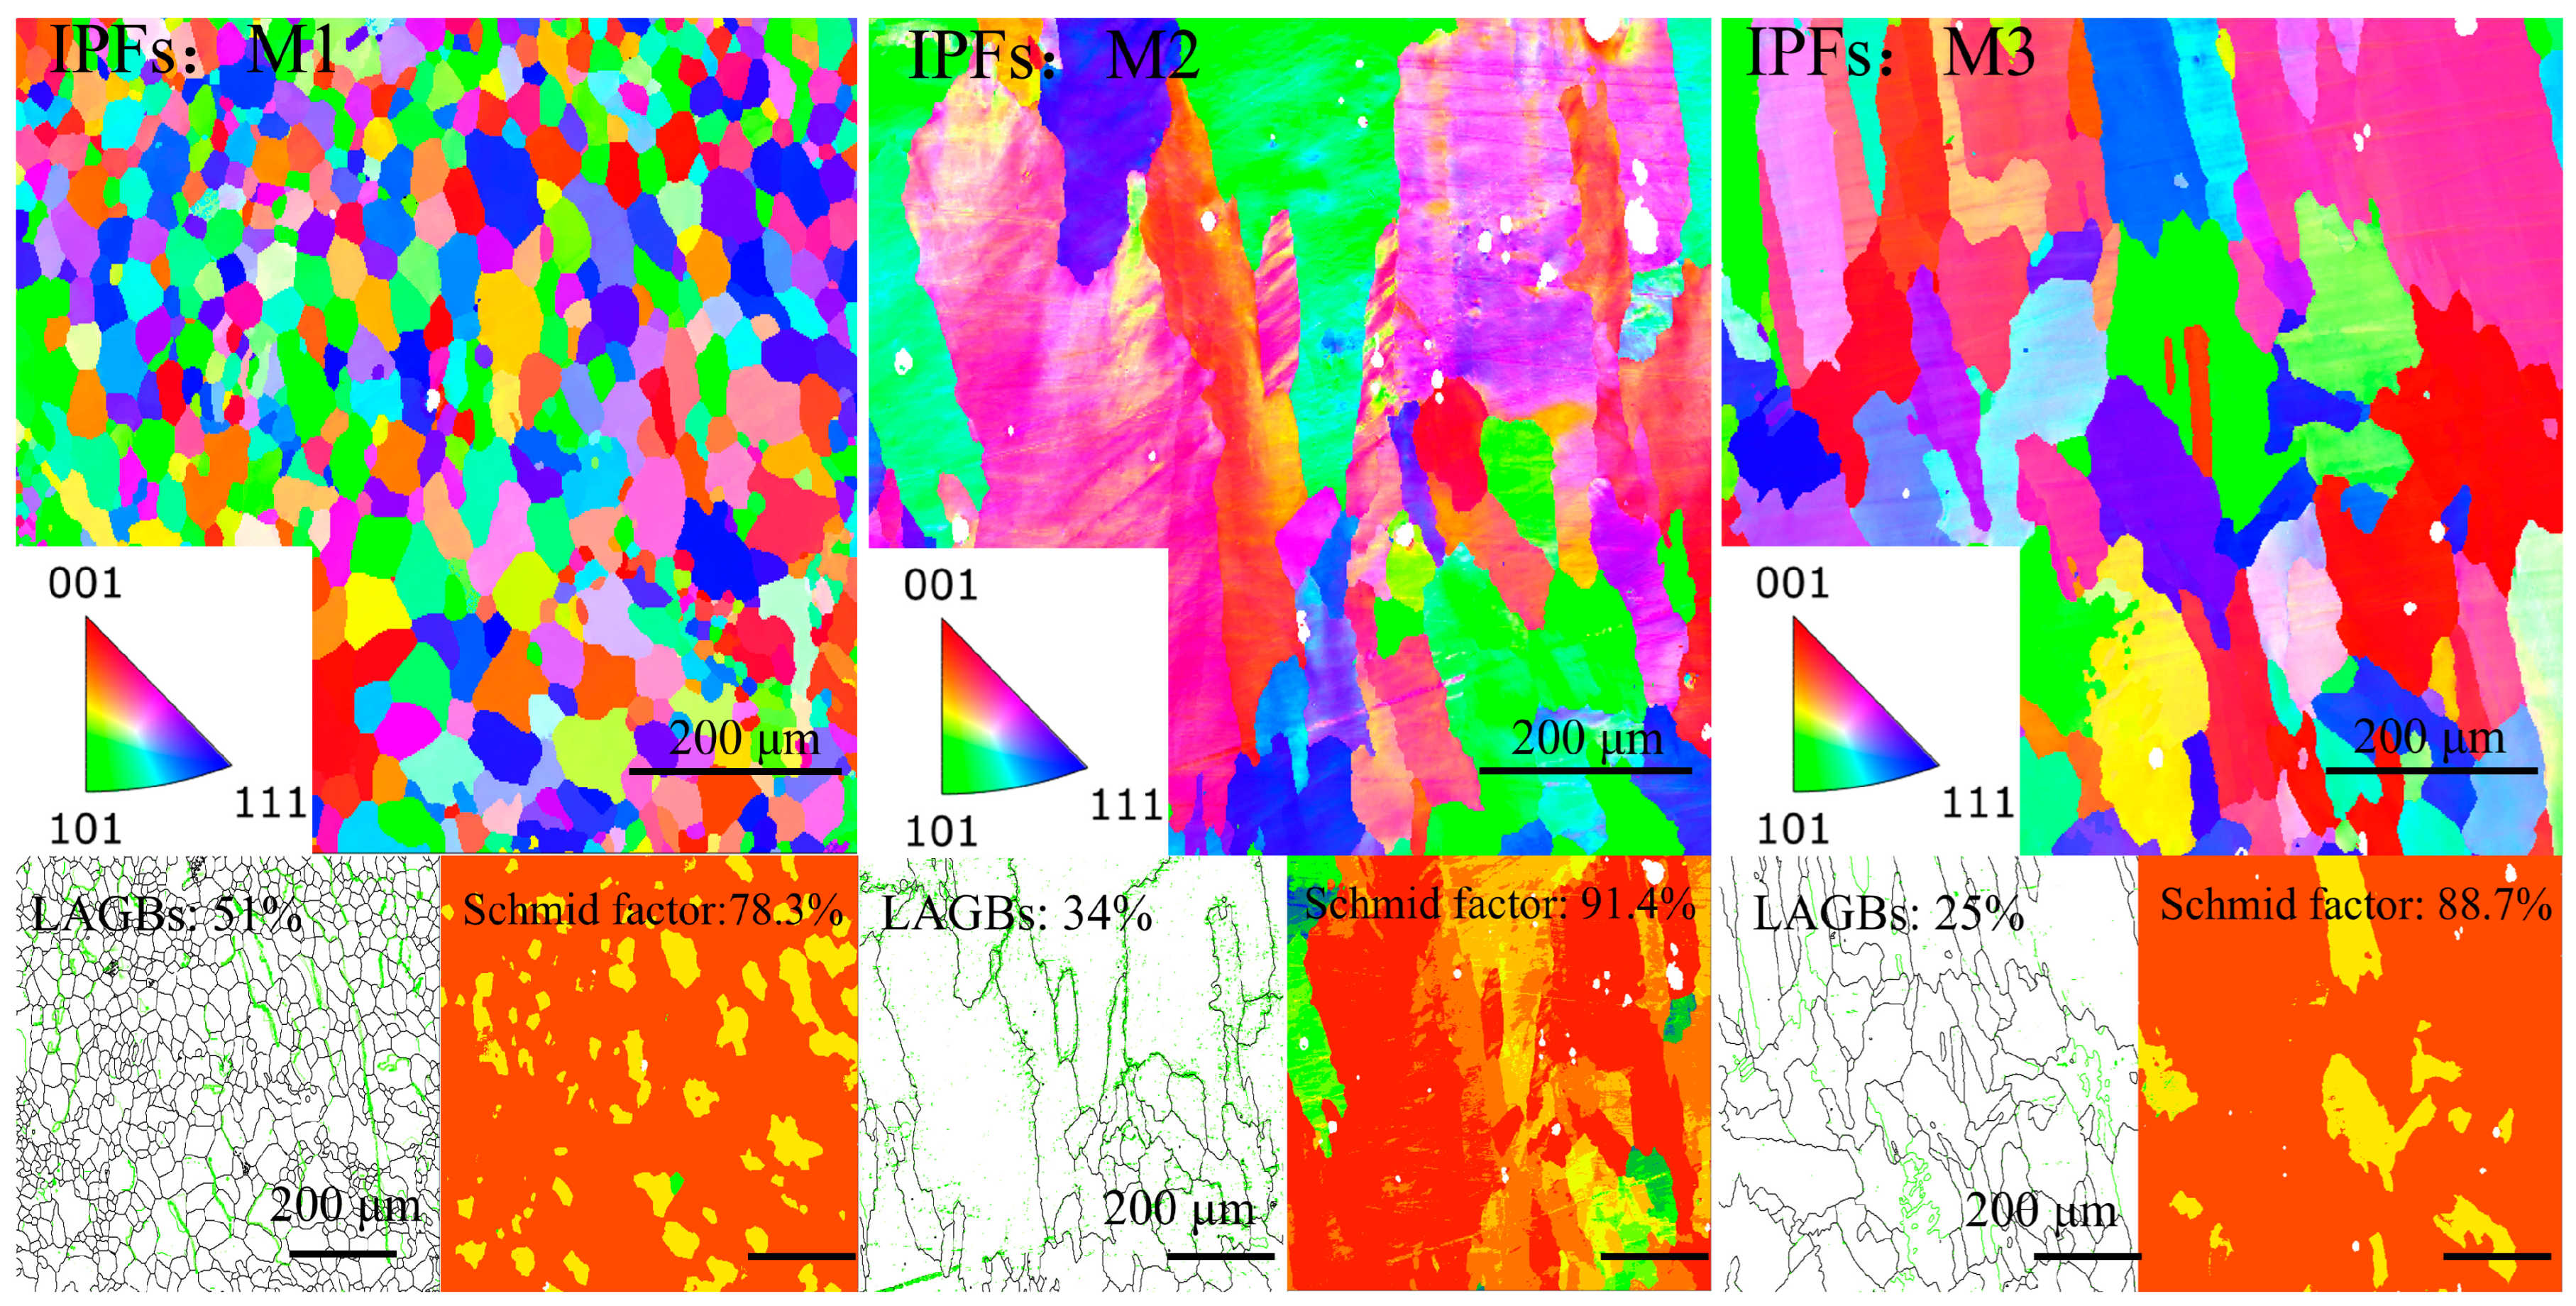
To further study the grain structure of coatings M1, M2, and M3 and its effect on the mechanical properties of coatings, the micrograins were characterized using EBSD.
Figure 5 shows the pictures of coatings M1, M2, and M3 using EBSD characterization. Different grain structures are observed, as shown in the inverse pole figures (IPFs). For M1, the grains do not exhibit significant orientation characteristics. However, for coatings M2 and M3, elongated columnar grains are observed, distinct from the fine equiaxed grains in M1. Moreover, M2 and M3 show a strong orientation in the [001] direction. The grain structures of coatings M2 and M3 are approximately the same, showing a typical FCC structure. This can be explained by the non-equilibrium nucleation density equation [
30] shown in Equation (7) for both coatings. M2 and M3 were fabricated at the same laser power, which means the same heat input and Δ
T, so their nucleation densities were the same. For M1, the grains are different, which will be discussed in the following part.
where
εmax is the nucleation density, Δ
Tσ is the temperature change standard deviation, and Δ
Tε is the subcooling.
EBSD was used to characterize the grain boundary misorientations, displacement density, and Smith factor of coatings M1, M2, and M3. Low-angle grain boundaries (LAGBs) represent large lattice distortions [
31] (the green lines in the map). M1 has the highest LAGBs, almost two times more than M3, as seen in the data attached in
Figure 5. On the basis of the characterization results, the dislocation strength was calculated using Equation (8). The dislocation density of the characterized region (
ρ) of coatings M1, M2, and M3 are 0.92 × 10
14, 0.40 × 10
14, and 0.39 × 10
14 m
−2, respectively.
where
ρave is the core average misorientation of the characterized region (°),
refers to the Burgers vector (nm), and u represents the step size (nm).
Yield strength represents the plastic deformation ability of the materials. The relationship between the critical shear stress
τ and yield strength
θ as well as the Schmid factor can be expressed in Equation (9).
where
SF refers to the value of the Schmid factor coefficient.
Since τ remains constant in certain metals, the smaller the Schmid factor coefficient values, the larger θ, in which case plastic deformation is less likely to occur. As a result, coating M1 is more resistant to plastic deformation compared to the other two coatings. There is also a part of the study wherein Schmid factors represent the percentage of soft particles on the surface of the material. From this aspect, it can also be concluded that coating M1 has lower soft particles and higher hardness compared to the other two coatings.
3.3. Nano-Indentation Test Analysis
The mechanical properties of coatings M1, M2, and M3 were measured using nano-indentation. The hardness (H) and elastic modulus (E) are usually applied to evaluate the plastic deformability of the material under test [
32]. Specifically, the magnitude of a material’s modulus of elasticity relates to the ease with which the material undergoes elastic deformation.
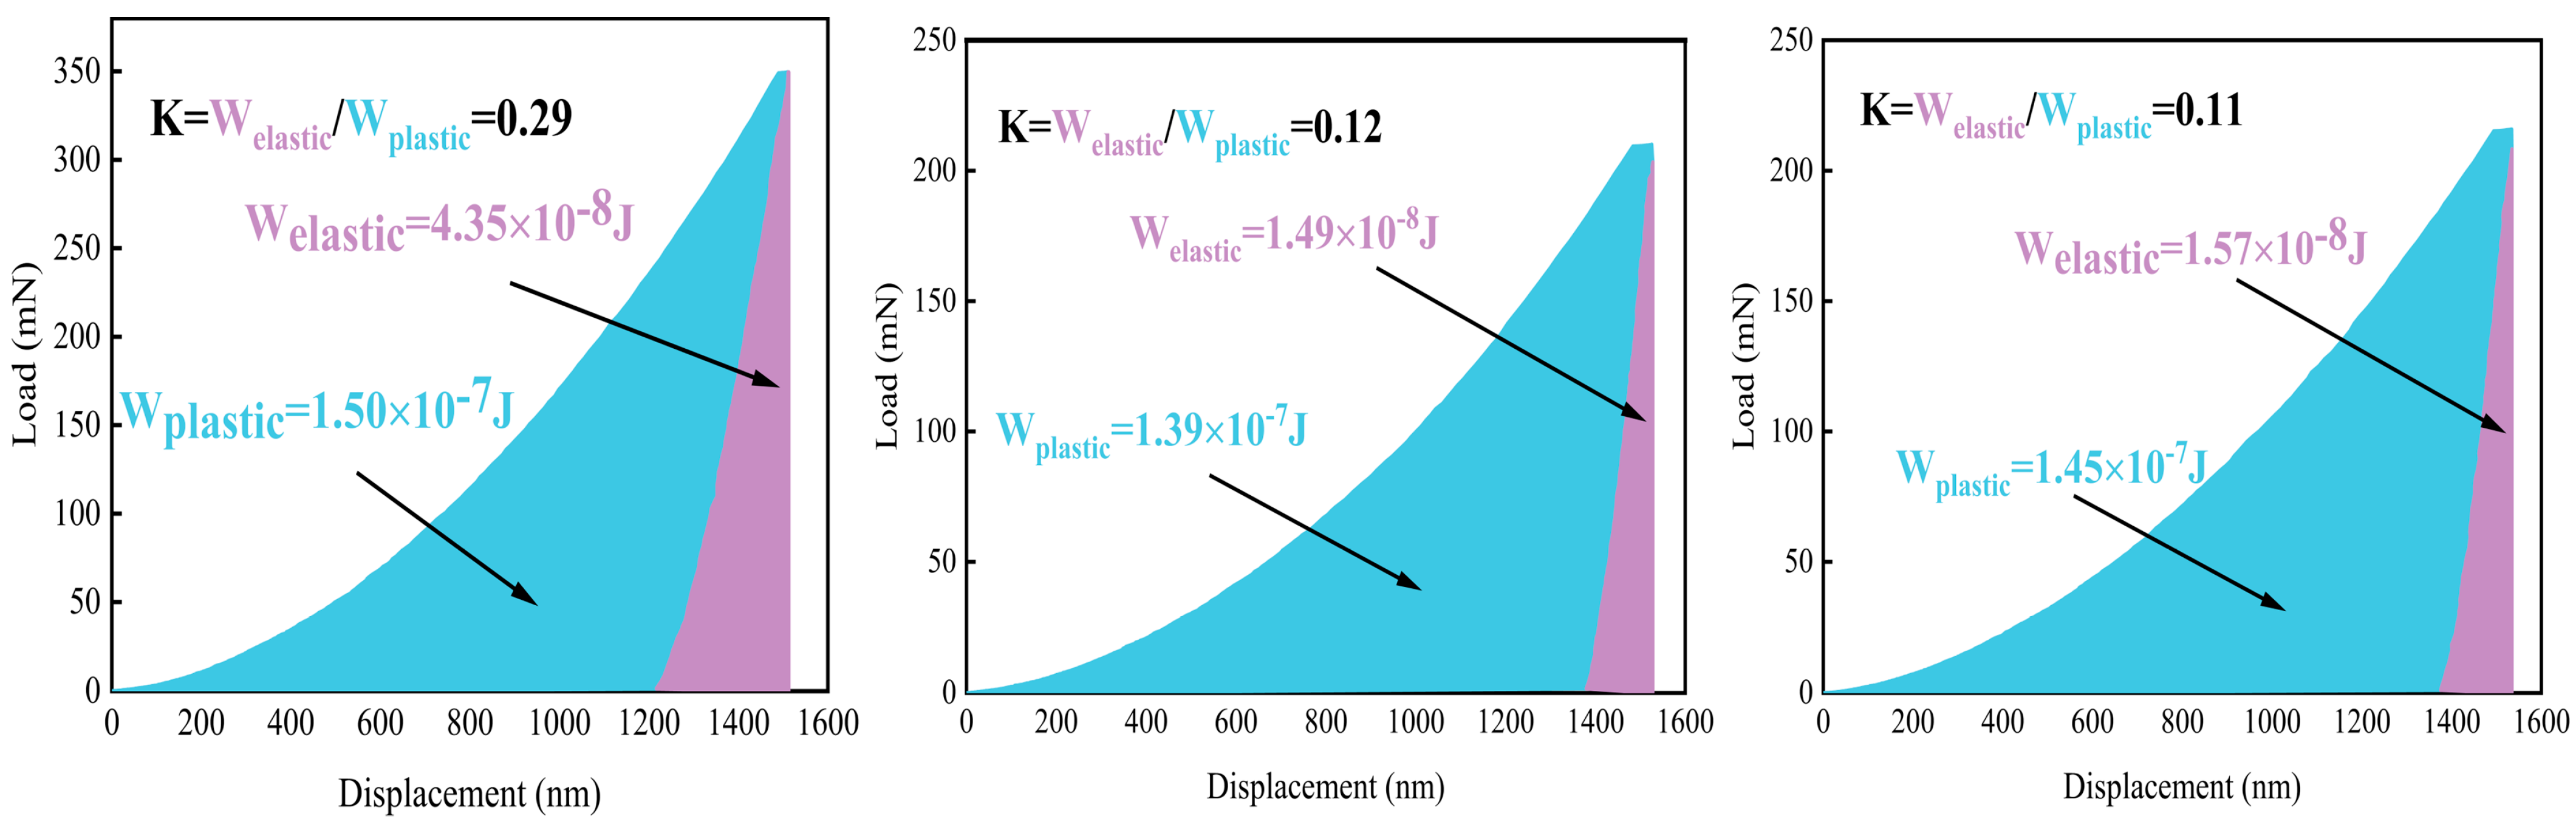
Figure 6 shows the data curves using Oliver and Pharr’s method [
33]. The integral area between the loading curve and the x-axis is the total work (W
total), and the integral area of the unloading curve and the x-axis is the elastic deformation work (W
elastic). Consequently, the integral area between the loading and unloading curves is the plastic deformation work (W
plastic). The formulas for all three are listed as Equations (10)–(12):
where
i is the indentation depth (nm),
Fa is the load force (N), r is the residual indentation depth (nm), and
Fu is the unloading force (N). The ratio of W
elastic and W
plastic, called the K value, represents the capacity when subject to certain loads.
Based on the values recorded in real-time from the tests, calculations were performed to study the three coatings’ H/E* and H
3/E*
2, as listed in
Table 5, where H is the ratio of nano-hardness, E*is the effective modulus of elasticity, the value of H/E* indicates wear resistance, and H
3/E*
2 is the deformation resistance. It is clear from the data that coating M1 has higher values than coatings M2 and M3, indicating that it has optimal wear and plastic deformation resistance, which further supports the results of the analysis on the Smith factor coefficient. In addition, it can be intuitively seen that the addition of Al increases the H and E*values, but the addition of Fe is less pronounced than Al.
3.4. CALPHAD and MD Simulation Analysis
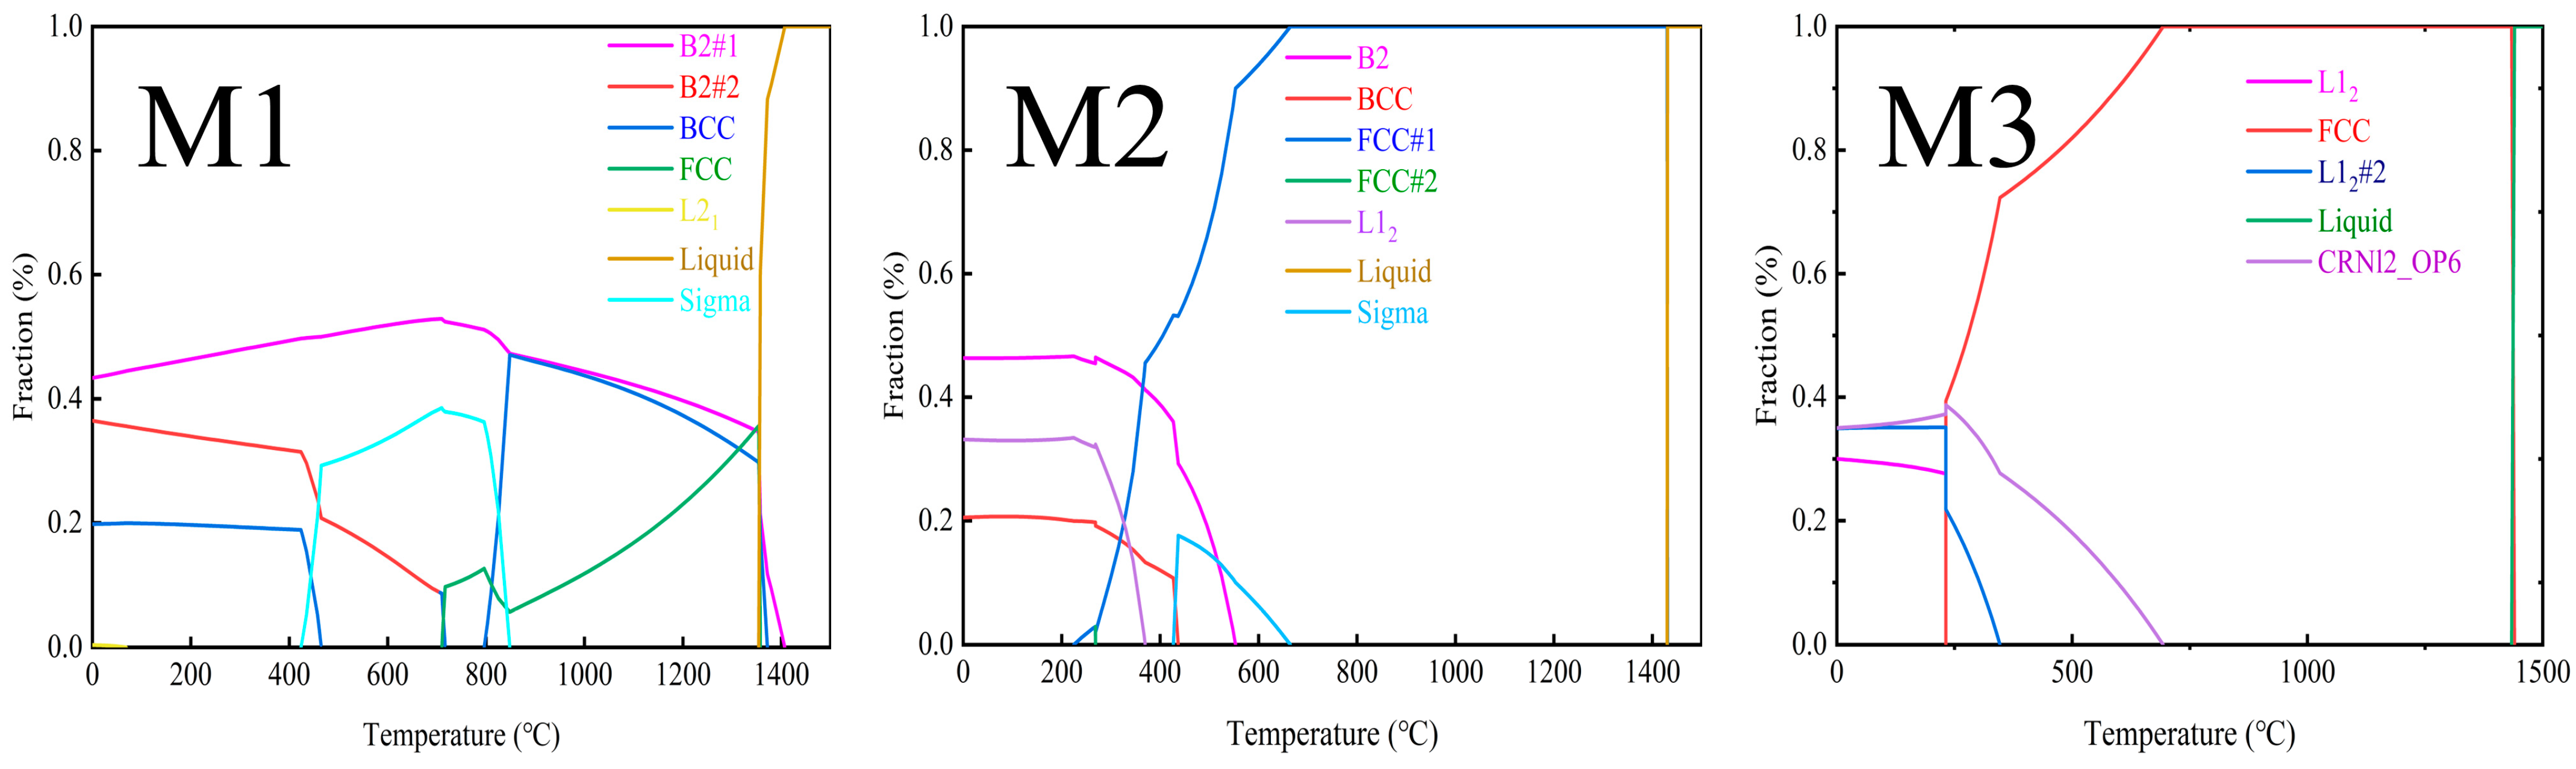
The CALPHAD helps understand alloys’ compositional changes as a temperature function [
34,
35,
36]. To understand the phase composition of the MEAs in-depth, especially the variation of their phase compositions with temperature, the CALPHAD phase diagrams of M1, M2, and M3 MEAs are carried out, as shown in
Figure 7. Both M1 and M2 are close in melting points (about 1400 °C). The B2 phase (40%) is the major phase at the range of 0–20 °C. However, in the XRD results, B2 phases (ordered body-centered cubic structure) are not detected due to the Fe element in the substrate entering the coating. For M3, L1
2 phases (ordered face-centered cubic structure) are the main phase, consistent with the XRD results in
Figure 4.
In conjunction with the CALPHAD, we further modeled the melt temperatures as well as the supercooling of CoCrFeNi and AlCoCrFeNi systems at approximate equilibrium solidification conditions. It is thus derived that the T
N of CoCrFeNi and AlCoCrFeNi is 62.1 and 9.1 °C, using Equations (13) and (14):
where ΔT
N is the nucleation supercooling, ΔT
MAX is the max nucleation supercooling, T
EQ is the liquid-phase line temperature, T
N is the nucleation start temperature, and T
RE is the re-glow start temperature. Zhang et al. [
37] concluded that alloys with higher alloy-growth limiting factors (Q) could form a larger compositional supercooling region at a faster rate at the solid/liquid (S/L) interface front, thereby refining the solidification organization.
The TN of AlCoCrFeNi MEA is smaller, so the energy required for nucleation is lower, the nucleation rate increases, and more nuclei can be formed; therefore, the grain size is the smallest. This is in agreement with the EBSD results.
MD simulations give a good insight into the microscopic mechanisms of the atomic composition of medium-entropy alloys. Xu et al. [
38] investigated the microstructure of high-entropy alloys at different temperatures using molecular dynamics methods to determine their effect on atomic size differences. Thus, the AlCoCrFeNi and CoCrFeNi MEA systems were built, in which the lattice parameters and atomic-force model are in reference to Mayahi’s [
39] and Deluigi’s [
40] simulations, respectively.
Table 6 shows the Voronoi volumes of AlCoCrFeNi and CoCrFeNi MEAs at 298 K. The Voronoi volume is the nearest neighborhood space of atoms, which incorporates the effects of interatomic forces, and it is used to represent differences in the size of atoms, which is more accurate than a direct comparison of the size of atomic radii [
41]. Liu et al. [
42] concluded in their simulation results of the CoCrFeMnNi system that the Mn element has a larger Voronoi volume, which leads to more severe local lattice distortion than other elements, resulting in the maximum local stress around the Mn element. In AlCoCrFeNi MEA, Al and Cr have the largest Voronoi volumes, while in CoCrFeNi MEA, they are Cr and Fe.
To understand the lattice distortion in more detail, we introduce the method of mean–square atomic displacements (MASD), i.e., the ideal atomic arrangement of a medium-entropy alloy is obtained after multiple relaxations (pressure 0 Mpa, temperature 0 k) and compared with the positions of the atom in the undisturbed lattice to derive their mean–square atomic displacements (MASD). The calculation method is shown in Equation (15):
where
N is the total number of certain atoms in the system, and
and
are the relaxed and ideal atomic coordinates of the
ith atom, respectively.
Table 7 shows the results. Comparing Co, Cr, and Ni, it can be deduced that the values of MASD are not necessarily related to the radius of the atom but rather to the structure in which the atom is located. δ is usually considered to be the elemental average lattice distortion, but the MASD values for M2 and M3 are not at all consistent with the δ, as shown in
Table 3. Y. Tong et al. [
42] in their study using synchrotron radiation, tested the localized lattice distortions of CoCrNi and CoCrFeNi attributed to their formation of short-range ordered structures rather than to atomic size differences. In addition, the MSAD value can predict the changing trend of yield strength of the medium entropy alloy, which will be the basis for further research in the future.


