1. Introduction
Copper (Cu) has good thermal conductivity, electrical conductivity, ductility, and corrosion resistance, and is easy to manufacture. It has widespread applications in various fields, including switch components, heat sink/cooling elements, wires, and more [
1,
2]. High hardness and good compressive strength are crucial for electrical contacts to resist deformation and wear, withstand frequent mechanical switching and arc erosion, and maintain dimensional stability and contact reliability. Excellent tensile strength combined with adequate ductility is equally critical for heat sinks and plasma-facing components, as this mechanical balance prevents brittle fracture under thermomechanical cycling and mechanical loads, thereby ensuring long-term operational safety and device longevity. However, the utility of pure Cu has been significantly constrained in demanding industrial applications, due to its relatively low hardness (typically 40–100 HV), moderate tensile strength (200–300 MPa), and poor wear resistance. The prevailing methodology in existing studies involves of metal or ceramic nano-additives to simultaneously improve Cu’s hardness, strength, and wear resistance. These additives enhance the material’s mechanical strength and wear resistance [
3]. As demonstrated by Chenna Krishna et al. [
4,
5], the multi-pass rolling of the Cu-3Ag-0.5Zr alloy at temperatures between 500 and 800 °C yielded sheets with high strength but significantly reduced ductility. Zhai et al. [
6,
7] fabricated Cu matrix composites with different TiC contents using powder metallurgy and investigated their property evolution during sintering at 900 °C. The results demonstrated that the composite containing 10 wt% TiC exhibited the most balanced performance, achieving a relative density of 90.07% and a hardness of 128 HV. Although further increasing the TiC content enhanced the yield strength, it also led to elevated brittleness due to the increased population of weak interfaces. As a hard but reasonably ductile transition metal, molybdenum (Mo) possesses both a high elastic modulus and an extremely high melting point (2620 °C), contributing to improved toughness and hardness in ductile materials. For example, in the work of Szczygieł et al. [
8,
9], the incorporation of Mo positively influenced Zn-Ni- and Zn-Co-coating characteristics by improving hardness, wear, and corrosion resistance. Ruzic et al. [
10] investigated Mo segregation influences on the Ti-12%Mo alloy’s mechanical characteristics using a nanoindentation technique. The results demonstrated that areas with elevated Mo concentrations displayed reduced hardness and elastic modulus. Cu-Mo composite is a typical immiscible binary alloy. It is difficult to form compounds or solid solutions between Cu and Mo phases [
11,
12,
13]. This material achieves a synergistic combination of the respective property advantages of Cu and Mo, resulting in good tensile strength and Vickers hardness [
14,
15]. Consequently, it has extensive applications in electrical contact materials, thermal management (sweating) materials, and structural materials [
16,
17].
Present research on Cu-Mo composite predominantly concentrates on high-Mo/low-Cu compositional systems, where Mo constitutes the primary phase. For example, Liu et al. [
18,
19] obtained a Mo-Cu composite with high hardness by a thermo-dynamic coupling method. The studies on high-Cu/low-Mo Cu-Mo composite are few. Hernández et al. [
20] employed high-energy ball milling to synthesize Cu-10% Mo alloy, resulting in superior corrosion resistance relative to pure Cu. Sap et al. [
21,
22] developed a Cu matrix composite with Co/Mo acting as reinforcing phases, which improved the wear and tensile properties.
Due to their fundamental property differences—including a 1535 °C melting point gap (Cu: 1085 °C vs. Mo: 2620 °C) and significant electronegativity difference—Cu and Mo exhibit extremely limited mutual solubility (<0.1 at% at room temperature) and poor interfacial bonding characteristics. At present, the mechanical alloying method [
23,
24,
25] is commonly used to prepare composite materials with different melting points. Powder metallurgy [
26,
27] is mainly divided into three parts: powder preparation, powder pressing, and powder sintering. The fabrication methodology employed for different parts critically influences the ultimate properties of Cu-Mo composite, with variations in processing parameters directly affecting microstructure development and final performance characteristics. In this experiment, the mechanical alloying method was used to prepare the powder, and the metal powder was forced to mix and refine in the solid state by grinding balls to form composite powder. The sintering process parameters exert a predominant influence on the final material properties, with temperature, pressure, and duration directly determining the composite’s density, interfacial bonding quality, and mechanical performance. The infiltration method [
28] represents a well-established forming technique particularly effective for fabricating Cu-Mo composite containing high Mo fractions (typically >30 vol%), enabling uniform matrix penetration while maintaining structural integrity. However, for the Cu-Mo composite with less Mo content, since Mo particles are too dispersed to form a connected Mo framework, the infiltration method cannot be used. Compared with the traditional sintering process, SPS [
29,
30] has the advantages of short sintering time, low sintering temperature, and high density.
In this study, Cu–Mo composites with a gradient of Mo contents were fabricated by SPS. For powder metallurgy-processed metal matrix composites, strengthening typically arises from the synergistic interaction of multiple mechanisms, including grain boundary strengthening, dislocation strengthening, and grain refinement strengthening. A thorough understanding of these mechanisms and their quantitative contributions is essential for the rational design of such advanced materials. It is challenging for conventional forming processes to achieve a combination of high density and excellent performance in such material systems, particularly under high Cu content conditions. Mo and tungsten share similar physical characteristics, allowing for the leveraging of existing research on Cu-W composites: While melt infiltration is widely used for fabricating high-W-content Cu-W materials, its applicability becomes limited under high-Cu-content conditions due to the difficulty in forming a continuous tungsten skeleton [
31]. Although high-temperature liquid-phase sintering can be employed to fabricate Cu matrix composites with high Cu content, the process itself suffers from significant limitations—namely, high sintering temperatures and prolonged holding times, which tend to cause grain coarsening and insufficient densification, consequently failing to meet the requirements for high-performance applications [
32]. Compared to conventional processes, SPS technology enables rapid powder densification through instantaneous high temperature and pressure, which effectively suppresses grain growth while eliminating reliance on a high-melting-point skeleton, thereby providing an efficient and reliable solution for fabricating high-performance Cu–Mo composites [
33]. Their microstructures were characterized by using a suite of analytical techniques. They systematically examined the variation in properties and microstructure of Cu-Mo composite with Mo content. From a microstructure–property relationship perspective, the strengthening mechanisms by which Mo modulates Cu matrix were elucidated, revealing the fundamental role of Mo content in determining the mechanical performance of the composite.
The developed Cu–Mo composites, especially the Cu–15wt.%Mo composition, exhibit a set of superior properties that make them compelling candidates for high-performance applications like power electronics and thermal management systems. In high-power electrical contact applications, materials are required to possess high hardness and high strength to withstand frequent arcing and mechanical stress. The Cu–15wt.%Mo composite developed in this study demonstrates remarkable performance in this regard, exhibiting a hardness of 135 HV and a tensile strength of 371 MPa, which substantially exceed those of pure copper (77 HV and 220 MPa, respectively). The superior mechanical properties ensure excellent resistance to plastic deformation, arc erosion, and contact welding under extreme service conditions, thereby guaranteeing long-term operational stability and extended service life for electrical contact systems. Secondly, in high-power electronic devices, heat sink components must exhibit not only high thermal conductivity but also sufficient tensile strength and ductility to withstand assembly-induced mechanical stresses and long-term thermal cycling fatigue. The Cu–15wt.%Mo composite developed in this work maintains high thermal conductivity while demonstrating superior strength–ductility synergy compared to conventionally processed Mo-Cu materials. This balanced property profile effectively suppresses premature failure induced by brittle fracture, thereby providing a material foundation for designing highly reliable thermal management systems with extended service life. This work provides a valuable reference for developing high-strength, high-density Cu-based composites.
3. Results and Discussion
As observed in the micrographs of
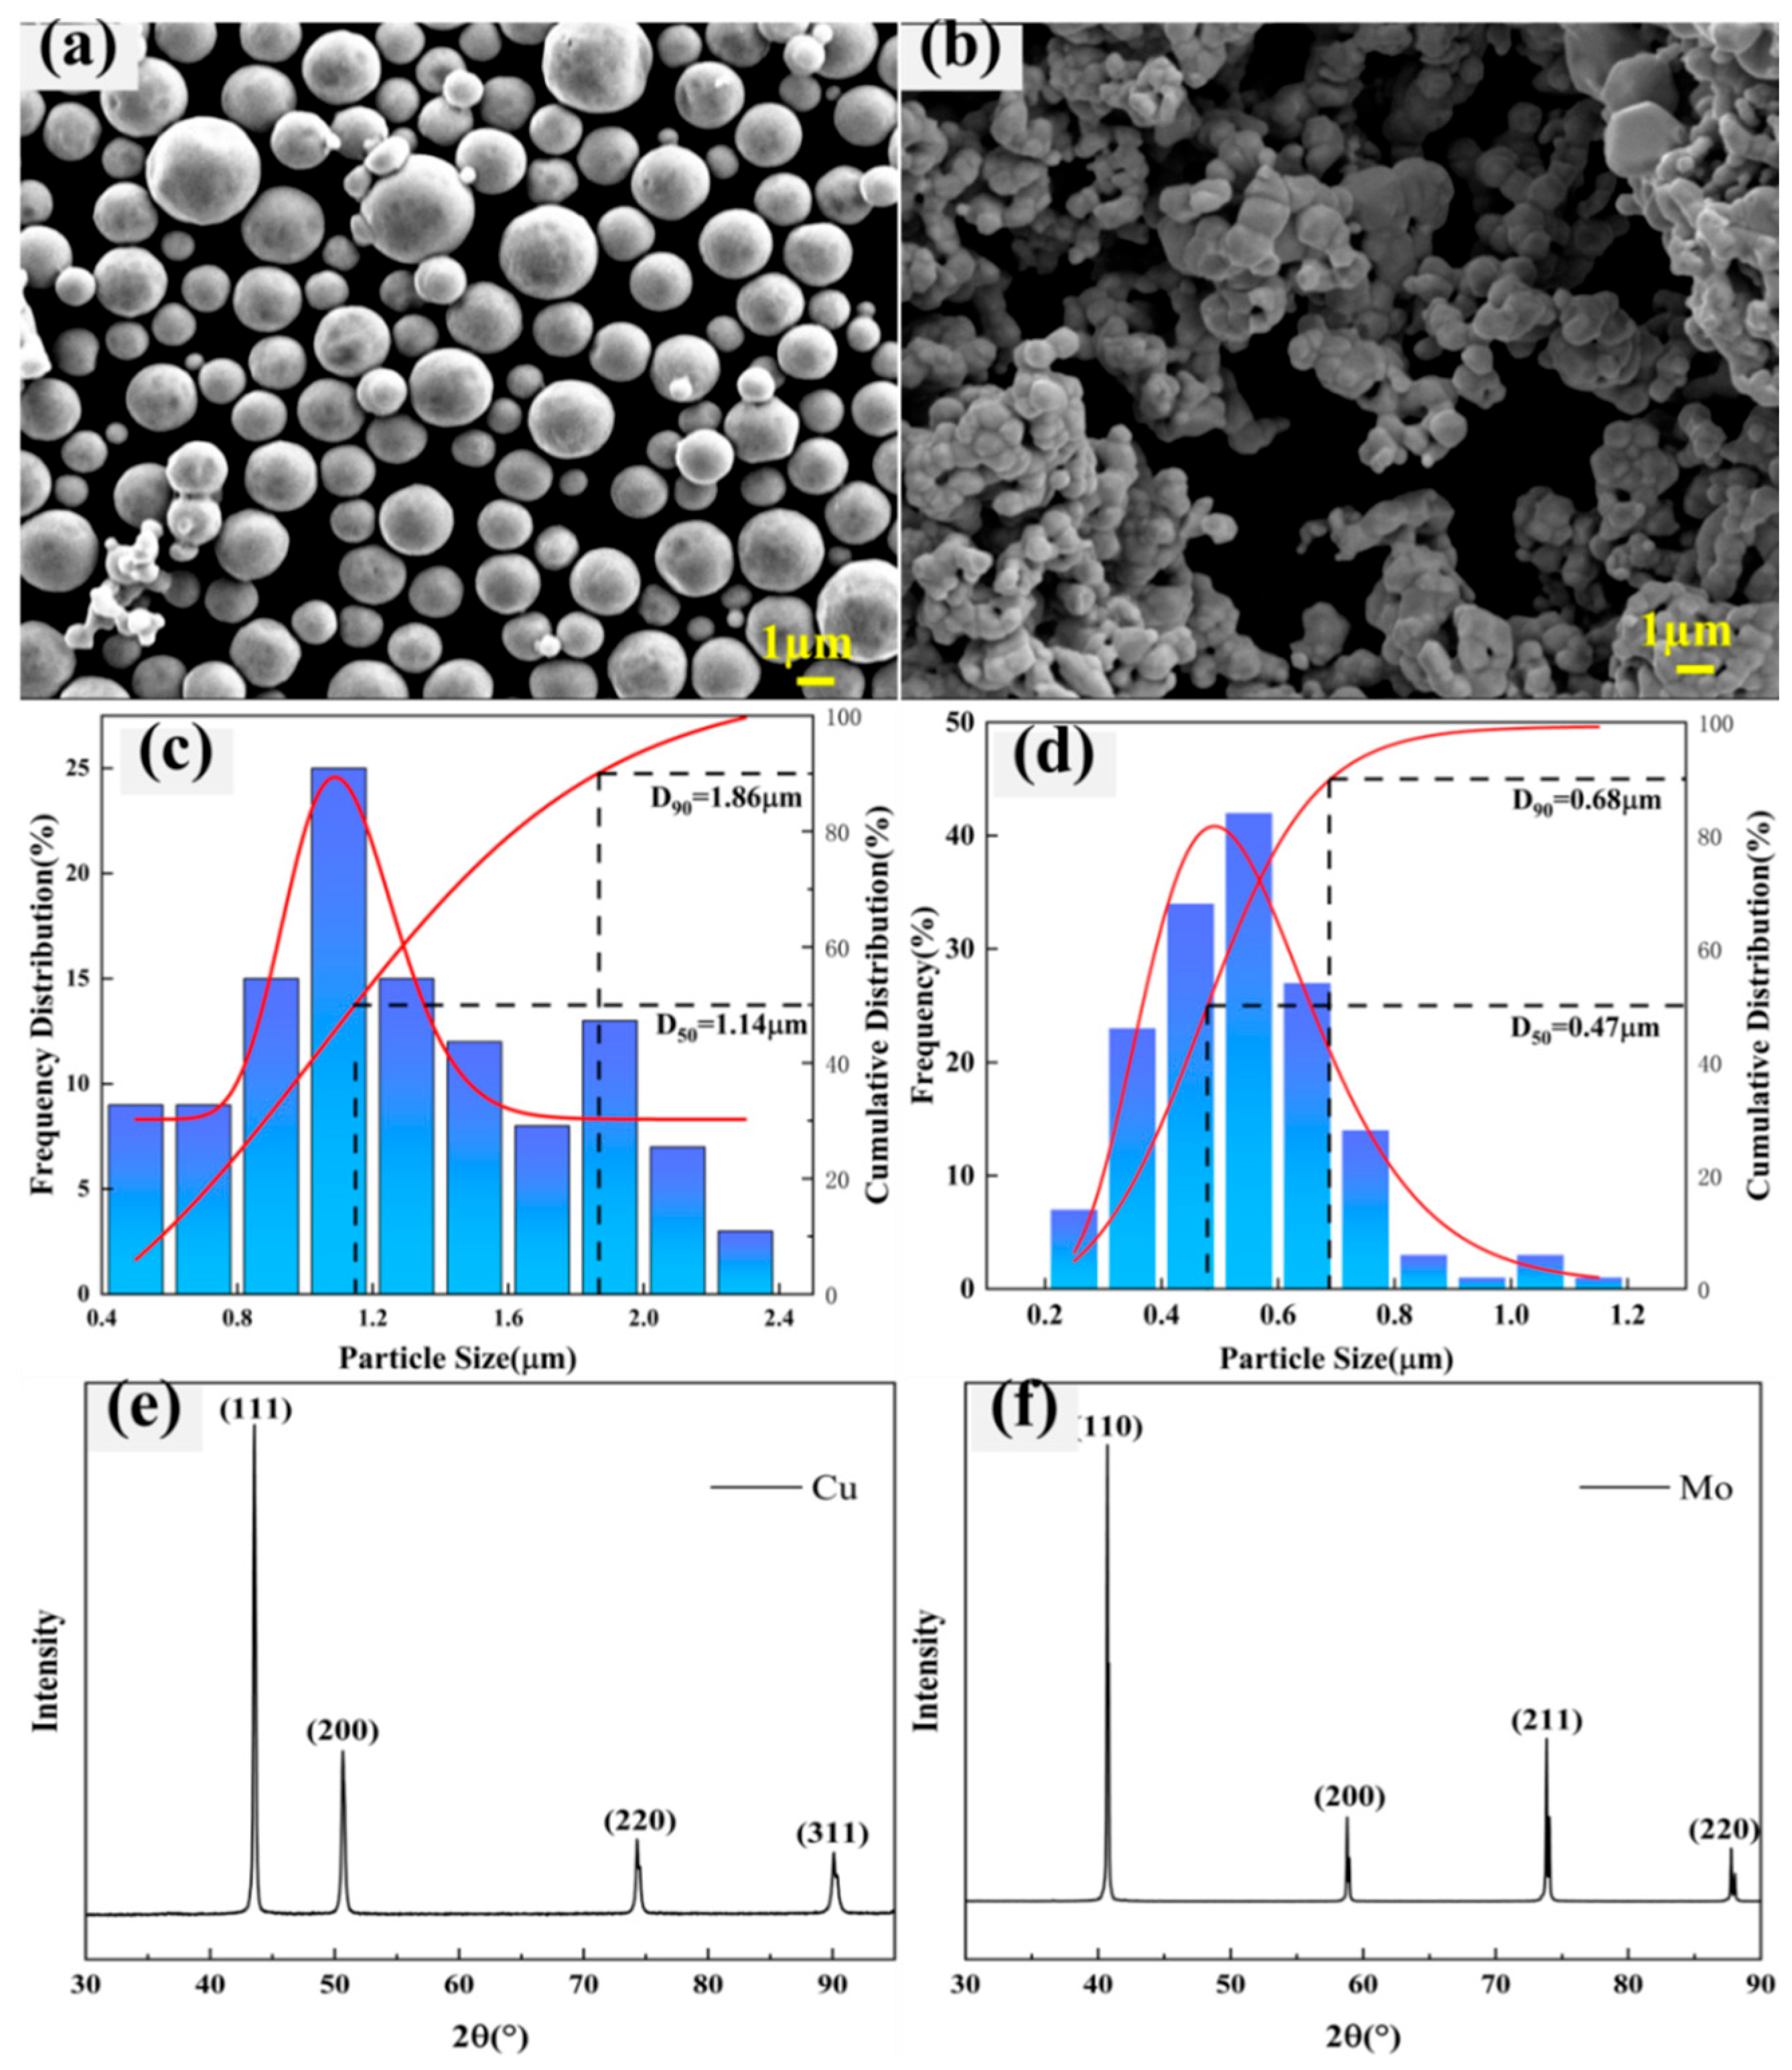
Figure 2a,b, Cu powder is regularly spherical, ensuring good sintering fluidity. Mo powder, however, consists of fine grains at the nanometer level with an extremely high specific surface area, thereby facilitating the production of a high-density composite.
Figure 2c,d shows the particle size analysis results of Cu powder and Mo powder. Average diameters of 1.14 μm for Cu powder and 0.47 μm for Mo powder are revealed. And both powders obey the normal distribution. The numerical difference between D50 and D90 is small, showing uniform particle dimensions and regular shapes. There are only Cu peaks or Mo peaks in the original powder (see
Figure 2e,f), and no other impurity peaks are detected, demonstrating that the sample purity satisfies the experimental specifications.
Comparing the experimental diffraction peaks with the standard PDF cards of Cu and Mo phases (shown in the red dotted line in
Figure 3), the diffraction peaks are sharp and clear, and all of them are composed of Cu and Mo phases. No other excess diffraction peaks are found, indicating that Cu and Mo phases maintain their own independent crystal structures during sintering, i.e., a face-centered cubic (FCC) structure for Cu (Fm-3m) and a body-centered cubic (BCC) structure for Mo (Im-3m). The formation of this ‘pseudo-alloy’ is attributed to the short sintering time, and atomic diffusion is limited. A comparison with the standard PDF cards reveals a decrease in intensity and a broadening of the diffraction peaks for both Cu and Mo. This broadening and weakening are a result of the reduction in crystallite size and internal strain accumulation during the milling process. The diffraction patterns indicate that variations in Mo content do not shift Cu diffraction peaks, suggesting that Mo exists as a separate phase. Furthermore, the spectrum shows that, with low Mo content, the characteristic peaks belonging to the Mo phase’s (200) and (211) crystal planes are not obvious. With a rise in the Mo content, the intensity of the Mo phase’s diffraction peaks progressively increases, which aligns with the anticipated trend in the design composition.
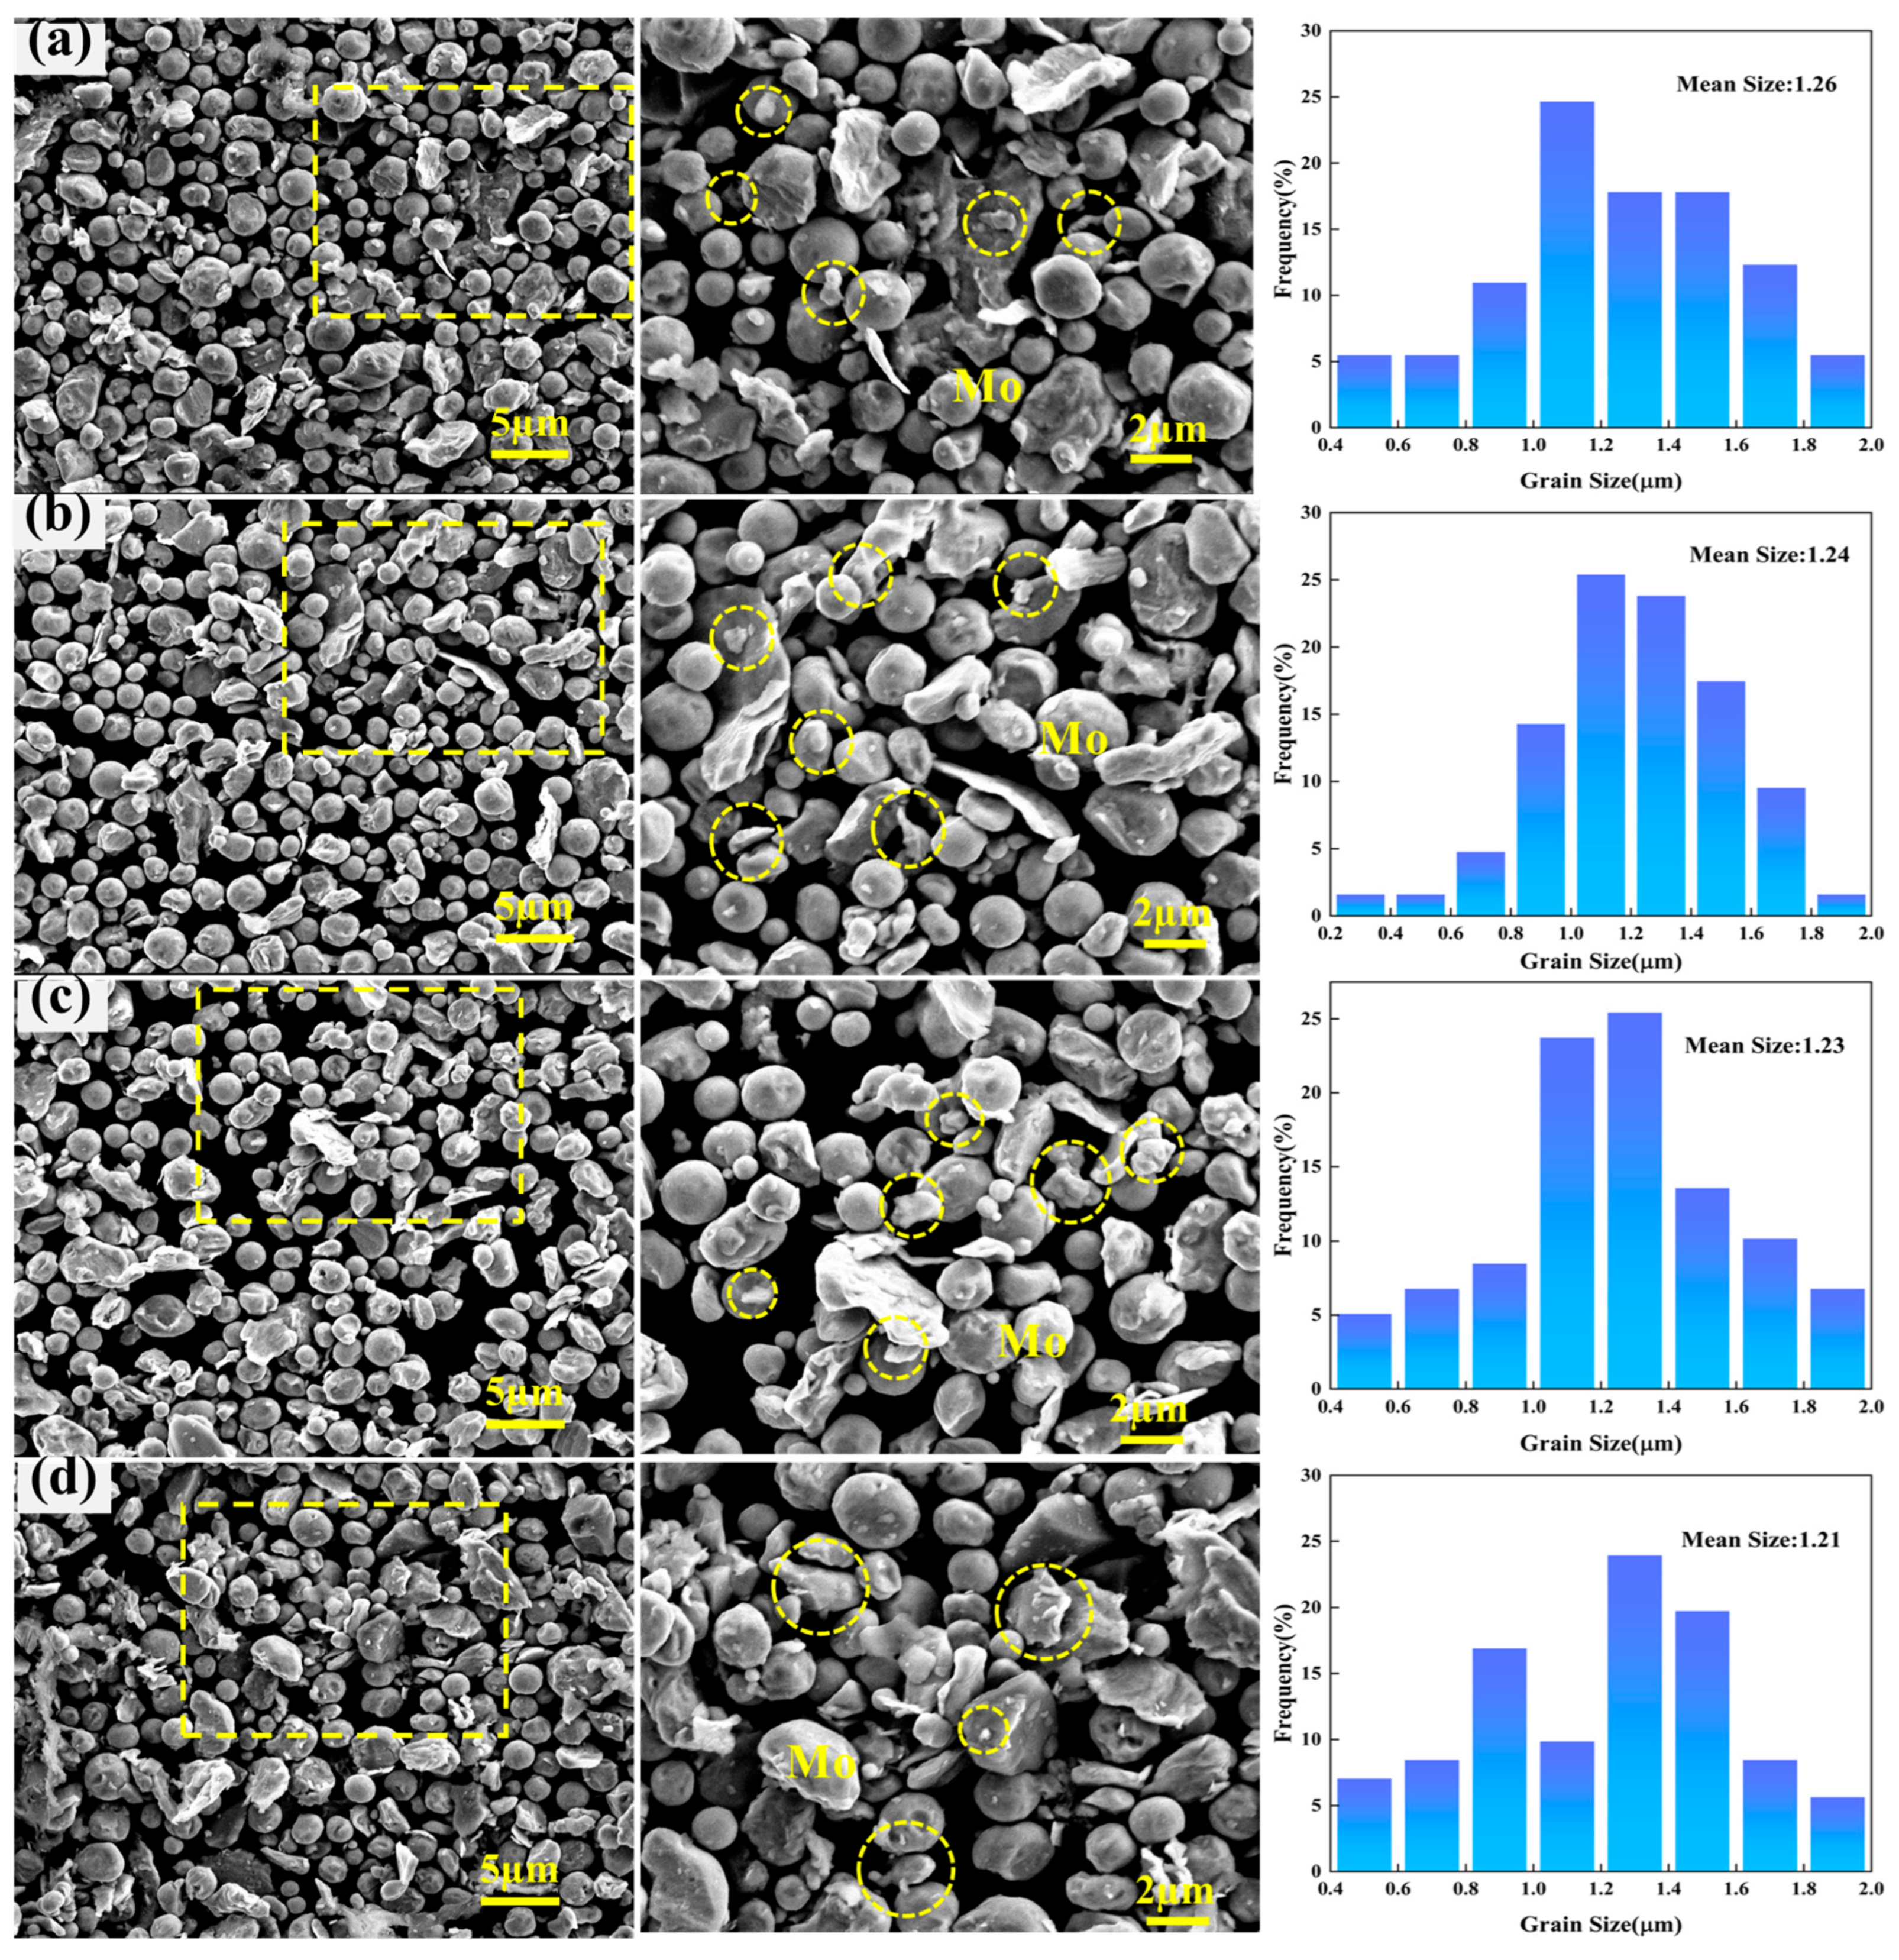
Figure 4 presents the SEM images and particle size distributions of Cu-Mo composite powders with varying Mo contents. The magnified views reveal that after blending, the high ductility of Cu causes its morphology to transition from spherical to elliptical structures. The Mo particles, indicated by yellow dashed circles, are primarily distributed on the surface and within the interstices of the Cu particles. As the Mo content increases, its distribution density within the copper matrix rises correspondingly, leading to a progressive adjustment in the spatial uniformity of the particles. At lower concentrations, the Mo particles exhibit an isolated, dispersed state. The measured grain sizes of the Cu-Mo composite powders across different compositions are 1.26 μm, 1.24 μm, 1.23 μm, and 1.21 μm, respectively.
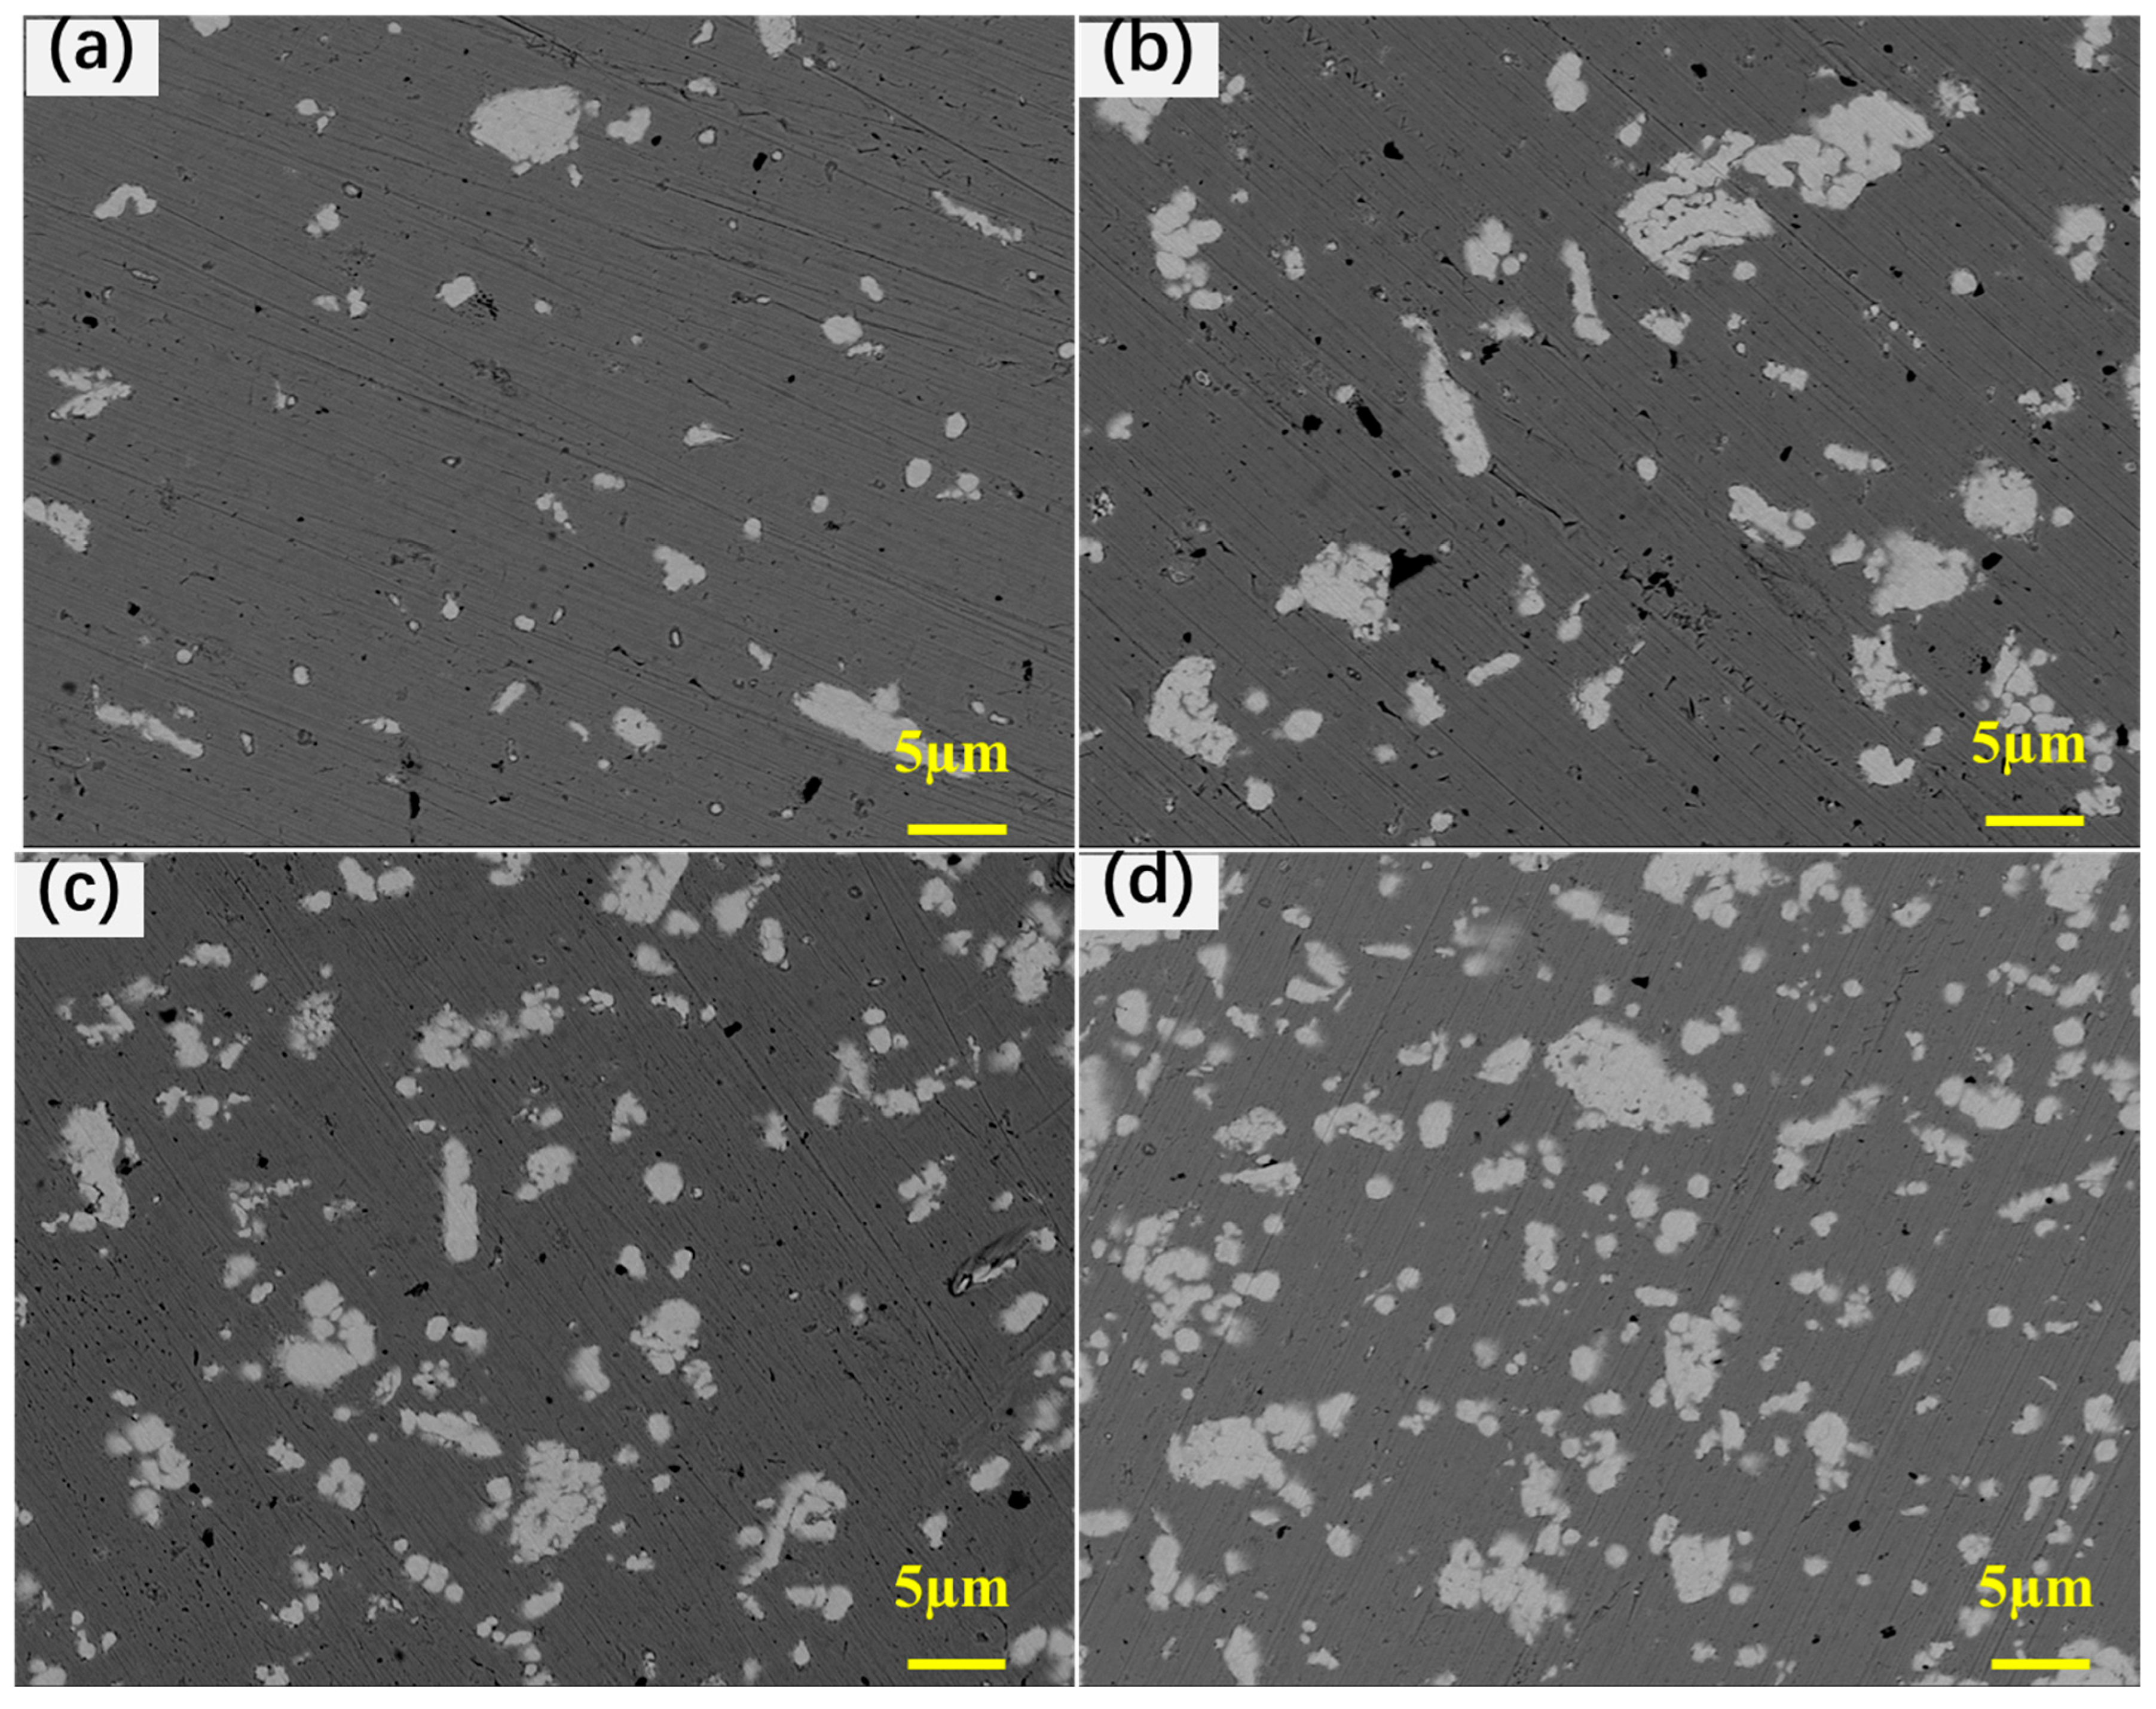
Figure 5 depicts the microstructural characteristics and EDS analysis of Cu-Mo composites. The dark gray and white areas in the micrographs represent the Cu matrix and Mo particles, respectively. Mo particles are relatively evenly distributed across the Cu matrix. The number of particles in a fixed area increases markedly, and their spatial arrangement evolves with increasing Mo content. This progression changes the distribution pattern from a dispersed state at low content (
Figure 5a) to a locally concentrated state, marking the initial characteristic for constructing a bicontinuous phase microstructure [
34,
35,
36]. In addition, the black regions in
Figure 4 are porosity, as evidenced by their morphology and the contrast in the BSE image. The mutual solubility is extremely low, and the mutual diffusion of elements is hindered; the Mo phase is mainly segregated at the grain boundary of Cu, which is helpful for realizing grain boundary strengthening.
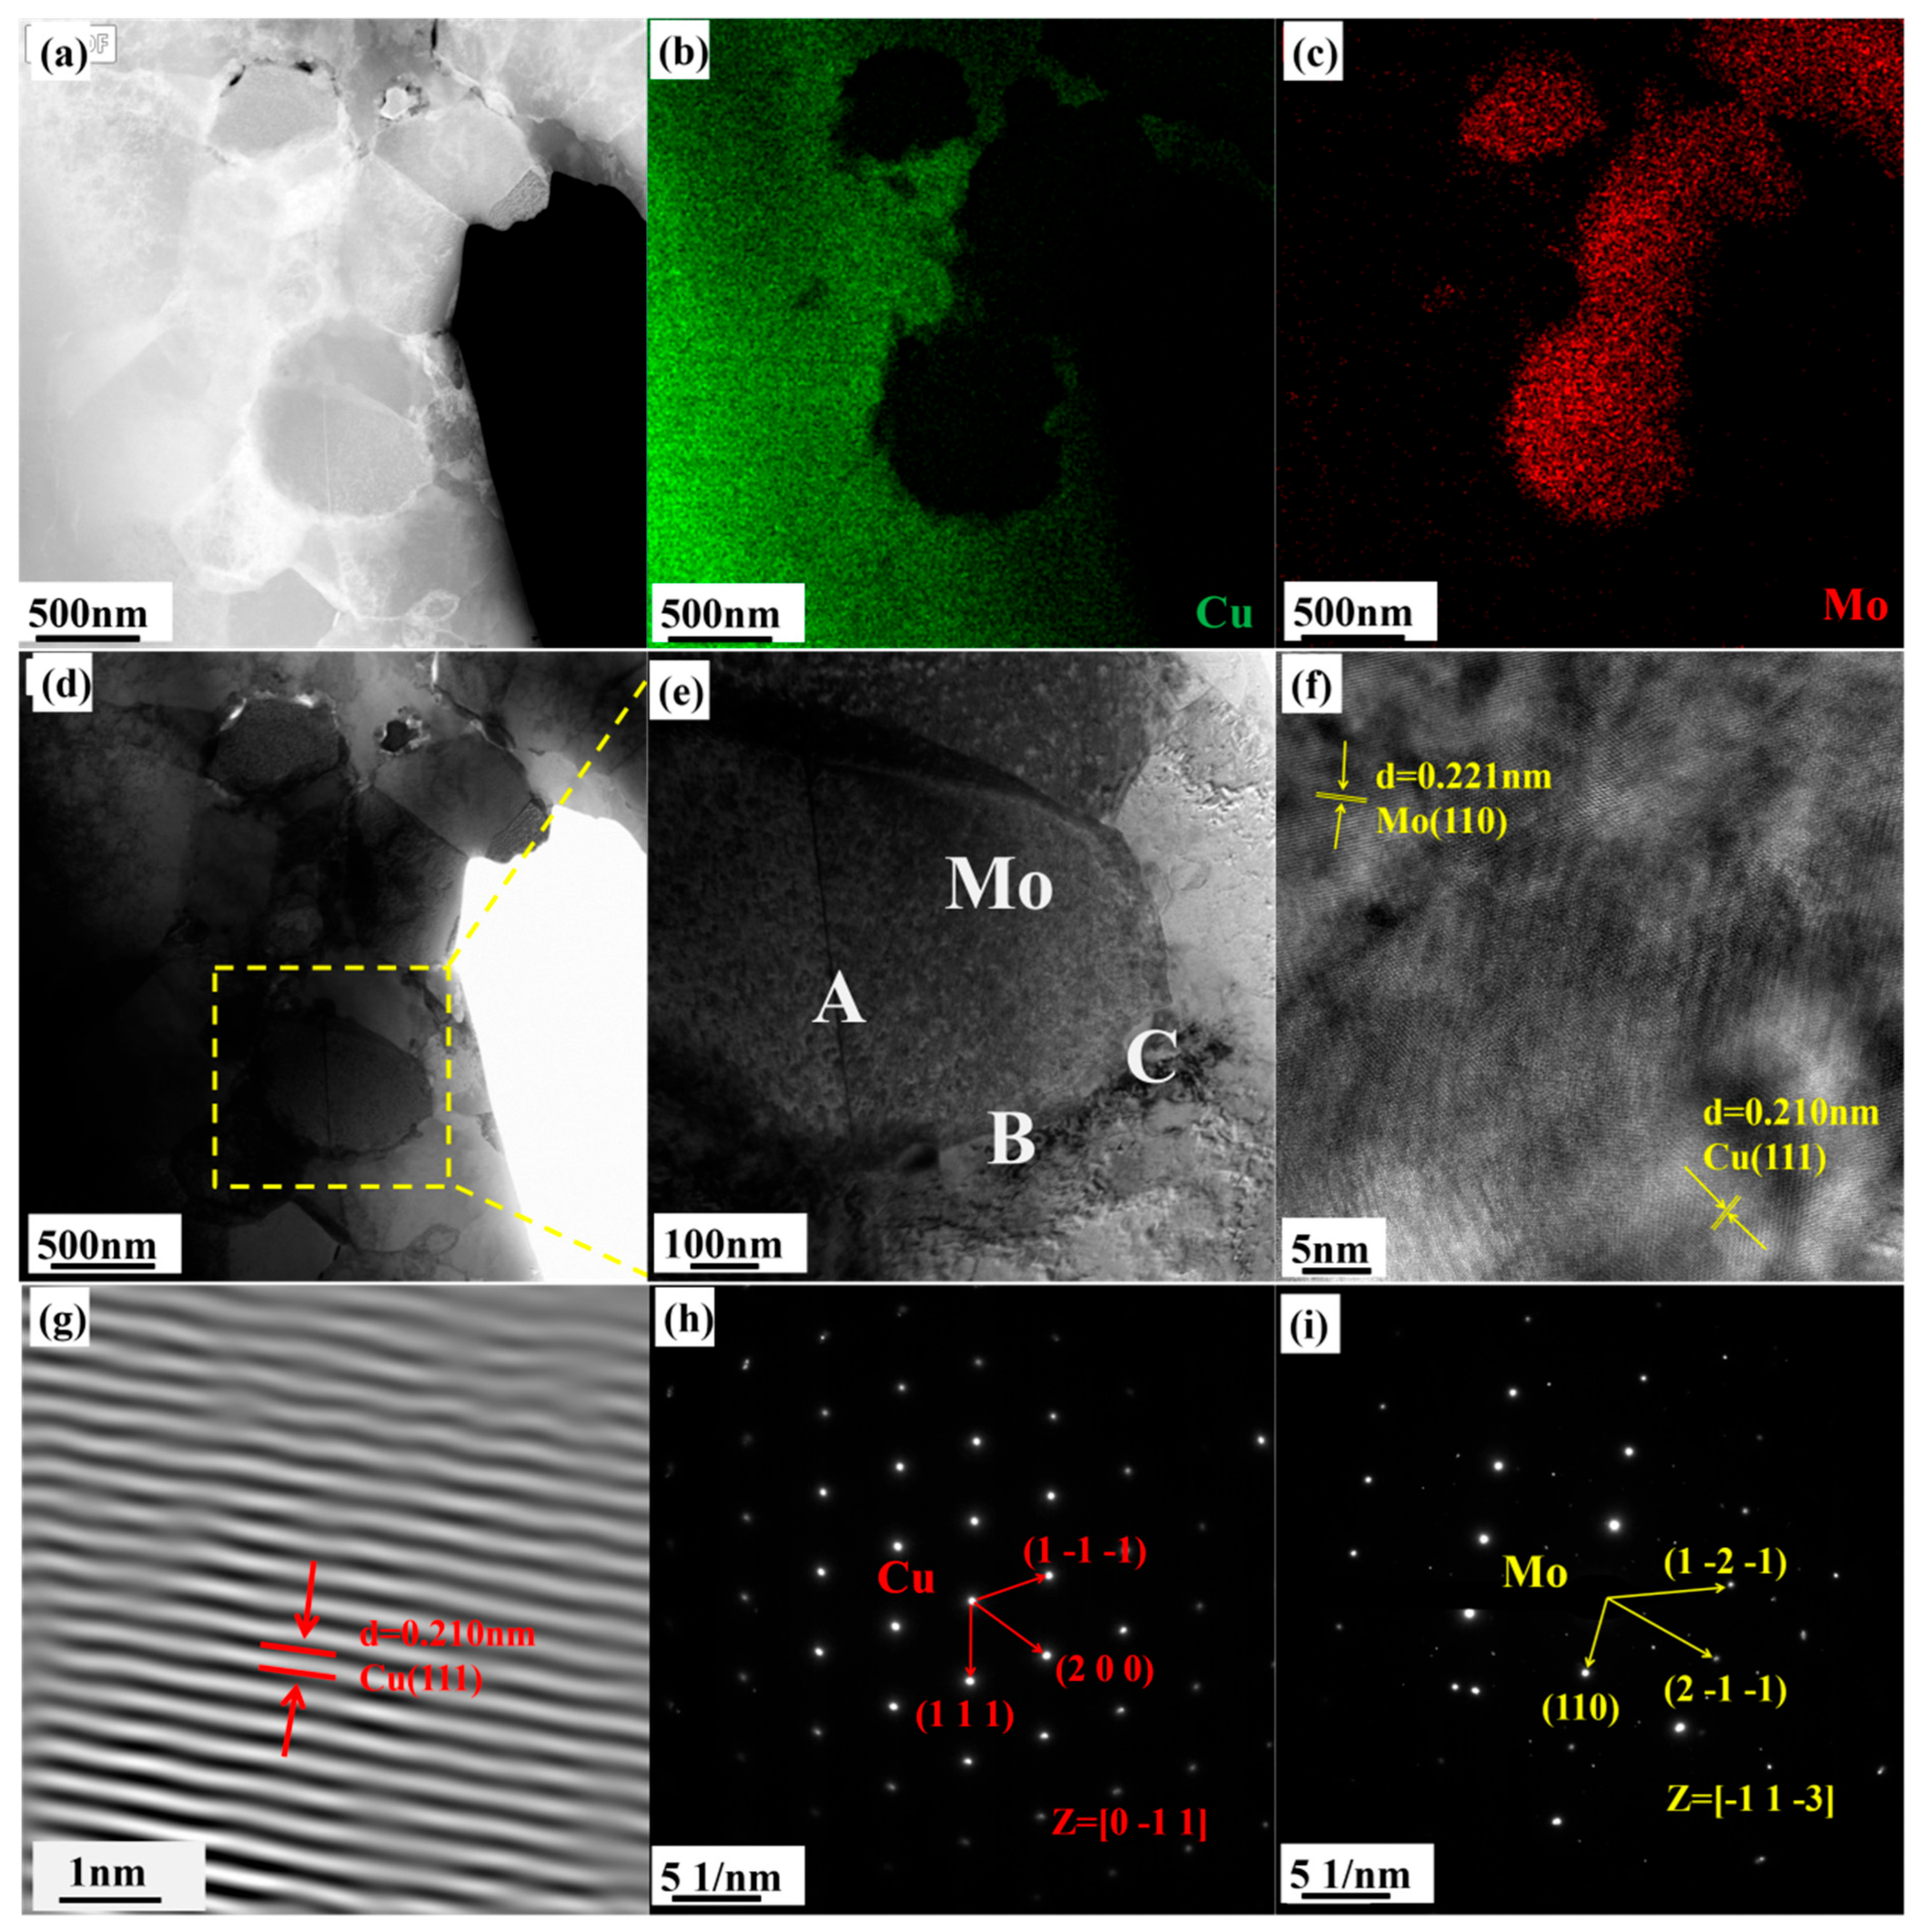
Transmission electron microscopy (TEM) analysis of Cu-15%Mo composite microstructure is shown in
Figure 6a, utilizing bright-field and dark-field imaging alongside elemental mapping to further elucidate its structure and composition. EDS analysis (see
Figure 6b,c) reveals that Mo particles are closely bonded with the Cu phase and distributed along Cu grain boundaries. Selected area electron diffraction was used to analyze the interface of the CM15 composite.
Figure 6h,i are, respectively, the diffraction patterns of points A and C in
Figure 6e. Comparison of the lattice diffraction patterns with standard PDF cards confirmed the existence of Mo and Cu phases, thereby yielding results that correspond with the XRD pattern analysis from
Figure 3. As measured in
Figure 6f, the interplanar spacings of Cu and Mo are 0.210 nm and 0.221 nm, respectively, corresponding to Cu (111) and Mo (110) crystal planes. To determine the interface crystallographic relationship, the mismatch parameter (
δ) can be employed for a quantitative assessment, calculated using the following formula:
where
αa is the interplanar spacing of Cu (111);
αb is the interplanar spacing of Mo (110).
The calculation results based on experimental data show that the mismatch parameter δ of the interface system is 0.052. Based on the criterion of the interface-matching theory (0.05 < δ < 0.25), the calculated δ value of 0.052 establishes that the interface is semi-coherent. In terms of atomic arrangement, the Cu (111) plane is a close-packed surface possessing high atomic density and low interface energy. This mechanism promotes a larger contact area between the two phases, thereby strengthening the interfacial bond and thus improving the mechanical properties of the Cu-Mo composite.
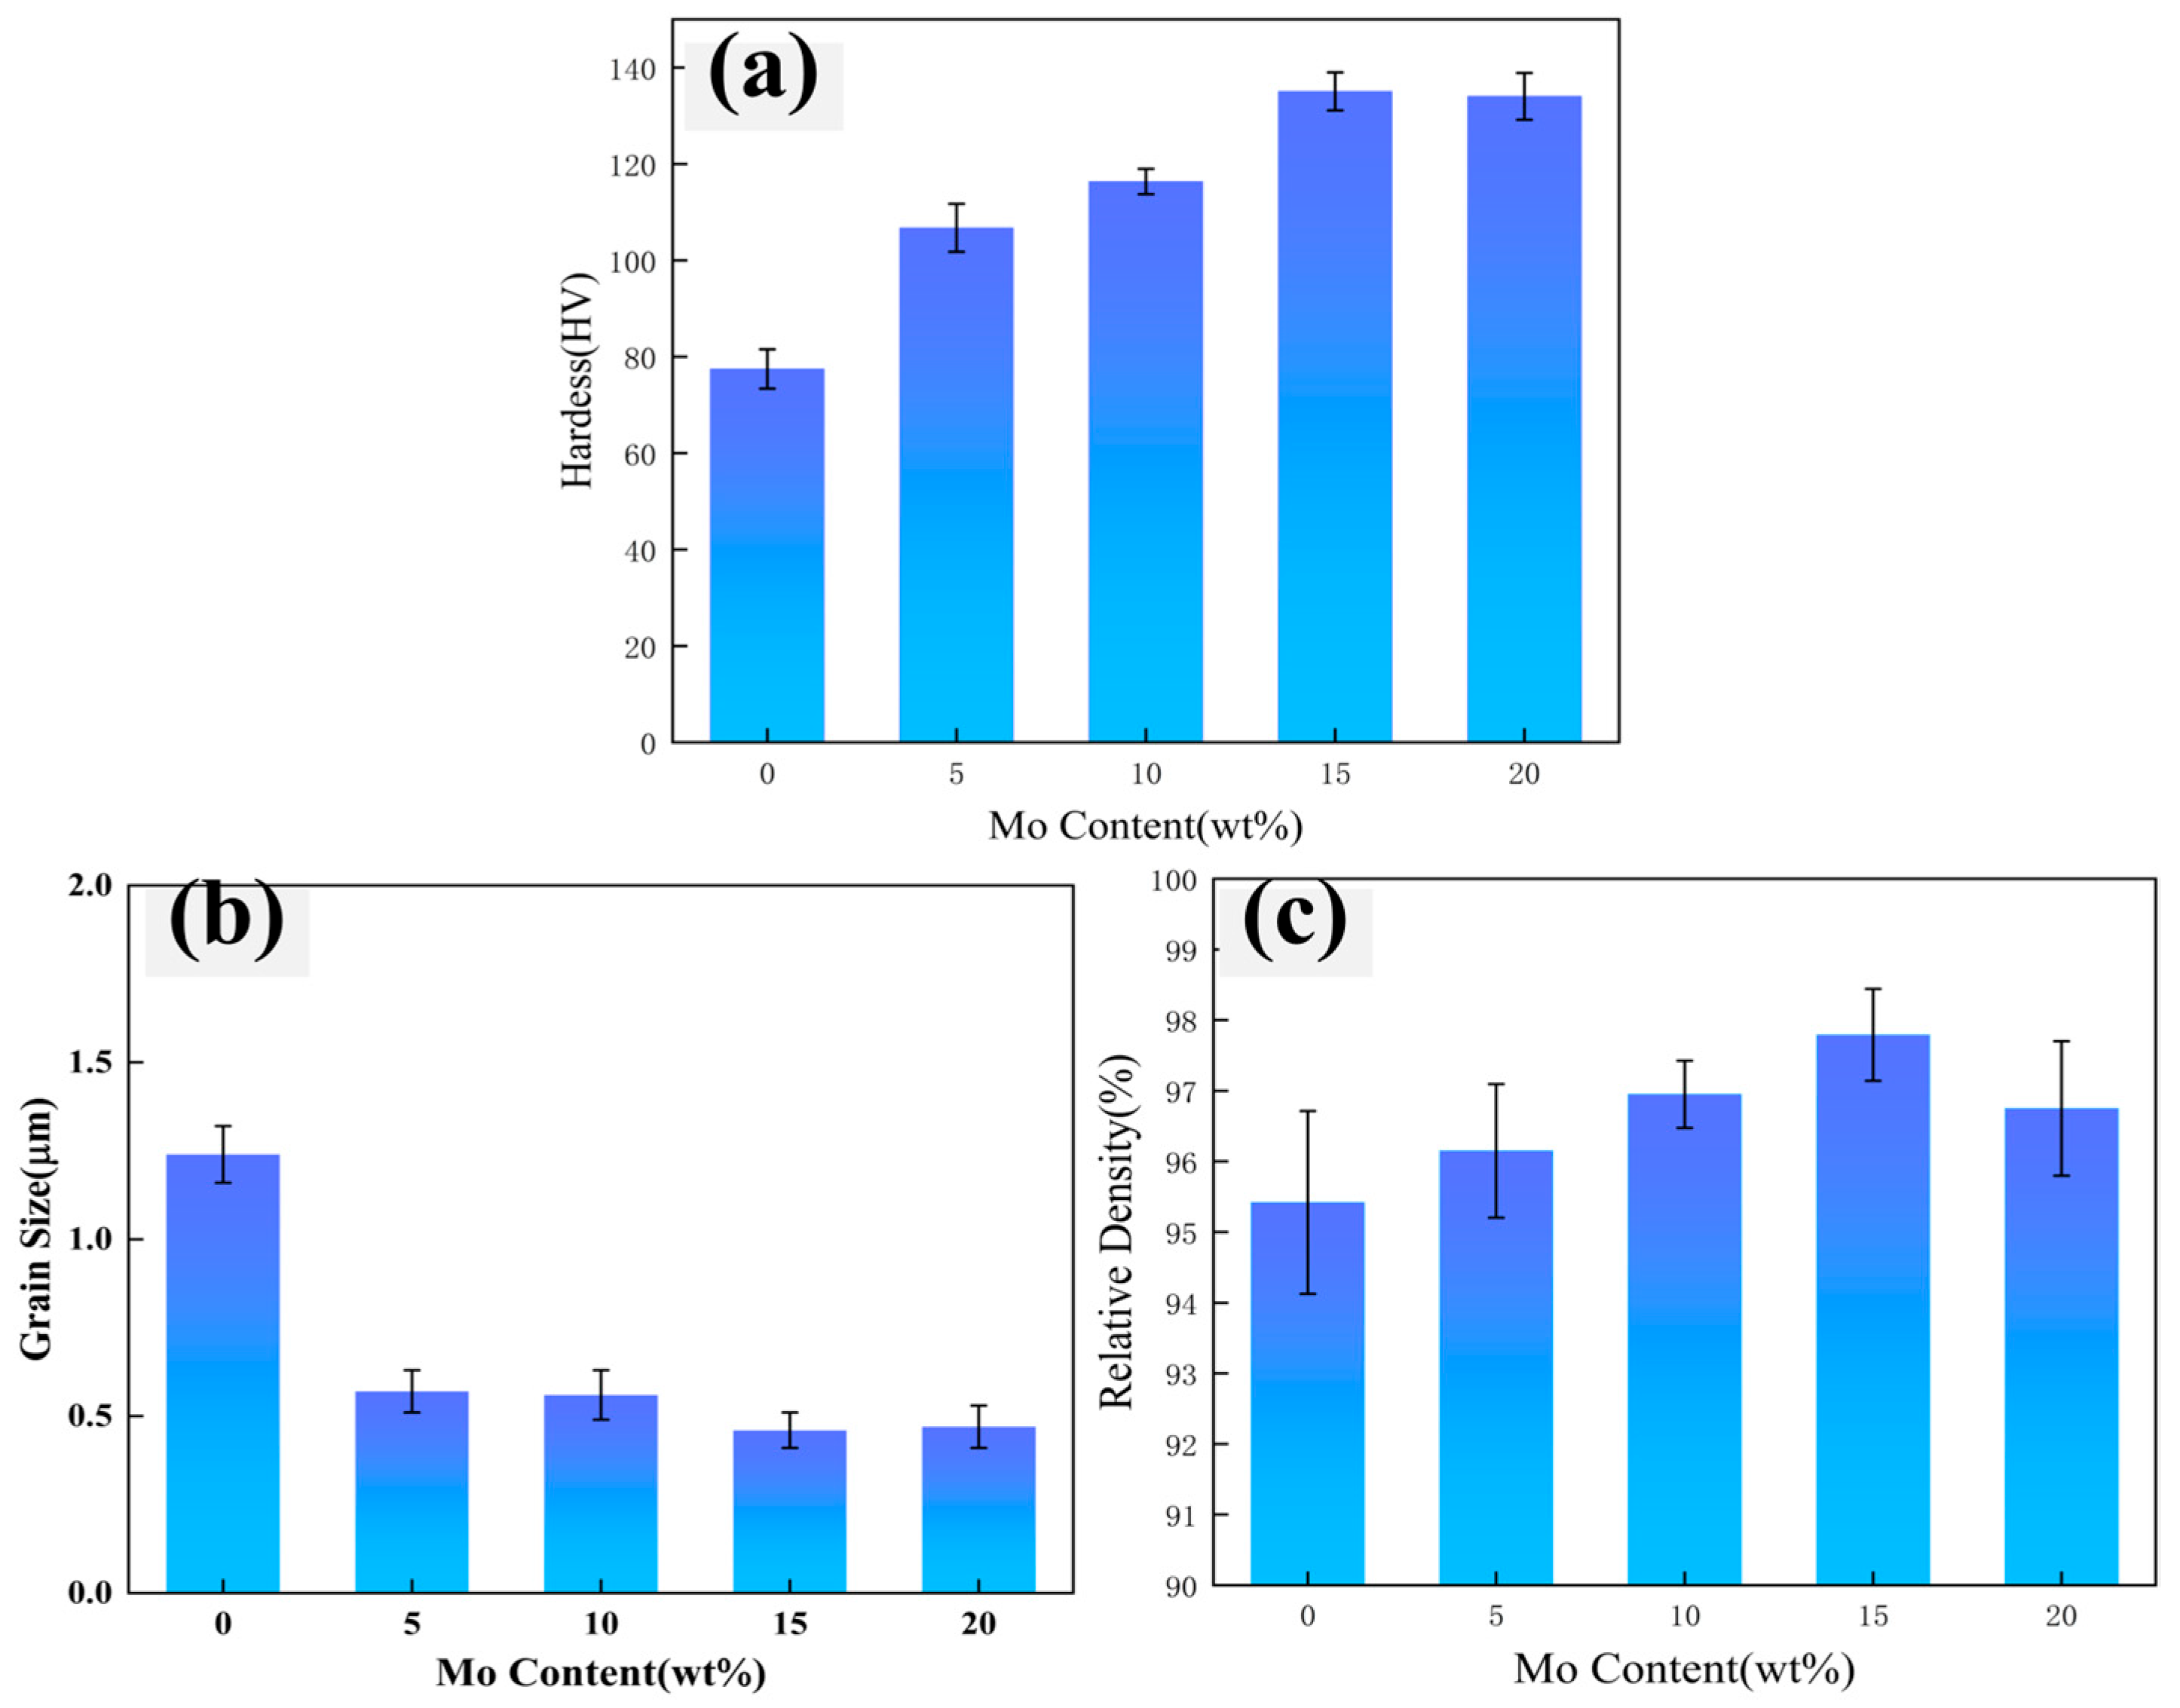
The Vickers hardness and density of Cu-Mo composites containing varying Mo concentrations are given in
Figure 7. As depicted in
Figure 7a, the Vickers hardness changes with Mo content. Under SPS conditions (950 °C), the microhardness of CM5, CM10, CM15, and CM20 sintered blocks is 107 HV, 116 HV, 135 HV, and 134 HV, respectively. The hardness of the Cu-Mo composite with 15wt% Mo content is the highest, which is 74% higher than that of pure Cu (77 HV). This is because introducing an appropriate amount of Mo particles into the Cu matrix enables their relatively uniform dispersion. This uniformity ensures that, on the one hand, the composite does not suffer from a weak strengthening effect due to an insufficient Mo content. On the other hand, it prevents stress concentration and defects induced by particle agglomeration that would occur with excessive Mo content. Furthermore, the fine size and homogeneous distribution of Mo particles contribute to an enhancement in the Vickers hardness of the Cu matrix [
37,
38].
Figure 7b presents the grain size. For pure Cu, the mean grain size is 1.24 μm. In contrast, the grain sizes of CM5, CM10, CM15, and CM20 composites are significantly refined to the sub-micron range, and the average values are, respectively, 0.57 μm, 0.50 μm, 0.46 μm, and 0.47 μm. Accumulated Mo particles primarily inhibit Cu matrix grain growth via the Zener pinning effect. The high Mo content, combined with the fine particle size, generates a substantial pinning force that impedes Cu grain boundary migration. This mechanism effectively achieves and maintains the refined grain structure rather than directly creating new fine grains. Equation (2) gives the Hall–Petch relationship between grain size and hardness:
In the formula, d is the grain size, and Hv
0 and K are constants. As described by Equation (2), the hardness (HV) of a sample is inversely related to its grain size (d); larger grain sizes result in lower hardness values [
39]. The observed hardening effect in this study, therefore, confirms that the addition of Mo nanoparticles effectively inhibits grain growth and promotes refinement in the Cu matrix. These finely distributed grain boundaries and dispersed Mo particles collectively form a barrier network that effectively impedes dislocation motion. During plastic deformation, dislocations accumulate at these obstacles, leading to enhanced material strength through combined grain refinement strengthening and dislocation strengthening mechanisms.
The density of the Cu-Mo composite increases with increasing Mo content (≤15 wt%) (see
Figure 7c). And the relative density rises from 95.4% for pure Cu to a maximum of 97.8% for the CM15 composite. Pure Cu has low density, which is primarily attributable to two factors during SPS: The aggregation of trace impurities in the Cu powder and the use of a mono-sized powder. Although Cu possesses high thermal conductivity, the lack of significant size variation among the particles means that the uniform pores formed lack a filling mechanism. Consequently, pore elimination relies solely on slow processes like grain boundary diffusion, resulting in an insufficient sintering driving force and a limited final density. Adding Mo will increase the density of the Cu-Mo composite. This enhancement is primarily because the nano-scale Mo particles effectively fill the pores between Cu powder particles. As Mo content rises, the pores within the Cu phase are further filled, leading to greater densification [
40]. In addition, the extensive phase interfaces between Mo particles and the Cu matrix serve a dual purpose. On one hand, they act as fast pathways for grain boundary diffusion of atoms during sintering, thereby promoting the shrinkage of pores. On the other hand, they effectively pin Cu grain boundaries, which inhibits their premature growth and helps maintain grain boundary diffusion capability [
41]. The synergy of these effects ultimately improves the overall density. When the Mo content reaches 20 wt%, the density of the Cu-Mo composite will decrease to 96.75%. This decline occurs because the high concentration of Mo particles increases their contact frequency, facilitating the formation of a rigid, three-dimensional network skeleton. This skeleton greatly reduces the effective stress transmitted to the Cu matrix (see
Figure 5d), thereby hindering further densification.
The room-temperature stress–strain curve of the Cu-Mo composite is presented in
Figure 8, as well as the compressive strength. Both the yield strength and compressive strength demonstrate a consistent increasing trend with higher Mo content. The CM15 composite achieved the highest yield strength of 300 MPa, which is 115% higher than the pure Cu sample (139 MPa). At a lower addition level, Mo is more finely dispersed throughout the Cu matrix, acting as a strengthening phase. This dispersion thereby imparts a yield strength that is moderately higher than that of pure Cu. A further increase in the Mo content to 15% introduces a large number of Mo particles that effectively hinder dislocation motion, thereby resulting in a significant improvement in yield strength and a more pronounced strengthening effect. When the Mo content is increased to 20%, the high concentration causes Mo particles to inevitably contact and connect, forming hard aggregates that increase material brittleness and promote brittle fracture. In general, the composite with 15% Mo content achieves a more optimal balance of strength.
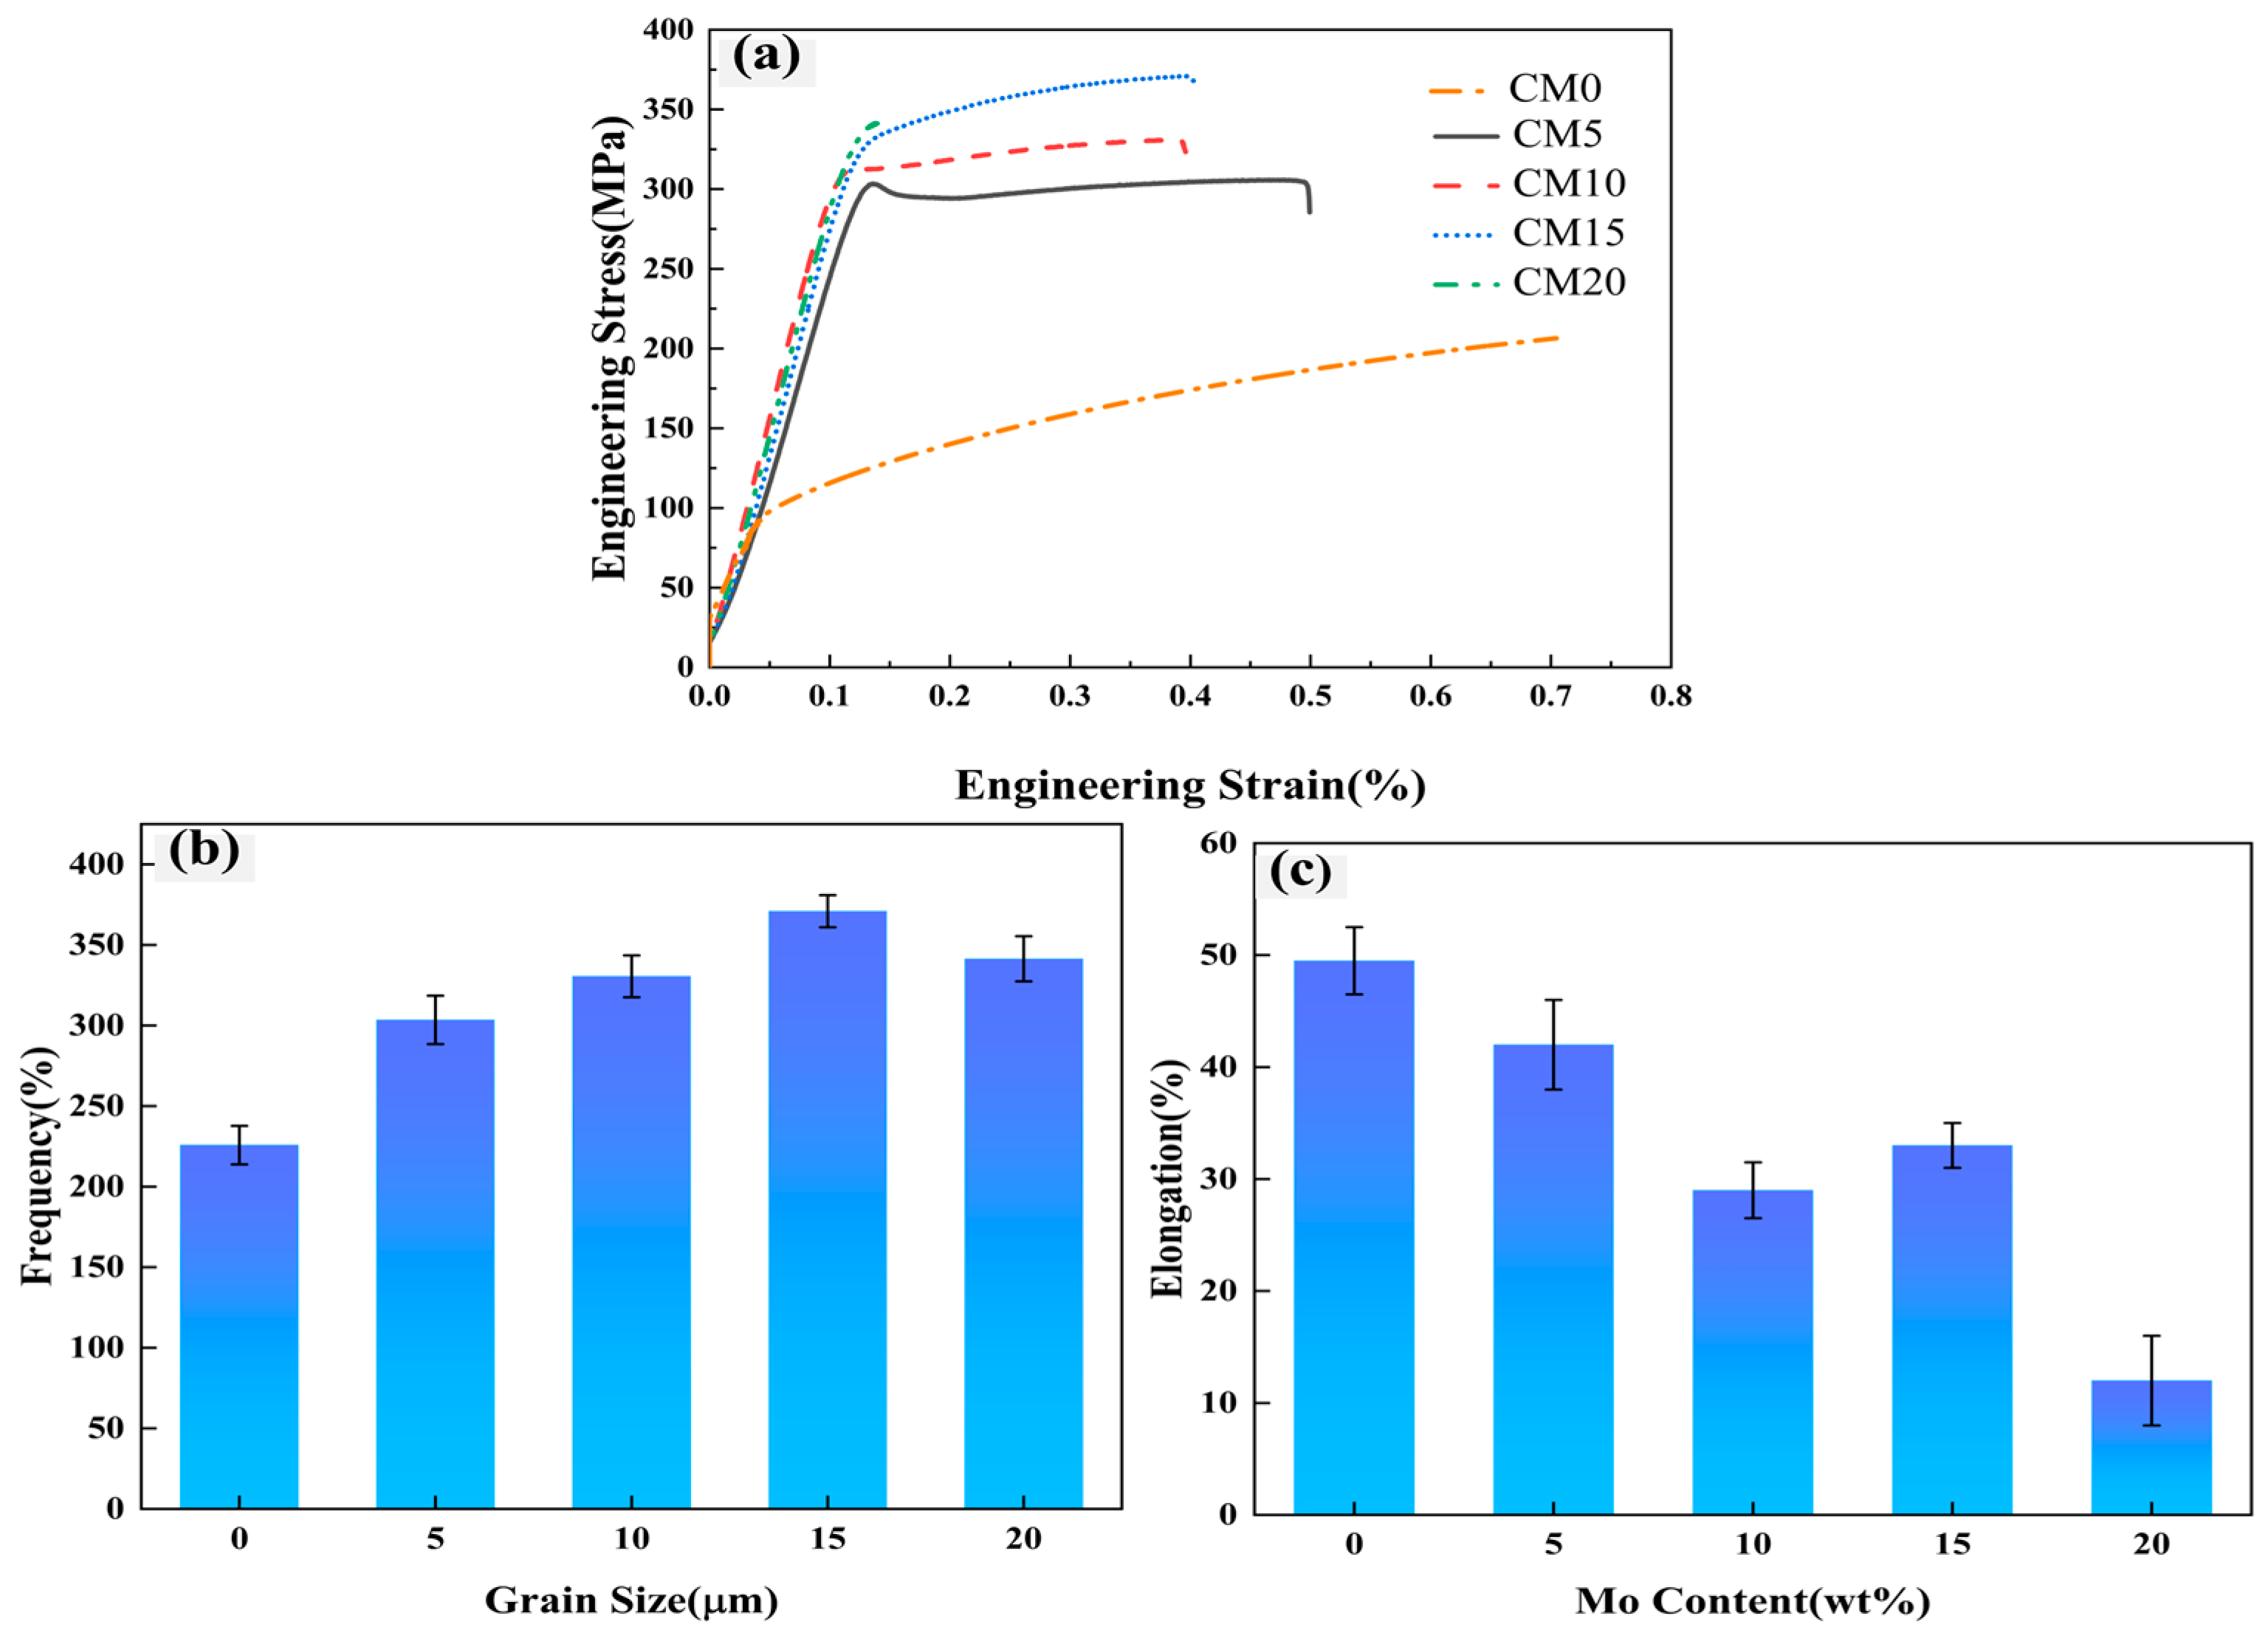
Also, the room-temperature tensile engineering stress–strain curve is shown in
Figure 9. The initial deformation of the material exhibits a linear trend, corresponding to the elastic region. Subsequently, the material behavior transitions from elastic to plastic deformation. With the increase in Mo content, the tensile strength increases, but the elongation is generally lower than that of pure Cu. This trade-off arises because even a small content of fine Mo particles effectively hinders dislocation motion within the material. With a further increase in Mo particle content (CM20), excessive particles form hard aggregates (
Figure 5). The formation of these aggregates will significantly worsen the elongation. The elongation of pure Cu is 49.5%, and the elongation of CM5, CM10, CM15, and CM20 composites is 42%, 29%, 33%, and 12%, respectively. In terms of tensile strength, the tensile strengths of CM5, CM10, CM15, and CM20 composites at room temperature are 303 MPa, 331 MPa, 371 MPa, and 341 MPa, respectively, which are 34.39%, 46.37%, 64.26%, and 51.18% higher than pure Cu (226 MPa). So, for the Cu-Mo composite, Mo can largely improve its tensile strength, but it simultaneously reduces its ductility to a certain extent [
42].
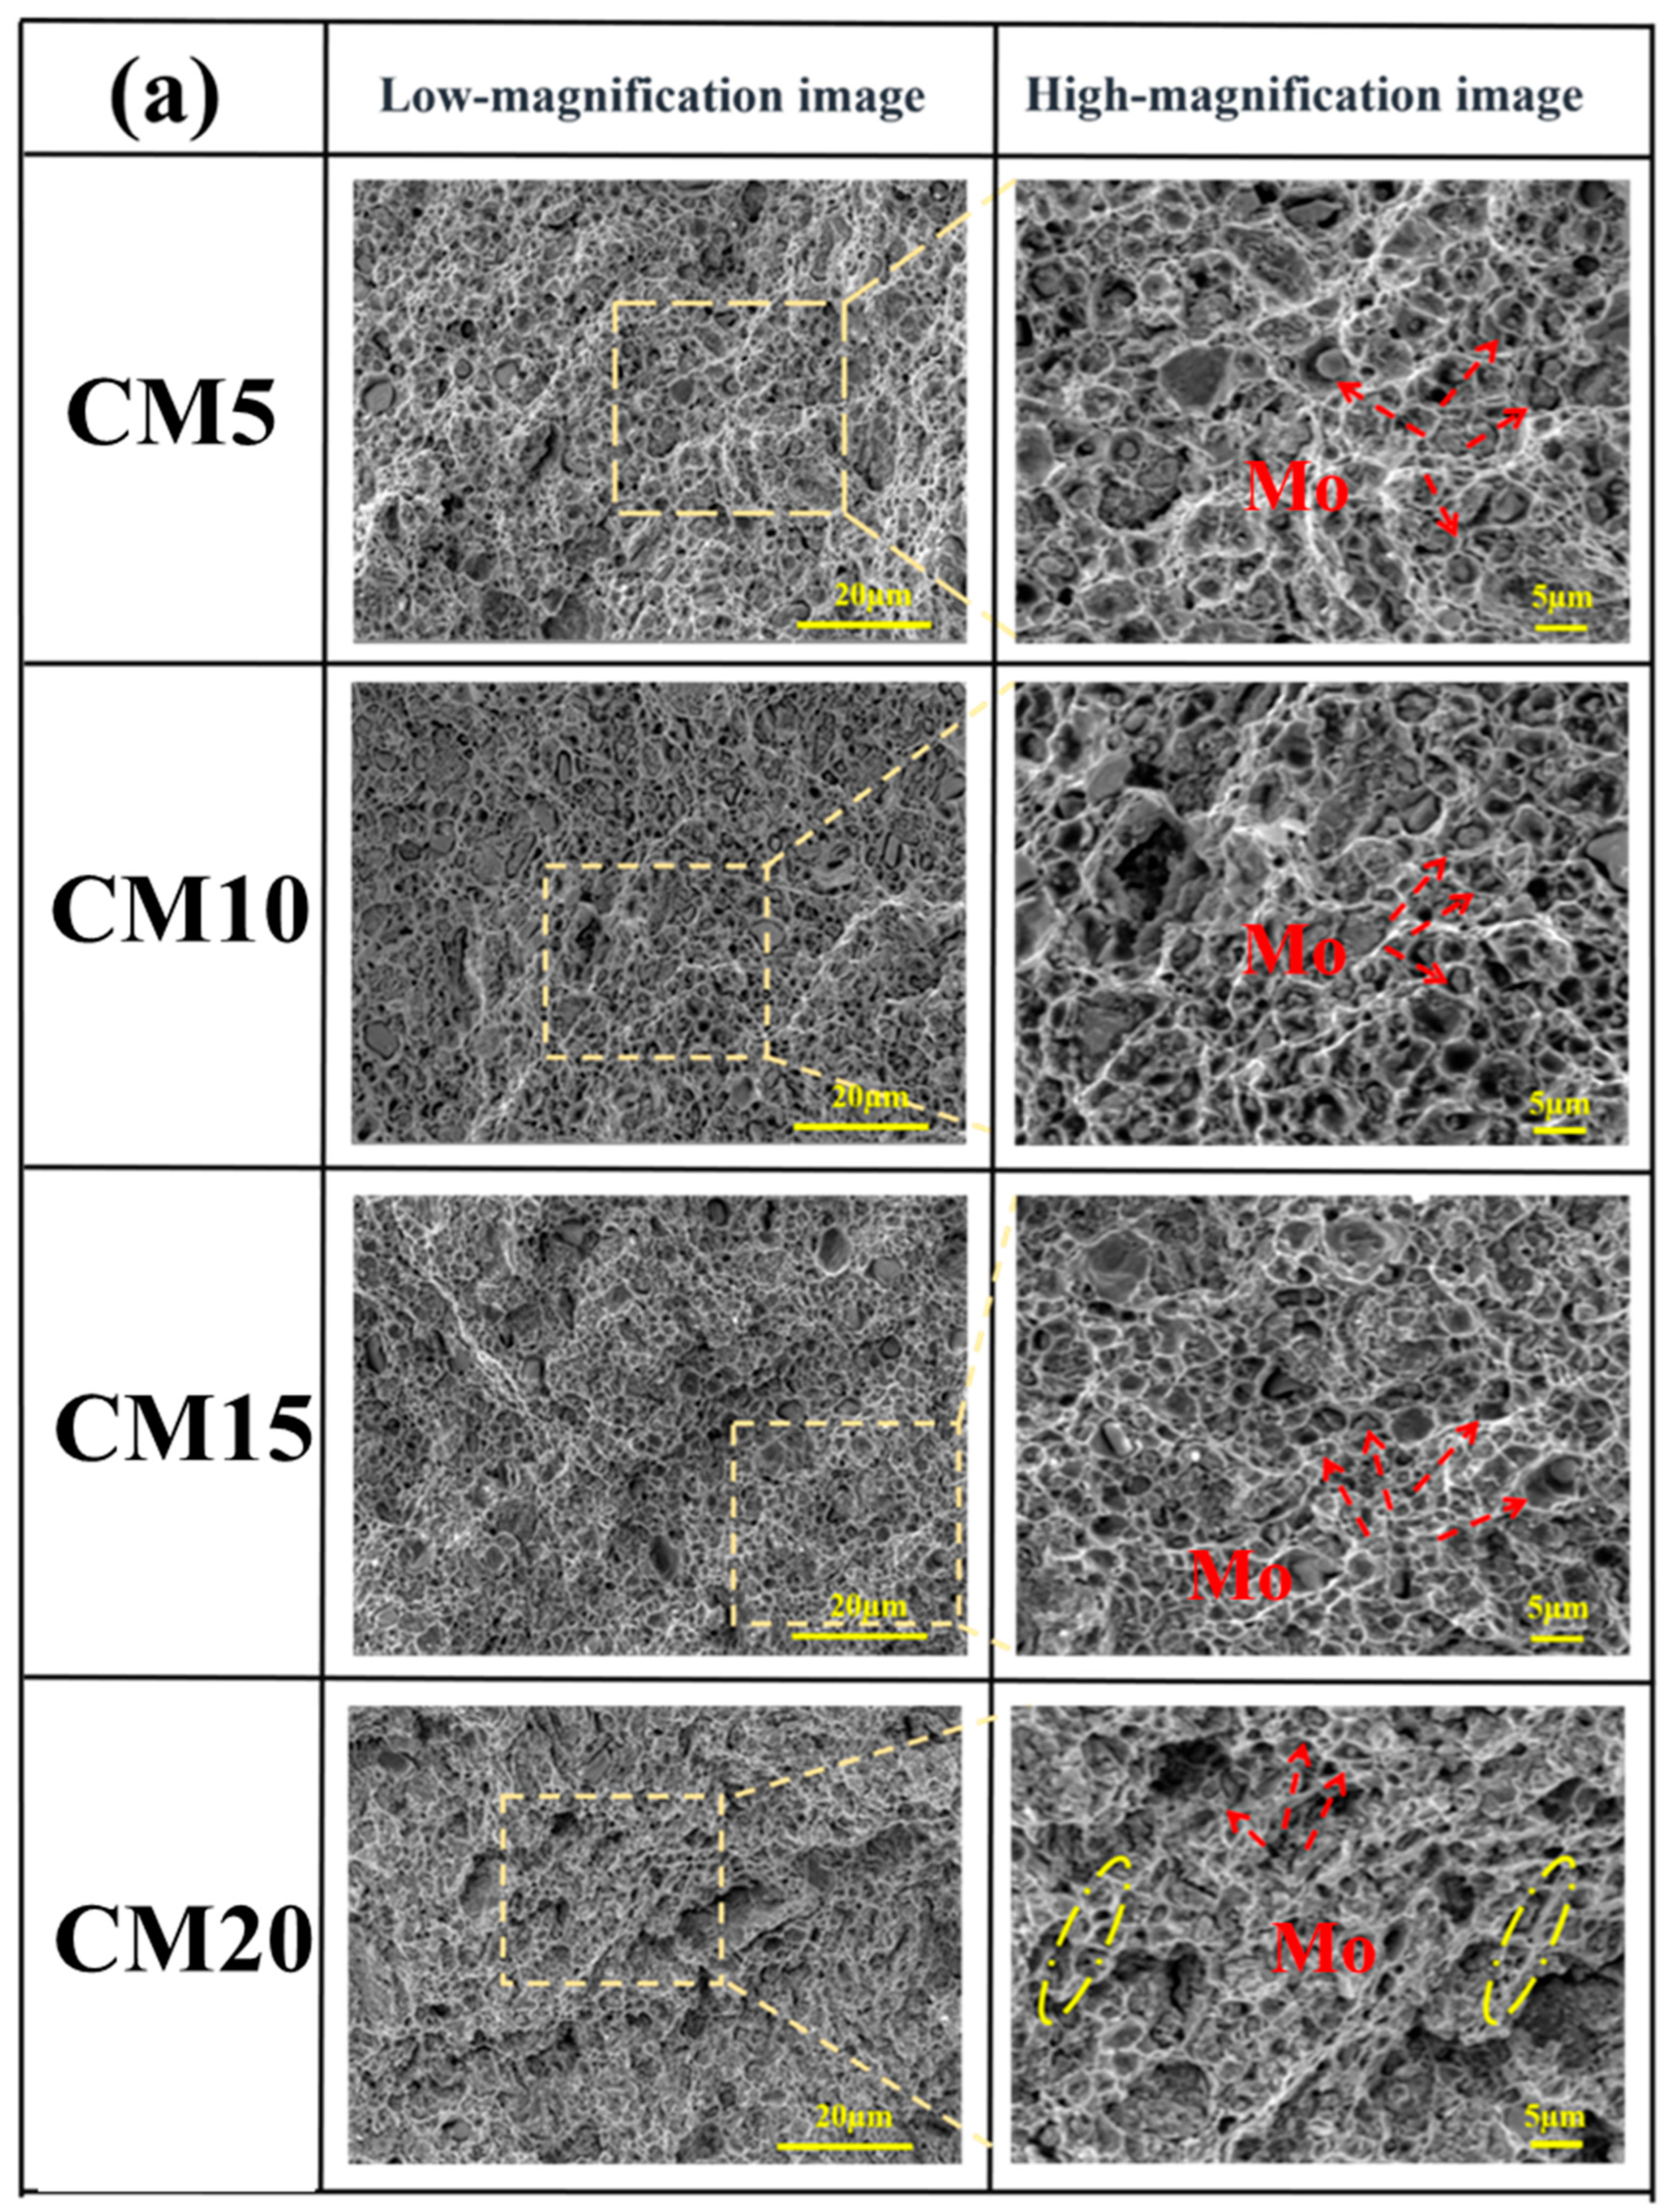
Tensile fracture morphologies of the Cu-Mo composite were analyzed via FE-SEM and EDS, as shown in
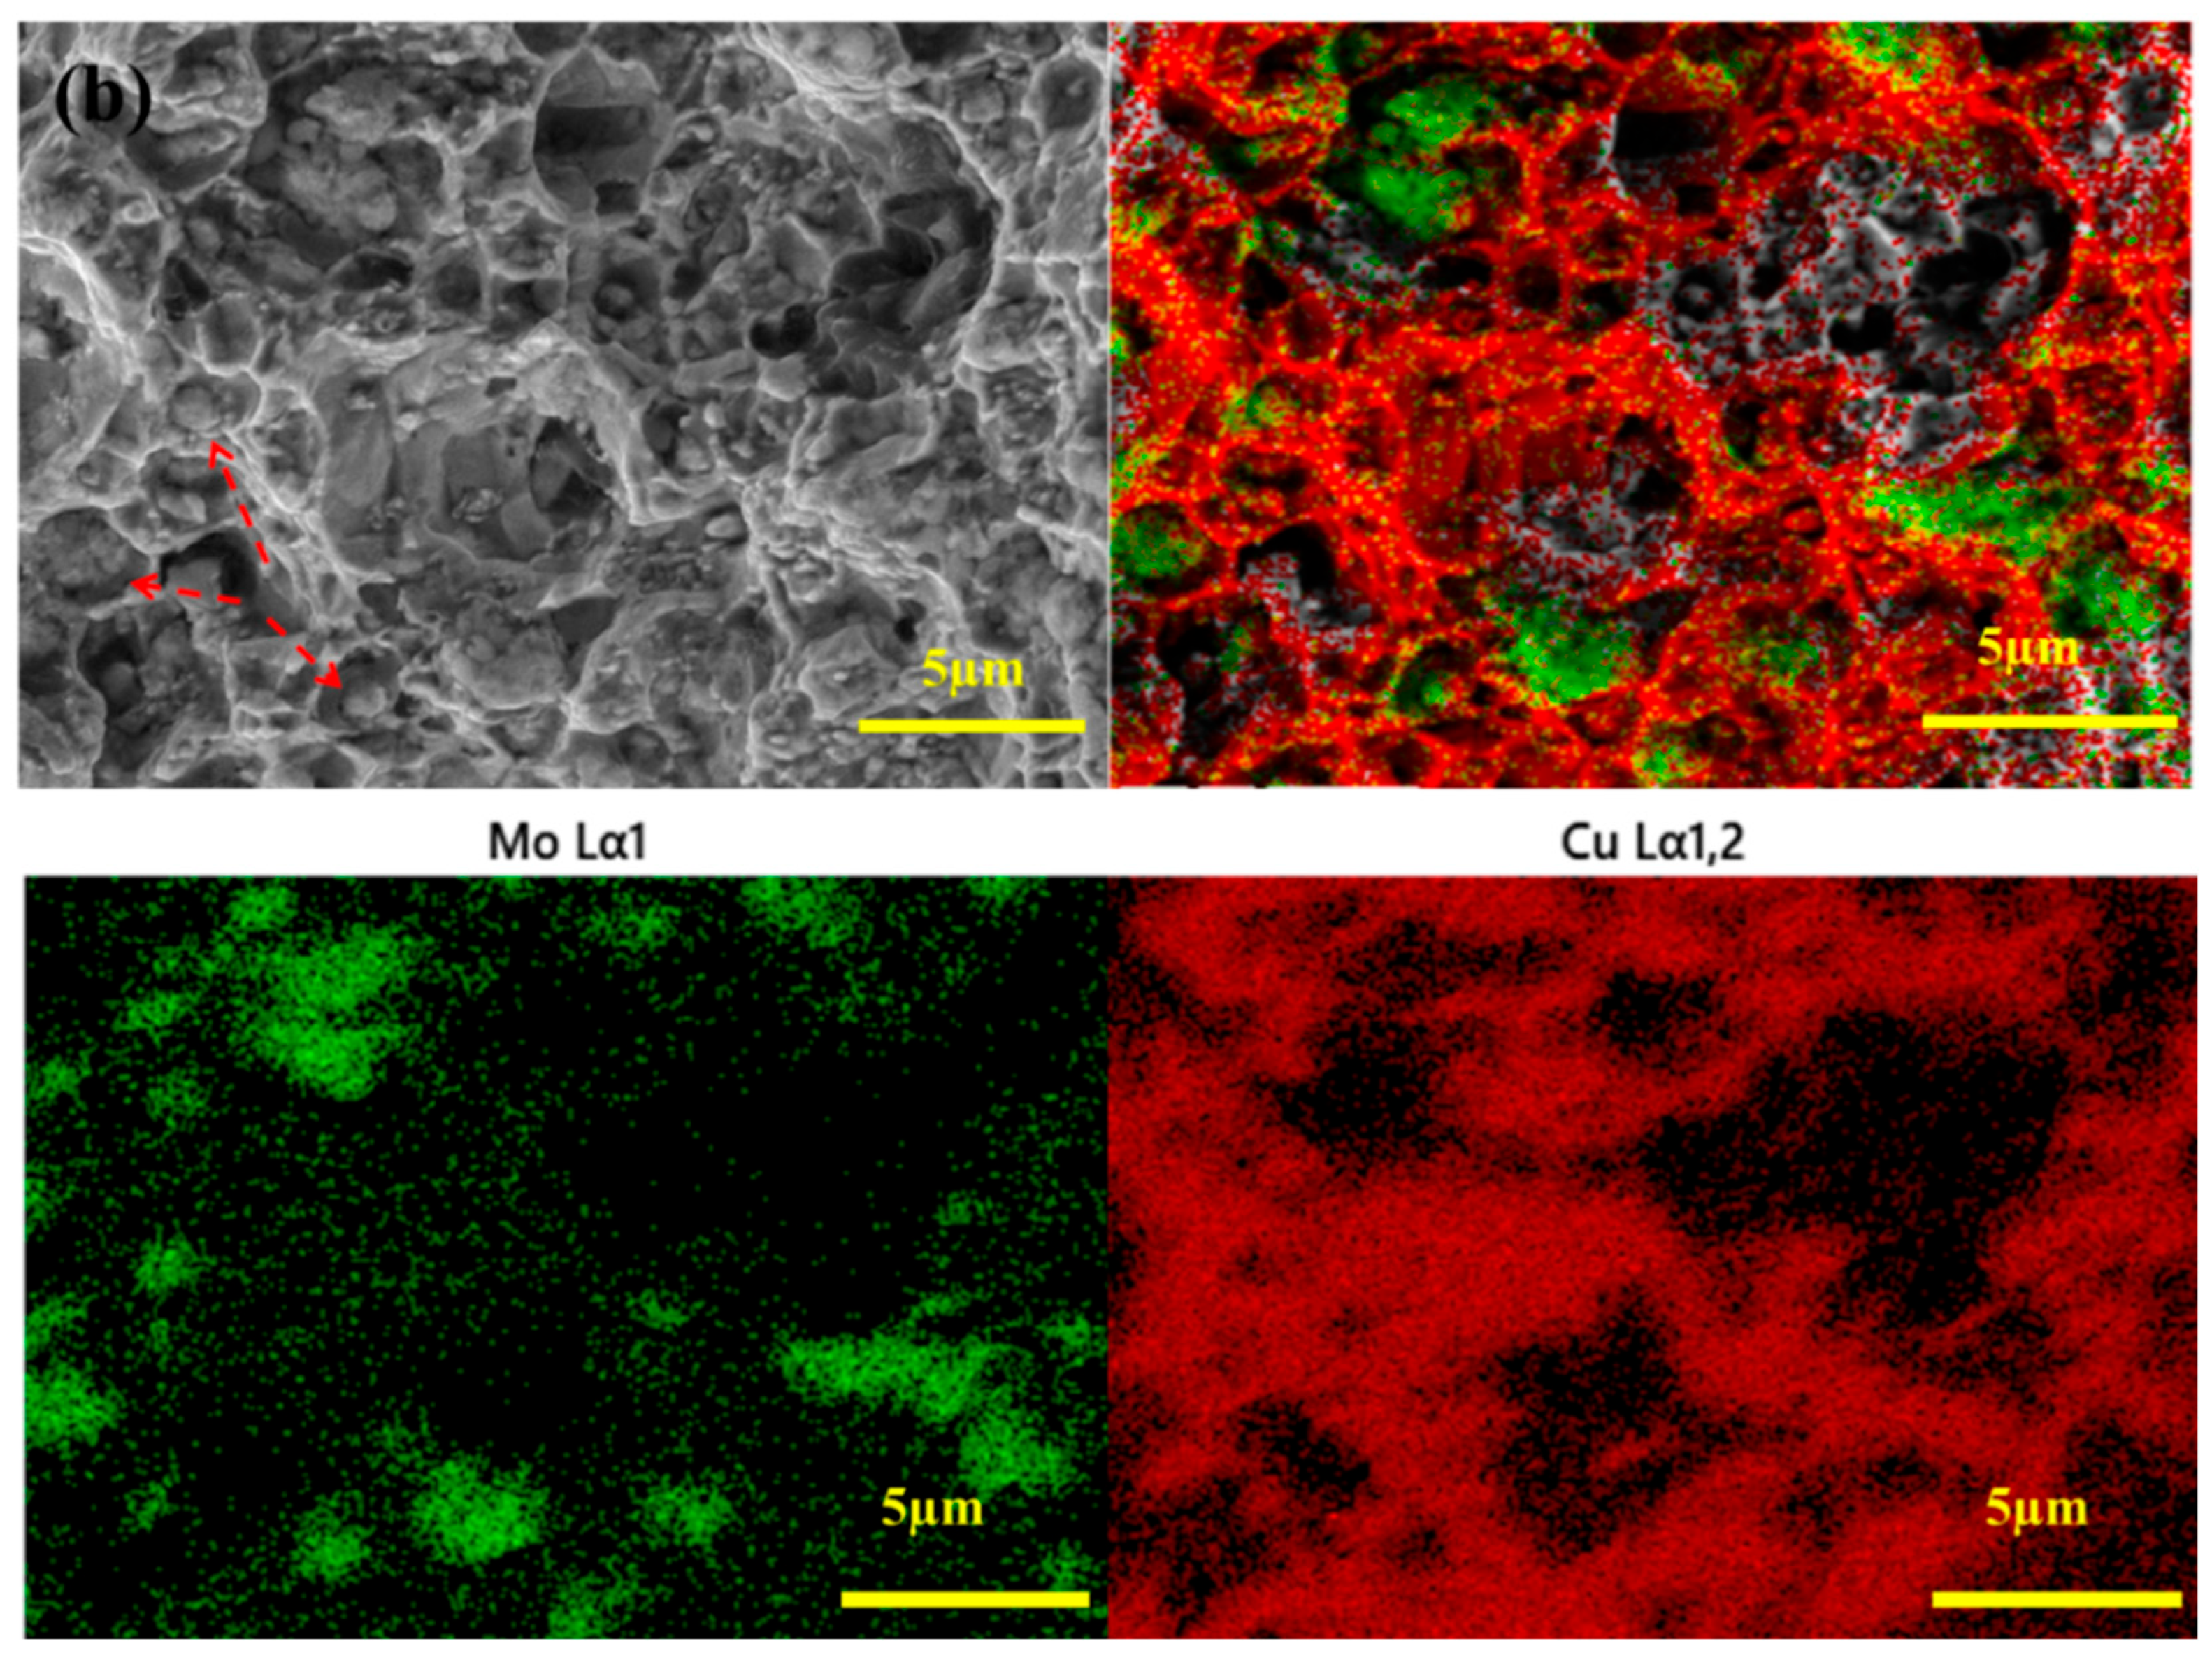
Figure 10. The high-magnification images are enlarged images of the area inside the yellow dotted rectangular frames in the images. Across the fracture surface of the CM5 composite, numerous large and deep equiaxed dimples are uniformly distributed. High-magnification imaging reveals that Mo particles are observed within the dimples on the fracture surface, indicating their role in the void nucleation during the fracture process (taking CM15 as an example).
Figure 10b shows the EDS element pattern of tensile fracture, which indicates that Cu matrix composites sintered by SPS have a typical ductile fracture. In general, the dimple size is influenced by the size and density of second-phase particles as well as the Cu matrix’s plastic deformation capacity. The dimples on the fracture gradually become smaller and shallower as Mo content rises to 15%. Nevertheless, when Mo content rises to 20%, a minor reduction in the material’s mechanical properties at room temperature is observed, the sintering performance deteriorates, the fracture mode changes to brittle fracture, and the cleavage fracture characteristics appear. The cleavage surface is observed in the fracture, as shown in the yellow dotted ellipse in the enlarged diagram. The reason for this behavior is that an increased number of Mo particles creates stress concentrations at the Mo/Cu interface, leading to localized cleavage fractures.
For the tensile fracture surfaces of the Cu-Mo composite, the inverse pole figure (IPF) images and pole figures were analyzed, as shown in
Figure 11. The relatively uniform color distribution in the pole figure indicates a certain degree of random grain orientation. The texture intensity distribution map adjacent to the pole figure reveals that the high intensity in pure Cu signifies a large number of grains with similar orientations. This concentration causes the fracture path to preferentially propagate along specific crystallographic planes, manifesting as a distinct preferred orientation in the pole figure. When considered together with
Figure 10, after adding Mo particles, the strongest texture strength in the Cu-Mo composite does not exceed 2.92, indicating a significant reduction in texture strength. Furthermore, dimples with Mo particles as their nucleation center are present on the fracture surface. The hard Mo particles disrupt the uniform plastic fracture process within the matrix, and as a result, the fracture path no longer follows the preferred orientation of the matrix. This leads to a decrease in texture strength. Although the plasticity and toughness of the material are lower than those of pure Cu, it still retains sufficient deformation capacity to satisfy the requirements of most applications, which is beneficial for ensuring the uniformity of the material’s plasticity and toughness.
Figure 12 presents the misorientation distribution maps of the Cu matrix of the Cu-Mo composite. As Mo content increases, the low-angle grain boundaries show a decreasing trend. Apart from this phenomenon, the peak shifts toward high-angle grain boundaries (concentrated in the 55°–60° range), and this is consistent with the observations from the tensile fracture IPF maps in
Figure 11. The grains on either side of the boundaries exhibit distinct orientations, and there is a certain proportion of high-angle grain boundaries. By correlating the data with the microscopic morphologies in
Figure 10, it can be concluded that the fracture mode is intergranular, with cracks propagating along the grain boundaries. Generally speaking, low-angle grain boundaries are mainly composed of dislocations. While high-angle grain boundaries are the strongest obstacles that hinder the movement of dislocations. This microstructural evolution, characterized by an increased proportion of high-angle boundaries, reflects the physical essence of mechanisms such as abnormal grain growth or continuous nucleation. It is the outcome of the synergistic interaction between grain boundary migration (driven by interface energy reduction) and the pinning effect exerted by Mo particles.
5. Conclusions
The CM15 Cu–Mo composite demonstrates exceptional promise for high-performance applications. With superior hardness (135 HV) and tensile strength (371 MPa), it resists arc erosion and ensures stable performance in electrical contacts. Its balanced strength–ductility and high thermal conductivity also make it suitable for thermal management, where it mitigates brittle fracture and enhances service life. These properties position CM15 as a compelling material for advanced power electronics. This study aims to fabricate a series of Cu-Mo composites with varying Mo contents via mechanical alloying and spark plasma sintering. By systematically investigating the correlation between microstructural evolution and mechanical properties—including hardness, compressive strength, and tensile behavior—the optimal composition for achieving a synergistic enhancement of both strength and ductility is identified. This work provides theoretical and experimental foundations for developing high-performance Cu-based composites capable of meeting the stringent mechanical demands of advanced industrial applications. The major research outcomes obtained in this study are presented as follows:
(1) Increasing Mo content leads to enhanced Vickers hardness and improved density in the Cu-Mo composite system. The improvement effect of CM15 is the most significant. The hardness and density reach 135 HV and 97.8%, which are 74% and 2.5% higher than those of pure Cu, respectively.
(2) The room-temperature compressive and tensile strengths of the Cu-Mo composite increase positively with increasing Mo content, peaking at 15 wt% with enhancements of 115% and 64.26%, respectively, compared to pure Cu.
(3) The tensile fracture analysis indicates that the fracture mode is a mixed type, including ductile fracture, crater cracking, and cleavage fracture. Most Mo particles are located inside dimples. At 15 wt% Mo content, the dimples become smaller and shallower, corresponding to optimal room-temperature mechanical properties. The EBSD results further confirm that Mo nanoparticle addition inhibits grain growth and refines the grain structure of Cu matrix.
(4) For Cu-Mo composite, the main strengthening mechanisms include fine-grain strengthening, dispersion strengthening, and grain boundary strengthening.

