Abstract
Graphene oxide (GO) is characterized by hydrophilic edges and a more hydrophobic planar/basic skeleton, which makes it has potential applications in the field of corrosion. But its hydrophobicity hinders its co-deposition behavior in the electrolyte. To improve the corrosion resistance of copper-based substrate, this article designs and successfully prepares a nickel/chromium graphene oxide (NiCr-GO) composite coating. The paper studied the influence and mechanism of GO addition on the microstructure and corrosion resistance of the coating. The results indicate that a crack network and nodular structure have formed on the surface of the coating. The coatings with different GO contents are composed of nickel, chromium single-phase, and Cr2Ni3 inter-metallic compounds, and the grain size does not significantly change. With the increase in GO, the corrosion resistance of the composite coating is enhanced, and the optimal GO addition amount is 0.750 g/L. GO chips may form physical barriers in the crystal structure defects of the coating, or passive films on the material surface. This dual mechanism is the fundamental reason for improving the corrosion resistance of NiCr-GO.
1. Introduction
Copper is widely used in electronics, aerospace, new energy vehicles, and other fields, but its own corrosion resistance is limited. Especially in harsh environment containing Cl−, it is prone to corrosion. Local corrosion such as pitting corrosion or selective corrosion may occur, together with wear, fatigue, and fracture, which will lead to the decrease in conductivity, mechanical strength, and electrochemical performance [1,2]. Therefore, it is necessary to prepare coatings on the surface of copper to improve its corrosion resistance. The electroplating of chromium and nickel–chromium on a metal surface is one of the commonly used protection methods [3]. In addition, second phase substances with excellent properties such as SiC [4], Al2O3 [5], ZrO2 [6], graphene oxide (GO), and so on, are usually added to form a composite coating and improve the corrosion resistance of materials.
In the field of corrosion, GO is extremely attractive. There are a large number of oxygen-containing functional groups, such as hydroxyl, carboxyl, and epoxy groups in GO [7]. So, in terms of structural characteristics, GO is amphipathic with hydrophilic edges and a more hydrophobic planar/basic skeleton [8], which can reduce the surface/interphase tension and it can be easily dispersed in solution and deposited into composite coatings by co-deposition [9,10]. So, GO has great potential and prospects [11].
As reported, Tseluikin et al. [12] prepared Ni-GO coating on steel. Compared with pure Ni, the coating produced refinement and the corrosion rate decreased by 1.7 times. Doğuş Özkan et al. [13] prepared Cr-GO coating on steel substrate. The results showed that the corrosion rate of chromium decreased, and the product can meet the needs of extreme corrosion protection such as the ocean. Arora [14] successfully prepared NiCo–GO composite coatings on low-carbon steel and found that the addition of GO markedly improved the coatings’ corrosion resistance.
In terms of alloy coating, NiCr-GO composite coating has attracted much attention from researchers because of its excellent comprehensive performance in strength, hardness, corrosion, and wear resistance. For example, Tseluikin [15] has successfully prepared NiCr-GO composite coating on low-carbon steel. It was found that the addition of GO particles increased the micro-hardness of the coating, and the uniformity of the coating was enhanced. The article analyzed that GO can dispersed and arranged parallel to the metal matrix, which can effectively block the diffusion of corrosive medium and showed corrosion resistance. Moreover, Duru et al. [16] successfully prepared NiCo-GO composite coating on medium carbon steel substrate by pulse electrodeposition technique. It was observed that GO was uniformly dispersed and the coating was tightly combined with GO, and it had excellent corrosion resistance.
The above research results showed that the alloy-GO coating significantly improved the corrosion resistance of the metal substrate, but most studies focused on low-carbon steel, iron-based, and other substrates, and there were few studies related to the coating on copper-based substrates.
Although there are documents studying NiMo-GO composite coating based on brass substrate [17,18], there are still some problems noted with the GO composite coating on the copper substrate, such as whether the addition of GO will lead to changes in the crystal structure of the plated metal and whether it will cause changes in electrochemical performance. At the same time, there is also a lack of research on the internal connection and evolution law between the change in GO gradient content and electrochemical performance. The mechanism of GO corrosion resistance also needs to be further discussed.
In this paper, NiCr and NiCr-GO composite coatings were prepared on copper substrate. A comparative study was conducted on their difference in morphology, structure, and phase composition. The effects of GO gradient content on the phase composition and grain size change law of composite coating were investigated, together with the effects of GO addition amount on the electrochemical properties of NiCr composite coating. The corrosion resistance mechanism of GO was also discussed.
2. Experiment
2.1. Electrodeposition
High density graphite plate (10 cm × 4 cm × 2 cm) and copper (5 cm × 4 cm × 0.1 cm) were used as the anode and cathode, respectively. The area of anode plate was 1–2 times that of cathode plate. An NiCr layer and NiCr-GO layer were prepared on copper substrate via double electrode direct current deposition. The bath was composed of CrCl3·6H2O, NiCl2·6H2O, H3BO3, KBr, HCOONa·2H2O, citrate, urea, saccharin, sodium dodecyl sulfate (SDS), and different contents of GO. The concentration of each component was shown in Table 1. The GO in the NiCr-GO composite coating was shown in Table 2. The electrolyte with different contents of GO was ultrasonically treated for 10 min before electrodeposition, so that GO was better dispersed in the solution. The pH of the system was controlled at 2.5–3, the stirring rate was set to 300 rpm, the reaction was maintained at room temperature for 1.5 h, and the current density was controlled at 20 A·dm−2.

Table 1.
Plating bath composition used for NiCr.
Table 2.
GO in NiCr-GO composite coating.
2.2. Characterization
Bruker’s D8 X-ray diffractometer (Bruker, Billerica, MA, USA) used in this paper was set at a test voltage of 40 kV, Cukα-ray, a scanning step was 0.03°, and a diffraction angle range in 5–90°. The surface morphology of the coating was observed via scanning electron microscopy (SEM), and the composition of the coating was analyzed via energy dispersive X-ray spectroscopy (EDS). The changes in GO before and after electrodeposition were characterized via an IS50 infrared spectrometer (Nicolet, Waltham, MA, USA). The three-electrode system was adopted, with the coating as the working electrode, the area was 1 cm2, the auxiliary electrode was platinum electrode, and the reference electrode was saturated calomel electrode. A total of 3.5 wt% sodium chloride solution was used as electrolyte for corrosion test. This experiment referred to the national standard JB/T 7901-1999 [19]. The corrosion potential (Ecorr) and self-corrosion current density (Icorr) were measured using the Tafel polarization method. Tests were performed on an Interface 1000 electrochemical workstation (Gamry Instruments, Warminster, PA, USA). Corrosion current density was determined from Tafel polarization curves using the linear extrapolation method to evaluate the coating’s corrosion resistance. A three-electrode configuration was employed: the specimen served as the working electrode, a platinum electrode as the counter electrode, and a saturated calomel electrode (SCE) as the reference. The electrolyte was an aqueous 3.5 wt% NaCl solution. The scan rate for the Tafel measurements was set to 5 mV·s−1. The equivalent circuit of the composite coating was simulated by electrochemical impedance spectroscopy (EIS), and then the electrochemical impedance data was fitted by curve fitting. Electrochemical impedance spectroscopy (EIS) was conducted on the Interface 1000, with an AC perturbation amplitude of 5 mV and a frequency range of 100 mHz to 100 kHz.
3. Results and Discussion
3.1. The Infrared Spectra of NiCr-GO Coating
The FT-IR spectra of GO before and after electrodeposition were shown in Figure 1. For original GO, information about different groups were as follows: the broad peak at 3418 cm−1 corresponded to the stretching vibration of O-H; 1737 cm−1 and 1672 cm−1 corresponded to C=O, C=C, respectively; 1402 cm−1 corresponded to the in-plane deformation vibration of -OH, the peak at 1091 cm−1 corresponded to the epoxy group, and the peak at 605 cm−1 represented the bending vibration of C-H [20]. Those results gave the existence of various active group (aromatic hydrocarbon C=C, carboxyl C=O, hydroxyl O-H, and epoxy group C-O-C) in GO.
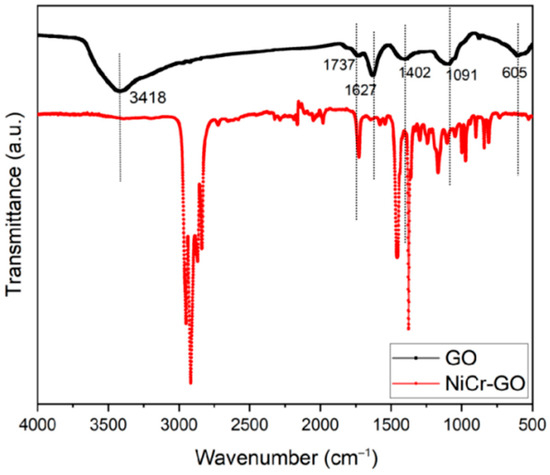
Figure 1.
Infrared spectra of Ni/Cr-GO composite coating and GO.
In addition, we can also see from the figure that the peak at 3418 cm−1 in the NiCr-GO composite coating did not appear, indicating that O-H disappeared. The peak intensity at 1737 cm−1 was significantly weakened, indicating that some carboxyl groups were reduced, and the new alkane C-H stretching vibration peak appeared at 2900–2800 cm−1, indicating that the reduction reaction of GO occurred during the electrodeposition process. On the other hand, the C=C stretching vibration peak at 1672 cm−1 still exists; apparently, the epoxy group can still be observed at 1091 cm−1, indicating that GO is successfully embedded in the coating and participates in the co-deposition process [21]. It is clear that GO is successfully deposited into the coating during the electrodeposition process, forming a NiCr-GO composite coating, and partial reduction reaction occurs during the electrodeposition. The FT-IR results is consistent with the literature [22].
3.2. Coating Microstructure (SEM) and Porosity
3.2.1. Coating Microstructure (SEM)
Figure 2a showed the micro-morphology of NiCr, NiCr-GO1, NiCr-GO2, Ni Cr-GO3, NiCr-GO4, and NiCr-GO5 coatings. The red arrows indicated the positions of microcracks within the coating, and the white lines denoted the microcracks within the coating. The surface of the coating was uniform and densely packed. The microcracks in the coating showed the characteristic micro-morphology of metal chromium deposition. Microcracks were the result of stress release in the coating. At the same time, the existence of microcracks reduced the residual stress of the coating.
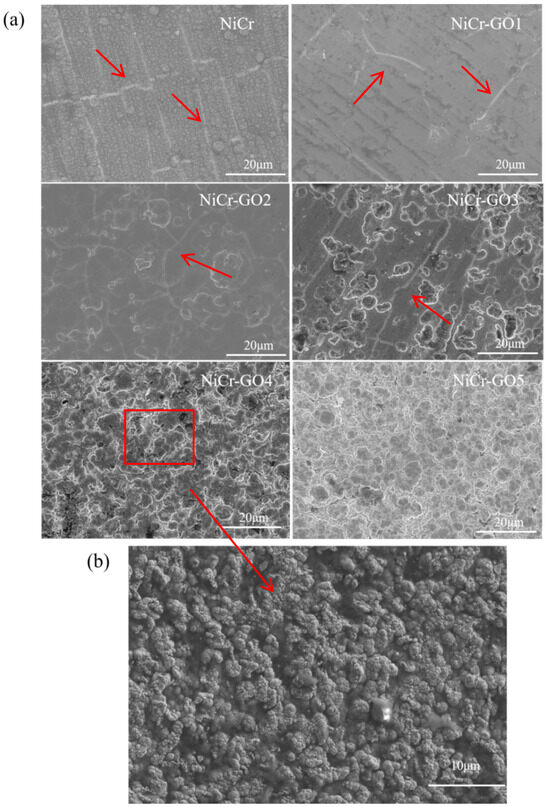
Figure 2.
(a) SEM micrographs of NiCr and NiCr-GO composite coatings. (b) GO sheets in composite coatings.
There was a balance between the microcrack and the corrosion resistance of the coating. More cracks will cause the corrosion solution to be easily immersed in the substrate. When the cracks were too few, the residual stress of the coating was higher and the corrosion tendency increases. Through the observation of SEM images, it was found that with the change in GO addition concentration, the microcracks will also change. The cracks of NiCr coating was more. From NiCr-GO1 to NiCr-GO5, with the increase in GO concentration, the cluster structure material increased, the coating roughness increased, the crack gradually decreased, and the coating was denser. This maybe because during the electrodeposition process, one end of GO was closely connected with the coating metal, resulting in nodular protrusions at this position. Due to the tip discharge effect, nodular substances were accumulated, which increased the surface roughness of the coating. The cracks were the fewest until NiCr-GO4. Therefore, within the appropriate range of GO addition concentration, the cracks will also decrease, forming a dense and uniform coating. Once the threshold value of GO addition was exceeded, GO was unevenly dispersed in the plating solution, resulting in a composite into the NiCr coating in an agglomerated form, which reduced the uniformity of its distribution in the coating and made the coating surface rougher [23].
The EDS spectrum analysis results of the coating were shown in Table 3. It can be seen that as the concentration of GO in the electrolyte increased from 0.125 g/L to 1.000 g/L, the carbon content in the coating increased from 6.27 wt% to 24.35 wt%, indicating that the concentration of GO increased. The content of GO in the coating also increased accordingly, indicating that GO was successfully embedded in the composite coating. However, when the addition amount of GO was 1.000 g/L, the carbon content did not change much, indicating that excessive GO accumulated in the electroplating solution.
Table 3.
Element composition of NiCr and NiCr-GO coatings.
Figure 2b showed the SEM image of the NiCr-GO4 composite coating covering the entire area of GO, and other composite coatings also showed the addition of GO sheets, which also confirmed the successful incorporation of GO into the composite coating.
The microscopic cross-section results of NiCr and NiCr-GO1~NiCr-GO5 coatings were shown in Figure 3. It can be seen that the coating tightly bonded to the substrate without holes and gaps. The thickness of the NiCr and NiCr-GO1~NiCr-GO5 coatings was 118.0 μm, 115.8 μm, 110.2 μm, 102.3 μm, 108.0 μm, and 116.8 μm, respectively. Obviously, there was not much difference in the thickness, indicating that with the increase in graphene content in the coating, the thickness of the coating did not change after it was embedded in the coating, which proved that it was filled in the crystal structure defects, such as microcracks. This was consistent with the change in microcracks in the micro-surface morphology in Figure 3, which further proved that the microstructure was denser.
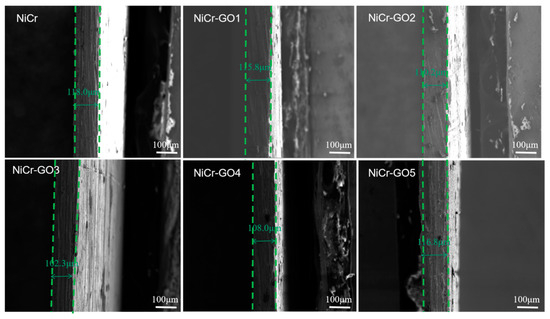
Figure 3.
Cross-section SEM images of NiCr and NiCr-GO coatings with different contents of GO.
3.2.2. Coating Porosity
The porosity reflected the compactness of the coating, which directly affected the protective ability of the coating [24]. Therefore, the porosity can determine the barrier ability of the coating to the corrosion solution. According to GB/T 17721-1999 [25], corrosion testing was performed using the wet filter-paper method. After drying, porosity was determined based on the characteristics and number of the spots. The coating porosity was calculated as follows:
where is the number of spots on the test filter paper and is the area of the coating under test (cm2). The test plating area of this paper was 10 cm2, and the test and calculation results are shown in Table 4.
Table 4.
Porosity of composite coating.
It can be seen from the table that the porosity of NiCr coating was as high as 5/cm2, and the structure was porous and loose, which cannot effectively prevent the immersion of corrosion solution. After adding GO, the porosity of NiCr-GO1~NiCr-GO5 decreased, indicating that the addition of GO filled the pores of NiCr alloy, increased the compactness of the coating, and improved the physical and chemical layer energy of NiCr composite plating. Moreover, through the position of the sample point, it can be seen that the pores are distributed on the surface of the whole specimen of the NiCr coating, which prevented the solution penetration ability from being weak, while the pores of the NiCr-GO1~NiCr-GO5 composite coating were basically concentrated on the edge of the coating. Owing to the current-edge effect [26], the coating exhibited rough, loosely adhered edges but a dense center that prevents solution penetration, effectively hindering corrosion and providing excellent resistance.
3.3. Coating Structure and Phase Composition (XRD)
The XRD test results of NiCr and NiCr-GO1~NiCr-GO5 coatings were shown in Figure 4. It can be seen from the figure that all the coatings form crystalline alloys, and there were elemental Ni, Cr phases, and Cr2Ni3 intermetallic compounds. Therefore, the addition of GO did not change the phase composition of the coating. The obtained XRD patterns were compared with the standard cards, and the diffraction peaks of 2θ = 43.5°, 50.6°, and 74.5° in the NiCr coating were obtained, corresponding to the (111), (200), and (220) crystal planes of the Cr phase, respectively, which were consistent with the pure chromium structure spectrum of the face-centered cubic. The diffraction peaks 2θ = 44.3°, 51.6°, 76.1° correspond to the (111), (200), and (220) planes of the face-centered cubic nickel structure, and the preferred orientation plane was the (111) crystal plane.
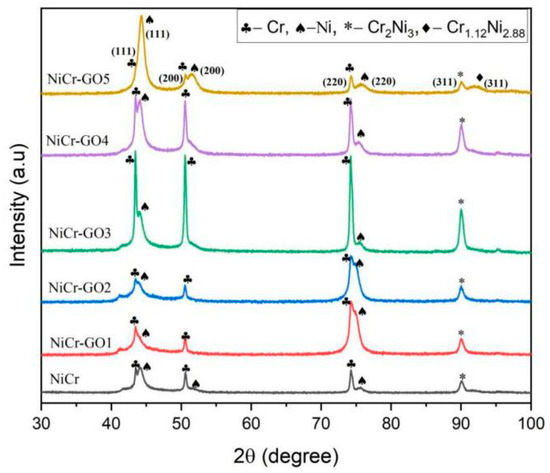
Figure 4.
XRD patterns of NiCr and NiCr-GO composite coatings.
With the addition of different contents of GO in electrodeposition, the diffraction peak intensity will change accordingly. At the same time, it can be observed that when the GO content is 0.750 g/L, the diffraction peak of NiCr-GO4 composite coating was sharper than that of NiCr coating, indicating that the addition of GO can improve the crystallinity of the material. The diffraction peak of GO did not appear in the diagram, mainly because the oxygen-containing functional groups of GO destroy the regular layered structure of graphite, resulting in a significant decrease in the intensity of the (001) crystal plane diffraction peak. The X-ray fluorescence effect of nickel was strong, and its intensity was much higher than the diffraction signal of GO [27], resulting in the diffraction peak of GO cannot be distinguished in the spectrum. This was consistent with what is described in the literature [28].
The average grain size obtained by the peak FWHM of Ni, Cr, and Cr2Ni3 according to the Scherrer formula [29]. The calculation results were shown in Figure 5.
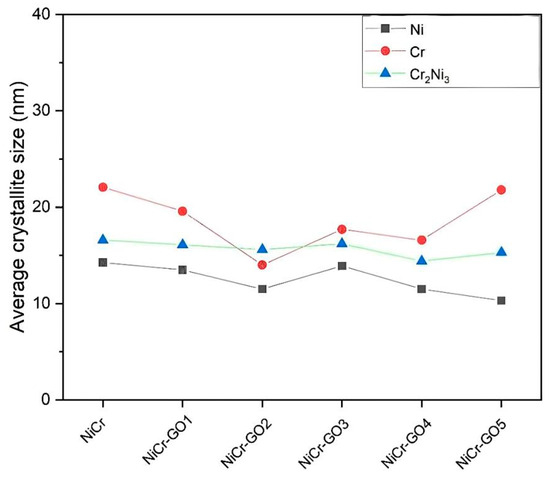
Figure 5.
Average grain size of NiCr and NiCr-GO composite coatings.
The crystallite size of the Cr phase decreased with decreasing GO content and fluctuated within a certain range. The size variation in Ni and Cr2Ni3 was small, and it can be considered that GO had a limited effect on the grain size of these two phases. The changes in grain size indicated that the physical and mechanical properties had been improved, which was mainly attributed to the heterogeneous nucleation and growth retardation/grain boundary pinning effect of GO sheets during electrodeposition [30].
In summary, different contents of GO were embedded in the coating, which did not change the phase composition and structure of NiCr-GO1~NiCr-GO5 alloy, and can produce a denser coating with the effect of improving the coating’s corrosion resistance.
3.4. Electrochemical Analysis
3.4.1. Tafel Polarization Curve
The polarization curves of NiCr and NiCr-GO1~NiCr-GO5 coatings were tested, respectively. The test solution was 3.5 wt% NaCl solution. The test solution was stabilized for 30 min before the test to obtain a stable open circuit potential (OCP). The polarization curve results of different samples were shown in Figure 6. No passivation behavior was observed in the anodic polarization curve, which reflected that metal ions were continuously dissolved into the solution and limited or did not form stable metal hydroxides and oxides.
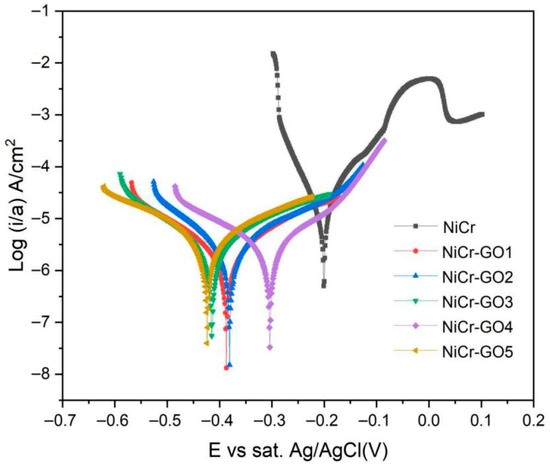
Figure 6.
Tafel polarization curves of NiCr and NiCr-GO composite coatings.
The Tafel curve was fitted to derive the values of corrosion current density (icorr), corrosion potential (Ecorr) and corrosion rate (CR). It can be seen from Table 5 that the corrosion current density and corrosion rate of NiCr-GO1~NiCr-GO5 coatings were lower than those of NiCr coatings, indicating that the corrosion resistance of NiCr-GO composite coatings was better than that of NiCr coatings. The corrosion current density of the NiCr coating was 13.24 μA/cm2, and the corrosion rate reached 6.048 mpy. The corrosion current density of the composite coating decreased sharply after adding GO, and with the increase in GO content, until the NiCr-GO4 coating was reduced to 3.235 μA/cm2, the corrosion rate reached the minimum. Continuing to increase GO will lead to an increase in corrosion rate because of the uneven distribution of high concentration GO in the coating. Therefore, when the addition amount of GO was 0.750 g/L, the corrosion resistance of the NiCr composite coating was the best, and a further increase in GO could not have a positive effect on the corrosion behavior of the coating.
Table 5.
Electrochemical parameters of NiCr and NiCr-GO composite coatings.
3.4.2. Electrochemical Impedance Spectroscopy (EIS)
The AC impedance test was conducted on the composite coating in order to further study the dynamic behavior of the coating electrodeposition process. Figure 7 showed the EIS spectra (Nyquist diagram and Bode diagram) of different samples. From the Nyquist diagram of Figure 7a, it was found that the diameter of the capacitor ring of the nickel–chromium coating is the smallest. When GO was added as the second phase to the coating, the diameter of the semi-circular capacitor ring gradually increased until NiCr-GO4 and then decreased. The capacitive loop with a larger diameter indicated a higher impedance value. The increase in the impedance value indicated that the corrosion rate of the nickel–chromium coating decreased with the increase in GO. Therefore, the corrosion resistance of NiCr-GO1~NiCr-GO5 composite coating was better than that of NiCr coating, and NiCr-GO4 had the highest corrosion resistance.
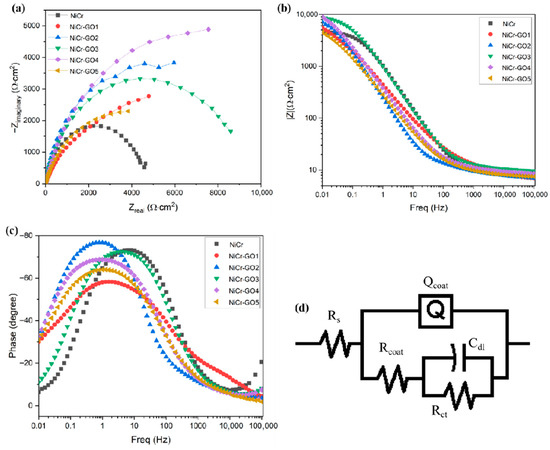
Figure 7.
(a): Nyquist diagram of NiCr and NiCr-GO composite coatings; (b,c): Bode diagram of NiCr and NiCr-GO composite coatings; (d) electrochemical equivalent circuit (EEC) simulating EIS data.
Figure 7b is the frequency–impedance Bode diagram, and the impedance |Z| value at low frequency indicated the corrosion resistance of the coating. It can be seen from the figure that the impedance values of NiCr and NiCr-GO1~NiCr-GO5 coatings at 0.01 Hz frequency were 4.607 kΩ·cm2, 5.5430 kΩ·cm2, 7.083 kΩ·cm2, 8.747 kΩ·cm2, 9.002 kΩ·cm2, and 4.481 kΩ·cm2, respectively. The increase in GO made the impedance of NiCr coating increase significantly until Ni-GO4 decreases. The high impedance of NiCr-GO4 indicated the formation of a compact protective coating. The decrease in impedance value caused by the addition of higher GO concentration was due to the dissolution of the coating in the solution due to the decrease in density caused by corrosion products or GO agglomeration.
It can be observed from the phase angle–frequency curve in Figure 7c that by adding GO to the coating, the main peak of the NiCr coating shifted to a lower frequency value, which was due to the formation of a protective layer of corrosion products on the surface of the coating and became a barrier to the penetration of corrosive ions (Cl−). In addition, the high phase angle indicated that the surface has better uniformity. At medium frequency, the maximum phase angle of NiCr coating was about 70°, and the maximum phase angle was about 74° after adding GO. Therefore, the Bode diagram verified the uniformity and compactness of the coating in a corrosive environment.
Figure 7d is the equivalent circuit diagram fitted by the Nyquist drawing software Zsimp (version 3.60). From the diagram, it was known that EEC had two RC circuits, in which Qcoat and Rcoat were high-frequency components and Cdl and Rct were low-frequency components. Considering the non-uniformity of the coating surface, the capacitor element was replaced by a constant phase element (CPE, Qcoat). The impedance of CPE was expressed as follows:
where Yo was the CPE constant, j was the imaginary constant, and n was the CPE index (ideal resistor n = 0; ideal capacitor n = 1, ideal inductor n = −1). Table 6 showed the values of Rs, Qcoat, Rcoat, Cdl, Rct, χ2, and polarization resistance Rp (Rcoat + Rct). The value of χ2 indicated the accuracy of fitting the EEC model, Rs the solution resistance between the reference electrode and the working electrode surface; rcoat the coating resistance; qcoat the capacitance provided by the coating; cdl the electric double layer capacitor; and rct the charge transfer resistance. The high Rp coating was more resistant to corrosion in the Cl− environment, showing a lower corrosion rate [31]. Therefore, RP can also be expressed as an inverse relationship with the icorr value. From the table, it can be seen that the RP value of the obtained NiCr-GO composite coating was greater than that of the NiCr coating, and with the increase in GO concentration, until the NiCr-GO4 reached the highest 14,639.17 Ωcm2, and then decreased. This showed that the NiCr-GO coating with a GO concentration of 0.750 g/L had the highest corrosion resistance, and further addition of GO will only produce the opposite effect.
Table 6.
Qdl, RP, n, and χ2 values obtained by the equivalent circuit of EIS data simulation.
3.4.3. Static Immersion Corrosion Test
In order to understand the long-term corrosion resistance of the coating, the NiCr coating and NiCr-GO composite coating samples were subjected to a 20-day full immersion test in 3.5 wt% NaCl solution. Figure 8 was the macroscopic view of the coating after 20 days of immersion. The red circles indicated the corrosion points on the coating. It can be seen from the figure that after 20 days of corrosion immersion, the corrosion points on the surface of the nickel–chromium coating were densely distributed, indicating that the coating has been seriously corroded at this time. Compared with NiCr coating, the corrosion degree of NiCr-GO composite coating was shallow, and with the increase in GO, the corrosion resistance was gradually enhanced. Until the addition amount of GO was 0.750 g/L, there was no corrosion on the surface of the coating, and only green products existed on the edge. It was mainly due to the edge effect that the edge of the coating was loose and rough, which leaded to the corrosion of the solution. Continue to increase the GO content, the green corrosion products diffused from the edge to the center, indicating that excessive GO agglomeration made the coating uneven, so that GO did not play a good protective role [32].
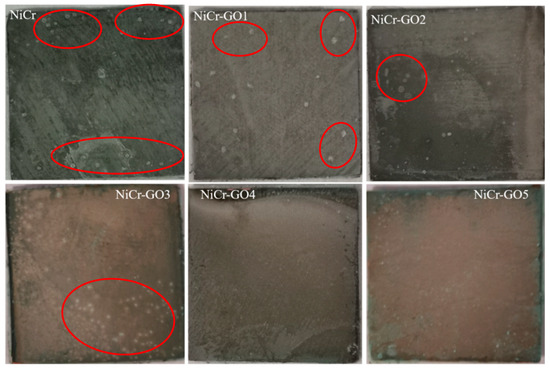
Figure 8.
The macroscopic morphology of the test piece after etching in 3.5 wt% NaCl solution for 20 days.
Figure 9 was the corresponding SEM electron microscope image after corrosion. The red arrows pointed to the location of microracks and the red circles high lighted the corrosion points. It can be observed from the figure that the surface of NiCr coating was covered with a large number of corrosion products. The corrosion products of NiCr-GO1~NiCr-GO5 coating were less, and NiCr-GO4 had no obvious corrosion phenomenon. When the addition amount of GO was 1.000 g/L, the coating has corrosion holes and serious hole corrosion occurs. Therefore, the addition of an appropriate amount of GO can provide long-term effective corrosion protection for the coating.
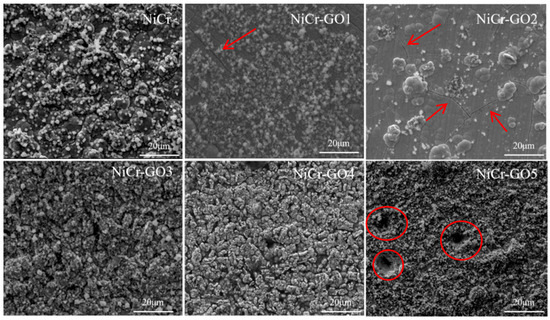
Figure 9.
The microstructure of the samples after full etching in 3.5 wt% NaCl solution for 20 days.
In summary, the pure NiCr coating has dense pitting corrosion, and the corrosion resistance was extremely poor; after the addition of GO, the corrosion was significantly reduced, and the corrosion resistance increased first and then decreased with the GO content. When the GO was 0.750 g/L, the effect was the best, and the surface was basically non-corrosive, only a small amount of green products were produced due to the edge effect. Continue to increase to 1.000 g/L, due to the uneven coating caused by GO agglomeration, the corrosion developed from the edge to the center and pitting corrosion occurs. Therefore, an appropriate amount of GO can provided long-term corrosion resistance protection for NiCr coating.
3.5. The Double Coupling Mechanism of GO Corrosion Resistance
3.5.1. The Barrier Corrosion Resistance Mechanism of GO
The corrosion path of NiCr-GO was shown in Figure 10. Firstly, GO was embedded into the metal coating by electrodeposition, showing a single layer of flakes, mainly distributed in crystal defects, such as microcracks, which effectively reduced the porosity, made the coating denser, and the corrosion solution was not easy to penetrate. At the same time, the appropriate amount of GO improved the cracks in the coating structure, resulting in an optimal balance between cracks and corrosion resistance. Secondly, when the flake GO coated on the surface of the substrate metal, a physical barrier formed on the surface of the coating. According its high chemical inertness and impermeability, the barrier played a protective role and delayed the corrosion process when it was eroded by the corrosion solution [33]. Compared with NiCr coating, due to the superposition of flake GO in NiCr-GO coating, the invasion path of corrosion solution was greatly increased, which can effectively prevent the immersion of corrosion substances for a long time, thus protecting the matrix metal.
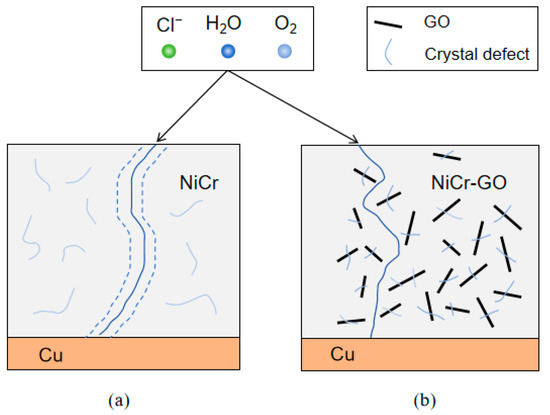
Figure 10.
Corrosion path diagram of NiCr (a) and NiCr-GO (b) composite coatings.
The research showed that the appropriate amount of GO can significantly improve the corrosion resistance of nickel–chromium coating. When the addition amount of GO was 0.750 g/L, the corrosion resistance was the best. After exceeding the threshold, the corrosion resistance decreased significantly. This was mainly because there was a current coupling between GO and the metal phase without changing the average grain size, resulting in an increase in the corrosion rate. Excessive GO was embedded in the coating, which increased the microcracks. Under the action of the corrosion solution, the metal at the microcracks acted as an anode, and GO acted as a cathode to form a corrosion galvanic cell, thereby accelerating the corrosion of the metal.
The open circuit potential (OCP) test of NiCr coating and GO confirms the current coupling between GO and metal phase. The test results were shown in Figure 11. From the diagram, it can be clearly seen that the open circuit potential value of GO relative to NiCr coating was significantly positive shift, indicating that the embedding of GO can increase the corrosion stability of the alloy coating. Compared with NiCr electrode, GO cathode is prominent. When the low concentration of GO is doped, the relative area ratio of anode (metal phase)/cathode (GO phase) was very large, and the polarization characteristics were “large anode-small cathode”. Once the GO content exceeds the critical value, it will increase the cathode area (GO phase) and reduce the anode area, resulting in a significant increase in the cathode GO area compared with the coating anode area. Corrosion followed the “area principle” [34], that was, “the anodic dissolution rate in the galvanic couple is proportional to the cathode area”, so that the corrosion rate increased due to current coupling.
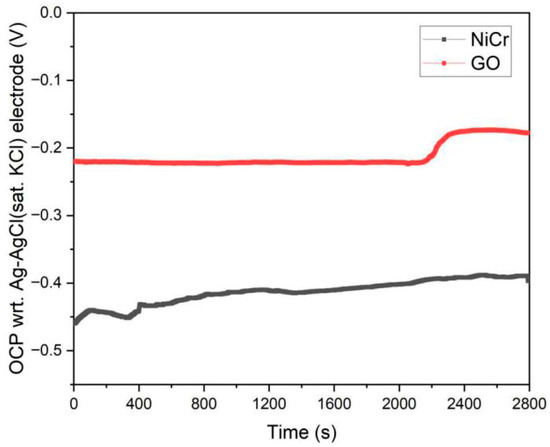
Figure 11.
OCP measurement curve of NiCr coating and GO.
3.5.2. Corrosion Resistance Mechanism of Passivation Film
The corrosion resistance of NiCr-GO was better than that of NiCr coating, which was mainly due to the redox reaction on the electrode. In the anodic polarization range, Cr and Ni were more electrochemically active than NiCr intermetallic compounds in Cl-medium. The corrosion products formed on the surface of the coating are Ni (OH)2, Cr(OH)3, and more stable oxides NiO, Cr2O3, and hypochlorite. As the main source of oxide and hydroxide functional groups, GO in NiCr-GO composite coating can increase the trend of forming oxide corrosion products. The corrosion products form a passivation film on the surface of the coating, which can be further used as a barrier to prevent the penetration of corrosive media, thereby improving the corrosion resistance of the composite coating. The schematic diagrams of the formation of surface passivation films on NiCr and NiCr-GO were shown in Figure 12a,b. The possible reactions were as follows:
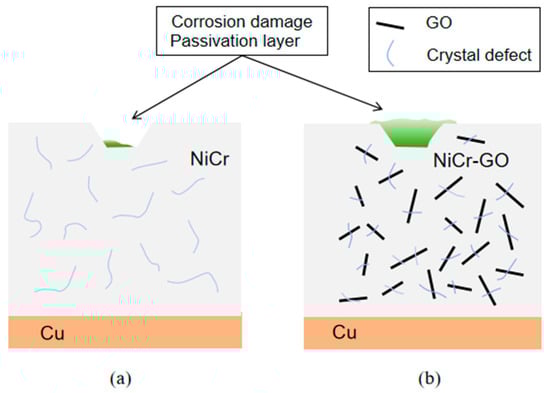
Figure 12.
The formation of passive film of NiCr (a) and NiCr-GO (b) composite coating.
Cathodic reaction:
Anodic reaction:
According to the above reaction, the corrosion was divided into three stages. (1) In the first stage, a passivation film forms on the coating surface. Discontinuous structural defects within this film serve as active sites for electrochemical corrosion. At this time, although the coating was in contact with the corrosive medium Cl−, the passivation film was not broken, the metal was not dissolved, and no oxidation reaction occurred. (2) The second stage: With the increase in time, the corrosion medium was competitively adsorbed with oxygen. Nickel and chromium metals were first dissolved into Ni2+ and Cr3+, and then react with O2, H2O, and Cl− in the air to form corrosion products such as oxides. Due to the embedding of microcrack GO in the NiCr-GO coating, the anode solubility was enhanced, and the formation rate of the product was much larger than the rate at which the product diffuses from the coating–electrolyte interface to the corrosion solution, and the net accumulation of oxides occurs in the defect. (3) The third stage: With the continuous accumulation of the product, the coating was dissolved and the structural defects were completely covered by the product, forming a new protective layer, and the corrosion was controlled by diffusion.
4. Conclusions
- (1)
- NiCr coating and NiCr-GO composite coating with different amounts of GO were successfully prepared on copper substrate by direct current electroplating method.
- (2)
- NiCr-GO coatings consisted of Ni phase, Cr phase, and Cr2Ni3 intermetallic compound. The addition of GO did not change the phase texture of the NiCr alloy coating, and had no obvious impacts on the crystallite size of Ni and Cr2Ni3. There was not much difference in the NiCr and NiCr-GO coatings thickness.
- (3)
- The corrosion resistance of NiCr-GO coating was better than that of NiCr. When the addition amount of GO was 0.750 g/L, NiCr-GO coating showed the best corrosion resistance.
- (4)
- GO achieved improvement of corrosion resistance through “dual coupling” mechanism. Firstly, as a “physical barrier”, GO sheets constructed multi-level detour penetration paths in crack/porosity and superimpose a surface shielding layer, significantly delaying the intrusion of Cl−. Secondly, owning to rich oxygen-containing functional groups in GO, oxide corrosion products were easier to form, which could act as a surface passivation film to prevent the penetration of corrosive media.
Author Contributions
Conceptualization, W.G. and T.C.; Methodology, W.G., Y.Z. and T.C.; Software, X.R.; Validation, Y.Z., X.R. and T.C.; Formal analysis, Y.Z. and X.R.; Investigation, Y.Z. and X.R.; Data curation, W.G.; Writing—original draft, Y.Z.; Writing—review & editing, W.G. and T.C.; Visualization, X.R.; Project administration, W.G. and T.C. All authors have read and agreed to the published version of the manuscript.
Funding
This research received no external funding.
Institutional Review Board Statement
Not applicable.
Informed Consent Statement
Not applicable.
Data Availability Statement
The original contributions presented in this study are included in the article. Further inquiries can be directed to the corresponding author.
Conflicts of Interest
The authors declare no conflict of interest.
References
- Ding, C.; Tai, Y.; Wang, D.; Tan, L.; Fu, J. Superhydrophobic composite coating with active corrosion resistance for AZ31B magnesium alloy protection. Chem. Eng. J. 2019, 357, 518–532. [Google Scholar] [CrossRef]
- Qian, H.; Xu, D.; Du, C.; Zhang, D.; Li, X.; Huang, L.; Deng, L.; Tu, Y.; Mol, J.M.C.; Terryn, H.A. Dual-action smart coatings with a self-healing superhydrophobic surface and anti-corrosion properties. J. Mater. Chem. A 2017, 5, 2355–2364. [Google Scholar] [CrossRef]
- Oduoza, C.F.; Hingley, S. Electrochemical evaluation of corrosion resistance of chromium plated nickel and copper tin alloys. A comparative study. J. Electrochem. Sci. Eng. 2018, 8, 227–239. [Google Scholar] [CrossRef]
- He, X.; Hou, B.; Cai, Y.; Li, C.; Jiang, Y.; Wu, L. Electrodepositing behaviors and properties of nano Fe-Ni-Cr/SiC composite coatings from trivalent chromium baths containing compound carboxylate-urea system. J. Nanosci. Nanotechnol. 2013, 13, 4031–4039. [Google Scholar] [CrossRef]
- Tulio, P.C.; Carlos, I.A. Effect of SiC and Al2O3 particles on the electrodeposition of Zn, Co and ZnCo: II. Electrodeposition in the presence of SiC and Al2O3 and production of ZnCo–SiC and ZnCo–Al2O3 coatings. J. Appl. Electrochem. 2009, 39, 1305–1311. [Google Scholar] [CrossRef]
- He, X.Z.; Zhou, X.L.; Zhang, X.W.; Sun, X. Characterization of Cr-Ni-ZrO2 composite coatings electrodeposited from Cr(III) plating bath. Adv. Mater. Res. 2011, 239–242, 2733–2737. [Google Scholar] [CrossRef]
- Dimiev, A.M.; Ceriotti, G.; Metzger, A.; Kim, N.D.; Tour, J.M. Chemical mass production of graphene nanoplatelets in ~100% yield. ACS Nano 2016, 10, 274–279. [Google Scholar] [CrossRef] [PubMed]
- Nasrollahzadeh, M.; Babaei, F.; Fakhri, P.; Jaleh, B. Synthesis, characterization, structural, optical properties and catalytic activity of reduced graphene oxide/copper nanocomposites. RSC Adv. 2015, 5, 10782–10789. [Google Scholar] [CrossRef]
- Wang, Y.; Li, S.; Yang, H.; Luo, J. Progress in the functional modification of graphene/graphene oxide: A review. RSC Adv. 2020, 10, 15328–15345. [Google Scholar] [CrossRef]
- Liu, C.; Wei, D.; Huang, X.; Mai, Y.; Zhang, L.; Jie, X. Electrodeposition of Co–Ni–P/graphene oxide composite coating with enhanced wear and corrosion resistance. J. Mater. Res. 2019, 34, 1726–1733. [Google Scholar] [CrossRef]
- Sharma, N.; Yadav, D.; Hassan, M.I.; Srivastava, C.M.; Majumder, S. A review on exploring the impact of graphene oxide-based nanomaterials on structures and bioactivity of proteins. J. Mol. Liq. 2024, 404, 124980. [Google Scholar] [CrossRef]
- Tseluikin, V.; Dzhumieva, A.; Yakovlev, A.; Tikhonov, D.; Tribis, A.; Strilets, A.; Lopukhova, M. Electrodeposition and properties of composite Ni coatings modified with multilayer graphene oxide. Micromachines 2023, 14, 1747. [Google Scholar] [CrossRef]
- Ozkan, D.; Erarslan, Y.; Kincal, C.; Gurlu, O.; Yagci, M.B. Wear and corrosion resistance enhancement of chromium surfaces through graphene oxide coating. Surf. Coat. Technol. 2020, 391, 125595. [Google Scholar] [CrossRef]
- Arora, S.; Srivastava, C. Microstructure and corrosion properties of NiCo–graphene oxide composite coatings. Thin Solid Films 2019, 677, 45–54. [Google Scholar] [CrossRef]
- Tseluikin, V.; Dzhumieva, A.; Yakovlev, A.; Mostovoy, A.; Lopukhova, M. Electrodeposition of graphene oxide modified composite coatings based on nickel–chromium alloy. Crystals 2021, 11, 415. [Google Scholar] [CrossRef]
- Duru, E.; Akyuz, M.; Gultekin, D.; Algul, H.; Akbulut, H.; Uysal, M. Reciprocating dry sliding friction and wear behavior of graphene oxide-reinforced Ni–Co composite coatings. Diam. Relat. Mater. 2025, 154, 112210. [Google Scholar] [CrossRef]
- Li, B.; Chen, S.; Xiao, M.; Tu, Q.; Xu, Z.; Feng, T.; Zhang, Z.; Yuan, Z.; Xu, C.; Gong, L.; et al. Preparation of Ni–Mo/GO composite coatings with strengthened mechanical properties and enhanced corrosion resistance. Surf. Coat. Technol. 2024, 477, 130404. [Google Scholar] [CrossRef]
- Sassi, W.; Zrelli, R.; Hihn, J.-Y.; Berçot, P.; Rezrazi, M.; Ammar, S. Silicate dip-coat mechanism as an inhibitor against copper dissolution into alkaline chloride media. J. Bio-Tribo-Corros. 2020, 6, 50. [Google Scholar] [CrossRef]
- JB/T 7901-1999; Metallic Materials—Laboratory Uniform Corrosion Test—Full Immersion Method. China Machinery Industry Press: Beijing, China, 1999.
- Brusko, V.; Khannanov, A.; Rakhmatullin, A.; Dimiev, A.M. Unraveling the infrared spectrum of graphene oxide. Carbon 2024, 229, 119507. [Google Scholar] [CrossRef]
- Li, S.; Song, G.; Zhang, Y.; Fu, Q.; Pan, C. Graphene-reinforced Zn–Ni alloy composite coating on iron substrates by pulsed reverse electrodeposition and its high corrosion resistance. ACS Omega 2021, 6, 13728–13741. [Google Scholar] [CrossRef] [PubMed]
- Mohamed, M.E.; Mekhaiel, P.S.; Mahgoub, F.M. Construction of superhydrophobic graphene-based coating on steel substrate and its ultraviolet durability and corrosion resistance properties. Sci. Rep. 2023, 13, 590. [Google Scholar] [CrossRef]
- Yang, B.; Zhang, P.; Wang, G.; Wang, A.; Chen, X.; Wei, S.; Xie, J. Effect of graphene oxide concentration in electrolyte on corrosion behavior of electrodeposited Zn–electrochemical reduction graphene composite coatings. Coatings 2019, 9, 758. [Google Scholar] [CrossRef]
- Walsh, F.C.; Ponce de Leon, C.; Kerr, C.; Court, S.; Barker, B.D. Electrochemical characterisation of the porosity and corrosion resistance of electrochemically deposited metal coatings. Surf. Coat. Technol. 2008, 202, 5092–5102. [Google Scholar] [CrossRef]
- GB/T 17721-1999; Test for Porosity of Metallic Coatings: Ferric Reagent Test [S]. Standards Press of China: Beijing, China, 1999.
- Sun, C.; Hu, G.; Cao, L.; Pan, T.; Guo, C.; Xia, Y. Ni/graphene coating for enhanced corrosion resistance of metal foam flow field in simulated PEMFC cathode environment. ACS Omega 2024, 9, 29797–29804. [Google Scholar] [CrossRef] [PubMed]
- Leenaers, A.J.G.; Vrakking, J.J.A.M.; de Boer, D.K.G. Glancing incidence X-ray analysis: More than just reflectivity. Spectrochim. Acta Part B 1997, 52, 805–812. [Google Scholar] [CrossRef]
- Zhang, Y.; Zhou, W.; Yu, H.; Feng, T.; Pu, Y.; Liu, H.; Xiao, W.; Tian, L. Self-templated synthesis of nickel silicate hydroxide/reduced graphene oxide composite hollow microspheres as highly stable supercapacitor electrode material. Nanoscale Res. Lett. 2017, 12, 325. [Google Scholar] [CrossRef] [PubMed]
- Klug, H.P.; Alexander, L.E. X-Ray Diffraction Procedures: For Polycrystalline and Amorphous Materials, 2nd ed.; Wiley: Hoboken, NJ, USA, 1974. [Google Scholar]
- Sherwin, C.; Raju, K.; Meena, P.L.; Tyagi, R.; Mohan, C. Optimization of current density for nickel–chromium (Ni–Cr) alloy coating on copper: An experimental approach. Discov. Appl. Sci. 2025, 7, 324. [Google Scholar] [CrossRef]
- Wang, S.; Zhang, J.; Gharbi, O.; Vivier, V.; Gao, M.; Orazem, M.E. Electrochemical impedance spectroscopy. Nat. Rev. Methods Primers 2021, 1, 41. [Google Scholar] [CrossRef]
- Zhang, Q.; Liu, X.; Jiang, Y.; Xiao, F.; Wang, W.; Duan, J. Graphene research progress in the application of anticorrosion and antifouling coatings. Crystals 2025, 15, 541. [Google Scholar] [CrossRef]
- Wang, N.; Gao, H.; Zhang, J.; Kang, P. Effect of graphene oxide/ZSM-5 hybrid on corrosion resistance of waterborne epoxy coating. Coatings 2018, 8, 179. [Google Scholar] [CrossRef]
- Mansfeld, F. Area relationships in galvanic corrosion. Corrosion 1971, 27, 436–442. [Google Scholar] [CrossRef]
Disclaimer/Publisher’s Note: The statements, opinions and data contained in all publications are solely those of the individual author(s) and contributor(s) and not of MDPI and/or the editor(s). MDPI and/or the editor(s) disclaim responsibility for any injury to people or property resulting from any ideas, methods, instructions or products referred to in the content. |
© 2025 by the authors. Licensee MDPI, Basel, Switzerland. This article is an open access article distributed under the terms and conditions of the Creative Commons Attribution (CC BY) license (https://creativecommons.org/licenses/by/4.0/).