1. Introduction
Aero-engine blades are core components, and their surface inspection is crucial to engine performance. However, reflection issues caused by material properties and structural features affect measurement accuracy. This section identifies the problem, introduces Multi-Exposure Image Fusion technology, and lays the groundwork for proposing the ELANet method.
As a core component of the engine, the surface morphology accuracy of the aero-engine blade directly determines the operational efficiency and safety performance of the engine. Moreover, the integrity and uniformity of the blade surface coating (such as thermal barrier coating, TBC—a high-performance coating usually made of ceramic-based materials, which blocks heat transfer from high-temperature gas to reduce the blade substrate temperature and ensures stable operation of the blade under extreme working conditions) are the key to ensuring the blade’s high-temperature resistance and corrosion resistance. Therefore, the precise detection of blade surface morphology and coating state is a core link in the production, manufacturing, operation and maintenance of aero engines [
1].
From the perspective of materials, the composite materials (engineered materials composed of two or more materials with different properties, e.g., titanium alloys with light weight and high strength, superalloys with resistance to extreme corrosion) used in the blade body have strong metallic luster and high reflectivity on the surface. However, the refractive index of the thermal barrier coating is significantly different from that of the substrate, the light is prone to multiple reflections at the interface between the coating and the substrate, forming local high-brightness reflective areas. From a structural perspective, due to the curved geometric shape of the aero-engine blades, the reflection angles of light at different positions vary, resulting in uneven light intensity entering the camera aperture. This can cause severe reflection on the captured aero-engine blade images [
2], leading to a lack of image information on the aero-engine blades and low measurement efficiency of the blades. More seriously, it will affect the working efficiency and safety of the aircraft [
3].
Although the existing blade measurement technologies have high-precision measurement capabilities, they all rely on clear surface image data as the measurement benchmark [
4]. Image quality issues caused by reflection will directly reduce the accuracy of the measurement data, not only affecting the judgment accuracy of key links such as coating thickness detection and surface defect identification, but also may lead to maintenance decision-making deviations due to misjudgment. Increase the risk of engine operation [
5].
To reconstruct an image with missing information into one with complete information, multi-exposure image fusion (MEF, a technology that collects images of the same blade under different exposure parameters, extracts valid details from each image, and fuses them into a high-quality image with balanced brightness and complete details) can be used [
6]. Therefore, multi-exposure image fusion technology plays a key role in the measurement of aero-engine blades [
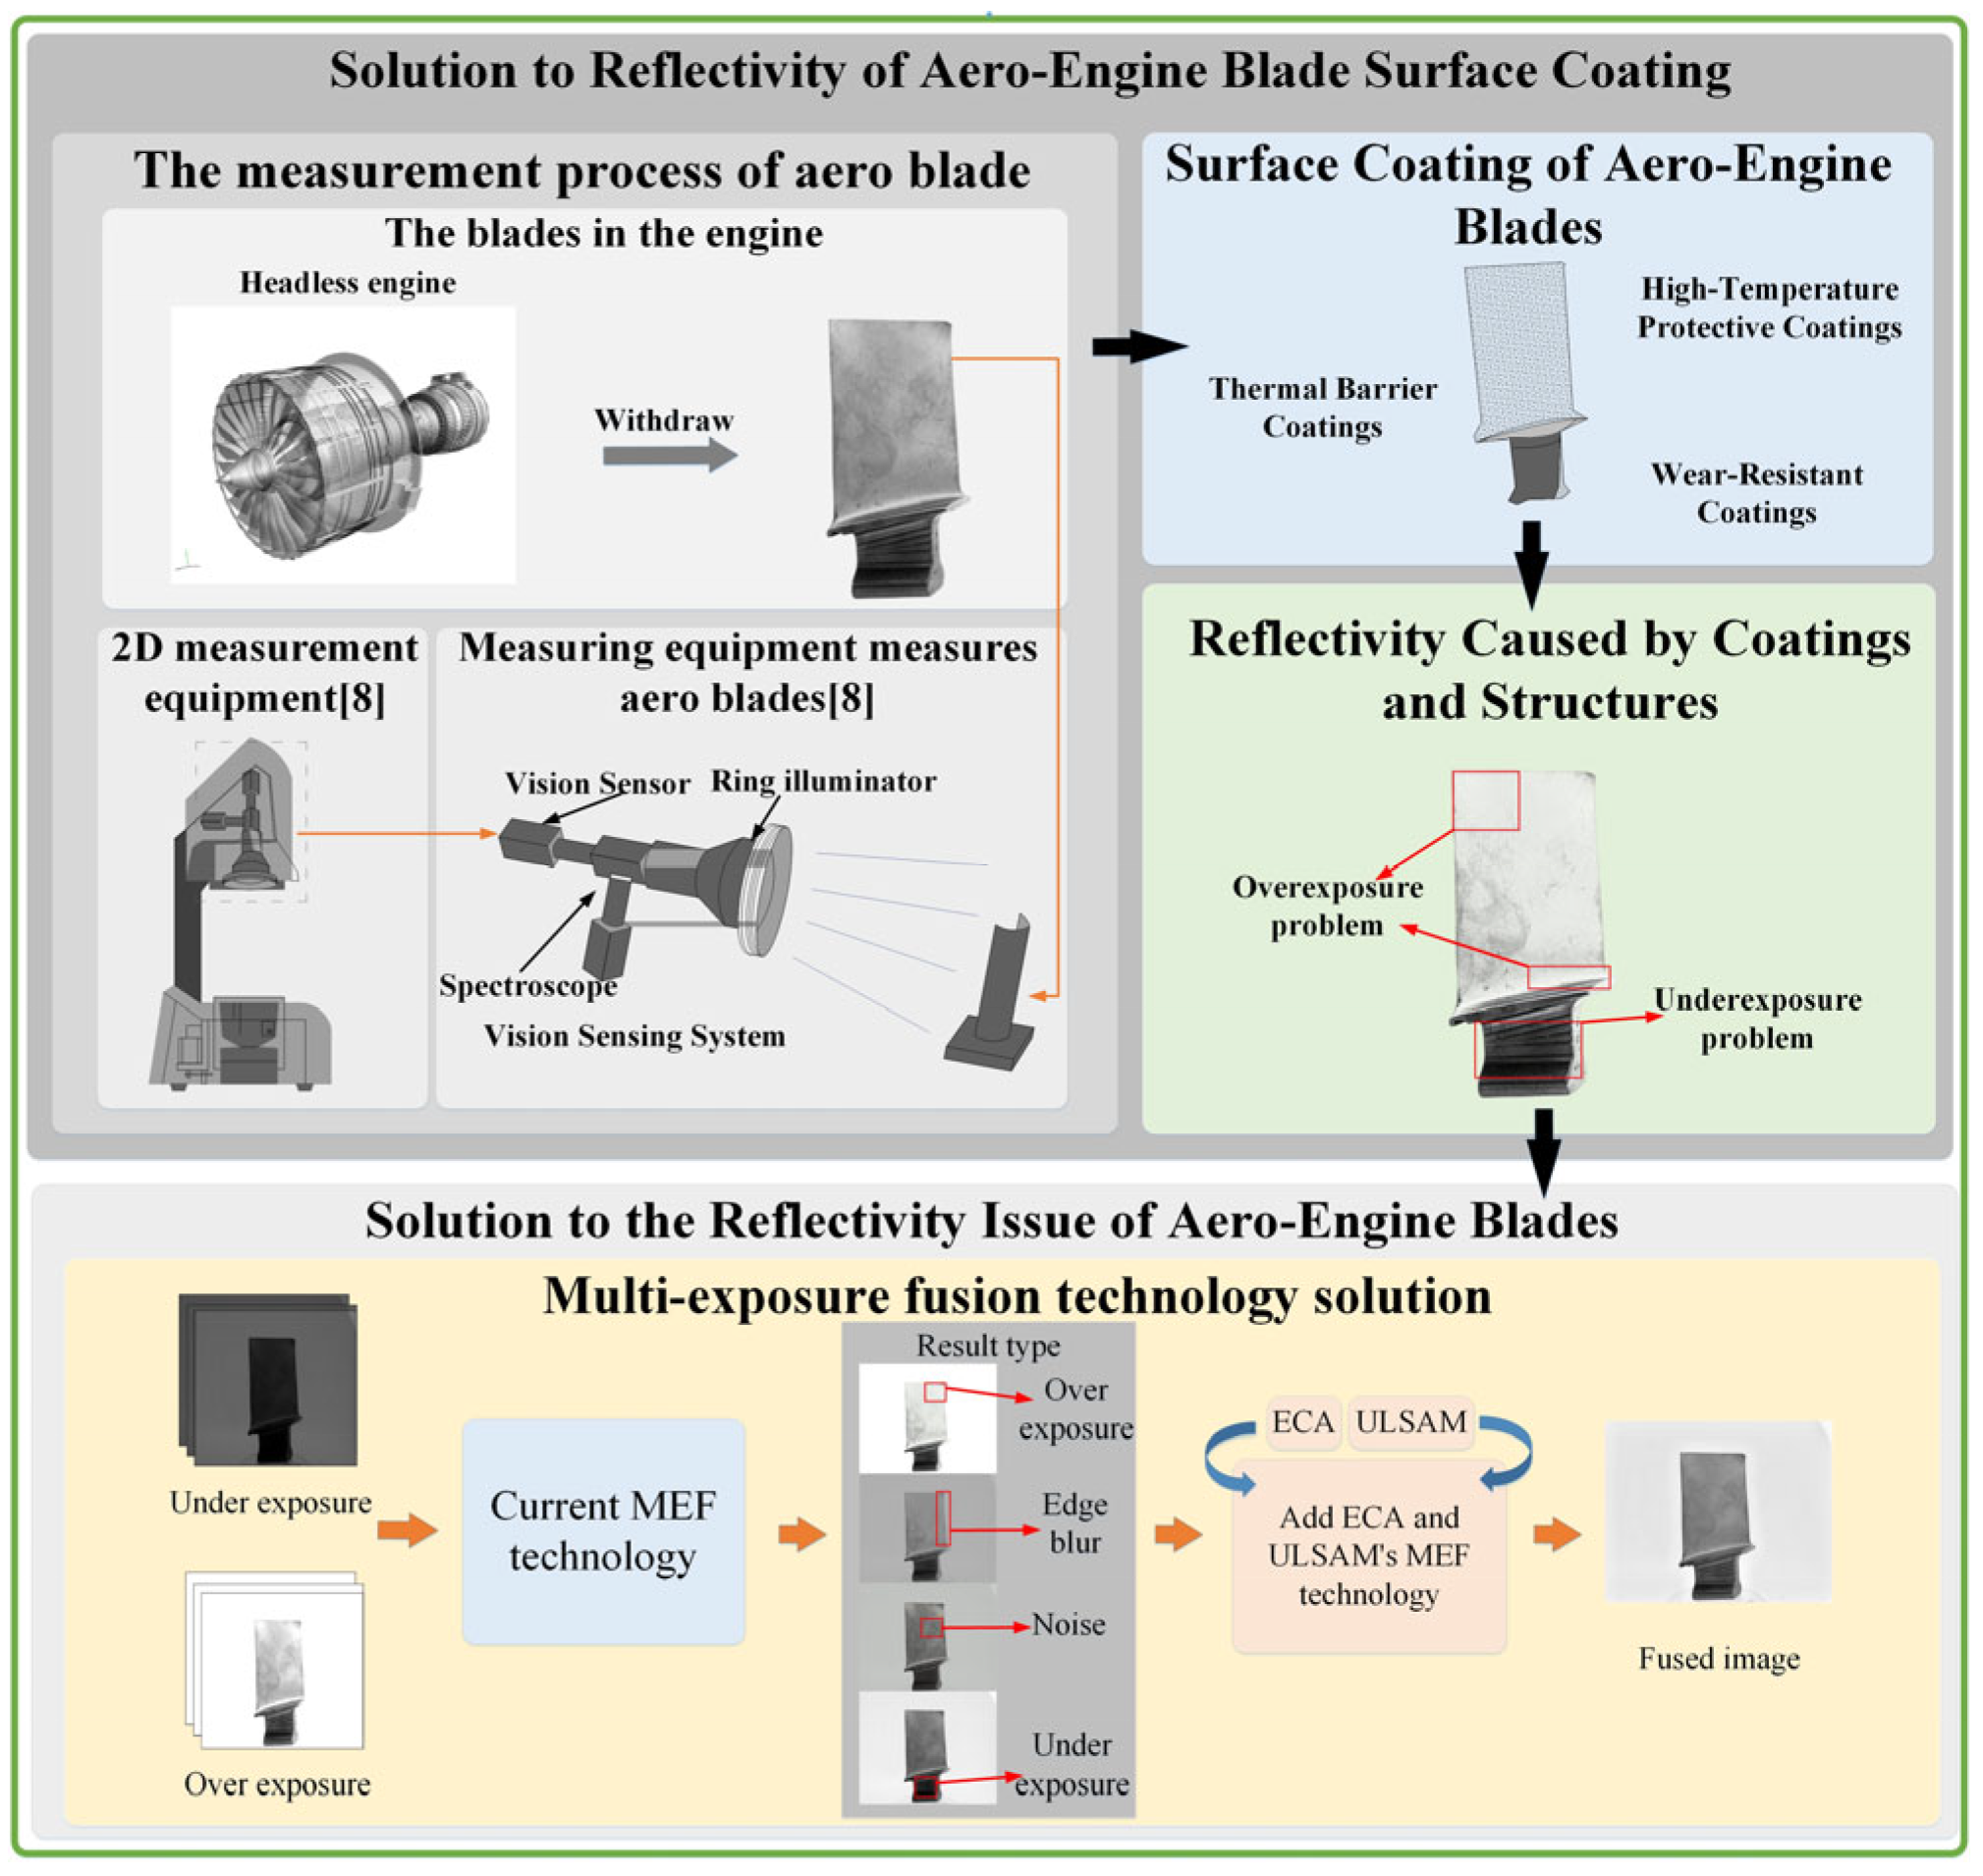
7]. The value and significance of multi-exposure image fusion technology in the measurement of aero-engine blades are shown in
Figure 1. among them, 2D measurement equipment and Measuring equipment measures aero blades are used for reference [
8].
Short exposure time will result in underexposure of the dark areas in the image, while long exposure time will cause overexposure of the bright areas. During the process of the exposure sequence of aero-engine blades changing from low to high, both overexposure and underexposure phenomena will interfere with blade measurement, thereby affecting the production and maintenance efficiency of the blades and causing serious problems such as low work efficiency and safety hazards. Multi-exposure processing technology has practical application value in appearance measurement and can efficiently generate high-quality images.
Multi-exposure image processing technology is an advanced method in the field of image processing. By fusing images at different exposure levels, it enriches detailed information and expands the dynamic range. To achieve an efficient reflection suppression effect, it is necessary to select images that can complement each other under different exposure Settings, avoiding the introduction of excessive noise or the masking of details due to overexposure or underexposure. Prioritize images with low noise, balanced local contrast and brightness to preserve scene details and textures. The core objective is to achieve comprehensive brightness coverage, thereby enhancing image quality to support precise measurement [
9].
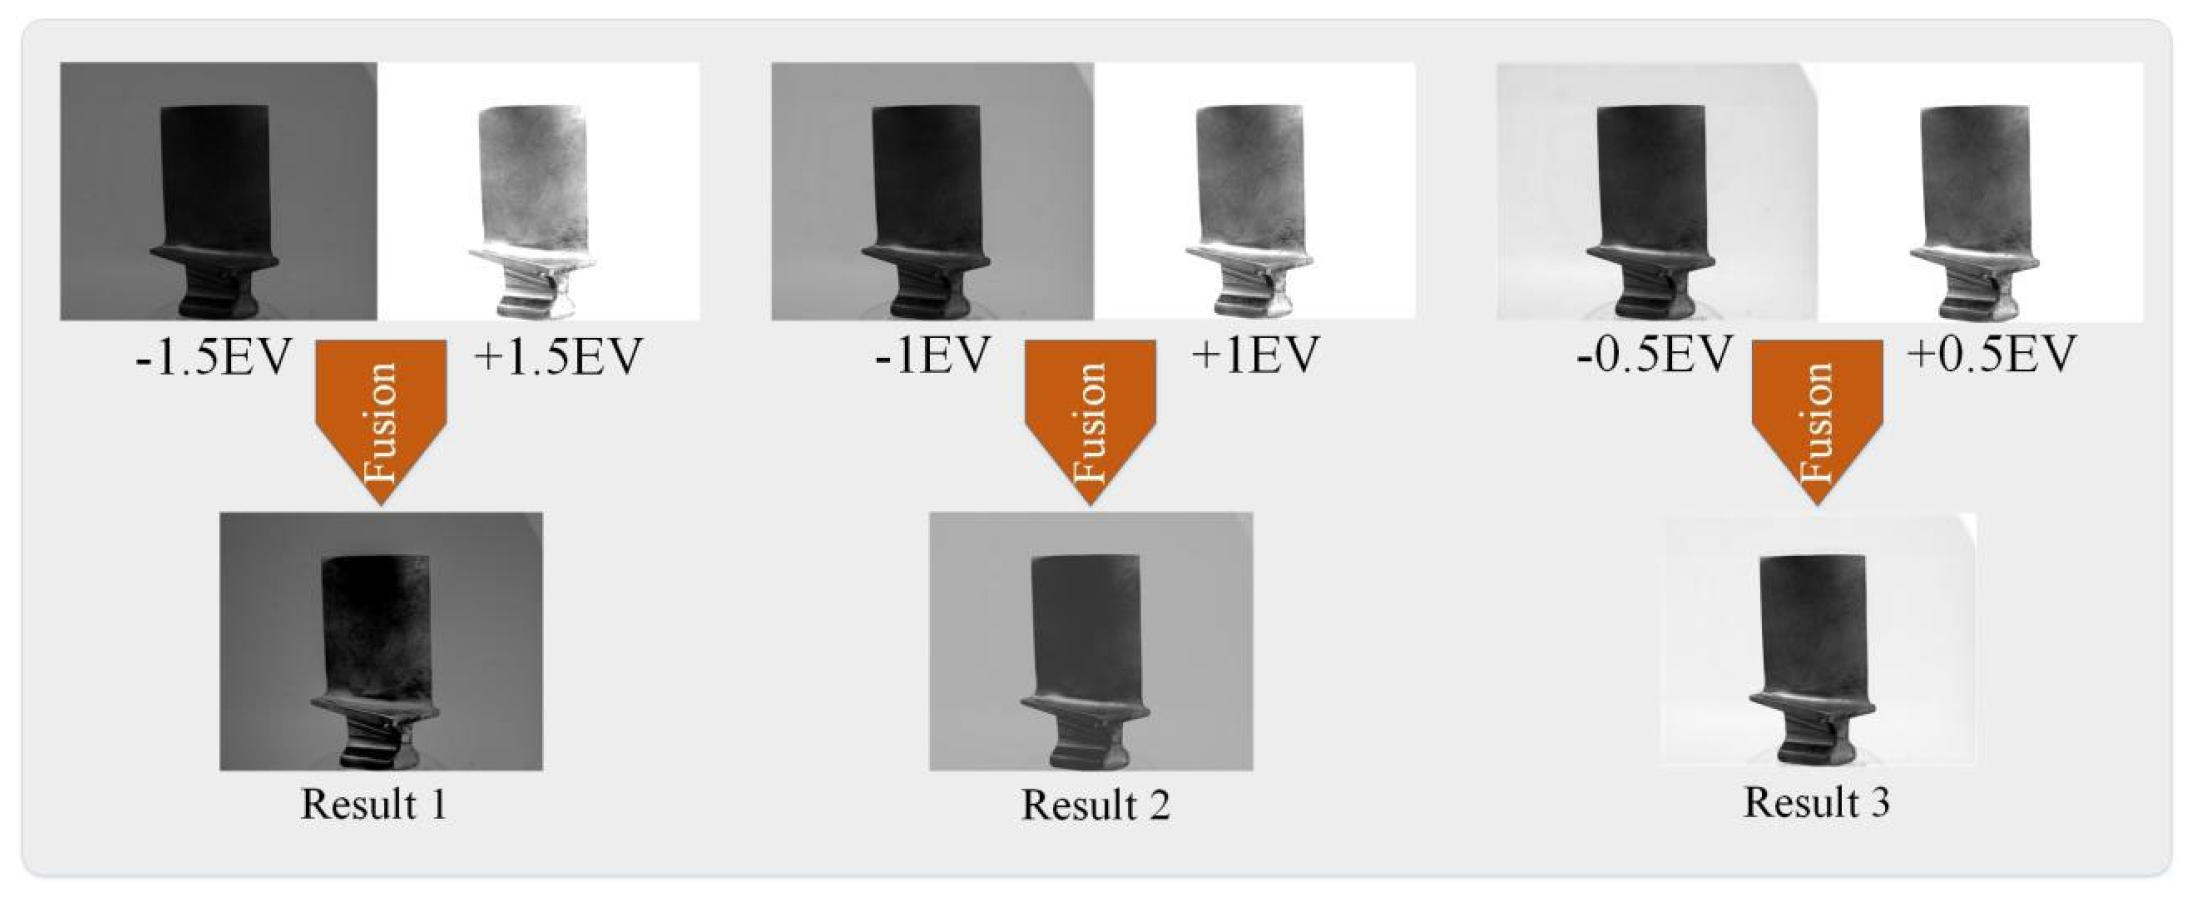
Selecting the exposure range is of vital importance. The exposure range of the data in this dataset is from −1.5 EV to +1.5 EV. Images close to 0 EV can capture more comprehensive image data, including fine details of brightness and contrast. Such comprehensive data is crucial for subsequent image processing, providing rich feature information to enhance processing accuracy. Therefore, selecting images within this exposure range can optimize the extraction effect of image details and features, generating more realistic and clear processing results. As shown in
Figure 2, when the input exposure values are +0.5 EV and −0.5 EV for the images, the optimal processing effect can be obtained, and the blade images with the most comprehensive information can be generated. As shown in
Figure 2.
At present, multi-exposure processing methods are mostly applied to the processing of natural landscape images [
10]. Specialized multi-exposure processing datasets for aero engine blades are scarce, and there are relatively few processing methods suitable for industrial scenarios, especially for composite material coated components. Therefore, the ELA-Net method proposed in this paper fills this gap, enabling the application of multi-exposure processing technology in the measurement of industrial composite material components. This method takes DenseNet as the backbone network and introduces an attention mechanism in the convolutional layer: By integrating an efficient channel attention mechanism and an ultra-lightweight subspace attention mechanism between convolutional layers, efficient allocation of information processing resources is achieved, and importance weights are automatically assigned to the extracted features. High weights are assigned to key data (such as blade edges and coating surface details), while low weights are assigned to irrelevant information (such as noise in reflective areas). Achieve the optimal processing effect with the fewest parameters. The main contributions of this study include:
(1) A new multi-exposure image fusion algorithm, ELANet, is proposed to precisely suppress the local reflection interference caused by the high reflectivity of composite materials such as titanium alloys on aero-engine blades, the multiple reflections at the interface due to the refractive index difference between the thermal barrier coating and the substrate, and the large difference in the incident light reflection Angle resulting from the complex high curved surface structure.
(2) By combining the efficient channel attention mechanism with the ultra-lightweight subspace attention mechanism, an unsupervised attention-guided network is designed in the attention layer between the convolutional layers added to the backbone network, which improves the fusion performance of the algorithm and makes the fusion result have richer texture details and clearer edges.
(3) The effectiveness and universality of the ELANet method were verified by comparing the results of 9 evaluation indicators with 12 popular multi-exposure image fusion methods.
2. Related Work
To address image quality problems caused by blade reflections, MEF technology has become a mainstream solution. This section reviews traditional and deep learning-based MEF methods, analyzes their limitations in industrial scenarios, and illustrates the necessity of developing the ELANet method.
At present, for industrial components such as aero-engine blades with high curved surface structures and composite material surface characteristics, the problems of overexposure and underexposure caused by surface reflection have been attempted to be solved by various image enhancement and fusion technologies. Among them, multi-exposure image fusion technology can expand the dynamic range and supplement detailed information by fusing images of different exposure levels [
10]. It has become one of the mainstream methods to deal with such surface reflection problems. The existing multi-exposure image fusion methods can be divided into two major categories: traditional methods and deep learning-based methods.
Traditional multi-exposure fusion methods can be divided into two categories: those based on the spatial domain and those based on the transformation domain. Goshtasby et al. [
11] proposed a block-based multi-exposure fusion method for static scenes. Divide the source image into multiple image blocks of different shapes and sizes, select the image with the most information, and apply a monotonically decreasing blending function to the selected image. Mertens et al. [
12] proposed a fusion method based on simple image quality metrics such as saturation and contrast for fusing sequences containing poorly exposed images.
Supervised MEF methods require a training set with a large number of ground truth (GT) images. In 2018, Wang introduced a supervised method called EFCNN [
13], which can be used for the task of fusing multiple exposed images. Deng proposed CU-Net [
14], addressing the reconstruction and fusion of multiple modal images. Zhang [
15] introduced a versatile image fusion framework known as IFCNN, a versatile image fusion framework has been proposed, named IFCNN, capable of addressing a variety of image fusion scenarios. As depicted in
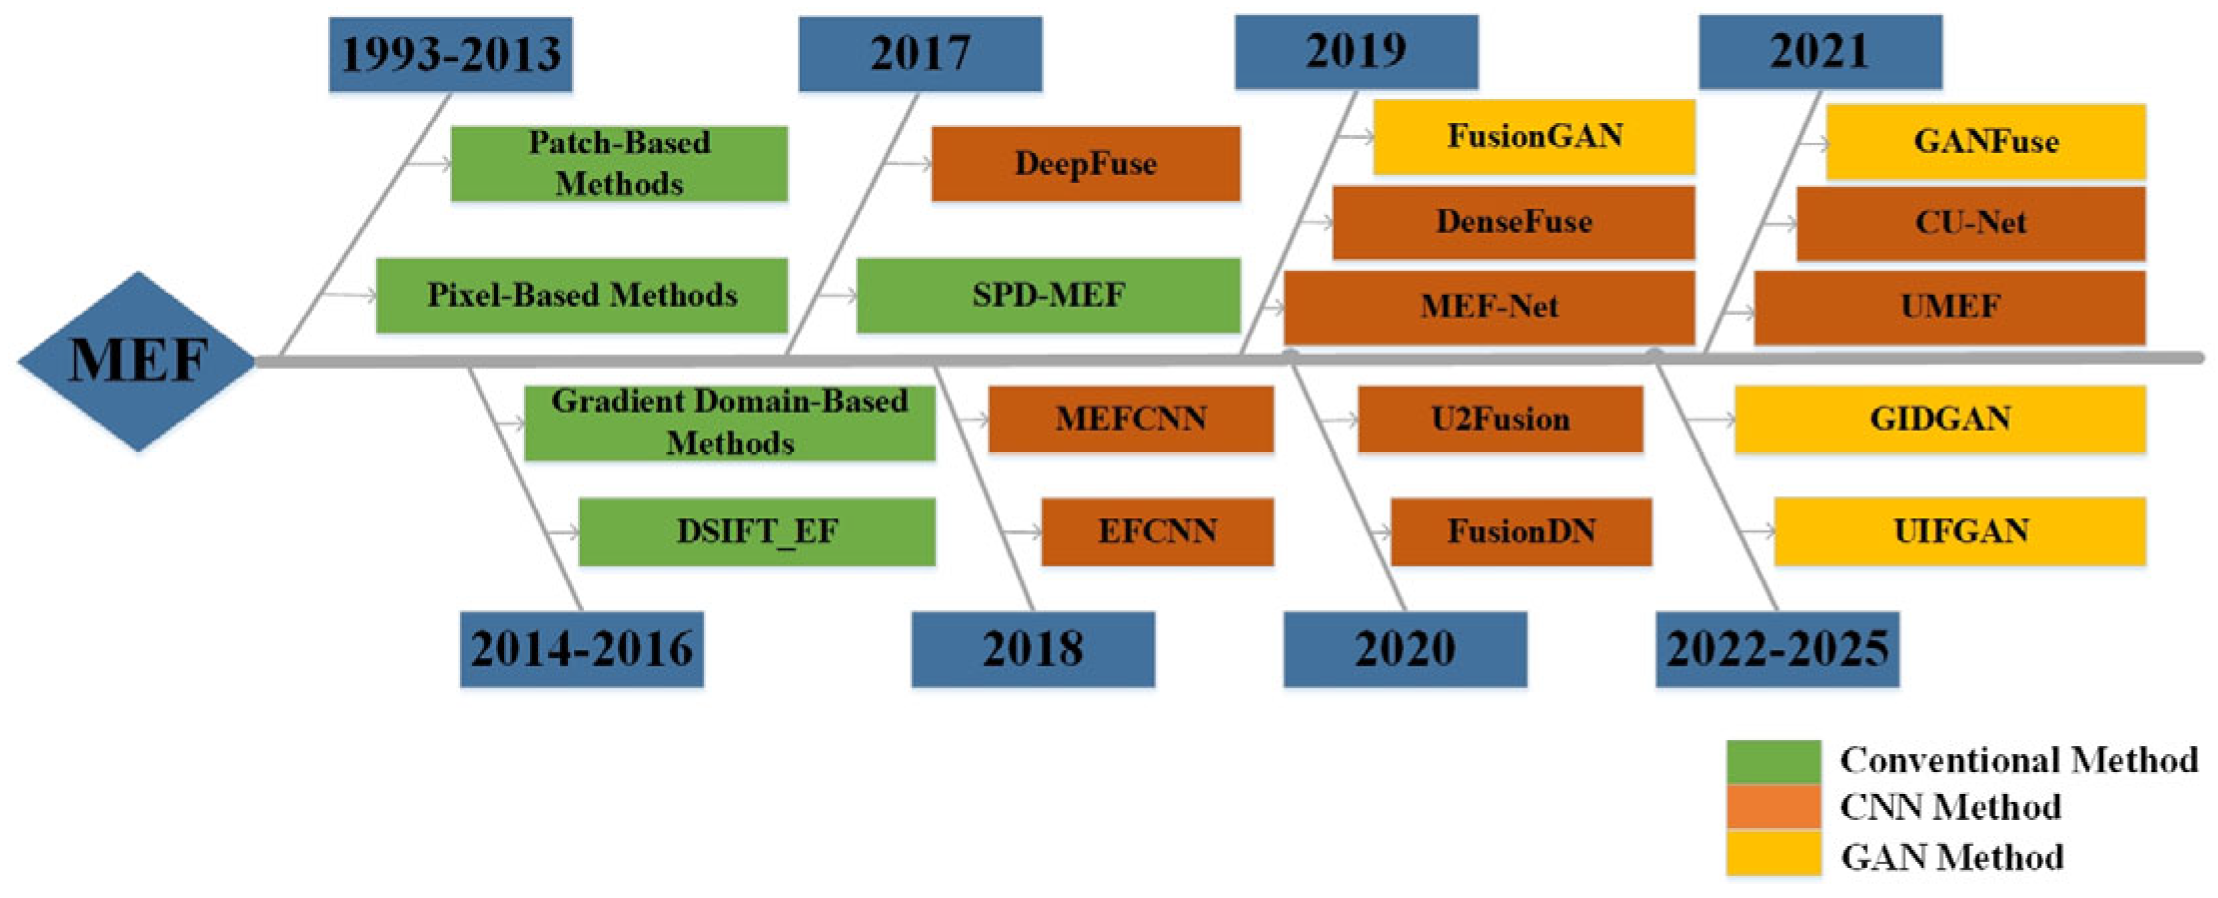
Figure 3. this illustrates the evolutionary timeline of multi-exposure fusion techniques.
In the field of MEF, it is challenging to obtain GT images, leading to the emergence of more unsupervised MEF methods. Sun introduced the IMDCN [
10] technique, an integrated multi-exposure approach that leverages the DenseNet architecture, along with the creation of the CW-MEF [
10] dataset. Despite its contributions, the technique encounters challenges with localized blurriness. To address this, our enhanced approach incorporates an efficient channel attention mechanism and a minimal subspace attention mechanism, effectively resolving the blurriness issue while simultaneously improving the visual appeal of the images through the synergistic application of two compact modules. Hui [
16] proposed the DenseFuse method, whose encoding network includes utilizing convolutional, fusion, and dense layers, the architecture ensures that the output from each layer is linked to every other layer within the network. Yu introduced a novel network called ParaLkResNet [
17], which incorporates an innovative plug-in convolutional block known as PLB. Ma introduced the MEF-Net [
18] method for MEF. By using a guided filter to perform joint upsampling on the learned weight map generated by the context aggregation network, it produces high-resolution feature images. Zhang [
19] used illumination map guidance, estimated dual gamma values through Transformer, performed partitioned exposure correction, and optimized the results using dual branch fusion to effectively address underexposure and overexposure issues. Xu [
20] proposed the CU-Net multi-exposure fusion method, which organically combines image super-resolution, usually considered as two separate visual tasks, with multi-exposure image fusion. Han [
21] introduced a deep perception enhancement network for MEF, consisting of modules for extracting image details and color mapping, resulting in a fusion with rich detail information and good visual perception. Zhang proposed MEF-CAAN [
22], which utilizes low resolution contextual information and attention mechanism to unsupervised fuse multi exposure images, particularly adept at restoring details in extreme exposure areas. Qi [
23] introduced the NestFuse multi-exposure fusion method, which uses nested connections and spatial or channel attention models for fusion. Zhu proposed a Frame-by-Frame Feedback Fusion Network (FFFN) for Video Super-Resolution tasks [
24]. Yan [
25] further proposed the DAHDRNet method, which extracts details from non-reference images, enhances details in the fusion result, and can adaptively scale feature information. Zhang [
26] proposed method based on perceptual enhancement structural block decomposition, which decomposes image blocks into four components, fuses them independently in different ways, aggregates the components, and finally generates an image. Han [
27] introduced FusionDN, a CNN-based image fusion model for static scenes, a universal image fusion model that can fuse various forms of images. An improved version of FusionDN, U2Fusion [
28], was proposed, which improves the information preservation allocation strategy, with the information preservation degree determined by the information measure of the features extracted by the U2Fusion model.
GAN-based unsupervised MEF methods have also been widely applied. Chen [
29] proposed a GAN-based multi-exposure image fusion model, consisting of three parts: a homography estimation network, a generator, and a discriminator. Tang [
30] designed a GAN based method called EAT, which is a multi-exposure image fusion method based on adversarial networks and focus transformations to better fuse information from local regions. Le [
31] proposed the UIFGAN, a GAN based on continuous learning, which trains a model with memory capable of remembering what was learned in previous tasks. Zhou [
32] proposed the GIDGAN, a GAN-based image fusion method that uses gradients and intensities to construct dual discriminators, thereby fully extracting the image’s salient information and geometric structure. As depicted in
Figure 3. this illustrates the evolutionary timeline of multi-exposure fusion techniques.
As shown in
Figure 3, multi-exposure fusion technology has evolved from traditional methods (1993–2013) to CNN-based approaches (2017–2020) and GAN-based unsupervised methods (2021–2025). While these advancements have promoted dynamic range expansion and detail preservation, critical gaps remain for industrial scenarios such as aero-engine blade inspection: traditional MEF technologies fail to adapt to the reflective properties of titanium alloys and thermal barrier coatings, easily causing overexposure and underexposure; deep learning-based MEF technologies mostly focus on natural and general static scenes, without considering reflection angle variations induced by blade curvature and multiple reflections at the coating-substrate interface; the latest GAN-based MEF technologies prioritize feature extraction for general images, making it difficult to balance the three core industrial requirements of reflection suppression, edge preservation, and computational efficiency.
As a targeted solution for industrial challenges in blade inspection, ELA-Net achieves innovations in its technical framework. On one hand, it draws on the idea of DenseNet combined with attention mechanism” from the unsupervised method IMDCN to efficiently extract multi-scale reflection features of blade coatings while innovatively introducing a dual-attention combination of “Efficient Channel Attention and Ultra-Lightweight Subspace Attention. Among them, ECA captures the reflection differences between the coating and the metal substrate to prioritize resource allocation for anti-reflection channels, and ULSAM adaptively adjusts local weights according to the reflection laws of the curved blade surface to solve problems of edge blurring and insufficient contrast, with its parameter count being only 1/5 of that of traditional spatial attention, making it suitable for on-site industrial inspection and thus overcoming pain points in blade detection. On the other hand, it absorbs the “protection degree” logic from the unsupervised method FusionDN, and combines it with the blade inspection scenario to quantify the “reflection region protection degree” using the local weights output by ULSAM. It reduces the protection degree in strongly scattering and overexposed regions to enhance reflection suppression, and increases the protection degree in non-scattering defect regions to avoid detail loss, accurately adapting to the uneven reflection characteristics of the blade surface. In summary, ELANet not only inherits the strong feature extraction capability of deep learning-based multi-exposure fusion technology but also specifically addresses unique challenges such as blade reflection and industrial scene adaptation, rather than being a simple incremental improvement.
3. Method
To suppress reflections, improve fusion quality, and meet industrial efficiency requirements, this section details the design of the ELANet method—including its network framework, attention mechanisms, fusion framework, and loss function—and presents a complete technical solution.
3.1. Network Structural Framework
The structural design of the ELANet model is shown in
Figure 4. In this paper, the DenseNet network is adopted to encode and decode exposed image pairs to generate images with suppressed reflections, and the structure and parameters of DenseNet are optimized to achieve the best performance. Compared with ResNet, which is often used in the backbone network of computer vision tasks, DenseNet can effectively alleviate the problem of data overfitting. Two blade images with different exposures (capturing the details of the reflective and dark areas of the coating, respectively) are stitched together as input, and the processed image is directly output.
The encoder part of the network consists of six standard convolutional layers, and the decoder part is composed of three advanced decoding units. Each unit in the encoder and decoder contains convolution operations of a 3 × 3 core matrix, an activation function layer, and an attention layer. The last layer of the decoder adopts the tanh function. For the DenseNet backbone network, each convolutional layer is equipped with 64 filters, with a kernel size of 3 × 3 and a stride of 1; the transition layer uses 32 filters, with a kernel size of 1 × 1 and a stride of 1, followed by average pooling parameters; the Efficient Channel Attention (ECA) module adopts 1D convolution, equipped with 32 filters, with a kernel size of 3 and a stride of 1; the Ultra-Lightweight Subspace Attention Mechanism (ULSAM) module includes convolutional layers with kernel sizes of 3 × 3 and 1 × 1, respectively, and both layers are equipped with 64 filters and have a stride of 1. The VGG-16 network is introduced to undertake the task of auxiliary feature extraction during the loss calculation process. It is embedded in the information measurement module of the network and used to extract multi-dimensional features from source images, ensuring that the loss function can fully capture the differences in image details.
In terms of image selection, priority should be given to blade images with balanced exposure to ensure low noise, high local contrast and appropriate brightness, so as to preserve the texture of the composite material coating and the details of the blade edges, and avoid the interference of reflective noise. At the same time, comprehensive brightness coverage must be achieved to enhance processing quality and provide a clear image foundation for subsequent measurements.
3.2. Attention Guided Network
There are many MEF methods available today, but most of them still result in images that are too dark or too bright. This issue can be resolved by using the Efficient Channel Attention Module (ECA) module in conjunction with the DenseNet network.
The images that are underexposed due to insufficient exposure time are too dark, and those that are overexposed due to too long exposure time are too bright; both can lead to an inappropriate distribution of image intensities. Incorporating the ECA into the common layers of the encoder, the application of the ECA significantly enhances the performance of the ELANet network by capturing more feature information. While introducing network models to enhance performance inevitably increases the network’s complexity, this issue is addressed by incorporating the ECA into the model. This module involves only a minimal number of parameters. By adding the ECA to the common layers, the attention mechanism strengthens the integration capability of features during the information feature extraction process. It contributes richer feature data to the final aggregation result, leading to a significant performance improvement. The schematic diagram of the attention-guided network is shown in
Figure 5.
Features synthesized via Global Average Pooling (GAP) are processed by the ECA assigns weights to the channels by applying a swift 1D convolutional filter with a dynamically determined size k, contingent upon the channel count C. By reducing the height h and width w dimensions to 1, while preserving only the channel dimension, the 1D convolution facilitates information exchange and weight sharing among channels within each layer and with adjacent layers. The application of the Sigmoid activation function results in the weights
for each channel, as described in Equation (1) [
33]:
In Equation (1), represents a one-dimensional convolution that involves only k parameters, with the kernel size of the one-dimensional convolution being k.
In different CNN architectures, the interaction coverage can be manually adjusted and optimized for convolutional blocks with varying channel counts. However, conducting manual optimization through cross-validation would require substantial computational resources. It stands to reason that the degree of interconnectivity scales with the channel capacity C, with the kernel size k being determined by the subsequent formula:
Equation (2) [
33] is used to calculate the kernel size k for the one-dimensional convolution, where C is the number of channels in the input features.
represents the nearest odd number to t. In experiments,
and b are set to 2 and 1, respectively. The variable
t denotes the exposure time of the image sensor (unit: milliseconds, ms) during the acquisition of blade surface images, which directly affects the light intensity captured by the sensor and thus the brightness distribution of the input image.
Upon determining the kernel dimension k, the ECA module performs a 1D convolution operation on the input feature maps, the announcement is as follows:
Equation (3) [
33] represents the transformation of input features in into output features out.
Within the framework of an attention-driven network, there is a requirement to emphasize significant features by assigning weights to different channels. To achieve this, we can implement an attention mechanism that leverages Global Average Pooling (GAP). This can be mathematically expressed as follows [
34]:
Ac denotes the attention weights for the channels, F signifies the feature map, Wa is the trainable weight matrix, σ stands for the activation function, typically a sigmoid, and GAP refers to the process of GAP, which condenses the spatial dimensions of the feature map into a single value. Utilizing GAP serves several purposes, by integrating images captured at varying exposure levels, the instances of excessive brightness and darkness are mitigated. This process leads to a composite image with a more evenly distributed luminance and contrast, which in turn elevates the overall visual appeal.
The feature maps obtained from input are then scaled by the corresponding weights of the refined feature maps. This process integrates the weights directly onto the feature maps. By doing so, the module streamlines the network’s architecture, promoting a lightweight design that balances performance with operational efficiency.
3.3. Fusion Framework
Existing methods focus more on the details and textures of images while neglecting the issues of edge blurring and insufficient contrast. While ensuring the quality of image details, we have also addressed the problems of edge blurring and insufficient contrast.
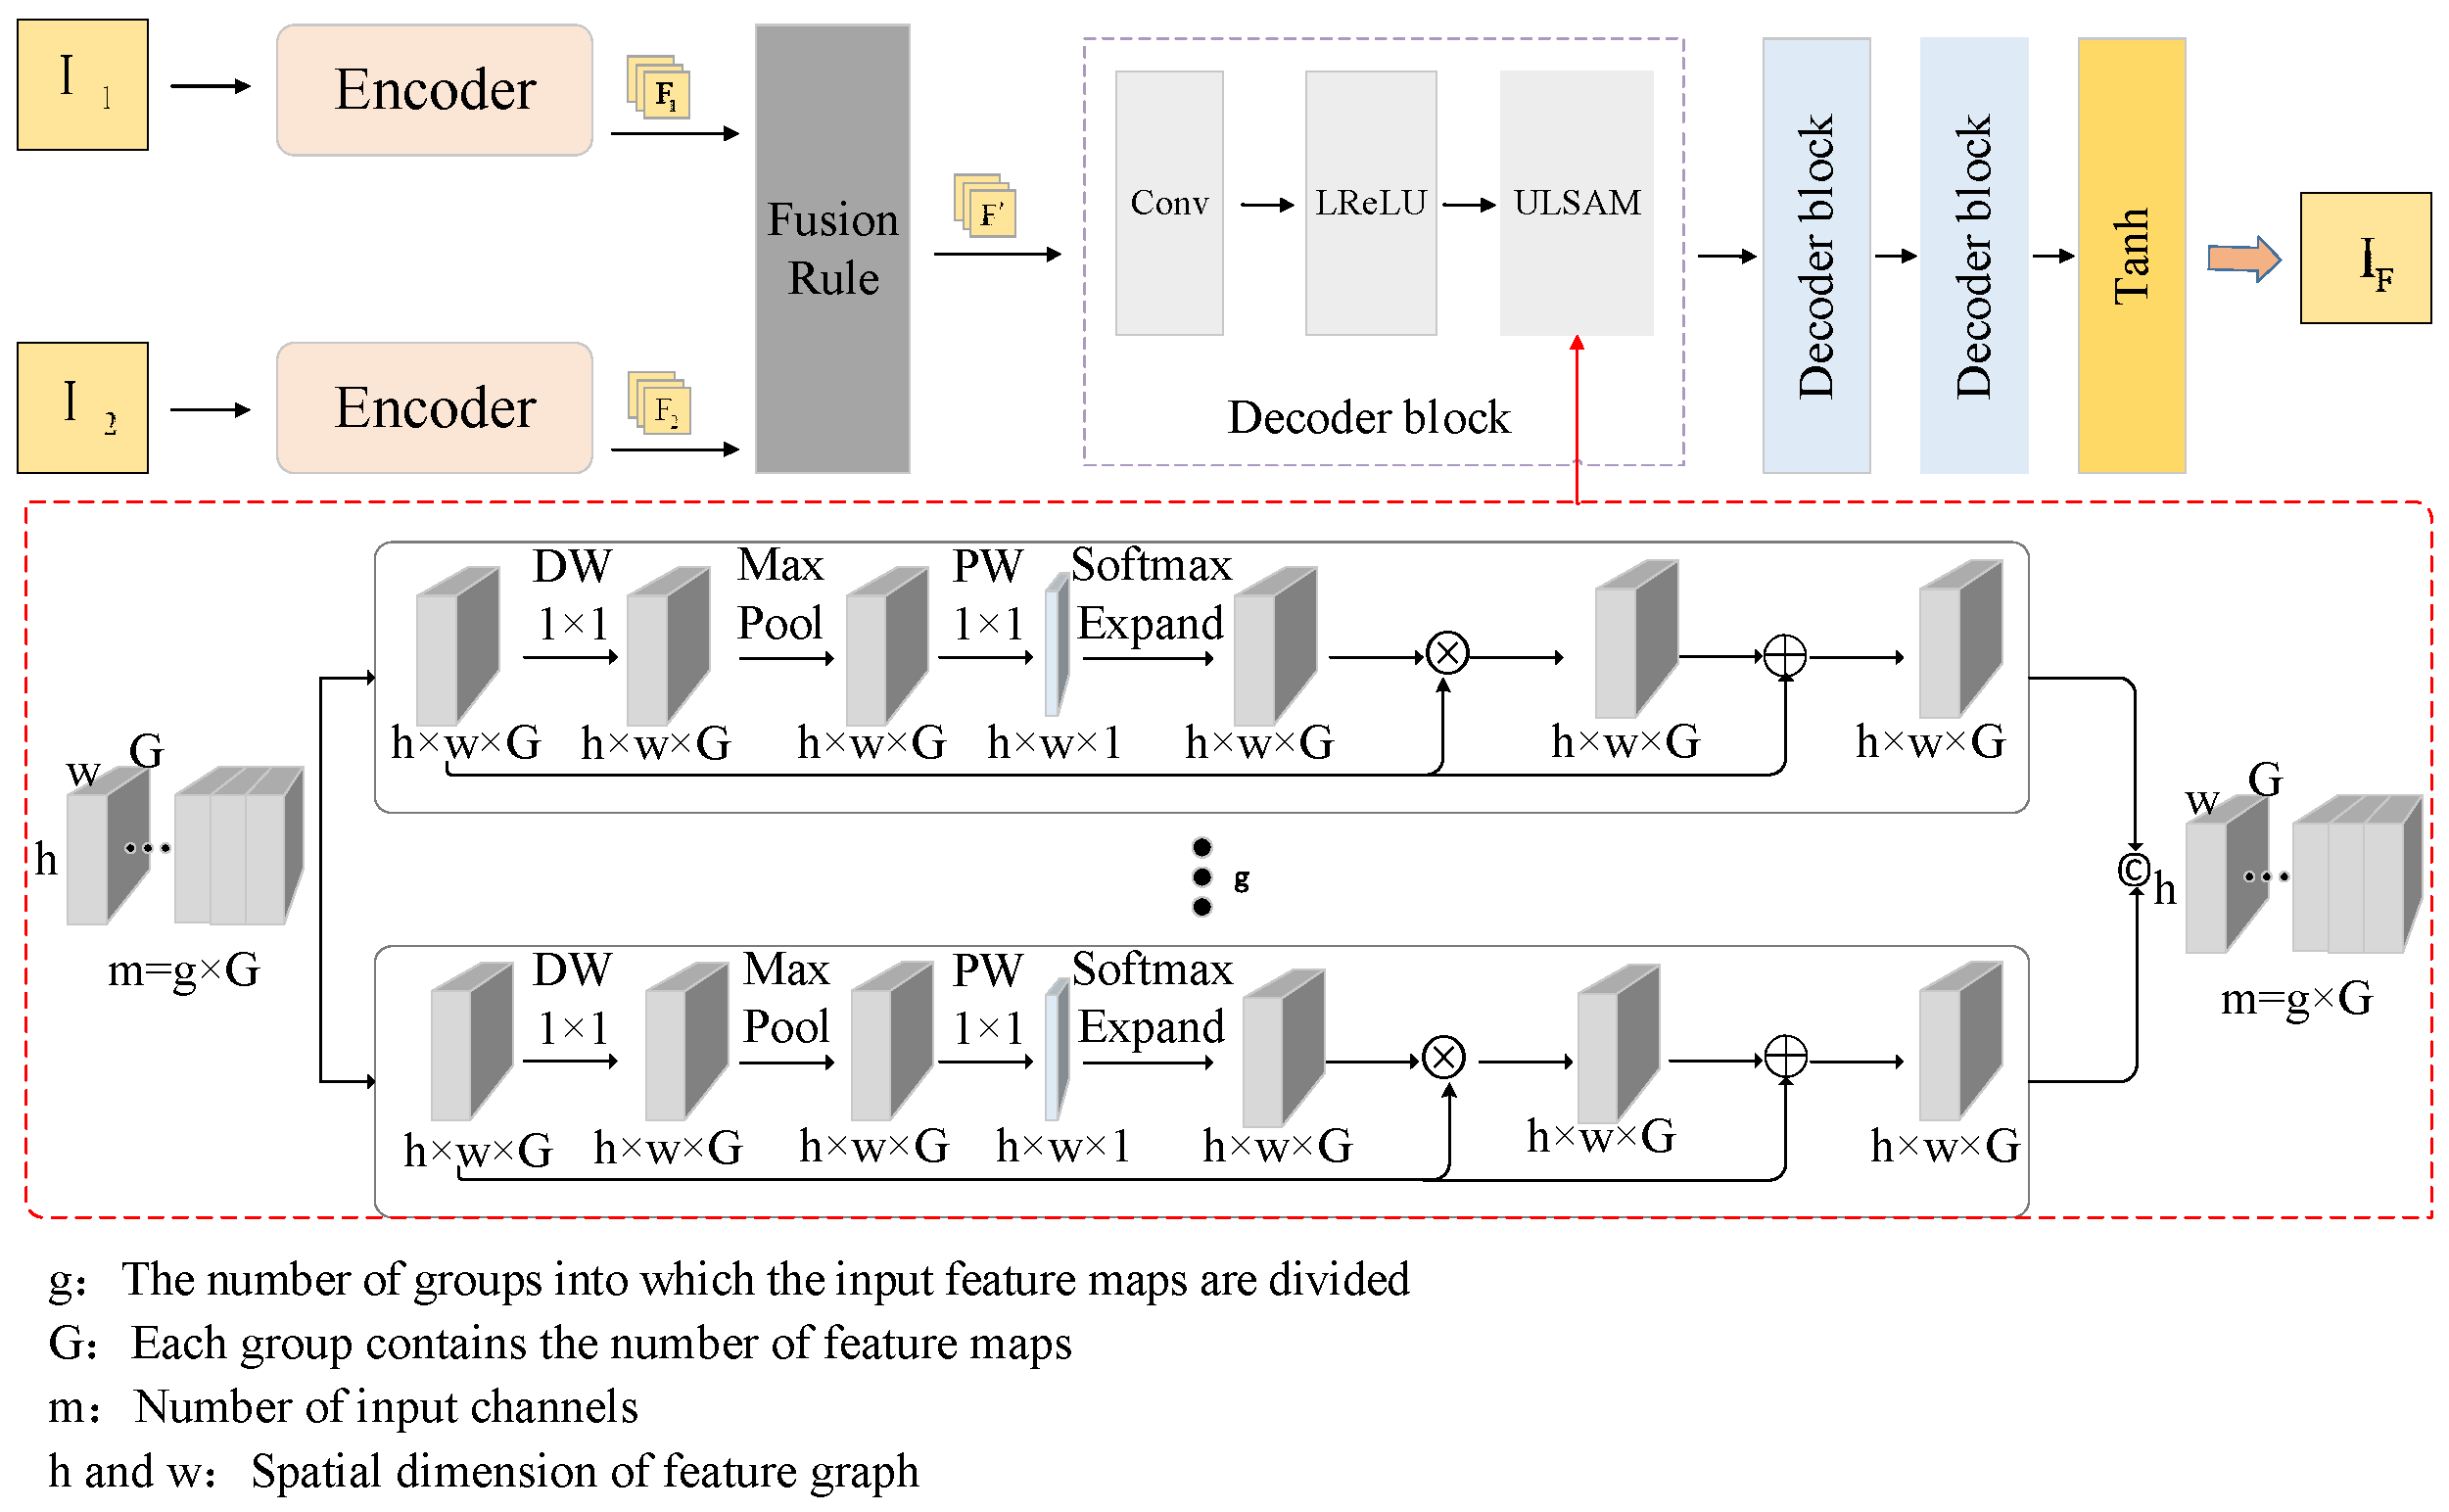
Incorporating the Ultra-Lightweight Subspace Attention Module (ULSAM) into the decoder’s blocks, adjustments have been made to the structure and parameters of the module to enhance its utility in applications such as industry, where efficiency and cost are paramount. This module, designed with a focus on lightweight properties, is adept at capturing global relevance more effectively as it enables the acquisition of distinct attention mechanisms for various feature subspaces, enhancing the network’s ability to process features across different scales and frequencies and learning while efficiently processing cross-channel information. The ELANet network, already proficient in feature extraction, features are extracted from two source images, enhanced through the aggregation of these features to form an integrated set of features, which are then forwarded to the decoding stage for the construction of the final fused image. A representational overview of the fusion framework is depicted in
Figure 6.
The added attention layers are within the decoder blocks of the decoder, where the input features are divided into multiple groups for separate processing. The ULSAM divides the input features into multiple groups and processes them separately. ULSAM partitions the input feature maps into g non-overlapping groups, with each group comprising G feature maps (F). Here, m signifies the channel count of the input features, while h and w correspond to the height and width of these feature maps. Concurrently, each group also has Gather and Broadcast operations similar to the Squeeze and Excitation effects, enhancing the model’s expressive power by adjusting the weights of each channel, thereby increasing focus on important channels:
By redistributing features within the feature space to reduce FLOPs and the count of parameters, Equation (5) [
35] demonstrates the fully connected layer with a filter size of, where
represents the size of the filter. Here, m and n represent the number of input and output feature maps, respectively, with a spatial size of h × w.
Since the network, it simply combines the features extracted
and
from the two source images to obtain a fused feature map F′, which is then forwarded to the decoder. At the decoder stage, we need to fuse the features extracted from two source images. Let
and
represent the feature maps of the two source images, respectively, and F′ be the fused feature map [
35]:
The weighting parameter
is a trainable parameter of ELANet. Instead of being manually tuned, it is adaptively learned through backpropagation during dataset-based model training, synchronously with the weights of the network’s convolutional layers and the parameters of the attention mechanism. It is dynamically updated based on the gradient feedback of the total loss function and finally converges to an optimal value. The value range of
is [0, 1], and its magnitude directly determines the feature contribution ratio of the two source images: when
approaches 1, the fused features focus more on the first source image (such as the dark area details of the high-exposure image); when
approaches 0, they focus more on the second source image (such as the reflection suppression information in the bright area of the low-exposure image). The adaptively learned
can dynamically balance the features of the two according to the reflection distribution and curved surface structure differences in blade images, avoiding the loss of local information caused by manually fixing weights, thereby improving the reflection suppression effect and detail integrity of the fused image.
In Equation (7) [
36]
denotes the final output feature map fed into the decoder after attention-based refinement.
Ac represents channel-wise attention weights that adaptively enhance discriminative channels.
is the fused feature map from two source images.
3.4. Loss
The experimental results indicate that after the operations of encoding and decoding, there is a loss of information from the source images, which affects the calculation of the loss function. To address this issue, feature extraction modules and information measurement modules have been incorporated into the network to preserve the characteristic of the source images. By employing the VGG-16 [
37] network, features across different dimensions are extracted, maximizing the richness of information from source images with varying exposures. A more efficient method for measuring image gradients in terms of computation and storage has been adopted, as follows [
10]:
Feature map originates from the convolutional layer prior to the j-th max pooling layer, and feature map k is selected from the k-th channel among multiple channels. After applying the softmax operation to the gradient measurement
of the source images, two data-driven weights, ω1 and ω2 are obtained. Consequently, the metrics derived from the source images are converted into weights that are utilized in the computation of the loss function.
The source image, the result, and the information measurement weights are simultaneously sent to the loss function. The information measurement of the input image is transformed into weights for calculating the loss function. The total loss function is as follows:
In Equation (9) [
10],
denotes the input image,
represents the output image, and λ is a balancing coefficients.
The SSIM is not highly restrictive regarding the distribution of image luminance. To compensate for this, an MSE constraint is introduced, which reduces the blur in the fusion results and decreases the brightness bias in the generated images. TV loss was introduced to retain the gradient details. of the original images and to mitigate the issues caused by noise interference.
In the DenseNet loss function, terms are used to control the retention of features from different data. The SSIM loss can be expressed as follows:
In Equations (10) and (11) [
7],
represents the result image, and
,
and
represents the input image. The MSE loss is defined as follows:
The TV loss is defined as follows:
In Equation (12) [
10], indicates the discrepancy between the original and the composited image, x and y correspond to the spatial dimensions of the pixel coordinates.
4. Experiments
To verify the effectiveness, superiority, and universality of ELANet, this section designs experiments covering experimental setup, qualitative-quantitative comparisons, ablation studies, and extended experiments, systematically demonstrating its advantages in industrial applications.
This section introduces a qualitative and quantitative An assessment of ELANet’s performance in contrast with 12 cutting-edge image fusion algorithms utilizing the CW-MEF dataset., namely IMDCN [
10], AIEFNet [
38], HoloCo [
39], IFCNN [
15], FusionDN [
27], U2Fusion [
28], CU-Net [
20], DenseFuse [
16], FMMEF, MEFDSIFT, MEF-Net [
18], and NestFuse [
23]. It also provides a detailed description of the ablation study, employs nine distinct image fusion metrics to quantitatively evaluate the performance.
4.1. Training Details
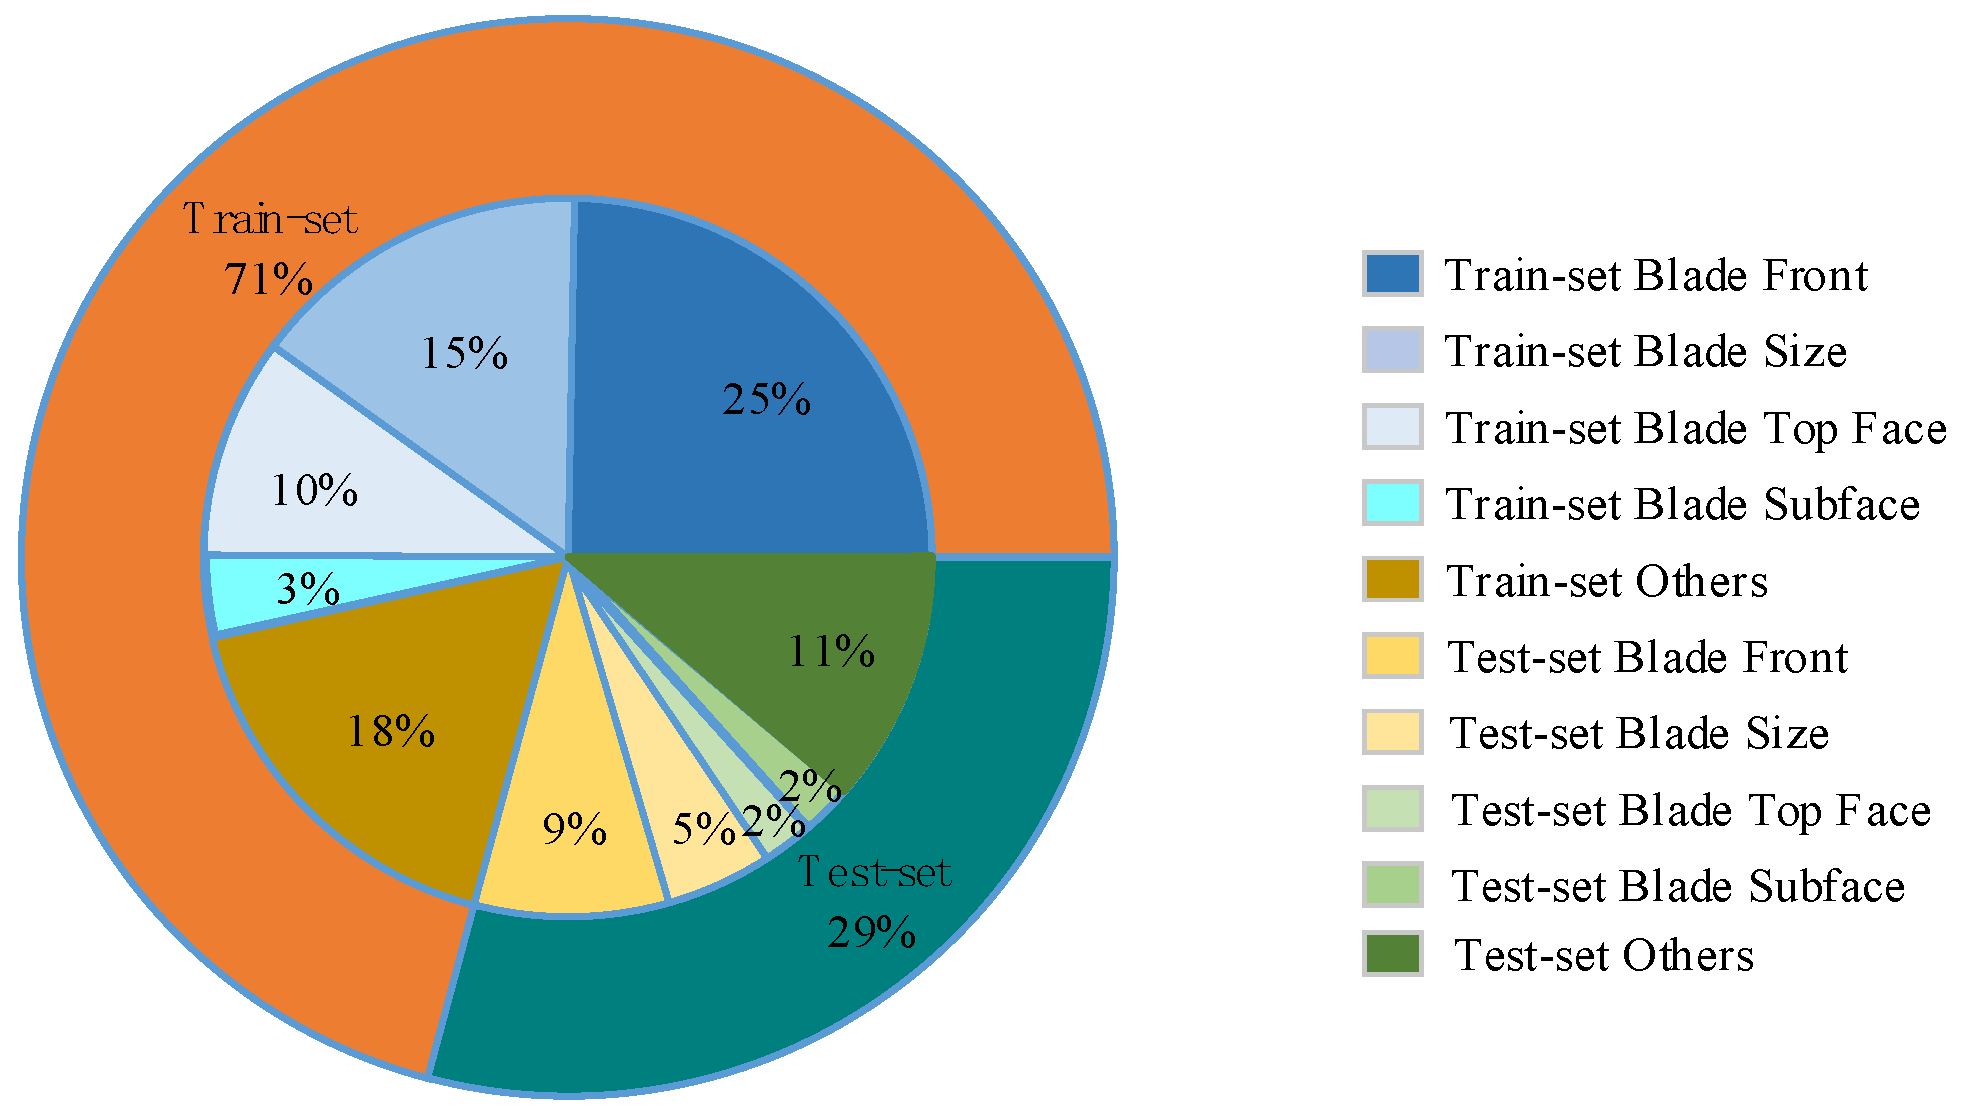
The equipment used in this study is the NVIDIA GeForce RTX 3080 Ti GPU and the 5.2 GHz Intel Core i9-12900KF CPU. This study selects the CW-MEF as the experimental dataset, choosing 1958 images as the training set for the network model training. 784 images are selected as the test set for results. All images are used at a resolution of 1280 × 1024 for the network.
The training process uses the Adam optimizer with an initial learning rate of 1 × 10⁻⁴, two iteration rounds of 140 and 160 epochs, respectively, a batch size of 4, and a loss weight λ of 20.
4.2. Dataset
The CW-MEF [
10] dataset adopted in this study is a multi-exposure image dataset specifically constructed for the surface inspection of industrial curved surface workpieces. This dataset focuses on workpieces with composite material coatings and prone to reflective properties, covering aero engine blades (mainly composed of titanium alloys, nickel-based superalloys and other composite materials, with thermal barrier coatings sprayed on the surface) and other typical industrial metal curved surface components. It can precisely match the material properties and structural features of aero-engine blades, providing data support that is in line with actual detection scenarios for verifying the performance of the reflection suppression algorithm.
To comprehensively cover the reflection conditions of different areas of the workpiece, the dataset adopts a multi-exposure method to collect images for each workpiece: Based on the standard exposure (0 EV), adjust the exposure parameters within the exposure range of −1.5 EV to +1.5 EV to obtain image sequences at different exposure levels—among which the low-exposure images (such as −1.5 EV, −0.5 EV) can clearly present the details of the high-brightness reflective areas of the workpiece. High-exposure images (such as +0.5 EV, +1.5 EV) can supplement the information of underexposed dark areas and form a complete multi-exposure sequence.
The dataset contains a total of 2742 images, all of which have a resolution of 1280 × 1024, consistent with the actual image resolution detected for aero-engine blades in industrial scenarios. According to the type of workpiece and the acquisition Angle, the images are classified into five categories: the front part of the aero-engine blade, the side part of the blade, the top part of the blade, the bottom part of the blade, and other industrial adaptation components. This can meet the algorithm verification requirements of different parts and different workpieces, ensuring the pertinence and applicability of the experimental results for the surface detection of aero-engine blades, with the classification illustrated in
Figure 7 and detailed in
Table 1.
4.3. Qualitative Experiment
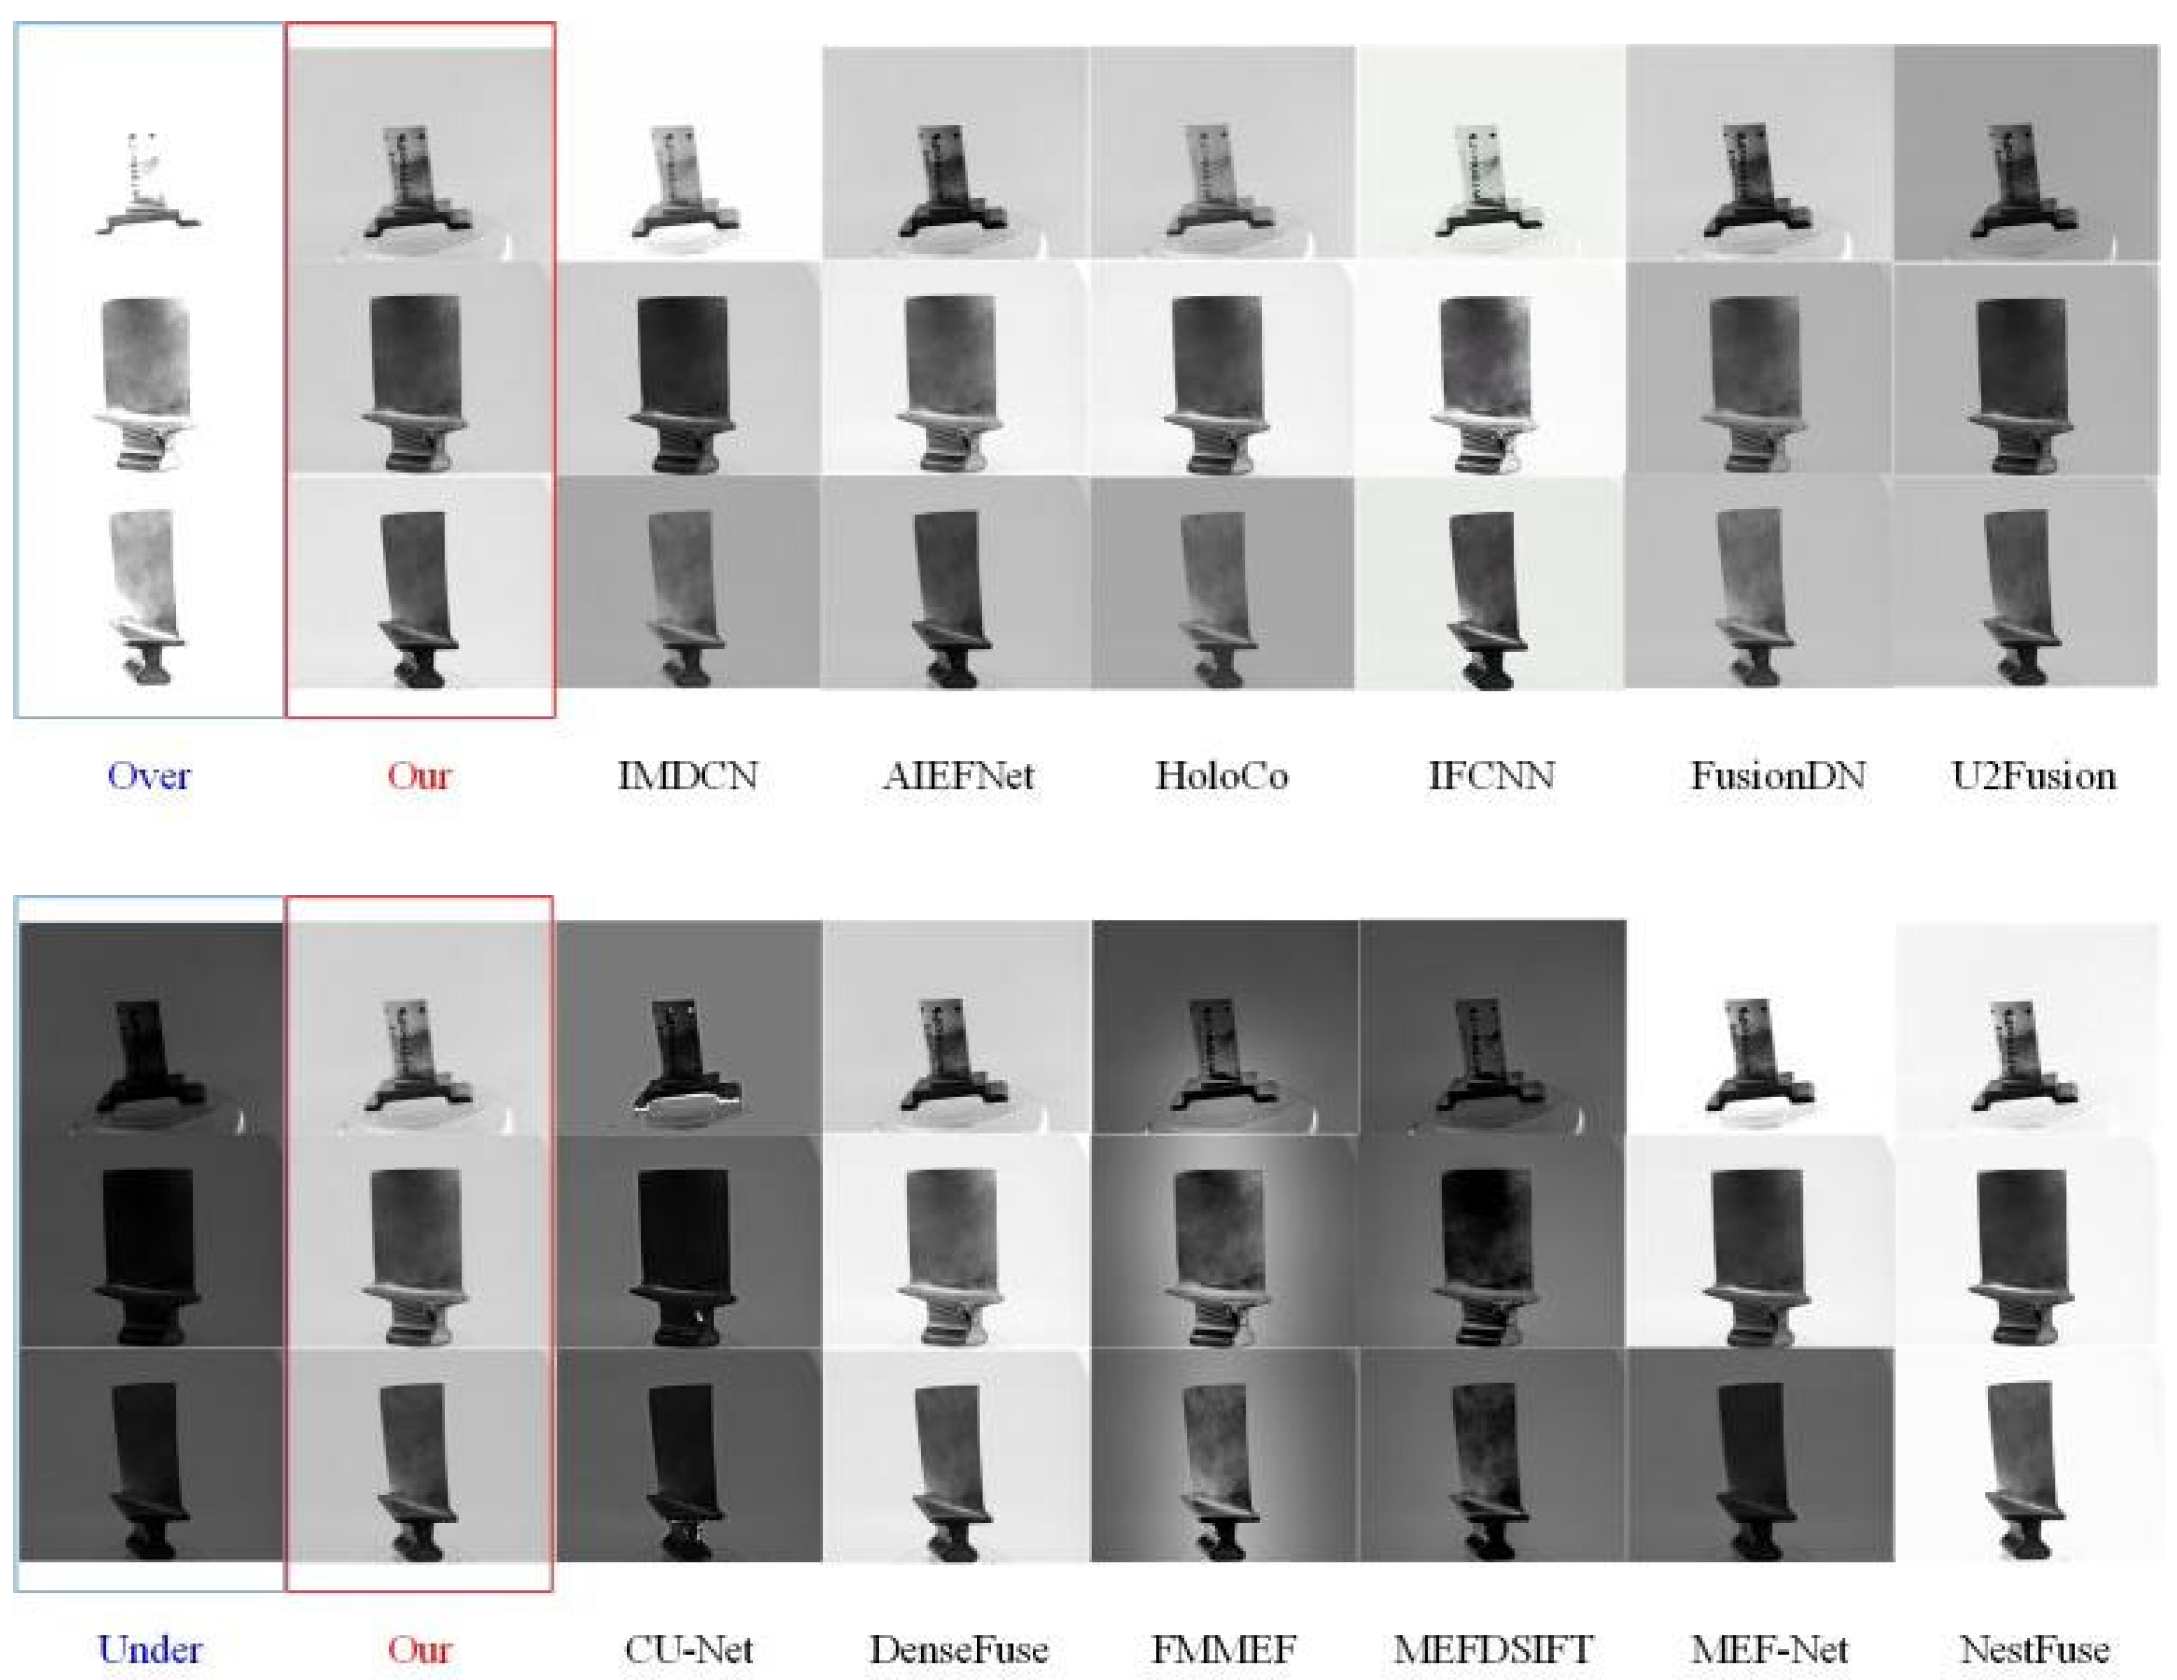
Through extensive comparative studies with aero-engine blades and state-of-the-art algorithms, this paper presents a qualitative experiment. Standard image sequences that encompass various image features were selected for result demonstration. The ELANet method is qualitatively compared with 12 current popular methods, with the results illustrated in
Figure 8.
The results show that, compared with the IMDCN method, the processing results of ELANet have better visual effects. The local blurred areas (such as the blur caused by coating reflection) are improved, and the details of overly dark images (such as the shadow area of leaves) are expressed more clearly. Compared with the AIEFNet method, ELANet avoids the problem of edge artifacts after processing (such as false contours of blade margins); Compared with the HoloCo method, the processing results of ELANet solve the problems of overall information loss (such as the absence of coating texture) and low image resolution; Compared with the IFCNN method, the processing results of ELANet are more balanced, while the results of IFCNN are generally too bright (more significantly affected by the high reflectivity of the coating). Compared with the FusionDN method, the processing results of ELANet have clearer details and further improve the blurring problem of component edges (such as blade tips). Compared with the U2Fusion method, ELANet solves the problems of its processing results being too dark and the image expression being unclear (such as the concealment of details in the dark area of the coating); Compared with the CU-Net method, ELANet is superior to its problems of information loss caused by low exposure and serious local noise (such as coating surface noise). Compared with the DenseFuse method, the processing results of ELANet are clearer in details, further improving the blurring problem of component edges, and processing image information more completely and clearly. Compared with the FMMEF and MEFDSIFT methods, the processing results of ELANet have richer contrast and solve the problems of too dark background and insufficient contrast (such as low discrimination between leaves and background) in the FMMEF and MEFDSIFT methods. Compared with the MEF-Net method, ELANet avoids the problems of its processing results being too dark or too bright and edge artifacts. Compared with the NestFuse method, ELANet performs better in suppressing the influence of reflection on light processing (such as retaining details in highly reflective areas of the coating).
In terms of detail preservation, ELANet can target the tenon groove, cooling hole edges, and coating scratches of blades, clearly presenting the stepped structure of the tenon groove, the complete contour of cooling holes, and the geometric features of coating scratches while also restoring subtle wear marks. In terms of contrast enhancement, it adjusts the grayscale of the overexposed area at the blade leading edge back to the range of 220–235 and raises the grayscale of the underexposed area at the trailing edge to 30–45, making the coating texture and the structure of the connection part clearly visible with a natural transition between light and dark. In terms of artifact suppression, it significantly reduces the diffusion range of reflection halation artifacts on the blade coating (from 8–10 pixels to 1–2 pixels), eliminates edge ghosting caused by multi-frame registration, and does not introduce new artificial artifacts.
In previous research, we focused on comparative experiments of material for aerospace engine blades. To enhance the universality and applicability of the experimental results, we have decided to extend our research scope to other metal components. By comparing the performance of different metal materials under the same conditions, we aim to demonstrate the generalization of the ELANet network and its advancement in multi-exposure image fusion in the industrial field. This expansion not only verifies the universal laws we discovered earlier but also provides convenience for the detection of metal components. We anticipate that through this comparative experiment, we can provide new insights into the measurement and detection of metal materials in the industrial field, thereby promoting the advancement of related technologies. The comparison diagrams of other metal components are depicted in
Figure 9.
The comprehensive analysis reveals that the proposed technique surpasses existing cutting-edge approaches in terms of both qualitative and quantitative assessment criteria. It excels in retaining fine spatial information and delivering enhanced visual perception.
4.4. Quantitative Assessment
As can be seen from
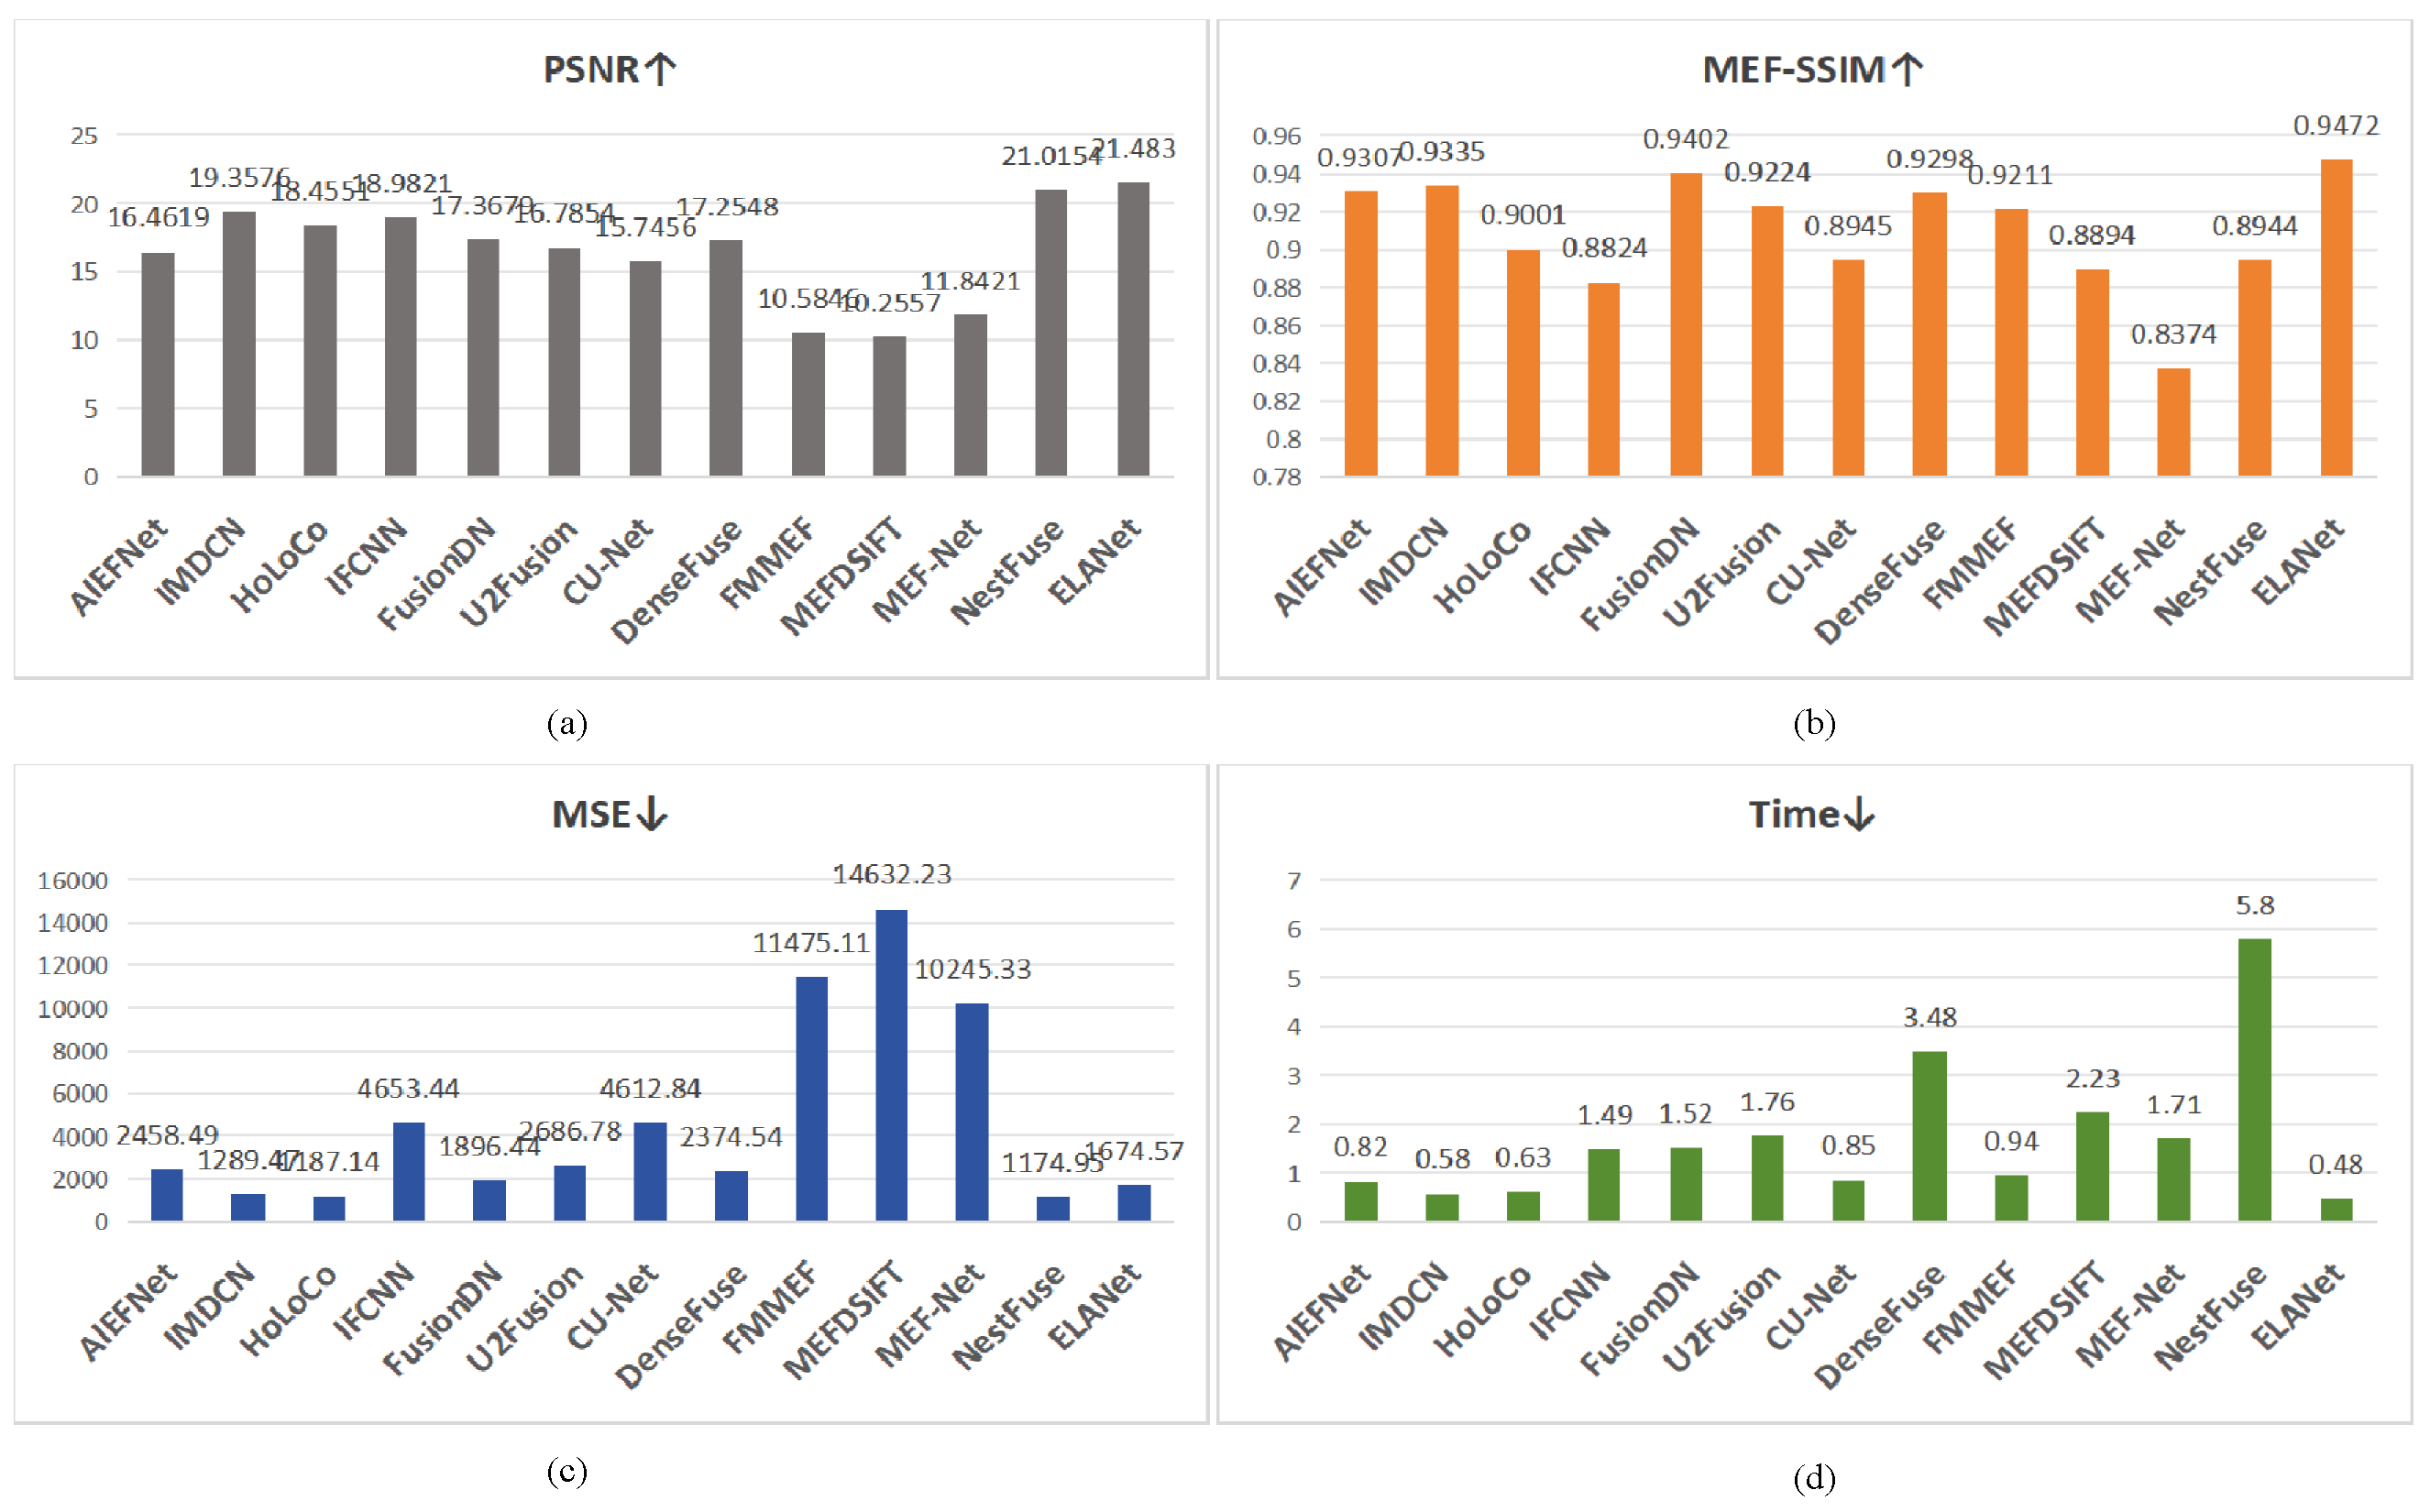
Table 2, this study employed nine different image fusion indices for evaluation, including, MEF-SSIM, NMI, PSNR, SSIM, MSE, SF, AG, and STD, to compare experiments with 12 current popular methods for multi-exposure image fusion. These methods include AIEFNet, IMDCN, HoLoCo, IFCNN, FusionDN, U2Fusion, CU-Net, DenseFuse, FMMEF, MEFDSIFT, MEF-Net, and NestFuse. Using the ELANet method to generate image indices, it achieved the best results in three out of the indices, ranked second in two indices, and came in third in one metric. Overall, the ELANet method has achieved excellent results across nine different image fusion indices. Additionally, For industrial applications, time efficiency is a crucial benchmark for the success of MEF technology. With this in mind, we assessed the average time efficiency across all comparative experiments. The ELANet technique generates fused images with the lowest mean processing time, showcasing excellent temporal performance, making it well-suited to meet the demands of industrial applications.
To encapsulate the efficacy of our approach, a quantitative analysis of objective metrics was performed, as depicted in
Figure 8 and
Figure 9. These visuals underscore the method’s resilience to both full-reference and no-reference assessment criteria. Additionally, our method was rigorously tested against deep learning counterparts, with the mean performance metrics tabulated and supplemented by a qualitative image review. The results indicate that our approach exhibits consistent strength across the entire dataset, rivaling the most advanced techniques in terms of (a) PSNR (the unit is dB), (b) SSIM, (c) MEF-SSIM, and (d) Time (the unit is s), as shown in
Figure 10.
To assess the method’s resilience across various images, the conducted experiments on additional metal components are designed to evaluate its broader applicability and industrial relevance. As evidenced in
Table 3, conclusions are derived from a visual analysis and are compared against leading-edge techniques to ascertain the method’s performance in terms of (a) PSNR, (the unit is dB) (b) SSIM, (c) MEF-SSIM, and (d) Time (the unit is s), as shown in
Figure 11.
4.5. Ablation Experiments
To demonstrate that the ELANet method is usable and dependable, a study was conducted using the training data from the CW-MEF dataset, with the results presented in
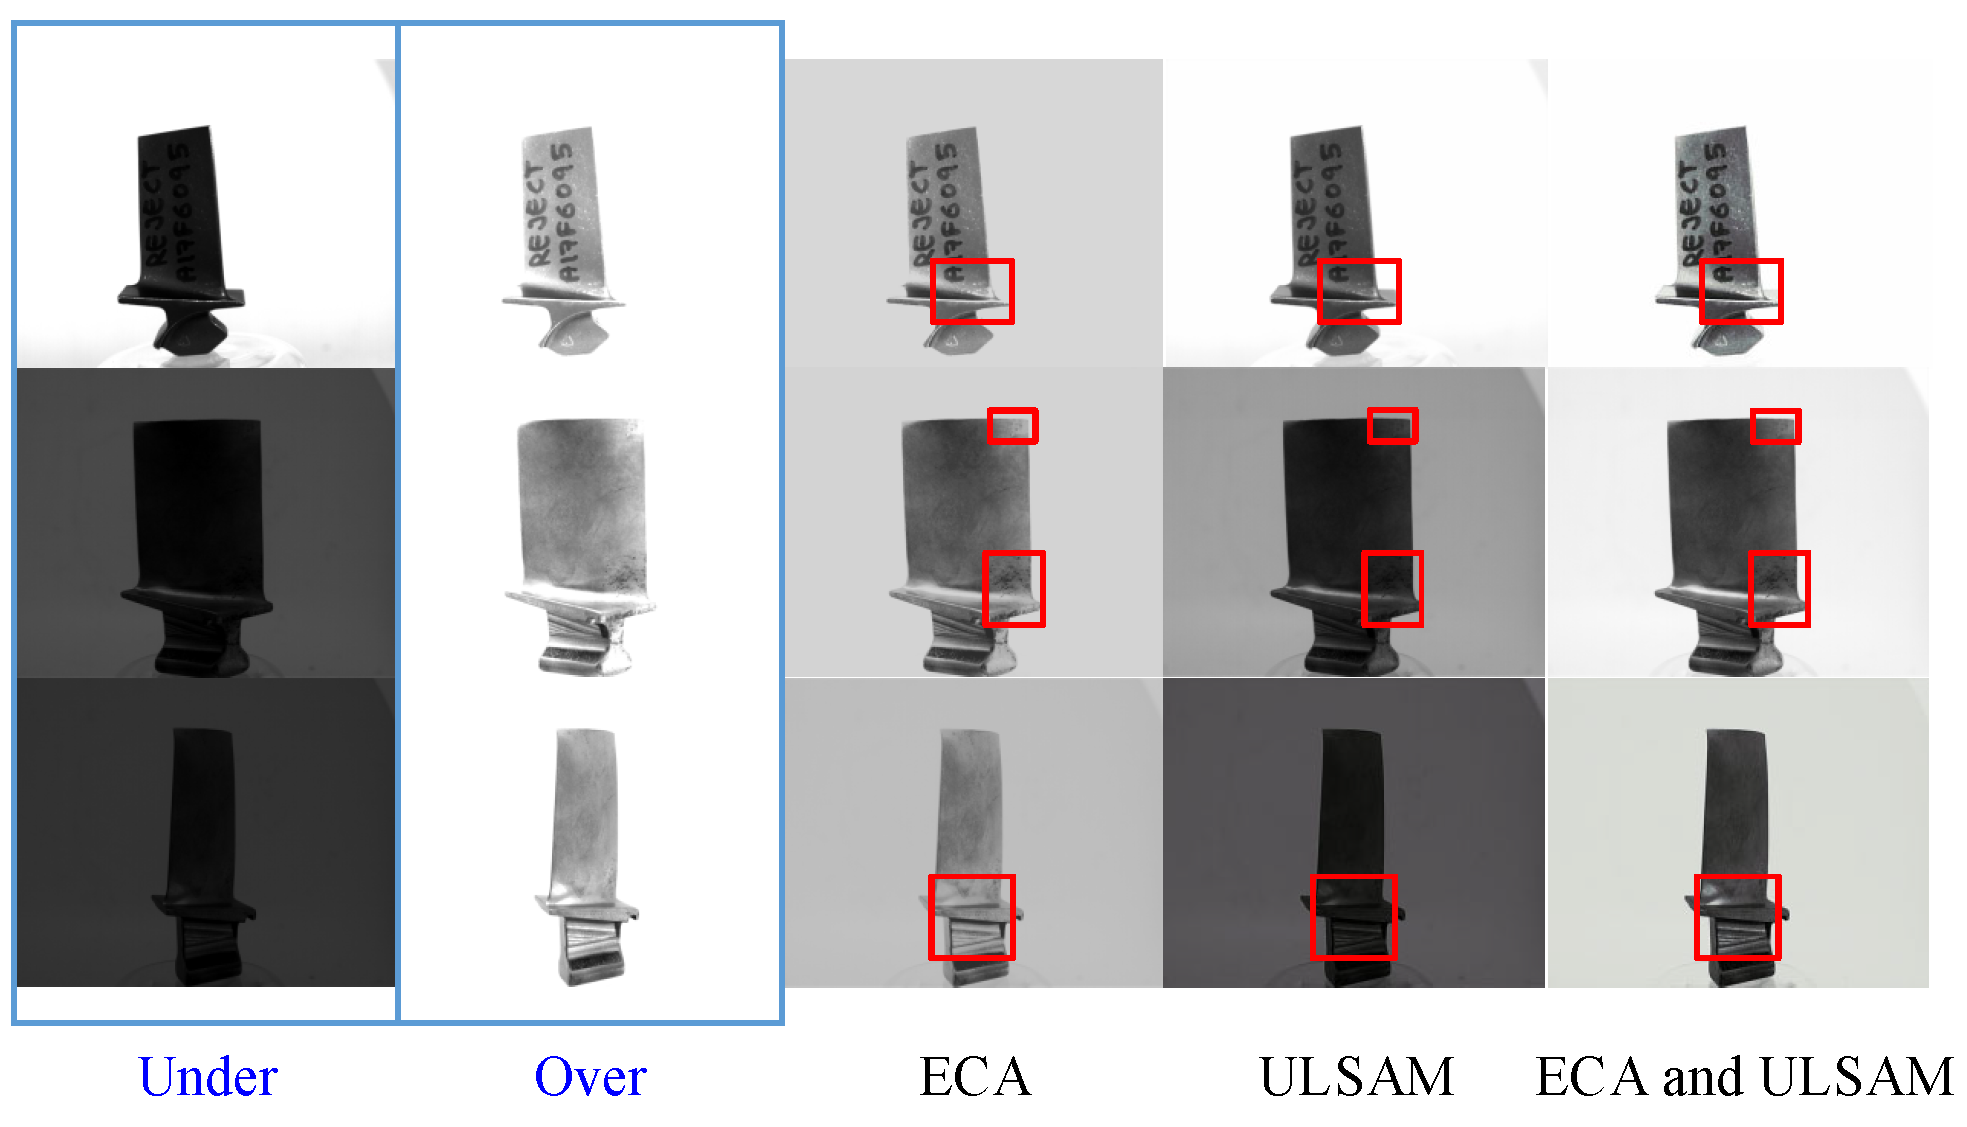
Table 4. Building upon the DenseNet network, the incorporation of the ECA module in the common layers allows the network to focus on features beneficial to the current task, thereby enhancing the model’s performance across various visual tasks and addressing the issue of overly dark images. However, the images exhibit insufficient overall contrast of the aero-engine blades, with a general brightness but without noise, leading to loss of image information and poor visual effects in the results, as shown in
Figure 12.
The ULSAM module within the decoding blocks of the decoder addresses the issue of image overexposure and insufficient contrast. However, the images show a slight blurriness in the overall aero-engine blades, a tendency towards darkness, and loss of image information, resulting in poor visual effects in the results, as shown in
Figure 12.
To further elucidate why the ELANet method is effective, an ablation study was performed on the same number of images from the same dataset. With the DenseNet network as the base, combining the ECA module in the common layers of the encoder with the ULSAM module in the decoding blocks of the decoder visualizes the effects of image reconstruction. The ELANet method reconstructs images with better detail and contrast. By integrating the overly bright effect of the ECA module with the overly dark effect of the ULSAM module, the image information is made complete, leading to a more visually pleasing fusion result, as illustrated in
Figure 12.
Table 3 indicates that nine different image fusion indices were utilized in the ablation experiment.
The ablation study conducted on the ELANet method demonstrates that the ECA module in the common layers of the network and the ULSAM module in the decoding blocks significantly reduce the noise in the fusion results. While the ULSAM module within the decoder block more effectively addresses the issue of image edge blurring. The aforementioned experiments indicate that these modules not only enhance the performance of the network but also lead to a lightweight network architecture, improving time efficiency, which is suitable for industrial applications.
