Article

Weed Detection on Architectural Heritage Surfaces in Penang City via YOLOv11

by
Shaokang Chen
1,†,
Yanfeng Hu
2,†,
Yile Chen
3,*,
Junming Chen
3 and
Si Cheng
2
1
School of the Arts, Universiti Sains Malaysia, Gelugor 11800, Malaysia
2
Faculty of Design and Architecture, Universiti Putra Malaysia, Serdang 43400, Malaysia
3
Faculty of Humanities and Arts, Macau University of Science and Technology, Avenida Wai Long, Taipa, Macau 999078, China
*
Author to whom correspondence should be addressed.
These authors contributed equally to this work.
Coatings 2025, 15(11), 1322; https://doi.org/10.3390/coatings15111322 (registering DOI)
Submission received: 18 September 2025 / Revised: 5 November 2025 / Accepted: 11 November 2025 / Published: 12 November 2025
(This article belongs to the Special Issue Solid Surfaces, Defects and Detection, 2nd Edition)

Abstract

George Town, the capital of Penang, Malaysia, was inscribed as a UNESCO World Heritage Site in 2008 and is renowned for its multicultural architectural surfaces. However, these historic façades face significant deterioration challenges, particularly biodeterioration caused by weed growth on wall surfaces under hot and humid equatorial conditions. Root penetration is a critical surface defect, accelerating mortar decay and threatening structural integrity. To address this issue, this study proposes YOLOv11-SWDS (Surface Weed Detection System), a lightweight and interpretable deep learning framework tailored for surface defect detection in the form of weed intrusion on heritage buildings. The backbone network was redesigned to enhance the extraction of fine-grained features from visually cluttered surfaces, while attention modules improved discrimination between weed patterns and complex textures such as shadows, stains, and decorative reliefs. For practical deployment, the model was optimized through quantization and knowledge distillation, significantly reducing computational cost while preserving detection accuracy. Experimental results show that YOLOv11-SWDS achieved an F1 score of 86.0% and a mAP@50 of 89.7%, surpassing baseline models while maintaining inference latency below 200 ms on edge devices. These findings demonstrate the potential of deep learning-based non-destructive detection for monitoring surface defects in heritage conservation, offering both a reliable tool for sustaining George Town’s cultural assets and a transferable solution for other UNESCO heritage sites.

Graphical Abstract

1. Introduction

1.1. An Essential Heritage of UNESCO: George Town

Historic districts are widely recognized as living records of urban development, embodying layers of cultural heritage and historical memory that connect societies to their past [1,2]. Their preservation is not only an expression of cultural respect but also a crucial element of sustainable urban development, balancing heritage conservation with social, economic, and environmental benefits [3]. In recent decades, shifting philosophies of conservation have emphasized preventive management, community participation, and technological innovation to ensure that heritage sites remain resilient under modern pressures [4].
George Town, the capital of the Malaysian state of Penang, represents an outstanding example of such heritage [5]. Inscribed on the UNESCO World Heritage List in 2008 as part of the “Historic Cities of the Straits of Malacca,” its 154.68-hectare core area preserves a remarkable fusion of Asian and European influences shaped by over five centuries of maritime trade. The district’s iconic “Straits Eclectic” shophouses—combining Chinese wood carvings, Malay verandahs, Victorian cast-iron balconies, and decorative tiles—demonstrate the architectural hybridity that defines its Outstanding Universal Value [6]. Figure 1 provides an overview of George Town’s location on Penang Island, its UNESCO-designated core zone, and representative architectural streetscapes. The images also highlight the growing problem of spontaneous vegetation and weed infestation on historic façades, which threatens both structural stability and visual integrity.
To safeguard this legacy, the Penang state government established George Town World Heritage Incorporated in 2010 and later enacted the George Town World Heritage Special Area Plan (2016), which institutionalized principles of preventive maintenance and community governance [7]. Yet, despite these initiatives, the site faces mounting conservation challenges. Tourism surged immediately after inscription, with nearly six million visitors recorded in 2009, while Penang’s population has continued to grow, increasing demand for housing and infrastructure. Planned light rail corridors linking the historic core to surrounding areas threaten to introduce vibration, dust, and traffic pressures into the fragile urban fabric. These socio-environmental stresses compound existing vulnerabilities, such as tropical weathering and biodeterioration, underscoring the urgent need for innovative conservation strategies. Against this backdrop, the present study introduces an artificial intelligence-based approach to real-time weed detection as a means of supporting sustainable management and offering transferable insights for heritage cities worldwide.

1.2. Threats from Weeds

Vegetation, particularly self-propagating weeds, has emerged as one of the most pervasive but often underestimated threats to architectural heritage [8]. Acting through both mechanical and biochemical mechanisms, weeds compromise structural integrity by penetrating mortar joints, dislocating masonry units, and weakening cohesion through the secretion of organic acids that dissolve carbonates and mobilize salts [9]. These processes are aggravated by prolonged surface moisture retention, salt-crystallization cycles, and pre-invasion biofilms, which accelerate deterioration while creating habitats for pests and secondary risks such as fire and falling debris [10,11,12]. Case studies from Rome’s Aurelian Walls and the Royal Palace of Portici have demonstrated that invasive species like Ailanthus altissima cause block detachment and deformation, while annual herbaceous plants preferentially colonize weak mortar joints, escalating maintenance costs and safety hazards [13,14]. Yet, damage intensity varies significantly among species, with perennial weeds generally more destructive than annuals due to their biomass, adaptability, and ability to propagate vegetatively [15].
George Town is particularly vulnerable to such processes due to its equatorial rainforest climate, which delivers over 2400 mm of rainfall annually, and the reliance of historic shophouses on porous clay bricks and lime mortar—materials highly susceptible to root penetration and acid attack [5]. Anthropogenic stressors, including tourism pressures and planned light-rail construction, further introduce vibration, micro-cracking, and nutrient deposition, creating favorable microsites for colonization. Beyond physical degradation, weeds also erode the visual quality of heritage streetscapes, undermine functional infrastructure, and negatively influence visitor perceptions, thereby reducing dwell time, repeat visits, and willingness to pay for cultural experiences [16,17]. These aesthetic and economic consequences directly threaten the Outstanding Universal Value for which George Town was inscribed on the UNESCO World Heritage List.
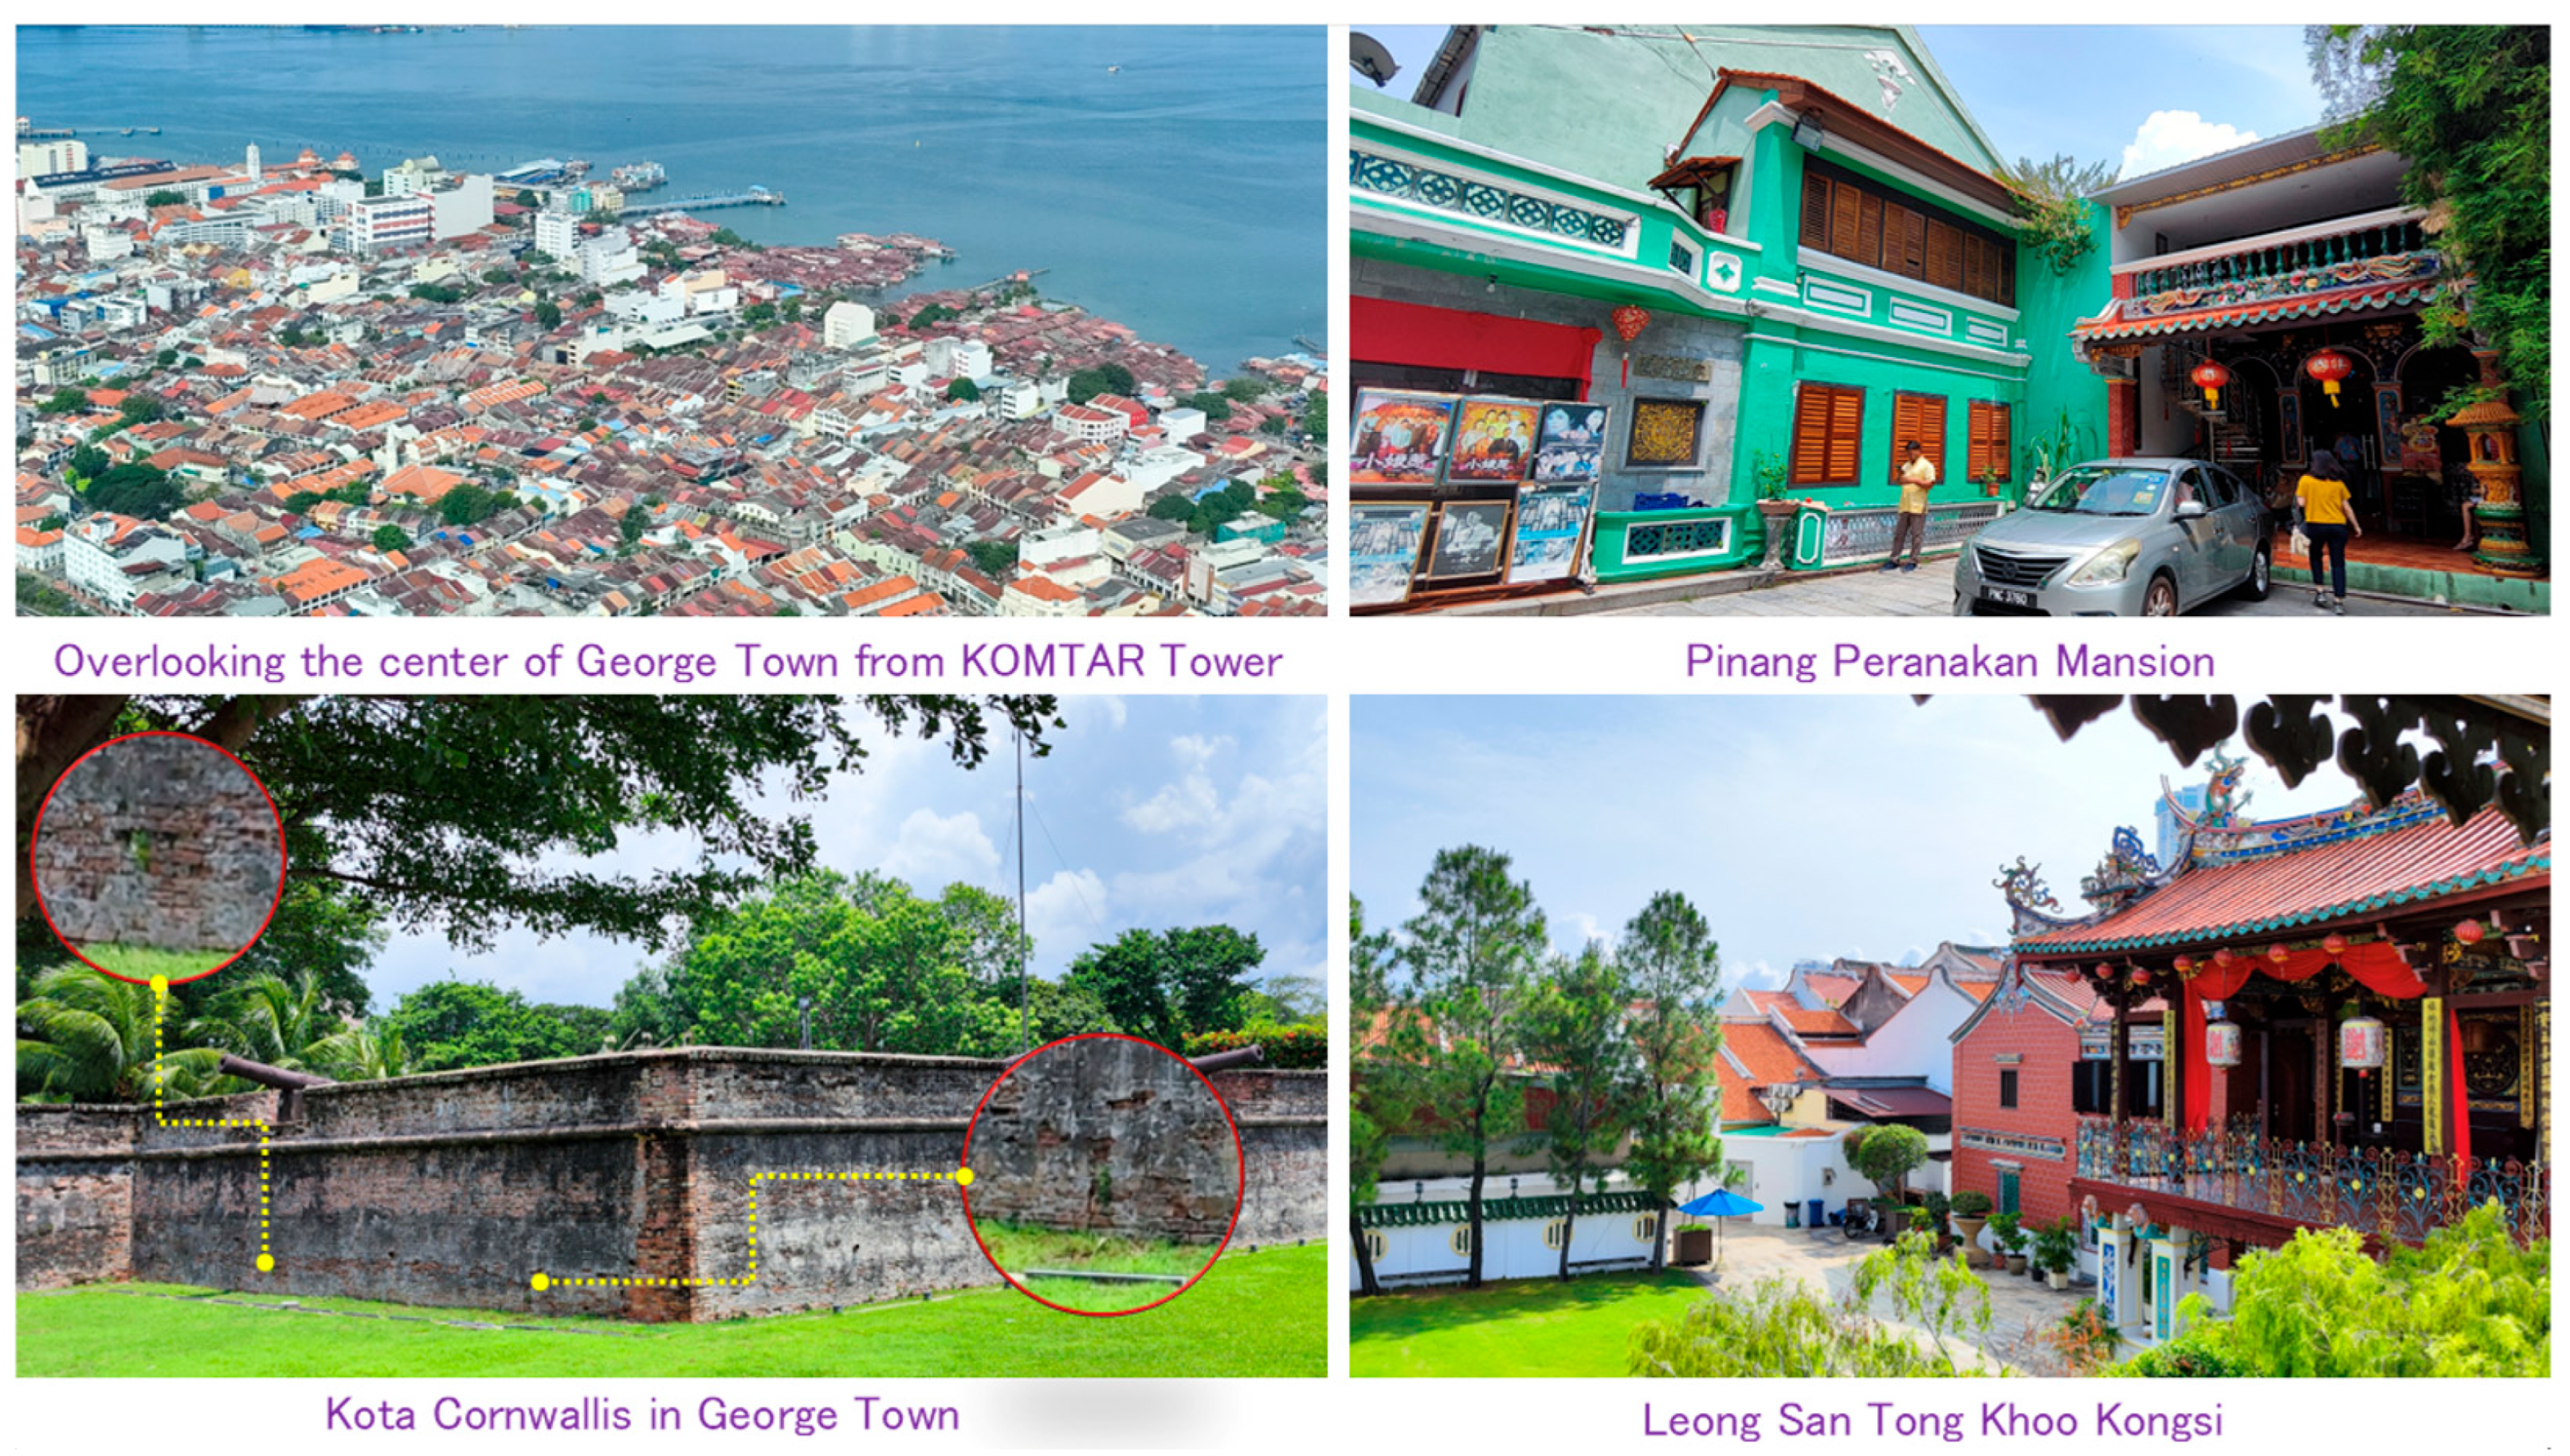
Field observations across George Town indicate that, although weeds are not extensively widespread, localized intrusions can still be observed on certain historic building surfaces. As shown in Figure 2, different types of heritage structures exhibit varying degrees of early vegetation colonization. From KOMTAR Tower, the dense roofscape of historic shophouses reveals the high porosity of brick masonry, which under prolonged moisture exposure provides potential sites for weed germination. At the Pinang Peranakan Mansion and Leong San Tong Khoo Kongsi, the overall façades are relatively well maintained. However, isolated weeds are still visible around cornices and window frames, where surface roughness and residual moisture facilitate growth. At Kota Cornwallis, weed intrusion is more evident, particularly in the mortar joints of red brick masonry (highlighted in the magnified circles in Figure 1), showing early signs of root penetration and minor mortar loss. Although currently limited in extent, these localized manifestations highlight the potential risks of biodeterioration in tropical climates and underscore the necessity of developing systematic monitoring methods.
Despite recognition of vegetation as a conservation hazard, systematic and real-time monitoring of weeds on historic façades remains limited. Traditional inspection is labor-intensive, subjective, and dependent on visual expertise, which can vary between observers and lacks temporal continuity. Photogrammetric and UAV-based documentation methods have improved spatial coverage but remain constrained by manual feature extraction, limited temporal resolution, and the inability to automatically distinguish between biological and non-biological surface anomalies. These techniques often generate large datasets that require human interpretation, slowing response time and increasing maintenance costs.
In contrast, deep learning-based detection frameworks offer an automated, scalable, and data-driven alternative. By directly learning discriminative visual features such as leaf morphology, texture irregularities, and chromatic variations, deep neural networks can achieve high precision even under low contrast, occlusion, or irregular lighting conditions. When embedded into preventive conservation workflows, such models can provide near-real-time alerts and facilitate adaptive maintenance planning. In this context, the proposed YOLOv11-SWDS addresses the current gap by enabling non-invasive, fine-grained, and reproducible detection of vegetation colonization on architectural surfaces, thereby supporting more proactive and evidence-based heritage management.
Diverging views persist over whether manual removal or chemical treatments are sustainable, with both approaches criticized for either high costs or potential damage to original materials. In this context, preventive detection systems that provide rapid, non-invasive, and scalable responses are urgently needed. This study addresses the gap by assembling a high-resolution façade image dataset of George Town and proposing a YOLOv11-based detector for automated weed localization. By embedding deep learning into preventive maintenance cycles, site managers can better prioritize interventions, optimize resource allocation, and strengthen long-term resilience in heritage conservation.

1.3. The Application of Computer Vision Technology to Architectural Heritage

Computer vision, a core branch of artificial intelligence, equips computer systems with human-like image recognition capabilities [18]. Among its developments, the “You Only Look Once” (YOLO) family of algorithms has become one of the most influential frameworks in object detection, offering real-time performance and high accuracy by reformulating detection as a single regression problem [19,20]. Since its introduction, successive versions such as YOLOv1–YOLOv11 have progressively enhanced detection precision, robustness, and efficiency [21,22]. Today, the YOLO series is widely adopted across diverse fields, including security monitoring [23,24], autonomous driving [25,26], medical imaging [27], and cultural heritage protection [28,29], and continues to evolve through integration with hybrid modules and deployment in edge environments.
In the domain of architectural and cultural heritage, computer vision has emerged as a promising tool for documentation, analysis, and conservation. Applications include classification of historic buildings [30], automated detection of structural damage [31,32], and mapping of archeological sites using drone imagery and semantic segmentation [33]. In parallel, remote sensing (RS) and Earth Observation (EO) technologies have also been extensively employed in heritage documentation and risk assessment. Previous studies have applied manual, semi-automatic, and automatic approaches using satellite imagery, aerial photography, geophysical surveys, and unmanned aerial vehicles (UAVs) to discover, protect, and monitor archeological sites and cultural landscapes worldwide [34,35]. For instance, Luo et al. [36] and Chen et al. [37] advanced the use of specific satellite data and processing pipelines to generate radar and deformation maps that support structural monitoring. Beyond technical innovation, Tapete and Cigna emphasized multidisciplinary collaboration, shared data-processing standards, and capacity building as key strategies for sustainable cultural heritage protection [38,39]. However, the majority of RS and EO research has focused on macro-scale hazards such as earthquakes, landslides, or soil erosion, while micro-scale biological deterioration—especially spontaneous vegetation and weed intrusion on façades—remains underexplored.
Compared with traditional manual surveys, computer vision provides more systematic, scalable, and cost-effective solutions for heritage management. Yet, despite its potential, research on the use of deep learning for the fine-grained monitoring of heritage surfaces remains limited. Current studies often focus on large-scale infrastructure or environmental management, while spontaneous vegetation growth—an urgent and recurrent threat to heritage façades—has received little systematic attention.
Technical barriers partly explain this gap. Weeds on heritage surfaces are often small, irregularly distributed, and embedded in visually complex textures, making them difficult for conventional object detection models to identify. Moreover, most deep learning models demand large datasets and computational resources, which hinders real-time deployment in resource-constrained conservation settings.
To address these challenges, this study develops a YOLOv11-based system tailored for weed detection on the façades of George Town’s historic buildings. The contributions of this work are threefold: (i) an enhanced YOLOv11 backbone incorporating multi-scale feature extraction to improve detection of small, densely distributed weeds on complex surfaces; (ii) a hybrid attention mechanism that integrates channel-wise and spatial-level modules to reduce false positives in cluttered environments; and (iii) edge deployment optimization through pruning and quantization, ensuring low-latency inference suitable for real-world conservation scenarios. Together, these advances provide a technical paradigm for predictive maintenance in heritage conservation and contribute to the broader integration of artificial intelligence into city heritage management.

2. Materials and Methods

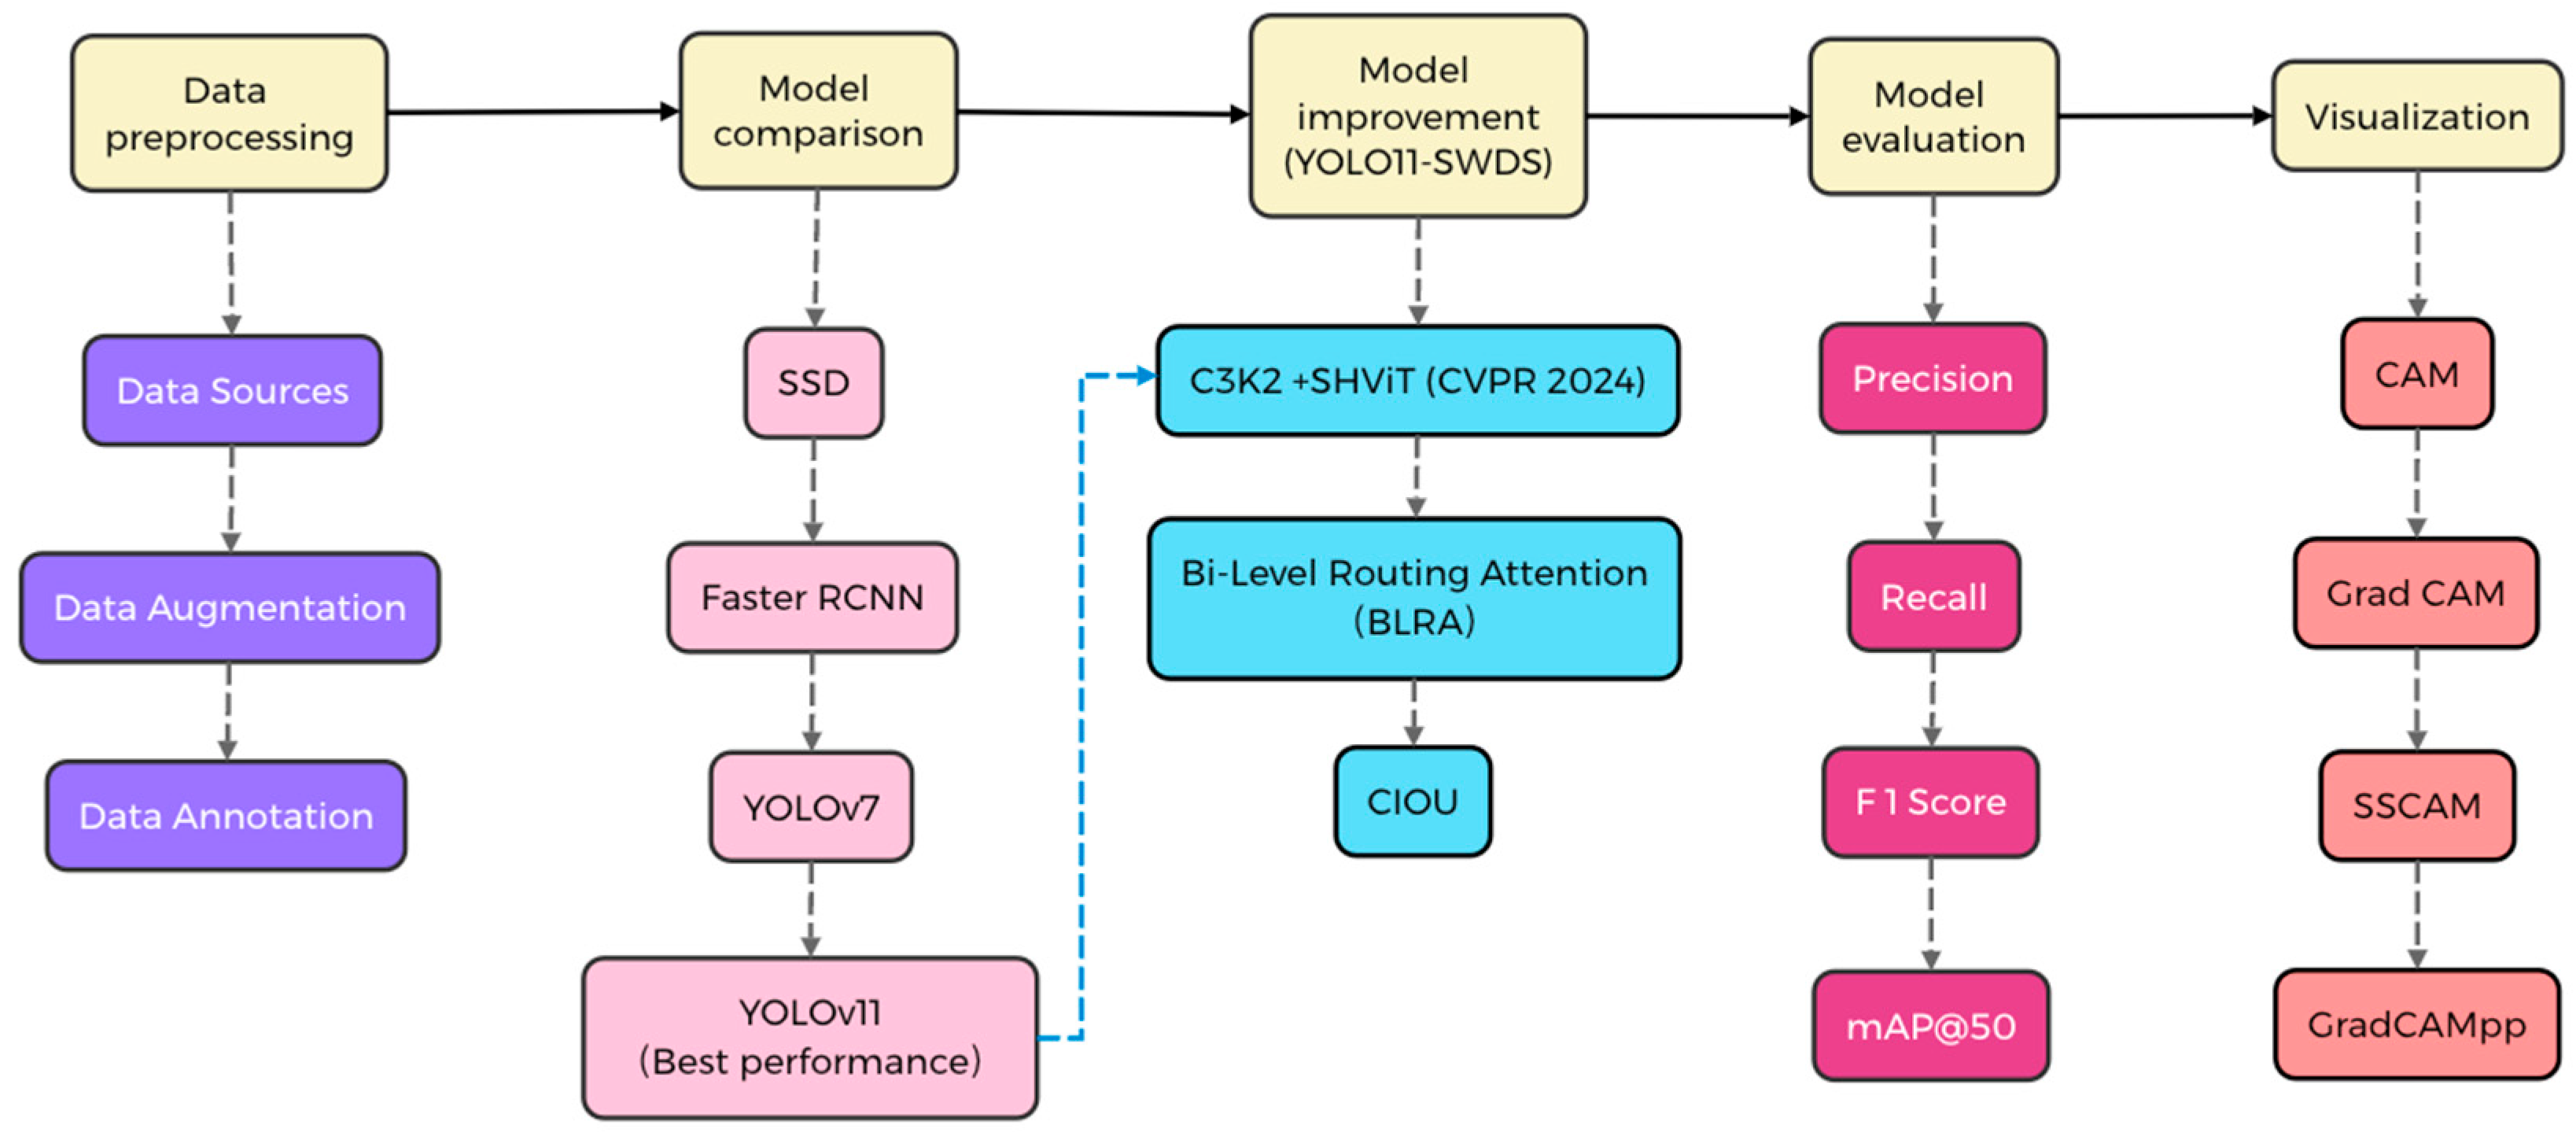
The Surface Weed Detection System (SWDS) method uses the YOLOv11 detection model, which can achieve fast and accurate object detection without the need for a region proposal network. The system is optimized to reduce the number of parameters required for detection, thereby improving efficiency. SWDS uses computer model learning to automatically detect weeds in images and video streams. The method consists of five stages, as shown in Figure 3.

2.1. Data Prerocessing

2.1.1. Data Collection and Processing

Stage one is data collection and processing. The weed image dataset was mainly constructed through the following field survey collection: in collaboration with horticulturalists, botanists, and heritage conservation experts, we conducted in situ documentation across George Town. Weed imagery was captured using high-resolution DSLR cameras and low-altitude drones, focusing on historical architectural surfaces.
The field survey was conducted between March and August 2024 across multiple representative areas within George Town’s UNESCO World Heritage Core Zone, including Armenian Street, Love Lane, Church Street, and the surroundings of Fort Cornwallis and Pinang Peranakan Mansion. These locations were selected to capture diverse architectural typologies such as shophouses, colonial masonry, and temple façades. Image acquisition was carried out under natural daylight conditions (08:00–17:00) on non-rainy days, ensuring stable illumination and minimal moisture interference. The average ambient temperature during documentation ranged from 28 to 33 °C with relative humidity between 70 and 90%, typical of Penang’s equatorial climate. To complement field data, a limited number of open-source weed images (less than 10%) from publicly available academic repositories were used to enrich morphological diversity. All external images were verified for non-duplication through visual cross-checking and filename hashing to ensure dataset uniqueness and integrity.
Following the field documentation, the research team systematically optimized and standardized all collected images to meet the strict requirements of model training. Image preprocessing was conducted using Adobe Photoshop CC 2023 (v24.0) with semi-automated batch actions to ensure reproducibility and minimize subjective intervention. The workflow comprised the following sequential steps: (i) Cropping: Images were manually cropped using bounding boxes to retain façade regions of interest while excluding irrelevant portions such as sky, pedestrians, or vehicles. (ii) Resizing: All images were standardized to 1024 × 1024 pixels to meet the model’s input requirements. (iii) De-noising: A Gaussian filter (radius 0.5–1.0 px) was applied only when high ISO noise was detected (>ISO 1600). (iv) Color restoration: Auto Color Correction (default parameters) was applied in batch mode, with manual fine-tuning if façade discoloration exceeded ΔE > 5 on CIE-Lab histograms. (v) Brightness and contrast: Histogram mid-tone peaks were maintained within 100–140 on an 8-bit scale; corrections were triggered when values fell outside this range. (vi) Perspective correction: Applied when tilt angles exceeded 5°, as measured through vanishing-line estimation on façade edges. All operations were scripted and executed consistently across the dataset, with manual interventions limited to fewer than 5% of images, primarily for severe lighting or occlusion issues.
We acknowledge, however, that such preprocessing may reduce background variability and potentially limit the model’s generalization to unseen environments. To mitigate this, cropped and preprocessed images were complemented with augmentation techniques such as mosaic composition and perspective shifts, and diverse architectural contexts were deliberately retained across the dataset. Nevertheless, this remains a limitation that future work should address by enlarging the dataset with additional raw, unaltered imagery.
In total, the dataset comprises 4522 high-resolution images and 5844 annotated bounding boxes across various weed and building categories, as well as weed growth contexts (e.g., wall joints, stone cracks, and moist architectural seams) for subsequent data processing and model training. All image acquisitions strictly adhered to data usage regulations and were used solely for academic research, teaching, and non-commercial algorithm validation.

2.1.2. Data Augmentation

The second stage focused on data augmentation to enhance dataset diversity and strengthen the model’s robustness against visual heterogeneity typical of heritage conservation contexts. Importantly, the augmentation procedures were implemented programmatically using Albumentations v1.4.3 (Python 3.10, CUDA 11.8) to ensure reproducibility and consistency across all samples. All outputs were restricted to academic research, teaching, and non-commercial algorithm validation.
The augmentation strategies were grouped into four categories, with the rationale for each stage explicitly considered to avoid unnecessary redundancy with preprocessing: (i) Geometric transformations (random cropping with object-preservation constraints, ±90° rotations, horizontal flips, and uniform scaling to 1024 × 1024 pixels). These operations introduced viewpoint and spatial variability not covered by initial manual cropping. (ii) Photometric adjustments (randomized brightness, contrast, saturation, and hue shifts). While global brightness and contrast corrections were already applied in preprocessing to standardize image quality, these augmentation steps were stochastic and designed to simulate uncontrolled illumination variability (e.g., shadows, seasonal lighting, reflective façades). Thus, preprocessing ensured baseline consistency, while augmentation introduced controlled randomness for robustness. (iii) Advanced compositional augmentation using mosaic compositing (4-image combinations) to create diverse contextual co-occurrence scenarios and simulate complex façade conditions with multiple weed species. This step enriched background and inter-object variability beyond what could be achieved with single-image preprocessing. (iv) Semantic foreground enhancement using GrabCut-based segmentation to extract weed structures from visually cluttered backgrounds such as reflective tiles, stains, or decorative architectural motifs. This improved feature salience for small or occluded weeds. We explicitly acknowledge that such segmentation may reduce real-world background variability; therefore, GrabCut-enhanced images were used in combination with unaltered and mosaic-augmented samples to preserve ecological diversity. Figure 4 illustrates the outcomes of each augmentation type. Subfigure A presents geometric transformations; Subfigure B shows photometric jitter simulating diverse lighting; Subfigure C–E depict mosaic augmentation strategies; and Subfigure F demonstrates the GrabCut-based enhancement workflow.
In conclusion, this multi-stage augmentation pipeline balanced standardization, variability, and salience, ensuring that the model was trained on both consistent quality inputs and diverse, ecologically realistic scenarios.

2.1.3. Data Annotation

Phase three is data annotation. Annotation followed a hybrid strategy combining AI-assisted labeling and expert validation. Initially, a YOLOv11-based pre-labeling model was deployed to generate bounding boxes. These annotations were subsequently verified and corrected using LabelImg by a team of trained botanists and urban ecology specialists. The annotation process adhered to a strict taxonomy guideline to ensure class consistency and bounding box precision. Inter-Annotator Agreement (IAA) testing yielded a Kappa coefficient of 0.91, indicating high labeling quality and inter-rater consistency. In addition to semantic labeling, we also considered structural-scale annotation to support fine-grained statistics of weed types and spatial distributions on architectural surfaces.
The dataset was divided into two main subsets: 80% for model development (training phase) and 20% for external validation (performance evaluation). Within the development subset, 20% of the data were randomly held out at each epoch as an internal validation buffer to monitor convergence, tune hyperparameters, and prevent overfitting during training. This hierarchical validation strategy—comprising an internal validation buffer for model tuning and an external validation subset for independent evaluation—ensured both stable optimization and fair performance assessment. Importantly, all final metrics (Precision, Recall, F1, and mAP@50) were computed exclusively on the external validation subset, which was never used for gradient updates or parameter fitting. This design minimized the risk of data leakage and overfitting, providing an impartial basis for evaluating the model’s generalization capability.
In addition to standard augmentation, advanced preprocessing steps were applied to enhance visual discriminability, including de-noising, perspective correction, and color normalization, ensuring optimal feature contrast for detecting minute plant structures against complex masonry backgrounds. During annotation, we employed a priority-based multi-label strategy, where overlapping weeds were ranked by risk level (e.g., root erosion > stem spread > leaf accumulation), ensuring that critical deterioration patterns were emphasized for model learning. Finally, in anticipation of deployment in heritage building management systems, our annotations also support unit-level surface analysis, enabling the automatic quantification of weed coverage ratios per structural unit—an essential input for preventive maintenance and conservation workflows.

2.2. Model Comparison and Improvement

For model comparison, we implemented three widely used object detection models—Faster R-CNN, SSD, and YOLOv7-tiny—as comparative baselines. All models were constructed, trained, and validated under conditions consistent with those used for the proposed YOLOv11-SWDS framework to ensure comparability.
Faster R-CNN uses the Detectron2 framework (v0.6, PyTorch 2.0 backend). The backbone was ResNet-50 with FPN (Feature Pyramid Network) pretrained on COCO. The Region Proposal Network (RPN) was configured with 300 proposals per image, anchor scales {32, 64, 128, 256, 512}, and aspect ratios {0.5, 1, 2}. Training used a learning rate of 0.0025, batch size of 4, and 12 k iterations with stepwise decay. SSD uses MMDetection (v3.1) with the VGG-16 backbone pretrained on ImageNet. Training was conducted with a learning rate of 0.001, momentum of 0.9, weight decay of 0.0005, batch size of 16, and 120 k iterations. Multi-scale feature maps from conv4_3 to conv11_2 were used for detection, following the original SSD-512 design. YOLOv7-tiny uses the official YOLOv7 repository (v0.1, PyTorch 2.0). The network depth and width multipliers were 0.33 and 0.50, respectively, as defined in the tiny configuration. Training was performed with a batch size of 16, learning rate of 0.01, SGD optimizer with momentum 0.937, weight decay 0.0005, cosine learning rate schedule, and 200 epochs.
All baseline models were trained on the same training dataset (80% of the annotated weed dataset) and validated on the same validation split (20%) as the proposed model. Evaluation followed the same metrics (Precision, Recall, F1-Score, and mAP@50) to ensure a standardized comparison with YOLOv11-SWDS.
This study introduces three key improvements to the YOLOv11 architecture to enhance feature representation, cross-scale information interaction, and localization robustness—specifically for the task of weed image detection. The overall model structure still consists of three parts: Backbone, Neck, and Head, but each stage has been optimized with targeted structural improvements to increase detection accuracy in complex architectural environments.
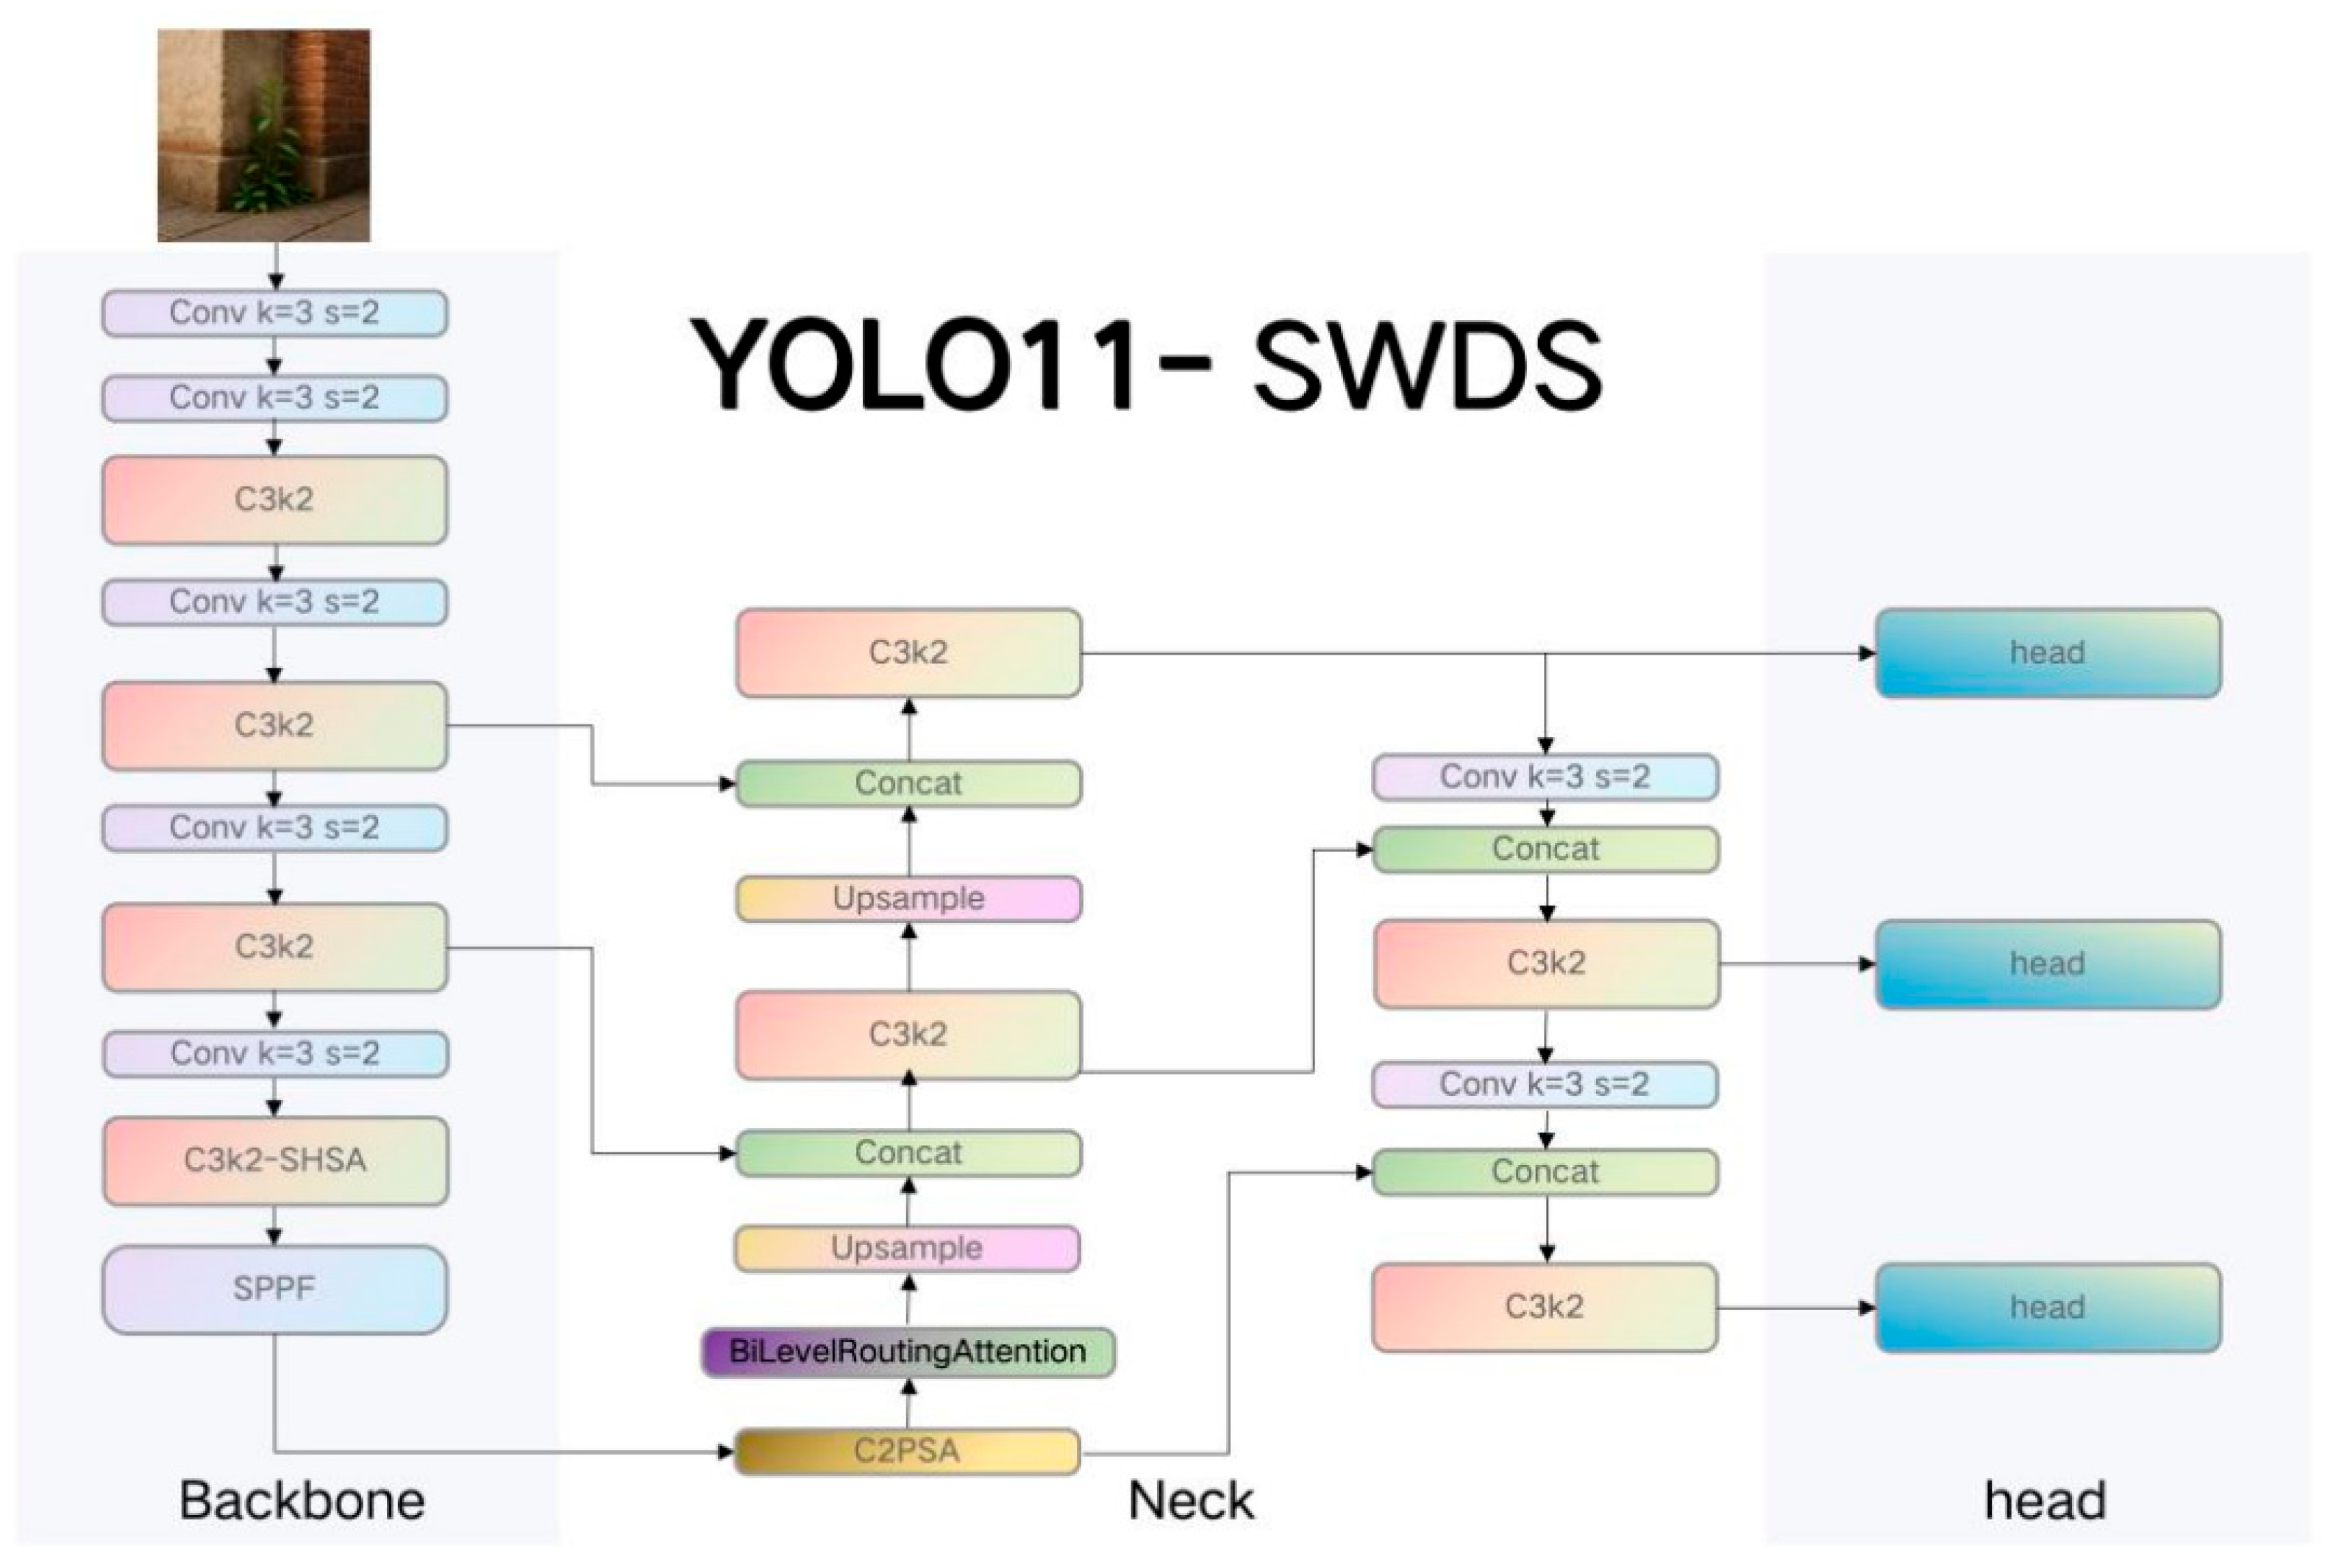
As shown in Figure 5, the improved model architecture includes three core enhancements: integration of the SHViT [40] attention-based feature extraction module, incorporation of Bi-Level Routing Attention [41] for cross-scale feature fusion, and adoption of PIOU [42] for more robust bounding box regression.
Specifically, in the Backbone, we adopted a hybrid architecture that integrates convolutional and transformer-based components to enhance hierarchical representation learning, as illustrated in Figure 6. The backbone begins with an Overlapping Patch Embedding module, which partitions the input image into partially overlapping patches to preserve spatial continuity and local texture information—an essential design for modeling complex surface structures found in architectural heritage. This embedding is then processed by a multi-level C3k2 module, which facilitates inter-layer feature propagation and fusion through densely connected convolutional blocks. To capture more abstract semantic patterns in deeper layers, we incorporate a C3k2-SHSA (Shifted Hybrid Self-Attention) module. This module serves as a transition from purely convolutional modeling to hybrid attention mechanisms.
At its core lies the SHViT (Shifted Hybrid Vision Transformer), which integrates convolutional locality encoding with transformer-style global modeling. Unlike conventional multi-head attention, SHViT utilizes a single-head parallel attention strategy that simultaneously captures local structural features, global spatial dependencies, and semantic consistency with reduced computational overhead. As shown in the right half of Figure 6, the SHViT output is explicitly decoupled into three branches: (i) Local Feature Modeling: Captures high-resolution texture patterns and edge features (e.g., cracks, leaf veins, surface erosion). (ii) Global Feature Modeling: Aggregates long-range dependencies and spatial layout cues, ensuring the network can model weed distribution patterns across large architectural planes. (iii) Single-head Attention: Maintains modeling efficiency while aligning attention distribution across both micro and macro levels.
The outputs from these branches are adaptively fused, forming a robust feature map that enhances the network’s ability to identify low-contrast, cluttered, or partially occluded weeds commonly found in corner areas, wall crevices, or moisture-prone seams of heritage structures. By combining deep convolutional priors with transformer-based attentional abstraction, this SHViT-enhanced backbone ensures stronger feature expressiveness and localization sensitivity, making it particularly well-suited for fine-grained weed detection in structurally complex, noise-prone visual environments.
Specifically, in the Neck part, while retaining the conventional FPN + PAN multi-scale feature fusion structure, we integrated the Bi-Level Routing Attention (BLRA) module to enhance the quality of cross-scale semantic interaction, as illustrated in Figure 6. BLRA serves as the core mechanism in BiFormer, characterized by its query-adaptive and content-aware sparse connectivity, which enables efficient and scalable attention computation across hierarchical feature maps.
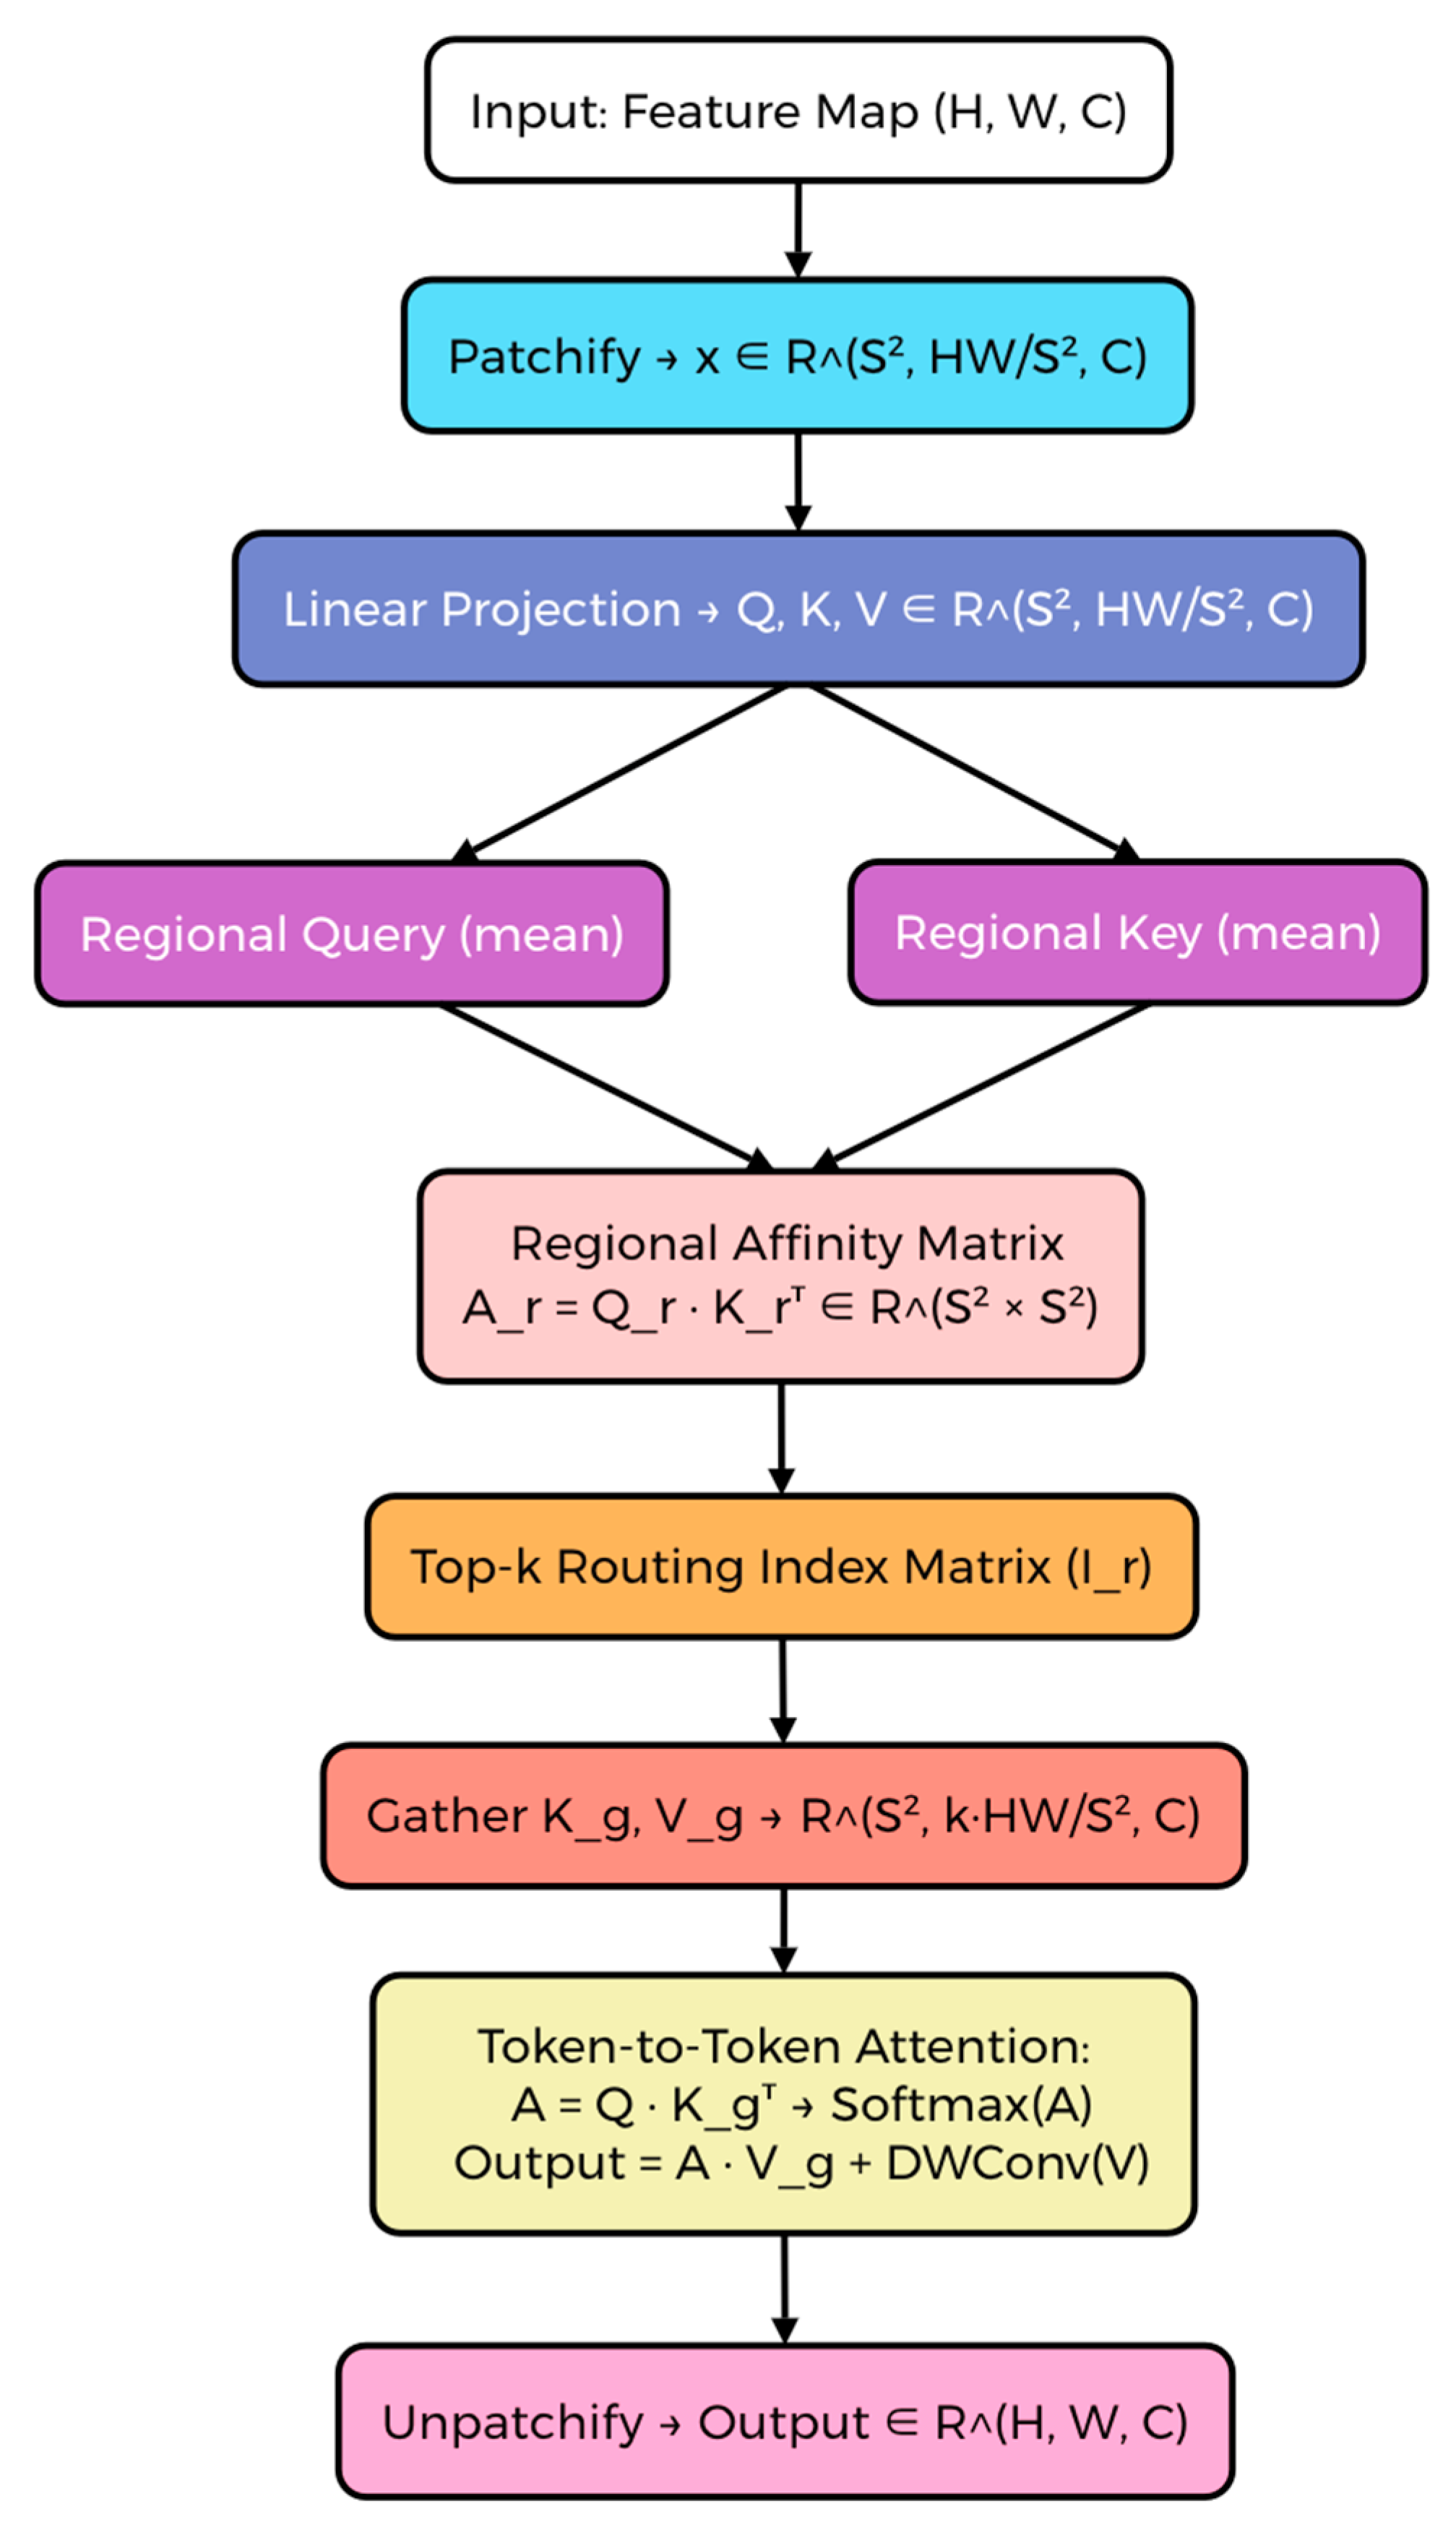
The BLRA mechanism operates in two stages: (i) Regional Attention Routing: The input feature map is first patchified into spatial regions of size H S × W S , where each region corresponds to a local semantic group. Linear projections generate the query Q , key K , and value V representations. Subsequently, regional queries and keys are aggregated via mean pooling to form a coarse-grained regional representation. The regional affinity matrix A r = Q r · K r T captures inter-region semantic similarity, upon which a top-k routing index matrix I r is computed to identify the most relevant regions per query. (ii) Token-to-Token Sparse Attention: Using the top-k index, corresponding key, and value tokens K g , V g R s 2 , k · H W / s 2 , C are gathered to compute fine-grained token-level attention. The final attention map is calculated as:
A   = S o f t m a x Q · K g T , O u t   = A · V g + D W C o n v ( V )
The output is then unpatchified to restore the spatial resolution of the original feature map. This bi-level routing strategy allows BLRA to focus selectively on both coarse regional context and fine token details, which is particularly effective in detecting small and contextually embedded weed structures, such as tendrils, grass sprouts, or creeping roots (Figure 7). By enhancing long-range dependencies while minimizing computational overhead, BLRA significantly improves feature expressiveness in high-resolution branches. To further improve localization accuracy, we also incorporated C2PSA (Channel–Position Spatial Attention) following BLRA. This module introduces both channel-level semantic filtering and spatial position encoding, guiding the network to attend to structurally relevant regions such as cracks, brick seams, moisture traps, and architectural crevices. The combination of BLRA and C2PSA forms a hybrid attention pipeline, which effectively increases sensitivity to subtle variations in low-contrast areas and strengthens the overall robustness of the detection system.
In sum, in the Neck part, while retaining the FPN + PAN multi-scale feature fusion structure, the model incorporates the Bi-Level Routing Attention (BLRA) module to improve feature interaction quality, as shown in Figure 7. As the core mechanism of BiFormer, BLRA possesses query-adaptive and content-aware sparse connection capabilities, enabling efficient routing of cross-scale semantic information. This is particularly effective in detecting tiny targets such as tendrils and grass sprouts, where it strengthens the response of high-resolution feature layers. In addition, we combined BLRA with C2PSA (Channel–Position Spatial Attention) to form a more directional and position-sensitive attention mechanism. C2PSA helps the model automatically focus on semantically meaningful regions, such as cracks, brick seams, and plant roots in corners, further enhancing robustness and localization accuracy.
Finally, the traditional CIOU loss function suffers from issues such as large convergence errors and unstable boundaries when dealing with irregular contours and high aspect-ratio targets. Therefore, in this study, we replaced it with the PIOU (Pixels-IoU) Loss, which is defined based on a pixel-level IoU distance function. This loss function simultaneously accounts for rotation angle and bounding box overlap quality, making it suitable for modeling boundary uncertainty under complex backgrounds. Experimental results show that PIOU effectively reduces both missed and false detections in high aspect-ratio weed recognition on building surfaces and significantly improves the model’s localization performance under irregular edges and occlusion conditions.
To ensure the accuracy and speed of the model in real-time scenarios, the training configuration of the YOLOv11-SWDS model incorporates multiple performance optimization strategies. The system runs on a Windows 11 (X64) platform with CUDA version 11.5 and PyTorch (1.13.0). It leverages a GeForce RTX 3070 (16 GB) GPU and an AMD Ryzen 9 5900HX processor (3.30 GHz), providing an efficient and robust training and inference environment. The model adopts a modern C2F (Cross-Stage Partial with Focus) design, enhancing both feature extraction and multi-scale fusion while maintaining lightweight deployment capability. This makes the system particularly effective for identifying fine-grained targets such as tendrils and root filaments embedded in architectural joints.
The training process follows a two-stage training strategy. In the freeze stage (epochs 0–50), the backbone is frozen and only the detection heads are trained to stabilize early learning. In the unfreeze stage (epochs 50–200), the entire network is optimized with the backbone unfrozen. The batch size is set to 4 during the freeze stage and adjusted to 2 during the unfreeze stage due to memory constraints. Stochastic Gradient Descent (SGD) is used with an initial learning rate of 0.01 and momentum of 0.937, combined with a cosine decay schedule (minimum LR = 0.0001). Input image size is fixed at 1024 × 1024 pixels. Model checkpoints are saved every 5 epochs, and training is accelerated with 8 parallel data loaders.

2.3. Evaluation Metrics

After model selection and optimization, we focused on model evaluation. To comprehensively evaluate the performance of the constructed weed detection model in complex scenarios, we adopted multiple evaluation metrics, including Precision, Recall, F1-Score, and mAP@50. These metrics reflect the detection capability of the model from different perspectives and are particularly important in practical applications where the cost of detection errors must be considered and balanced.
To assess the classification of weed species, we used the following metrics:
(i) Precision measures how many of the images predicted as “weeds” are actually weeds.
P r e c i s i o n = T r u e   P o s i t i v e s   ( T P ) T r u e   P o s i t i v e s T P + F a l s e   P o s i t i v e s   ( F P )
TP (True Positives) denotes the number of weed instances correctly detected and classified by the model (i.e., predicted bounding boxes that overlap with ground-truth weed annotations at IoU ≥ 0.5). FP (False Positives) refers to the number of non-weed regions or background elements incorrectly predicted as weeds.
(ii) Recall measures how many of the true “weeds” are successfully detected.
R e c a l l = T r u e   P o s i t i v e s   ( T P ) T r u e   P o s i t i v e s   T P + F a l s e   N e g a t i v e s   ( F N )
In this context, FN (False Negatives) denotes the number of ground-truth weed instances that were missed by the model (i.e., weeds present in the annotation but not detected by the model at IoU ≥ 0.5).
(iii) F1-Score. The F1 score is the harmonic mean of precision and recall, and is calculated as:
F 1   S c o r e = 2 · P r e c i s i o n × R e c a l l P r e c i s i o n + R e c a l l
(iv) Object detection metrics (bounding box evaluation). Since the model performs both classification and object localization, the accuracy of the bounding box must be evaluated using the following metric: Mean Average Precision at Intersection over Union (IoU) 0.5 (mAP@50). This metric evaluates the model’s object detection performance by measuring the average precision at which the predicted bounding box is at least 50%. A higher mAP@50 score indicates a higher accuracy in identifying and locating weeds. The calculation formula is:
I o U   = A r e a   o f   I n t e r s e c t i o n A r e a   o f   U n i o n
For visualization, this study further introduced multiple techniques to enhance the interpretability and transparency of the model, which is particularly important for non-technical users in decision-making scenarios such as urban heritage conservation and weed control. Since YOLO is a detection model with multiple outputs (bounding boxes and class probabilities), we adapted the visualization methods to highlight feature responses corresponding to both the predicted class and its associated bounding box region. Specifically, the target detection head was used to identify the bounding box with the highest confidence score for each species, and the corresponding convolutional feature maps were back-propagated through the network to generate class-sensitive heatmaps. In this way, the visualization methods capture not only global image saliency but also localized object-level attention. The following four visualization methods were adopted in this study: (i) CAM (Class Activation Mapping) [43]. In this study, CAM was applied to YOLO by extracting the final convolutional feature maps before the detection head and weighting them according to the class prediction associated with each bounding box. This allowed us to preliminarily verify whether the model focuses on key weed structures such as leaf edges and stem contours. (ii) Grad-CAM (Gradient-weighted Class Activation Mapping) [44]. For YOLO, Grad-CAM was adapted by computing gradients of the detection confidence score with respect to the last convolutional feature maps. The weighted combination of these maps generated localized heatmaps for each detected bounding box, providing more flexible class-sensitive visualizations than CAM. (iii) SSCAM (Self-Supervised Class Activation Mapping) [45]. To improve interpretability under low contrast and complex façade textures, SSCAM was applied at the feature maps aligned with bounding box predictions. The self-supervised reconstruction process yielded more stable visual attention, even in cases of weak labels or cluttered backgrounds. (iv) GradCAM++ [46]. Since weed images often contain multiple scattered and small targets, Grad-CAM++ was particularly suitable for YOLO. By refining the weight computation of Grad-CAM, this method provided sharper and more localized responses for each detection, highlighting weakly bounded weeds that might otherwise be overlooked.

2.4. System Architecture for Weed Detection and Heritage Monitoring

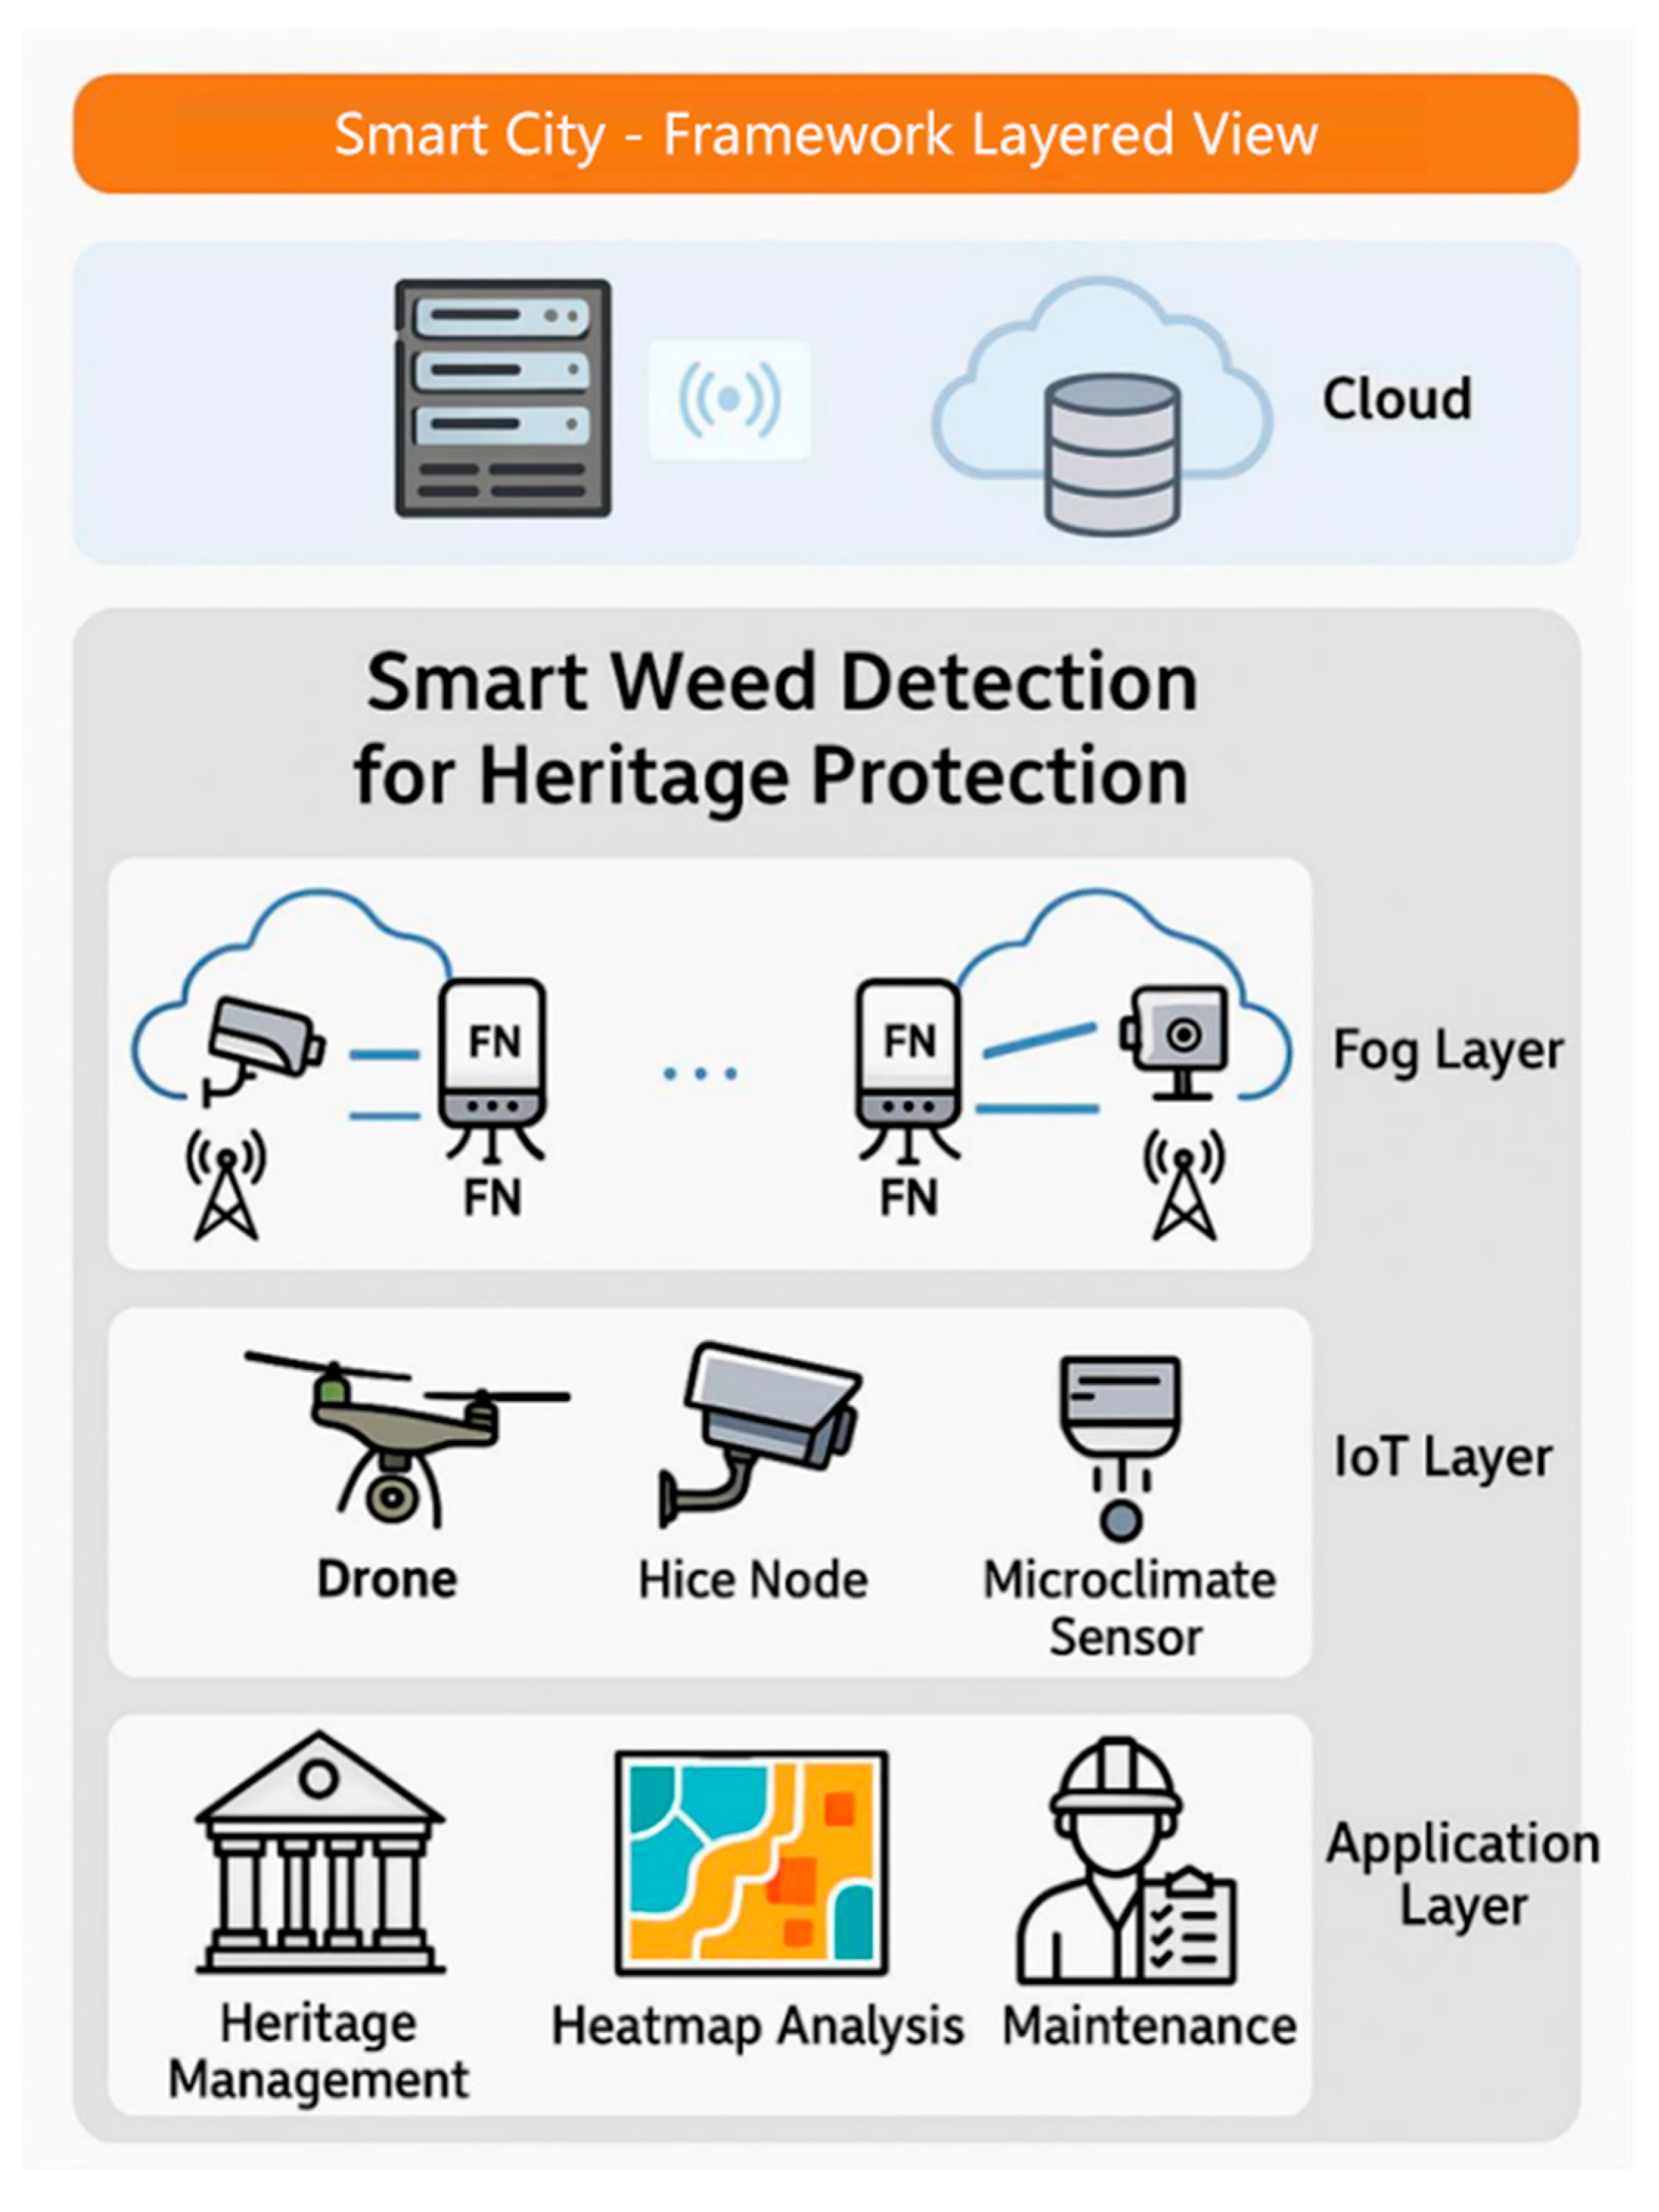
The proposed system aims to establish an operational framework for real-time monitoring, early detection, and predictive analysis of weed growth on historic façades within George Town’s UNESCO World Heritage Site. To overcome the limitations of manual inspection and photogrammetric methods, the research integrates a deep learning-based detection pipeline into a hierarchical architecture optimized for urban heritage environments. As shown in Figure 8, the framework comprises four interconnected layers responsible for data perception, computation, analysis, and delivery of results across distributed nodes:
(i) Cloud Layer. This layer performs centralized processing, large-scale model training, and historical data storage. It enables comparative analysis and time-series prediction of weed colonization trends across different buildings. Visualization dashboards and heatmaps are generated to support further quantitative evaluation.
(ii) Fog Layer. Optimized YOLOv11-SWDS models are deployed on fog nodes to provide low-latency, near-edge inference for vegetation detection. A coordinating master node synchronizes multiple fog devices, minimizing delays in data transmission and ensuring stable system response during continuous monitoring.
(iii) IoT Layer. This layer integrates fixed cameras, low-altitude drones, and environmental sensors (e.g., humidity, temperature, and illumination) to continuously acquire façade imagery and contextual data. The resulting multimodal inputs form the basis for localized detection and ecological correlation analysis.
(iv) Application Layer. At the system interface, outputs from the detection modules are transmitted to heritage management platforms for visualization, statistical analysis, and early-warning alerts. The interface allows end users to access weed distribution maps and growth dynamics, facilitating data sharing between researchers and heritage authorities.
This multi-layer architecture supports modular scalability and can be adapted to other heritage cities with similar monitoring demands.

2.5. Integration of Surface Protection Measures

Following the detection and localization of weed colonization, the proposed system provides a structured link between algorithmic outputs and corresponding surface protection operations. This integration ensures that monitoring results can directly inform targeted conservation actions through a standardized post-detection workflow. Based on current conservation practice and technical guidelines, three categories of interventions are defined:
(i) Mechanical removal and repointing. For localized weed growth detected in mortar joints, mechanical extraction followed by repointing with lime-based mortars is recommended. This step restores structural cohesion and prevents further biological infiltration. The detection data guide technicians in identifying exact locations and depths of required intervention.
(ii) Biocidal treatment and ecological cleaning. In cases where residual roots or biofilms remain after physical removal, low-toxicity biocidal solutions or hot-water/steam cleaning can be applied. The system’s spatial annotations support precise targeting of affected areas, minimizing unnecessary exposure of intact masonry surfaces. Compatibility tests are required to ensure material safety before application.
(iii) Preventive coatings and microclimate regulation. Detection outputs can also trigger preventive maintenance cycles. Breathable protective coatings—such as silicate- or nanolime-based consolidants—are applied to minimize moisture retention. Combined with microclimate sensors from the IoT layer, the system enables predictive scheduling of protective treatments when humidity or temperature exceed threshold levels.
Together, these operational measures form a closed feedback loop between digital detection and field-level conservation.

3. Results

3.1. Result of Model Comparison

To evaluate the efficiency and effectiveness of the proposed YOLOv11n model, we conducted a comparative analysis with three representative object detection models: Faster R-CNN, SSD, and YOLOv7-tiny. The comparison focused primarily on four performance metrics: F1 score, Precision (P), Recall (R), and mean Average Precision at an IoU threshold of 0.5 (mAP@50), as well as computational complexity indicators, including GFLOPs and model size (in MB). The results are summarized in Table 1.
The results show that the YOLOv11n model achieved the best overall performance, with an F1 score of 86.17%, precision of 86.3%, recall of 86.1%, and mAP@50 of 89.7%, demonstrating strong detection capability in scenarios sensitive to both precision and recall. Notably, it achieved this performance while maintaining the lowest computational cost, requiring only 6.3 GFLOPs and a model size of 2.58 MB, making it highly suitable for edge deployment and real-time weed monitoring tasks.
In contrast, Faster R-CNN, although traditionally robust in complex object detection, performed poorly in this scenario, with an F1 score of 41.17%, precision of 32.41%, and mAP@50 of 47.67%, while also incurring the highest computational load (83 GFLOPs, 37 MB). This indicates that although its two-stage architecture performs well on large, well-separated objects, it is not optimal for small-scale, irregular targets such as urban weeds on building surfaces.
The SSD model demonstrated relatively balanced performance, with an F1 score of 81.63%, mAP@50 of 82.41%, and moderate resource demands (31.3 GFLOPs, 26.14 MB). Meanwhile, YOLOv7-tiny achieved comparable accuracy (F1: 82.46%, mAP@50: 85.2%), while requiring fewer GFLOPs (13.2) and having a smaller model size (12.3 MB), thus serving as a strong lightweight baseline model.

3.2. Result of Ablation Experiments

To systematically evaluate the independent and combined performance of the SHViT, BLRA, and PIOU modules on the YOLOv11 baseline model, we conducted seven groups of ablation experiments, with the results summarized in Table 2.
In the single-module tests, the performance decreased after introducing SHViT into the YOLOv11 baseline (F1 = 82.9%, P = 86.8%, R = 79.3%), indicating that the lightweight Transformer module may lead to insufficient generalization of high-level features in the absence of boundary or regression constraints. In contrast, introducing the BLRA module alone led to a stable improvement, with the F1 score increasing to 83.8% and mAP@50 reaching 86.8%, validating the positive effect of BLRA-enhanced boundary sensitivity in architectural contour detection. When PIOU loss was introduced individually, the model achieved relatively high mAP@50 (86.0%) and precision (P = 86.7%) but had the lowest recall (R = 79.1%) and a relatively lower F1 score (82.7%), suggesting that while PIOU contributes to regression accuracy, it may compromise overall recall ability.
In the dual-module combinations, the integration of SHViT and BLRA achieved better overall performance (F1 = 84.1%, mAP@50 = 87.1%, Params = 2.46 M) and maintained the smallest parameter size, demonstrating a favorable balance between accuracy and efficiency. The combination of BLRA and PIOU achieved the highest precision (P = 89.9%), but the recall remained low (R = 75.5%), and F1 dropped to 82.0%, indicating that the gain in precision came at the cost of reduced coverage.
The final combination of all three modules (SHViT + BLRA + PIOU) yielded the most balanced performance across all metrics, achieving the highest F1 score (85.0%), with precision and recall of 89.0% and 81.3%, respectively, and mAP@50 of 87.8%. Importantly, this was accomplished while maintaining a reasonable computational cost (GFLOPs = 6.5, Params = 2.75 M), delivering the best overall detection performance. Therefore, this combination was selected as the optimized YOLOv11 model architecture for subsequent deployment and visualization analysis tasks. Similarly, the joint configuration of SHViT and PIOU also demonstrated superior performance.
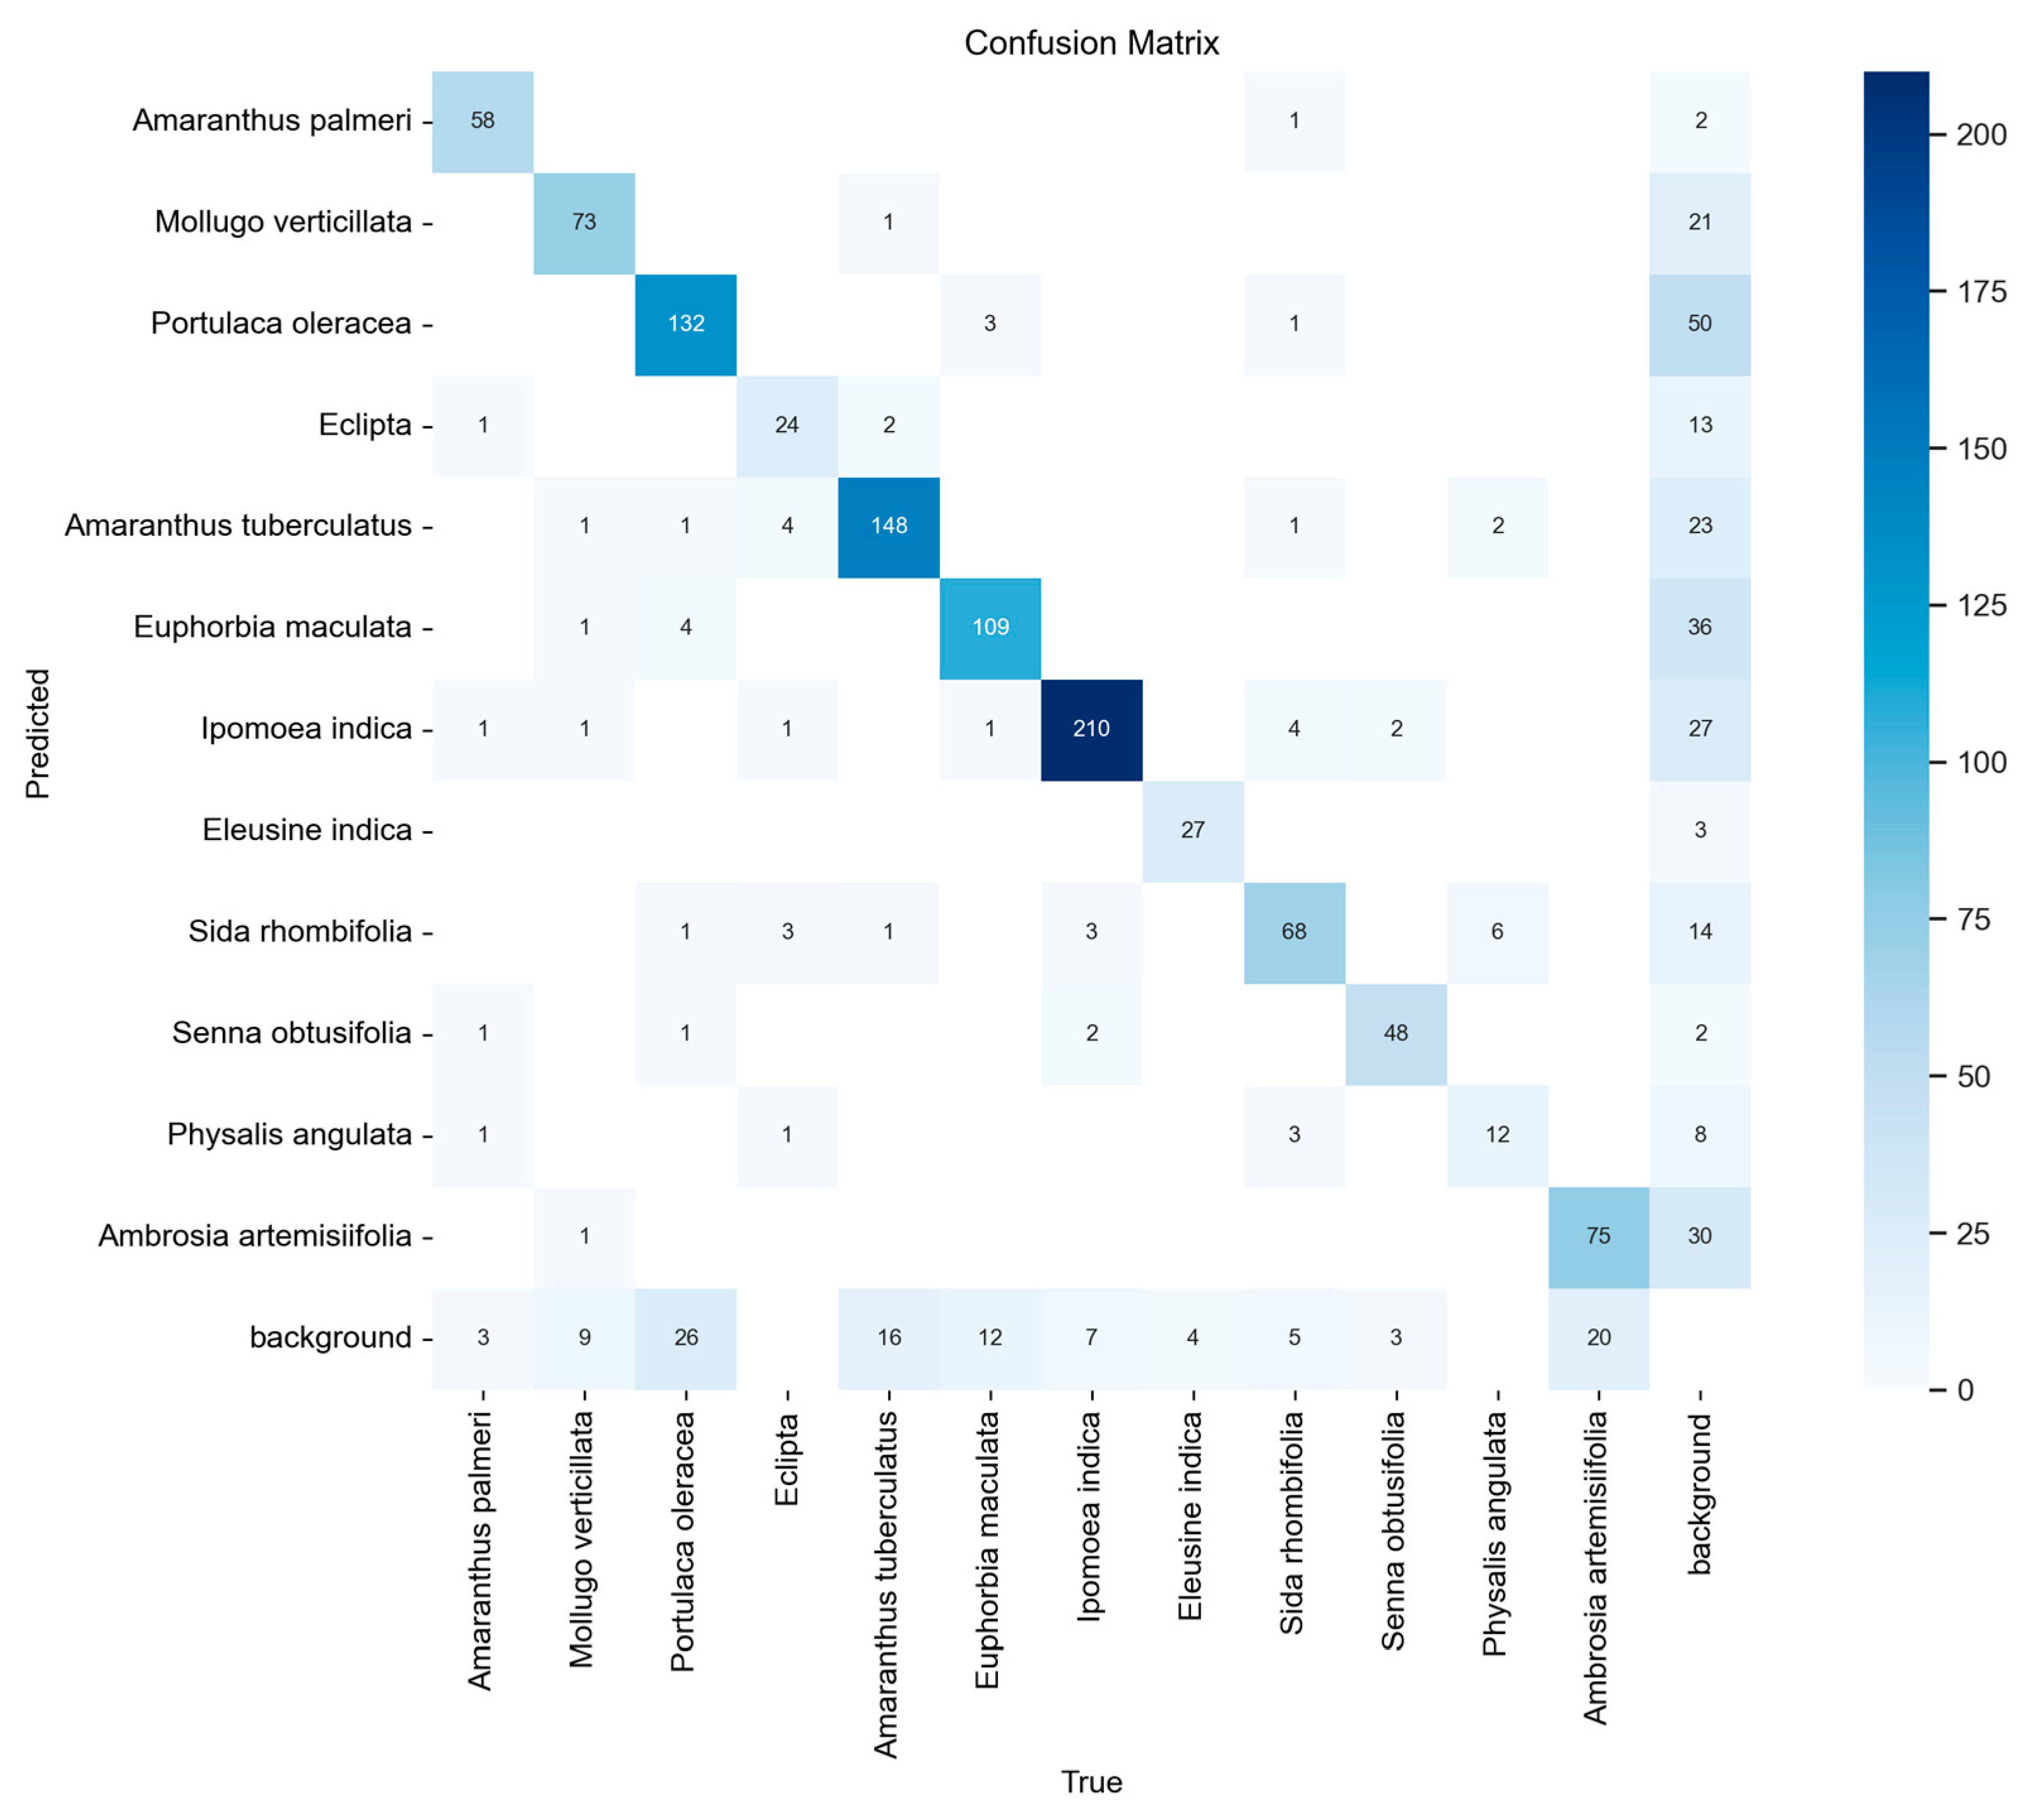
To further evaluate the classification capability of the optimized YOLOv11 model, we examined the confusion matrix on the validation set, as shown in Figure 9. Each row corresponds to the predicted class, and each column represents the ground truth. Diagonal entries denote correct predictions, while off-diagonal elements highlight misclassifications. The model achieved high accuracy across most categories, with Ipomoea indica (210), Portulaca oleracea (132), and Amaranthus tuberculatus (148) showing the strongest classification confidence. Less frequent species such as Physalis angulata and Eleusine indica also attained acceptable identification rates. Nonetheless, some misclassifications occurred among morphologically similar species. For example, Mollugo verticillata was occasionally confused with Amaranthus palmeri and Portulaca oleracea, likely due to overlapping leaf structures and growth locations. Additionally, false positives were recorded in the background class (e.g., Portulaca oleracea misclassified as background: 26 instances), suggesting room for further improvement in background suppression and boundary discrimination. These findings reaffirm the reliability of the proposed model while offering diagnostic insights for future refinement.
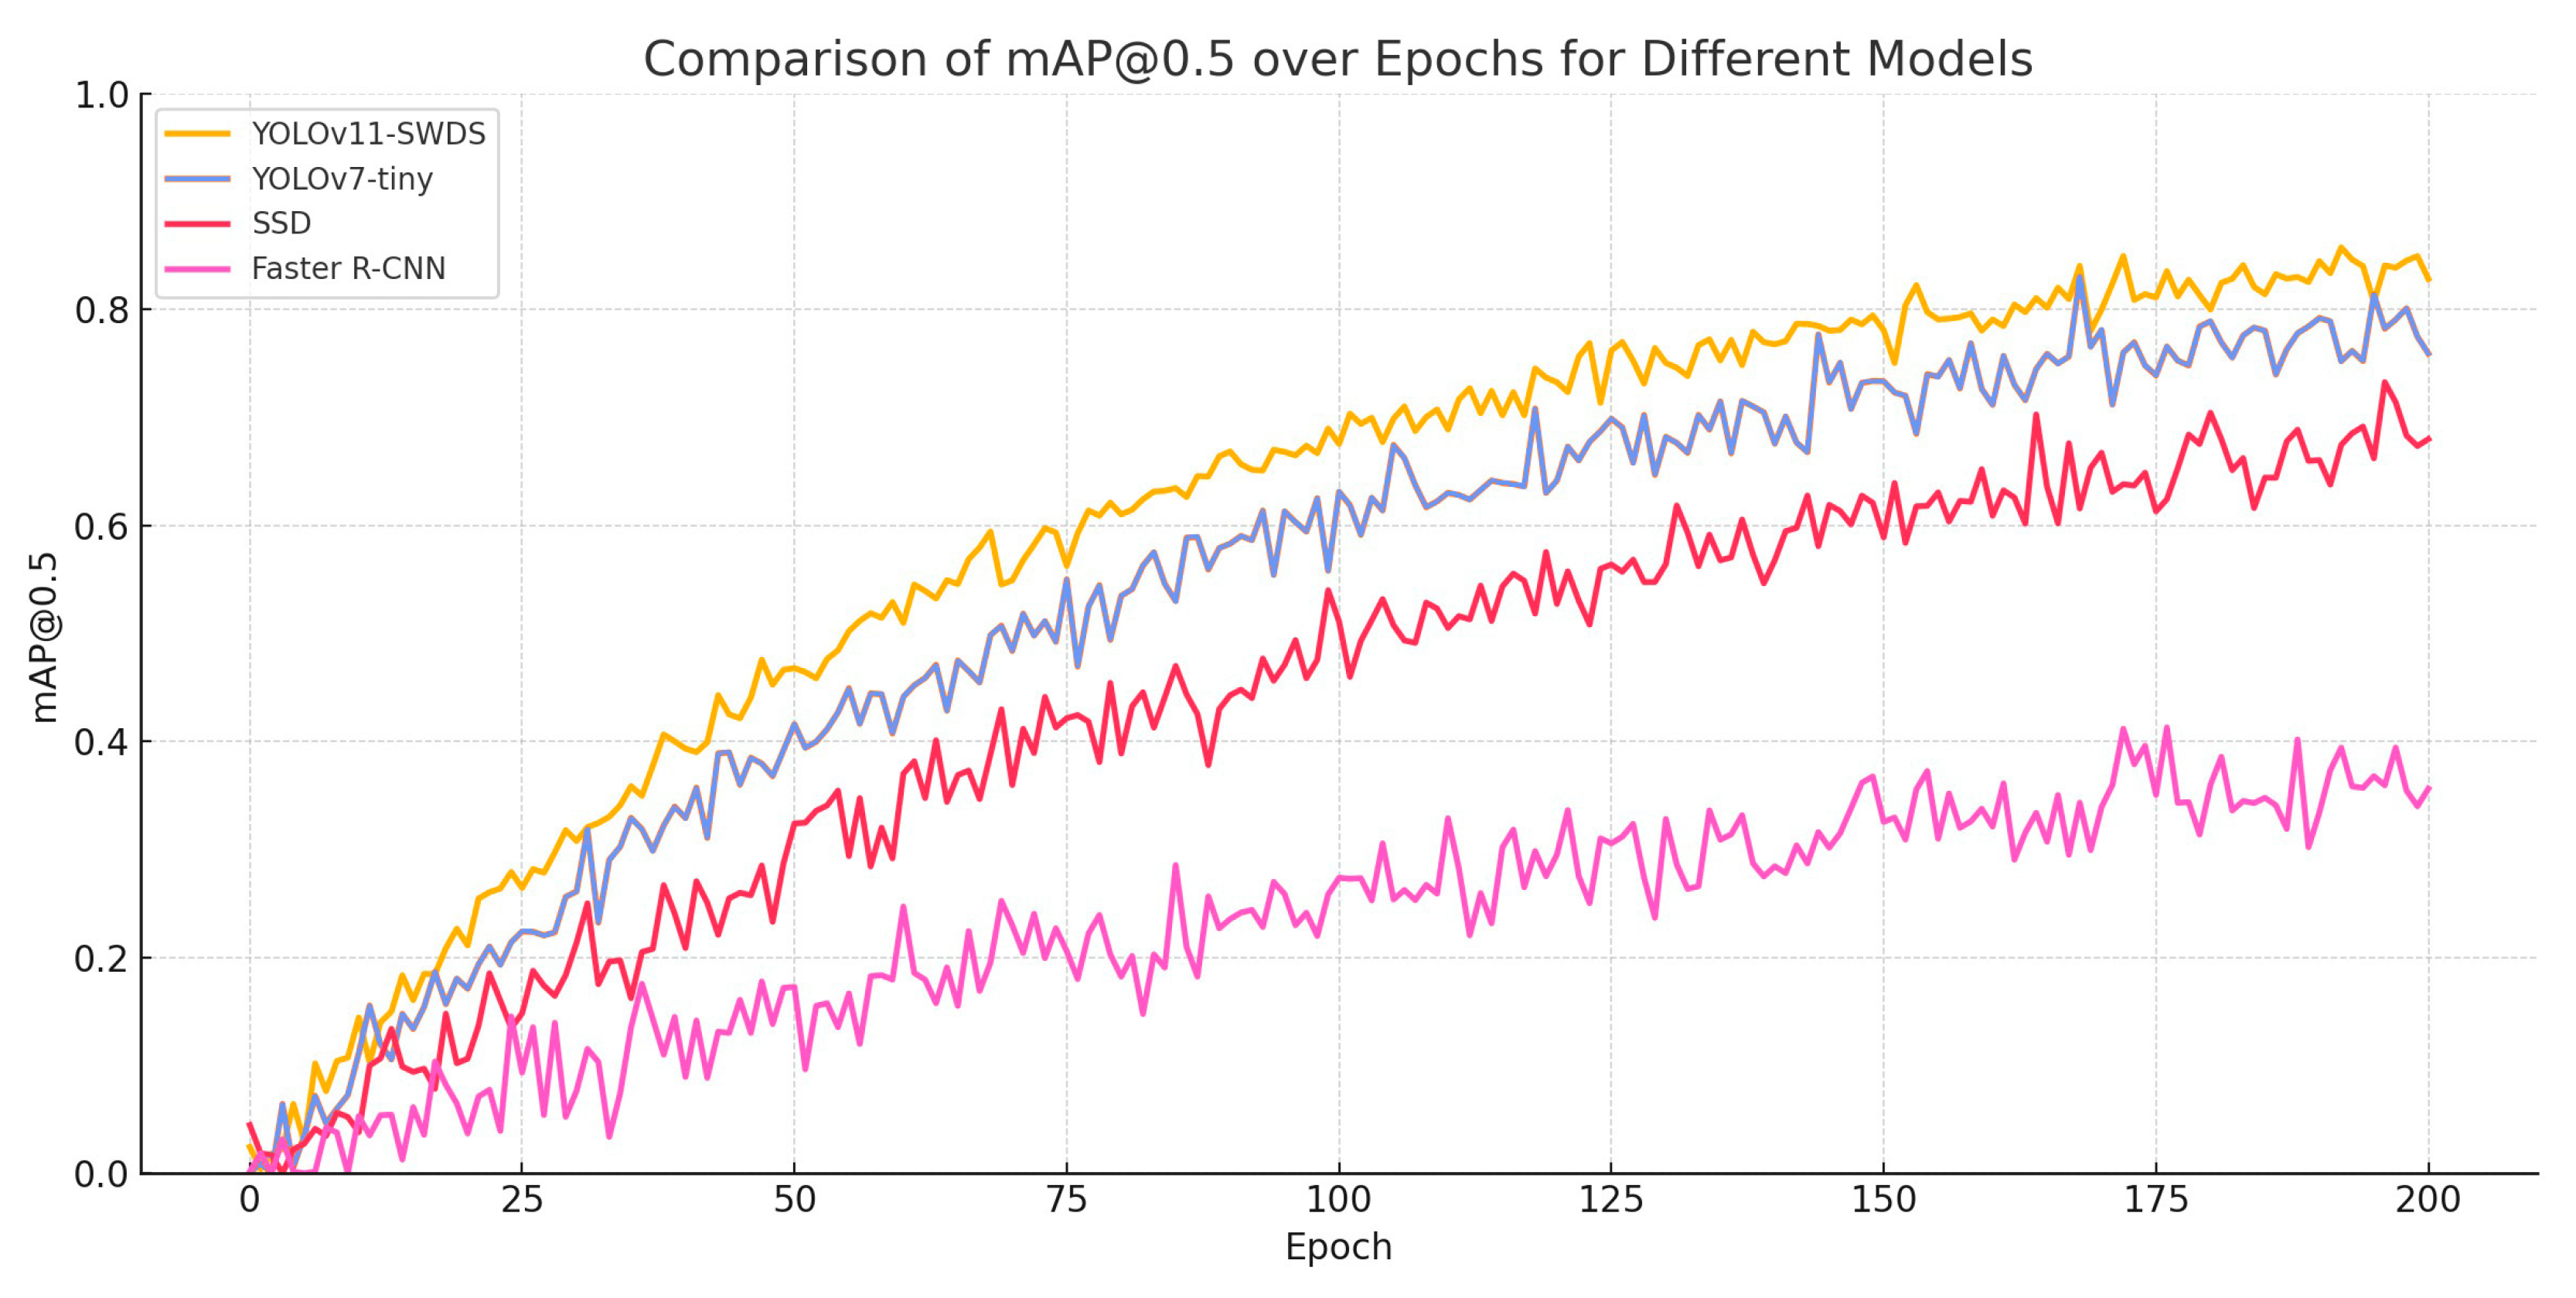
Figure 10 illustrates the training dynamics and comparative performance of four object detection models (YOLOv11-SWDS, YOLOv7-tiny, SSD, and Faster R-CNN) on the SWDS dataset, with mAP@0.5 tracked over 200 training epochs. Throughout the training process, YOLOv11-SWDS (orange curve) demonstrates the most stable and progressive learning behavior. Its mAP@0.5 curve rises rapidly in the early stages, maintains consistent growth in the mid-epochs, and converges smoothly toward its final peak performance of 87.8%. This convergence trend suggests that the integrated SHViT, BLRA, and PIOU modules facilitate efficient feature extraction, edge localization, and regression refinement, particularly under conditions of occlusion, low contrast, and complex background noise typical of heritage architectural weed datasets.
The YOLOv7-tiny model (blue curve) also shows effective learning progression, achieving a final mAP@0.5 of 85.2%. While its initial growth is slightly slower than YOLOv11-SWDS, it stabilizes early and exhibits a low-variance curve throughout training. The SSD model (red curve) displays noticeable instability during the early epochs, with sharp oscillations suggesting sensitivity to learning rate dynamics and inadequate robustness in early feature alignment. In stark contrast, the Faster R-CNN model (pink curve) exhibits the slowest convergence and highest volatility across all epochs. Its mAP@0.5 plateaus prematurely at 47.67%, reflecting insufficient capacity to generalize under the dense, cluttered visual conditions of this task. The two-stage structure appears to impede optimization under small batch settings and urban-scale object variability.
In summary, the training curves provide strong empirical support for the adoption of YOLOv11-SWDS. Its smooth convergence, high final accuracy, and minimal early-stage volatility confirm its robustness, fast learning dynamics, and adaptability to the specialized demands of heritage city architectural weed detection.

3.3. Performance Evaluation of CAM, Grad-CAM, LayerCAM, SSCAM for Deep Learning Model

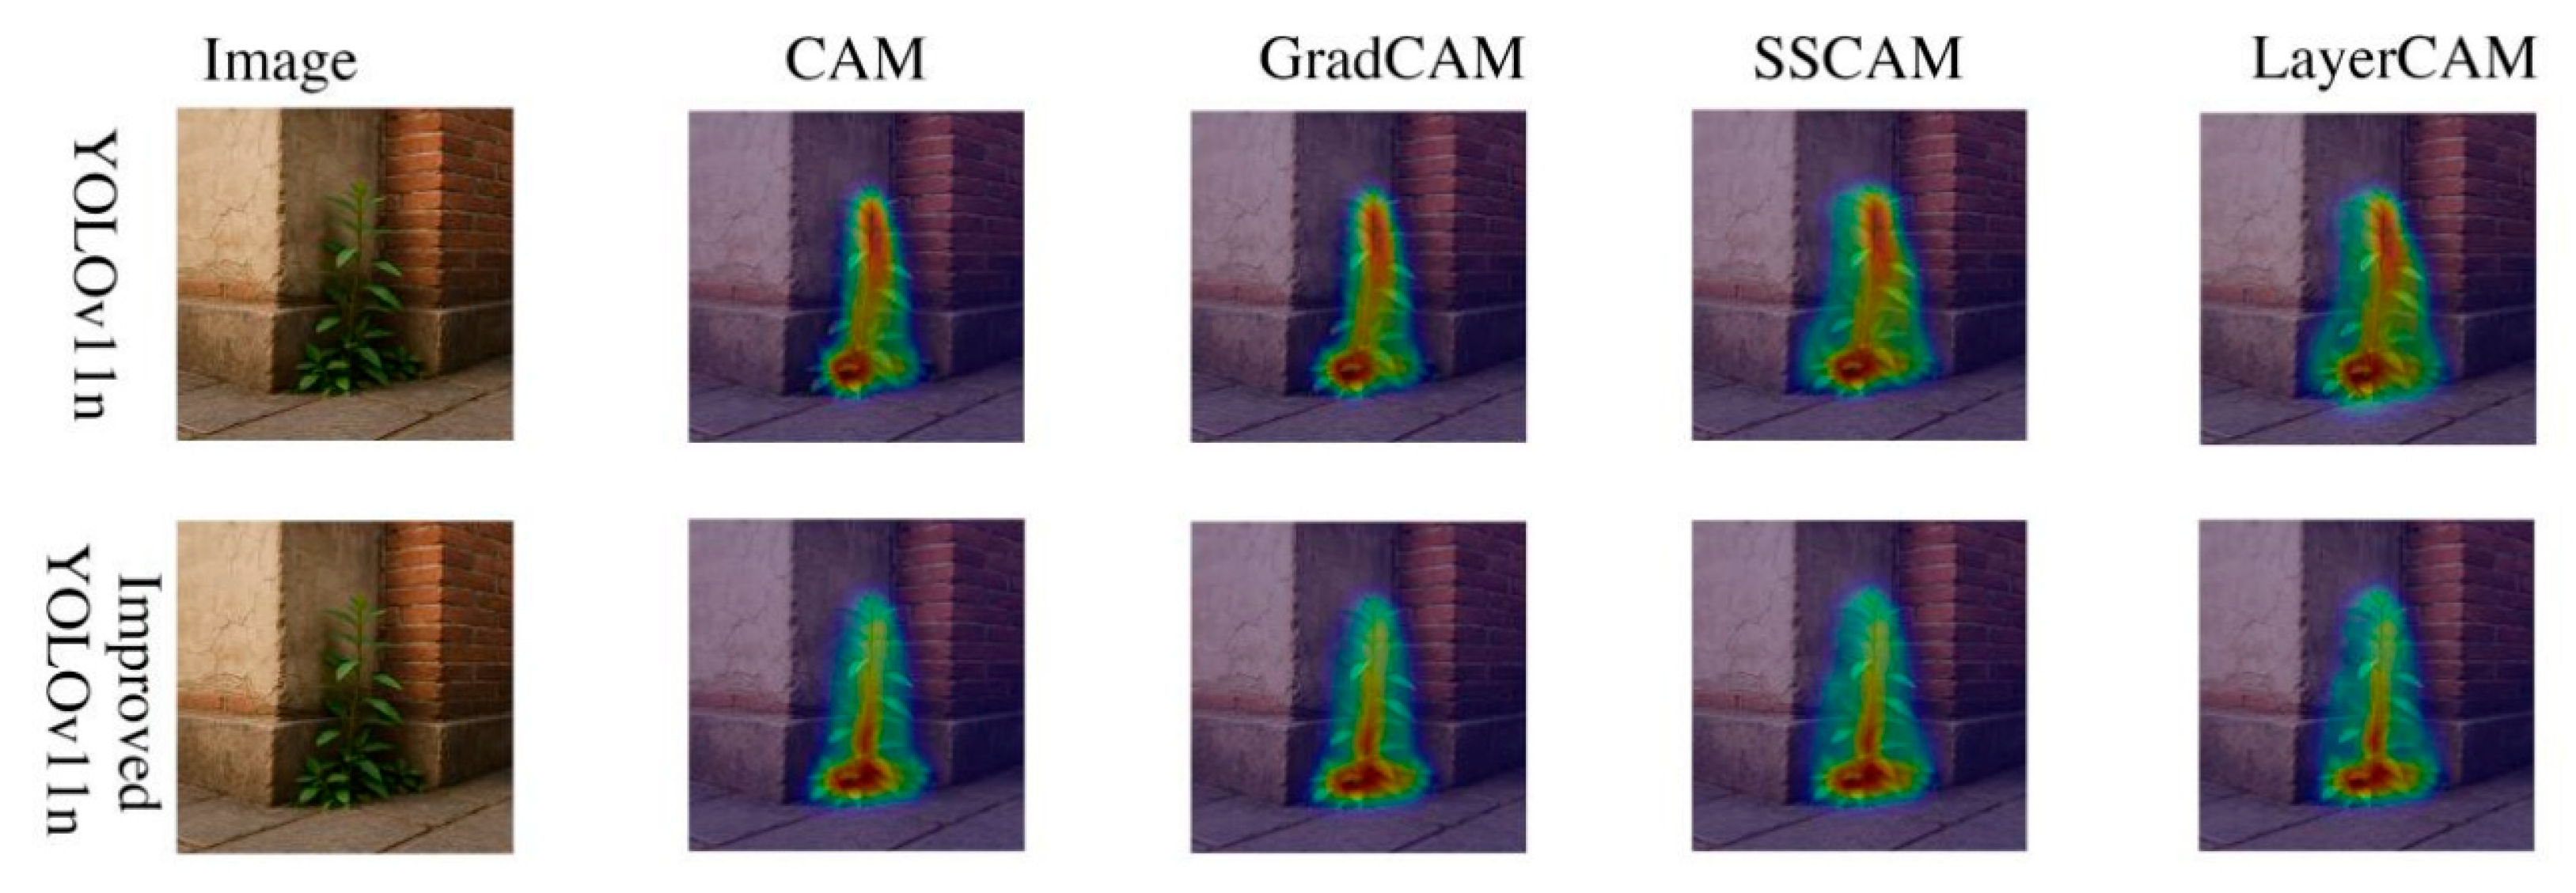
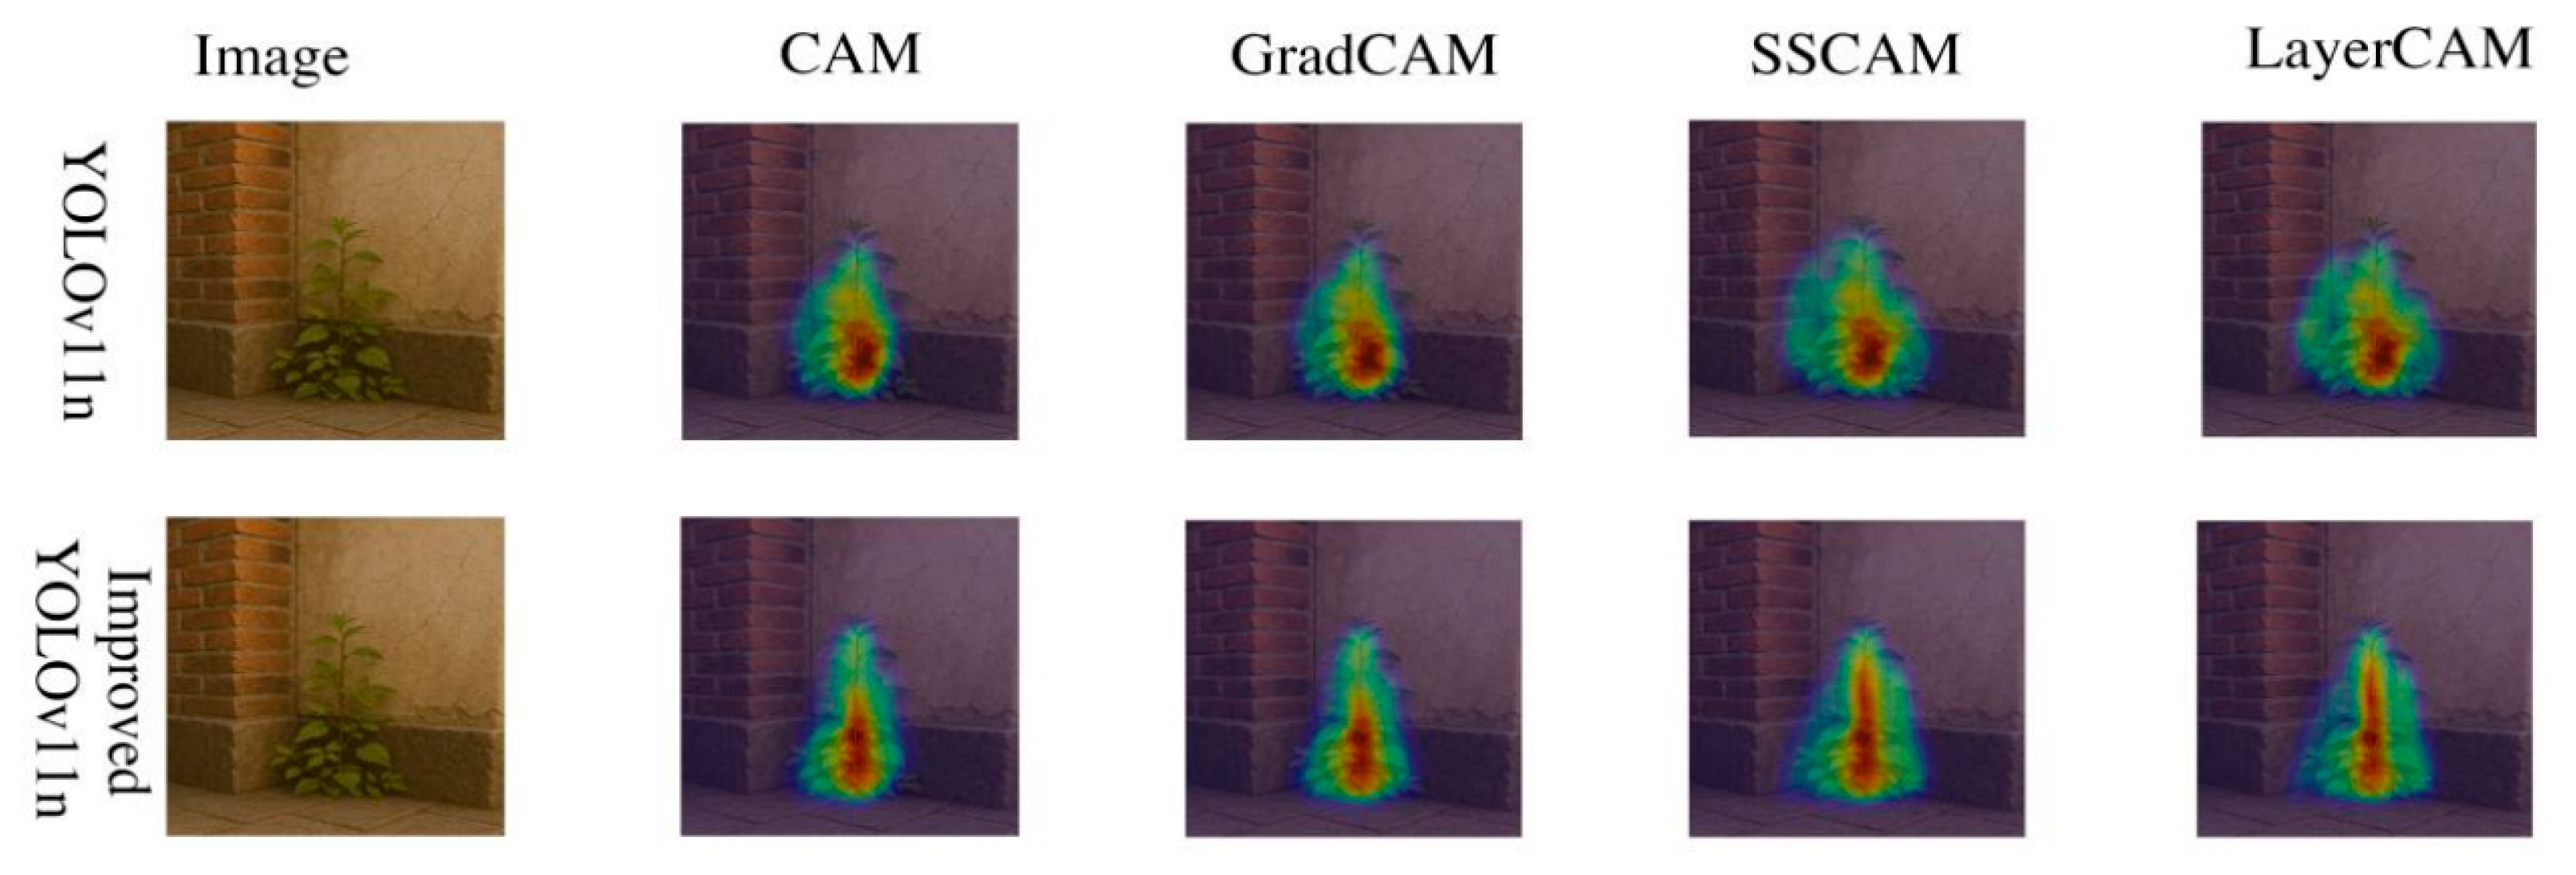
To further enhance the interpretability of YOLOv11 in the task of weed detection on urban building surfaces, this study introduced a variety of attention-based visualization methods to identify key image regions that the model focuses on during inference. Specifically, we employed four mainstream heatmap generation techniques—CAM, Grad-CAM, SSCAM, and LayerCAM—to overlay salient response regions on the input images, thereby revealing the spatial distribution patterns of the model’s feature perception. As shown in Figure 11, we applied both the baseline model (YOLOv11n) and the improved model (YOLOv11-SWDS) to the same test image and conducted a comparative analysis of their response regions under different visualization methods. The results indicate that the improved model exhibits more concentrated activations and a closer fit to the actual weed contours across various visualization techniques, with significantly clearer edges and stronger target focus compared to the baseline.
In the baseline YOLOv11n model, the attention maps generated by CAM and Grad-CAM show noticeable attention drift and dispersion. Some heatmap responses are spread across brick textures and wall corners, suggesting that the model may have been influenced by background structures or uneven lighting. Although SSCAM and LayerCAM provide some ability to capture contours, they still demonstrate insufficient response to leaf edges or root areas.
In contrast, the YOLOv11-SWDS model exhibits a much stronger semantic focus across all heatmap methods. Notably, in the SSCAM and LayerCAM results, the heatmap responses are highly concentrated on key semantic regions such as the main stem, leaf edges, and the crevices between bricks where roots are located. This indicates that the improved model can effectively capture semantically salient growth areas such as “wall-edge gaps,” “structural joints,” and “shadowed masonry,” demonstrating stronger target recognition and more stable localization capabilities.
Moreover, this set of results confirms the effectiveness of the BLRA (Bi-Level Routing Attention) module and the SHViT attention mechanism integrated into the improved model architecture in enhancing the quality of spatial attention distribution. These mechanisms improve the model’s understanding of weed growth patterns in complex backgrounds, reduce the impact of background interference on feature extraction, and enhance the model’s visual consistency and robustness.
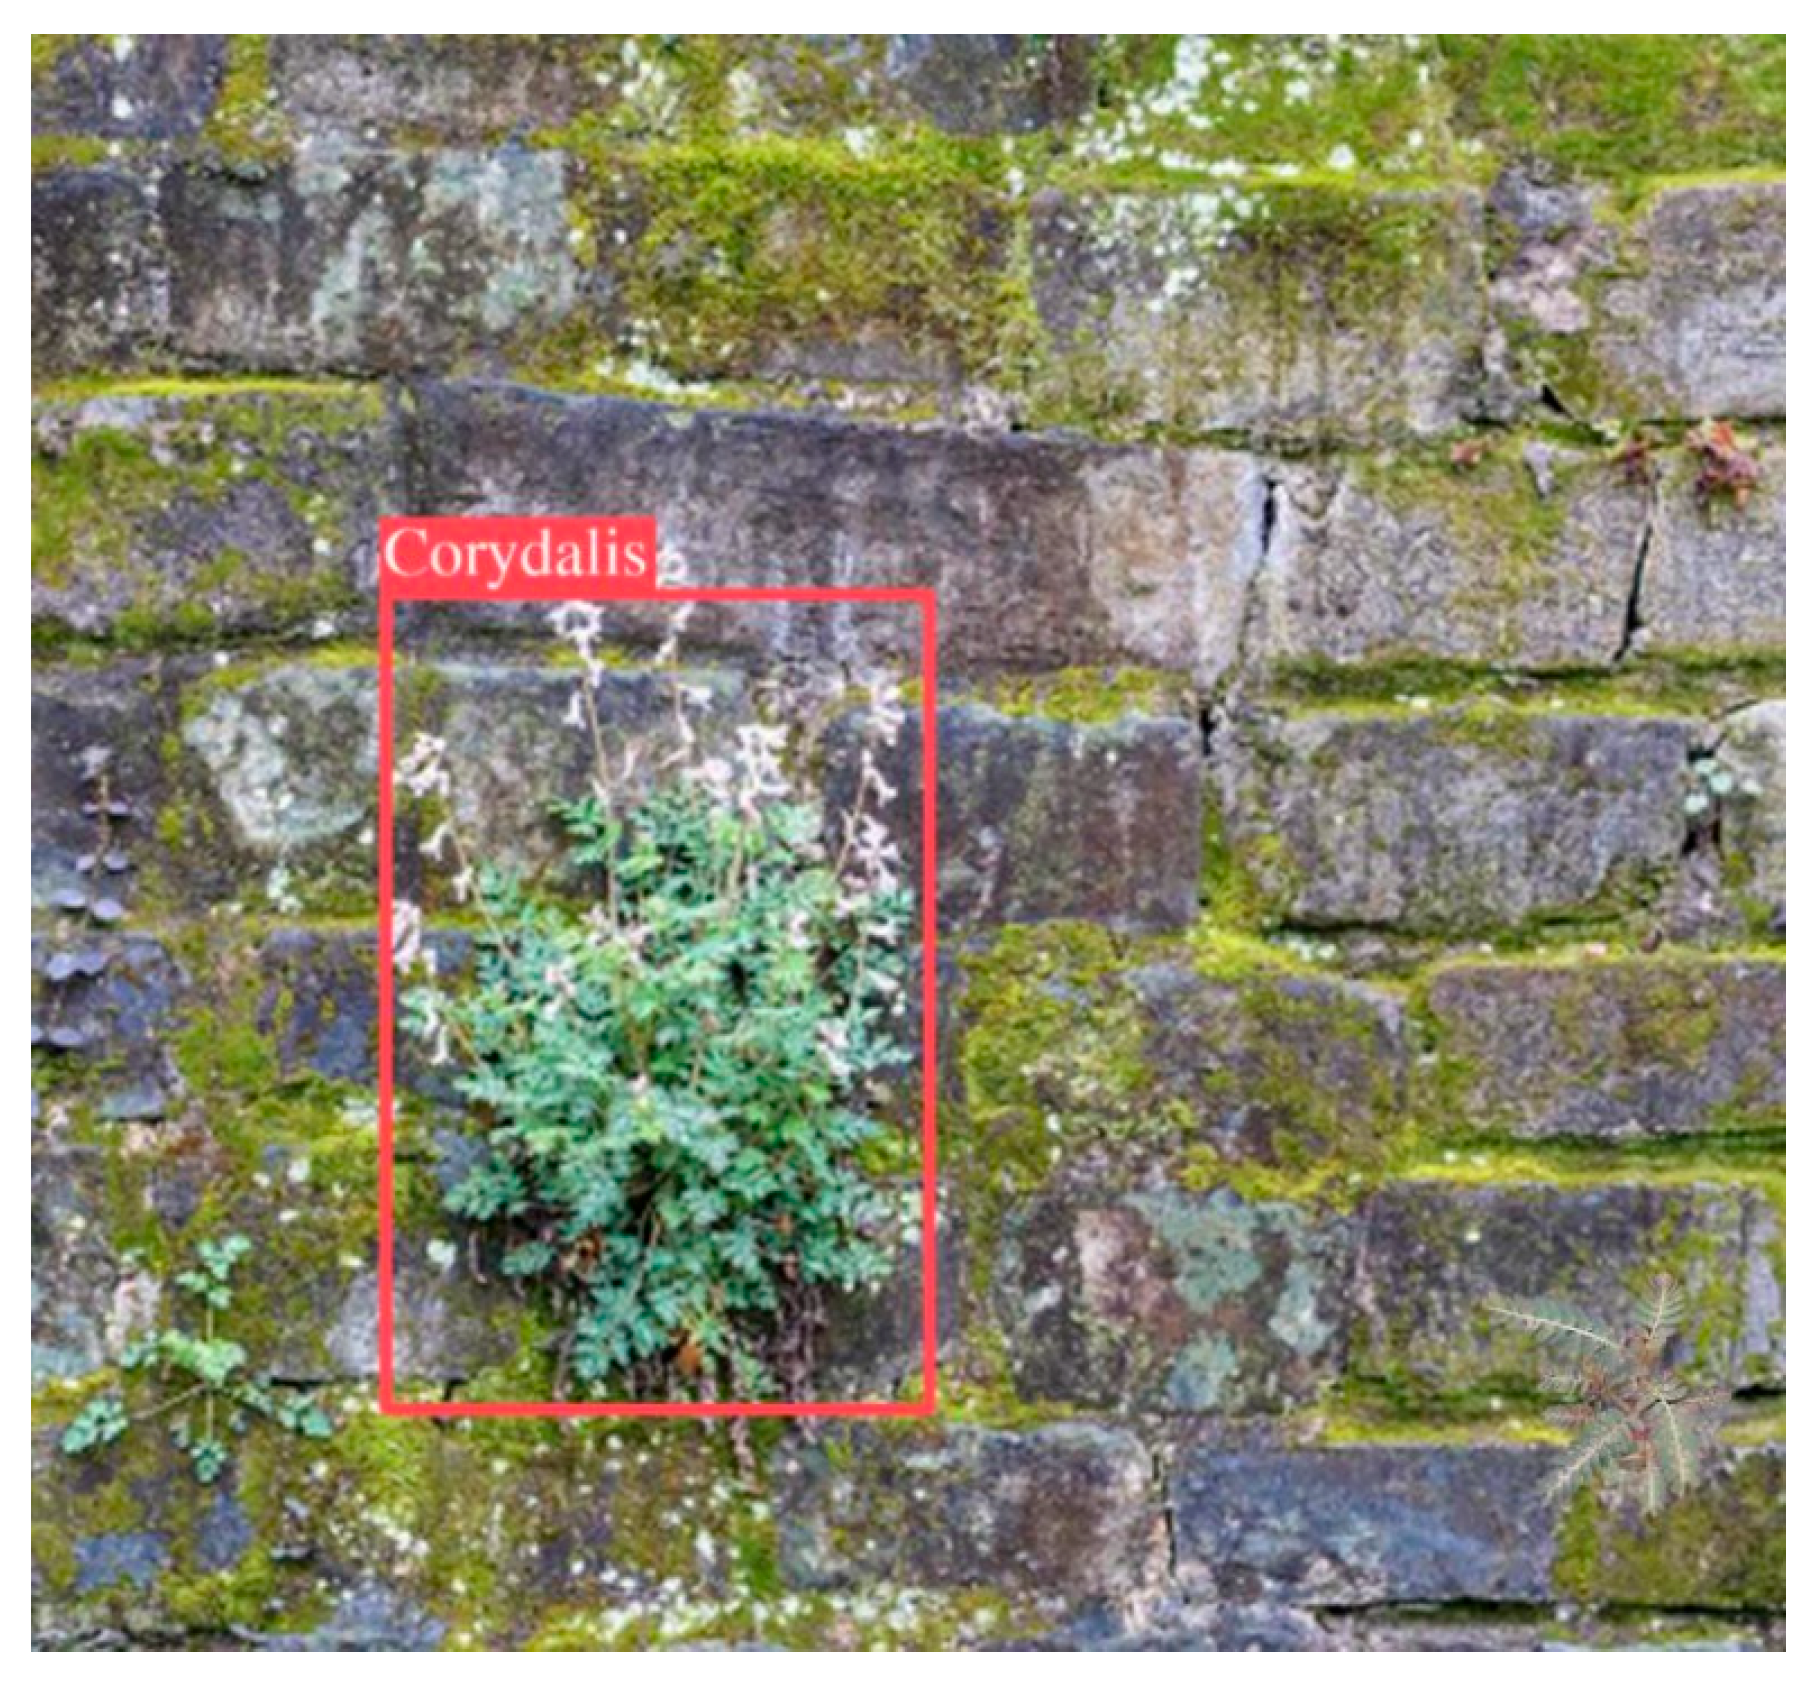
Although the YOLOv11-SWDS model demonstrates stronger target perception and spatial focus in the task of weed detection on building surfaces, its visualization results also reveal certain limitations of the attention mechanisms. Under scenarios involving complex architectural backgrounds and weakened object boundaries, the model’s saliency responses may exhibit omissions. As shown in Figure 12, the weed roots clearly grow between brick joints, displaying a typical vertical stem and opposite leaf structure, which are distinctive biological identification features. However, due to the visual interference caused by surface aging and slippery reflections on the stone materials in this region, along with the similar color tone between the weed and the background wall, local contrast is reduced, negatively affecting the model’s attention distribution.
From the Grad-CAM and SSCAM response heatmaps, it is evident that although the improved model has successfully focused on the main stem area, it still exhibits incomplete recognition of low-contrast weed leaves located near walls and between brick joints. In the attention map generated by Grad-CAM, only the central stem receives significant activation, while the scattered weed clusters adjacent to the leaf edges and brick seams fall outside the model’s salient attention range, appearing as “cold zones” at the periphery of the heatmap. This phenomenon suggests that even with architectural enhancements, the model still experiences perceptual blind spots when handling targets with blurred structural edges and high color similarity to the background. Such omissions may result in missed detections during practical applications, ultimately affecting the accuracy of weed control in architectural environments.
This result further underscores the necessity of introducing more structure-sensitive attention fusion mechanisms, such as directional attention and multi-scale edge guidance, to enhance performance in complex scenarios. Therefore, this comparative analysis not only validates the effectiveness of the improved model but also highlights the need to consider edge ambiguity, low-contrast interference, and texture similarity as critical challenges to model perception when deploying in real-world contexts, providing a basis for future model optimization.
In addition to attention-based alignment analysis, we also conducted qualitative error analysis to identify the model’s limitations in handling visually degraded or incomplete weed targets. As shown in Figure 13, when weed objects appear with unclear edges or extremely low contrast due to surface aging or image blur, the model may fail to classify the region correctly. In the given example, although the weed clearly grows out from the brick joint and exhibits a discernible stem–leaf structure, the presence of water stains and reflective glare on the stone surface, combined with the color similarity between the weed and the background wall, leads to misidentification or omission by the model. As a result, the target is missed during detection.

4. Discussion

The findings of this study confirm the potential of deep learning-based object detection for addressing persistent conservation challenges in historic environments. Compared with the baseline YOLOv11, the proposed YOLOv11-SWDS model demonstrated superior adaptability to small-scale, low-contrast, and partially occluded targets on heritage façades. This aligns with previous research in agricultural contexts, where YOLO-based detectors achieved robust performance in identifying small weeds under variable field conditions. However, while most agricultural studies emphasize crop–weed discrimination in open environments, the present work highlights the feasibility of adapting such models to the visually complex and structurally sensitive context of historic architecture. Similarly, studies on crack detection in earthen or masonry structures have shown that attention mechanisms can improve localization accuracy under noisy textures, which is consistent with the performance gains observed here when BLRA and SHViT modules were combined.
Our working hypotheses were partially supported. While SHViT alone introduced a risk of over-generalization and reduced performance, its integration with BLRA or PIOU yielded synergistic benefits. This outcome suggests that lightweight attention requires boundary-aware modules to avoid excessive abstraction in small-object detection, a point that confirms earlier observations in computer vision research where hybrid attention designs outperformed purely transformer-based backbones in fine-grained tasks. Furthermore, the introduction of the PIOU loss function improved recall without compromising precision, validating the hypothesis that position-aware constraints can enhance detection in occluded or visually degraded regions. These results demonstrate that targeted module fusion is a viable strategy for balancing accuracy, efficiency, and interpretability in real-world heritage scenarios.
Recent studies in the field of heritage science have increasingly explored AI-driven approaches for surface pathology and biodeterioration analysis, reinforcing the relevance of automated detection beyond structural monitoring. For instance, Elgohary et al. employed spectral imaging and neural networks to assess biochemical deterioration on archeological stones [9], while Cozzolino et al. analyzed vascular plant-induced damage in Italian archeological parks using multispectral and photogrammetric data [12]. Similarly, Trotta et al. demonstrated the value of combining UAV imagery with deep learning to quantify vegetation colonization on the Aurelian Walls in Rome [13]. Beyond these examples, Mishra and Lourenço systematically reviewed AI-assisted visual inspection of cultural heritage, identifying that deep learning has been widely applied for surface pathology detection—including cracks, spalling, efflorescence, vegetation, discoloration, and microbial growth—across masonry, stone, and façade structures. They reported that models such as YOLOv5, Faster R-CNN, and Mask R-CNN achieve accuracies exceeding 90% for typology-specific deterioration (e.g., efflorescence, biological colonization, and weathering), enabling non-invasive diagnostics in line with ICOMOS recommendations for heritage documentation [47].
Within the broader domain of urban heritage documentation, several studies published in the ISPRS Archives and Journal of Cultural Heritage demonstrate the use of convolutional neural networks for surface defect mapping, semantic segmentation of façade materials, and 3D digital twins, highlighting the convergence between computer vision and conservation science [48,49,50]. The present study extends this trajectory by focusing on weed-induced biodeterioration—a specific yet underexplored manifestation of surface pathology—within the tropical UNESCO context of George Town, thereby contributing to the emerging field of AI-assisted preventive conservation in Southeast Asian heritage environments.
The implications extend beyond the immediate task of weed detection. Vegetation growth on heritage façades not only accelerates biodeterioration but also alters visual perception and visitor experience, thereby influencing cultural and economic sustainability. Automated detection systems such as YOLOv11-SWDS can therefore support preventive conservation strategies by enabling early intervention, reducing reliance on manual inspection, and optimizing the allocation of limited conservation resources. Importantly, the early identification of weed intrusion can also inform the timely application of surface protection measures, such as localized repointing of mortar joints, biocidal cleaning, or the use of breathable protective coatings. Integrating detection with subsequent protective interventions ensures not only removal of existing vegetation but also mitigation of re-colonization risk, thereby extending the service life of historic masonry surfaces. In addition, the integration of interpretability techniques (e.g., Grad-CAM, LayerCAM) strengthens practitioner trust in AI-assisted monitoring, which is crucial for promoting adoption among conservation specialists and policymakers.
From a societal and policy perspective, the deployment of automated detection frameworks in UNESCO World Heritage Sites such as George Town can directly enhance management transparency and accountability. By providing quantifiable, visual evidence of material deterioration, AI-based monitoring aligns with UNESCO’s Periodic Reporting and Reactive Monitoring frameworks, enabling data-driven prioritization of maintenance across large heritage inventories. Moreover, digital tools like YOLOv11-SWDS can empower local authorities—such as George Town World Heritage Incorporated (GTWHI)—to integrate preventive maintenance into broader urban heritage management plans, linking conservation practice with community-based stewardship and sustainable tourism objectives. In this sense, the model not only contributes to technical efficiency but also supports policy coherence between heritage preservation, cultural continuity, and economic development at both local and international levels.
Future research should expand in three directions. First, dataset diversity could be improved by incorporating more weed species, façade materials, and climatic conditions, thereby enhancing model generalizability across different heritage sites. Second, multimodal approaches that combine visual detection with environmental sensor data (e.g., humidity, temperature, or air quality) may provide a more comprehensive understanding of biodeterioration mechanisms. Third, long-term monitoring studies should be conducted to evaluate the model’s capacity for trend prediction, integrating temporal analysis with conservation planning. Finally, collaborative research between computer scientists, conservationists, and urban planners is essential to align technical innovation with the cultural, social, and economic dimensions of heritage protection.
Overall, this study contributes to bridging the gap between computer vision research and heritage conservation practice. By demonstrating the effectiveness of a lightweight, interpretable, and deployable deep learning model for weed detection, it offers both theoretical insights into model design and practical tools for safeguarding the Outstanding Universal Value of historic cities.

5. Conclusions

This study developed YOLOv11-SWDS, an enhanced deep learning model tailored for weed detection on historic building surfaces. By integrating SHViT for improved semantic representation, BLRA for boundary-aware spatial learning, and PIOU for robust regression, the model achieved superior performance over baseline and mainstream alternatives, balancing detection accuracy with lightweight deployment requirements.
The experimental evaluation confirmed that YOLOv11-SWDS effectively detects small, low-contrast, and partially occluded weeds in complex architectural environments, supporting early intervention and preventive conservation. Visual interpretability analysis further validated the model’s capacity to focus on semantically meaningful façade regions, reinforcing its practical relevance for heritage monitoring.
However, several constraints should be acknowledged. First, the image dataset, while carefully annotated, remains geographically and climatically limited to George Town, which may restrict model generalizability to other heritage contexts. Second, the detection framework focuses primarily on RGB imagery, without incorporating temporal data or multispectral inputs, which could capture hidden or subsurface biodeterioration. Third, the study emphasizes technical performance over field validation—that is, the model was evaluated in controlled conditions rather than through full-scale heritage maintenance trials. Finally, while the model is designed for lightweight deployment, implementation in operational heritage management systems will require further testing of interoperability, data governance, and ethical compliance regarding heritage image usage.
Future work should therefore expand dataset diversity across different building typologies and climatic zones, integrate multimodal and time-series sensing, and conduct pilot deployments with conservation authorities to assess real-world usability and policy alignment.

Author Contributions

Conceptualization, Y.H. and S.C. (Shaokang Chen); methodology, Y.H.; software, S.C. (Si Cheng); validation, Y.H., S.C. (Shaokang Chen) and S.C. (Si Cheng); formal analysis, S.C. (Si Cheng) and J.C.; investigation, Y.H. and Y.C.; resources, Y.H. and S.C. (Shaokang Chen); data curation, S.C. (Shaokang Chen) and J.C.; writing—original draft preparation, Y.H.; writing—review and editing, S.C. (Shaokang Chen). and Y.H.; visualization, S.C. (Shaokang Chen) and Y.C.; supervision, Y.C.; project administration, Y.C. All authors have read and agreed to the published version of the manuscript.

Funding

This research received no external funding.

Data Availability Statement

The data supporting the findings of this study are openly available in Figshare at https://doi.org/10.6084/m9.figshare.29484998.

Conflicts of Interest

The authors declare no conflicts of interest.

Abbreviations

The following abbreviations are used in this manuscript:
UNESCOUnited Nations Educational, Scientific and Cultural Organization
YOLOYou Only Look Once
SWDSSmart Weed Detection System
CNNConvolutional Neural Network
IoUIntersection over Union
mAPMean Average Precision
GFLOPsGiga Floating Point Operations per Second
CAMClass Activation Mapping
Grad-CAMGradient-weighted Class Activation Mapping
SSCAMSelf-Supervised Class Activation Mapping
Grad-CAM++Gradient-weighted Class Activation Mapping++
SHViTShifted Hybrid Vision Transformer
BLRABi-Level Routing Attention
PIOUPixels-IoU Loss
CIOUComplete IoU Loss
FPNFeature Pyramid Network
PANPath Aggregation Network
C2PSAChannel–Position Spatial Attention
C3k2Cross Stage Partial with K2 blocks (network module)
GPUGraphics Processing Unit
CPUCentral Processing Unit
RTXNVIDIA GeForce RTX (Graphics Processing Unit family)
SGDStochastic Gradient Descent
IAAInter-Annotator Agreement
MBMegabyte

References

  1. Moazzeni Khorasgani, A. Sustainable Development Strategies for Historic Cities. In Using Data Science and Landscape Approach to Sustain Historic Cities; Springer Nature: Cham, Switzerland, 2024; pp. 63–81. [Google Scholar] [CrossRef]
  2. Theodora, Y. Cultural heritage as a means for local development in Mediterranean historic cities—The need for an urban policy. Heritage 2020, 3, 152–175. [Google Scholar] [CrossRef]
  3. Labadi, S.; Logan, W. Approaches to Urban Heritage, Development and Sustainability. In Urban Heritage, Development and Sustainability; Routledge: London, UK, 2015; pp. 1–20. [Google Scholar]
  4. Otero, J. Heritage conservation future: Where we stand, challenges ahead, and a paradigm shift. Glob. Chall. 2022, 6, 2100084. [Google Scholar] [CrossRef] [PubMed]
  5. Hassan, A.S.; Yahaya, S.R.C. Architecture and Heritage Buildings in George Town, Penang; Penerbit USM: Penang, Malaysia, 2012. [Google Scholar]
  6. Bideau, F.G.; Kilani, M. Multiculturalism, cosmopolitanism, and making heritage in Malaysia: A view from the historic cities of the Straits of Malacca. Int. J. Herit. Stud. 2012, 18, 605–623. [Google Scholar] [CrossRef]
  7. OECD. Higher Education in Regional and City Development: State of Penang, Malaysia 2011; OECD Publishing: Paris, France, 2011. [Google Scholar] [CrossRef]
  8. Bennett, B.M. Model invasions and the development of national concerns over invasive introduced trees: Insights from South African history. Biol. Invasions 2014, 16, 499–512. [Google Scholar] [CrossRef]
  9. Elgohary, Y.M.; Mansour, M.M.; Salem, M.Z. Assessment of the potential effects of plants with their secreted biochemicals on the biodeterioration of archaeological stones. Biomass Convers. Biorefin. 2024, 14, 12069–12083. [Google Scholar] [CrossRef]
  10. Baliddawa, C.W. Plant species diversity and crop pest control: An analytical review. Int. J. Trop. Insect Sci. 1985, 6, 479–487. [Google Scholar] [CrossRef]
  11. Dewey, S.A.; Jenkins, M.J.; Tonioli, R.C. Wildfire suppression—A paradigm for noxious weed management. Weed Technol. 1995, 9, 621–627. [Google Scholar] [CrossRef]
  12. Cozzolino, A.; Bonanomi, G.; Motti, R. The role of stone materials, environmental factors, and management practices in vascular plant-induced deterioration: Case studies from Pompeii, Herculaneum, Paestum, and Velia Archaeological Parks (Italy). Plants 2025, 14, 514. [Google Scholar] [CrossRef]
  13. Trotta, G.; Savo, V.; Cicinelli, E.; Carboni, M.; Caneva, G. Colonization and damages of Ailanthus altissima (Mill.) Swingle on archaeological structures: Evidence from the Aurelian Walls in Rome (Italy). Int. Biodeterior. Biodegrad. 2020, 153, 105054. [Google Scholar] [CrossRef]
  14. Celesti-Grapow, L.; Ricotta, C. Plant invasion as an emerging challenge for the conservation of heritage sites: The spread of ornamental trees on ancient monuments in Rome, Italy. Biol. Invasions 2021, 23, 1191–1206. [Google Scholar] [CrossRef]
  15. Chicouene, D. Mechanical destruction of weeds: A review. In Sustainable Agriculture; Springer: Dordrecht, The Netherlands, 2009; pp. 399–410. [Google Scholar] [CrossRef]
  16. Sabri, A.M.; Suleiman, M.Z. Study of the use of lime plaster on heritage buildings in Malaysia: A case study in George Town, Penang. In MATEC Web of Conferences; EDP Sciences: Les Ulis, France, 2014; Volume 17, p. 01005. [Google Scholar]
  17. Hall, C.M. Biological invasion, biosecurity, tourism, and globalisation. In Handbook of Globalisation and Tourism; Edward Elgar Publishing: Cheltenham, UK, 2019; pp. 114–125. [Google Scholar] [CrossRef]
  18. Matsuzaka, Y.; Yashiro, R. AI-based computer vision techniques and expert systems. AI 2023, 4, 289–302. [Google Scholar] [CrossRef]
  19. Ali, M.L.; Zhang, Z. The YOLO framework: A comprehensive review of evolution, applications, and benchmarks in object detection. Computers 2024, 13, 336. [Google Scholar] [CrossRef]
  20. Lee, J.; Hwang, K.I. YOLO with adaptive frame control for real-time object detection applications. Multimed. Tools Appl. 2022, 81, 36375–36396. [Google Scholar] [CrossRef]
  21. Hussain, M. Yolov1 to v8: Unveiling each variant—A comprehensive review of YOLO. IEEE Access 2024, 12, 42816–42833. [Google Scholar] [CrossRef]
  22. Vijayakumar, A.; Vairavasundaram, S. YOLO-based object detection models: A review and its applications. Multimed. Tools Appl. 2024, 83, 83535–83574. [Google Scholar] [CrossRef]
  23. Reddy, K.U.K.; Shaik, F.; Swathi, V.; Sreevidhya, P.; Yashaswini, A.; Maheswari, J.U. Design and implementation of theft detection using YOLO-based object detection methodology and Gen AI for enhanced security solutions. In Proceedings of the 2025 International Conference on Inventive Computation Technologies (ICICT), Coimbatore, India, 24–26 April 2025; IEEE: New York, NY, USA, 2025; pp. 583–589. [Google Scholar]
  24. Nguyen, H.H.; Ta, T.N.; Nguyen, N.C.; Bui, V.T.; Pham, H.M.; Nguyen, D.M. YOLO-based real-time human detection for smart video surveillance at the edge. In Proceedings of the 2020 IEEE 8th International Conference on Communications and Electronics (ICCE), Phu Quoc, Vietnam, 13–15 January 2021; IEEE: New York, NY, USA, 2021; pp. 439–444. [Google Scholar]
  25. Xu, L.; Yan, W.; Ji, J. The research of a novel WOG-YOLO algorithm for autonomous driving object detection. Sci. Rep. 2023, 13, 3699. [Google Scholar] [CrossRef]
  26. Zhao, R.; Tang, S.H.; Shen, J.; Supeni, E.E.B.; Rahim, S.A. Enhancing autonomous driving safety: A robust traffic sign detection and recognition model TSD-YOLO. Signal Process. 2024, 225, 109619. [Google Scholar] [CrossRef]
  27. Ragab, M.G.; Abdulkadir, S.J.; Muneer, A.; Alqushaibi, A.; Sumiea, E.H.; Qureshi, R.; Alhussian, H. A comprehensive systematic review of YOLO for medical object detection (2018 to 2023). IEEE Access 2024, 12, 57815–57836. [Google Scholar] [CrossRef]
  28. Hu, Y.; Wu, S.; Ma, Z.; Cheng, S.; Xie, M.; Li, S.; Wu, S. Integrating deep learning and machine learning for ceramic artifact classification and market value prediction. npj Herit. Sci. 2025, 13, 306. [Google Scholar] [CrossRef]
  29. Zhang, J.; Zhang, Y.; Liu, J.; Lan, Y.; Zhang, T. Human figure detection in Han portrait stone images via enhanced YOLO-v5. Herit. Sci. 2024, 12, 123. [Google Scholar] [CrossRef]
  30. Siountri, K.; Anagnostopoulos, C.N. The classification of cultural heritage buildings in Athens using deep learning techniques. Heritage 2023, 6, 3673–3705. [Google Scholar] [CrossRef]
  31. Raushan, R.; Singhal, V.; Jha, R.K. Damage detection in concrete structures with multi-feature backgrounds using the YOLO network family. Autom. Constr. 2025, 170, 105887. [Google Scholar] [CrossRef]
  32. Pratibha, K.; Mishra, M.; Ramana, G.V.; Lourenço, P.B. Deep learning-based YOLO network model for detecting surface cracks during structural health monitoring. In Proceedings of the International Conference on Structural Analysis of Historical Constructions, Rome, Italy, 12–15 September 2023; Springer Nature: Cham, Switzerland, 2023; pp. 179–187. [Google Scholar] [CrossRef]
  33. Verhoeven, G.; Taelman, D.; Vermeulen, F. Computer vision-based orthophoto mapping of complex archaeological sites: The ancient quarry of Pitaranha (Portugal–Spain). Archaeometry 2012, 54, 1114–1129. [Google Scholar] [CrossRef]
  34. Cuca, B.; Zaina, F.; Tapete, D. Monitoring of Damages to Cultural Heritage across Europe Using Remote Sensing and Earth Observation: Assessment of Scientific and Grey Literature. Remote Sens. 2023, 15, 3748. [Google Scholar] [CrossRef]
  35. Agapiou, A.; Lysandrou, V. Remote Sensing Archaeology: Tracking and Mapping Evolution in European Scientific Literature from 1999 to 2015. J. Archaeol. Sci. Rep. 2015, 4, 192–200. [Google Scholar] [CrossRef]
  36. Luo, L.; Wang, X.; Guo, H.; Lasaponara, R.; Zong, X.; Masini, N.; Wang, G.; Shi, P.; Khatteli, H.; Chen, F.; et al. Airborne and Spaceborne Remote Sensing for Archaeological and Cultural Heritage Applications: A Review of the Century (1907–2017). Remote Sens. Environ. 2019, 232, 111280. [Google Scholar] [CrossRef]
  37. Chen, F.; Guo, H.; Tapete, D.; Cigna, F.; Piro, S.; Lasaponara, R.; Masini, N. The Role of Imaging Radar in Cultural Heritage: From Technologies to Applications. Int. J. Appl. Earth Obs. Geoinf. 2022, 112, 102907. [Google Scholar] [CrossRef]
  38. Tapete, D.; Cigna, F. Trends and Perspectives of Space-Borne SAR Remote Sensing for Archaeological Landscape and Cultural Heritage Applications. J. Archaeol. Sci. Rep. 2017, 14, 716–726. [Google Scholar] [CrossRef]
  39. Tapete, D.; Cigna, F. Detection of Archaeological Looting from Space: Methods, Achievements and Challenges. Remote Sens. 2019, 11, 2389. [Google Scholar] [CrossRef]
  40. Yun, S.; Ro, Y. SHViT: Single-head vision transformer with memory efficient macro design. In Proceedings of the IEEE/CVF Conference on Computer Vision and Pattern Recognition (CVPR), Seattle, WA, USA, 17–21 June 2024; pp. 5756–5767. [Google Scholar]
  41. Zhu, L.; Wang, X.; Ke, Z.; Zhang, W.; Lau, R.W. BiFormer: Vision transformer with bi-level routing attention. In Proceedings of the IEEE/CVF Conference on Computer Vision and Pattern Recognition (CVPR), Vancouver, BC, Canada, 18–22 June 2023; pp. 10323–10333. [Google Scholar]
  42. Chen, Z.; Chen, K.; Lin, W.; See, J.; Yu, H.; Ke, Y.; Yang, C. PIOU loss: Towards accurate oriented object detection in complex environments. In Proceedings of the Computer Vision—ECCV 2020: Proceedings of the 16th European Conference on Computer Vision, Glasgow, UK, 23–28 August 2020; Springer International Publishing: Cham, Switzerland, 2020. Part V. pp. 195–211. [Google Scholar] [CrossRef]
  43. Bishop, F.L.; Lewith, G.T. Who uses CAM? A narrative review of demographic characteristics and health factors associated with CAM use. Evid.-Based Complement. Altern. Med. 2010, 7, 11–28. [Google Scholar] [CrossRef]
  44. Selvaraju, R.R.; Das, A.; Vedantam, R.; Cogswell, M.; Parikh, D.; Batra, D. Grad-CAM: Why did you say that? arXiv 2016, arXiv:1611.07450. [Google Scholar] [CrossRef]
  45. Wang, H.; Naidu, R.; Michael, J.; Kundu, S.S. SS-CAM: Smoothed Score-CAM for sharper visual feature localization. arXiv 2020, arXiv:2006.14255. [Google Scholar]
  46. Chattopadhay, A.; Sarkar, A.; Howlader, P.; Balasubramanian, V.N. Grad-CAM++: Generalized gradient-based visual explanations for deep convolutional networks. In Proceedings of the 2018 IEEE Winter Conference on Applications of Computer Vision (WACV), Lake Tahoe, NV, USA, 12–15 March 2018; pp. 839–847. [Google Scholar]
  47. Mishra, M.; Lourenço, P.B. Artificial Intelligence-Assisted Visual Inspection for Cultural Heritage: State-of-the-Art Review. J. Cult. Herit. 2024, 66, 536–550. [Google Scholar] [CrossRef]
  48. Karimi, N.; Mishra, M.; Lourenço, P.B. Deep Learning-Based Automated Tile Defect Detection System for Portuguese Cultural Heritage Buildings. J. Cult. Herit. 2024, 68, 86–98. [Google Scholar] [CrossRef]
  49. Colmenero-Fernández, A. Novel VSLAM Positioning through Synthetic Data and Deep Learning: Applications in Virtual Archaeology, ArQVIA. J. Cult. Herit. 2025, 73, 347–357. [Google Scholar] [CrossRef]
  50. Hatir, M.E.; Barstuğan, M.; İnce, İ. Deep Learning-Based Weathering Type Recognition in Historical Stone Monuments. J. Cult. Herit. 2020, 45, 193–203. [Google Scholar] [CrossRef]
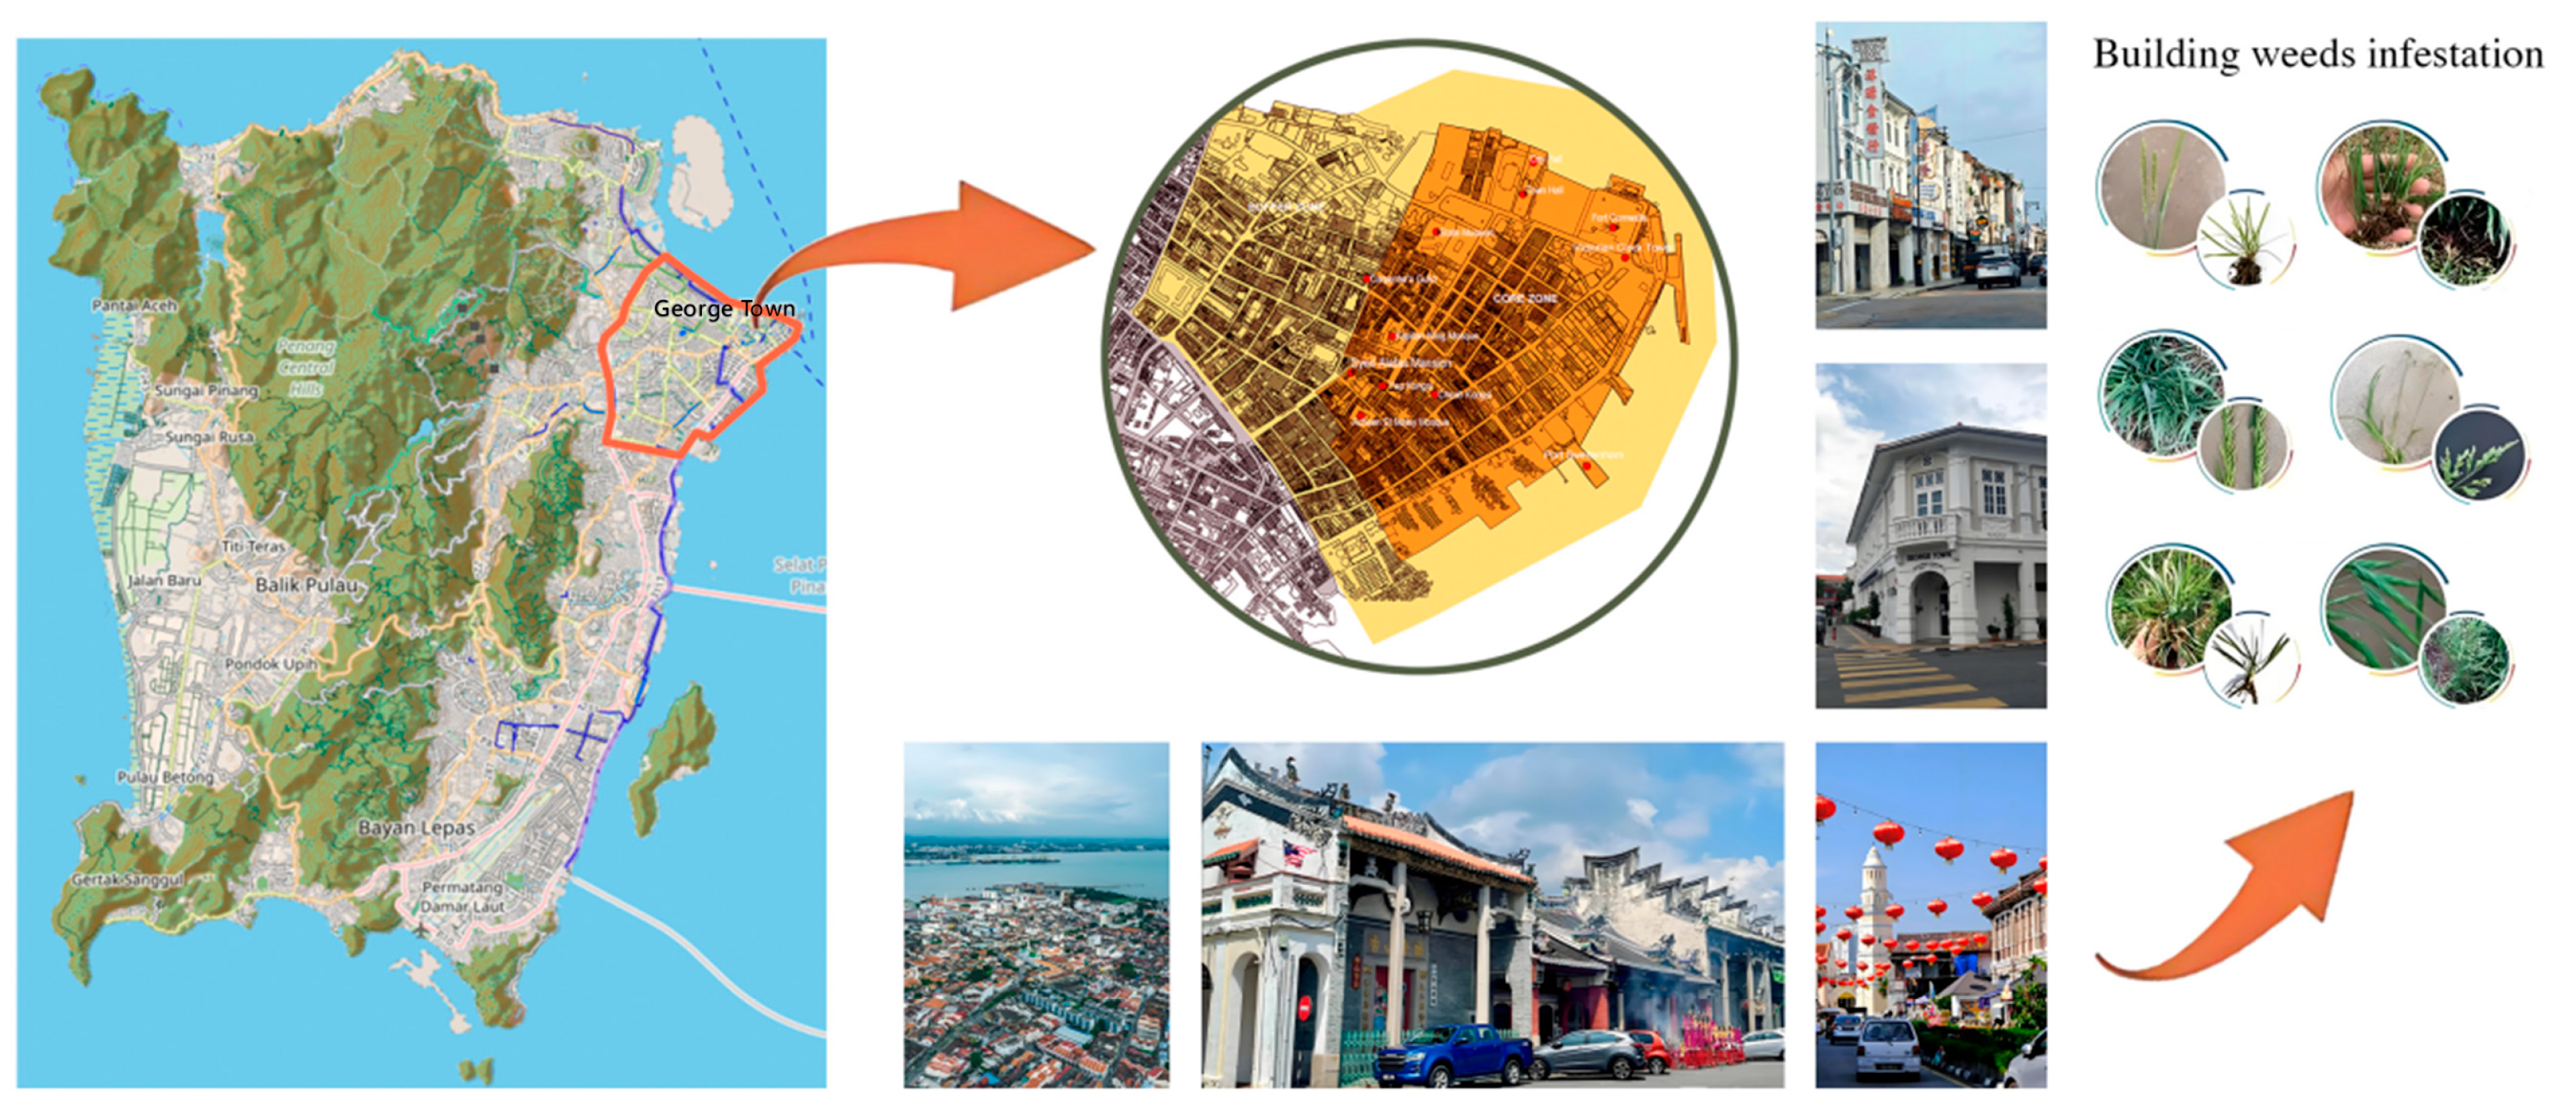
Figure 1. George Town UNESCO World Heritage Core Zone and Representative Weed Challenges.
Coatings 15 01322 g001
Figure 2. Localized weed colonization on heritage building surfaces in George Town, Penang.
Coatings 15 01322 g002
Figure 3. Research Framework of Historic Buildings Surface Weed Detection System.
Coatings 15 01322 g003
Figure 4. Schematic Diagram of Data Enhancement and Segmentation.
Coatings 15 01322 g004
Figure 5. Model Framework of YOLO11-SWDS.
Coatings 15 01322 g005
Figure 6. Schematic architecture of the proposed feature-enhanced backbone in the YOLOv11-SWDS model. The input image first undergoes overlapping patch embedding to preserve fine-grained contextual cues. A multi-level C2f-SE block and deep convolutional layers extract primary local features, which are subsequently processed through the SHViT module integrating single-head hybrid self-attention. This module fuses local and global feature representations via single-head attention to enhance small-object recognition on complex heritage façades. The resulting feature maps are used for subsequent detection and localization tasks in the experimental workflow.
Coatings 15 01322 g006
Figure 7. Framework of Bi-Level Routing Attention (BLRA) module.
Coatings 15 01322 g007
Figure 8. Weed Detection for Heritage Protection.
Coatings 15 01322 g008
Figure 9. Confusion Matrix of Weed Detection across Heritage Façade Categories.
Coatings 15 01322 g009
Figure 10. Comparison of mAP@0.5 values during YOLOv11-SWDS, Faster R-CNN, SSD, and YOLOv7-tiny model training.
Coatings 15 01322 g010
Figure 11. Comparison of response heatmaps of baseline YOLOv11n and YOLOv11-SWDS under different attention visualization methods.
Coatings 15 01322 g011
Figure 12. Comparison of model attention response maps under architectural background interference.
Coatings 15 01322 g012
Figure 13. Typical example of model missing weeds under visual degradation conditions.
Coatings 15 01322 g013
Table 1. Comparison of Experimental Results of Different Models.
ModelF1 ScoreP (%)R (%)mAP@50
(%)
GFLOPsParams
(MB)
Faster R-CNN41.1732.4160.247.678337
SSD81.6387.0377.5782.4131.326.14
YOLOv7-tiny82.4686.578.885.213.212.3
YOLOv11n83.287.079.785.46.62.85
Table 2. Ablation Experimental Results of Improvement YOLOv11 Model.
SHViTBLRAPIOUF1
Score
P (%)R (%)mAP@50
(%)
GFLOPsParams
(MB)
82.986.879.385.86.32.58
83.887.380.486.86.62.85
82.786.779.186.06.32.58
84.188.879.787.16.22.46
82.089.975.585.56.62.85
85.089.081.387.86.52.75
85.089.081.387.86.52.75
Disclaimer/Publisher’s Note: The statements, opinions and data contained in all publications are solely those of the individual author(s) and contributor(s) and not of MDPI and/or the editor(s). MDPI and/or the editor(s) disclaim responsibility for any injury to people or property resulting from any ideas, methods, instructions or products referred to in the content.