Article

Study on Synergistic Enhancement of Surface Properties of Ti-6Al-4V Alloy for Dental Applications by Magnetic Abrasive Finishing

1
Stomatology College of Jiamusi University, Jiamusi University, Jiamusi 154002, China
2
Beijing CRS Medical Device Co., Ltd., Beijing 102600, China
3
Beijing Citident Hospital of Stomatology, Beijing 100032, China
4
Beijing Implant Training College (BITC), Beijing 100032, China
5
Dental Implant Center, Peking Union Medical College Hospital, Chinese Academy of Medical Sciences, Beijing 100032, China
*
Authors to whom correspondence should be addressed.
Coatings 2025, 15(12), 1364; https://doi.org/10.3390/coatings15121364 (registering DOI)
Submission received: 20 October 2025 / Revised: 15 November 2025 / Accepted: 18 November 2025 / Published: 22 November 2025
(This article belongs to the Section Bioactive Coatings and Biointerfaces)

Abstract

Titanium alloys are widely used in dental implants due to their superior biocompatibility and mechanical strength. However, these alloys are prone to corrosion and wear in the oral environment, thereby shortening their clinical lifespan. This study investigates the enhancement of titanium alloy surface properties using magnetic abrasive finishing (MAF) and examines the influence of magnetic needle diameters (0.2–1.5 mm) on surface modification. Titanium alloy samples were processed by MAF and systematically evaluated for surface morphology, grain size, surface hardness, residual stress, electrochemical corrosion behavior, and tribological performance. Results demonstrated that MAF improves surface morphology, significantly refines grain size, and enhances surface hardness and compressive residual stress, thereby optimizing surface properties. The 1.0 mm magnetic needle group demonstrated the best performance, achieving a Vickers hardness of 376.71 ± 12.48 HV and a compressive residual stress of −579.1 ± 8.49 MPa. In addition, this group showed a higher self-corrosion potential (−0.5661 V), a lower corrosion current density (0.0114 μA·cm−2), and the lowest wear rate ((4.49 ± 0.42) × 10−4 mm3/N·m) in artificial saliva, demonstrating superior corrosion and wear resistance. Overall, MAF technology markedly enhances the surface integrity of titanium alloys in artificial saliva through the synergistic effects of grain refinement and stress modulation. These findings provide valuable experimental evidence supporting future efforts to optimize the surface properties of titanium alloy dental implants.

1. Introduction

With the ongoing advancements in modern dentistry and dental implantology, there is a growing demand for improved surface properties of implant materials. Titanium alloys are among the most successful biomaterials, owing to their high strength-to-weight ratio and excellent biocompatibility. They not only promote tissue integration effectively but also exhibit unique physical properties, making them widely used in dental applications [1,2,3]. However, within the complex and dynamic oral environment, titanium alloys are still significantly affected by combined corrosion and wear, severely limiting their long-term clinical reliability [4]. Electrolytes, microbial metabolites, and pH fluctuations in saliva can induce electrochemical corrosion, resulting in the continuous release of metal ions. This process may trigger local inflammation, cytotoxicity, and reduced biocompatibility [5,6,7,8]. Repeated masticatory stress and occlusal forces cause mechanical wear, leading to implant loosening, reduced stability, and eventual failure [9,10]. The synergistic interaction between corrosion and wear has emerged as a critical factor limiting the long-term clinical performance of titanium implants. Consequently, developing efficient and controllable surface modification strategies to improve corrosion and wear resistance has become a central focus in dental implant research.
Traditional surface modification methods primarily include laser cladding, plasma spraying, and anodizing. Among these, laser cladding employs high-energy lasers to deposit materials onto the substrate surface. It provides high coating density and strong interfacial bonding, but its limitations include costly equipment and complex operation [11,12]. Plasma spraying offers high processing efficiency; however, maintaining consistent coating quality is challenging, and adhesion is influenced by multiple factors, leading to reliability issues [13]. Anodizing is simple to perform and produces an oxide film on metal surfaces; however, the film exhibits low mechanical strength, compromising its long-term stability [14]. Although these methods have achieved progress, they still encounter challenges such as high energy consumption, complicated procedures, high costs, and limited adaptability to complex structures in practical applications, which restrict their clinical application. Therefore, it is urgent to develop a low-energy, environmentally friendly surface modification technology suitable for complex curved structures.
Magnetic abrasive finishing (MAF) is an advanced surface modification technique that employs a magnetic field to control magnetic abrasives, enabling precise material removal from workpiece surfaces. It provides advantages including uniform material removal, adaptability to complex geometries, and the absence of mechanical contact wear [15]. Moreover, the process is environmentally friendly, significantly mitigating ecological impacts by lowering the consumption and emission of pollutants during machining [16]. MAF enhances material performance in complex service environments by inducing residual compressive stress and increasing surface hardness [17,18,19]. In recent years, advances in MAF technology and its strong controllability of abrasive media structures have revealed distinct advantages in processing complex cavities and miniature workpieces, highlighting its substantial industrial potential and clinical relevance.
Although the potential of magnetic abrasive finishing (MAF) in precision machining is increasingly recognized, studies on its application to titanium alloys—particularly in dental surface modification—remain limited. Specifically, systematic experimental evaluations of the influence of magnetic needle diameter—a critical process parameter—on grinding performance are lacking. Therefore, this study investigates how magnetic needle diameter regulates the surface properties of Ti-6Al-4V alloy using magnetic needle grinding technology, with the goal of providing experimental evidence and optimization guidelines for its application in dental titanium alloy surface modification. The methodology adopted for this study is described in detail below, outlining the experimental setup and evaluation criteria.

2. Materials and Methods

2.1. Sample Preparation

Cylindrical specimens of Ti-6Al-4V alloy (Zapp Precision Metals, Schwerte, North Rhine-Westphalia, Germany) were fabricated using CNC lathe processing, with a diameter of 6 mm and a length of 2.5 mm. The Ti-6Al-4V alloy primarily consists of approximately 90% titanium, 6% aluminum, and 4% vanadium. The specimens were sequentially ultrasonically cleaned in acetone, ethanol, and distilled water for 10 min each, then dried and prepared for subsequent experiments. A schematic of the magnetic abrasive finishing process is presented in Figure 1. The experiment was conducted using the single-factor variable method, in which the magnetic needle diameter—identified as the primary factor influencing surface quality [20]—was varied while all other parameters were maintained at predetermined constant values to investigate its effect on surface finishing performance. The magnetic needles were made of SUS304 stainless steel, and the grinding fluid used was HD-233A (Holding Electric Co., Ltd., Taichung City, Taiwan Province, China). Magnetic abrasive finishing was performed using an HD-728 machine (Holding Electric Co., Ltd., Taichung City, Taiwan Province, China). During processing, the magnetic pole rotation direction was reversed halfway to improve finishing uniformity. After grinding, the specimens were ultrasonically cleaned again with acetone (≥99.5%), anhydrous ethanol, and distilled water, and then dried. The experiment was divided into four groups, each treated with MAF using different magnetic needle diameters. The detailed parameters are listed in Table 1. Unprocessed samples served as the control group.

2.2. Surface Morphology

The surface morphology of the samples was examined using a FlexSEM 1000 II scanning electron microscope (Hitachi Industrial Products, Ltd., Marunouchi, Tokyo, Japan) operated at an acceleration voltage of 10 kV.

2.3. Phase Analysis

Phase analysis was conducted using a D/Max 2500PC X-ray diffractometer (Rigaku Holdings Co., Ltd., Akishima City, Tokyo, Japan) equipped with a Cu target and Kα radiation (λ = 0.154 nm). Each group consisted of one independent sample. The operating conditions were: tube voltage 40 kV, tube current 40 mA, and a scanning range of 2θ = 30–90°. X-ray diffraction (XRD) patterns were processed with Jade 6.5 software (Materials Data, Inc., Livermore, CA, USA) to determine phase composition, full width at half maximum (FWHM). Based on the obtained FWHM values, the grain size was calculated using the Scherrer formula (Equation (1)).
D = K λ β cos θ
Here, D denotes the average crystallite size, K is the shape factor, λ represents the wavelength of the X-ray radiation, β corresponds to the FWHM of the diffraction peak, and θ is the Bragg diffraction angle.

2.4. Surface Micro Vickers Hardness

The Vickers hardness of the samples was measured using a 200HV-5 Vickers hardness tester (Laizhou Huayin Test Instrument Co., Ltd., Laizhou City, Shandong Province, China). During testing, each sample was mounted on the stage and adjusted to the focal plane of the microscope. A 136° rhombic diamond indenter applied a load of 200 g, which was maintained for 10 s. After unloading, the lengths of the two diagonals of the indentation were measured under the microscope, and the hardness was calculated using the standard Vickers formula with the applied load. Each group consisted of five independent samples (n = 5). The Vickers hardness was calculated according to Equation (2):
H V = 0.1891 F d 2
Here, HV denotes Vickers hardness, d refers to the average length of the two indentation diagonals, and F indicates the applied test force.

2.5. Surface Residual Stress

The surface residual stress of the titanium alloy was measured using the Laboratory X-ray Residual Stress Diffractometer MG2000 and analysis system (Proto Manufacturing Ltd., Kitchener, ON, Canada). Prior to testing, the Cu Kα X-ray source was set to a tube voltage of 25.00 kV and a tube current of 30.00 mA, and the sample surface was thoroughly cleaned. The specimen was then securely fixed to the measurement platform to ensure that its normal was approximately parallel to the incident X-ray beam. Residual stress was determined using the sin2ψ method by sequentially collecting diffraction peaks of the crystal planes at seven inclination angles (ψ = 0.00°, 10.83°, 18.84°, 19.00°, 19.16°, 27.17°, and 38.00°) [21]. Each group consisted of three independent samples (n = 3). Finally, the surface residual stress was calculated according to Equation (3):
σ ϕ = E 2 1 + ν cot θ 0 π 180 2 θ ϕ ψ sin 2 ψ
Among these, σϕ denotes the residual stress on the material surface; E is the Young’s modulus of the crystal plane; v is the Poisson’s ratio of the crystal plane; θϕψ denotes the X-ray diffraction angle of the stressed material; and ψ is the angle between the surface normal and the normal of the diffraction crystal plane. A negative σϕ indicates compressive stress, whereas a positive value indicates tensile stress.

2.6. Electrochemical Corrosion

Electrochemical corrosion tests were conducted using a CHI660E electrochemical workstation (Shanghai Chenhua Instrument Co., Ltd., Shanghai, China). The testing system comprised a saturated calomel electrode (SCE) as the reference electrode, a platinum wire as the counter electrode, and the sample as the working electrode. All electrodes were immersed in artificial saliva (AS, pH 6.8) at 37 °C to simulate the oral environment. The composition of the artificial saliva is shown in Table 2. Before both polarization and impedance measurements, the samples were stabilized under open-circuit potential (OCP) conditions for 60 min to ensure that the system reached a relatively stable state. After OCP stabilization, electrochemical impedance spectroscopy (EIS) was performed over a frequency range of 10−2 to 105 Hz. Subsequently, dynamic potential polarization tests were carried out by scanning from –1.6 V to +1.6 V (vs. Ag/AgCl), and the polarization curve was recorded. The corrosion potential (Ecorr) and corrosion current density (Icorr) were obtained from the polarization curve using the Tafel extrapolation method. Each group consisted of one independent sample. The polarization resistance (Rp) was calculated using the Stern–Geary Equation (4):
R p = β a β c 2.303 I corr β a + β c
In this context, βa denotes the anodic Tafel slope, while βc denotes the cathodic Tafel slope.
Table 2. Artificial saliva components.
NaClKClNaH2PO4, 2H2OCaCl2, 2H2ONa2S, 2H2OUreaDistilled-Water
0.4 g0.4 g0.78 g0.795 g0.005 g1 g1000 mL

2.7. Friction and Wear Performance

The friction and wear performance was evaluated using a CSM-TRB3 tester (Anton Paar, Graz, Austria). Prior to testing, the friction pair surfaces were polished and subsequently cleaned with acetone in an ultrasonic bath. The samples were then mounted in the drive unit and fixture of the testing machine and preloaded to ensure precise system alignment. To simulate the oral environment, tests were performed under artificial saliva (AS) conditions at pH 6.8 and 37 °C, using 3-mm-diameter Si3N4 balls as counter bodies to evaluate the wear resistance of the substrate. Test parameters included a constant load of 2 N, a reciprocating frequency of 2 Hz, and a stroke amplitude of 3 mm. Wear volume was determined by white-light scanning and analyzed with the accompanying software, Image Plus (Anton Paar, Graz, Austria). Each group consisted of three independent samples (n = 3). The wear rate was calculated according to Equation (5):
W = V L × F
Here, W denotes the wear rate, V represents the wear volume, L is the sliding distance, and F is the applied normal load.

2.8. Statistical Analysis

All data related to micro-Vickers hardness, residual stress, and friction/wear performance are expressed as mean ± standard deviation (mean ± SD), with at least three independent specimens per group (n ≥ 3). Prior to statistical analysis, data normality was assessed using the Shapiro–Wilk test, and homogeneity of variances was verified using the Levene test. When both assumptions were satisfied, one-way analysis of variance (ANOVA) followed by Tukey’s multiple comparison test was performed to evaluate intergroup differences. If either assumption was violated, the Kruskal–Wallis non-parametric test was applied. Statistical significance was defined as p < 0.05. For phase analysis and electrochemical corrosion tests, since only one specimen was examined per group, results are presented descriptively without statistical evaluation.

3. Result

3.1. Surface Morphology

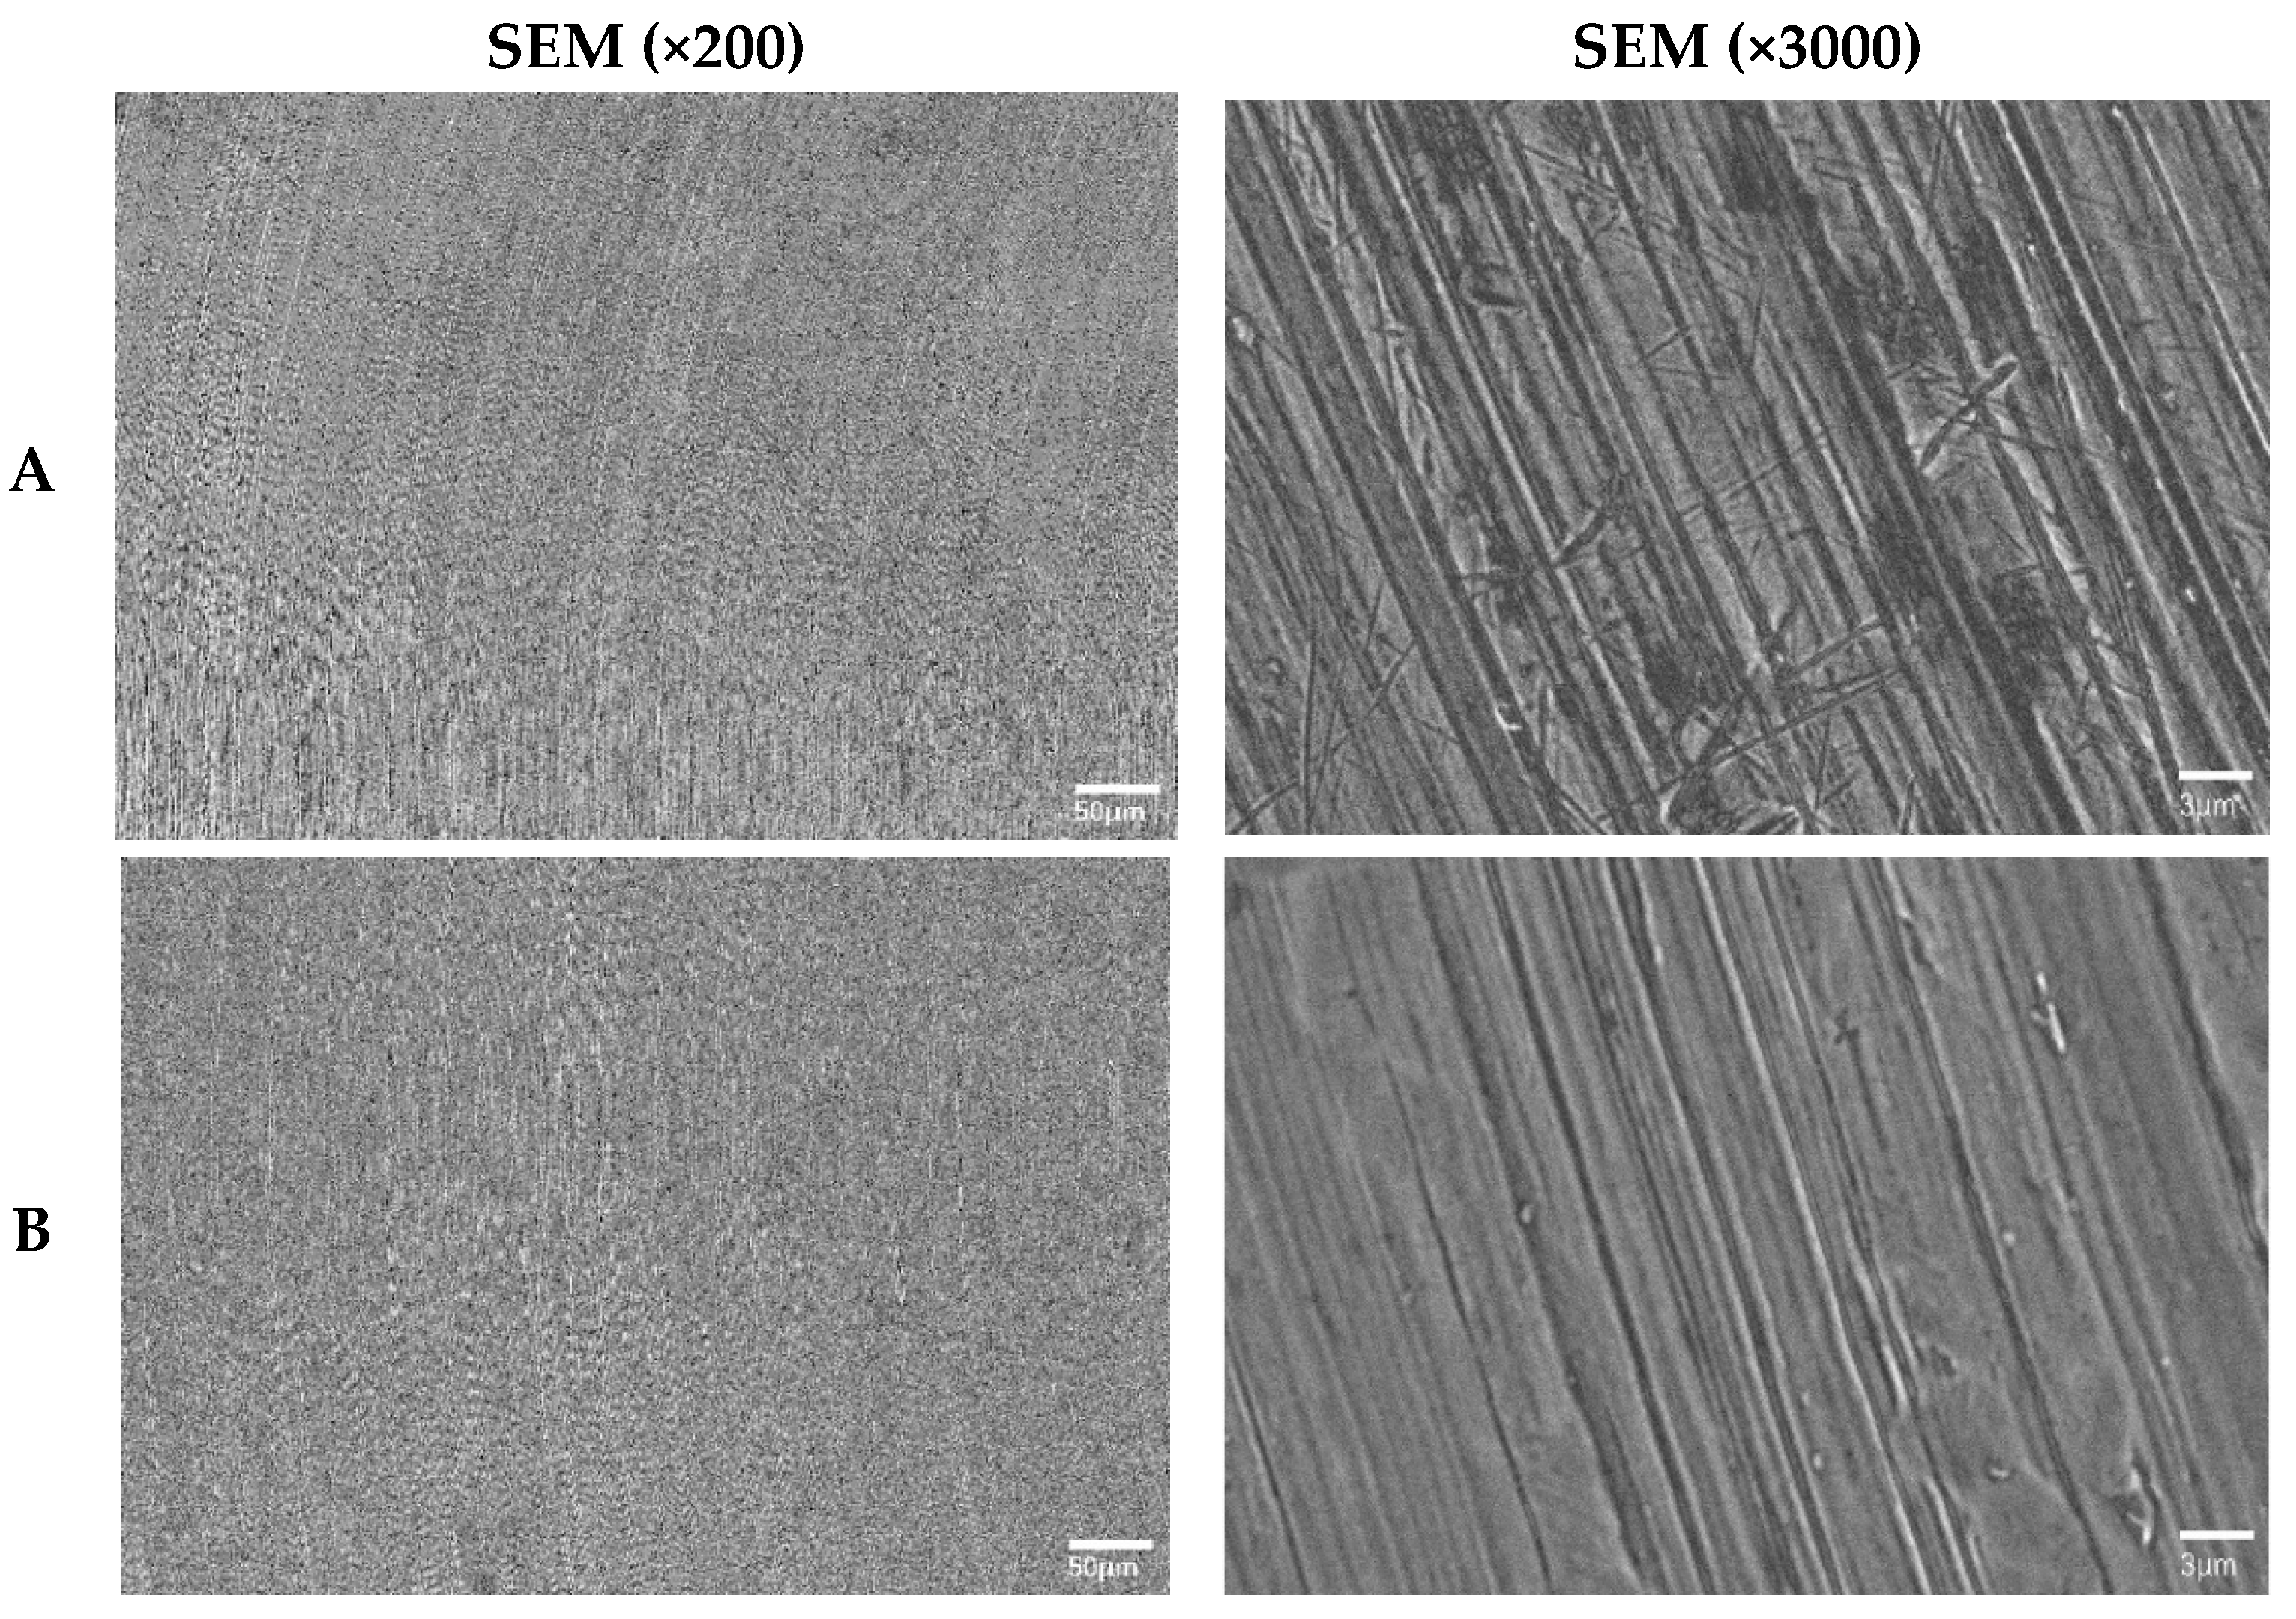
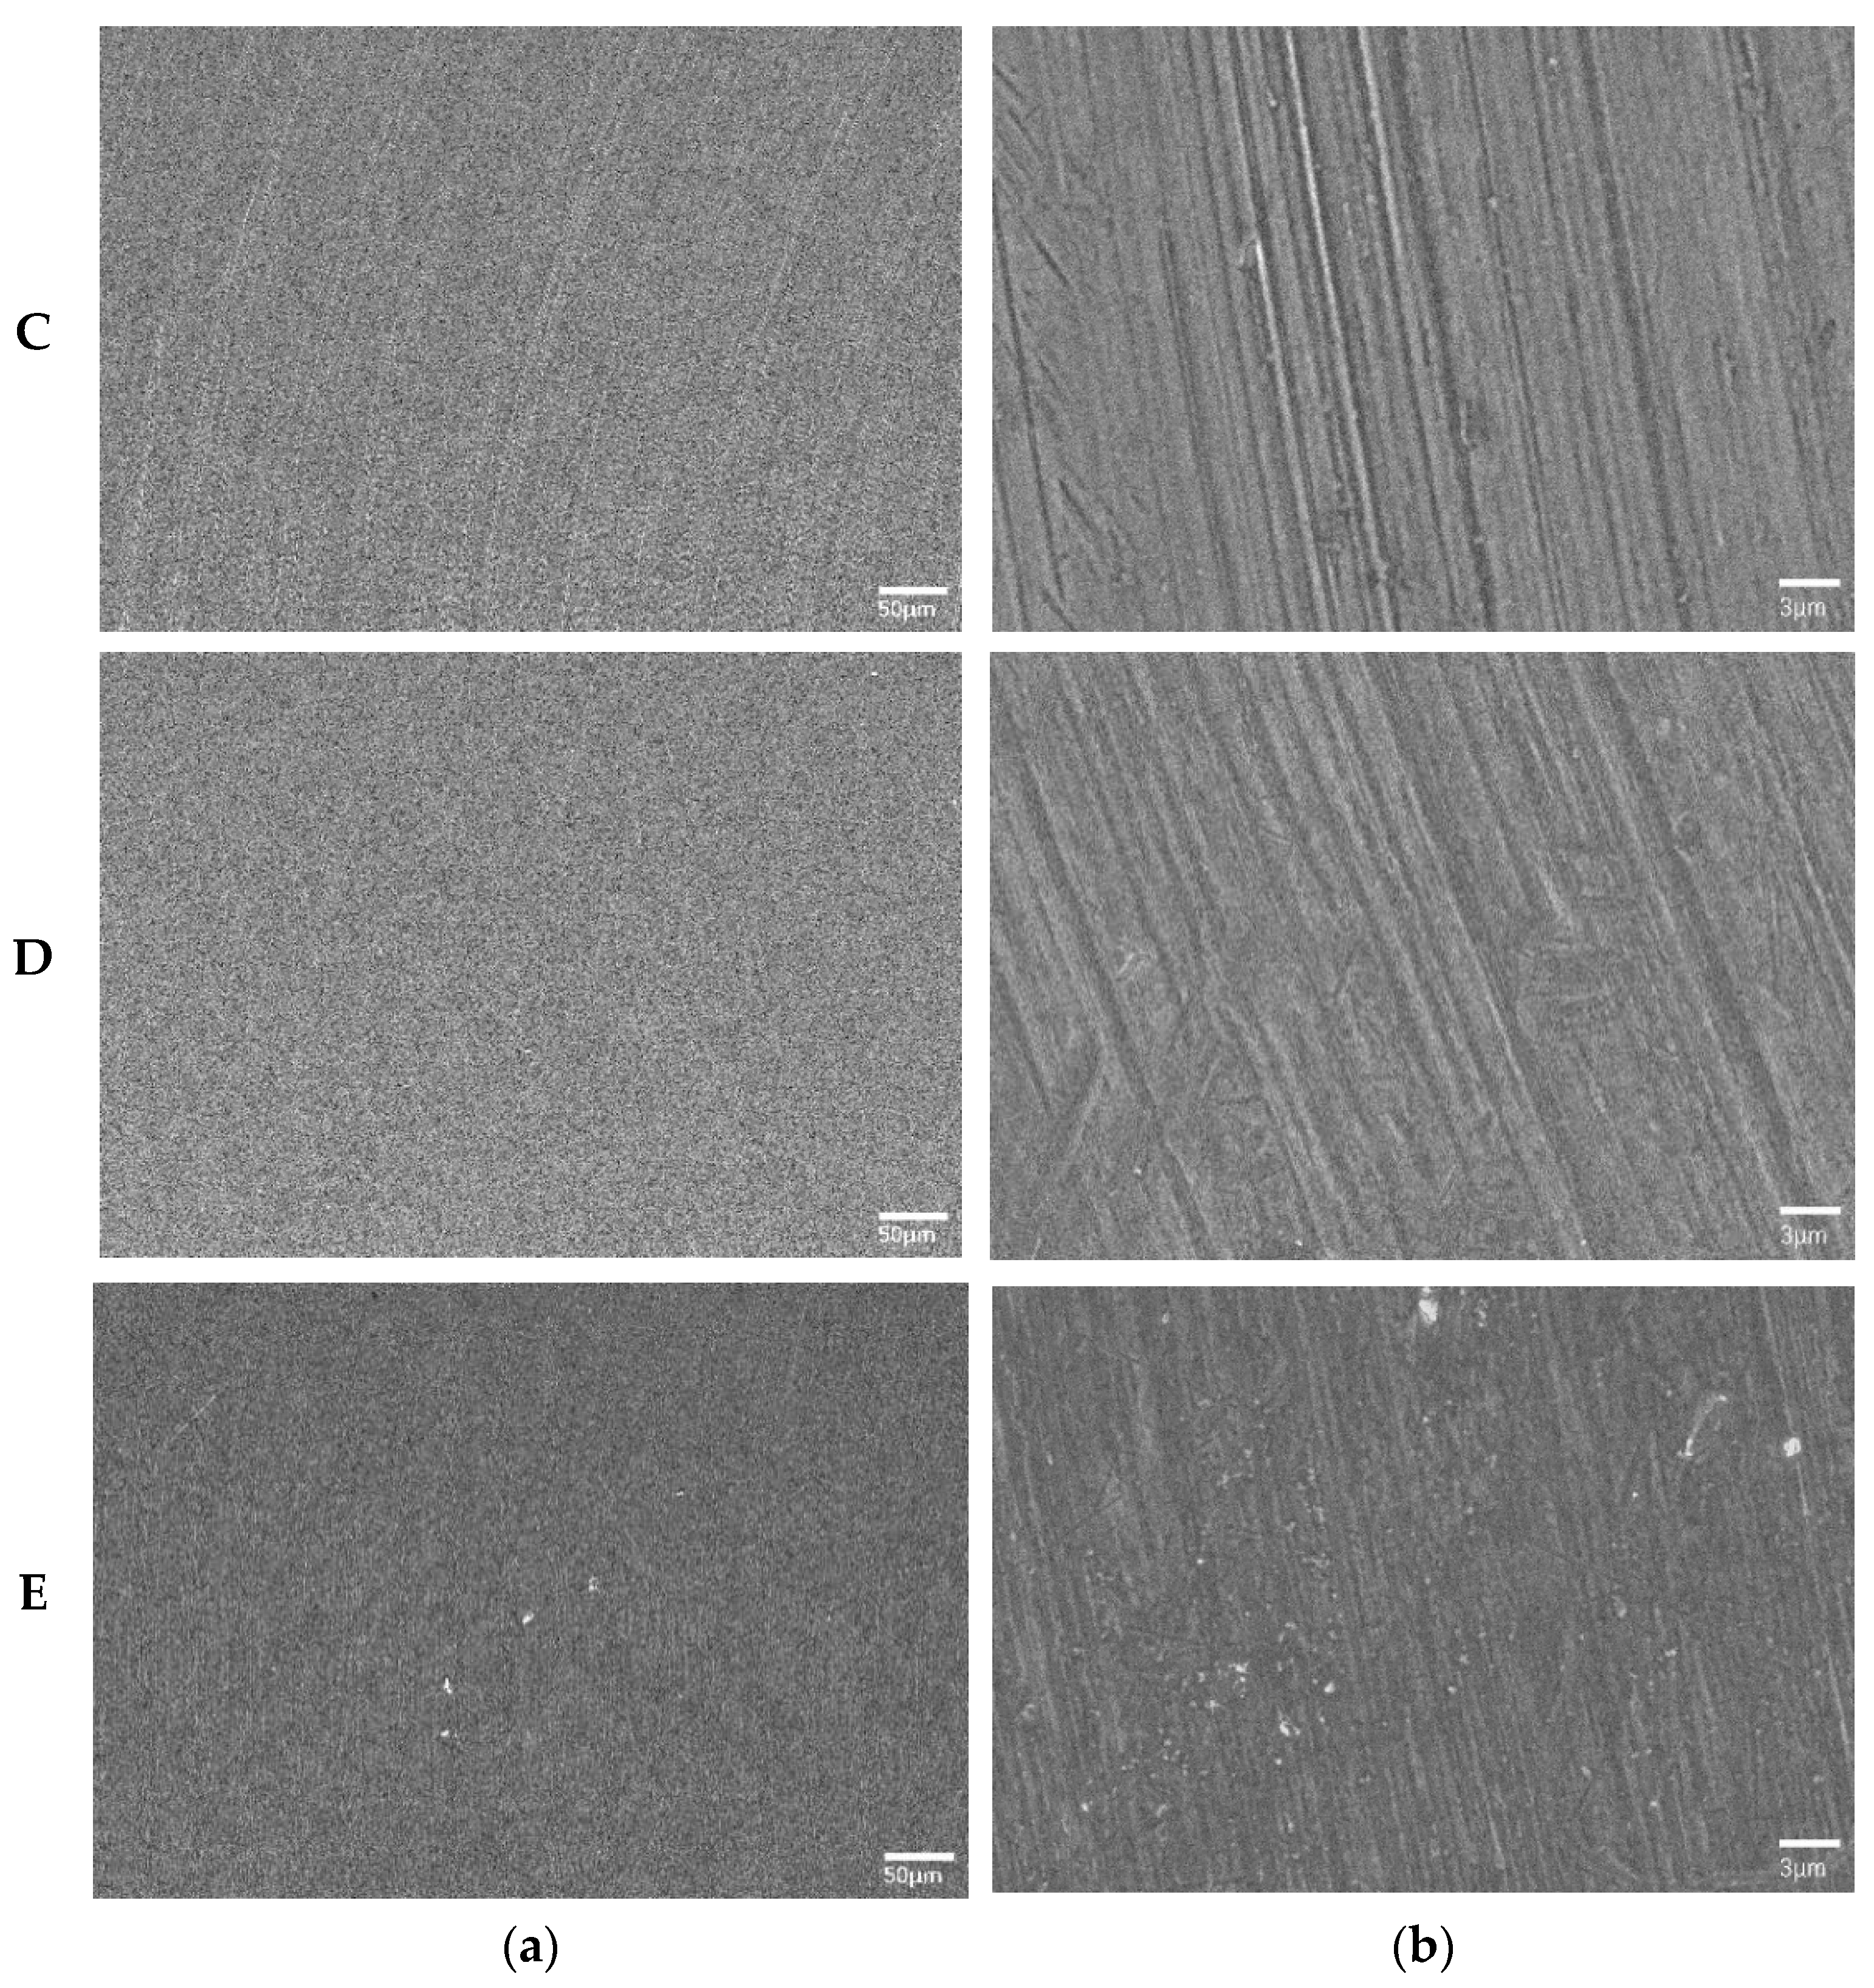
Figure 2 shows the surface morphology of samples processed under different MAF parameters. The control group exhibited continuous deep grooves and small pits, with grooves oriented in a consistent direction and overall high roughness. In the MAF0.2 group, macroscopic grooves were partially smoothed, while parallel micro-striations and local irregular micro-elevations remained, indicating a slight improvement in surface topography. In the MAF0.5 group, most grooves were smoothed, forming shallow and broad wavy traces; the residual grooves became shallower and narrower, further improving surface flatness. The MAF1.0 group showed an even flatter surface with only a few shallow scratches. At MAF1.5, machining marks were almost entirely eliminated, although localized particle deposits were present.

3.2. Phase Analysis

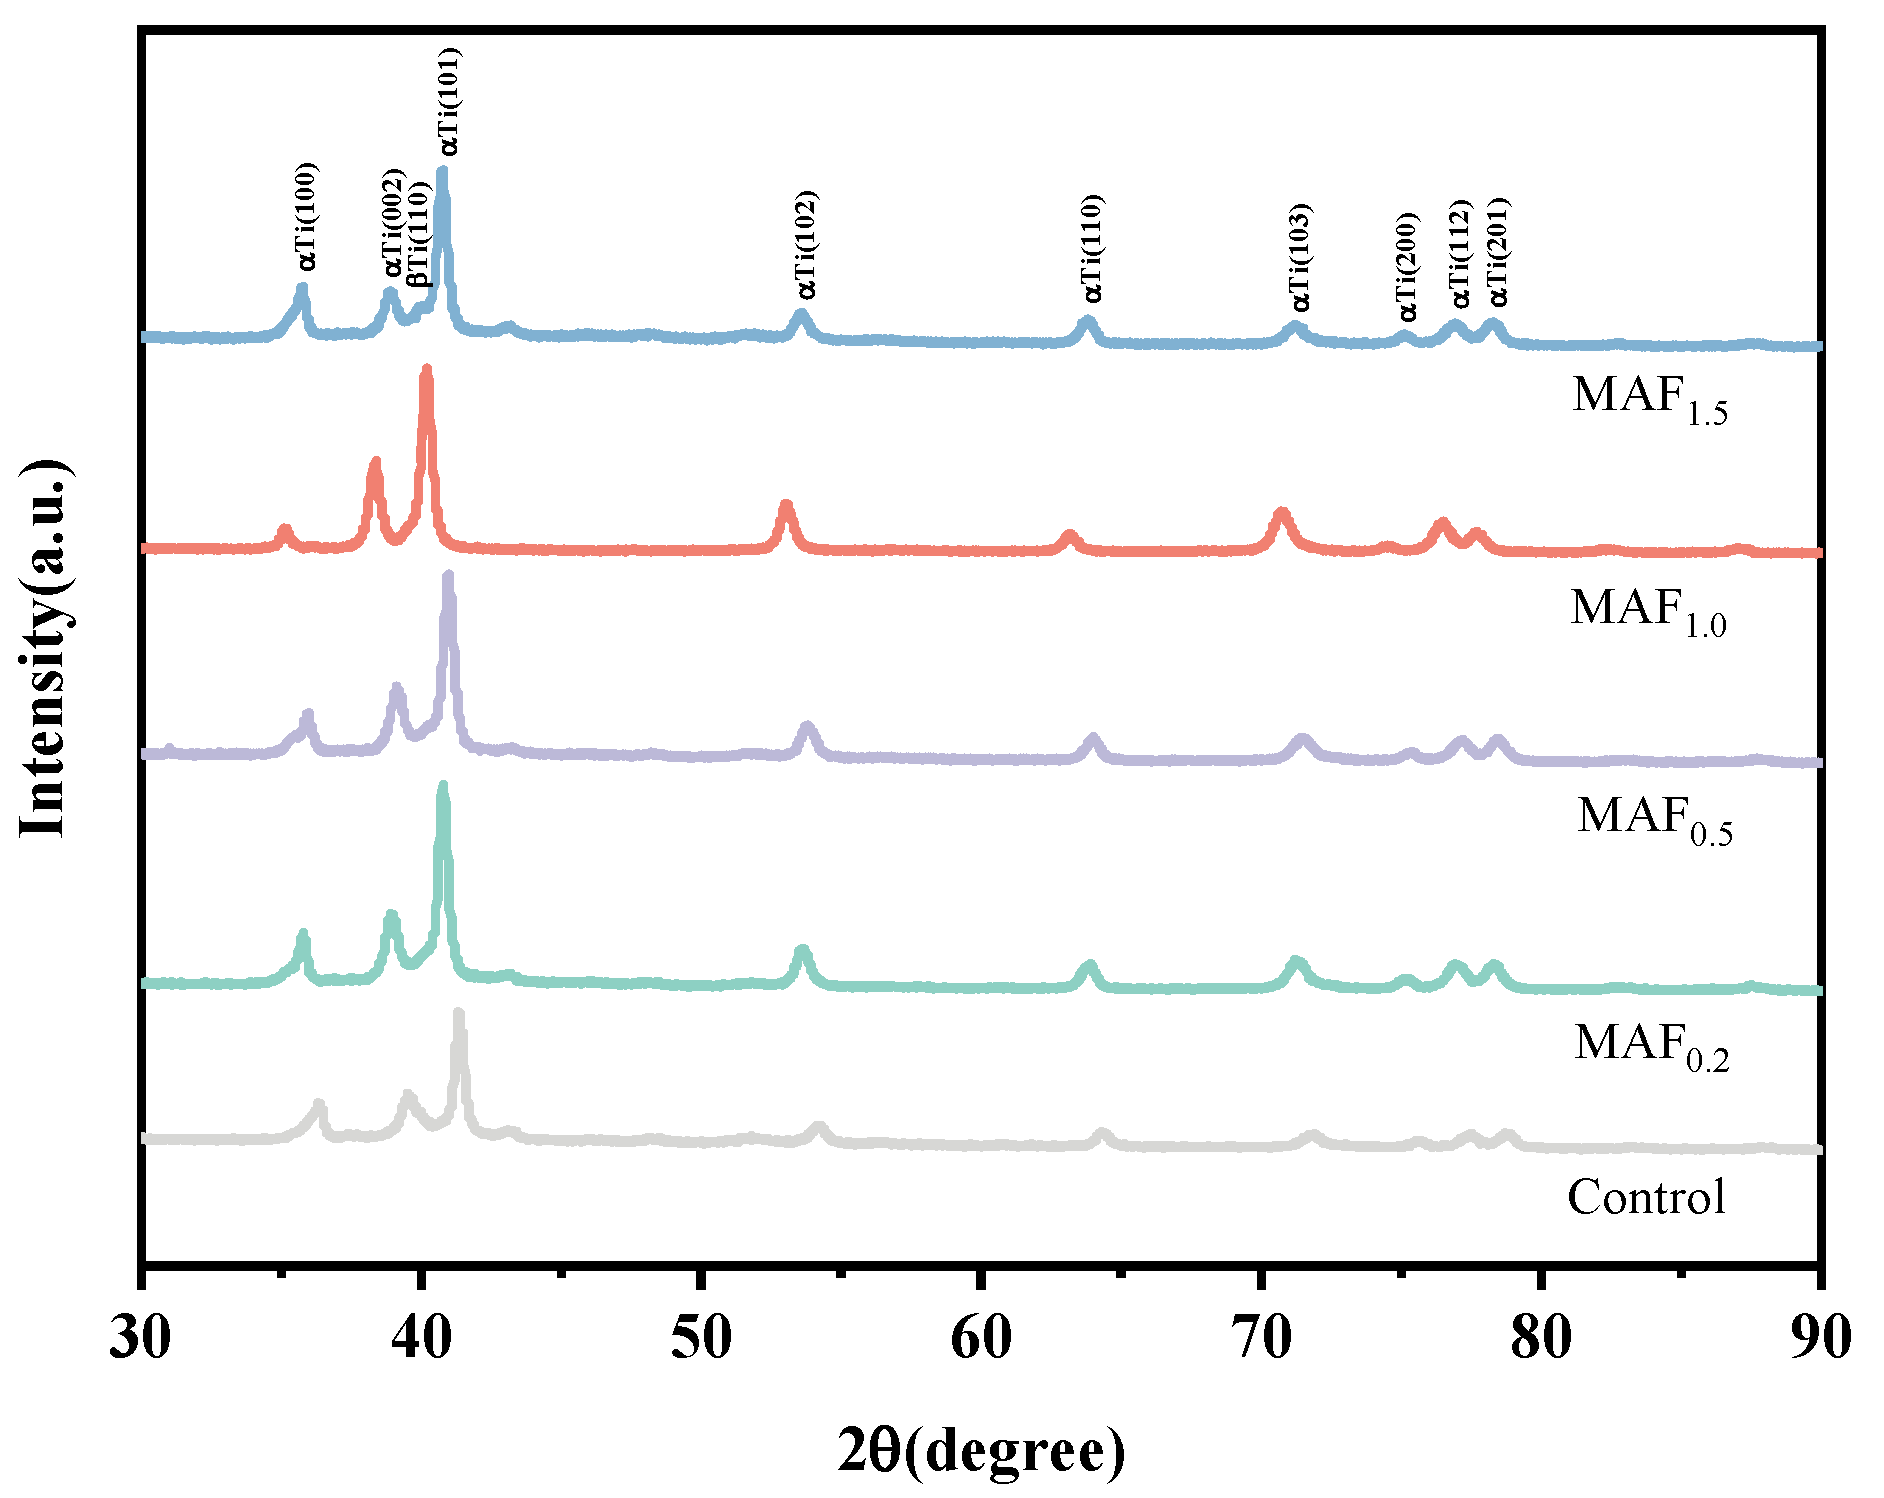
According to the XRD patterns in Figure 3, the titanium alloy samples primarily consisted of α-titanium, with a minor fraction of β-phase detected. No additional diffraction peaks were observed, indicating that MAF treatment did not induce significant phase transformation or formation of new phases. Compared with the control group, the MAF-treated samples exhibited slightly low-angle shifts in the main diffraction peaks. Table 3 presents the full width at half maximum (FWHM) of the α-Ti (101) diffraction peak under different magnetic needle conditions, along with the corresponding grain sizes. The results indicate that with increasing magnetic needle diameter, the FWHM of the diffraction peak exhibits an overall upward trend. Specifically, the FWHM in the control group, the FWHM was 0.338°, increasing to 0.362°, 0.385°, and 0.400° after MAF0.2, MAF0.5, and MAF1.0 treatments, respectively, before slightly decreasing to 0.390° in the MAF1.5 group. Consistent with the FWHM changes, the grain size first decreased and then slightly increased. The grain size in the control group was 18.5 nm, which decreased to 17.7 nm, 17.1 nm, and 15.4 nm in the MAF0.2, MAF0.5, and MAF1.0 groups, respectively, before increasing to 16.8 nm under MAF1.5 conditions.

3.3. Surface Micro-Vickers Hardness

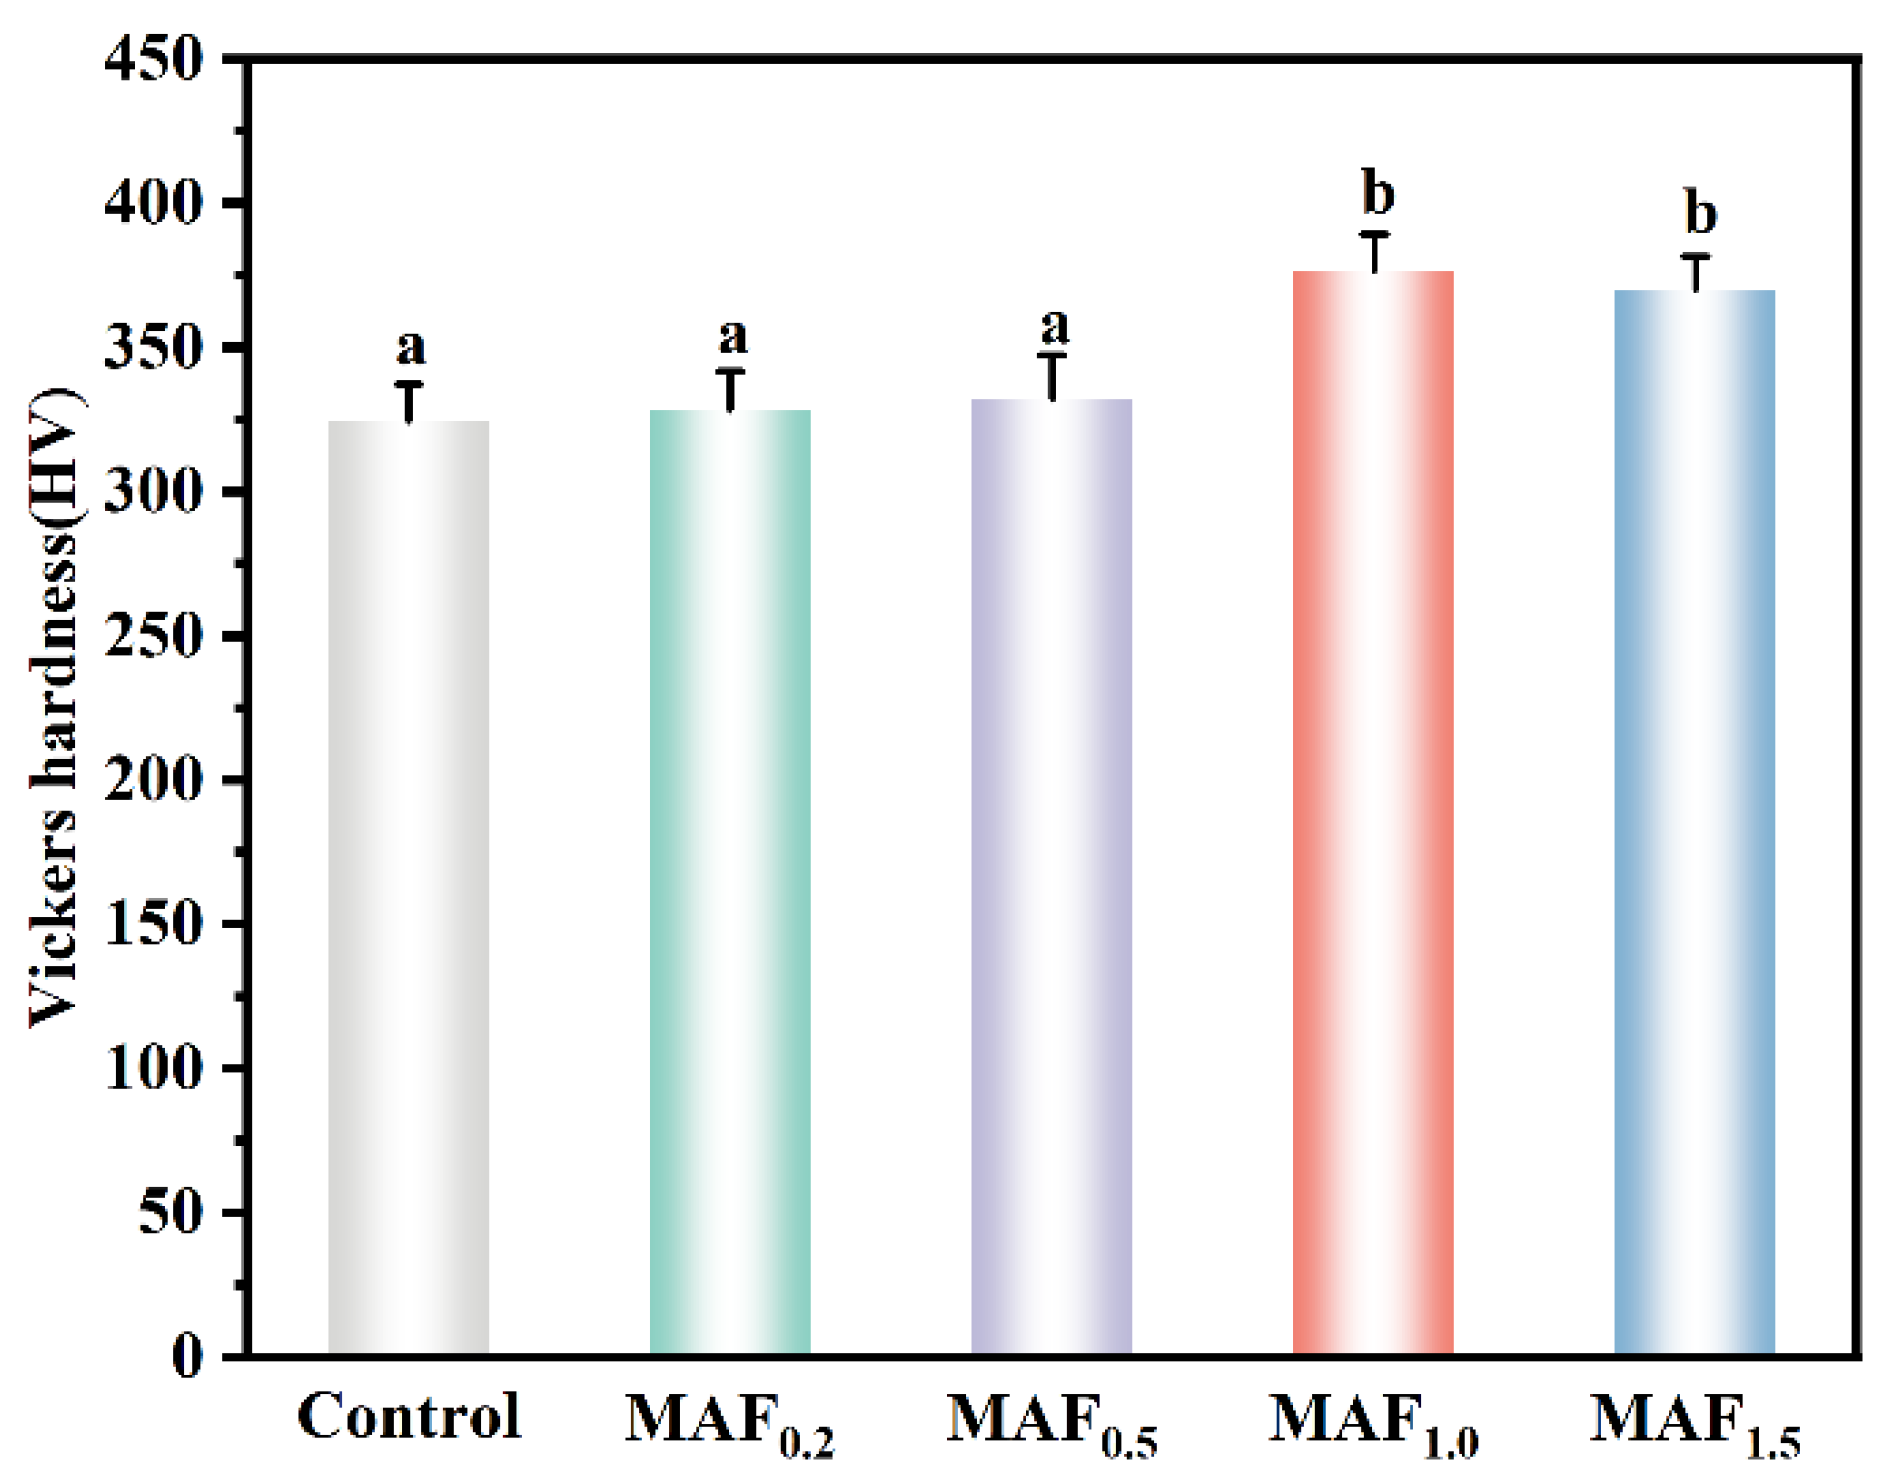
Figure 4 presents the surface micro-Vickers hardness of titanium alloy samples under various treatment conditions. The control group exhibited a Vickers hardness of 324.24 ± 12.88 HV. While MAF-treated samples showed a substantial increase in hardness. Specifically, the MAF0.2 group reached 328.14 ± 13.52 HV, the MAF0.5 group reached 331.83 ± 15.44 HV, and the MAF1.0 group achieved the highest value of 376.71 ± 12.48 HV. The MAF1.5 group exhibited a hardness of 369.97 ± 11.38 HV, slightly lower than that of the MAF1.0 group. Statistical analysis revealed that the Vickers hardness values of the MAF1.0 and MAF1.5 groups were significantly higher than that of the control group (p < 0.05). Overall, the Vickers hardness increased with larger MAF magnetic needle diameters, peaking in the MAF1.0 group and slightly decreasing thereafter.

3.4. Surface Residual Stress

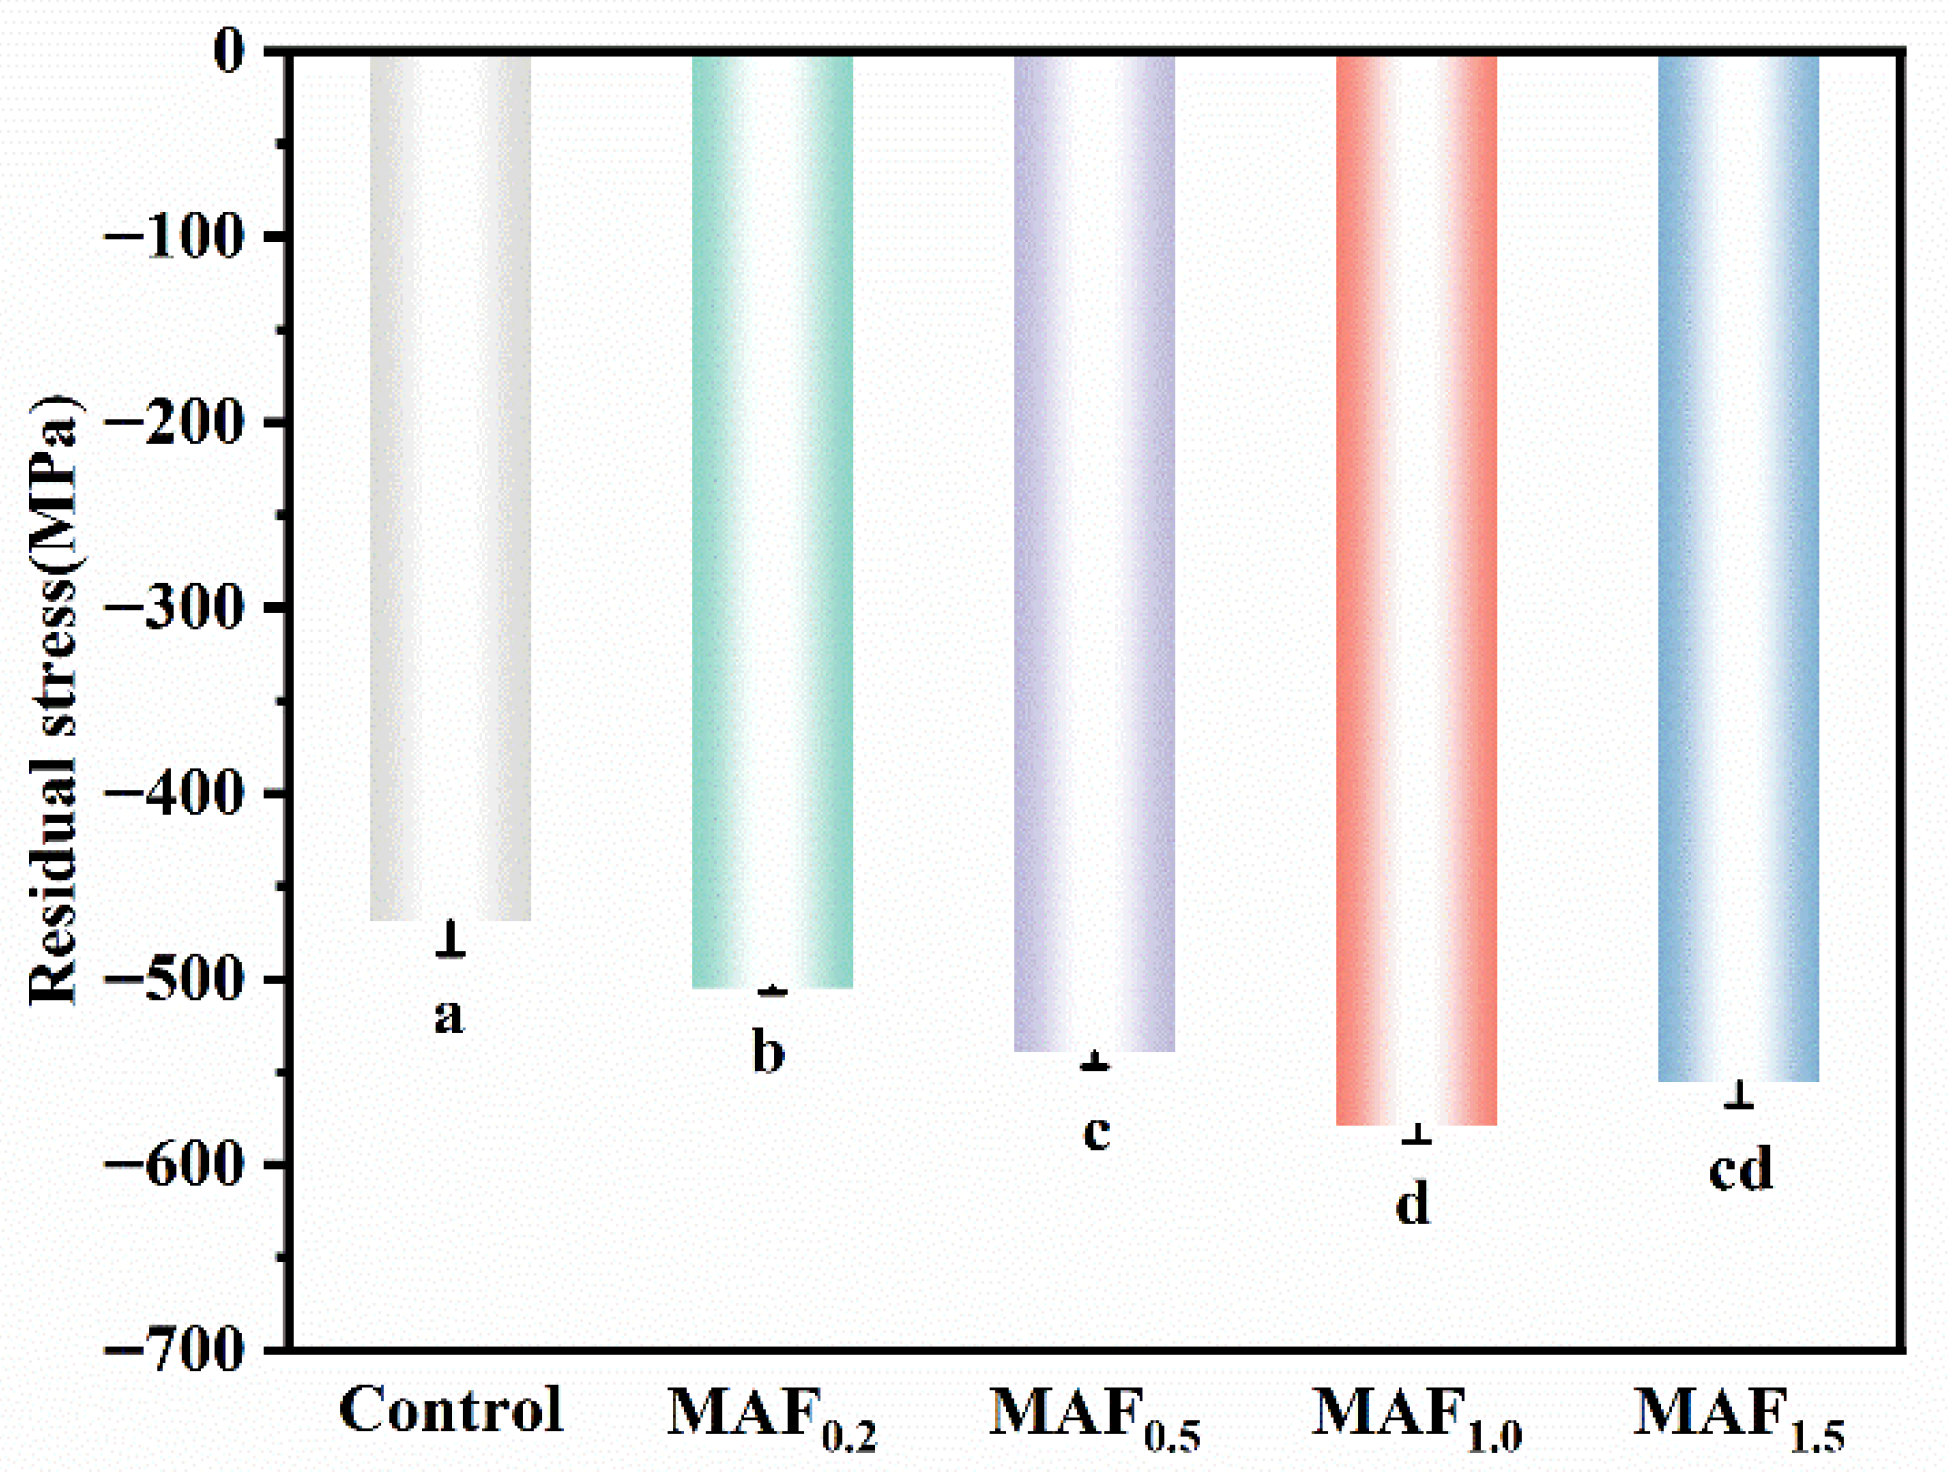
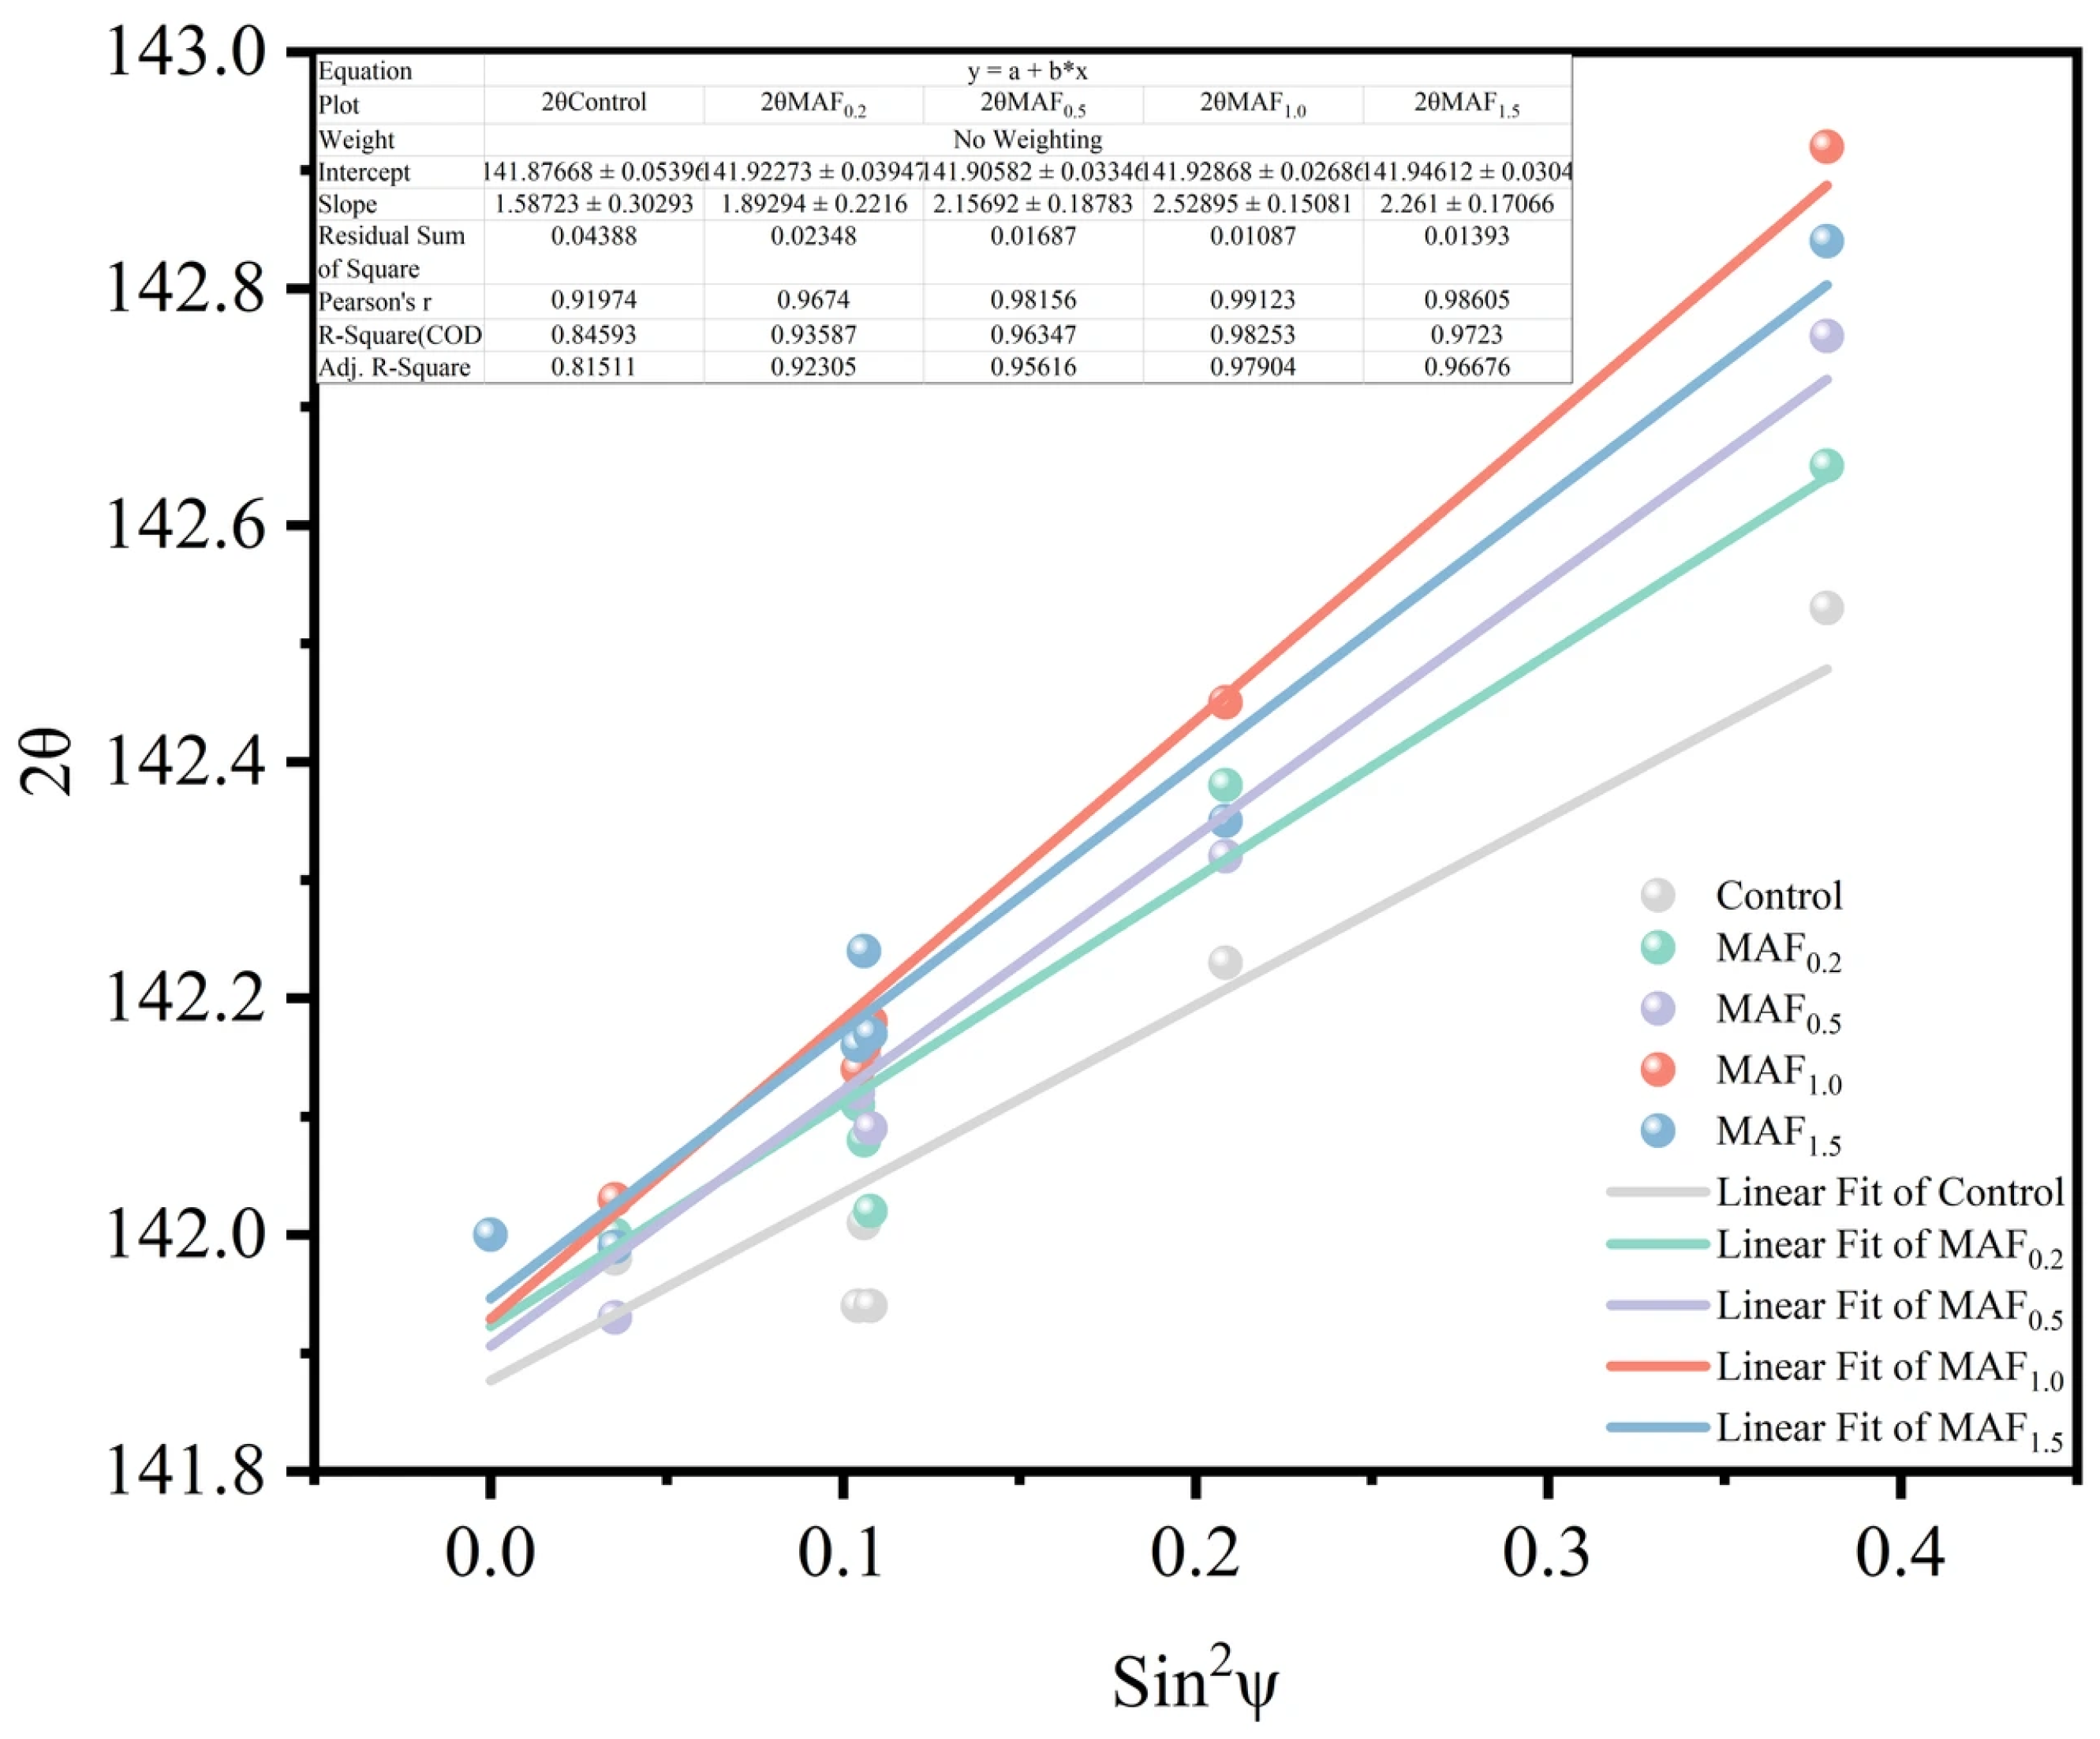
Figure 5 presents the surface residual stress test results of titanium alloy samples from the control group and various MAF treatment groups. The control group exhibited an average residual stress of approximately −460.03 ± 17.57 MPa. With the progression of MAF treatment, the residual compressive stress gradually increased. The residual compressive stresses for the MAF0.2, MAF0.5, and MAF1.0 groups were −504.57 ± 2.89 MPa, −539.6 ±7.79 MPa, and −579.1 ± 8.49 MPa, respectively, with MAF1.0 exhibiting the highest value. Statistical analysis revealed that the residual compressive stresses of the MAF1.0 and MAF1.5 groups were significantly higher than that of the control group (p < 0.05), while no significant difference was observed between these two groups (p > 0.05). When the magnetic needle diameter was further increased to 1.5 mm, the residual stress of the MAF1.5 group slightly decreased to −555.63 ± 12.79 MPa. Figure 6 presents the linear fitting results between 2θ and sin2ψ obtained from X-ray diffraction tests of samples across different groups and ψ angles. All samples exhibited strong linear correlations, with coefficients of determination (R2) exceeding 0.93, confirming the high stability and accuracy of the residual stress test. The linear fitting parameters corresponding to the table section in Figure 6 are provided in the Supplementary Materials (Table S1). According to the X-ray diffraction sin2ψ method, the slope of the fitted curve is directly proportional to the residual compressive stress. A larger slope corresponds to a higher residual compressive stress. The fitting results demonstrate that the slope variation trend aligns with the residual stress variation shown in Figure 5. The MAF1.0 group exhibited the largest slope, corresponding to the maximum residual compressive stress. The control group showed the smallest slope, corresponding to the lowest residual compressive stress. Data points in each group were evenly distributed, and fitting errors were minimal, further confirming the reliability of the residual stress variation trend.

3.5. Electrochemical Corrosion

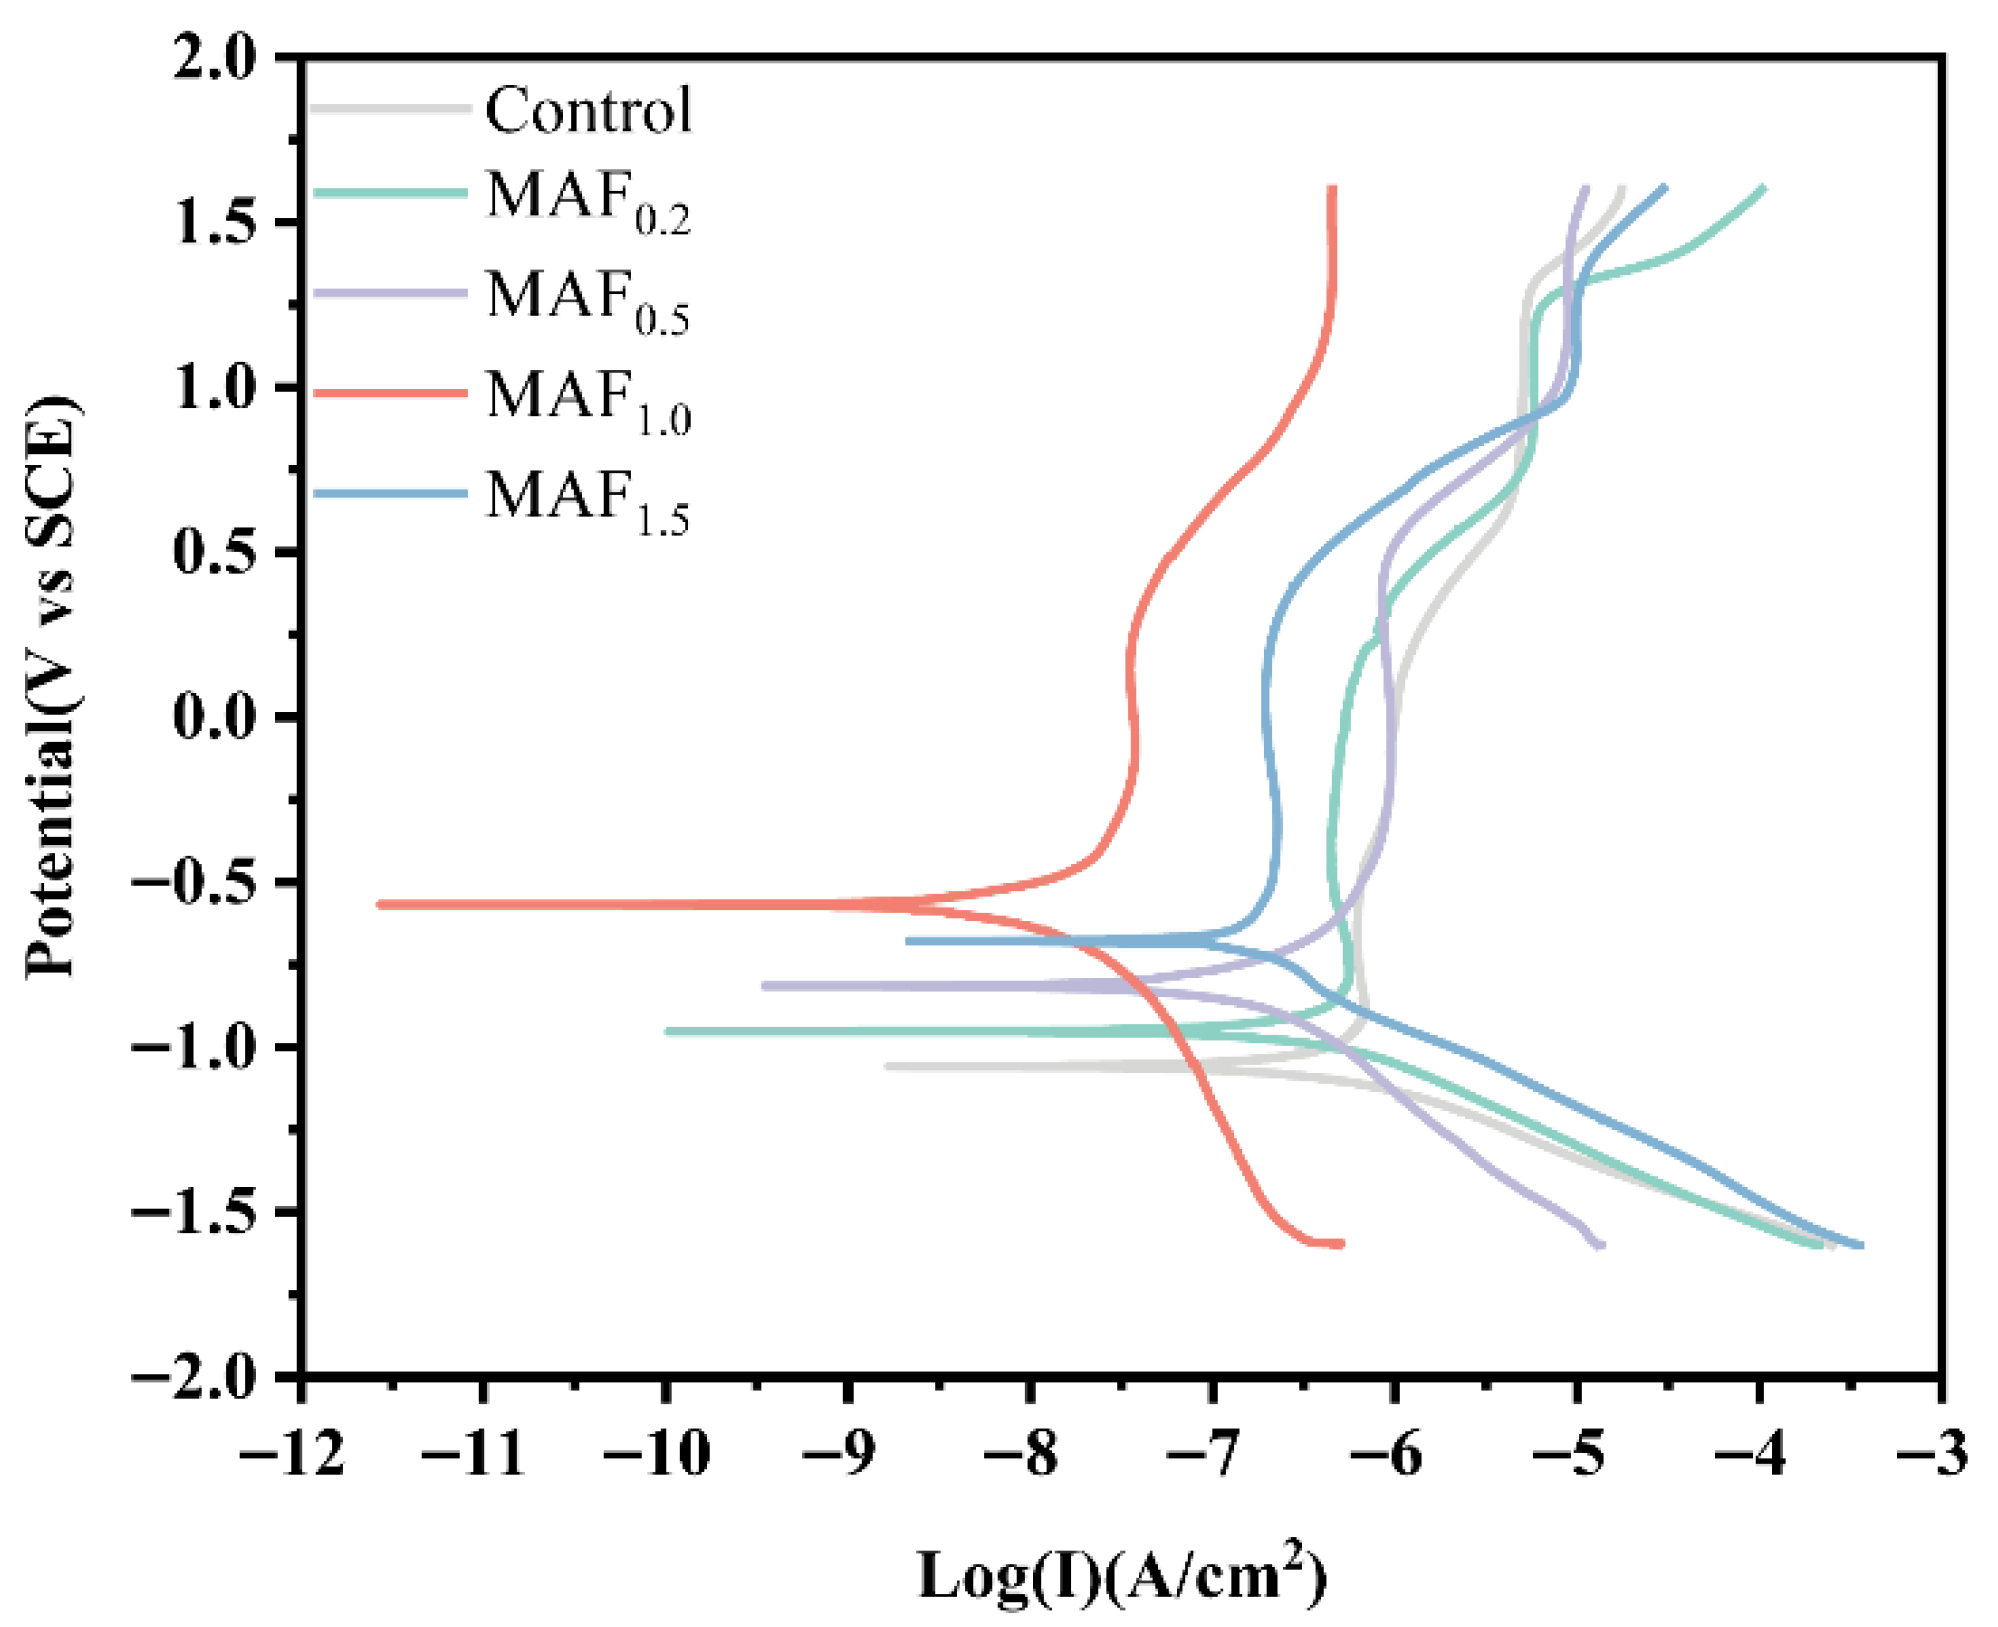
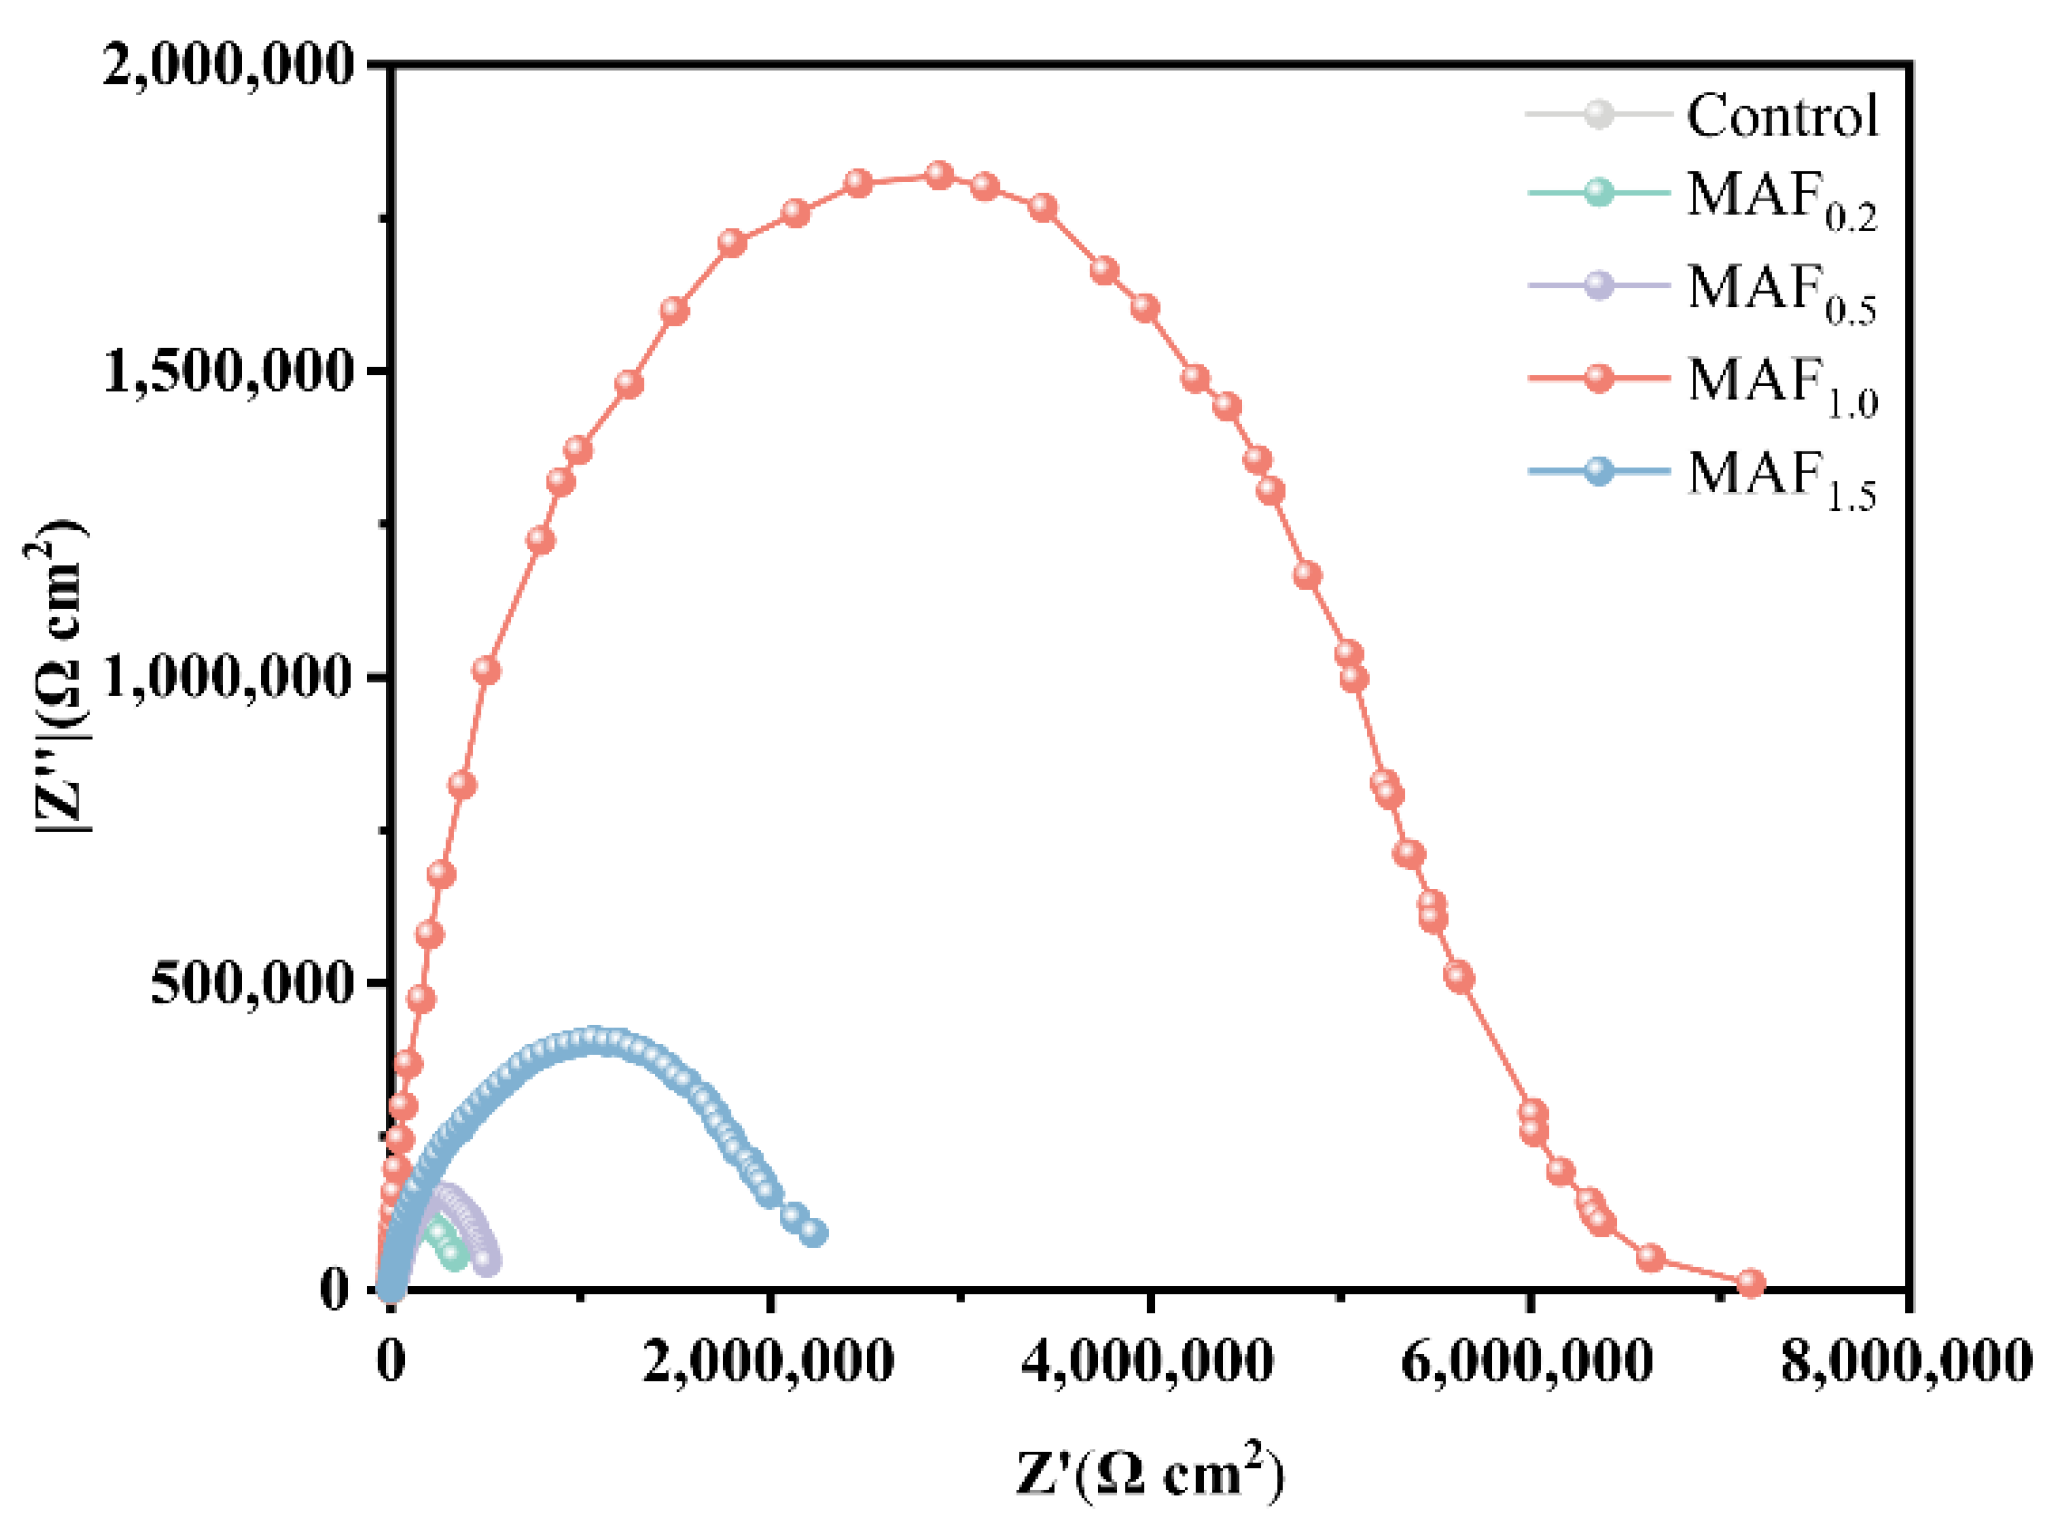
Figure 7 presents the dynamic polarization curves of titanium alloy samples subjected to different MAF treatments in an artificial saliva environment. All groups exhibit similar polarization profiles, indicating comparable redox reactions during electrochemical corrosion. Distinct passivation plateaus with broad passivation zones were observed in all treated samples, confirming excellent passivation performance regardless of magnetic needle size. Electrochemical parameters derived from curve fitting are summarized in Table 4. A more positive self-corrosion potential (Ecorr) indicates higher corrosion resistance, whereas a lower corrosion current density (Icorr) indicates a slower corrosion rate. As the magnetic needle diameter increased from 0.2 mm to 1.0 mm, Ecorr shifted positively and Icorr decreased markedly, demonstrating progressive enhancement of corrosion resistance. The MAF1.0 group exhibited the best performance, with Ecorr reaching −0.5661 V and Icorr reduced to 0.0114 μA·cm−2, while the untreated control group showed the poorest resistance (Ecorr = −1.0647 V, Icorr = 0.2869 μA·cm−2). Figure 8 shows the Nyquist impedance plots of each sample group. All curves display the characteristic semicircular shape typical of charge-transfer-controlled capacitance. As the magnetic needle diameter increased, the curve radius first expanded and then slightly decreased, indicating that polarization resistance (Rp) followed an overall upward trend. The maximum Rp of 8.97 × 10⁶ Ω·cm2 was observed in the MAF1.0 group, significantly higher than the 1.43 × 10⁵ Ω·cm2 measured in the control group, confirming the superior corrosion resistance achieved with this treatment.

3.6. Friction Wear

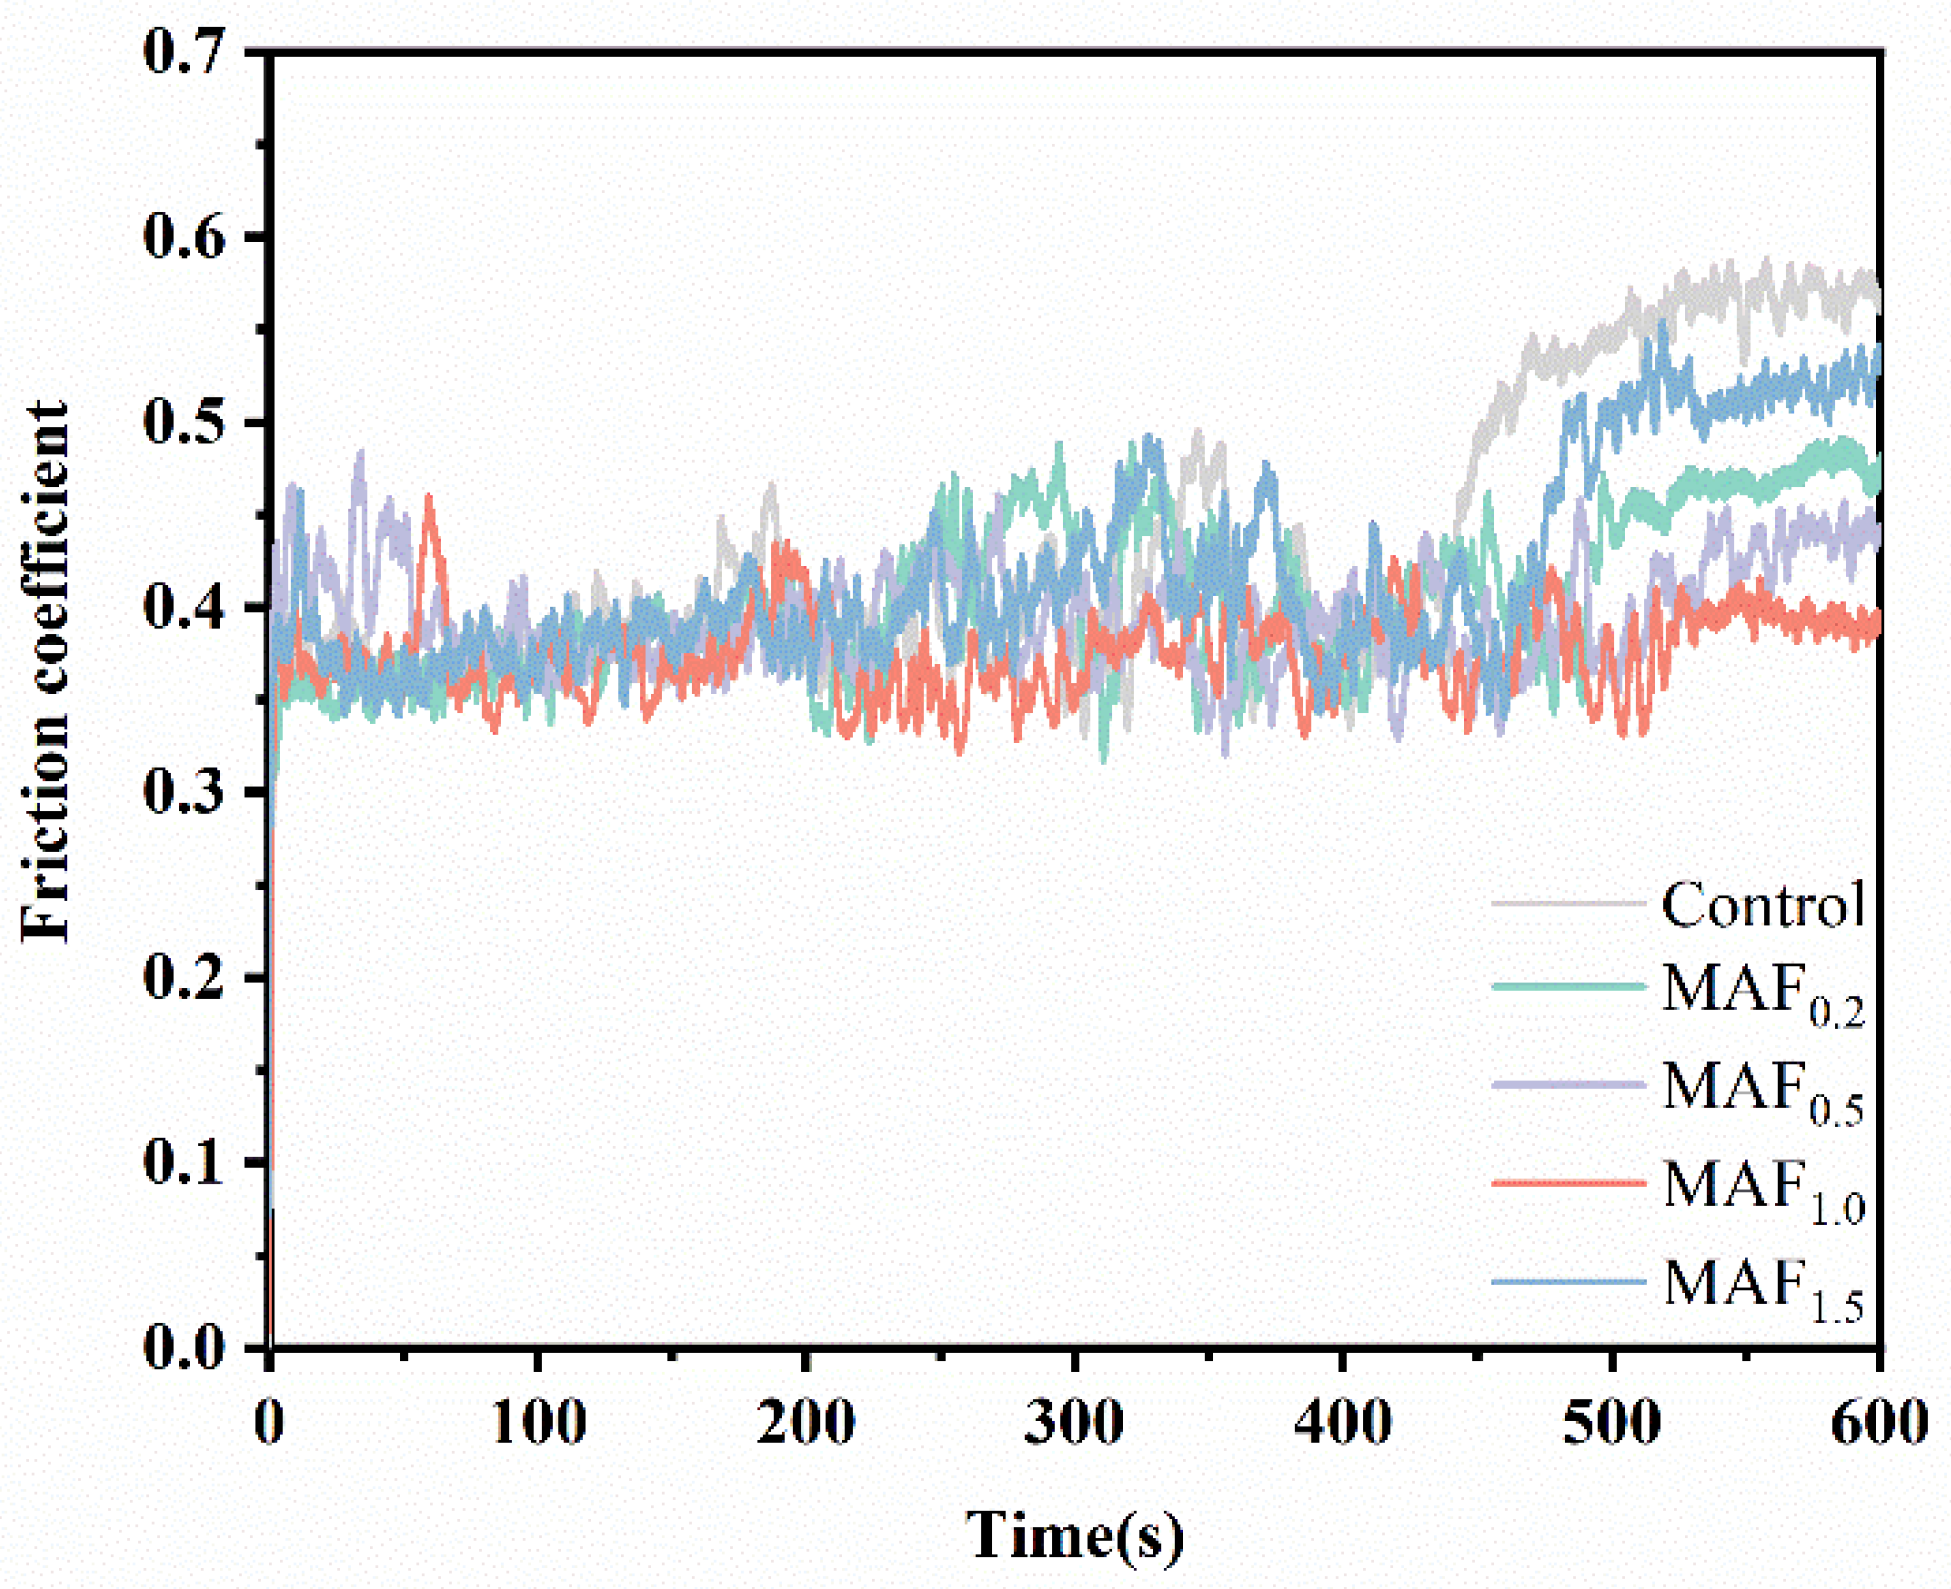
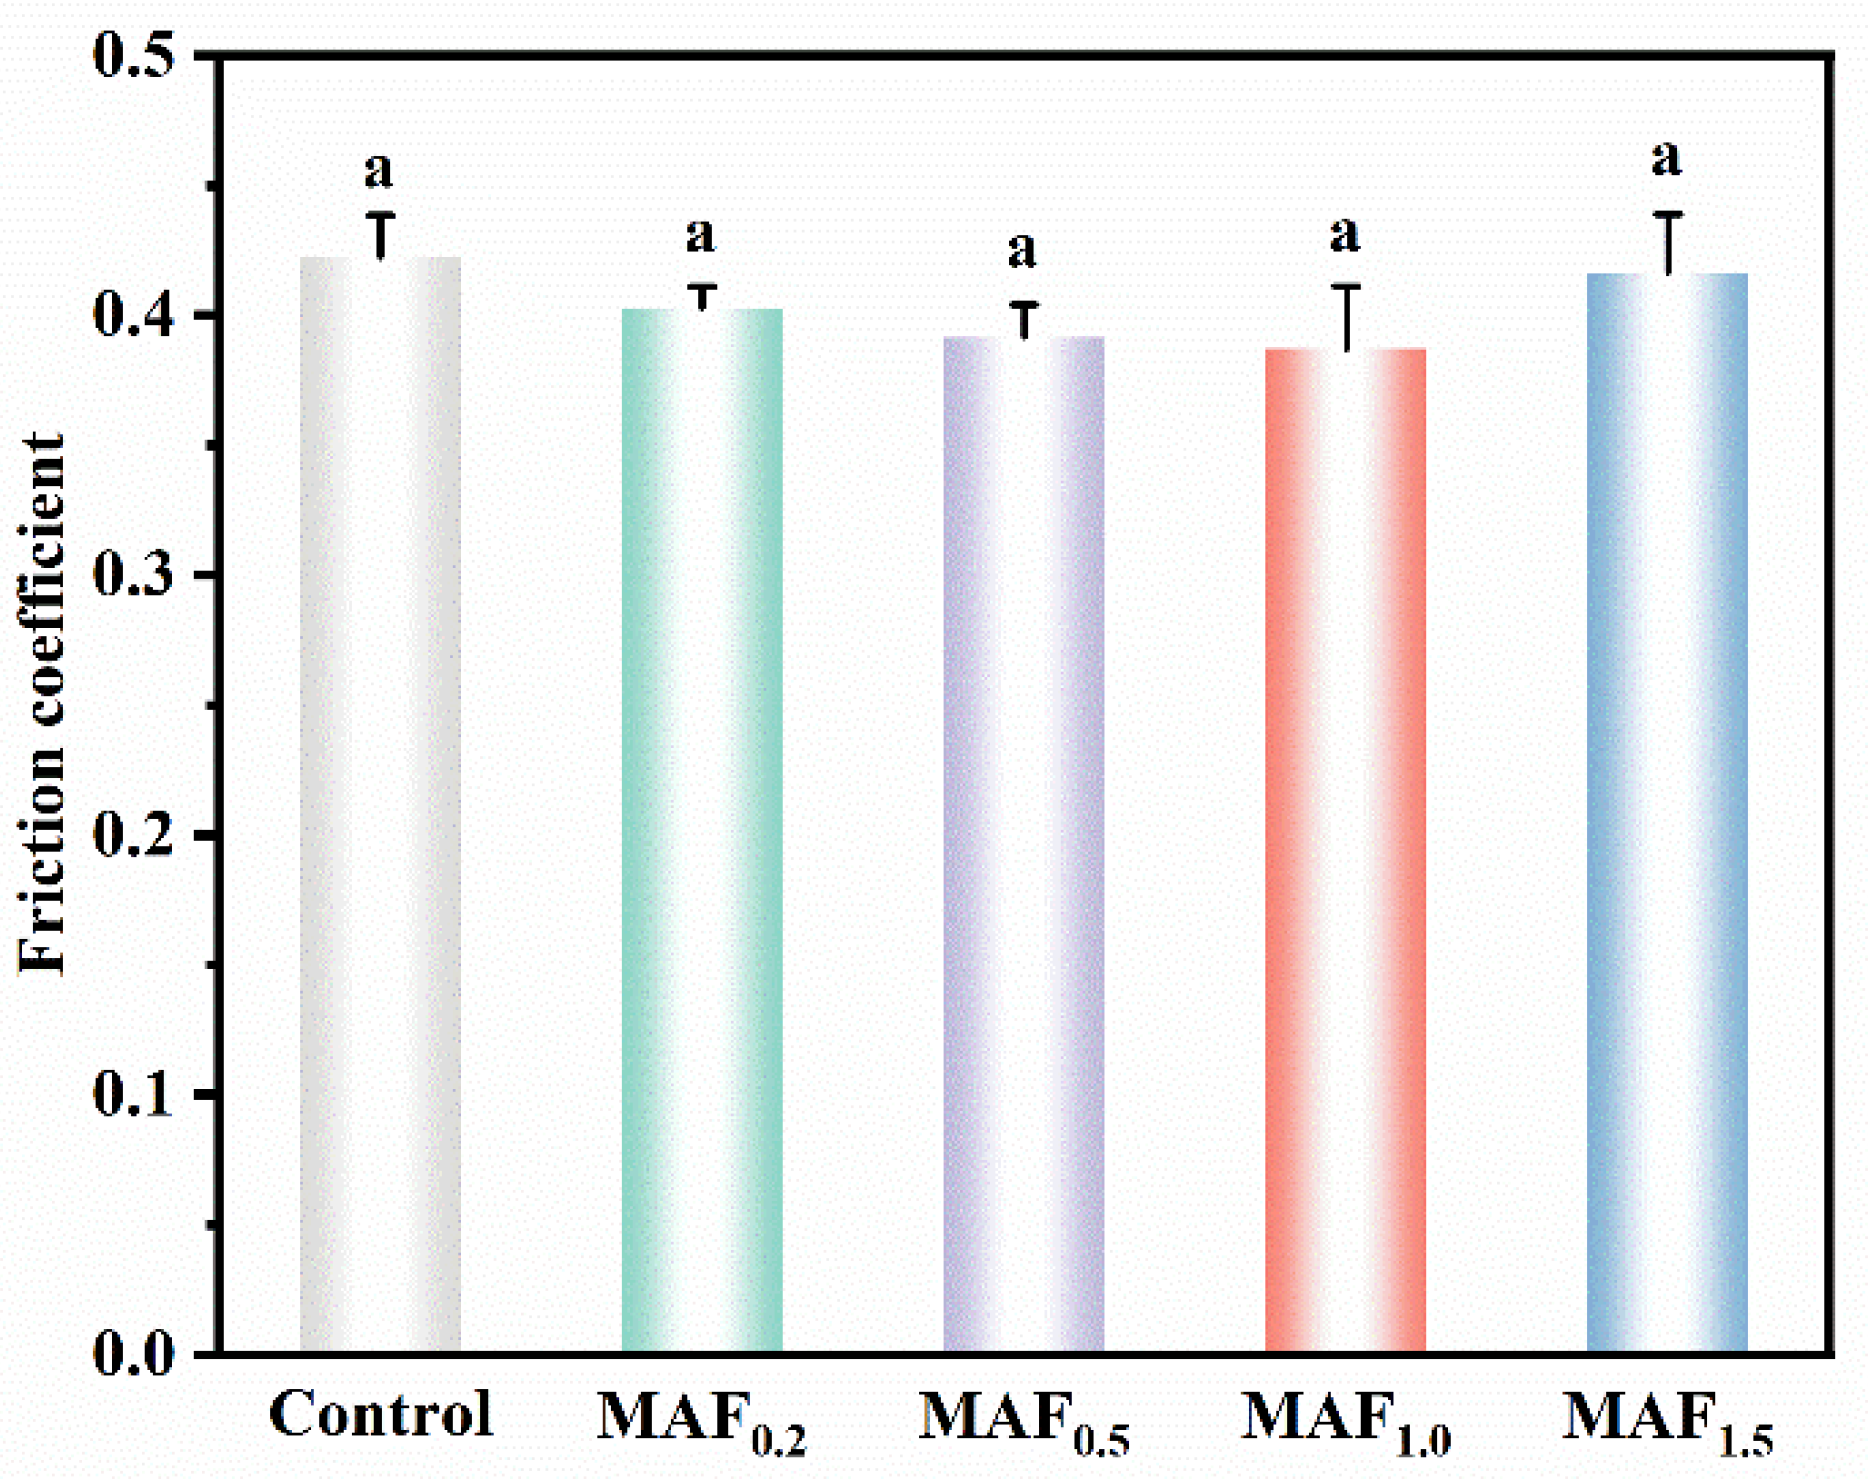
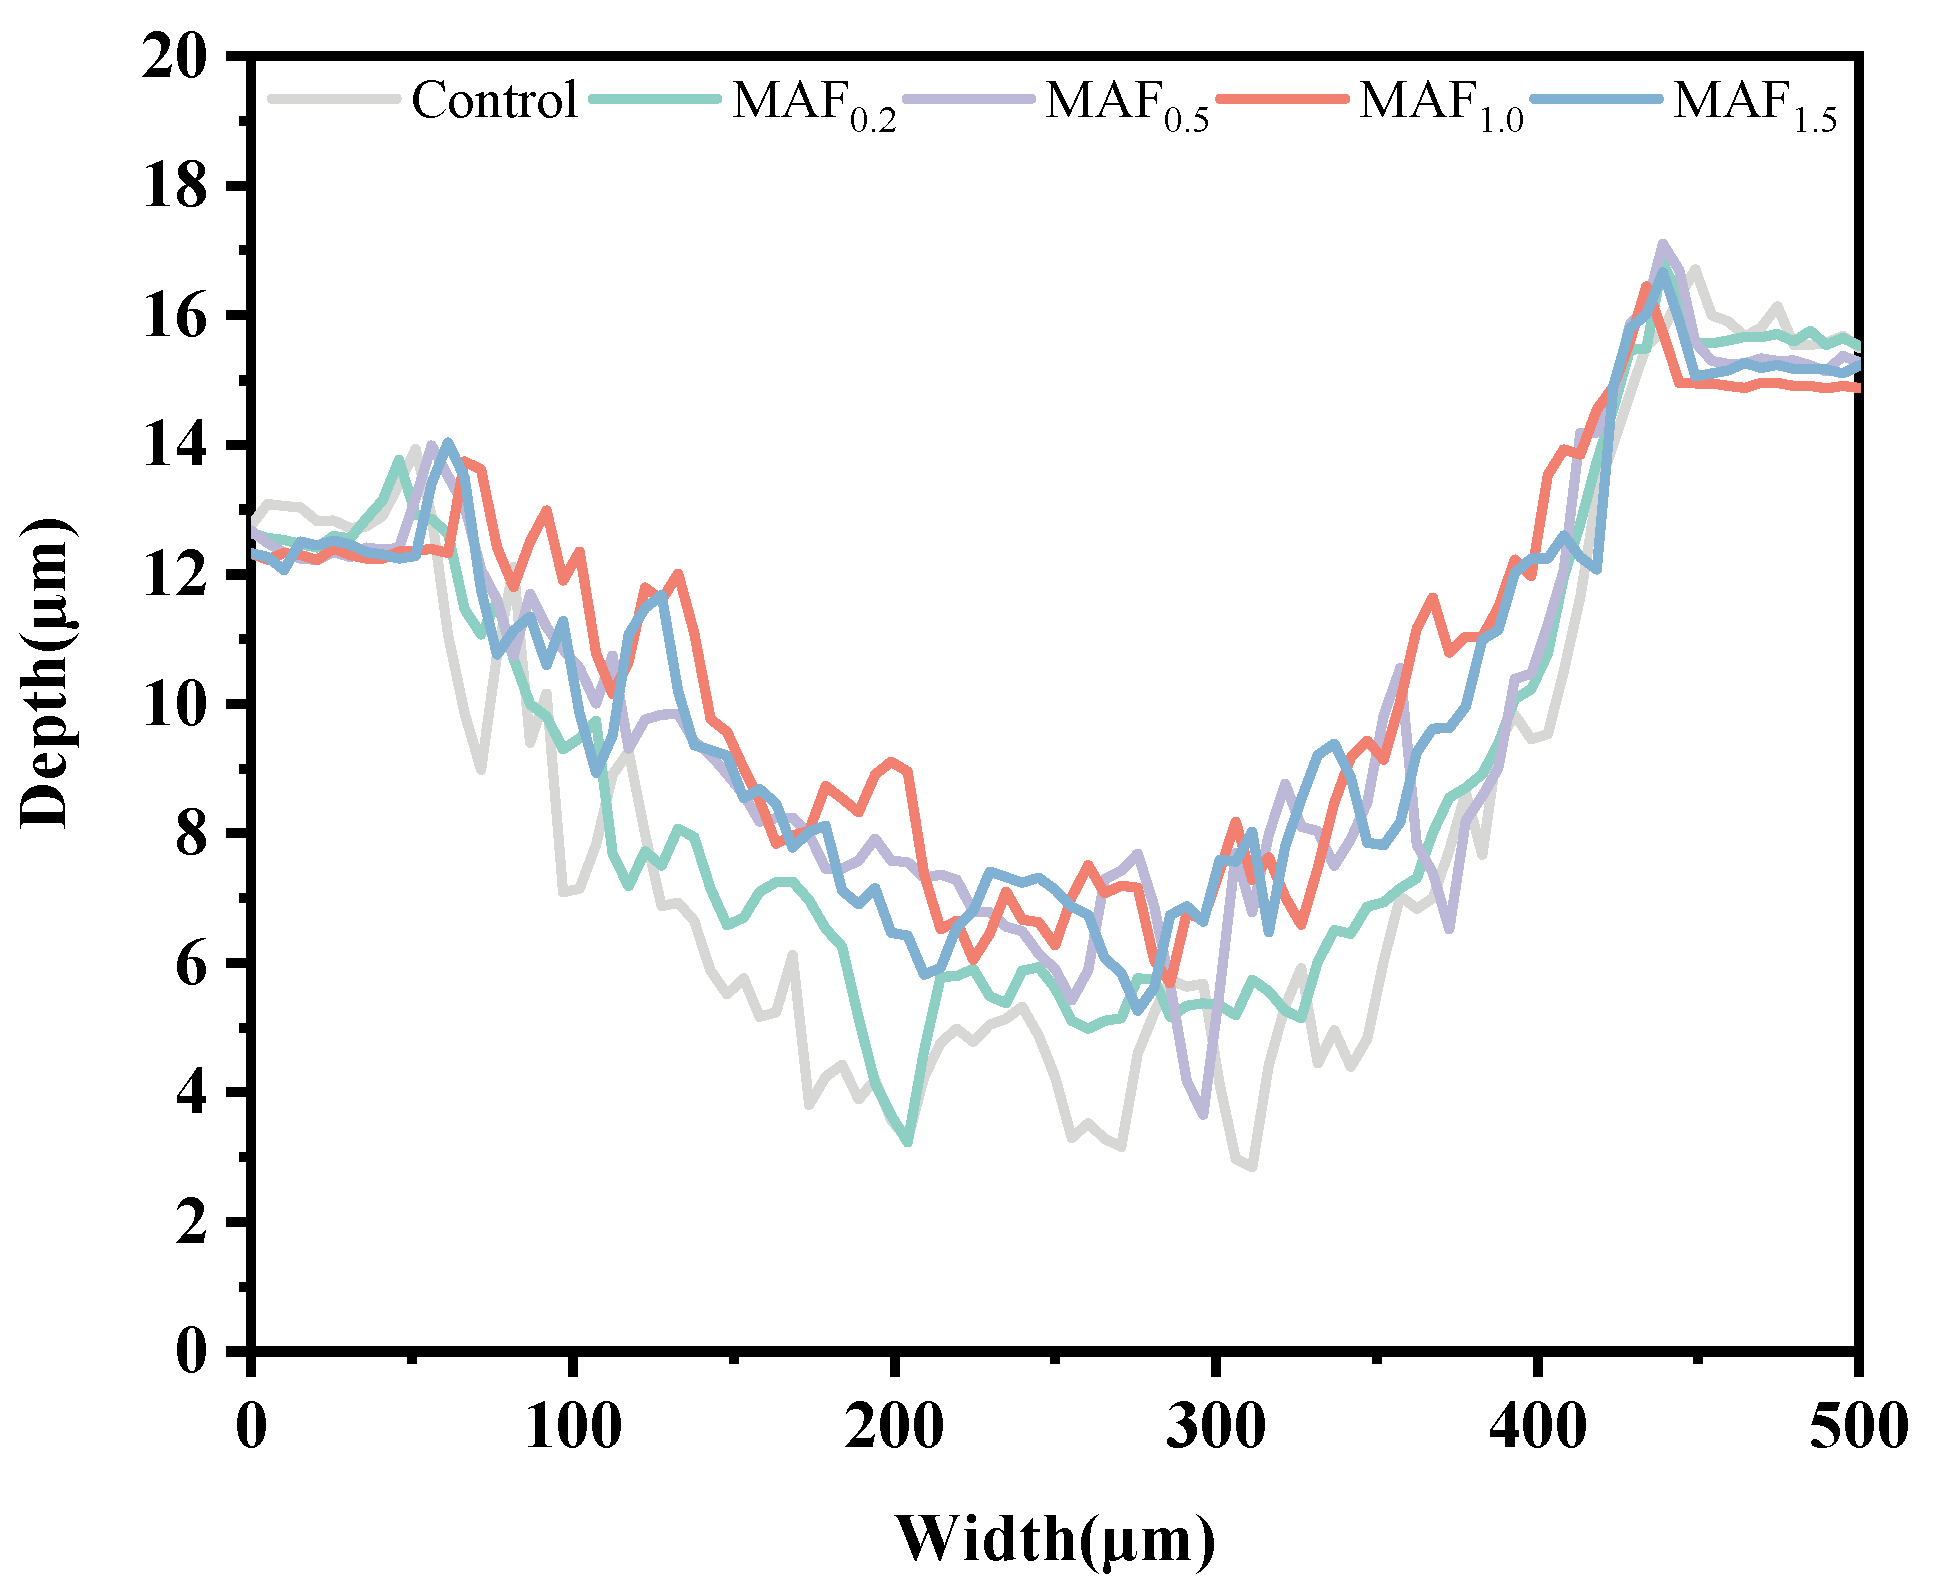
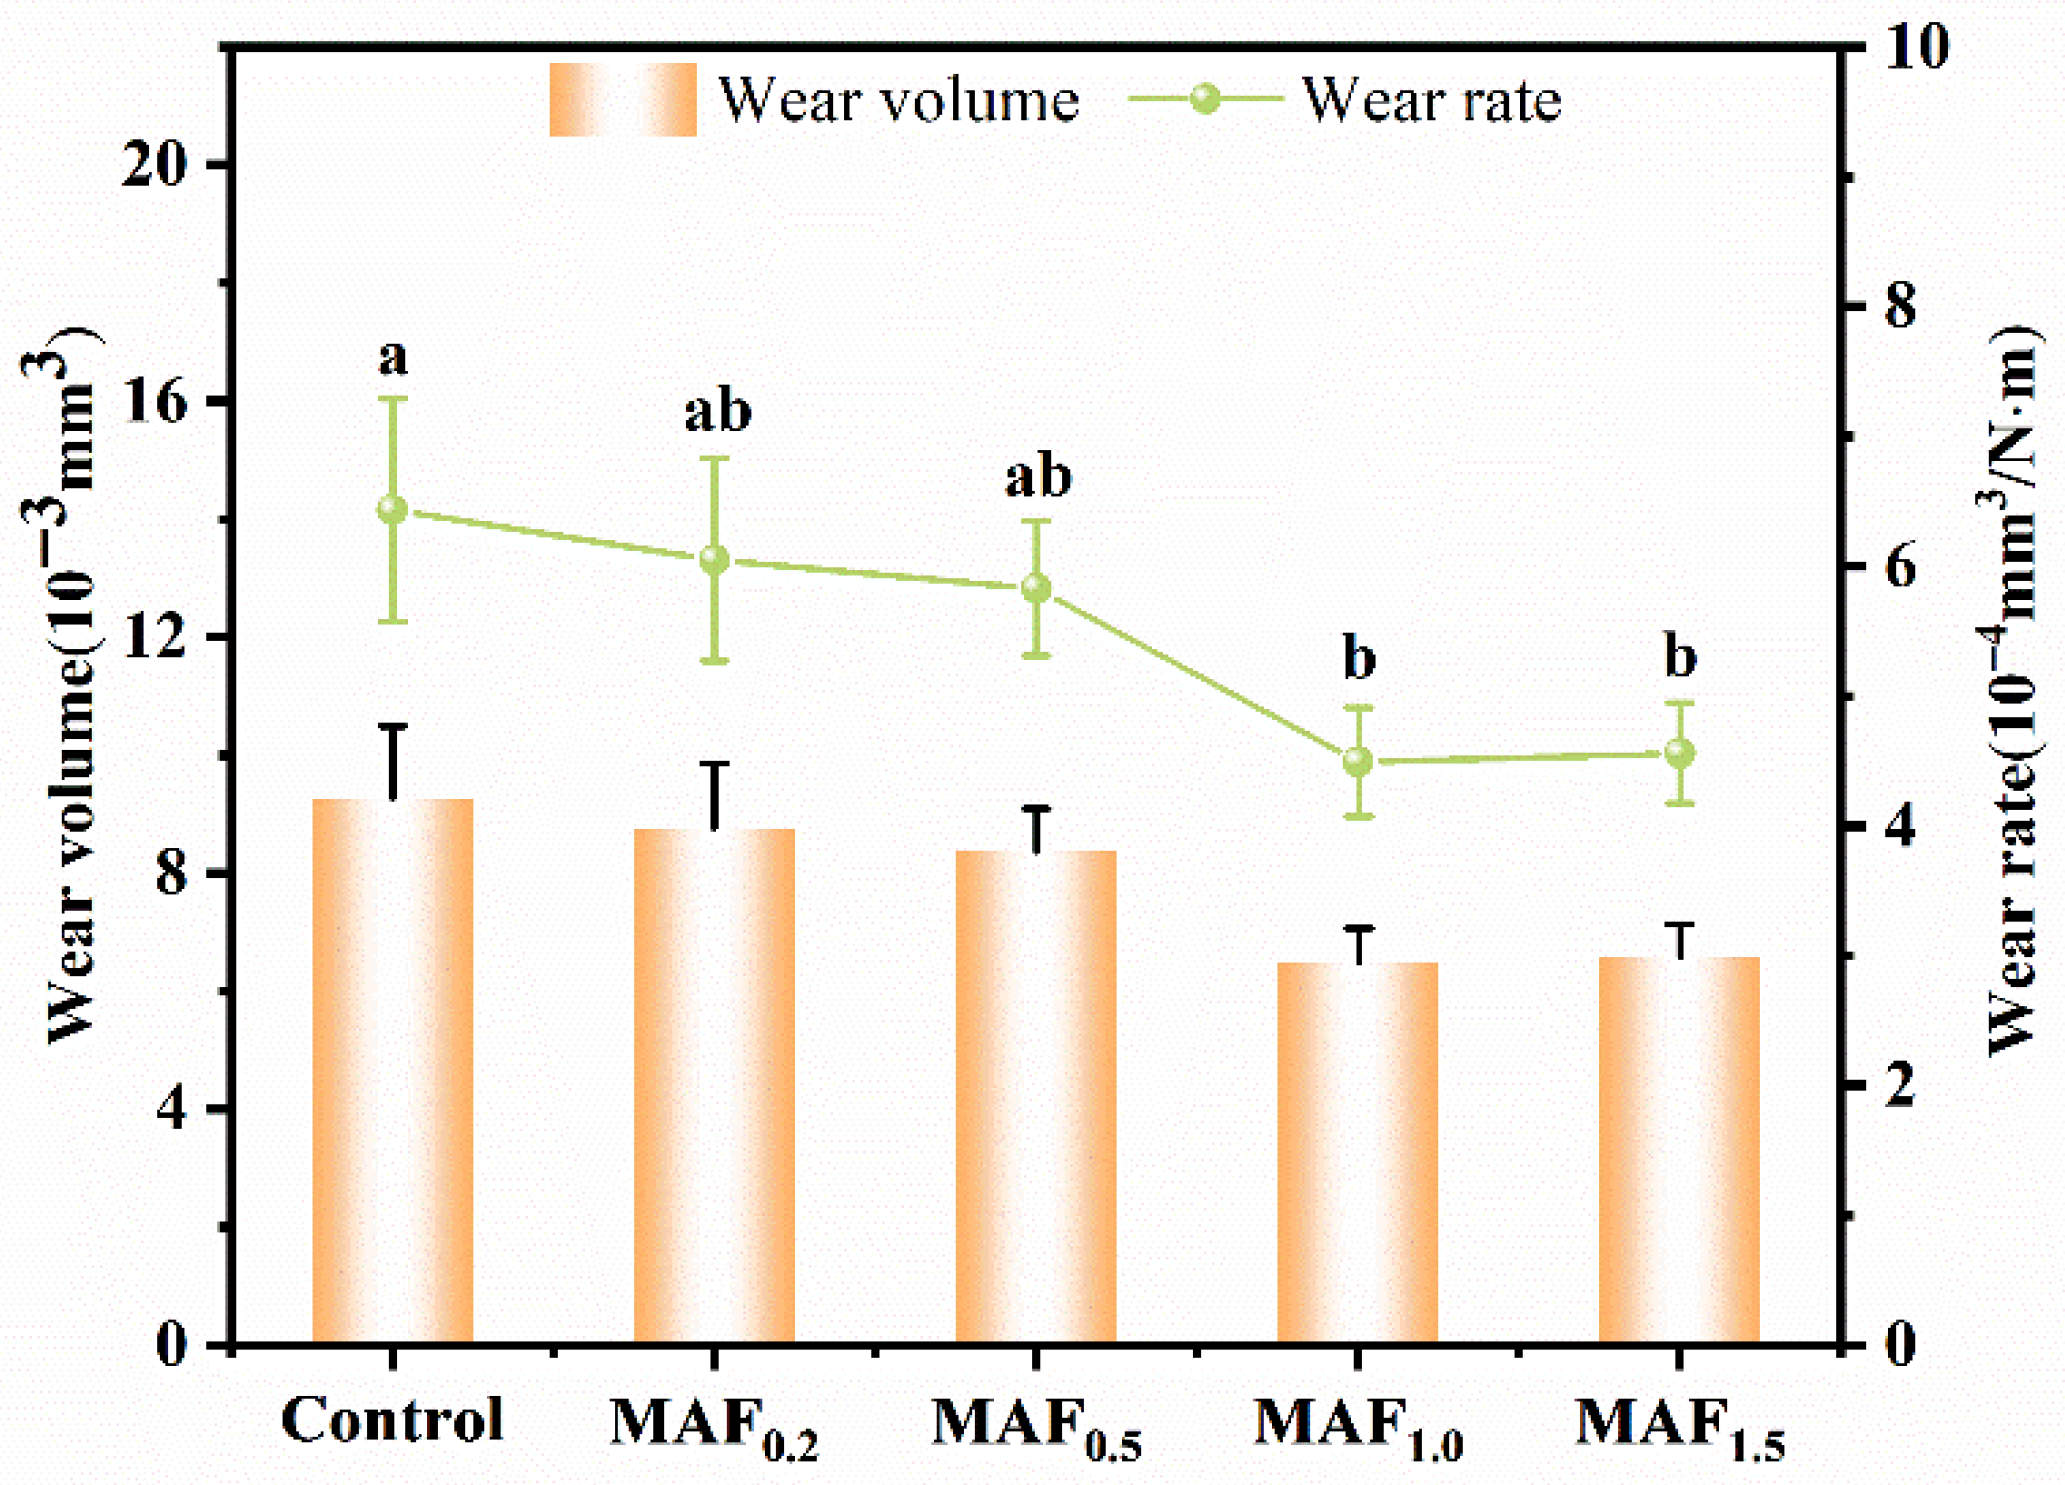
Figure 9 depicts the temporal evolution of friction coefficients. The control group maintained a coefficient of ~0.40 up to 400 s, followed by a sharp increase above 0.55, indicating deteriorating tribological performance. In contrast, MAF-treated samples exhibited lower and more stable friction coefficients. Specifically, MAF1.0 maintained the lowest values (0.35–0.40), while MAF0.2 and MAF0.5 showed slight increases after 400 s. The MAF1.5 group also rose at later stages but remained below the control group. As shown in Figure 10, the average coefficient in the control group was 0.422 ± 0.016, whereas all MAF-treated groups showed reductions. MAF1.0 achieved the lowest value (0.387 ± 0.023), followed by MAF0.5 (0.392 ± 0.012), MAF0.2 (0.403 ± 0.008), and MAF1.5 (0.416 ± 0.022). Figure 11 shows the wear profiles. The control group exhibited the deepest and sharpest grooves, while all MAF treatments reduced both depth and width. MAF1.0 produced the shallowest, U-shaped profile, indicating superior surface protection. Wear volume and rate results (Figure 12) further confirmed these trends. The control group had the highest wear ((9.25 ± 1.24) × 10−3 mm3, (6.43 ± 0.86) × 10−4 mm3/N·m). All MAF-treated groups performed better, with MAF1.0 showing the lowest wear ((6.47 ± 0.60) × 10−3 mm3, (4.49 ± 0.42) × 10−4 mm3/N·m), while MAF1.5 ((6.57 ± 0.56) × 10−3 mm3, (4.56 ± 0.39) × 10−4 mm3/N·m) ranked second, followed by MAF0.5 ((8.36 ± 0.73) × 10−3 mm3, (5.83 ± 0.52) × 10−4 mm3/N·m) and MAF0.2 ((8.74 ± 1.11) × 10−3 mm3, (6.05 ± 0.78) × 10−4 mm3/N·m). Statistical analysis indicated that the reductions in wear volume and wear rate for MAF1.0 and MAF1.5 were significant compared with the control group (p < 0.05).

4. Discussion

This study investigates the enhancement of titanium alloy surface properties for dental applications using the MAF process with varying magnetic needle diameters. Experimental results show that MAF markedly improves corrosion and wear resistance, with the 1.0 mm magnetic needle group exhibiting the best performance. These improvements result from the synergistic effects of grain refinement and residual stress regulation induced by the MAF process.
Grain size is a critical factor influencing the mechanical and physical properties of materials. For nanomaterials with grain sizes below 100 nm, XRD is a widely used and effective method to determine grain size. Grain sizes before and after MAF were calculated from XRD data using the Scherrer formula. Results indicate that MAF markedly refines grain size, confirming its positive effect on the material’s microstructure. Grain refinement improves structural uniformity and enhances corrosion resistance. Wang et al. reported that grain refinement enhances corrosion resistance by increasing grain boundary density, accelerating passivation film nucleation and growth, and improving film semiconductor properties [22]. Electrochemical tests in this study further confirmed this conclusion. MAF-treated samples showed a positive shift in corrosion potential and a decrease in corrosion current density, indicating improved corrosion resistance. Electrochemical impedance spectroscopy revealed a larger Nyquist semicircle for MAF-treated samples, indicating a denser oxide film and higher interfacial impedance. This hinders corrosive ion migration, thereby enhancing material stability in corrosive environments [23,24,25].
According to the Hall–Petch relationship [26], surface hardness is inversely proportional to the square root of grain size. Thus, grain refinement directly increases surface hardness. Micro-Vickers hardness tests showed that surface hardness after MAF treatment increased significantly, with the MAF1.0 group exhibiting the greatest improvement, consistent with grain refinement trends. This observation was also reported by Fujian et al. After MAF treatment, a refined microstructural layer formed on the titanium alloy surface, accompanied by a marked reduction in grain size. This impeded dislocation movement, thereby enhancing surface hardness [27]. Material wear is closely related to surface hardness and is often described by the Holm–Archard equation. According to this relationship [28], wear volume is inversely proportional to surface hardness. Thus, MAF treatment reduces wear volume by increasing surface hardness. Experimental results confirmed this: under identical conditions, the MAF1.0 group showed the lowest wear volume, consistent with Archard equation predictions. This demonstrates that increased surface hardness mitigates wear. Optimizing MAF parameters therefore refines grain size and enhances surface hardness, markedly improving wear resistance.
Besides grain refinement, residual compressive stress induced during MAF is another key factor enhancing overall performance. Previous studies show that compressive stresses induced in the surface layer suppress crack initiation and propagation, thereby extending fatigue life [29,30,31]. In this study, the MAF1.0 group exhibited the highest residual compressive stress, likely due to stronger grinding impact. Other studies indicate that MAF generates a stable microstress field on surfaces, enhancing fatigue performance and structural stability under complex conditions [32]. This stress state helps withstand alternating oral loads and mitigates interface stress concentration under corrosion–fatigue coupling. It delays crack propagation, lowers corrosion rates, and improves implant stability and biocompatibility [33,34,35,36]. Higher residual compressive stress also enhances surface hardness and lowers the friction coefficient, further improving wear resistance [37,38].
MAF treatment markedly enhances corrosion and wear resistance of titanium alloys, a critical improvement for dental implant applications. The oral cavity, a complex and dynamic environment, readily induces frictional corrosion on implant surfaces during long-term use. This may cause adverse effects, including metal ion release, interface damage, and implant micromotion. In severe cases, it compromises implant stability and biocompatibility [39,40,41]. The surface modifications in this study enhance long-term stability and biocompatibility, reducing clinical complication risks. Specifically, improved corrosion resistance reduces metal ion release, lowers cytotoxicity and immune activation, and mitigates local inflammation by stabilizing passivation films. This ultimately improves biocompatibility and long-term implant safety [42]. Furthermore, improving wear resistance is crucial. It strengthens implant mechanical stability, reduces friction-induced damage in body fluids, and lowers risks of early loosening or failure [43]. This synergistic enhancement is expected to improve implant long-term stability and service life, while optimizing clinical outcomes and patient satisfaction.
This study demonstrates that MAF markedly enhances the surface integrity, microhardness, residual compressive stress, and corrosion resistance of the Ti-6Al-4V alloy. Nevertheless, several limitations should be acknowledged. The sample size was limited, and certain analyses (e.g., grain size and electrochemical measurements) were performed on a single specimen, lacking statistical validation. All experiments were conducted under static in vitro conditions that do not fully replicate the complex, dynamic oral environment. Surface roughness was mainly characterized qualitatively using SEM without quantitative assessment. This limitation partially restricts a detailed understanding of surface morphology evolution but does not compromise the overall conclusions. Unlike conventional roughening techniques, MAF produces smooth surfaces appropriate for abutment and connection interfaces, thereby reducing bacterial adhesion and wear and enhancing long-term stability. The process is relatively environmentally friendly; however, proper abrasive removal and recycling are necessary to avoid titanium residue contamination. Ongoing studies are focusing on the biological performance of MAF-treated Ti-6Al-4V, including its compatibility with gingival fibroblasts and epithelial cells and the adhesion behavior of Streptococcus mutans and Porphyromonas gingivalis, to further optimize its biological response and clinical applicability.

5. Conclusions

This study systematically investigated the influence of magnetic needle MAF processing on the surface properties of titanium alloys for dental applications, focusing on magnetic needle diameters ranging from 0.2 to 1.5 mm. Comprehensive characterization—including Surface morphology, grain refinement, surface hardness, residual stress, electrochemical corrosion resistance, and tribological behavior—led to the following findings.
MAF treatment significantly refined the grain structure and improved the surface morphology, with the smallest grain size and highest surface hardness (376.71 HV, >15% improvement) observed in the 1.0 mm group. Substantial compressive residual stress (−579.1 MPa) was also generated, which retarded fatigue crack propagation and improved structural stability. Electrochemical performance was notably enhanced in simulated oral environments: the 1.0 mm group exhibited a positive shift in self-corrosion potential (−0.5661 V), a reduced corrosion current density (0.0114 μA·cm−2), and an increased polarization resistance (8.97 × 10⁶ Ω·cm2), indicating improved passivation stability. Furthermore, tribological properties were optimized, with the 1.0 mm group achieving a low friction coefficient (0.387) and wear rate (4.49 × 10⁻⁴ mm3/N·m), confirming superior anti-wear performance and surface integrity retention.
In summary, magnetic needle MAF processing enables comprehensive optimization of titanium alloy surfaces by tuning magnetic needle parameters. In particular, a 1.0 mm magnetic needle diameter synergistically enhances both electrochemical stability and mechanical durability, suggesting its potential as an effective surface modification approach for titanium alloys used in dental-related environments.

Supplementary Materials

The following supporting information can be downloaded at: https://www.mdpi.com/article/10.3390/coatings15121364/s1, Table S1. Residual stress measurement linear fitting parameters.

Author Contributions

Conceptualization, Y.S.; Methodology, Y.S.; Software, L.X., H.S., J.H. and Y.S.; Formal analysis, L.X., H.S., J.H. and Y.S.; Investigation, L.X. and Y.S.; Resources, J.H. and Y.S.; Data curation, Y.S.; Writing – original draft, L.X., H.S. and Y.S.; Writing – review & editing, L.X., J.H. and Y.S.; Project administration, Y.S. All authors have read and agreed to the published version of the manuscript.

Funding

This research received no external funding.

Institutional Review Board Statement

Not applicable.

Informed Consent Statement

Not applicable.

Data Availability Statement

Data are contained within the article.

Conflicts of Interest

Authors Hanqi Su, Junjiang Hao were employed by the company Beijing CRS Medical Device Co., Ltd. The remaining authors declare that the research was conducted in the absence of any commercial or financial relationships that could be construed as a potential conflict of interest.

References

  1. Marin, E.; Lanzutti, A. Biomedical Applications of Titanium Alloys: A Comprehensive Review. Materials 2023, 17, 114. [Google Scholar] [CrossRef]
  2. Lin, C.P.; Shyu, Y.T.; Wu, Y.L.; Tsai, M.H.; Chen, H.S.; Wu, A.Y. Effects of Marginal Bone Loss Progression on Stress Distribution in Different Implant-Abutment Connections and Abutment Materials: A 3D Finite Element Analysis Study. Materials 2022, 15, 5866. [Google Scholar] [CrossRef]
  3. Muhl, A.; Szabo, P.; Krafcsik, O.; Aigner, Z.; Kopniczky, J.; Akos, N.; Marada, G.; Turzo, K. Comparison of surface aspects of turned and anodized titanium dental implant, or abutment material for an optimal soft tissue integration. Heliyon 2022, 8, e10263. [Google Scholar] [CrossRef]
  4. Apaza-Bedoya, K.; Tarce, M.; Benfatti, C.A.M.; Henriques, B.; Mathew, M.T.; Teughels, W.; Souza, J.C.M. Synergistic interactions between corrosion and wear at titanium-based dental implant connections: A scoping review. J. Periodontal Res. 2017, 52, 946–954. [Google Scholar] [CrossRef]
  5. Alhamad, M.; Barao, V.A.R.; Sukotjo, C.; Cooper, L.F.; Mathew, M.T. Ti-Ions and/or Particles in Saliva Potentially Aggravate Dental Implant Corrosion. Materials 2021, 14, 5733. [Google Scholar] [CrossRef]
  6. Barros, C.D.d.R.; Rocha, J.C.; Bastos, I.N.; Ponciano Gomes, J.A.d.C. Tribocorrosion Resistance of Dental Implant Alloys—Assessment of cp-Ti, Ti6Al4V, and NiCr in Neutral and Acidified Saliva. J. Bio- Tribo-Corros. 2021, 7, 73. [Google Scholar] [CrossRef]
  7. Hubenova, E.; Mitov, M.; Hubenova, Y. Microbiologically influenced corrosion can cause a dental implant rejection. Electrochim. Acta 2024, 485, 144087. [Google Scholar] [CrossRef]
  8. Mellado-Valero, A.; Munoz, A.I.; Pina, V.G.; Sola-Ruiz, M.F. Electrochemical Behaviour and Galvanic Effects of Titanium Implants Coupled to Metallic Suprastructures in Artificial Saliva. Materials 2018, 11, 171. [Google Scholar] [CrossRef]
  9. Yilmaz, E.Ç.; Sadeler, R. A Literature Review on Chewing Simulation and Wear Mechanisms of Dental Biomaterials. J. Bio- Tribo-Corros. 2021, 7, 91. [Google Scholar] [CrossRef]
  10. Ali, B.; Meddah, H.M.; Merdji, A. Effects of overloading in mastication on the mechanical behaviour of dental implants. Mater. Des. 2013, 47, 210–217. [Google Scholar] [CrossRef]
  11. Raj, D.; Maity, S.R.; Das, B. State-of-the-art review on laser cladding process as an in-situ repair technique. Proc. Inst. Mech. Eng. Part E J. Process Mech. Eng. 2021, 236, 1194–1215. [Google Scholar] [CrossRef]
  12. Dowling, M.; Al-Hamaoy, A.R.; Obeidi, M.A. Laser surface cladding of metal parts. Results Surf. Interfaces 2023, 12, 100142. [Google Scholar] [CrossRef]
  13. Heimann, R.B. The nature of plasma spraying. Coatings 2023, 13, 622. [Google Scholar] [CrossRef]
  14. İzmir, M.; Ercan, B. Anodization of titanium alloys for orthopedic applications. Front. Chem. Sci. Eng. 2018, 13, 28–45. [Google Scholar] [CrossRef]
  15. Ahmad, S.; Tian, Y.; Arora, K. Magnetic abrasive finishing: Innovations and possibilities. J. Manuf. Process. 2025, 134, 299–336. [Google Scholar] [CrossRef]
  16. Houshi, M.N. A comprehensive review on magnetic abrasive finishing process. In Advanced Engineering Forum; Trans Tech Publications: Baech, Switzerland, 2016; pp. 1–20. [Google Scholar]
  17. Maraboina, R.; Pasam, V.K. Enhancing Surface Integrity of Selective Laser Melted Al-Si Alloys through Ultrasonic Assisted Magnetic Abrasive Finishing utilizing SiC Abrasives. Silicon 2023, 16, 1183–1196. [Google Scholar] [CrossRef]
  18. Wei, D.; Chen, Y.Y.; Li, H.; Yang, J.C. Residual stress evolution and tailoring of cold pilgered Ti-3Al-2.5V tube. Int. J. Mech. Sci. 2022, 225, 107366. [Google Scholar] [CrossRef]
  19. Zhou, K.; Chen, Y.; Du, Z.W.; Niu, F.L. Surface integrity of titanium part by ultrasonic magnetic abrasive finishing. Int. J. Adv. Manuf. Technol. 2015, 80, 997–1005. [Google Scholar] [CrossRef]
  20. Lee, J.-H.; Kwak, J.-S. Behavior characteristics of abrasives for improving surface integrity in magnetic pin polishing. J. Mech. Sci. Technol. 2020, 34, 4069–4075. [Google Scholar] [CrossRef]
  21. Noyan, I.C.; Cohen, J.B. Residual Stress: Measurement by Diffraction and Interpretation; Springer: Berlin/Heidelberg, Germany, 2013. [Google Scholar]
  22. Wang, P.-J.; Ma, L.-W.; Cheng, X.-Q.; Li, X.-G. Influence of grain refinement on the corrosion behavior of metallic materials: A review. Int. J. Miner. Metall. Mater. 2021, 28, 1112–1126. [Google Scholar] [CrossRef]
  23. Jos, B.; Babu, C.R.; Shaji, S.; Anila, E.I. Study of the structural, optical, electrical and electrochemical properties of copper oxide thin films synthesized by spray pyrolysis. J. Mater. Sci. Mater. Electron. 2024, 35, 233. [Google Scholar] [CrossRef]
  24. Golgovici, F.; Tudose, A.-E.; Mosinoiu, L.F.; Demetrescu, I. Characterization of NiCrAlY Layers Deposited on 310H Alloy Using the EB-PVD Method After Oxidation in Water at High Temperature and Pressure. Appl. Sci. 2025, 15, 2361. [Google Scholar] [CrossRef]
  25. Liu, X.; Li, Z.; Du, X.; Yang, G.; Shi, H.; Wang, J. Regulation of trace aluminum addition on the corrosion resistance of Cu-12.5Ni-5Sn-xAl alloy. Mater. Today Commun. 2025, 43, 111616. [Google Scholar] [CrossRef]
  26. Liu, Z.; Gao, C.; Liu, X.; Liu, R.; Xiao, Z. Improved surface integrity of Ti6Al4V fabricated by selective electron beam melting using ultrasonic surface rolling processing. J. Mater. Process. Technol. 2021, 297, 117264. [Google Scholar] [CrossRef]
  27. Fujian, M.; Shiyu, L.; Qichao, L.; Yu, L.; Zhihua, S.; Shengfang, Z. Effects of Ultrasonic Assisted Magnetic Abrasive Finishing on Surface Integrity of Titanium Alloy. China Surf. Eng. 2019, 32, 128–136. [Google Scholar]
  28. Liu, B.; Bruni, S.; Lewis, R. Numerical calculation of wear in rolling contact based on the Archard equation: Effect of contact parameters and consideration of uncertainties. Wear 2022, 490–491, 204188. [Google Scholar] [CrossRef]
  29. Qiu, Y.; Peng, Y.; Zuo, Y. Ultrasonic impact surface strengthening treatment and fatigue behaviors of titanium alloy thin-walled open hole components. Eng. Fract. Mech. 2024, 307, 110292. [Google Scholar] [CrossRef]
  30. Zha, X.; Yuan, Z.; Qin, H.; Xi, L.; Guo, Y.; Xu, Z.; Dai, X.; Jiang, F. Investigating the Dynamic Mechanical Properties and Strengthening Mechanisms of Ti-6Al-4V Alloy by Using the Ultrasonic Surface Rolling Process. Materials 2024, 17, 1382. [Google Scholar] [CrossRef]
  31. Ren, Z.; Li, Z.; Zhou, S.; Wang, Y.; Zhang, L.; Zhang, Z. Study on surface properties of Ti-6Al-4V titanium alloy by ultrasonic rolling. Simul. Model. Pract. Theory 2022, 121, 102643. [Google Scholar] [CrossRef]
  32. Wei, D.; Yang, H.; Yang, J.; Xue, J.; Zhang, P.; Li, H. Synchronously tailoring of residual stress and surface quality of high-strength titanium alloy tube using magnetic field-assisted finishing. J. Manuf. Process. 2025, 141, 638–649. [Google Scholar] [CrossRef]
  33. Su, K.; Zhang, J.; Lu, L.; Li, H.; Ji, D. Corrosion-fatigue property of anodic oxidation coated 6082-T6 aluminium alloy: Effect of substrate residual stress and microstructure beneath coating-substrate interface. Int. J. Fatigue 2023, 175, 107803. [Google Scholar] [CrossRef]
  34. Dai, W.; Hao, J.; Li, C.; He, D.; Jia, D.; Zhang, Y.; Tan, Z. Residual stress relaxation and duty cycle on high cycle fatigue life of micro-arc oxidation coated AA7075-T6 alloy. Int. J. Fatigue 2020, 130, 105283. [Google Scholar] [CrossRef]
  35. Chen, W. An Overview of Near-Neutral pH Stress Corrosion Cracking in Pipelines and Mitigation Strategies for Its Initiation and Growth. Corrosion 2016, 72, 962–977. [Google Scholar] [CrossRef]
  36. Zhang, W.; Fang, K.; Hu, Y.; Wang, S.; Wang, X. Effect of machining-induced surface residual stress on initiation of stress corrosion cracking in 316 austenitic stainless steel. Corros. Sci. 2016, 108, 173–184. [Google Scholar] [CrossRef]
  37. Wu, Z.; Zheng, G.; Yan, J.; Cheng, X.; Liu, H.; Yang, X. Effect of TiAlSiN coating residual stress on its sliding wear and cutting wear performance. Int. J. Adv. Manuf. Technol. 2022, 123, 3885–3900. [Google Scholar] [CrossRef]
  38. Lhiabani, A.; Nasri, M.; Shajari, Y.; Seyedraoufi, Z.-S. Effect of compressive residual stress on wear resistance of IGT25+ gas turbine compressor blades made of 1.4923 steel. Modares Mech. Eng. 2022, 22, 167–177. [Google Scholar] [CrossRef]
  39. Sun, Y.; Shukla, A.; Ramachandran Remya, A.; Kanniyappan, H.; Yang, B.; Harlow, R.; Campbell, S.D.; Thalji, G.; Mathew, M. Fretting-corrosion at the Implant–Abutment Interface Simulating Clinically Relevant Conditions. Dent. Mater. 2024, 40, 1823–1831. [Google Scholar] [CrossRef]
  40. Revathi, A.; Borras, A.D.; Munoz, A.I.; Richard, C.; Manivasagam, G. Degradation mechanisms and future challenges of titanium and its alloys for dental implant applications in oral environment. Mater. Sci. Eng. C Mater. Biol. Appl. 2017, 76, 1354–1368. [Google Scholar] [CrossRef]
  41. Corne, P.; De March, P.; Cleymand, F.; Geringer, J. Fretting-corrosion behavior on dental implant connection in human saliva. J. Mech. Behav. Biomed. Mater. 2019, 94, 86–92. [Google Scholar] [CrossRef]
  42. Hu, N.; Xie, L.; Liao, Q.; Gao, A.; Zheng, Y.; Pan, H.; Tong, L.; Yang, D.; Gao, N.; Starink, M.J.; et al. A more defective substrate leads to a less defective passive layer: Enhancing the mechanical strength, corrosion resistance and anti-inflammatory response of the low-modulus Ti-45Nb alloy by grain refinement. Acta Biomater. 2021, 126, 524–536. [Google Scholar] [CrossRef]
  43. Pathote, D.; Jaiswal, D.; Singh, V.; Gautam, R.K.; Behera, C.K. Wear behavior and microhardness studies of tantalum (Ta)-coated 316L stainless steel by DC magnetron sputtering for the orthopedic applications. J. Mater. Sci. 2022, 57, 21039–21056. [Google Scholar] [CrossRef]
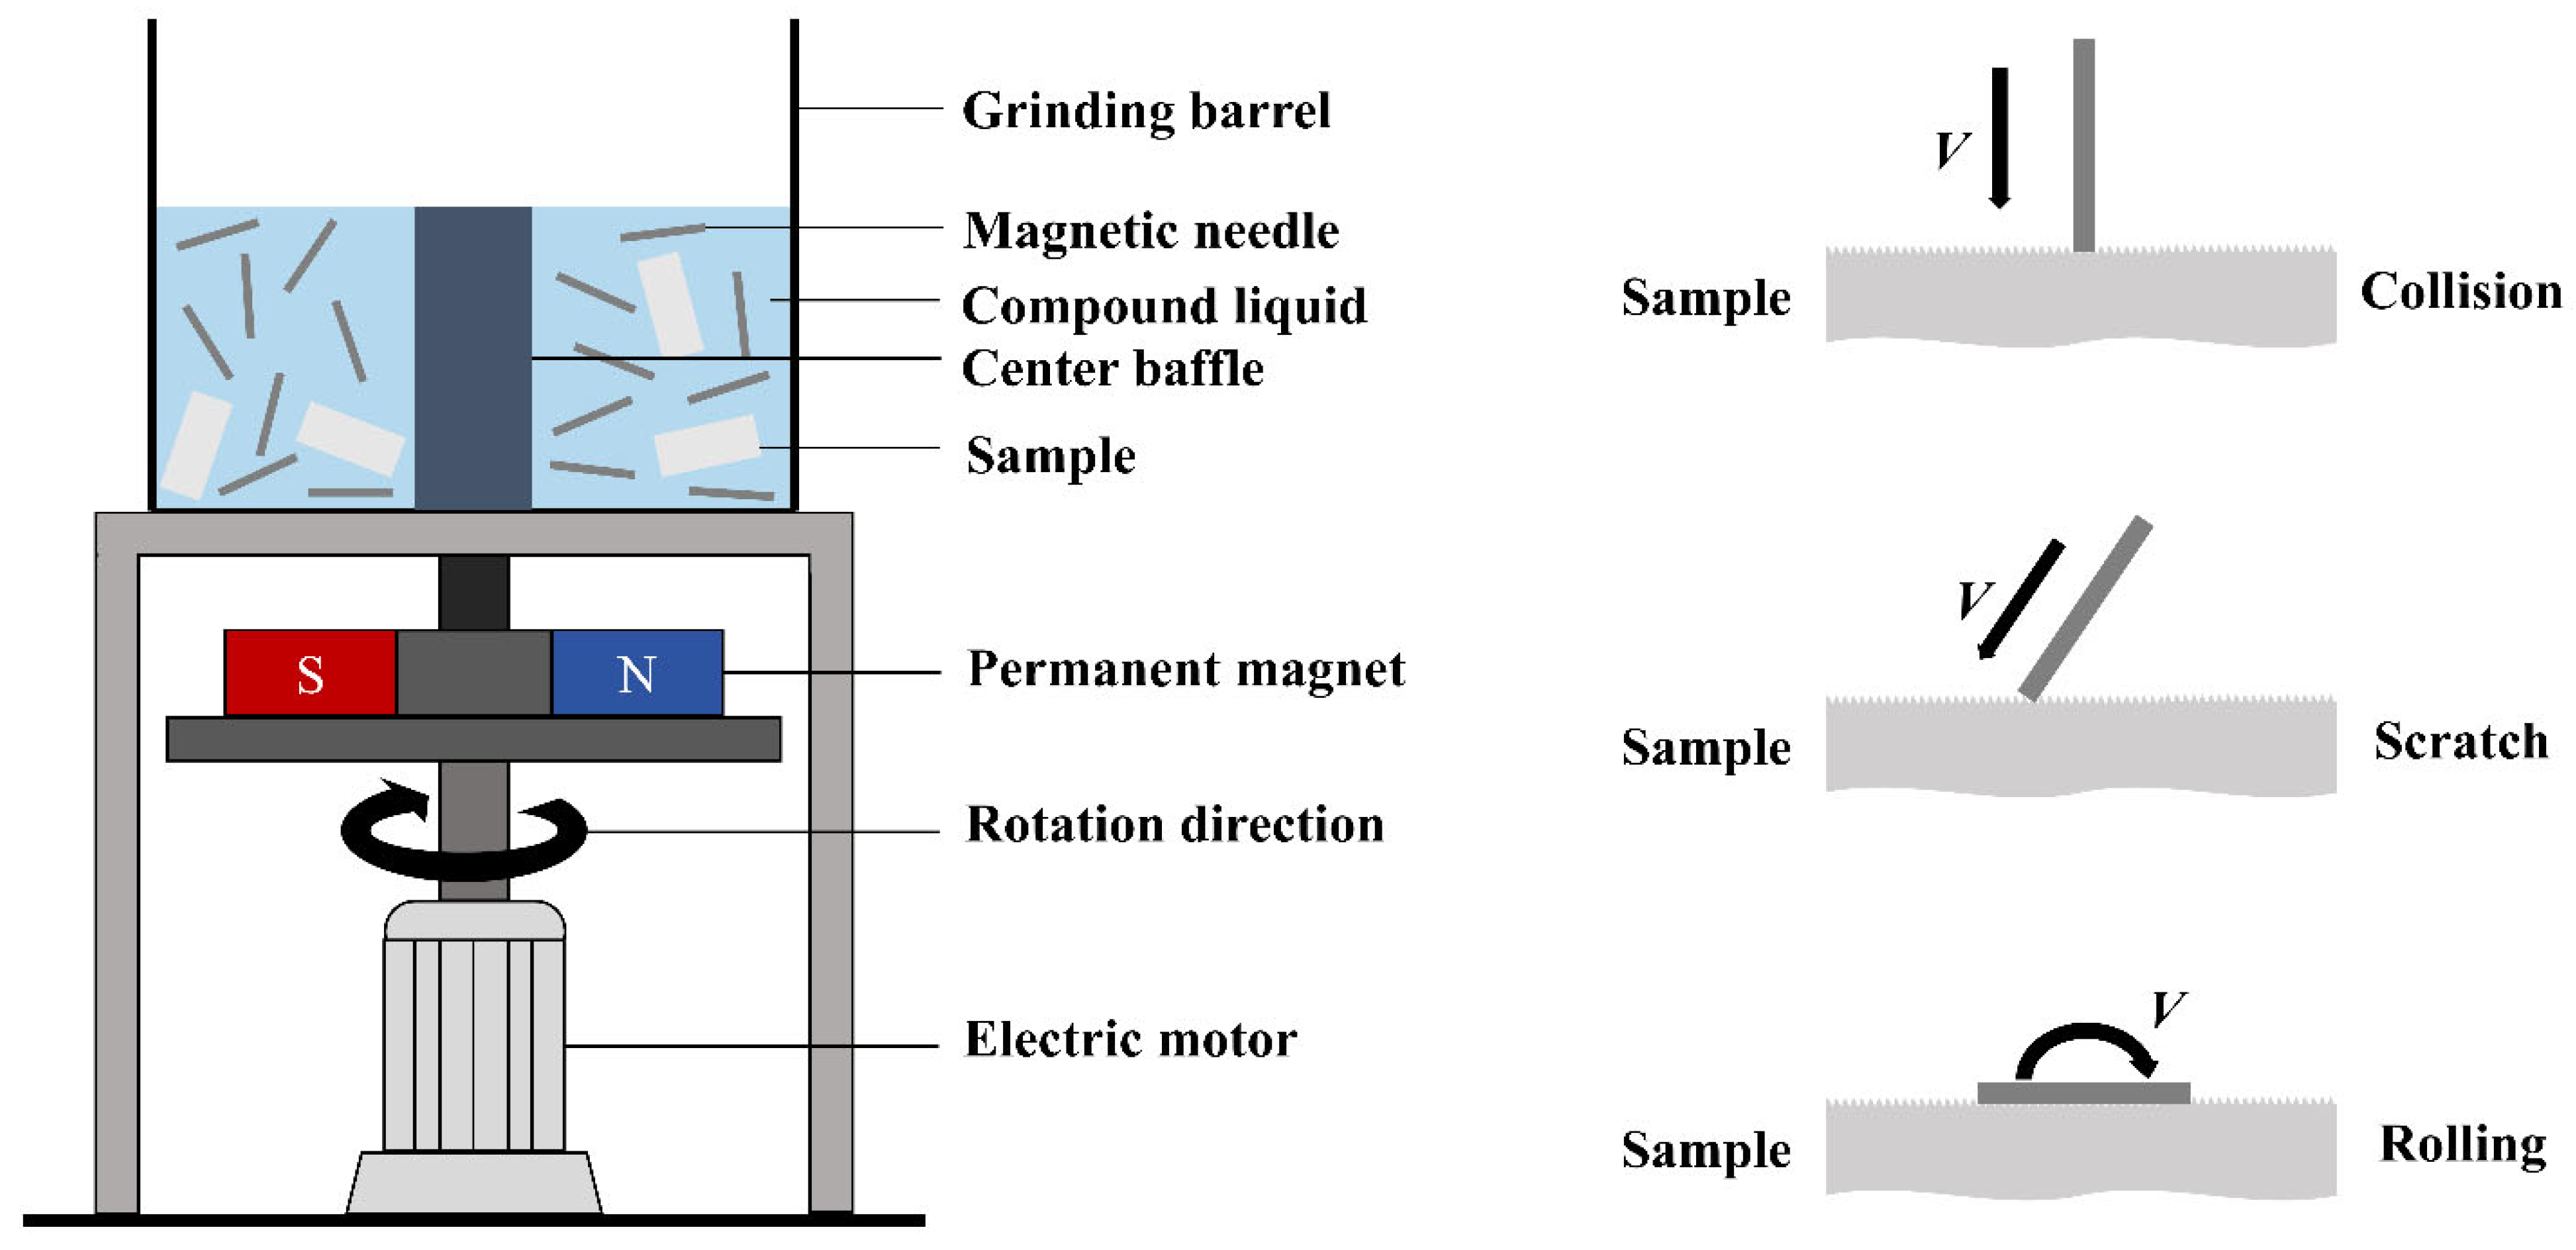
Figure 1. Schematic diagrams of magnetic abrasive finishing. The left panel illustrates the structure of the finishing equipment, while the right panel depicts the working principle of the process.
Coatings 15 01364 g001
Figure 2. Surface morphologies of titanium alloy samples after different MAF treatments observed by SEM. (a) Original magnification 200×, (b) Original magnification 3000×. ((A): Control, (B): MAF0.2, (C): MAF0.5, (D): MAF1.0, (E): MAF1.5).
Coatings 15 01364 g002aCoatings 15 01364 g002b
Figure 3. XRD patterns of the control sample and samples treated with different MAF conditions.
Coatings 15 01364 g003
Figure 4. Surface micro-Vickers hardness of the control and MAF-treated samples. (Different letters indicate significant differences among groups (p < 0.05), while the same letters indicate no significant difference).
Coatings 15 01364 g004
Figure 5. Residual stress results of the control group and MAF-treated samples. (Different letters indicate significant differences among groups (p < 0.05), while the same letters indicate no significant difference).
Coatings 15 01364 g005
Figure 6. Linear fitting results of residual stress for the control and MAF-treated samples.
Coatings 15 01364 g006
Figure 7. Potentiodynamic polarization curves of the Control and MAF-treated samples.
Coatings 15 01364 g007
Figure 8. Nyquist plots of the Control and MAF-treated samples.
Coatings 15 01364 g008
Figure 9. Friction coefficient curves for the Control and MAF-treated samples.
Coatings 15 01364 g009
Figure 10. Average friction coefficients for the Control and MAF-treated samples. (Different letters indicate significant differences among groups (p < 0.05), while the same letters indicate no significant difference).
Coatings 15 01364 g010
Figure 11. Wear scar cross-sectional profiles for the Control and MAF-treated samples.
Coatings 15 01364 g011
Figure 12. Wear volume and wear rate for the Control and MAF-treated samples. (Different letters indicate significant differences among groups (p < 0.05), while the same letters indicate no significant difference).
Coatings 15 01364 g012
Table 1. Experimental design.
GroupMagnetic Needle Diameter/mmGrinding Fluid RatioMagnetic Needle Quality/kgMagnetic Needle Length/mmMagnetic Pole Rotation Speed/HzGrinding Time/min
MAF0.20.21/501.05.04060
MAF0.50.51/501.05.04060
MAF1.01.01/501.05.04060
MAF1.51.51/501.05.04060
Table 3. Characterization parameters of the main diffraction peak of the α-Ti (101) plane.
GroupFWHW (°)Grain Size (nm)
Control0.33818.5
MAF0.20.36217.7
MAF0.50.38517.1
MAF1.00.40015.4
MAF1.50.39016.8
Table 4. Electrochemical corrosion parameters.
GroupEcorr
(V vs. SCE)
Icorr
(μA·cm−2)
βa
(mv/dec)
c|
(mv/dec)
Rp
( Ω ·cm2)
Control−1.06470.28693621271.43 × 105
MAF0.2−0.95530.1349161861.80 × 105
MAF0.5−0.83290.11643452114.88 × 105
MAF1.0−0.56610.01144894548.97 × 106
MAF1.5−0.67980.10692942044.89 × 105
Disclaimer/Publisher’s Note: The statements, opinions and data contained in all publications are solely those of the individual author(s) and contributor(s) and not of MDPI and/or the editor(s). MDPI and/or the editor(s) disclaim responsibility for any injury to people or property resulting from any ideas, methods, instructions or products referred to in the content.