4.2.1. Model Establishment and Significance Analysis
Based on the results obtained from the Box–Behnken experimental design, this study employed Design-Expert software to perform quadratic regression fitting on the surface roughness (Ra) of PLA and ABS, resulting in reliable predictive models. The complete experimental design and response values are provided in
Appendix A Table A1. The analysis of variance (ANOVA) for the regression models of both materials is presented in
Table 6, with detailed ANOVA data available in
Appendix A,
Table A2 and
Table A3.
As shown in
Table 6, the regression models developed for both PLA and ABS were highly significant (
p < 0.0001), while their lack-of-fit terms were not significant (
p > 0.05), indicating that the models are valid and well-fitted. The determination coefficients R
2 and adjusted R
2 for both models were above 0.96, proving that the models explain over 96% of the variation in response values and possess excellent predictive capability. Furthermore, significance analysis of the individual factors and their interactions revealed distinct patterns: For PLA, the linear terms of ironing speed (A) and flow (B), as well as their interaction (AB), exerted extremely significant effects on Ra (
p < 0.0001), whereas the main effect of ironing line spacing (C) and its related interactions were not significant. For ABS, the main effects of all three factors—ironing speed (A), flow (B), and line spacing (C)—as well as the interactions between ironing speed and flow (AB) and between ironing speed and line spacing (AC), were all significant.
It is noteworthy that the significance of factors revealed by the response surface analysis differs from the preliminary understanding derived from single-factor experiments. While single-factor experiments indicated that ironing line spacing (C) affects the surface quality of PLA, the response surface model showed its main effect to be insignificant (p = 0.5371). This suggests that the line spacing effect observed under fixed ironing speed and ironing flow conditions was dominated and masked by the highly significant speed-flow interaction (AB) in the response surface experiments. This finding highlights the limitations of relying solely on single-factor experiments and underscores the necessity of investigating parameter interactions.
The quadratic polynomial regression equations derived from the models are given by Equations (4) and (5).
The above analysis demonstrates that the models established in this study possess high significance and predictive reliability, making them suitable for subsequent interaction analysis and parameter optimization. Furthermore, the significant factors differ between PLA and ABS. The following section will employ response surface plots to provide a focused analysis of the interactions between parameters on surface quality, thereby clarifying the optimal process optimization pathways for each material.
4.2.2. Analysis of Parameter Interactions
Using the Design-Expert software system, we analyzed the effects of interactions among three factors—ironing speed, ironing flow, and ironing line spacing—on the surface roughness Ra of PLA and ABS specimens. The results are shown in
Figure 11.
As shown in
Figure 11a,b, the interaction between ironing speed and flow (AB) exerted a highly significant influence on surface roughness. Specifically, for PLA (
Figure 11a), the response surface exhibited a distinct steep-to-gentle transition. In the low-speed region (A < 25 mm/s), Ra values rose sharply with increasing ironing flow, resulting in a steep response surface. This indicated that the excessive material, delivered by the high flow, cannot be sufficiently spread and leveled by the low ironing speed, leading to material buildup. In the medium-high-speed region (A > 30 mm/s), Ra first slightly decreased and then gradually increased with increasing ironing flow, while its sensitivity to flow changes diminished significantly, resulting in a flatter response surface. This suggested that a moderate increase in material supply at high speeds could fill interlayer gaps and improve surface finish. However, when the flow continued to increase beyond the optimal value, even at high speeds, the excessive material supply eventually surpassed the leveling capacity, leading to slight material over-accumulation and a subsequent rise in Ra. The optimal process window for PLA was located in the combination zone of medium-high speeds and medium-low flows, where the process demonstrated good robustness. For ABS (
Figure 11b), the response surface morphology was similar to that of PLA. In the low-ironing speed range, high ironing flow also caused Ra to increase, while in the high-ironing speed range, the sensitivity of Ra to flow changes was reduced, though excessive ironing flow still degraded surface quality. The optimal process window for ABS was also found in the combination zone of medium-to-high ironing speed and medium-to-low ironing flow.
As observed in
Figure 11c,d, the influence of ironing line spacing (C) differed markedly between PLA and ABS, highlighting a clear material-dependent behavior. For PLA (
Figure 11c), the response surface exhibited pronounced variation along the ironing speed axis while showing extremely gradual changes along the ironing line spacing axis. This aligns with the ANOVA results, where the AC interaction term was not significant (
p = 0.4813). At a fixed ironing line spacing, the Ra value decreased sharply and then increased with rising ironing speed, indicating that both excessively long thermal exposure at low speeds and insufficient thermal exposure at high speeds led to deteriorated surface quality. For ABS (
Figure 11d), the response surface morphology resembled that of PLA but exhibited more pronounced variation along the ironing line spacing axis, displaying a distinct inclination. In the low-to-medium speed range (A < 30 mm/s), Ra increased with larger line spacing, whereas in the medium-to-high speed range, the change in Ra with increasing line spacing became relatively gradual. These results demonstrate that ironing line spacing is a key controllable parameter in the ABS ironing process, and its optimal setting is closely related to ironing speed, requiring coordinated optimization.
As shown in
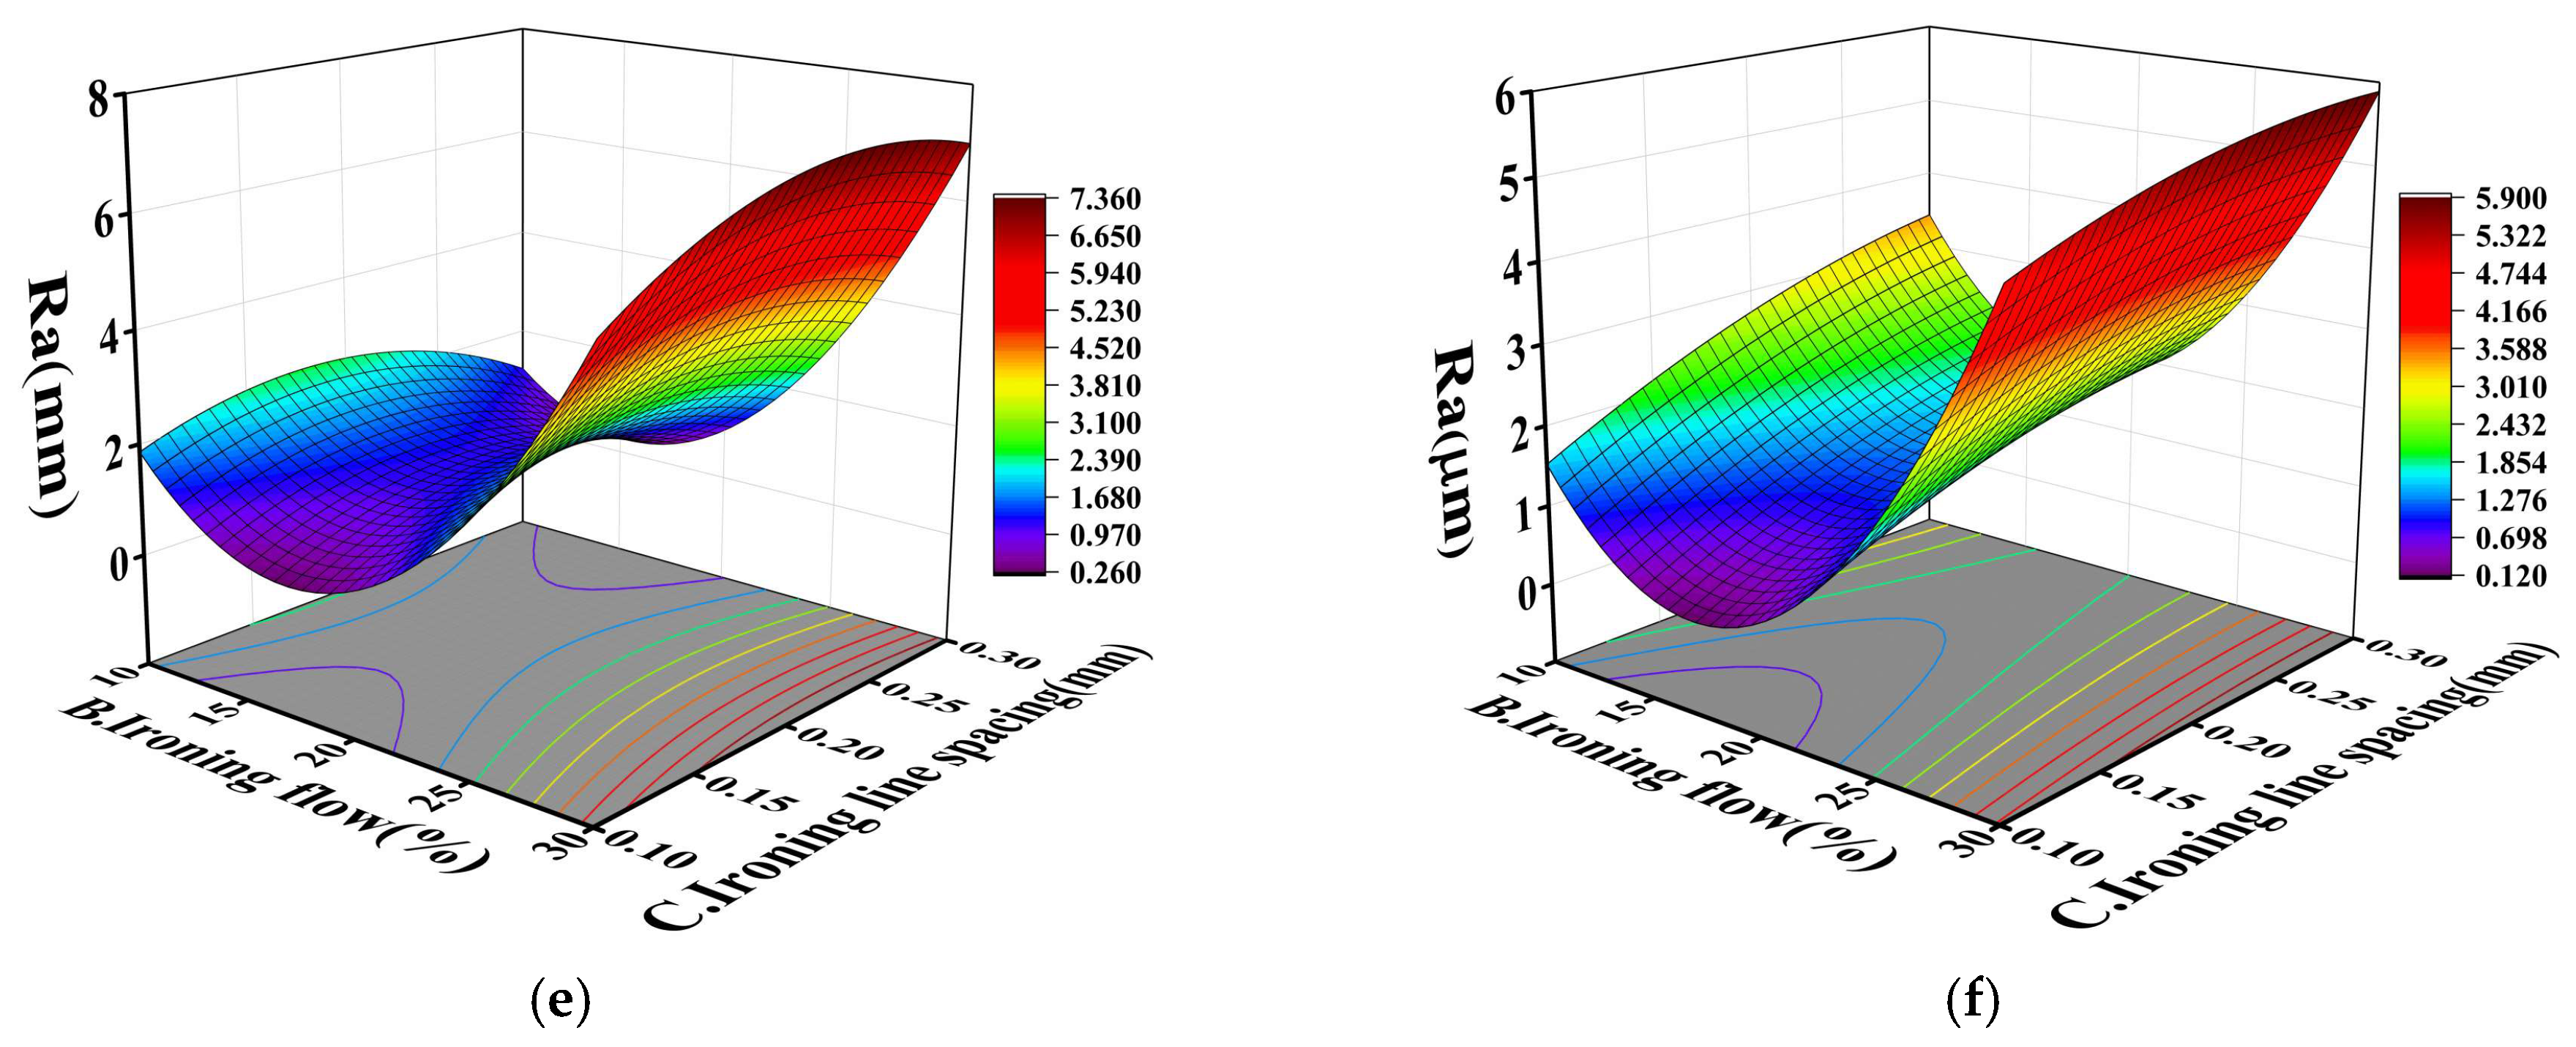
Figure 11e,f, the interaction between ironing flow and ironing line spacing (BC) had a relatively weak effect on both materials. For PLA (
Figure 11e), the main effect of ironing flow (B) was highly significant and dominated the response surface trend, whereas the independent effect of ironing line spacing (C) was relatively weak. This aligned with the ANOVA conclusion that the BC term was not significant (
p = 0.2586). At a fixed ironing line spacing, the Ra value first decreased and then increased significantly with increasing flow. This indicated that insufficient ironing flow failed to provide adequate material to cover the layer lines, leading to degraded surface quality (elevated Ra). Conversely, excessive flow caused material over-accumulation and overflow, resulting in surface irregularities (sharply increased Ra). For ABS (
Figure 11f), the response surface characteristics resembled those of PLA. At a fixed ironing line spacing, Ra first decreased and then increased sharply with increasing ironing flow, with the main effect of ironing flow (B) being highly significant. However, the independent effect of ironing line spacing (C) is weaker compared to PLA, as evidenced by the flatter variation in the response surface along the C-axis direction.
The significant AB and AC interactions for ABS, as shown in
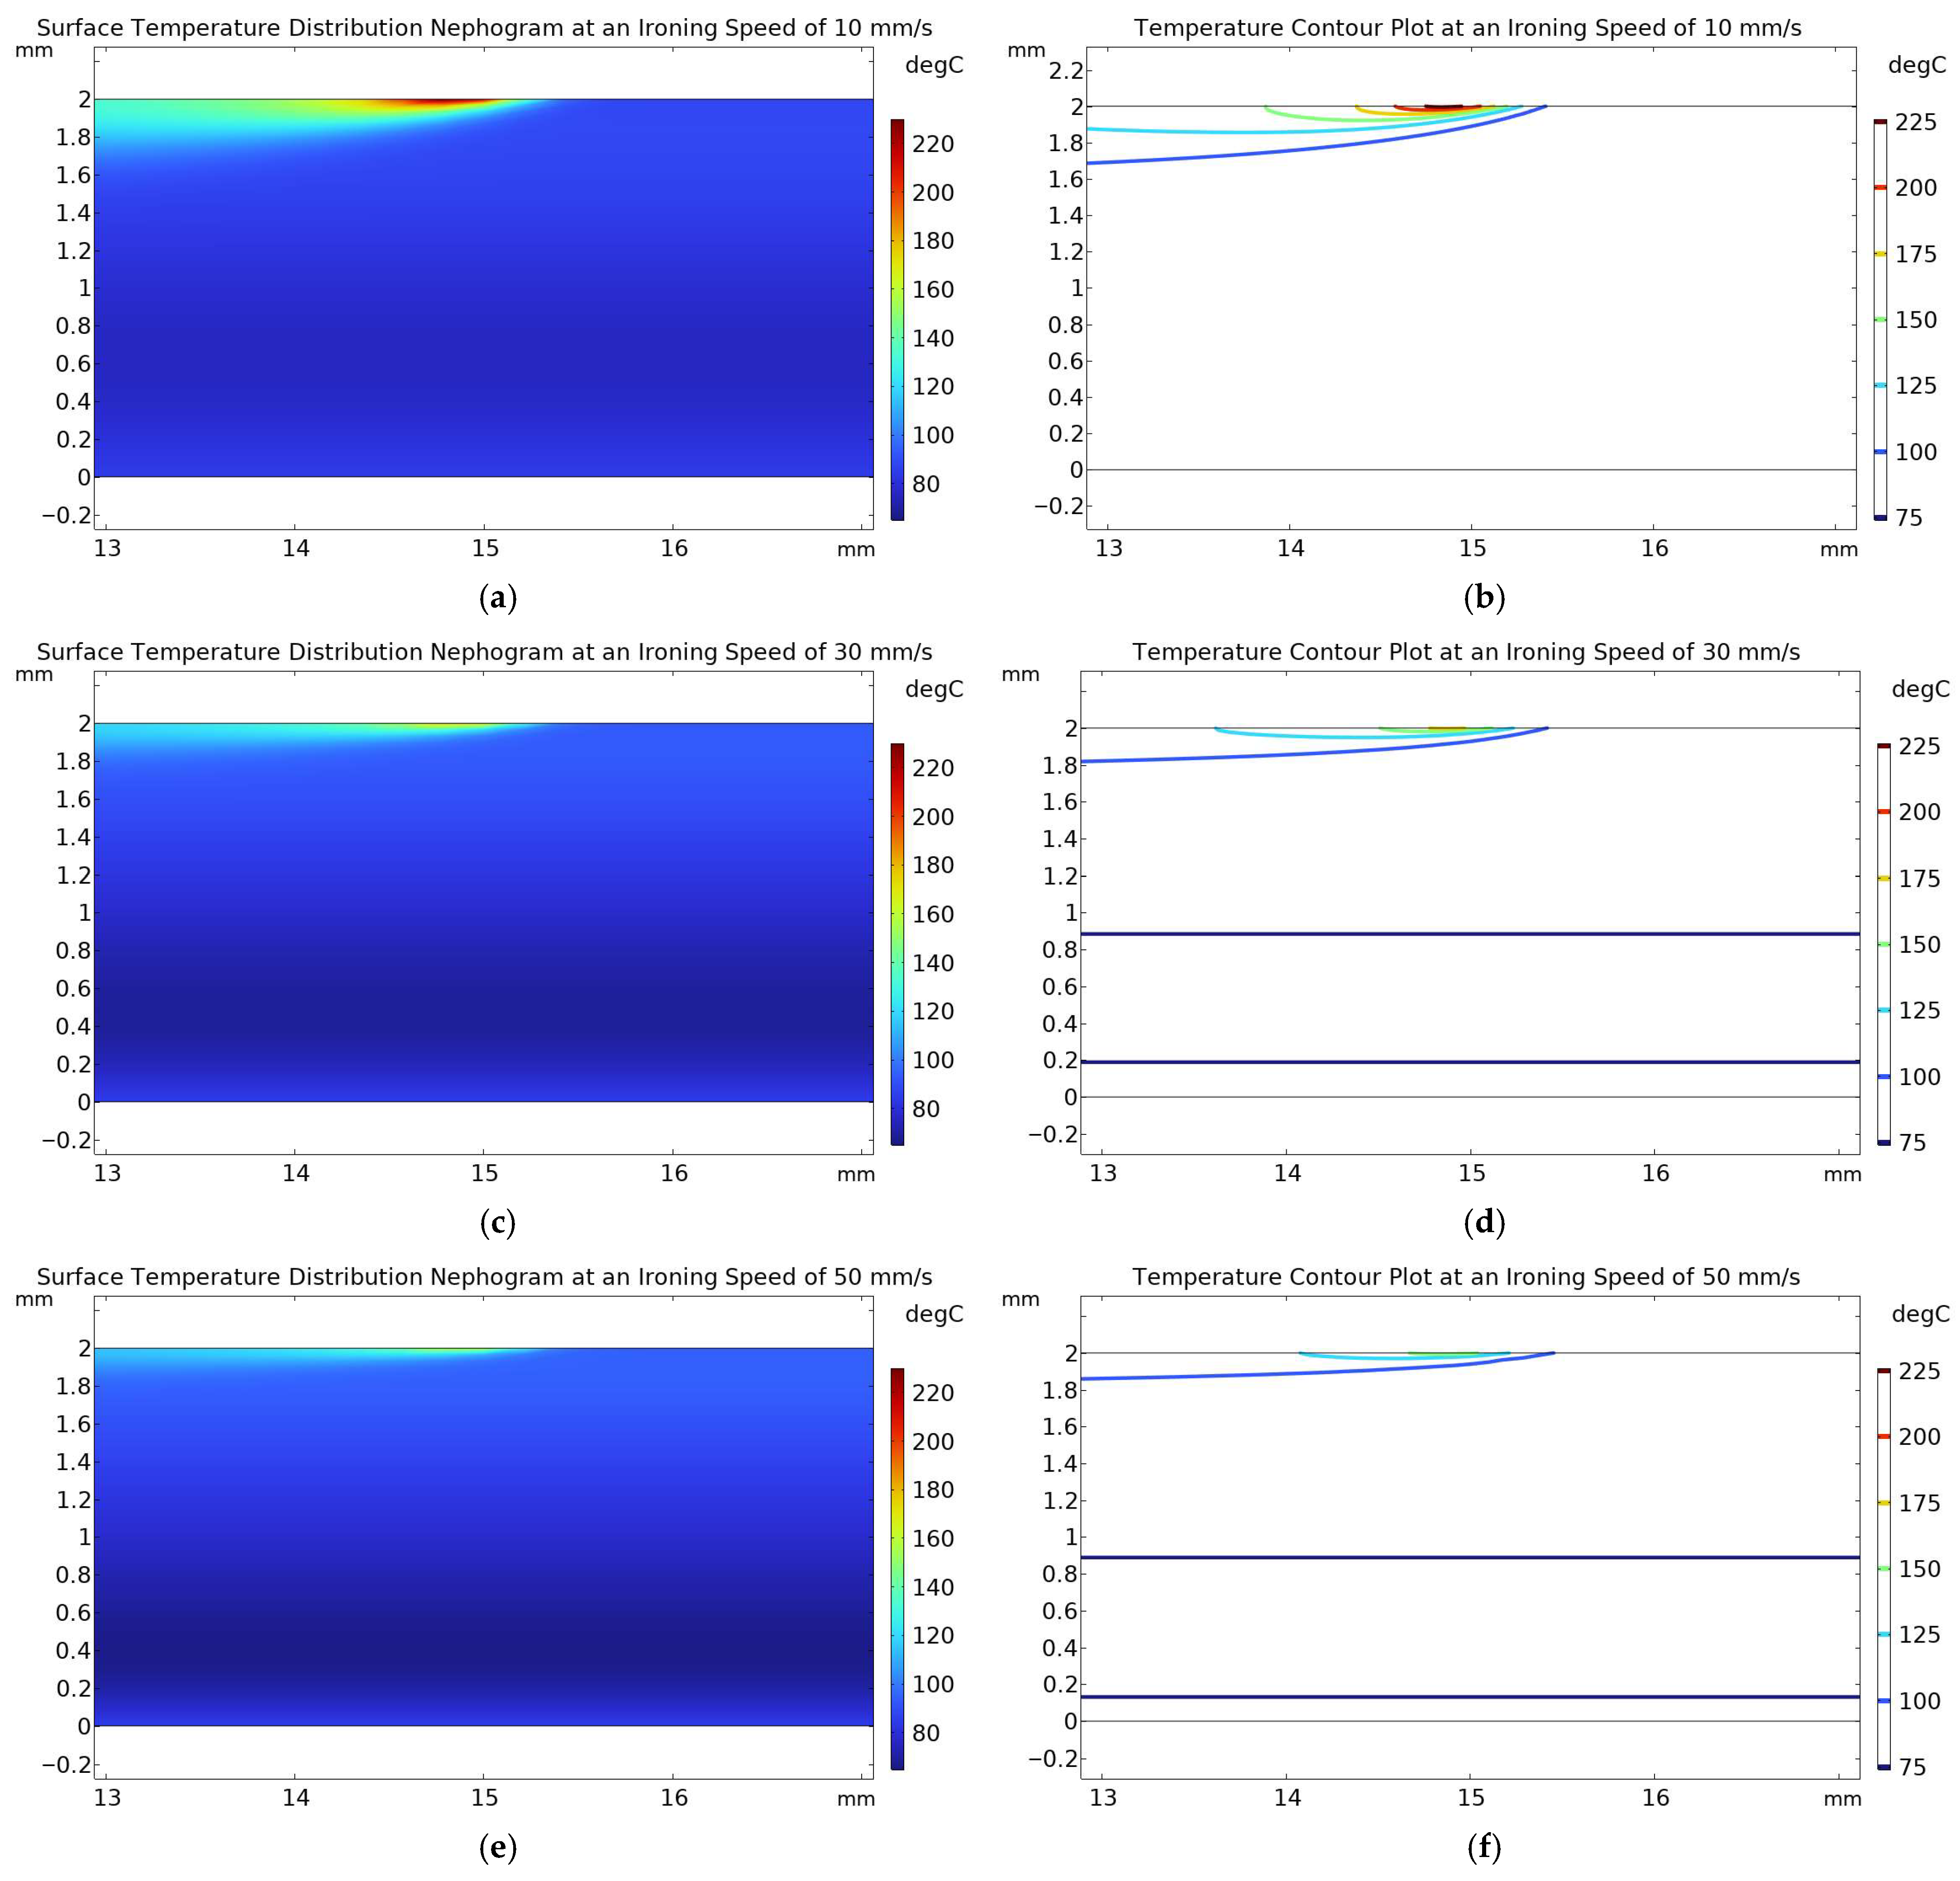
Figure 11b,d, can be interpreted through the fundamental mechanism of thermal input. In this study, this mechanism was qualitatively illustrated by the thermal simulations for PLA in
Figure 4. Although ABS and PLA possess different rheological properties, the ironing speed governed the thermal energy input for both materials during the ironing process. For the AB interaction (
Figure 11b), at a low speed of 10 mm/s, the prolonged thermal exposure (as indicated by the extensive heat-affected zones in
Figure 4a,b) combined with a high flow of 30% allowed excessive material to be extruded, leading to accumulation. However, at a high speed of 50 mm/s, the brief thermal exposure (as indicated by the shallow heat-affected zones in
Figure 4e,f) combined with a low flow of 10% failed to sufficiently soften and spread the material, resulting in insufficient filling. For the AC interaction (
Figure 11d), at a low speed of 10 mm/s, despite sufficient heat input and a larger heat-affected zone, an excessively wide line spacing of 0.3 mm exceeded the material’s flow capacity, preventing effective gap filling and leading to increased surface roughness. However, at a high speed of 50 mm/s, even with a small line spacing of 0.1 mm, insufficient heat input and a shallow heat-affected zone hindered effective material flow and filling. The high melt strength of ABS severely restricted its flow, making it highly sensitive to both interactions influenced by ironing speed.
In summary, PLA and ABS exhibit fundamentally different sensitivities to ironing process parameters, a distinction rooted in their divergent rheological properties. The surface quality of PLA is primarily governed by the interaction between ironing speed and flow, indicating that its low-viscosity melt is highly sensitive to material supply. In contrast, ABS is significantly influenced by ironing speed, flow, and line spacing simultaneously, exhibiting more complex parameter coupling effects closely related to its high melt strength-induced flow resistance. Regarding optimization strategies, a combination of medium-to-high ironing speed and medium-to-low ironing flow represents a clearly effective approach for PLA. For ABS, however, the stronger parameter coupling narrows the optimal process window, necessitating strict coordination of ironing speed, flow, and line spacing during optimization.
4.2.3. Parameter Optimization and Validation
Based on the established response surface models, this study employed the optimization module of Design-Expert software to perform parameter optimization of ironing speed (A), flow (B), and line spacing (C), aiming to minimize surface roughness (Ra). To balance surface quality and production efficiency, the optimization range for speed (A) was constrained between 20 and 40 mm/s, while the other factors remained continuously adjustable within their experimental ranges. Subsequently, based on the predicted optimal parameter combinations, three replicate experiments were conducted for each PLA and ABS specimen, with the average values serving as the final measured results. The predictive accuracy of the models was evaluated by comparing the predicted and measured values. The optimal process parameter combinations for both materials, along with a comparison between the predicted and experimentally validated Ra values, are presented in
Table 7.
The comparison of the predicted results with the experimental results indicated that the two material models exhibit differences in predictive accuracy. For ABS, the validation experiments yielded a measured Ra of 1.014 μm, representing a relative error of 11.24% against the predicted value (0.900 μm). This error margin fell within the reasonable expectation range of the model’s predictive coefficient of determination (Pred R
2 = 0.7910), confirming the high predictive accuracy and reliability of the ABS regression model. For PLA, the larger relative error (32.04%) underscored a limitation of the model. While it excelled at identifying the correct optimization direction and the significant parameter interactions, its accuracy in predicting the absolute Ra value for a new parameter set was limited. This divergence between the high R
2 (0.9859) and the lower Pred R
2 (0.8257) quantified this limitation, indicating that the model explained the experimental design variance well but had reduced predictive power for new data. The superior actual measured Ra value (0.852 μm) suggested the presence of unmodeled interactions between the process conditions and the material behavior. Therefore, the primary utility of the PLA model lies in its proven ability to reliably guide parameter optimization towards the global optimum, rather than in providing precise point forecasts. The plots of predicted versus actual values for PLA and ABS models provided in the
Supplementary Materials (Figure S2) further corroborate the above explanation.
