Article

Surface Damage and Fouling Resistance Degradation Mechanisms of Silicone Antifouling Coatings Under Sediment Erosion

1
College of River and Ocean Engineering, Chongqing Jiaotong University, Chongqing 400074, China
2
National Engineering and Technology Research Center for Inland Waterway Remediation, Chongqing Jiaotong University, Chongqing 400074, China
3
Jiangsu Donghua Testing Technology Co., Taizhou 225300, China
4
Tianjin Water Transport Engineering Research Institute, Ministry of Transport, Tianjin 300456, China
*
Author to whom correspondence should be addressed.
Coatings 2025, 15(11), 1353; https://doi.org/10.3390/coatings15111353
Submission received: 23 October 2025 / Revised: 10 November 2025 / Accepted: 19 November 2025 / Published: 20 November 2025
(This article belongs to the Section Corrosion, Wear and Erosion)

Abstract

Sediment-laden seawater (1.4 kg/m3) under controlled flow velocities (1.5 m/s and 3.0 m/s) was employed to evaluate degradation mechanisms in static anti-fouling coatings. Exposure to 1.5 m/s sediment-laden flow induced a 49% reduction in adhesion strength, a 4.9–5.2° decrease in water contact angle, and an elevation in surface roughness from 0.32 μm to 0.88 μm after 30 days. Concurrently, antibacterial rate and anti-algal rate declined by 11.9% and 14.6%, respectively. In comparison, pure seawater scouring at equivalent velocity reduced adhesion by 30% and contact angle by merely 1.1°. Low-flow (1.5 m/s) conditions accelerated abrasive wear, driving severe surface roughening, whereas higher flow velocity (3.0 m/s) disrupted sustained particle–coating contact through turbulence generation, attenuating roughness progression. Crucially, low-flow conditions intensified abrasive wear and promoted severe surface roughening, whereas higher flow velocities generated sufficient turbulence to disrupt sustained particle–coating contact, thereby slowing the progression of roughness. These findings reveal a previously unrecognized, flow-velocity-dependent erosion mechanism: lower velocities encourage particle deposition and progressive surface damage, while higher velocities unexpectedly produce a protective, turbulence-mediated buffering effect that mitigates surface roughening. These findings establish a theoretical foundation for developing advanced anti-fouling coatings with enhanced resistance to sediment erosion.

1. Introduction

Coastal shallow-water port areas in China commonly experience severe biofouling problems [1,2,3]. The attachment of marine organisms to the surfaces of port monitoring equipment frequently causes device failure, shortens service life, and compromises measurement accuracy [4]. The direct application of anti-fouling coatings to sensor surfaces has been recognized as an economical and effective solution. However, ports and docks located near river estuaries are exposed to seawater carrying substantial sediment loads, and the effects of such sediment-laden flow on static anti-fouling coatings remain poorly understood [5].
Anti-biofouling technologies can be broadly categorized into two groups based on energy consumption: active intervention (energy-consuming) and passive defense (non-energy-consuming) approaches [6]. Active intervention methods primarily include mechanical removal [7], ultrasonic treatment [8], UV irradiation [9], and electrolysis [10]. Passive defense technologies are mainly represented by anti-fouling coating systems, which include antifoulant-release coatings [11,12,13,14], low-surface-energy coatings [15,16,17,18,19], and bioinspired or smart antifouling coatings [20,21,22,23,24,25,26,27,28]. Since the 1970s, Milne and Hails developed highly effective organotin self-polishing (TBT-SPC) antifouling coatings, which were once widely used but have since been strictly banned due to their severe environmental impacts [29]. In contrast, low-surface-energy antifouling coatings rely solely on their smooth surface characteristics and low elastic modulus to prevent biofouling, eliminating the need for toxic biocide release. Among these coatings, fluoropolymer-based low-surface-energy systems exhibit extremely low surface energy and high structural rigidity but suffer from poor film compactness [16,17]. Silicone–fluoropolymer hybrid coatings demonstrate superior antifouling performance by effectively reducing surface energy but remain ineffective against bacterial biofilm and diatom adhesion [18]. At present, silicone-based coatings have attracted considerable attention because of their exceptionally low surface tension and excellent antifouling capability. Characterized by low elastic modulus and surface energy, these coatings provide stable performance and represent one of the most widely applied antifouling solutions [14,15]. Current development and application of silicone-based coating technologies primarily target high-flow dynamic conditions typical of ship hulls, yet they exhibit suboptimal antifouling performance under the low-flow static conditions characteristic of port monitoring equipment [29]. Despite their advantages, silicone-based low-surface-energy antifouling coatings face several limitations: (1) complex application processes that hinder field repairs when mechanically damaged; (2) inadequate static antifouling performance, particularly in preventing microbial (bacterial and diatom) adhesion; and (3) markedly reduced efficacy once biofilm formation occurs [30,31,32]. These shortcomings highlight the urgent need to investigate coating performance under sediment erosion in static port environments.
The estuarine port environment—characterized by strong tidal currents and high sediment loads resulting from the combined influence of river discharge and oceanic tides—exposes antifouling coatings on port infrastructure sensors to persistent erosion by sediment-laden seawater. Accordingly, evaluating the degradation of these coatings under sediment erosion is of critical importance. To address this issue, we conducted a comprehensive experimental program that incorporated multiple test configurations and parameter combinations to simulate practical service conditions. This study systematically examines the performance evolution of static antifouling coatings under sediment erosion and establishes a theoretical foundation for developing more effective antifouling solutions for coastal port infrastructure.

2. Sample Preparation and Analytical Methods

2.1. Pretreatment of Titanium Alloy Test Specimens

To ensure long-term performance of antifouling coatings on TC4 titanium alloy substrates, surface pretreatment was carried out as follows: organic contaminants were removed using neutral solvents, followed by high-pressure freshwater rinsing. Abrasive blasting was performed according to international standard ISO 8501-1:1988 (Sa2.5–3 grade), employing stainless steel grit (0.2–1.2 mm particle size) at 0.65 ± 0.05 MPa. After blasting, residual particles and dust were removed using sequential brushing with clean bristle tools and vacuum suction (Figure 1). This pretreatment process significantly enhances the environmental resistance of both the titanium alloy substrate and the antifouling coating system, thereby substantially prolonging the service life of the protective coating.

2.2. Preparation of Antifouling Coatings on Titanium Alloy Substrates

The experimental material selected was an organosilicon antifouling coating featuring multiple synergistic anti-fouling mechanisms. This coating system was formulated from modified polydimethylsiloxane (PDMS) and silica (SiO2) nanoparticles, which collectively impart low elastic modulus and low surface energy properties. By integrating hydrogel silicone technology with highly effective antifouling biocides, the coating forms a robust multifunctional barrier that effectively suppresses marine organism attachment, thereby significantly extending fouling-free periods.
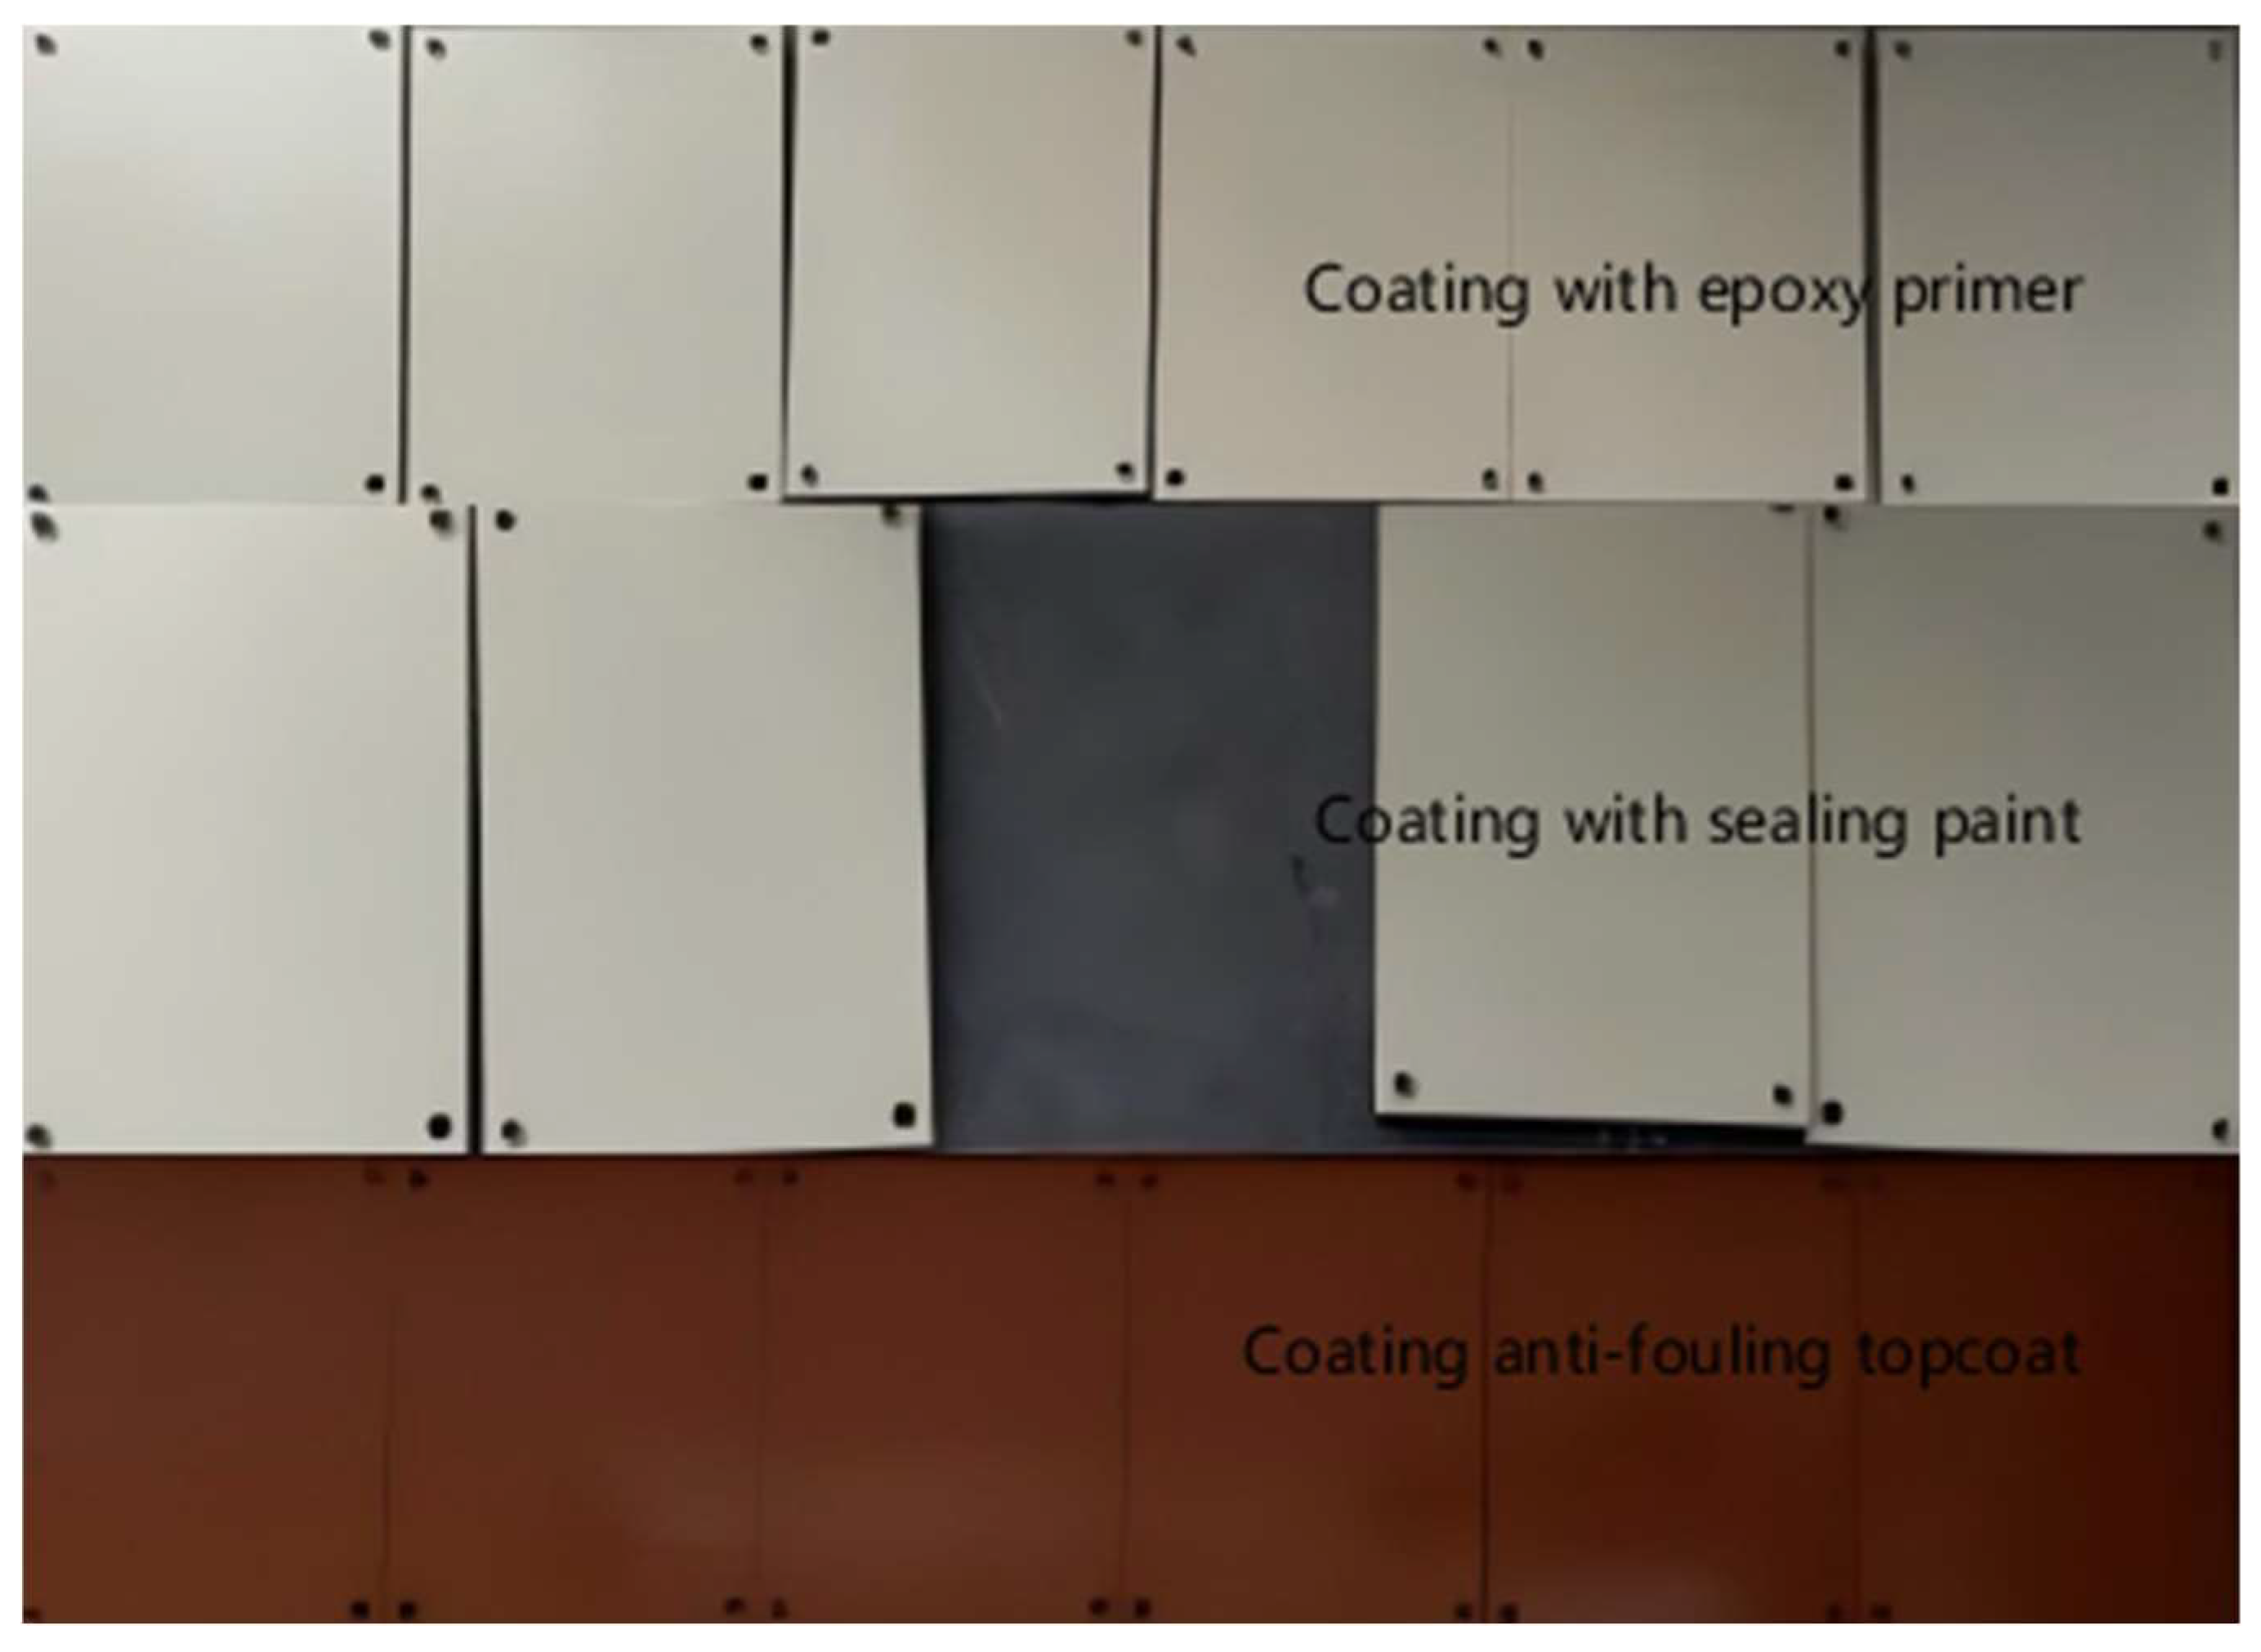
To achieve optimal performance of the antifouling coating, a 5500 W high-pressure airless spray system was employed for coating deposition. The system was equipped with a 0.46–0.53 mm nozzle, and experimental results indicated optimal atomization efficiency at a nozzle pressure of 15 MPa. Coating application followed the spraying method specified in GB/T 1727-2021, “General Preparation Methods for Paint Films”. The epoxy paint components were prepared by mixing the base material with the curing agent in an 8.8:1.2 volume ratio, followed by a 15 min maturation period at 20 ± 1 °C. Spraying was performed with the spray gun maintained 30–50 cm from the sample surface, with the nozzle perpendicular (90 ± 2°) to the surface and moving at a constant speed to ensure uniform coating application. The sealing coat was applied after 16 h of curing at 20 °C, using a precisely controlled formulation of base material, hardener, and additive mixed at 13.9:3.6:2.5 by volume, resulting in a uniform wet film thickness of 175 μm. For the topcoat, a two-layer system was implemented with a base material to hardener ratio of 17.8:2.2 by volume. Each layer was carefully applied to achieve a wet film thickness of 143 μm, maintaining an 8 h interval between applications (Table 1). The entire coating process produced uniform films without any visual defects, such as holidays or sagging (Figure 2), demonstrating optimal adhesion and surface coverage.

2.3. Experimental Design

The hydrodynamic analysis of the Qinzhou Bay port area reveals characteristic reciprocating tidal flows. Flood tides exhibit average velocities of 0.8–1.28 m/s (maximum 1.54 m/s), whereas ebb tides demonstrate stronger currents, averaging 0.9–1.55 m/s with peak velocities of 1.95 m/s. The inner bay (Maowei Sea) has substantial tidal prism capacity, with particularly strong tidal currents in its channels serving as the primary mechanism for maintaining sediment equilibrium in Qinzhou Bay. Maximum flood tide currents reach 1 m/s, while peak ebb tide velocities reach 1.7 m/s. Upstream river discharge causes scouring, carrying sediments downstream to the estuary and increasing suspended sediment concentrations in port waters. Periodic tidal movements further transport seabed sediments from nearshore shallow areas. Biofouling-resistant coating erosion tests were conducted using artificial seawater with 35‰ salinity, prepared according to ASTM D1141-98 (2013), “Standard Practice for the Preparation of Substitute Ocean Water”. Quartz sand with a median particle size of 4–15 μm was used as artificial sediment, and three comparative test groups were established. The experimental scheme in this study adopts the “Case1-v3c0” numbering system. Here, “Case1” denotes the first experimental condition to distinguish different configurations, “v3.0” represents a flow velocity of 3.0 m/s characterizing the hydrodynamic conditions, and “c0” indicates a sediment concentration of 0 kg/m3 describing the suspended sediment content in the water. This systematic numbering of experimental parameter combinations effectively enhances comparability and analytical efficiency across different test conditions.

2.4. Sediment Erosion Equipment

Coating erosion testers can be classified into jet-type, rotary-type, suspension-type, and tank-type based on different erosion mechanisms and testing requirements. For this experiment, the MCF-20 rotary corrosion–erosion–abrasion tester was selected, featuring multi-angle scouring (0–60° adjustable, using a standard 45° angle), high-precision flow velocity control (0.1–5.0 m/s continuously adjustable), and uniform water flow distribution to accurately simulate port water flow effects on antifouling coatings. Unlike conventional jet-type equipment, the rotary design generates stable laminar flow through a turbine drive, eliminating localized turbulence interference and ensuring uniform coating loading. This configuration effectively simulates liquid rotational scouring, subjecting specimen surfaces to erosion effects resembling actual environmental conditions, thereby enabling more accurate evaluation of antifouling coating performance in real port applications.
The experiment employed a circulating water channel to subject the angled coating surface to continuous directional flow, simulating marine dynamic conditions. This was followed by particle-free high-pressure vertical rinsing to remove residual sediment, with subsequent stabilization in a constant temperature and humidity chamber to achieve uniform surface drying. The coating surface was then examined for erosion, blistering, and delamination. Performance testing of adhesion strength, contact angle, and surface roughness was conducted to evaluate the effects of varying flow velocities and sediment conditions, while antimicrobial and algal inhibition properties were simultaneously assessed.

2.5. Coating Performance Analysis Methods

2.5.1. Adhesion Testing

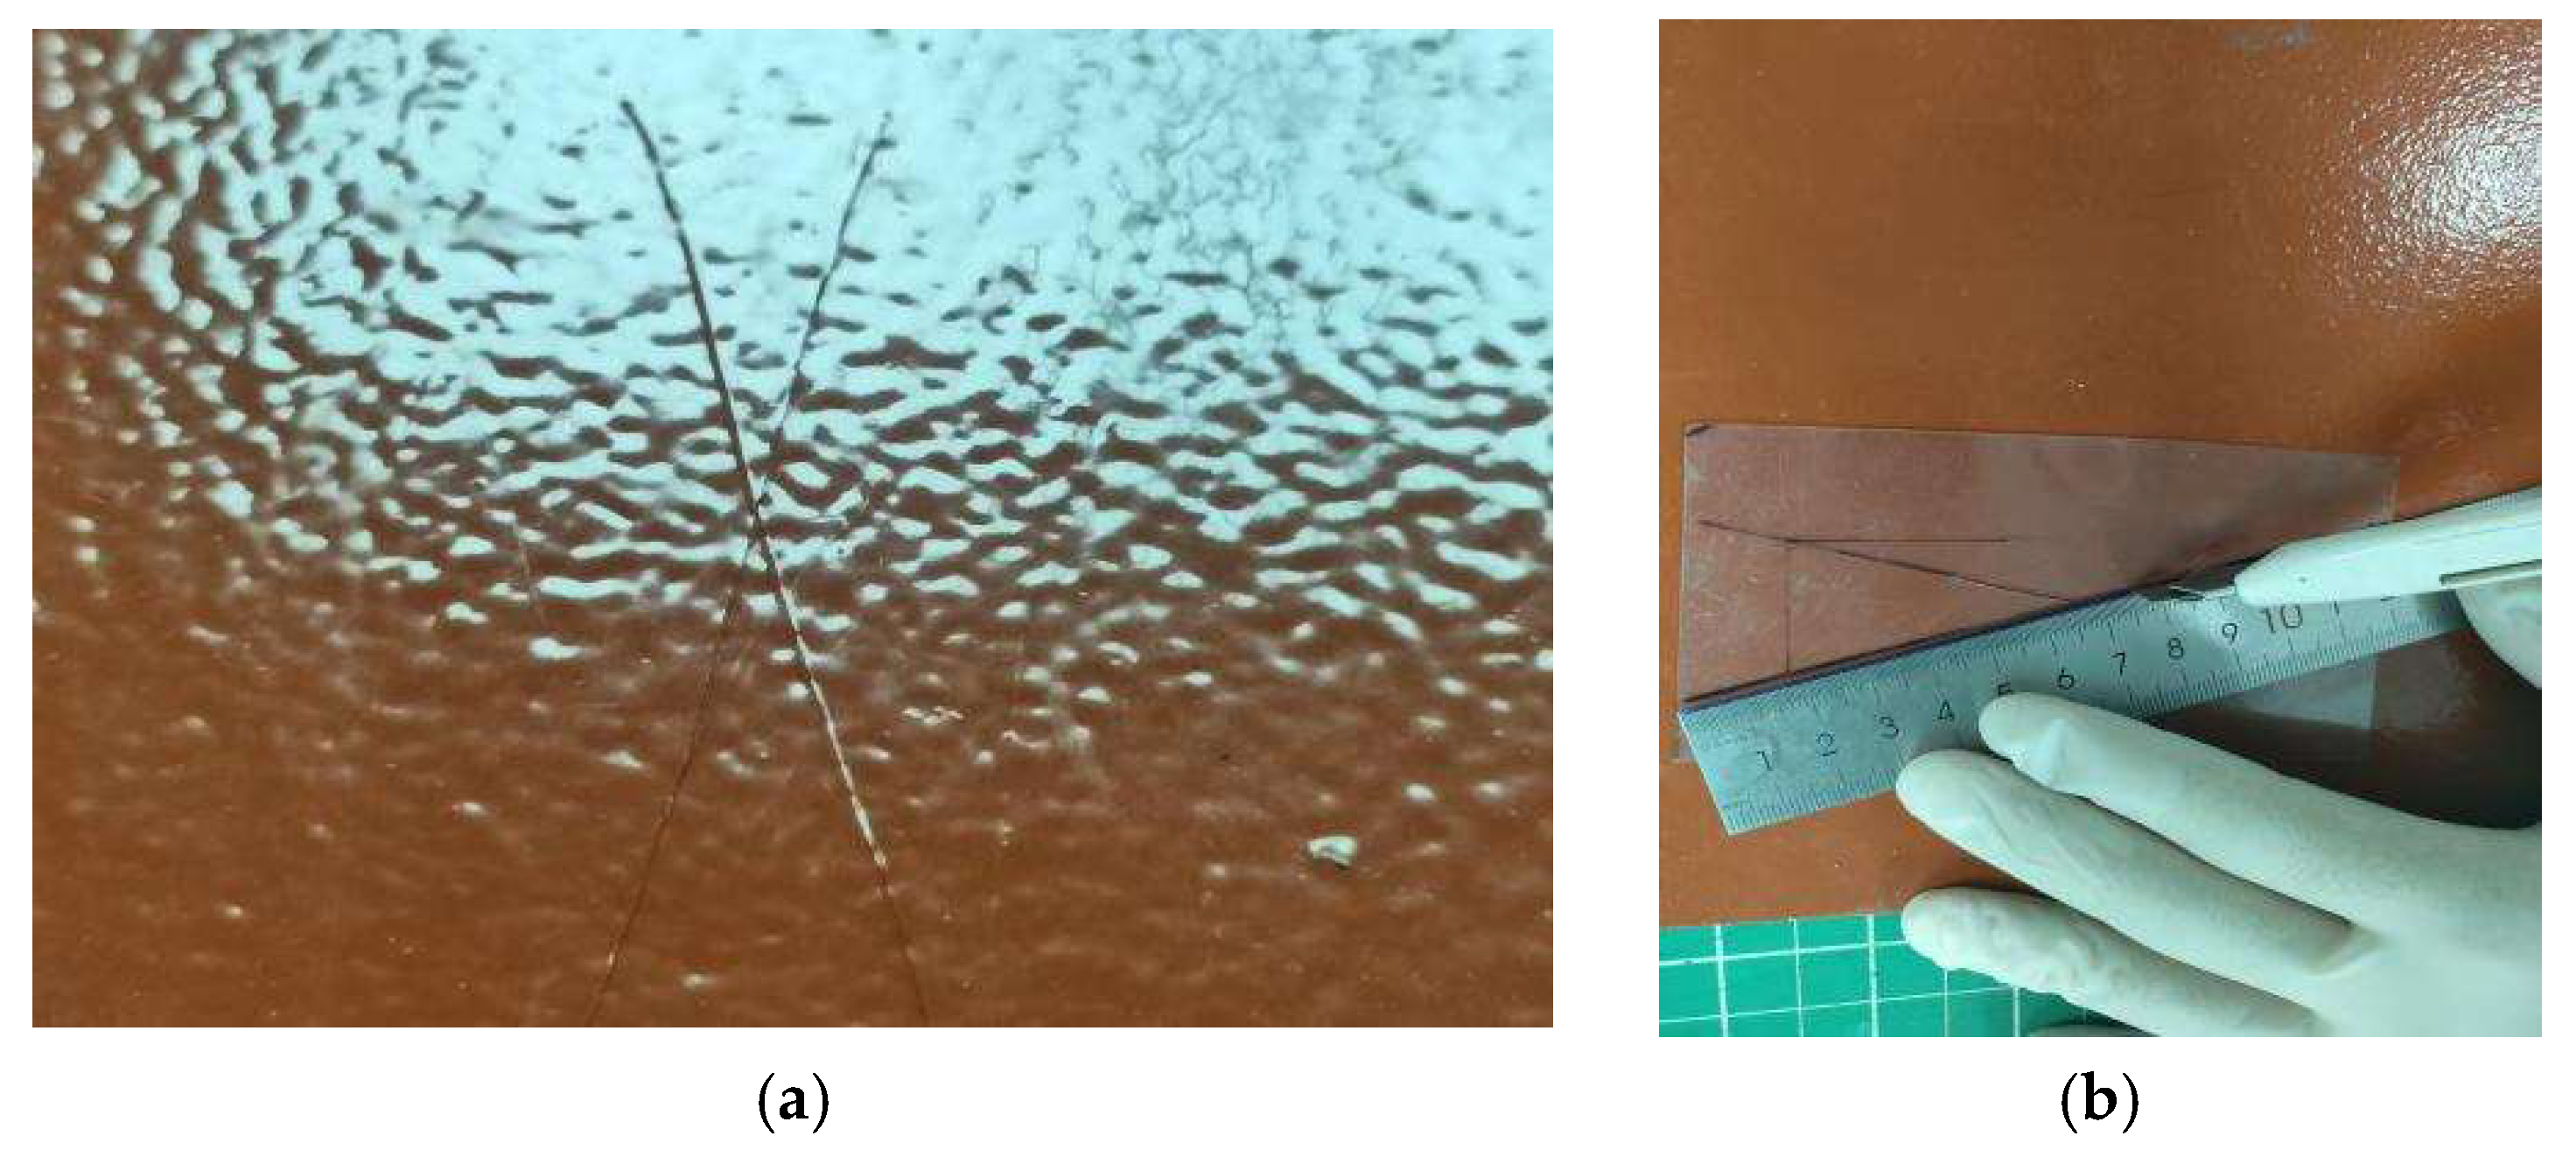
The adhesion performance of antifouling coatings was evaluated according to ISO 16276-2 (X-cut test). After each test cycle, coated specimens were conditioned at 23 ± 2 °C and 50 ± 5% relative humidity until completely dry. Using a precision knife guided by a steel ruler, two 40 mm intersecting lines were cut at a 45° angle, penetrating through to the titanium alloy substrate. Pressure-sensitive tape was then applied precisely at the intersection, firmly burnished by finger, and removed at a 180° angle within 90 s (Figure 3). The coating’s condition after tape removal was examined to assess adhesion integrity. Using Equation (1), the erosion test results for different experimental conditions were analyzed, revealing a decline in the average coating adhesion strength with increasing test cycles.
X n t = Y 0 ¯ Y n t ¯ Y 0 ¯ × 100 %
where Y 0 ¯ represents the adhesion strength of the coating surface before immersion, and Y n t ¯ represents the adhesion strength after immersion. Here, n denotes the test condition (1 for Case1-v3.0c0, 2 for Case2-v1.5c1.4, and 3 for Case3-v3.0c1.4), and t represents the number of erosion test cycles.

2.5.2. Impact Resistance Testing

The impact resistance of the antifouling coating was determined according to GB/T 1732-2020, “Test Method for Impact Resistance of Paint Films”. Testing was conducted using a weighted hammer dropped from progressively increasing heights (0–100 cm) onto the coated surface. The impact head deformed both the coating and substrate, with the critical failure height defined as the point at which coating damage first became consistently observable. The optimized test configuration employed a 1000 ± 2 g hammer with an 8 mm diameter impact head. Specimens were positioned coating-side upward, ensuring that each impact point maintained a minimum spacing of ≥10 mm from plate edges and adjacent test points. The hammer was released freely onto the impact head, with the drop height incrementally increased in 5 cm intervals until coating failure—manifested as cracking, wrinkling, or delamination—was observed. The threshold failure height was recorded, and all tests were conducted under controlled laboratory conditions (Figure 4).

2.5.3. Hardness Testing

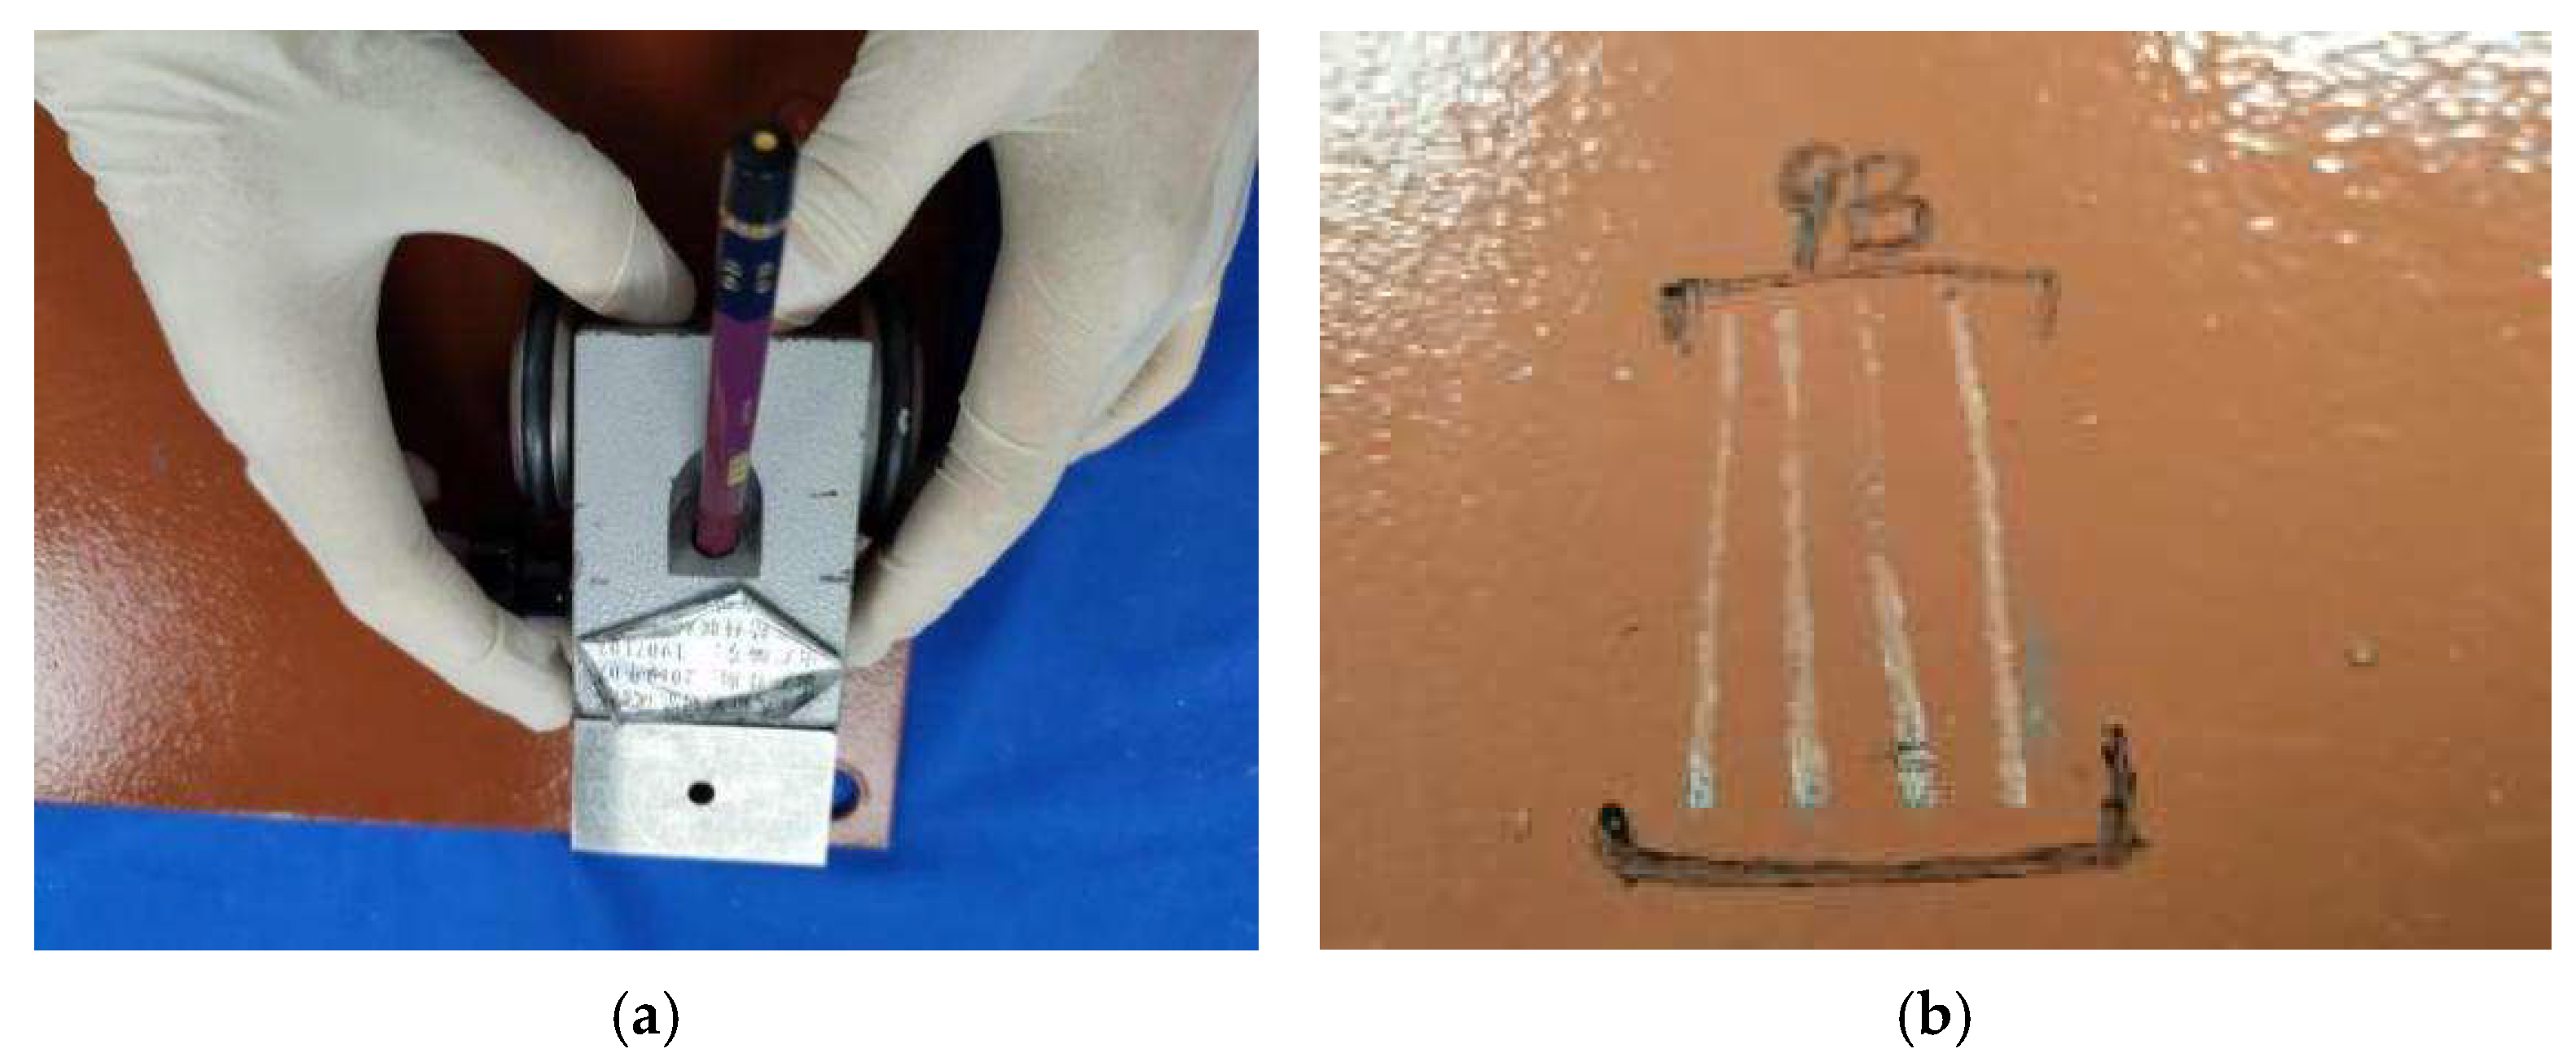
The hardness of the antifouling coating was evaluated according to GB/T 6739-2020, “Pencil Method for Determining Film Hardness,” using standardized pencil testing procedures. The instrumented pencil hardness test was performed with Mitsubishi Uni pencils mounted in a QHQ tester. A load of 7.35 ± 0.15 N was applied at a 45° angle until coating defects ≥3 mm in length appeared, after which the surface was cleaned with a solvent (Figure 5).

2.5.4. Contact Angle Measurement

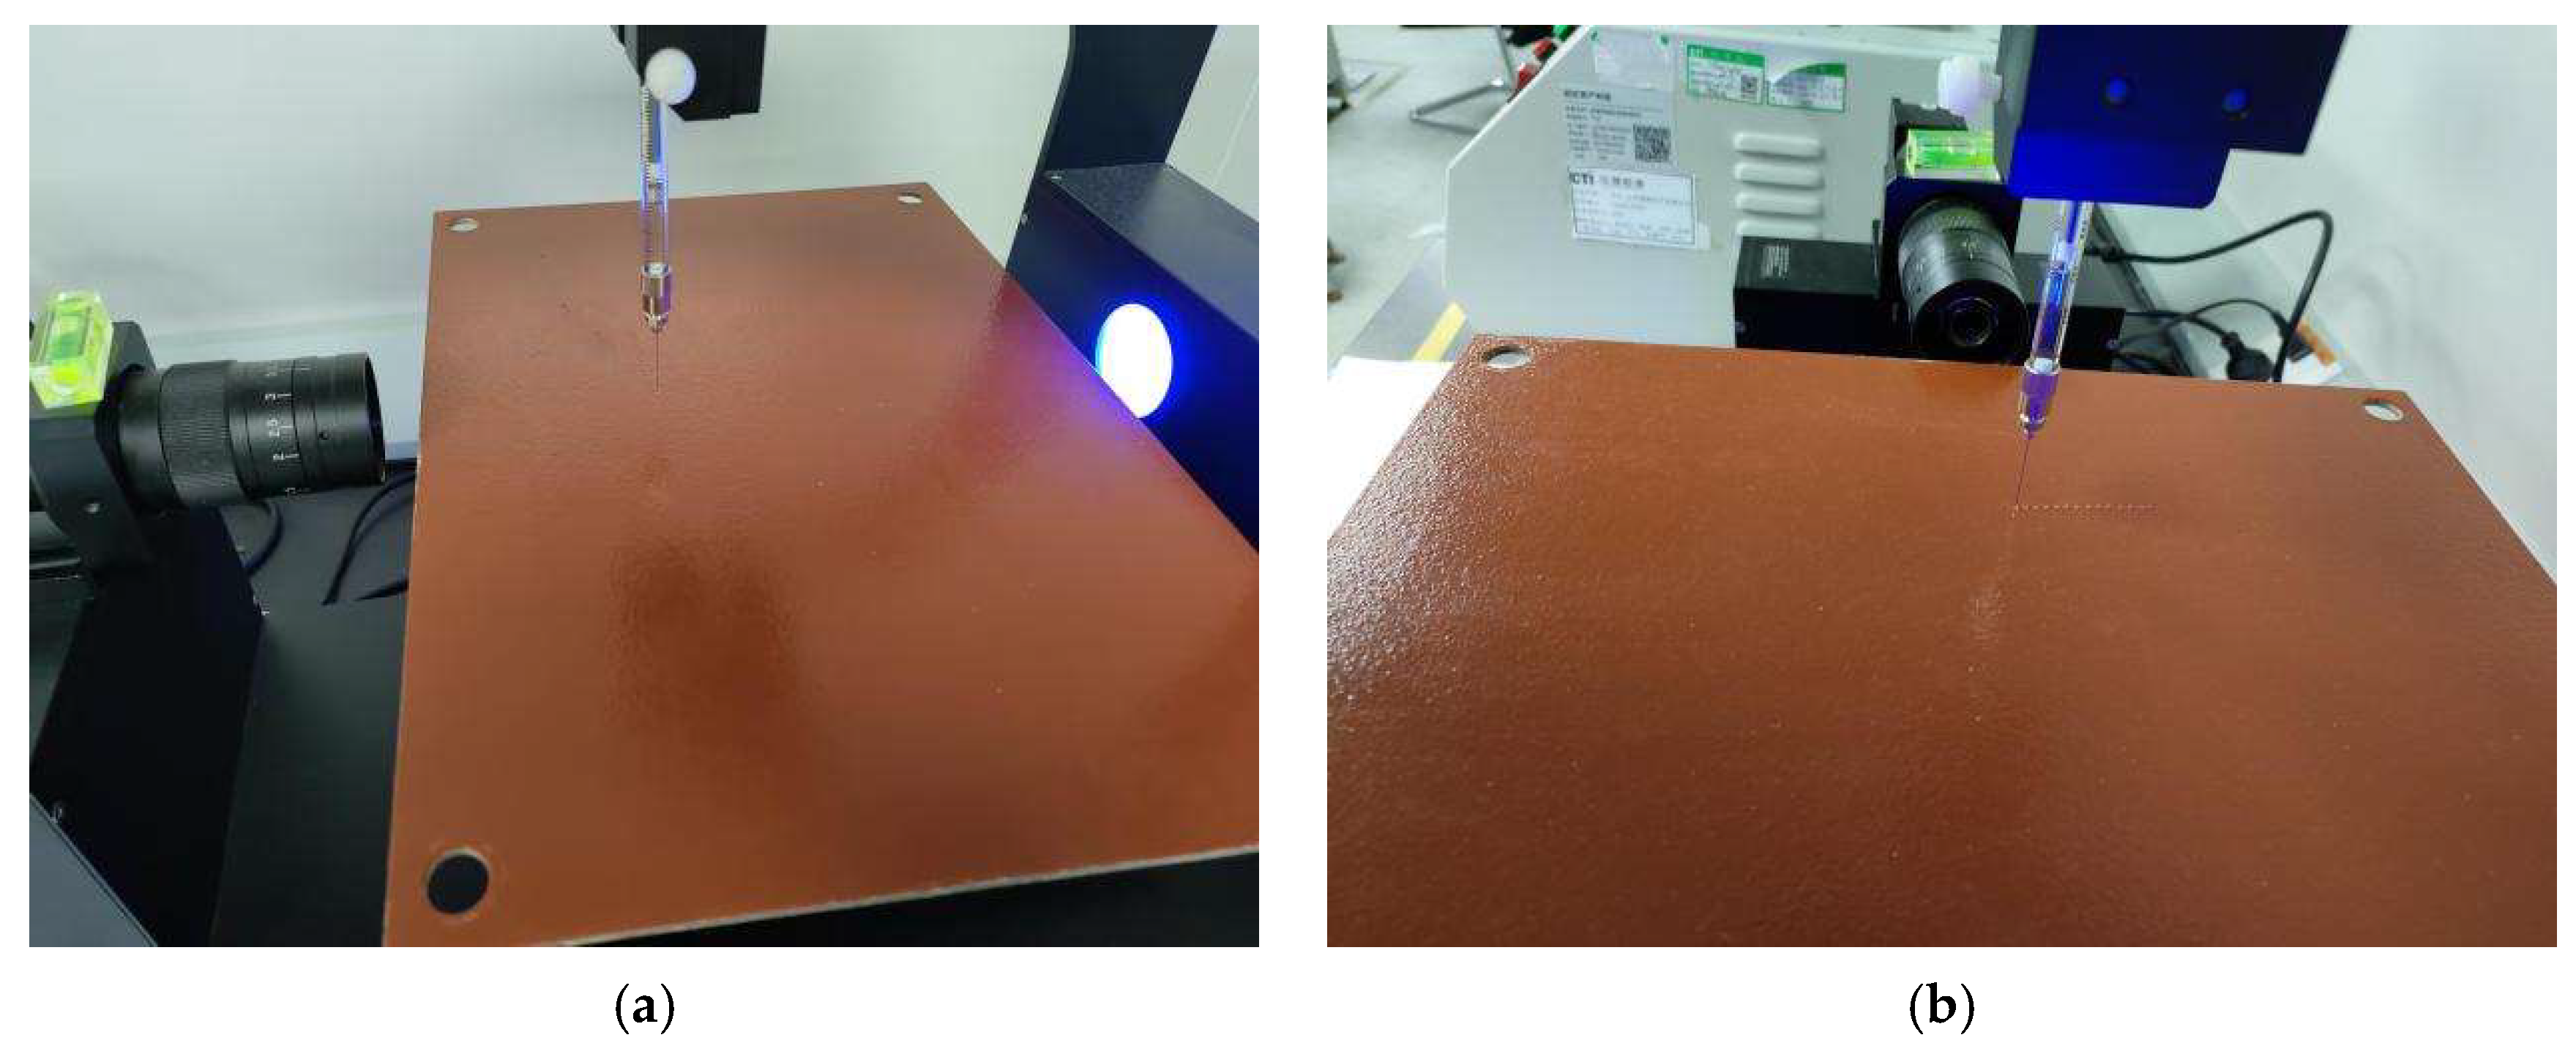
Contact angle measurements on the antifouling coatings were performed before and after testing according to GB/T 30693-2014 to analyze surface energy changes. Both water and diiodomethane were used as test liquids, and measurements were conducted using the SDC-100 contact angle goniometer (Shenzhen Shengding Precision Instruments Co., Ltd., Shenzhen, China). Specimens were dried and leveled on the instrument stage prior to testing (Figure 6). A 2 μL deionized water droplet and a 1 μL diiodomethane droplet were suspended from a 0.51 mm diameter needle tip. The sample stage was then gradually raised to transfer the droplets onto the coating surface without splashing. After 60 s of equilibrium stabilization, contact angles were measured and averaged over 10 repeated tests, rounded to 0.1°, with the water–substrate contact angle calculated using Equation (2) in degrees (°).
θ = 2 × arctan H R
where H—height of the water droplet image (mm); R—half-width of the water droplet image (mm).

2.5.5. Surface Roughness Measurement

Surface roughness was measured using a 3D laser measurement microscope (OLS4100) (Olympus, Tokyo, Japan) employing laser interferometry to capture phase-shift data for generating high-resolution 3D topographical images, allowing precise quantification of surface morphology and roughness parameters (Figure 7). The microscope was configured at 1000× magnification with an 800 μm cutoff to calculate the arithmetic mean deviation (Ra) of the coating surface. Measurements were conducted in a right-handed Cartesian coordinate system, with the X-axis aligned along the specimen’s long edge, the Y-axis along the short edge, and the Z-axis perpendicular to the surface. The final roughness value was determined by averaging eight consecutive scans.
The arithmetic average roughness (Ra) was evaluated by calculating the mean absolute coordinate values Z(x) over the sampling length of the coating surface, with the Ra value expressed in micrometers (μm) and determined by Equation (3).
R a = 1 L L 0 Z x d x
where Z(x)—vertical coordinate value representing profile height at position x (negative when below X-axis, positive when above); L—sampling length.

2.5.6. Bacterial Adhesion Performance Testing

The bacterial adhesion test used Micrococcus luteus, a common marine microorganism, to evaluate the coating’s anti-adhesive properties. Materials included M. luteus culture medium, coated and control samples, Petri dishes, inoculation loops, pipettes, and scanning electron microscopy (SEM) equipment for analysis. M. luteus suspensions were prepared from 24 h cultures (37 °C in marine broth), and coated and control samples were incubated in the bacterial suspensions for 12 h at 37 °C. After incubation, bacterial adhesion was quantified via SEM imaging following triple rinsing with 0.9% NaCl, and antimicrobial efficiency was calculated using Equation (4):
A R = N c N s N c × 100 %
where N s —bacterial adhesion density of coated samples; N c —bacterial viscosity density of control samples.
The diatom adhesion test employed Navicula spp., a common marine diatom, to evaluate the coating’s anti-fouling performance against microalgae. The required materials included Navicula culture, coated samples, control substrates, filtered and sterilized seawater, optical microscopy equipment, environmental chambers, light meters, and experimental containers. Seawater was prepared into an algal suspension at a concentration of 105 cells/mL. Coated samples were then immersed in 1 L of this suspension, and an uncoated control sample was included for comparison. The vessels were placed in an environmental incubator and maintained for 24 h at a light intensity of 7000 lux, a 12:12 h light-dark cycle, and a temperature of 25 °C. After incubation, the samples were gently rinsed with filtered and sterilized seawater to remove unattached algal cells. Algal adhesion was then observed and counted using a light microscope. Twenty fields of view per sample were analyzed in triplicate, and the average value was calculated. Based on these measurements, the antifouling efficiency of the coating was determined. The algal inhibition rate was calculated using Equation (5):
A R = N c N s N c × 100 %
where N s —number of adherent algal cells in the coated sample; N c —number of adherent algal cells in the control sample.

3. Experimental Results

3.1. Variations in Coating Adhesion Performance

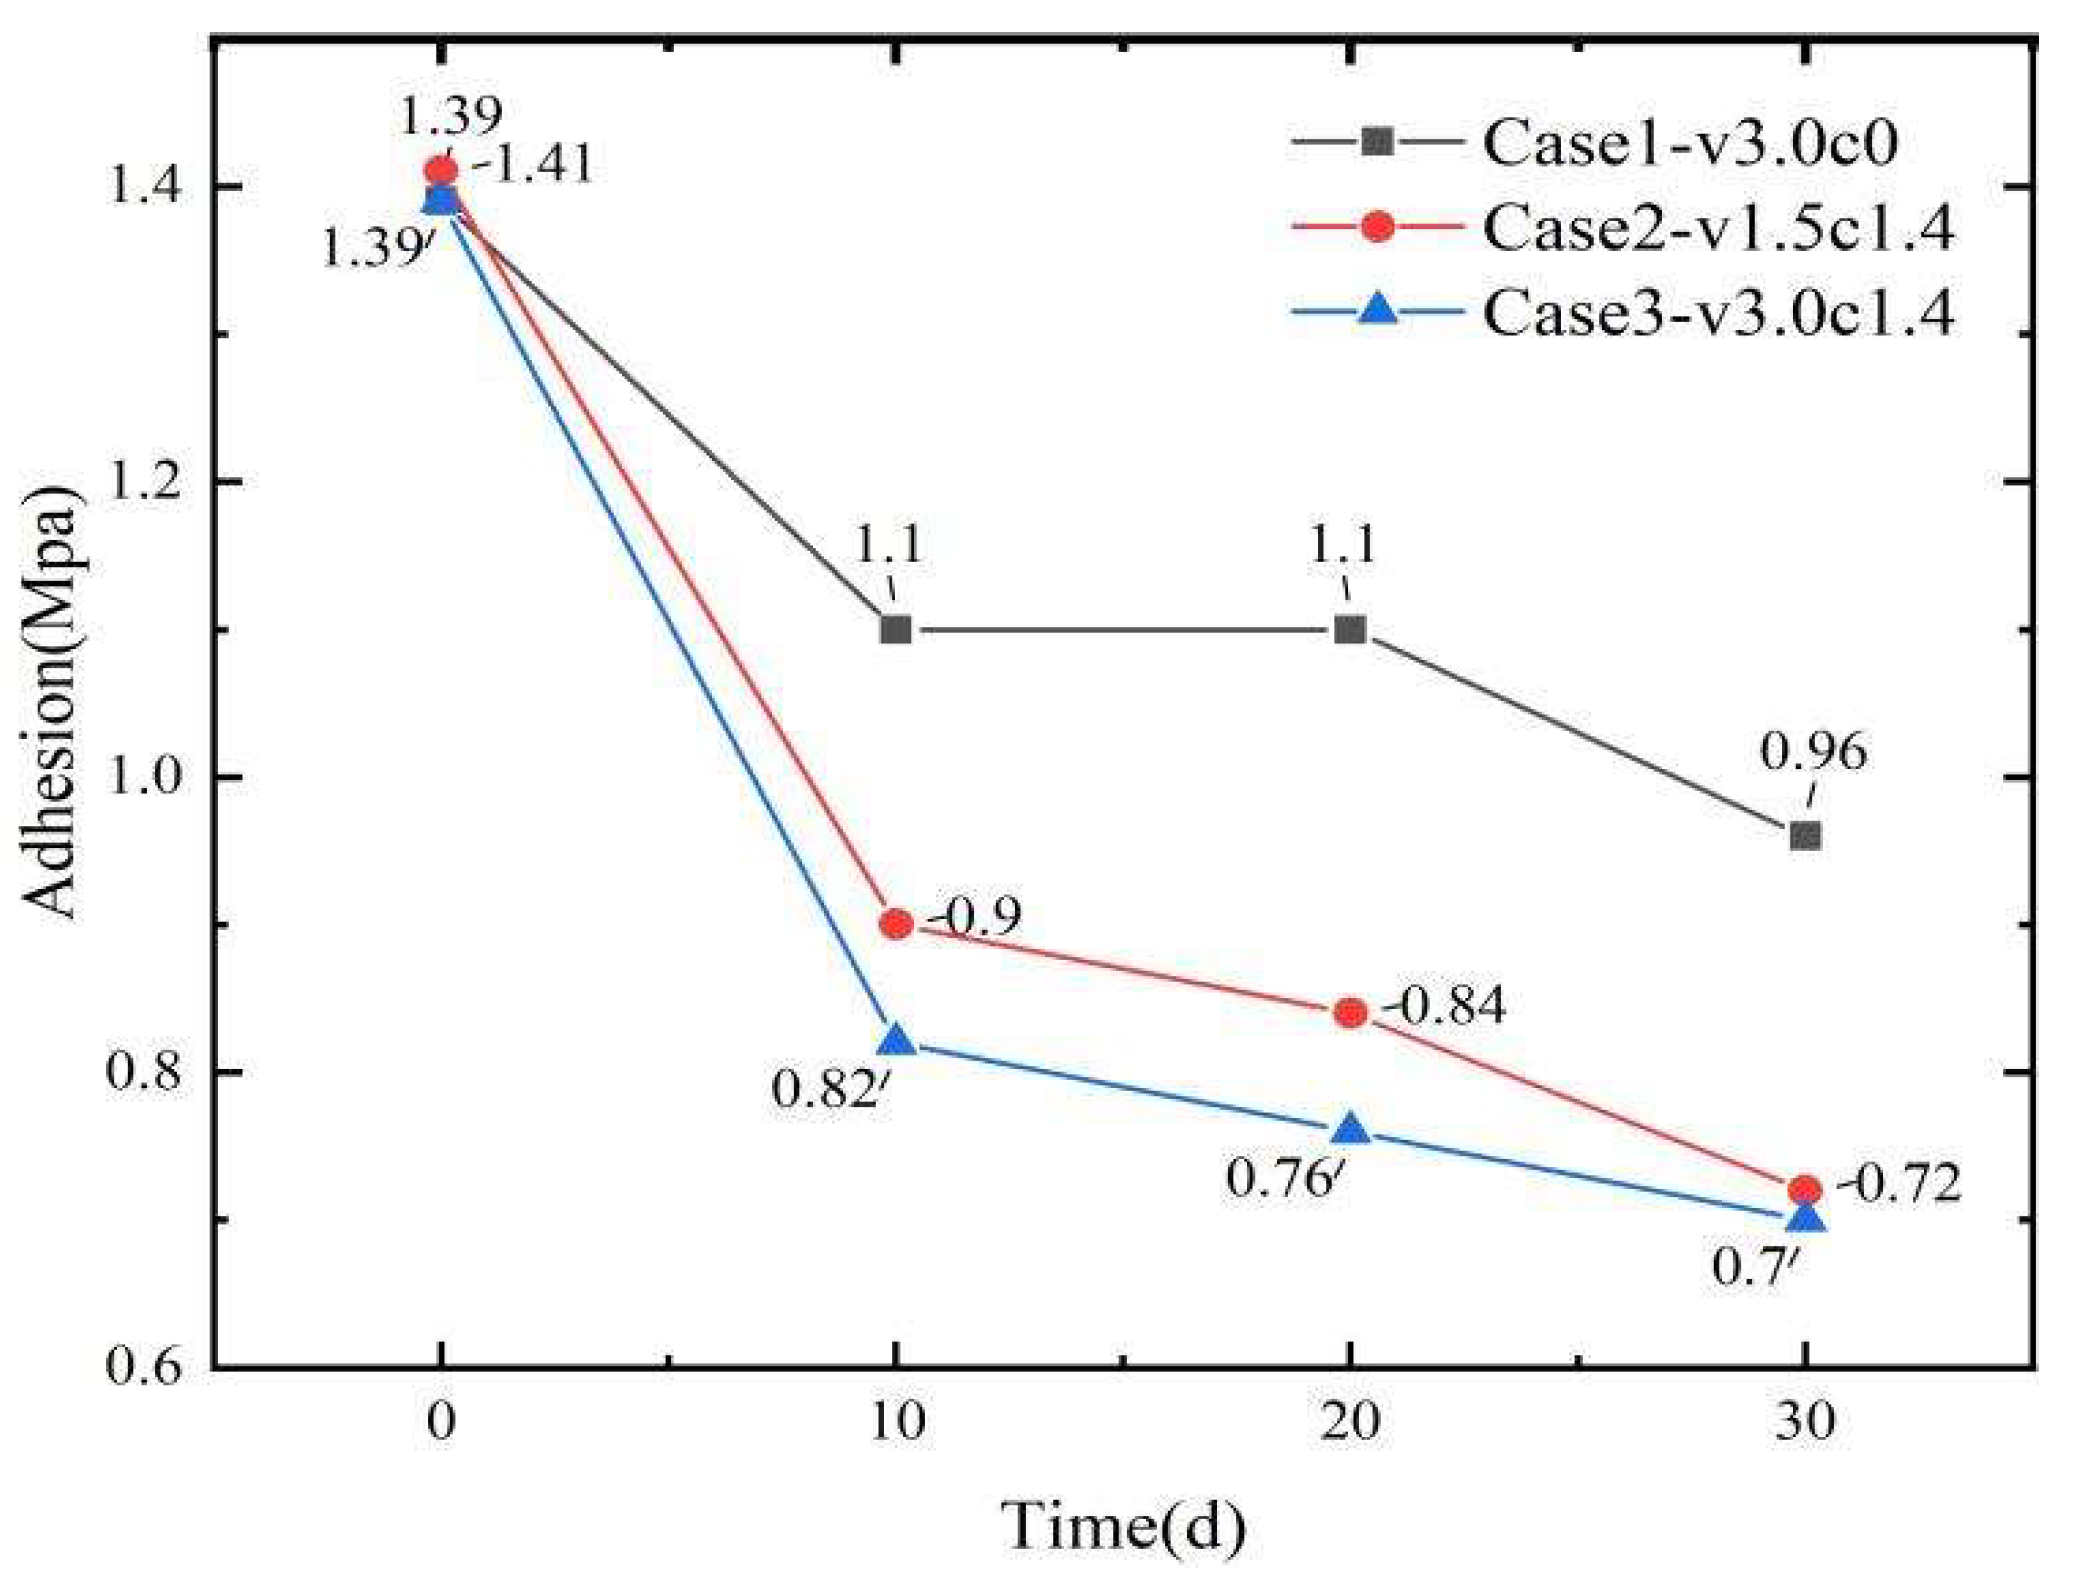
Table 2 shows that the adhesion strength of all antifouling coatings exposed to erosion decreased over time. For Case 1 (without sediment) at an erosion flow velocity of 3 m/s, the decline in adhesion strength was gradual during the first two cycles, with a reduction of 20.86%. In contrast, Cases 2 and 3 (with sediment erosion) showed more substantial adhesion loss, exceeding 35%, and the decline became more pronounced at higher flow velocities (3 m/s). After three cycles, the adhesion reduction in Cases 2 and 3 converged to approximately 49%. Under pure seawater erosion (without sediment), however, adhesion loss remained lower at around 30% (Table 3). These experiments demonstrate that the presence of sediment during erosion significantly reduces the adhesion of antifouling coatings and accelerates coating damage (Figure 8).

3.2. Variation in Coating Impact Resistance Performance

The MCF-20 rotating corrosion–erosion–wear testing machine was used to simulate the scouring effects of high-speed water flow and suspended sediment in marine environments. This systematic evaluation assessed the interfacial stability of antifouling coatings under dynamic loading and examined their mechanical response under multiaxial stress conditions. As shown in Table 4, under all three operating conditions, the coatings exhibited no visible cracks, delamination, or microstructural defects after continuous impact cycles. The interfacial bond strength showed no significant degradation, and the impact resistance of all samples remained below 5 cm. At flow velocities of 1.5 m/s and 3.0 m/s in the presence of sediment, the coating system demonstrated high stability, with fluctuations in impact resistance significantly.

3.3. Variation in Coating Hardness Performance

The pencil hardness test evaluates the hardness of coatings by scratching their surfaces with pencils of varying hardness grades. As shown in Table 5, all tested samples exhibited hardness levels below 9B under the three operating conditions, with sediment erosion having no observable effect. Across all three test cycles, the measured coating hardness consistently remained below 9B. This relatively low hardness indicates that the coatings may be susceptible to cracking or delamination under sediment erosion, potentially reducing their service life.

3.4. Variation in Coating Hydrophobicity Performance

As shown in Table 6, under different erosion conditions, the static contact angles of both water and diiodomethane exhibited similar decreasing trends. In Case 1 (3 m/s artificial seawater flow without sediment), the contact angles declined most gradually: the water contact angle decreased from 105.2° (cycle 1) to 104.1° (cycle 3), while the diiodomethane contact angle decreased from 78.7° to 77.6°. In contrast, Cases 2 and 3 (with quartz sand as artificial sediment) exhibited more rapid and pronounced reductions in coating surface contact angles compared to Case 1. The experimental results indicate that increasing flow velocity and the presence of sediment during erosion enhance surface roughness, thereby reducing the hydrophobicity of the antifouling coatings. Under identical 3 m/s flow conditions, the sediment-free case maintained higher contact angles and superior hydrophobic performance. Similarly, under sediment-containing artificial seawater erosion, lower flow velocity conditions preserved higher contact angles on the coating surface. These findings confirm that both flow velocity and sediment presence significantly influence coating hydrophobicity (Figure 9).

3.5. Variation in Coating Surface Roughness

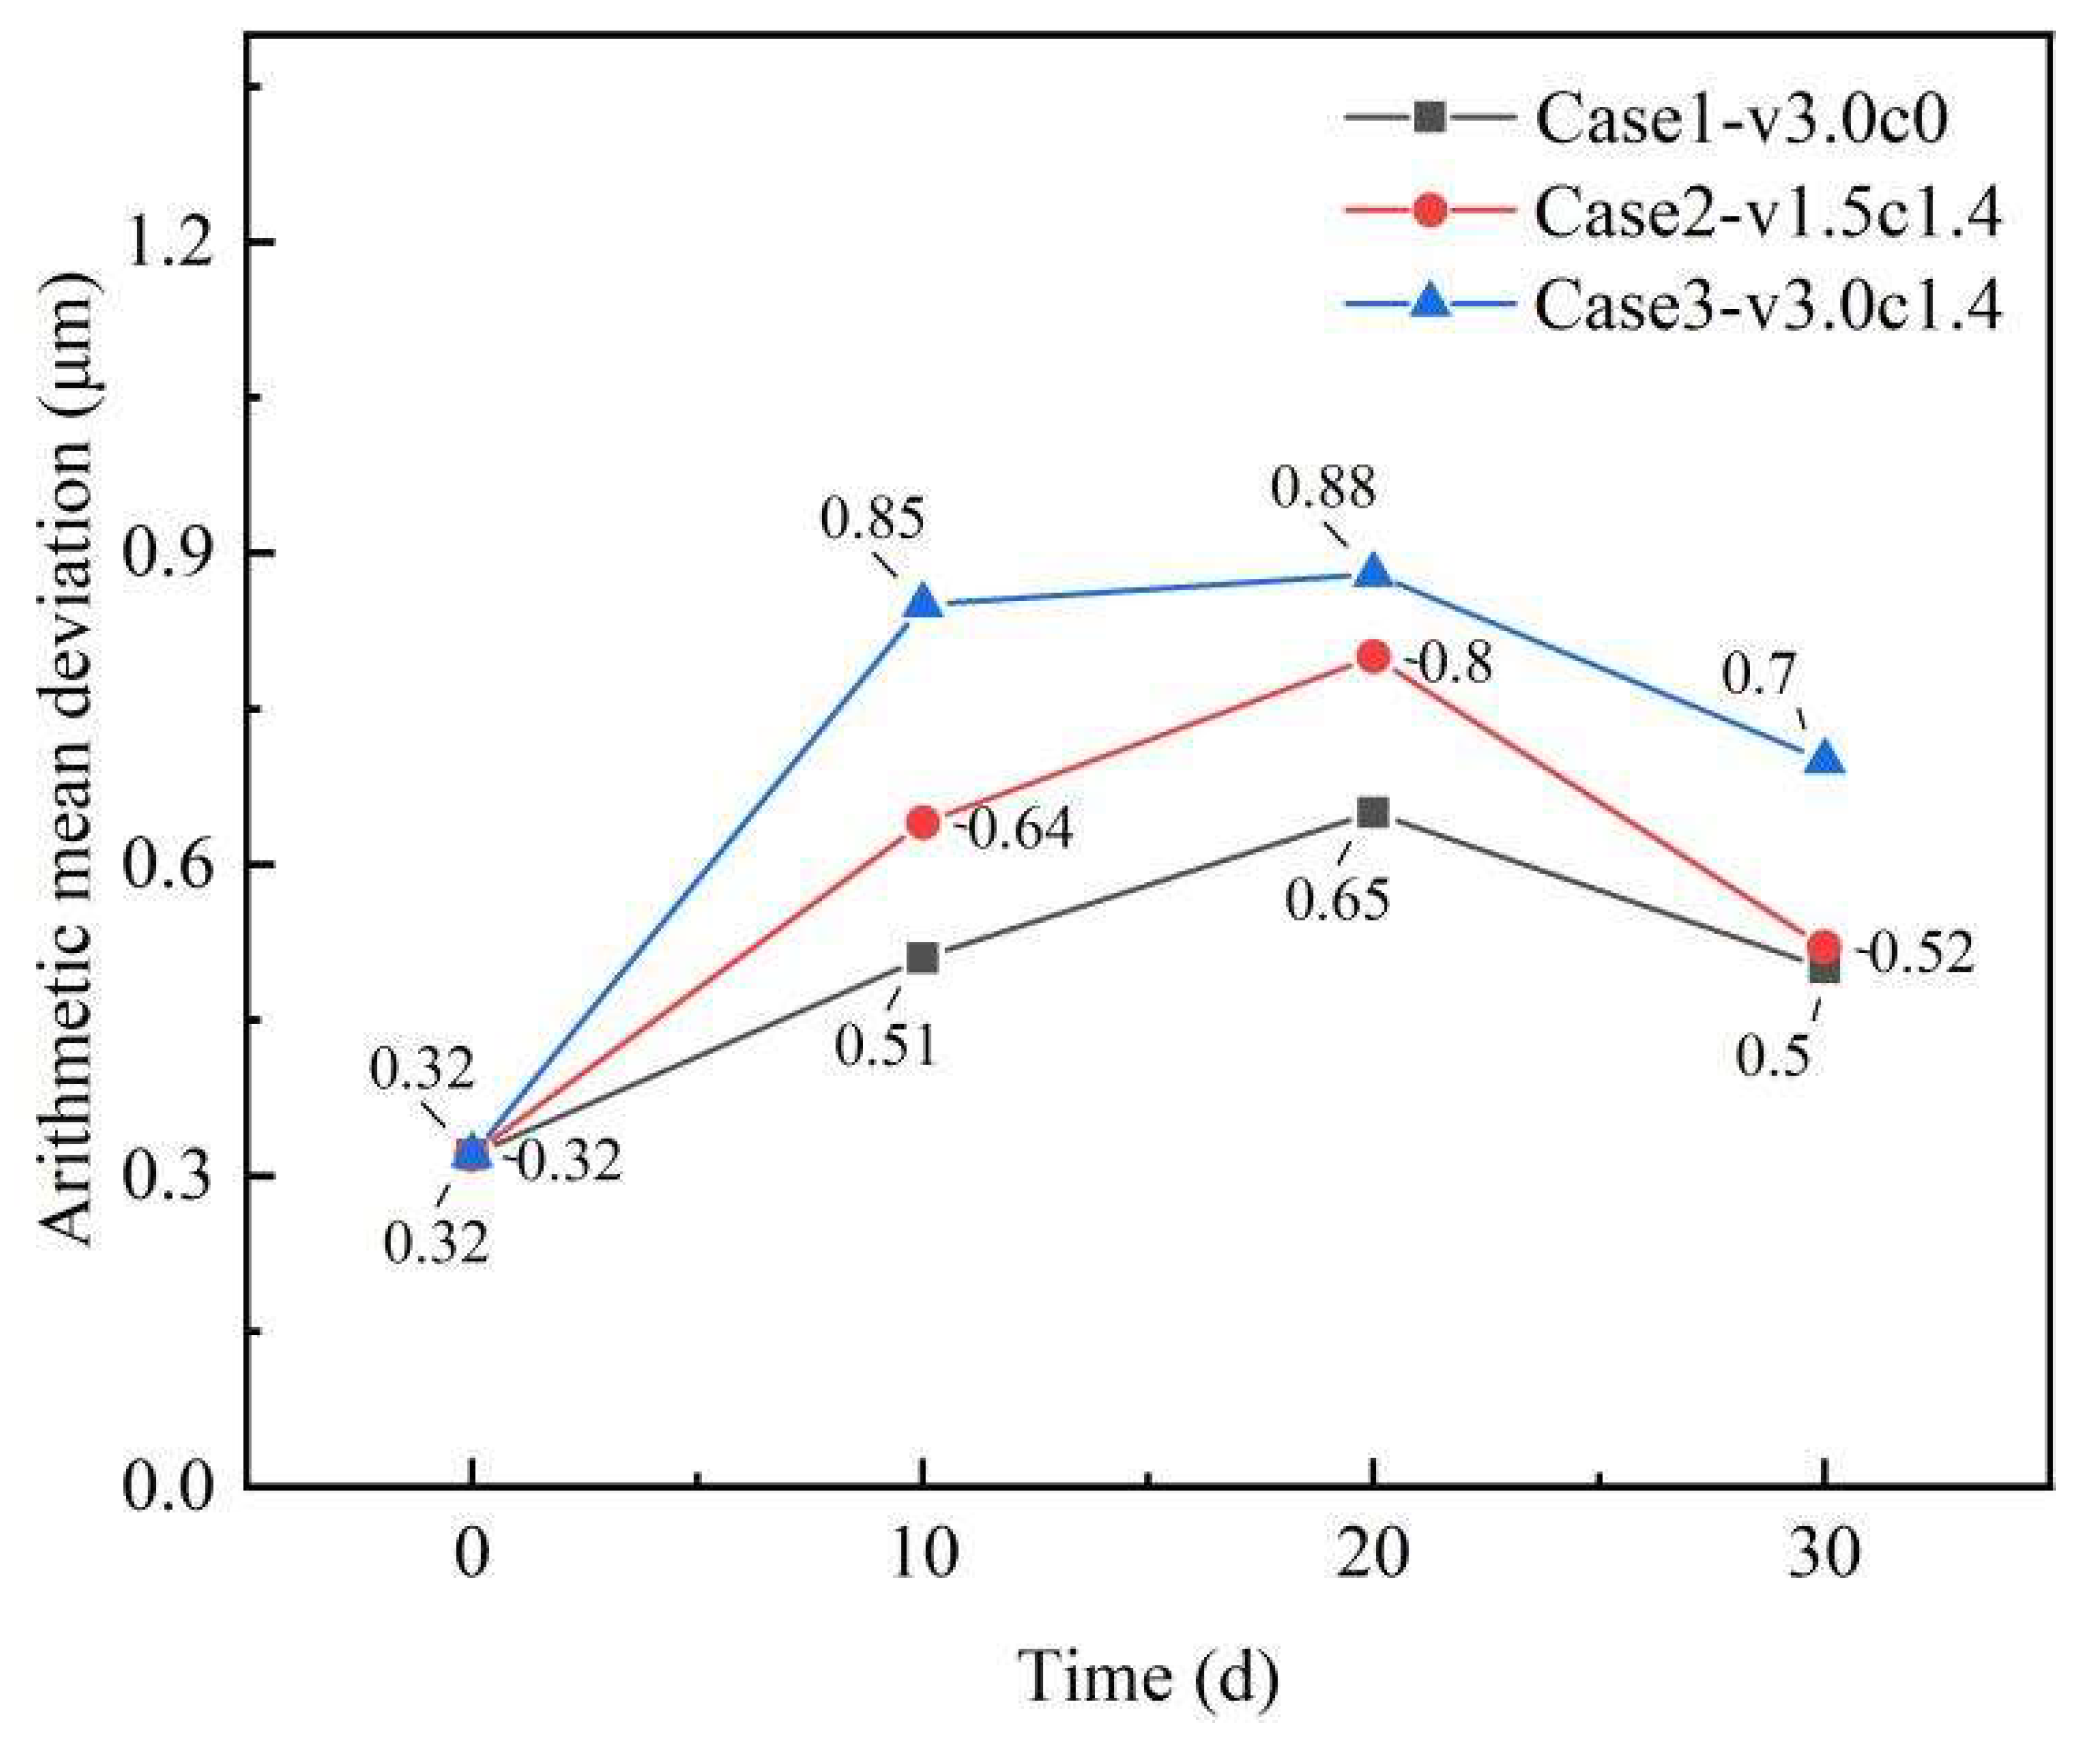
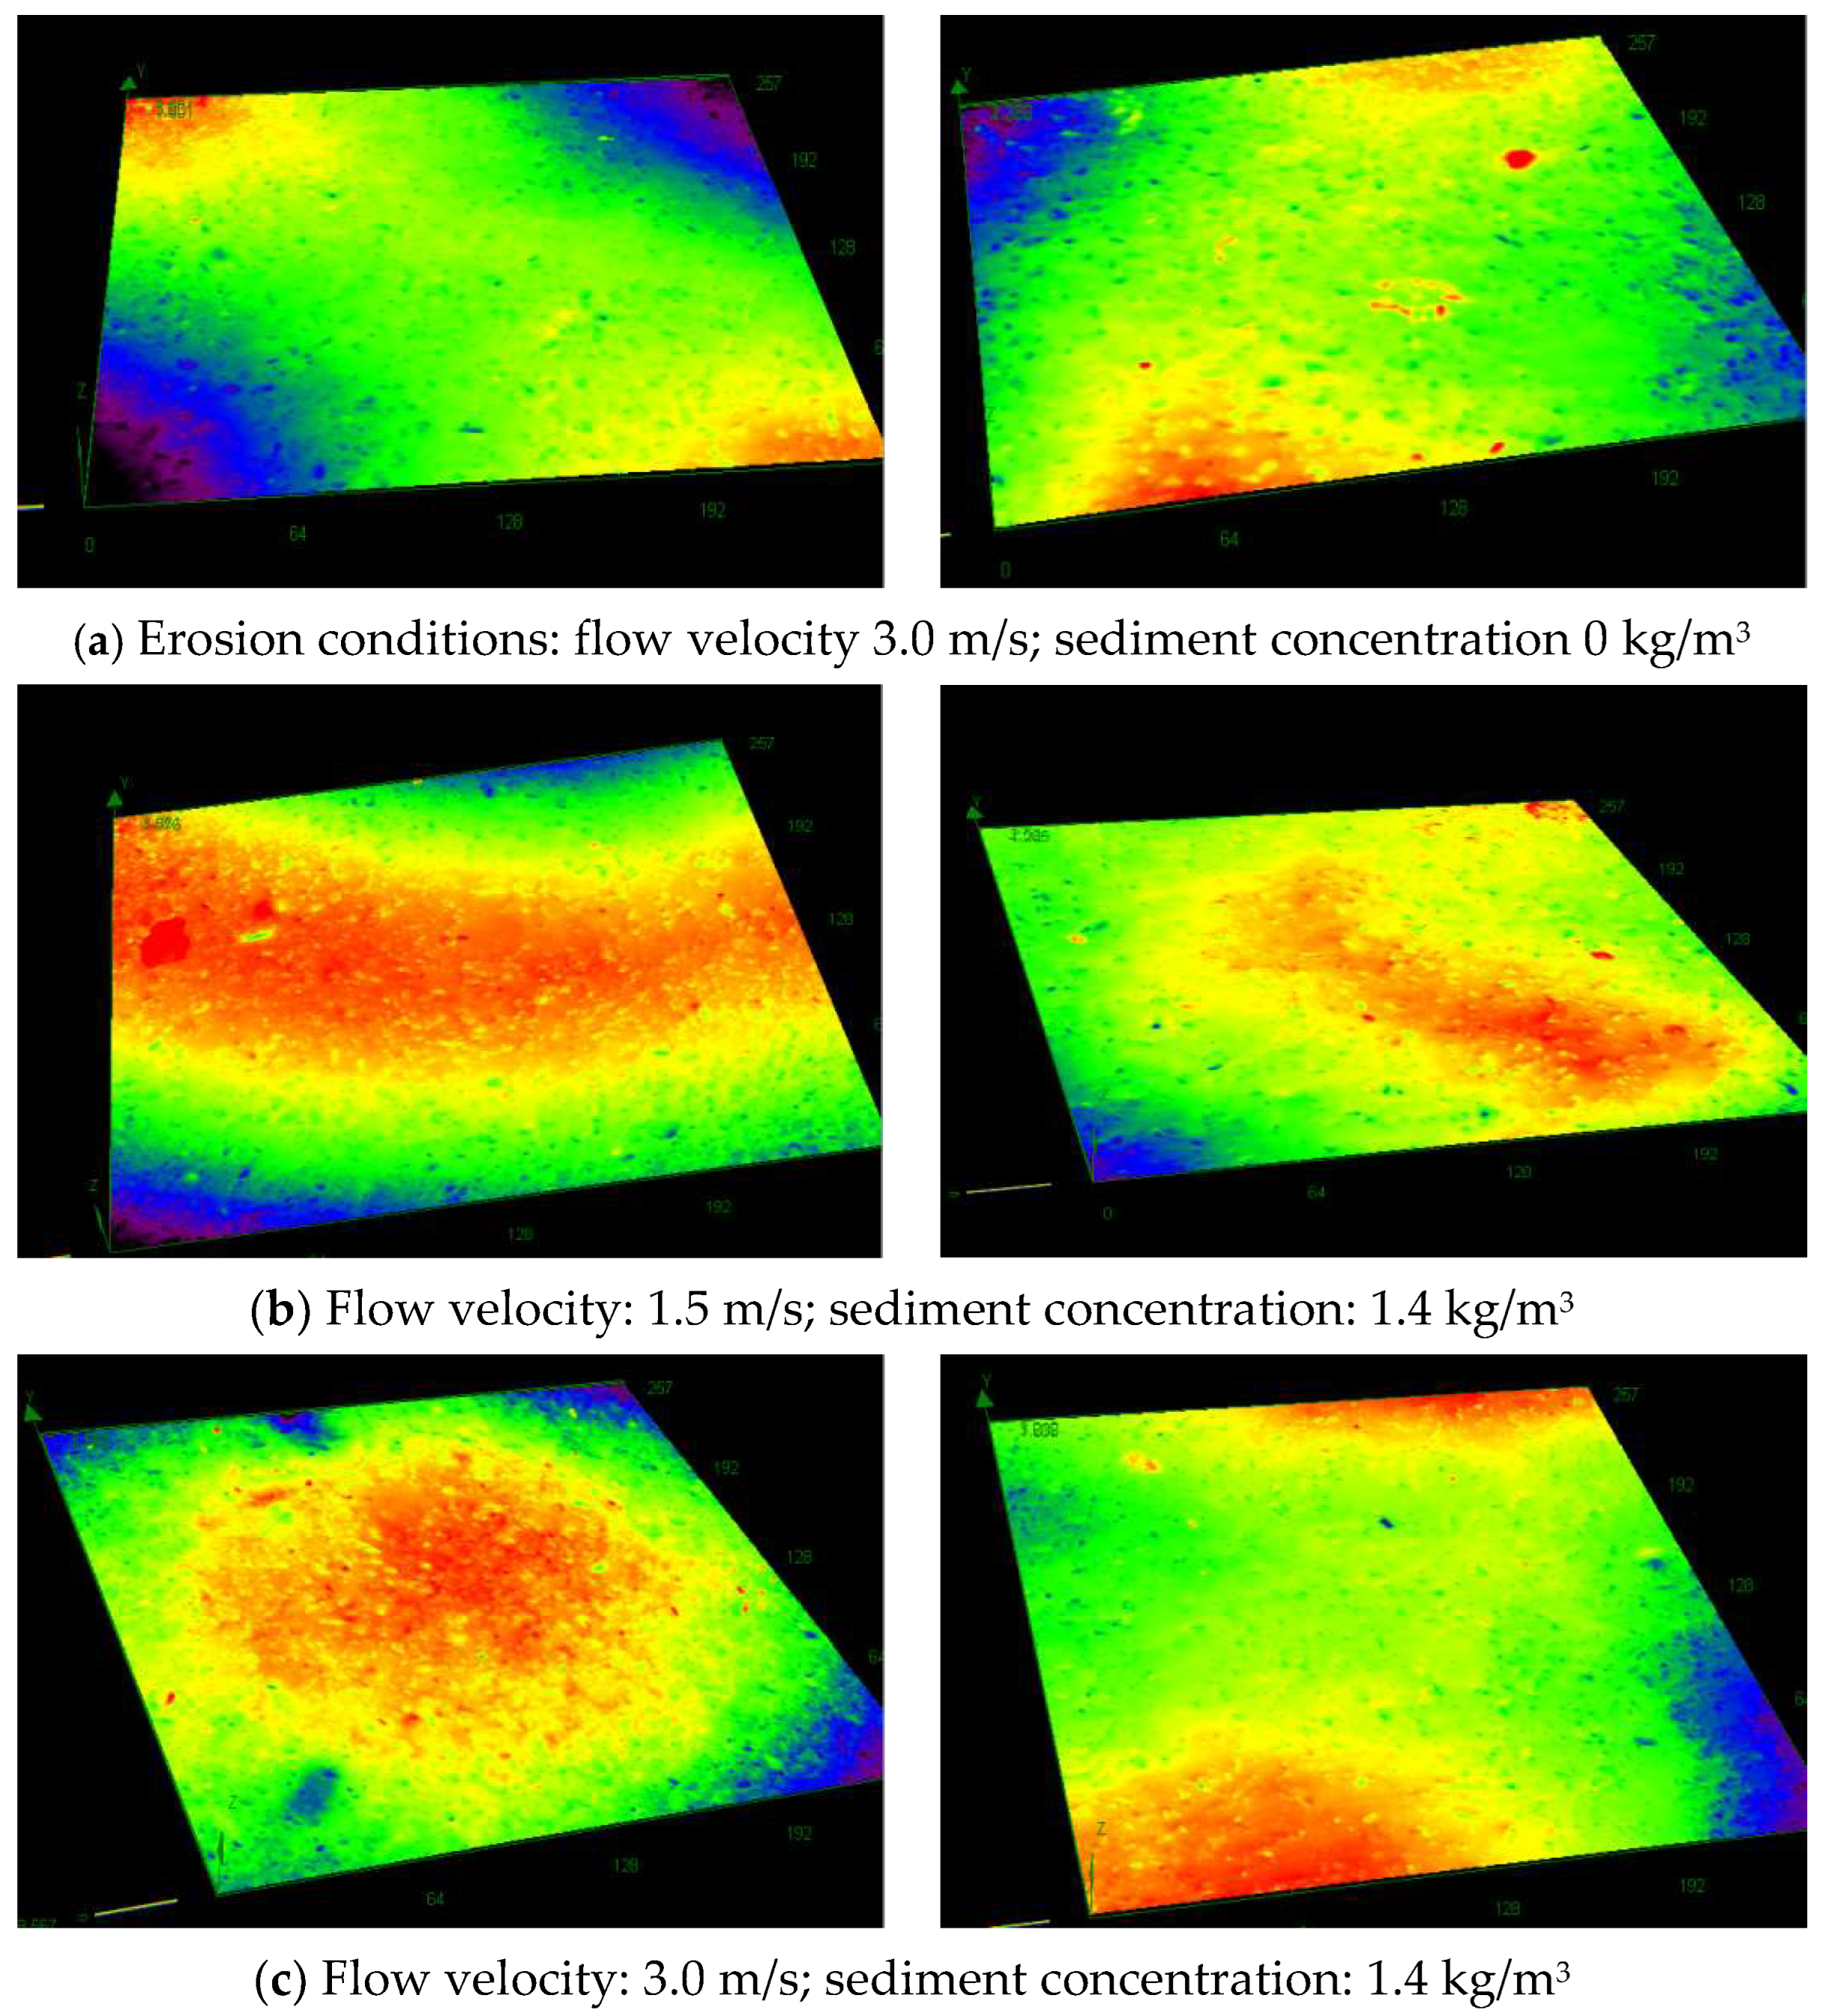
Figure 10 shows that the coating surfaces remained smooth under all three operating conditions during artificial seawater erosion, with no signs of abrasion, blistering, or delamination. The average roughness exhibited comparable temporal trends across all conditions, beginning at an initial value of 0.32 μm. Between 0 and 20 days, surface roughness gradually increased, followed by a progressive decrease from 20 to 30 days. These consistent variations occurred while the coating surfaces retained their structural integrity throughout the erosion process. Under identical sediment erosion conditions, however, variations in flow velocity had a significant influence on the surface roughness of the antifouling panels. During the first 0–10 days, lower flow velocity resulted in faster roughness growth compared with the 3 m/s condition. Between 10 and 20 days, the roughness Ra values increased gradually under both conditions, reaching maximum average values of 0.88 μm at lower velocity and 0.80 μm at higher velocity. After one month, the coating surfaces became smoother under lower flow velocity. This difference was attributed to the abrasive action of quartz sand, as higher flow velocity produced micro-scratches on the coating surfaces, thereby increasing surface roughness. Under sediment-free erosion conditions, the measured roughness remained relatively low, and the coating surfaces maintained a high degree of smoothness. Comparative testing showed that sediment erosion caused substantially greater roughness increases than seawater flushing alone. Moreover, higher flow velocities amplified the abrasive effects of sediment, leading to significantly increased surface roughness (Figure 11).

3.6. Variation in Coating Antibacterial and Algal-Inhibition Performance

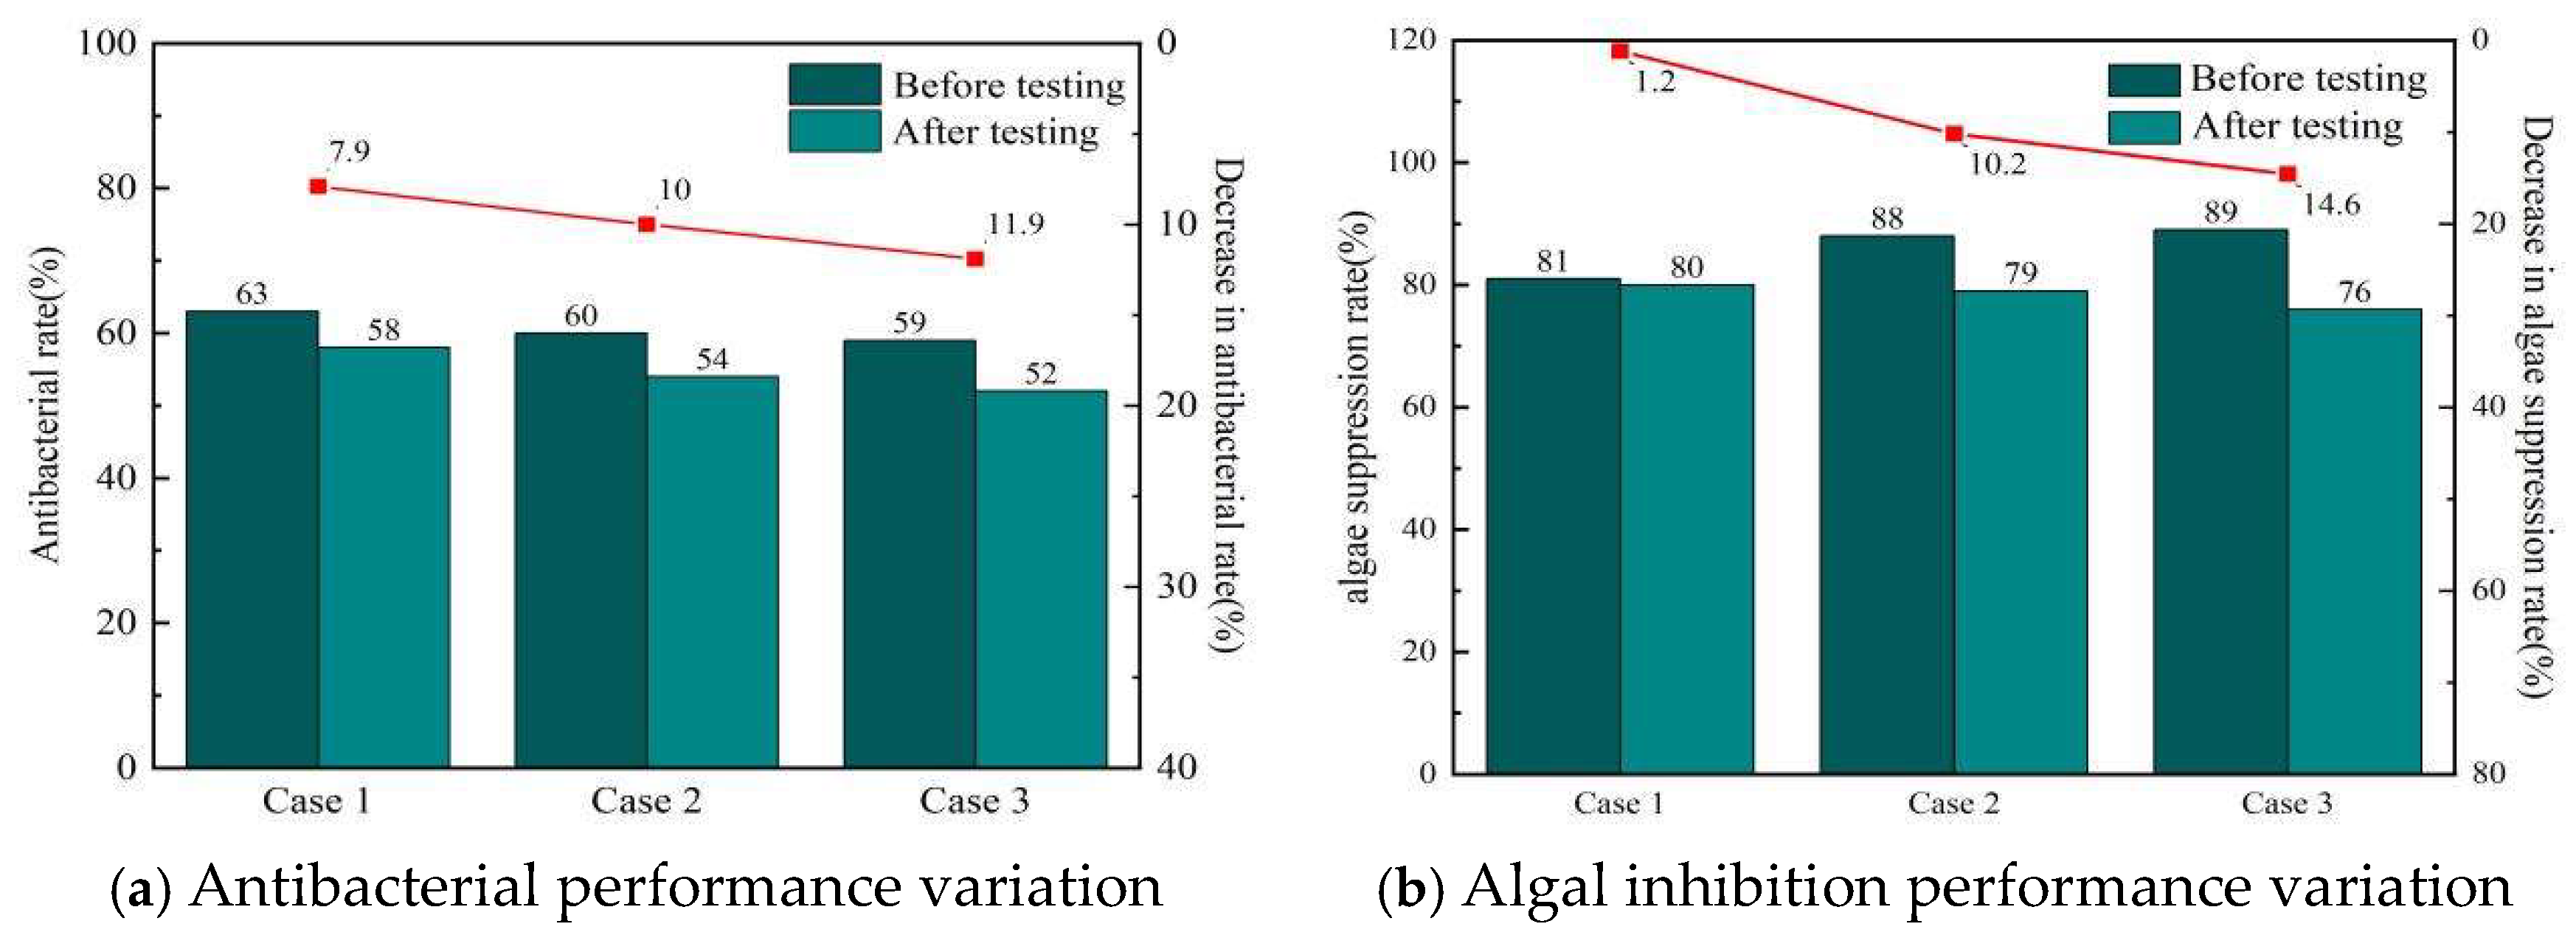
The antibacterial and algal inhibition rates of the antifouling coatings consistently declined after sediment–seawater erosion (Figure 12). Under the most severe erosion condition (Case 3: 3.0 m/s flow velocity and 1.4 kg/m3 sediment concentration), the coatings showed maximum performance reductions of 11.9% in antibacterial rate and 14.6% in algal inhibition rate. In contrast, coatings exposed to sediment-free artificial seawater flushing retained strong antifouling properties, with only a 1.2% reduction in algal cell adhesion inhibition. Under identical sediment erosion conditions, a flow velocity of 1.5 m/s caused smaller reductions in antifouling performance than the 3.0 m/s condition. Sediment erosion exerted a greater influence on algal inhibition than on antibacterial activity. Overall, these results indicate that the presence of sediment degrades antifouling performance more substantially than flow velocity variations alone in artificial seawater.

4. Discussion

4.1. Challenges of Static Antifouling Coatings

The performance degradation of antifouling coatings in static port environments arises from the synergistic effects of sediment erosion and water flow scouring. Low-velocity currents combined with sediment create persistent scouring that drives dynamic evolution of surface roughness (experimental data show over a 30% reduction in hydrophobicity with sediment, with the contact angle decreasing to 104.1°). This process accelerates the weakening of coating–substrate bonding strength, resulting in a 49% loss of adhesion, while mechanical abrasion from quartz sand particles generates micro-cracks and scratches on the coating surface. Weakened coating adhesion compromises surface integrity, creating microcracks and defective areas that serve as prime sites for microbial attachment and biofilm colonization. This significantly diminishes the coating’s antibacterial and anti-algal properties, accelerating the overall decline in antifouling efficiency. The increase in surface roughness from an initial 0.32 μm to 0.88 μm forms a positive feedback loop with hydrophobicity loss, significantly promoting microbial attachment and biofilm formation. Although silicone coatings possess inherently low surface energy, their antibacterial and anti-algal rates exhibit declining trends under microtopographical alterations caused by sediment erosion. These alterations enable bacteria and diatoms to more readily establish metabolically active mucous layers, accelerating the chemical degradation of coatings. Among the three test conditions, the coating experienced the greatest performance degradation at 1.5 m/s flow velocity with 1.4 kg/m3 sediment concentration. This indicates that the alternating actions of low-velocity sediment deposition and weak-current scouring in static port environments most severely compromise coating antifouling effectiveness.

4.2. Effect of Sediment Content on the Surface of Antifouling Coatings

In static port environments, sediment erosion acts as a critical environmental stressor that substantially alters antifouling coating surface characteristics through the combined effects of mechanical scouring and chemical corrosion, thereby accelerating functional failure. Systematic testing of coating surface behavior under coupled sediment–flow velocity conditions revealed stepwise influences of sediment concentration on microtopography, wettability, and antifouling performance. From a mechanical perspective, sediment particles directly weaken coating interfacial bonding strength through impact and abrasive cutting effects. At a sediment concentration of 1.4 kg/m3, adhesion loss reached 49%, which is significantly higher than under pure seawater scouring conditions. Particle impacts and abrasion generate scratches and pits, rapidly increasing surface roughness from an initial 0.32 μm to 0.88 μm. This surface deterioration directly reduces hydrophobicity: contact angle measurements revealed accelerated declines in both water contact angle (from 105.2° to 104.1°) and diiodomethane contact angle (from 78.7° to 77.6°) under sediment erosion conditions. These results indicate that sediment-induced roughening substantially decreases coating hydrophobicity, creating a detrimental “roughness-hydrophobicity” feedback cycle. The resulting loss of hydrophobicity further elevates the risk of biofouling. Experimental data show that when sediment concentration exceeds 1.4 kg/m3, the coating undergoes an 11.9% reduction in antibacterial rate and a 14.6% decline in algal inhibition rate. This marked deterioration in antimicrobial and anti-algal rates originates from sediment-induced scratches and pits, which provide microbial attachment sites, while reduced hydrophobicity facilitates mucous layer formation.
In summary, the multistage degradation pathway of “mechanical abrasion → surface roughening → hydrophobicity alteration → pollutant adsorption” induced by sediment scouring markedly accelerates the functional deterioration of antifouling coatings. These findings offer critical guidance for the design of coatings in static port environments, highlighting the need for precise control of surface roughness thresholds and optimized interfacial bonding strength to achieve both erosion resistance and antifouling performance.

4.3. Effect of Water Velocity on the Surface of Antifouling Coatings

The surface stability of antifouling coatings in dynamic flow environments is strongly influenced by flow velocity–regulated particle–coating interactions. Systematic observation of surface roughness and morphological evolution under artificial seawater erosion at different flow velocities (1.5 m/s versus 3.0 m/s) revealed distinct mechanisms of velocity-dependent erosion damage. During the 0–10 day erosion period, surface roughness showed pronounced differences between low and high flow velocity conditions. Under low flow velocity, prolonged particle–coating contact enhanced the cumulative effect of mechanical abrasion, leading to progressive microstructural damage and a rapid increase in surface roughness (Ra) from an initial 0.32 μm to 0.8 μm by day 10. In contrast, high flow velocity conditions limited sustained abrasive accumulation, as turbulent flows prevented stable particle–surface contact, resulting in a comparatively smaller Ra increase of only 0.5 μm by day 10. This phenomenon is intrinsically linked to the time-dependent nature of particle–coating interactions. Under low flow velocities, prolonged particle residence time and increased impact frequency per unit area accelerate microscopic surface degradation, manifesting as scratches and pits. This mechanism directly compromises coating hydrophobicity: low-velocity erosion–induced roughening reduced water contact angles from 105.2° to 104.1°, whereas high-velocity conditions resulted in only a 0.5° decrease, quantitatively confirming the strong correlation between surface topography evolution and hydrophobic performance.
In summary, flow velocity plays a critical role in regulating particle–coating interactions, exerting significant control over the surface roughness and morphological stability of antifouling coatings. These findings offer fundamental theoretical guidance for the design of velocity-adaptive coatings in static port environments, where careful management of flow velocity is essential to optimize both erosion resistance and long-term antifouling performance.

5. Conclusions

This study investigated the effects of sediment erosion on antifouling coatings under coastal port tidal and sediment conditions, systematically evaluating their erosion resistance. Using an MCF-20 corrosion–erosion–wear testing machine (Nanovea, Irvine, CA, USA), comparative analyses were conducted to assess the impacts of artificial seawater flushing versus sediment erosion on coating performance. The key findings are summarized as follows:
(1).
After three test cycles (30 days), sediment erosion caused a 49% reduction in coating adhesion strength, compared with only a 30% decrease under seawater flushing conditions. These results indicate that the presence of sediment substantially compromises coating adhesion and exacerbates surface damage.
(2).
Experimental results revealed distinct hydrophobicity variations under different erosion conditions. Seawater flushing alone caused only a 1.1° reduction in contact angle, whereas seawater containing sediment induced significantly larger decreases of 4.9–5.2°. At identical flow velocities, sediment-free conditions maintained superior hydrophobic performance, exhibiting both a more gradual decline in contact angle and enhanced stability during the initial immersion period compared with sediment erosion scenarios.
(3).
Sediment erosion markedly increased coating roughness, reaching 0.88 μm after 30 days—a 175% increase. Quartz sand abrasion was more severe under low flow velocities, while higher velocities promoted surface smoothing through scratch remediation. In comparison, seawater flushing alone caused significantly less roughness development, confirming that sediment particles are the primary driver of accelerated surface damage.
(4).
Sediment erosion led to significant deterioration in the coating’s antifouling performance, with an 11.9% reduction in antibacterial rate and a 14.6% decrease in algal inhibition rate. In contrast, artificial seawater flushing alone resulted in only a 1.2% decline. These results demonstrate that the introduction of sediment under erosion conditions more substantially compromises the coating’s antifouling properties than variations in seawater flow velocity alone.

Author Contributions

Conceptualization, P.Z.; Formal analysis, C.L.; Data curation, W.C.; Writing—original draft, C.L.; Writing—review & editing, C.L.; Funding acquisition, L.J. and S.C. All authors have read and agreed to the published version of the manuscript.

Funding

This research was funded by National Key R&D Program of China (2022YFB3207400).

Data Availability Statement

Data are contained within the article.

Conflicts of Interest

Author Jiao Liang was employed by the company Jiangsu Donghua Testing Technology Co. The remaining authors declare that the research was conducted in the absence of any commercial or financial relationships that could be construed as a potential conflict of interest.

References

  1. Niu, S.; Wu, Y.L.; Xu, B.; Zhu, Z.; Pang, Q.; Fang, Y. Design of safety early warning and monitoring system for smart urban ports. Internet Things Technol. 2023, 13, 21–23. (In Chinese) [Google Scholar]
  2. Wu, Z.W.; Zhou, H.Y.; Lü, F. Anti-biofouling technologies for marine observation instruments. Ocean Eng. 2017, 35, 110–117. (In Chinese) [Google Scholar]
  3. Yebra, D.M.; Kiil, S.; Dam-Johansen, K. Antifouling technology—Past, present and future steps towards efficient and environmentally friendly antifouling coatings. Prog. Org. Coat. 2003, 50, 75–104. [Google Scholar] [CrossRef]
  4. Wang, L.; Lin, C.G.; Su, Y.; Ding, K.; Guo, M. Biofouling and corrosion performance of ship copper materials in typical marine areas. Equip. Environ. Eng. 2021, 18, 52–58. (In Chinese) [Google Scholar]
  5. Chaudhari, C. Adhesion of fouling organisms and its prevention technique. Int. J. Adv. Res. Ideas Innov. Technol. 2017, 3, 427–440. [Google Scholar]
  6. Zhang, J.B.; Sun, M.S.; Wan, R. Research progress in biofouling control technologies for marine fishery equipment. J. Fish. Sci. China 2021, 28, 1489–1503. (In Chinese) [Google Scholar]
  7. Zhang, M.M.; Zhao, W.; Yu, S.C. Research overview of marine fouling organisms in China. Fish. Sci. 2008, 27, 545–549. (In Chinese) [Google Scholar]
  8. Ren, Z. Research on Anti-Fouling Technology for Offshore Pastures Based on Ultrasonic Cavitation Effect. Master’s Thesis, Dalian University of Technology, Dalian, China, 2021. (In Chinese) [Google Scholar] [CrossRef]
  9. Lan, H.; Li, H.Z.; Wang, L.; Xu, P.; Wu, S.; Zhang, T. Design and testing of an ultraviolet-based anti-biofouling device for CTD sensors. Adv. Mar. Sci. 2019, 37, 332–341. (In Chinese) [Google Scholar]
  10. Lu, Y.Y.; Wu, J.H.; Sun, M.X.; Cui, Y.; Chen, G. Marine biofouling prevention: New advances in electrolytic antifouling technology. Corros. Prot. 2001, 530–534. (In Chinese) [Google Scholar]
  11. Jalaie, A.; Afshaar, A.; Mousavi, S.B.; Heidari, M. Investigation of the release rate of biocide and corrosion resistance of vinyl-, acrylic-, and epoxy-based antifouling paints on steel in marine infrastructures. Polymers 2023, 15, 3948. [Google Scholar] [CrossRef]
  12. Anisimov, V.A.; Mikhailova, A.M.; Uvarova, A.E. Modern approaches to the development of marine antifouling coatings. Inorg. Mater. Appl. Res. 2019, 10, 1384–1389. [Google Scholar] [CrossRef]
  13. Zhou, Y.B.; Wang, X.J.; Zhang, K.; Cong, W.; Liu, S.; Gui, T. Preparation and performance evaluation of long-term antifouling coating with low-temperature resistance and high toughness. Mater. Rev. 2022, 36 (Suppl. S2), 486–490. (In Chinese) [Google Scholar]
  14. Zhang, J.B.; Zhang, C.Y.; Sun, L.; Yu, B.; Yang, W.; Pei, X.; Cai, M.; Zhou, F. Effect of silicone self-lubricating components on antifouling and drag reduction properties of self-polishing coatings. Surf. Technol. 2022, 51, 274–282. (In Chinese) [Google Scholar]
  15. Liu, C.; Ma, C.; Xie, Q.; Zhang, G. Self-repairing silicone coatings for marine anti-biofouling. J. Mater. Chem. A 2017, 5, 15855–15861. [Google Scholar] [CrossRef]
  16. Ye, Z.J.; Chen, S.S.; Zhang, J.W.; Lin, C.; Ma, C.; Zhang, G.; Wu, J. Research progress in application of silicone and fluorinated resins in marine antifouling coatings. Paint Coat. Ind. 2018, 48, 75–82. [Google Scholar]
  17. Jeon, J.H.; Park, Y.G.; Lee, Y.H.; Lee, D.; Kim, H. Preparation and properties of UV-curable fluorinated polyurethane acrylates containing crosslinkable vinyl methacrylate for antifouling coatings. J. Appl. Polym. Sci. 2015, 132, 42168–42176. [Google Scholar] [CrossRef]
  18. Mielczarski, J.A.; Mielczarski, E.; Galli, G.; Morelli, A.; Martinelli, E.; Chiellini, E. The surface-segregated nanostructure of fluorinated copolymer–poly (dimethylsiloxane) blend films. Langmuir 2010, 26, 2871–2876. [Google Scholar] [CrossRef] [PubMed]
  19. Li, Y.; Wang, G.; Guo, Z.; Wang, P.; Wang, A. Preparation of microcapsules coating and the study of their bionic anti-fouling performance. Materials 2020, 13, 1669. [Google Scholar] [CrossRef]
  20. Jin, H.; Tian, L.; Bing, W.; Zhao, J.; Ren, L. Bioinspired marine antifouling coatings: Status, prospects, and future. Prog. Mater. Sci. 2022, 124, 100889. [Google Scholar] [CrossRef]
  21. Huang, Y.; Wang, Z.; Chen, T. Bio-inspired surfaces for fouling resistance. Front. Soc. Sci. Technol. 2020, 2, 221–232. [Google Scholar]
  22. Guo, H.S.; Liu, X.M.; Zhao, W.Q.; Xie, C.; Zhu, Y.; Wen, C.; Li, Q.; Sui, X.; Yang, J.; Zhang, L. A polyvinylpyrrolidone-based surface-active copolymer for an effective marine antifouling coating. Prog. Org. Coat. 2021, 150, 105975. [Google Scholar] [CrossRef]
  23. Olsen, S.M.; Pedersen, L.T.; Laursen, M.H.; Kiil, S.; Dam-Johansen, K. Enzyme-based antifouling coatings: A review. Biofouling 2007, 23, 369–383. [Google Scholar] [CrossRef] [PubMed]
  24. Tasso, M.; Pettitt, M.E.; Cordeiro, A.L.; Callow, M.E.; Callow, J.A.; Werner, C. Antifouling potential of Subtilisin A immobilized onto maleic anhydride copolymer thin films. Biofouling 2009, 25, 505–516. [Google Scholar] [CrossRef] [PubMed]
  25. Zhao, W.; Wu, Z.; Liu, Y.; Dai, P.; Hai, G.; Liu, F.; Shang, Y.; Cao, Z.; Yang, W. Research progress of natural products and their derivatives in marine antifouling. Materials 2023, 16, 6190. [Google Scholar] [CrossRef]
  26. Chen, L.; Duan, Y.; Cui, M.; Huang, R.; Su, R.; Qi, W.; He, Z. Biomimetic surface coatings for marine antifouling: Natural antifoulants, synthetic polymers and surface microtopography. Sci. Total Environ. 2021, 766, 144469. [Google Scholar] [CrossRef] [PubMed]
  27. Gu, Y.; Yu, L.; Mou, J.; Wu, D.; Xu, M.; Zhou, P.; Ren, Y. Research strategies to develop environmentally friendly marine antifouling coatings. Mar. Drugs 2020, 18, 371. [Google Scholar] [CrossRef]
  28. Bodkhe, R.B.; Stafslien, S.J.; Daniels, J.; Cilz, N.; Muelhberg, A.J.; Thompson, S.E.; Callow, M.E.; Callow, J.A.; Webster, D.C. Zwitterionic siloxane-polyurethane fouling-release coatings. Prog. Org. Coat. 2015, 78, 369–380. [Google Scholar] [CrossRef]
  29. Li, J.X.; Wang, Z.Q.; Chen, L.; Chen, H. Research progress in anti-biofouling coating materials for hydraulic engineering. J. Yangtze River Sci. Res. Inst. 2016, 33, 125–130. (In Chinese) [Google Scholar]
  30. Liu, S.J.; Ma, X.; Luan, Y.S.; Sun, X.; Wang, J.; Zhou, X.; Sui, X.; Ma, X.; Xia, C. Performance study of acrylic antifouling coatings modified with KH-570 functionalized nano-TiO2. Paint Coat. Ind. 2015, 45, 14–18. (In Chinese) [Google Scholar]
  31. Zhang, D.; Zhao, S.; Rong, Z.; Zhang, K.; Gao, C.; Wu, Y.; Liu, Y. Silicone low surface energy antifouling coating modified by zwitterionic side chains with strong substrate adhesion. Eur. Polym. J. 2022, 179, 111529. [Google Scholar] [CrossRef]
  32. Lin, Y.; Xie, Y.; Chen, F.; Gong, S.; Yang, W.; Liang, X.; Lian, Y.; Chen, J.; Wei, F.; Bai, W.; et al. Bioinspired self-stratification fouling release silicone coating with strong adhesion to substrate. Chem. Eng. J. 2022, 446, 137043. [Google Scholar] [CrossRef]
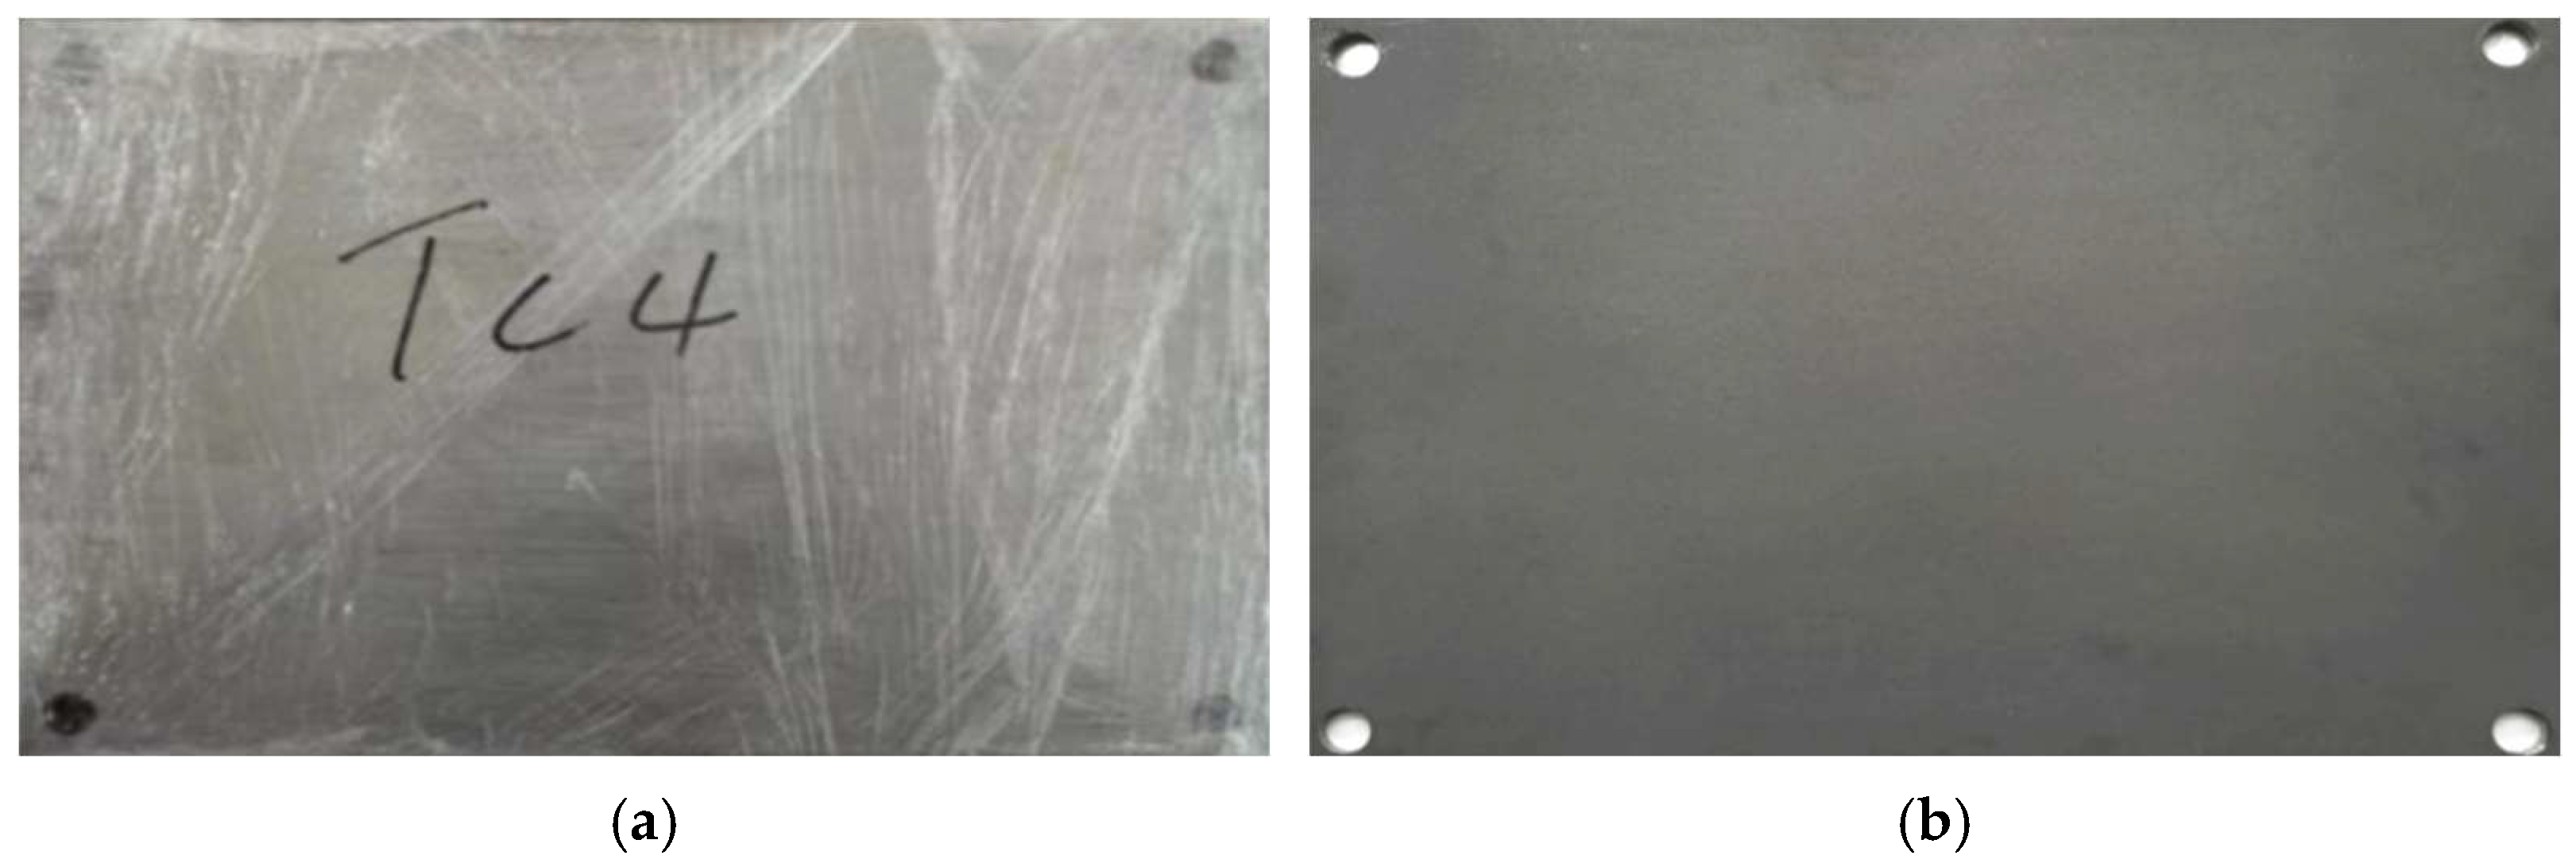
Figure 1. TC4 titanium alloy specimen before and after abrasive blasting treatment. (a) before sandblastung; (b) after sandblastung.
Coatings 15 01353 g001
Figure 2. Schematic diagram of the antifouling coating preparation process.
Coatings 15 01353 g002
Figure 3. Schematic diagram of X-cut adhesion testing. (a) cutting intersecting lines; (b) tear-off tape.
Coatings 15 01353 g003
Figure 4. Schematic diagram of impact resistance testing. (a) heavy hammer drop; (b) coating failure.
Coatings 15 01353 g004
Figure 5. Schematic diagram of film hardness measurement. (a) pencil load application; (b) scratch diagram.
Coatings 15 01353 g005
Figure 6. Schematic diagram of water contact angle measurement. (a) experiment preparation; (b) droplet transfer.
Coatings 15 01353 g006
Figure 7. Schematic diagram of roughness testing under strong wet-dry alternation conditions. (a) roughness measurement; (b) 3D topographical image.
Coatings 15 01353 g007
Figure 8. Variation in adhesion strength of antifouling coatings under erosion conditions.
Coatings 15 01353 g008
Figure 9. Variation in water contact angle over time under erosion conditions.
Coatings 15 01353 g009
Figure 10. Temporal evolution of arithmetic mean roughness (Ra) for antifouling coatings under erosion conditions.
Coatings 15 01353 g010
Figure 11. Surface roughness variation in coating samples before and after erosion testing.
Coatings 15 01353 g011
Figure 12. Comparative changes in antibacterial and algal inhibition performance before and after sediment erosion tests.
Coatings 15 01353 g012
Table 1. Anti-Fouling Coating Compatibility Chart.
ItemEpoxy PrimerSealing AdhesiveOrganosilicon
Antifouling Paint
Total Wet Film Thickness/μm147175143
Total dry film thickness/μm100100200
EffectEnhance coating adhesionPrevent substrate permeationAnti-biofouling
Table 2. Sediment scouring test protocol.
Working
Conditions
Total Duration (Days)Number of
Scouring Cycles
Per Cycle (Days)Artificial Seawater Flow Velocity (m/s)Sediment
Concentration (kg/m3)
Case1-v3.0c03031030
Case2-v1.5c1.4303101.51.4
Case3-v3.0c1.4303103.01.4
Table 3. Variation in pull-off adhesion strength reduction under erosion conditions.
Operating ConditionDays
10 Days20 Days30 Days
Case1-v3.0c020.86%20.86%30.94%
Case2-v1.5c1.436.17%40.43%48.94%
Case3-v3.0c1.441.01%45.32%49.64%
Table 4. Variation in impact resistance test results under erosion conditions.
Operating ConditionDays
10 Days20 Days30 Days
Case1-v3.0c0<5 cm<5 cm<5 cm
Case2-v1.5c1.4<5 cm<5 cm<5 cm
Case3-v3.0c1.4<5 cm<5 cm<5 cm
Table 5. Variation in hardness test results under erosion conditions.
Operating ConditionDays
10 Days20 Days30 Days
Case1-v3.0c0<9B<9B<9B
Case2-v1.5c1.4<9B<9B<9B
Case3-v3.0c1.4<9B<9B<9B
Table 6. Variation in contact angles under erosion conditions.
Operating
Condition
Test LiquidDays
10 Days20 Days30 Days
Case1-v3.0c0water105.2°104.6°104.1°
diiodomethane78.7°78.5°77.6°
Case2-v1.5c1.4water105.4°102.2°100.4°
diiodomethane78.6°77.3°75.7°
Case3-v3.0c1.4water102.4°100.9°99.6°
diiodomethane77.6°75.4°74.2°
Disclaimer/Publisher’s Note: The statements, opinions and data contained in all publications are solely those of the individual author(s) and contributor(s) and not of MDPI and/or the editor(s). MDPI and/or the editor(s) disclaim responsibility for any injury to people or property resulting from any ideas, methods, instructions or products referred to in the content.