Article

Surface Modification of AZ31 Mg Alloy Based on PLA or PLGA with Caffeic Acid for Bioengineering Applications

1
Faculty of Materials Science and Ceramics, AGH University of Krakow, A. Mickiewicza Av. 30, 30-059 Kraków, Poland
2
Institute of Machine Tools and Production Engineering, Lodz University of Technology, Stefanowskiego Str. 1/15, 90-924 Łódź, Poland
3
Faculty of Chemistry, Jagiellonian University, Gronostajowa 2, 30-387 Kraków, Poland
4
Faculty of Materials Engineering and Physics, Cracow University of Technology, Warszawska 24, 31-155 Kraków, Poland
*
Author to whom correspondence should be addressed.
Coatings 2025, 15(11), 1309; https://doi.org/10.3390/coatings15111309
Submission received: 28 September 2025 / Revised: 29 October 2025 / Accepted: 6 November 2025 / Published: 10 November 2025
(This article belongs to the Special Issue Recent Advances in Surface Functionalisation, 2nd Edition)

Abstract

The study is focused on the technology for surface modification of AZ31 magnesium alloy for biomedical applications, in particular in implantology. The experimental procedure consists of intentional stages that involve chemical treatment in piranha solution, plasma chemical activation of the alloy surface using Ar and O2 as gaseous precursors, and biopolymer coatings deposition—based on polylactic acid (PLA) and poly(lactic-co-glycolic acid) (PLGA) with the addition of caffeic acid—utilizing the immersion method. In the course of the experiment, the validity of the investigated technology of surface modification of AZ31 magnesium alloy was confirmed. The pre-treatment step guaranteed obtaining a higher surface roughness, resulting in homogeneous and stable biopolymer coatings with proper adhesion to the substrate. Moreover, the corrosion studies conducted confirmed better corrosion behaviour of the modified samples in SBF corrosive medium, and no significant release of the alloy-related ions was observed. Furthermore, the biopolymer coatings ensured non-cytotoxicity towards the MG-63 cell line and promoted cell proliferation with proper morphology. Based on the obtained results, it may be concluded that the proposed technology can be treated as an interesting and promising surface-engineering strategy for implantology and biodegradable materials applications.

1. Introduction

Metallic implants have been used in several fields of biomedicine [1,2]. The interest in the application of metals for the construction of implants results from their numerous advantages, especially high mechanical strengths, easy shaping, and relatively good biocompatibility. However, the high modulus of elasticity and the ability to release metal ions in biological environments create problems with the use of metals and alloys in implantology [1,3,4]. A special class of metallic materials designated for medical implants are biodegradable alloys designed to degrade naturally in biological environments. They may be used for the construction of medical implants, where temporary support is needed without long-term presence in the body [5,6,7]. Among different biodegradable metals, magnesium, zinc, and iron are relatively biocompatible and non-toxic in general terms [8]. Over the last decade, magnesium-based biodegradable alloys such as AZ31, AM50, and AZ91 have attracted attention as potentially suitable for biomaterials in orthopedic applications [9,10]. Their density and mechanical properties are close to those of natural bone, and in a body fluid, they degrade, producing generally biocompatible magnesium products (magnesium cations, hydroxide, carbonate, oxide, chloride, sulphate and phosphate), which are beneficial for use in biomedical applications [11,12,13,14]. The other products of the degradation process depend on the alloying elements, like Zn or Ca. The human body stores magnesium mainly (~67%) in the skeleton in the form of apatite crystals [15]. In the body, magnesium plays an important role in biochemical reactions, metabolic and some physicochemical processes involving ribonucleic acid (RNA) [16,17,18], and in the functioning of nerves, muscles, and the immune system [19]. The rate of magnesium release from a Mg-alloy should be carefully controlled so as not to allow tissue inflammation in the case of an excessive local concentration of this element. Insoluble magnesium hydroxide, Mg(OH)2, in a chloride-containing fluid can be transformed into soluble magnesium chloride, MgCl2 [20]. The rapid degradation of a Mg-alloy component of an implant endangers the implant’s mechanical stability prior to tissue regeneration. An additional problem with the release of magnesium is exhaled hydrogen (1 L H2/1 g Mg), badly influencing tissue repair and osteointegration in cases of its local excess [21].
Different solutions have been proposed to minimize the degradation rate of the Mg-alloy-based implants, including the modification of their elemental compositions [22] or surface modification [23,24]. The latter is particularly attractive, with approaches ranging from inorganic coatings (e.g., hydroxyapatite, conversion coatings) to organic layers, such as biodegradable polymers like polylactide (PLA) and poly(lactide-co-glycolide) (PLGA) [25,26]. However, a key challenge frequently reported in the literature is achieving long-term stability and sufficient adhesion for polymer coatings on magnesium alloys. The inherent reactivity of magnesium leads to the rapid formation of a non-uniform and loosely adherent native oxide layer. This weak interface often results in premature coating delamination and localized corrosion initiation, compromising the implant’s protective function [27]. Therefore, a robust and reproducible preliminary surface activation method is essential to ensure a strong interfacial bond between the Mg substrate and the subsequent polymer layer.
In this study, the surface of AZ31 magnesium alloy was modified to improve its suitability for orthopedic implants. The work focused on a preliminary plasmochemical and Piranha solution treatment, followed by the deposition of various biopolymer coatings: polylactide (PLA), polylactide with caffeic acid (PLA + CA), polyglycolide (PLGA), and poly(lactide-co-glycolide) with caffeic acid (PLGA + CA). To address the challenge of poor adhesion and to maximize the performance of subsequent polymer coatings, we specifically selected a dual-step preliminary treatment: the Piranha solution treatment combined with subsequent plasmochemical activation. The Piranha solution (a mixture of sulfuric acid and hydrogen peroxide) is utilized for its aggressive and reliable chemical etching capabilities, which ensure the complete removal of the irregular and weak native oxide layer, thereby providing a chemically uniform and highly clean Mg alloy surface. Following this, the plasmochemical treatment is applied to generate high-energy active sites and surface roughness. This dual effect—creating micro-scale mechanical anchoring points and introducing polar functional groups (e.g., hydroxyl, carbonyl)—is critical for maximizing both the physical interlocking and chemical bonding of the biopolymer coatings (PLA/PLGA) to the substrate [28,29]. This novel, sequential dual-step approach is specifically designed to produce an optimally prepared surface, essential for achieving the required long-term mechanical integrity and stability of the implant. The bioactive agent, caffeic acid (CA), was incorporated into the biopolymer coatings based on the hypothesis that its potent antioxidant and anti-inflammatory properties will locally mitigate the adverse effects (oxidative stress and inflammation) associated with the early, rapid degradation of the magnesium substrate, thereby fostering a tissue microenvironment more favourable for osseointegration and healing. The primary novelty of this work lies in the successful combination of this unique, sequential dual-step (Piranha etching followed by plasmochemical activation) preliminary surface treatment, which guarantees robust polymer adhesion, with the incorporation of bioactive caffeic acid (CA) into the biopolymer coatings (PLA/PLGA) to enhance biofunctionality, biocompatibility, and corrosion resistance.

2. Materials and Methods

2.1. Samples Preparation and Surface Modification

In the experimental procedure, the surface of AZ31 magnesium alloys was modified by chemical treatment in Piranha solution, plasmochemical activation by using Ar and O2 as a gaseous mixture, and, subsequently, we obtained biopolymer layers based on PLA (polylactic acid, Sigma-Aldrich, St. Louis, MO, USA, product no. 38534) and PLGA (polylactic-co-glycolic acid, Lactide:Glycolide—50:50, Sigma-Aldrich, product no. 937754) as well as caffeic acid (Sigma-Aldrich, product no. C0625). High-purity AZ31 magnesium alloy was sourced from GoodFellow Cambridge Ltd. (Huntingdon, UK) with the average chemical composition given in Table 1.
The selected physical and mechanical parameters of the alloy according to the manufacturer’s material sheet are as follows: density—1.77 g/cm3; tensile strength—260 MPa; yield strength—200 MPa; Young’s modulus—45 GPa.
A rod of AZ31 alloy (diameter 11 mm) was cut into discs, 2 mm thick each using Wire Electrical Discharge Machining (WEDM). For each experimental series (W0–W5), twenty brand new samples were obtained. The grinding and polishing of the samples were performed on a Phoenix Beta 2 grinder-polisher (Wirtz Buehler, Ostfildern, Germany) with different grades of SiC waterproof abrasive papers (#600 and #1200), polished using diamond paste with grain size 3 μm, and then by Al2O3 emulsion (grain size 0.05 μm). Non-destructive tests were prioritized and performed first on randomly selected samples from each series. All primary characterization experiments (e.g., surface morphology, mechanical testing, corrosion studies), unless otherwise specified, were repeated a minimum of three times using either a new measurement location on the same sample (for surface analysis) or a completely new sample from the same series (for destructive tests).
The second treatment step involved activating the surface in Piranha solution (NH3 aq. 25%:H2O2 30%:dH2O in a volume ratio of 1:5:5). The reagents, ammonia (NH3 aq., 25% NH3 in H2O, ≥99.99%) and hydrogen peroxide (H2O2, 30% pure p.a.) were purchased from Sigma-Aldrich and Chempure, respectively. All of the above reagents can be used without further purification. Each sample was submerged for 20 min. at a constant temperature of 70 °C.
For the next stage of activation, the plasma treatment was realized in RF CVD system (13.56 MHz, Elettrorava S.p.A., Turin, Italy). The process was performed over 90 min using a gas mixture of oxygen and argon, mixed in a flow ratio of 19:1, at a pressure of 0.8 Tr, a plasma density of 0.8 W/cm2, and under room temperature conditions. The series of samples, after activation by chemical and plasmochemical treatment, was designated W1.
A further third step involved obtaining layers of biopolymers, including PLA and PLGA. To obtain 4% biopolymer solutions, 1.00 g of each biopolymer was placed in separate beakers, which were then flooded with 24 mL of chloroform. The beakers were then placed on a magnetic stirrer and stirred for 90 min to obtain a homogeneous solution. A 1 mM caffeic acid solution was prepared 48 h before the modification by dissolving 0.0036 g of acid in 20 mL of ethanol. To obtain the caffeic acid biopolymer solution, 9.9 mL of PLA and PLGA solution were taken into separate beakers, and 0.1 mL of caffeic acid was added to each beaker. The beakers were then placed on a magnetic stirrer and stirred for 90 min to obtain a homogeneous solution.
The pre-treated and surface-activated substrates were placed in sterile 12-well cell culture plates and then flooded with 2 mL of solutions of 4% PLA (W2), 4% PLA with 1 mM caffeic acid in a 10:1 volume ratio (W3), 4% PLGA (W4), and 4% PLGA with 1 mM caffeic acid in a 10:1 volume ratio (W5). The scratch tests were specifically conducted twice, each time on a different, randomly selected sample from the appropriate series (W2–W5). The entire series is summarized in Table 2, with physical photos of samples (Figure S1, Supplementary Material).
The process of obtaining the biopolymer layers was carried out by immersion, over a period of 15 min. Then, after the process, in order to neutralize the surface of the modified samples, they were washed three times, alternately in 4% NaOH and distilled water.

2.2. Surface Analysis

The microstructure and chemical composition of unmodified and modified samples were examined using scanning electron microscopy (FEI Nova NanoSEM 200, Hillsboro, OR, USA) with energy dispersive spectrometry analysis (EDS) (EDAX Inc., Mahwah, NJ, USA). Structural properties of samples were investigated by means of Fourier transform infrared spectroscopy (Bruker Vertex 70V, Bruker Corp. Billerica, MA, USA), using the Attenuated Total Reflectance method (FTIR-ATR). The FTIR spectra were measured within a 400–4000 cm−1 range with a 4 cm−1 resolution. Chemical structure studies of samples were performed using a LabRAM HR UV-VIS-NIR Raman spectroscope (Horiba, Kyoto, Japan) with a 488 nm laser, a wavelength range of 50 ÷ 4000 cm−1, a scan number of 120, and a resolution of 3 cm−1. An Olympus BX-41 confocal optical microscope (Olympus Microscope, Tokyo, Japan) was used to observe the samples.
Surface roughness testing of samples was carried out using an Alpha Step IQ optical profilometer (KLA-Tencor Corp. (Milpitas, CA, USA)). Five independent linear scans with a measurement path length of 500 μm were performed for each test sample.
The contact angles were measured by the sessile drop method using the automatic drop shape analysis system DSA 10 Mk2 (KRÜSS GmbH, Hamburg, Germany). Ultra-high-quality water (UHQ-water produced with the use of UHQ-PS, Elga, UK) and diiodomethane (Sigma Aldrich, Darmstadt, Germany) droplets with a volume of 1 μL were placed on each sample surface, and the contact angles were obtained by averaging the results of seven measurements for each liquid. Surface free energies (SFE) were calculated from contact angles using the Owens–Wendt–Rabel–Kaelble (OWRK) approach, which enables the dispersive (γd) and polar (γp) components of surface free energy to be obtained.

2.3. Mechanical and Tribological Tests

The scratch test of the samples was performed using an MST platform from Anton Parr GmbH (Graz, Austria) and a Rockwell M-181 diamond indenter with a radius of 100 µm. The loading force (critical load) was increased from 0.03 to 5 N at a speed of 1.99 N/m. Two scratches of 5 mm were made for each specimen.

2.4. Corrosion Test

The degree of degradation of the tested alloys was assessed after the immersion of the prepared samples in an SBF solution (Simulated Body Fluid) of the ionic composition given in Table 3 [30].
Samples of unmodified and modified AZ31 alloy, whose unmodified alloy surfaces (bottom and edges) were protected with epoxy adhesive, were placed in 50 mL of SBF solution at a constant temperature of 37 °C. After 1, 3, 7, and 14 days, respectively, 5 mL of solution was taken from each sample, and the cavity was replenished to a volume of 50 mL. The solution samples obtained after the tests were subjected to inductively coupled plasma mass spectrometry tests to determine the type and amount of ions released by corrosion processes.
The amount and type of ions released by the medium after the corrosion and biological tests of unmodified and modified AZ31 alloy samples were assessed using the ICP-MS method. Solutions collected from samples immersed in SBF after 1, 3, 7, and 14 days and the liquid medium after cytotoxicity tests (2 and 6 days) were analyzed. Assays were performed using an ELAN 6100 ICP-MS mass spectrometer from Perkin Elmer Corp. (Waltham, MS, USA).

2.5. Cumulative Release Profiles

The cumulative drug release (CDR) experiments were conducted by incubation films PLA + CA (W3) and PLGA + CA (W5), previously poured into the wells of a multi-well plate, in 1 mL of PBS. The plates were constantly shaken with a precisely set speed and at a temperature of 37 °C on the horizontal laboratory shaker. At the predetermined time intervals, 0.2 mL release medium was removed, and fresh medium with the same volume was added to the wells to maintain the initial volume. The amount of CA released from the films was determined using a Shimadzu Prominence-i LC-2030C 3D liquid chromatograph (Shimadzu Corporation, Kyoto, Japan). HPLC analysis was performed on a ZORBAX SB-Aq column (80Å, 5 µm, 4.6 × 150 mm) using a 30:70 (v:v) water-methanol solution as the applied eluent. The sample analysis time was 10 min, the flow rate was 0.5 mL/min, and the sample volume collected by the device was set to 20 µL. CA concentration was calculated on the basis of a calibration curve prepared separately for pure caffeic acid, analyzing the dependence of the absorbance maximum on its concentration at 254 nm and 320 nm. The data are presented as the average value of at least three independent experiments.
To comprehensively investigate the mechanism of CA release from the films, several theoretical models were employed for data modelling and fitting the experimental results. The collected in vitro release profiles were analyzed to determine how well they conformed to the predictions of the following kinetic models: first-order, Higuchi, Korsmeyer–Peppas, Hixson–Crowell, and Weibull. The fitting process for all these models was conducted via linear direct fitting. The quality of the fit was then assessed by examining goodness-of-fit statistical indicators, such as the sum of squares due to error (SSE) and the adjusted R-square (R2). This entire analysis, which involved fitting the graphs and calculating the statistics, was conducted using dedicated graph fitting software [31,32].

2.6. Biocompatibility Study

2.6.1. Cell Culture

The MG-63 osteosarcoma cell line (MG-63, ATCC® CRL-1427™) was cultured on standard polystyrene plates (NEST Biotechnology, Woodbridge, NJ, USA) in DMEM (Corning, ALAB, Warsaw, Poland) enriched with 10% FBS and 1% antibiotics (streptomycin/penicillin, Gibco-BRL Life Technologies, Darmstadt, Germany). Standard incubation conditions, 37 °C and 5% CO2, were used. The culture medium was refreshed every 2–3 days, and cells were split every 3–4 days when the monolayer reached about 90% confluence.

2.6.2. Cell Viability Assay

Substrates were sterilized immediately prior to use by sequential washing (three times in pure ethanol, three times in sterile PBS) followed by 20 min under UV light. The cells were seeded onto the substrates at a density of 50,000 cells per disc (50 × 103 cells/mL) in medium with 1% PBS and incubated at 37 °C, with daily medium replacement. To determine the effectiveness of the modified surfaces in promoting cell attachment, the number of adherent viable cells was quantified using a cytotoxicity assay. The Alamar Blue assay was conducted on days 2 and 4 to directly assess cell growth and viability. The assay involved incubating cells with resazurin sodium salt (0.2 mL of 7 mg/mL in PBS) for 2 h in the dark at 37 °C. Fluorescence was then measured at 605 nm (excitation 560 nm) using an Infinite 200 M PRO NanoQuant microplate reader. Cytotoxicity was expressed as the ratio of living cells on the test substrate (S) to the polystyrene control (S0). All tests were run at least three times, and data is presented as mean ± SD.

2.6.3. Visualization of Cell Attachment and Growth

In terms of proper attachment and growth on the investigated surfaces, after 4 days of incubation, MG-63 cells on the studied alloys were visualized under scanning electron microscope. The MG-63 cells were fixed with 2% glutaraldehyde (Sigma-Aldrich) followed by dehydration using graded ethanol (ranging from 20% to 100% (v/v)). The samples were then air-dried, gold sputter coated, and visualized using a FEI Nova NanoSEM 200.

2.6.4. Statistical Analysis

Statistical significance in the Alamar Blue and ALP assay results was determined via one-way ANOVA (p < 0.05) using Origin 2018 software (OriginLab Corporation, Northampton, MA, USA). Subsequent pairwise comparisons between the means were conducted using Tukey’s test (p < 0.05).

3. Results and Discussion

3.1. Chemical Structure of Obtained Coatings

The chemical structure of the obtained PLA- or PLGA-based structures on the surface of the AZ31 alloy was studied using mid-IR ATR spectroscopy (Attenuated Total Reflectance Infrared Spectroscopy), and the obtained results are presented in Figure 1.
In the case of the PLA-containing layers (W2 and W3 series), peaks around 700, 1747, and 1774 cm−1 can be associated with carbon-oxygen stretching vibrations in a C=O functional group typical for this polymer, while the peak at 757 cm−1 is attributed to C-C stretching vibrations of the crystalline region of PLA. A band at 3500 cm−1 can be associated with the stretching vibrations of OH groups. Peaks in the 2800–3100 cm−1 region are associated with carbon-hydrogen symmetric and antisymmetric stretching vibrations in -CH2 and -CH3 functional groups. A peak at 1454 cm−1 is due to the presence of symmetric and antisymmetric bending in the -CH3 functional groups [33]. A nearby band at 1492 cm−1 increases its intensity in the presence of caffeic acid, possibly due to stretching of the carbon–carbon single bond (C-C), characteristic of this compound. A similar dependence can be observed for the band at 1600 cm−1 corresponding to stretch vibrations of the carbon–carbon double bond (C=C) [34]. A band at 1363 cm−1 is connected with symmetric and antisymmetric bending in the carbon–hydrogen (-CH) in polylactide, and a band at 1269 cm−1 with bending vibration in the carbon–oxygen (C=O) double bond [33]. C-O-C stretching bands are in the range of 1047–1189 cm−1. A band at 868 cm−1 can be associated with the carbon–carbon single bonds (C-C), and a band at 757 cm−1 with deformation vibration in α-CH3 [33].
IR ATR spectra for PLGA (W4 and W5 series) contain an O-H band at around 3500 cm−1 and C-H bands in the 2800–3100 cm−1 region due to stretching vibrations in the -CH2 and -CH3 groups. The spectra show the presence of three bands in the C=O stretching regions: 700, 1747, and 1774 cm−1. Peaks at 1454 and 1492 cm−1 correspond with deformation vibrations of C-H bonds in the O-CH2 groups. The bands in the range of 1100–1300 cm−1 can be assigned to the asymmetric and antisymmetric stretching vibrations in the C-C(=O)-O groups and C-H bands in the 2800–3100 cm−1 region due to bending vibrations in the -CH2 and -CH3 groups. A characteristic band at 755 cm−1 is due to deformation vibrations in the α-CH3 groups [35,36]. In the case of PLGA, a similar influence of caffeic acid is observed in the IR spectra, with bands at 1492 and 1600 cm−1 increasing their intensity due to the presence of bending vibrations in the C-C and C=C bonds, respectively [34].
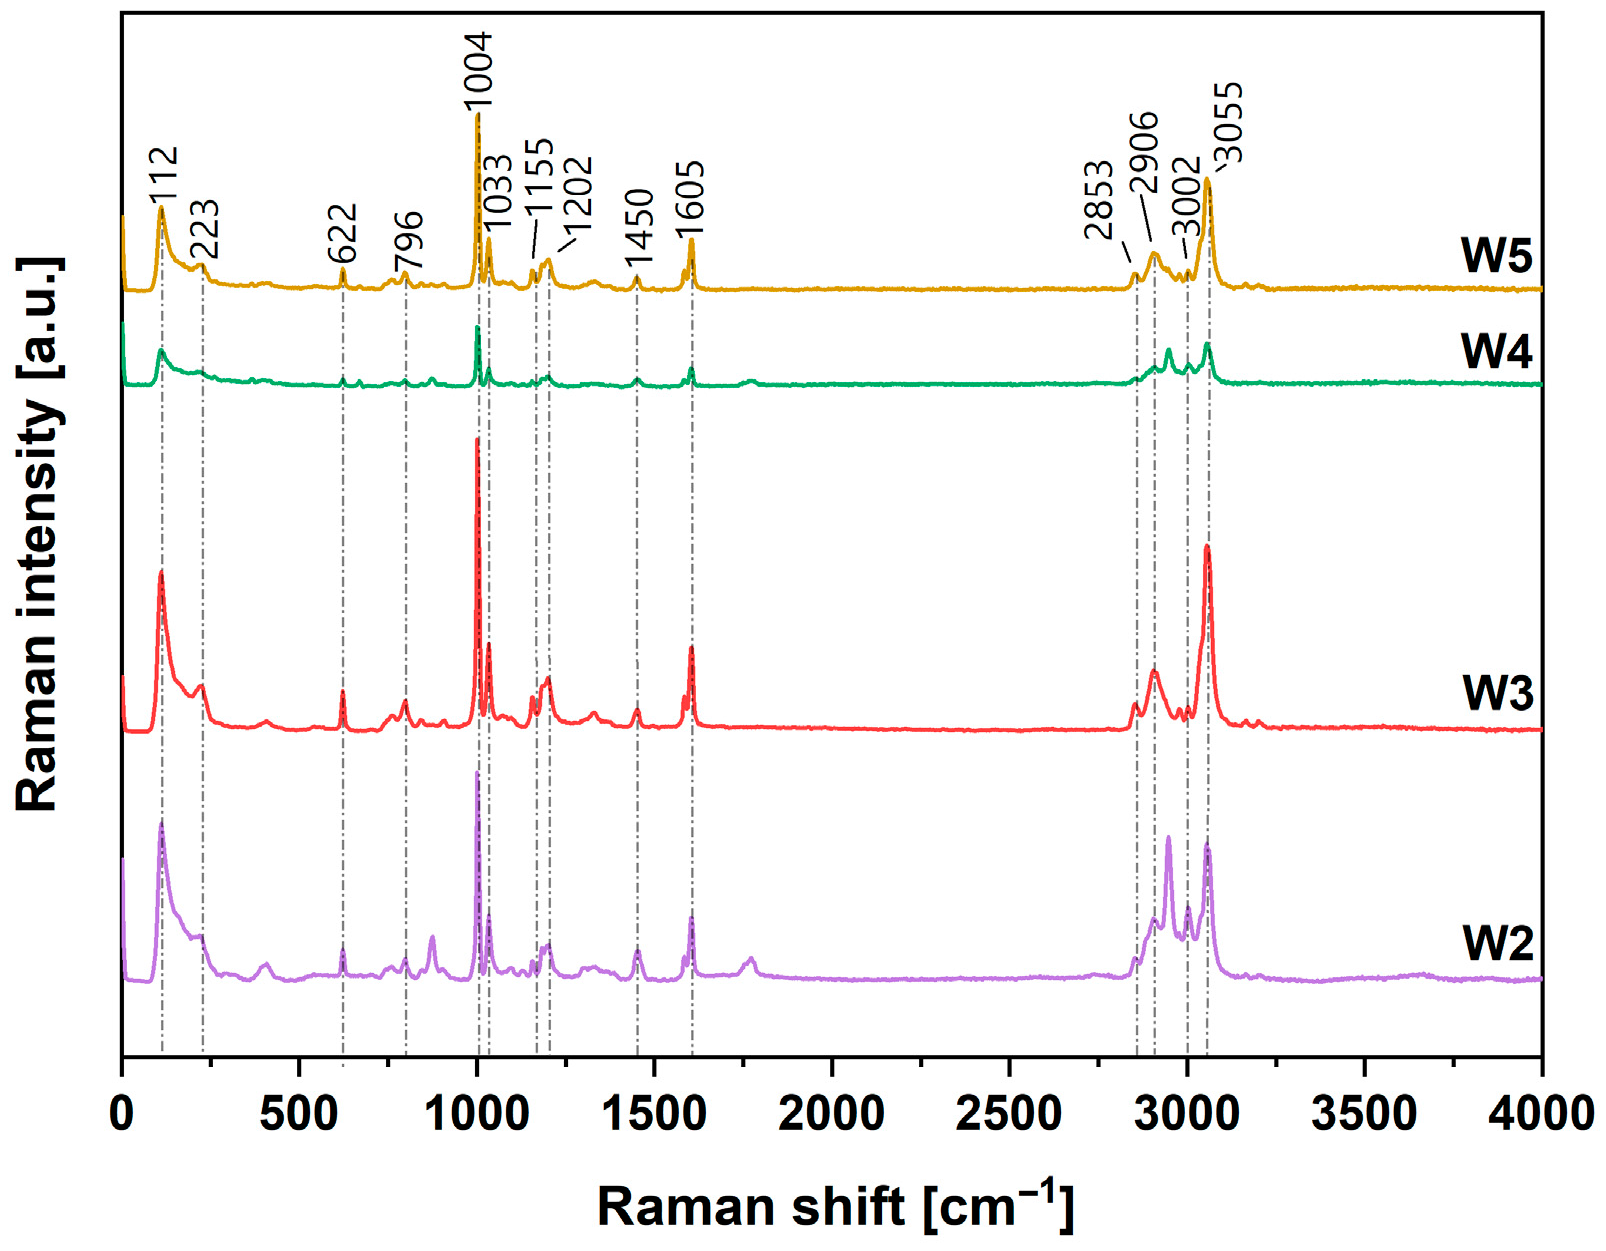
In addition to IR ATR spectroscopic investigations, Raman spectroscopy was applied to study the molecular structure of the obtained PLA- or PLGA-based structures on the surface of AZ31 alloy, and the results are shown in Figure 2.
The many bands visible in the obtained Raman spectra of PLA and PLGA (W3-W5 series) were also present in IR ATR spectra (Figure 1), as well as in the presence of caffeic acid in these surface structures [34]. One of the differences between the IR ATR and Raman spectra is the lack of bands corresponding to polar groups, which results in a smaller number of bands shown in the Raman spectra of the studied compounds [36]. Additionally, Raman spectroscopy revealed bands in the <500 cm−1 region: a CH3 band at 223 cm−1 due to twisting, and a C-C band at 112 cm−1 due to oscillations in the carbon–carbon single bonds [36].
The conducted mid-IR ATR and Raman spectroscopic studies confirmed the presence of atomic groups and bonds typical for PLA and PLGA. The admixture of caffeic acid to both biopolymers had no significant influence on the obtained spectra, only increasing the intensity of some peaks (1450 and 1605 cm−1), due to the increased number of C-C and C=C bonds in the coating structures and because IR spectra of pure PLA and PLGA draw parallels to that of pure caffeic acid (characteristic IR absorption bands exist at the same wavenumbers).

3.2. Microstructure and Chemical Composition

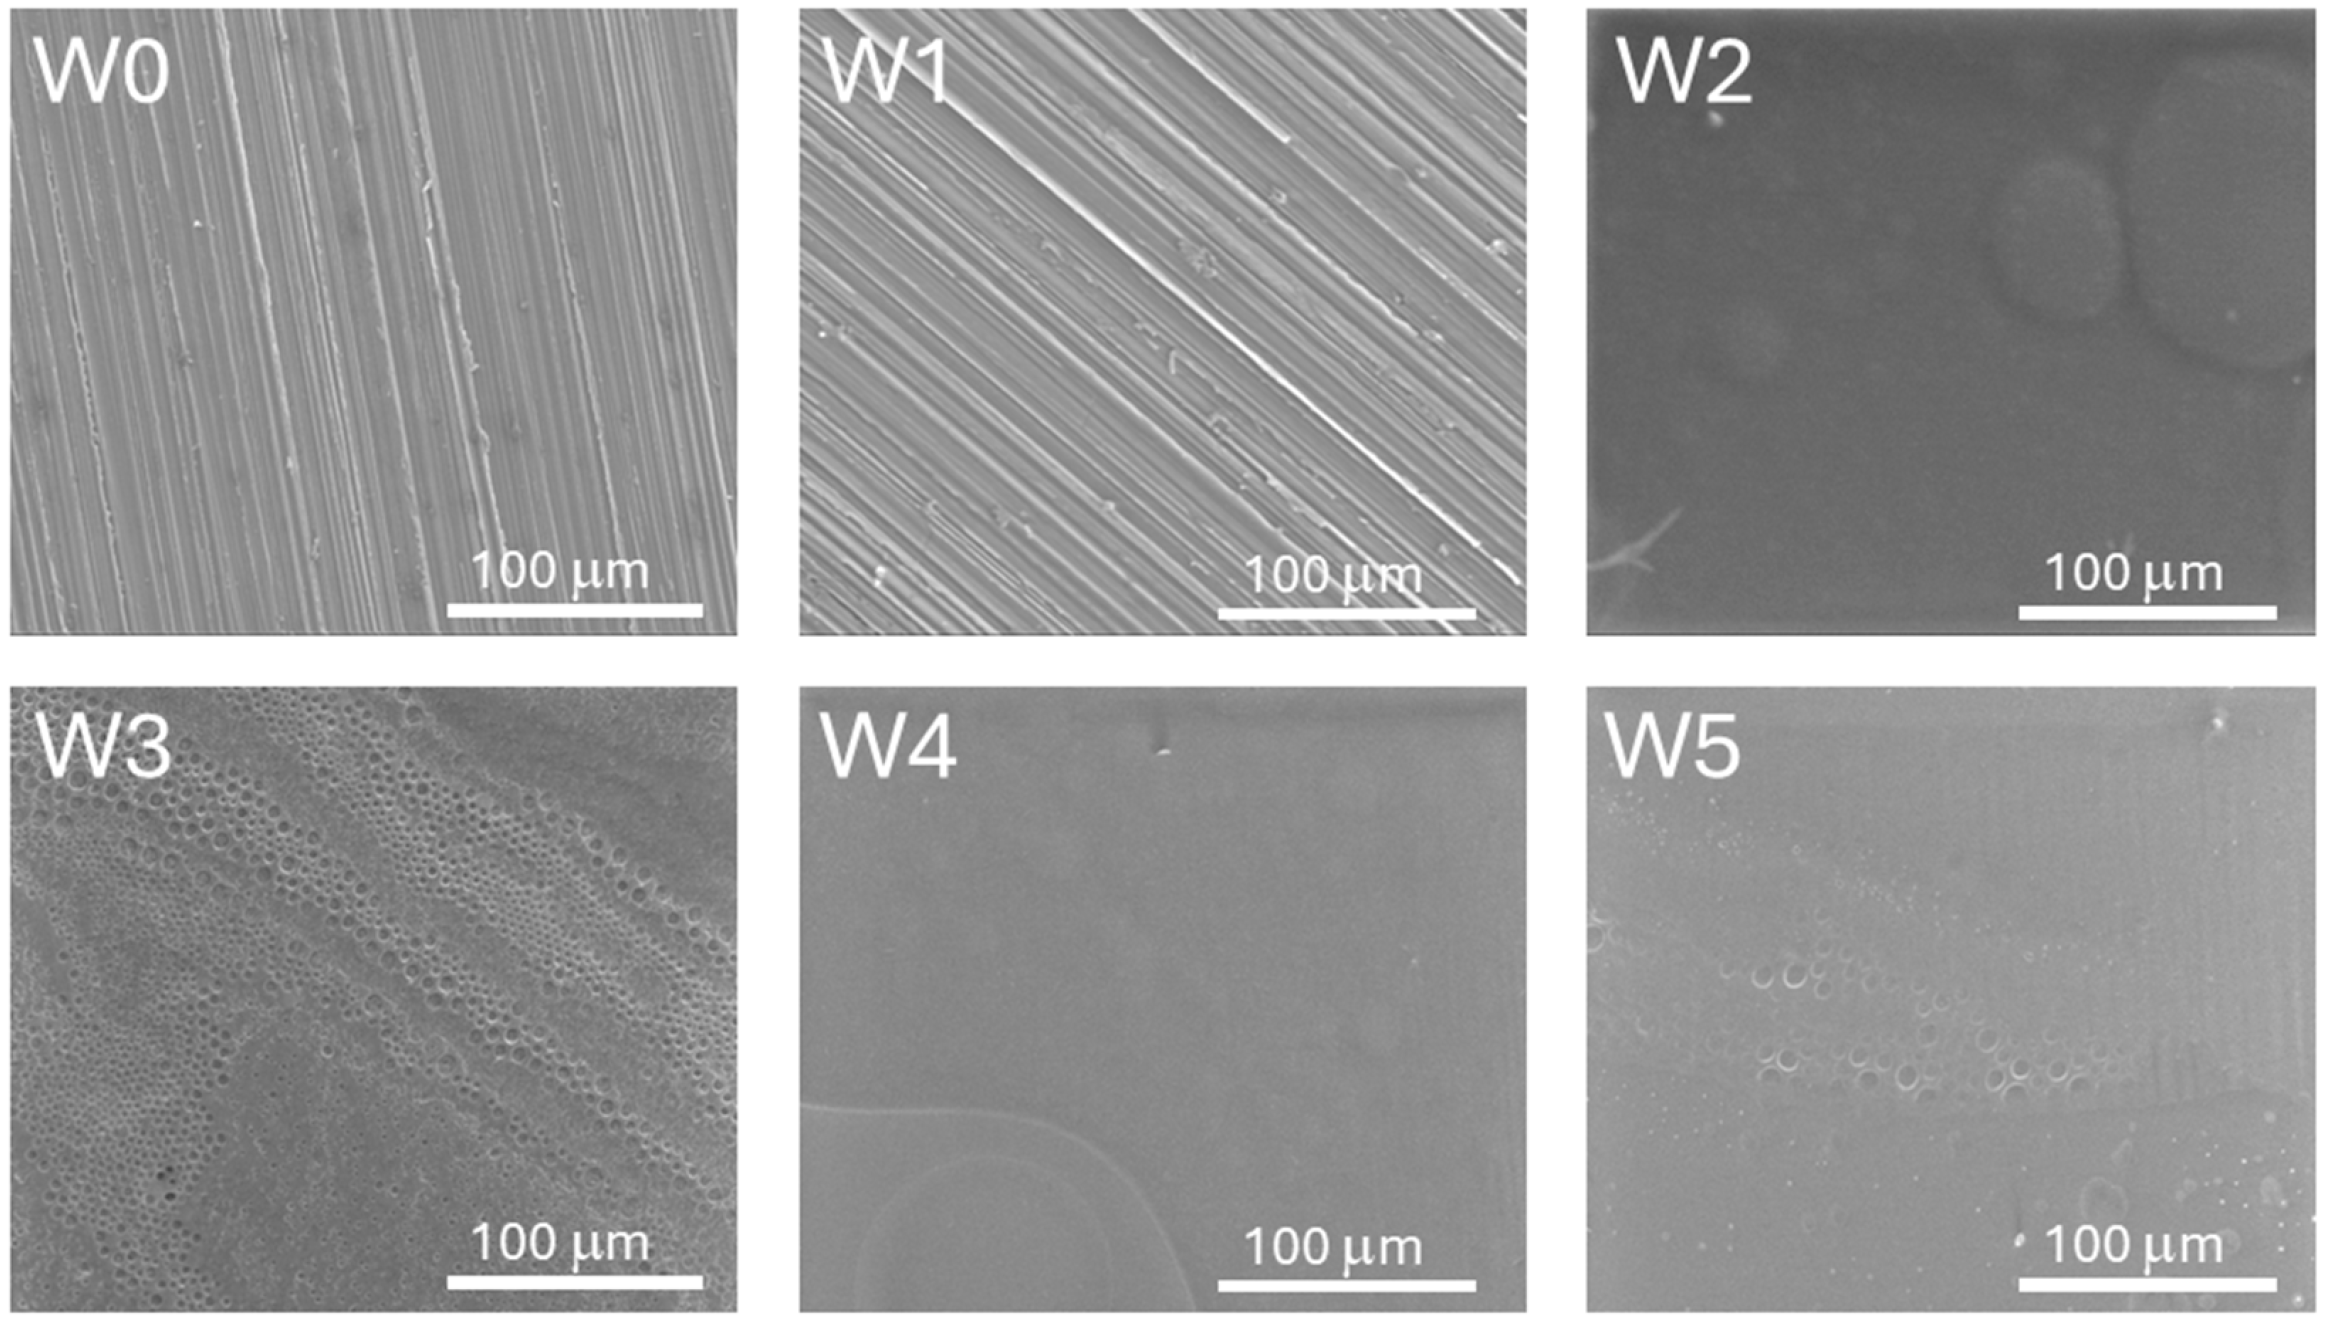
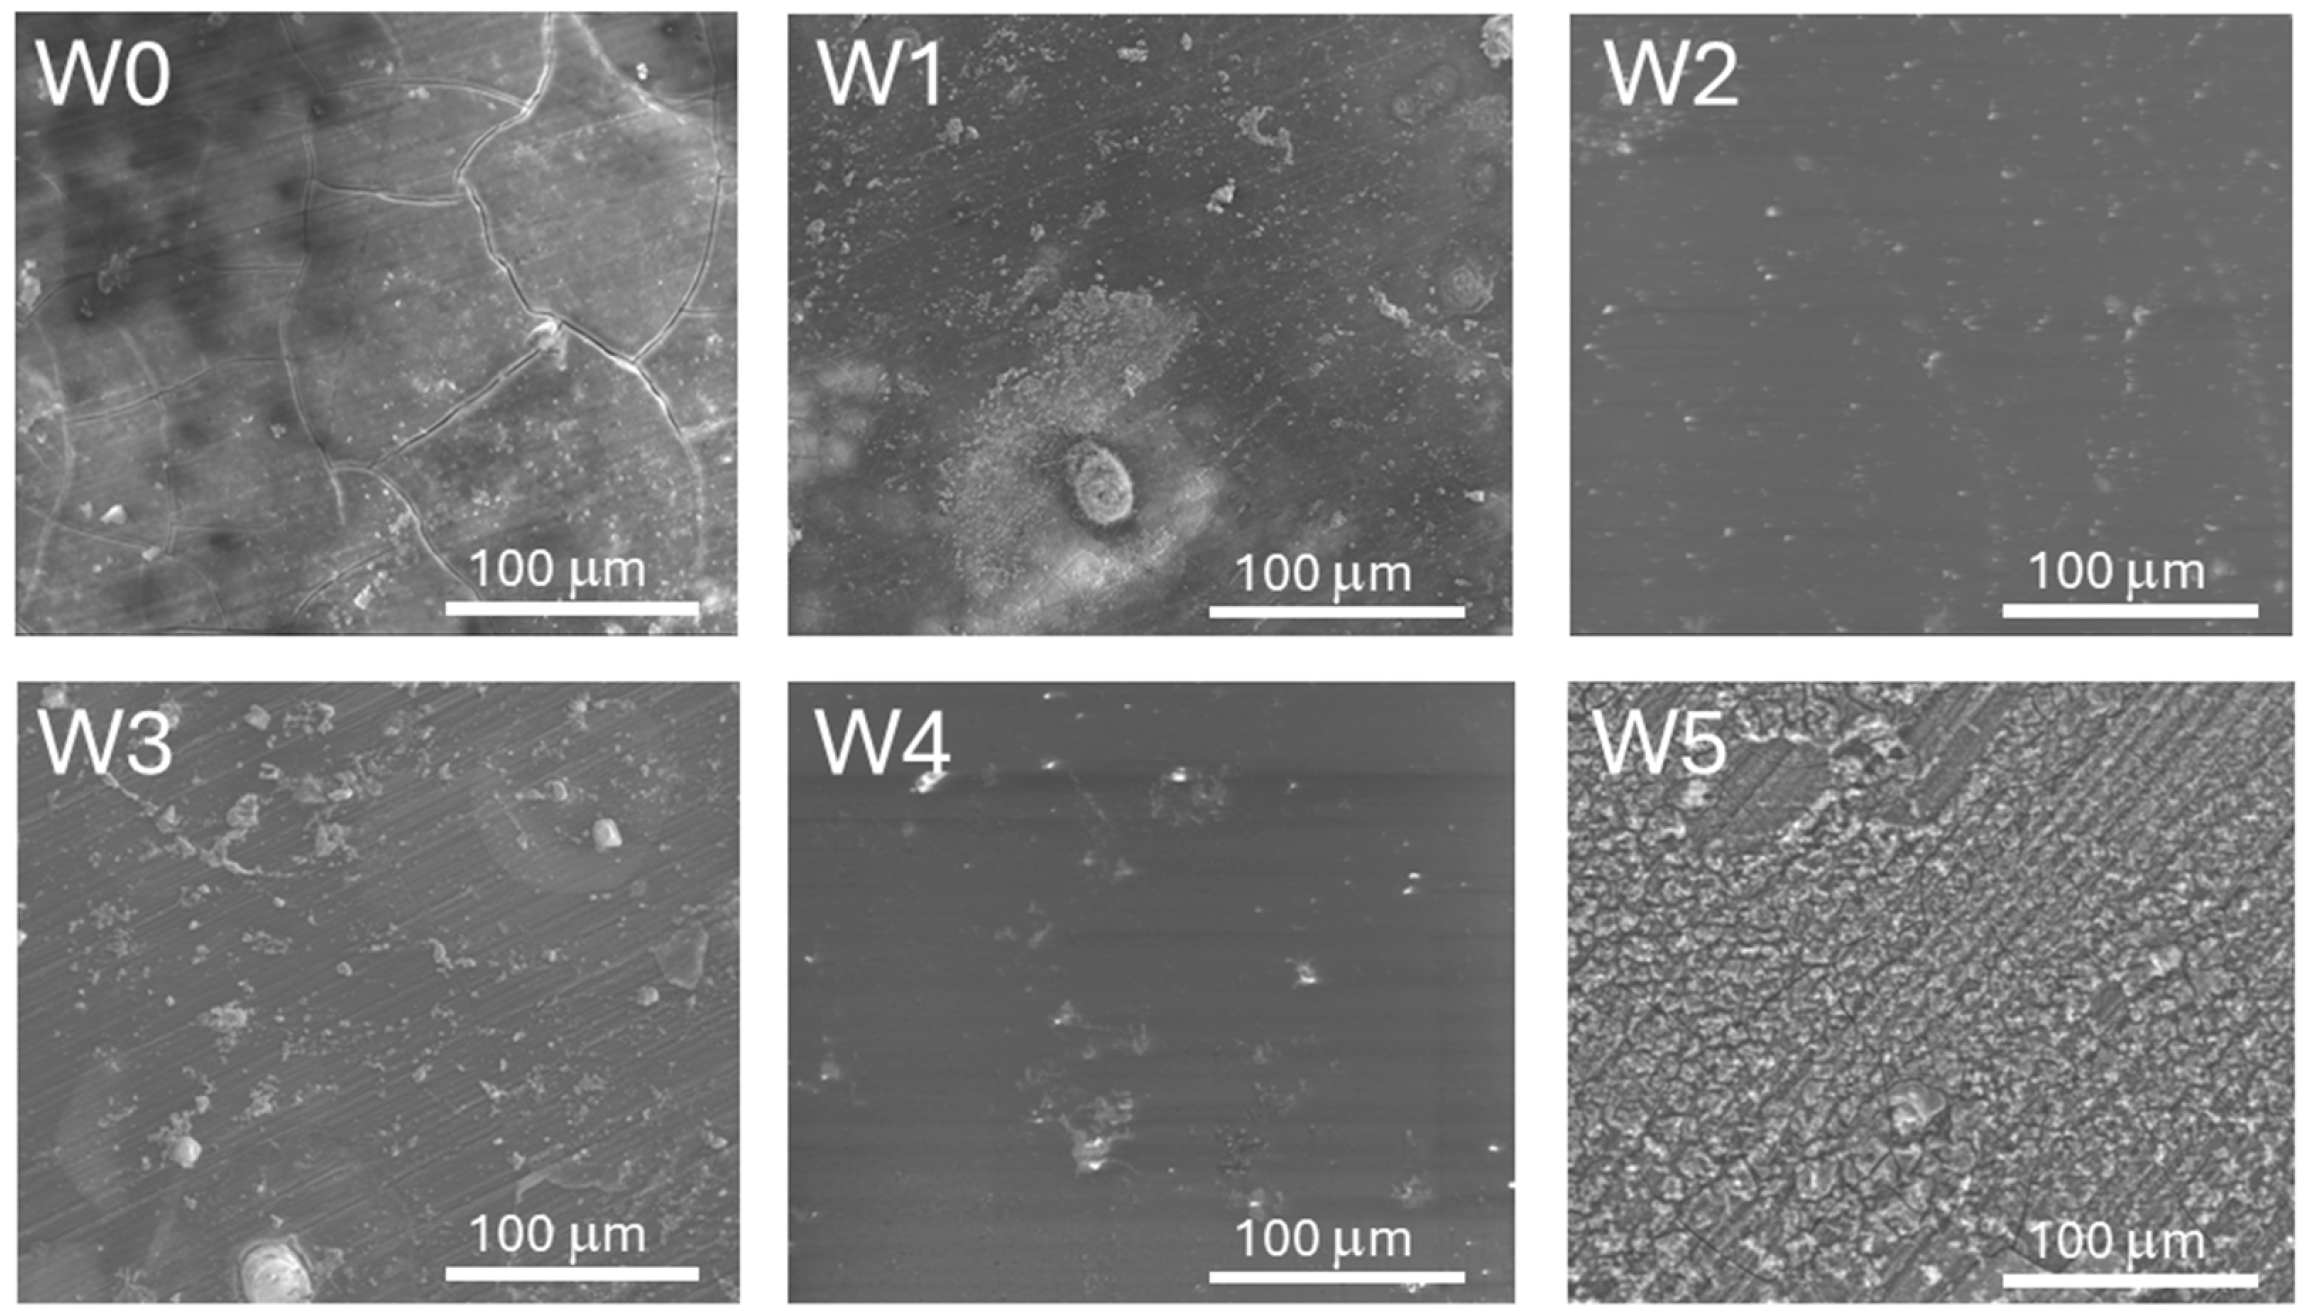
The study of the surface of the unmodified AZ31 magnesium alloy and that of the alloys subjected to chemical and plasmochemical activation and deposition of biopolymer layers allowed clear changes in the microstructure to be observed. Figure 3 compares the SEM images of the individual samples from the studied series with each other.
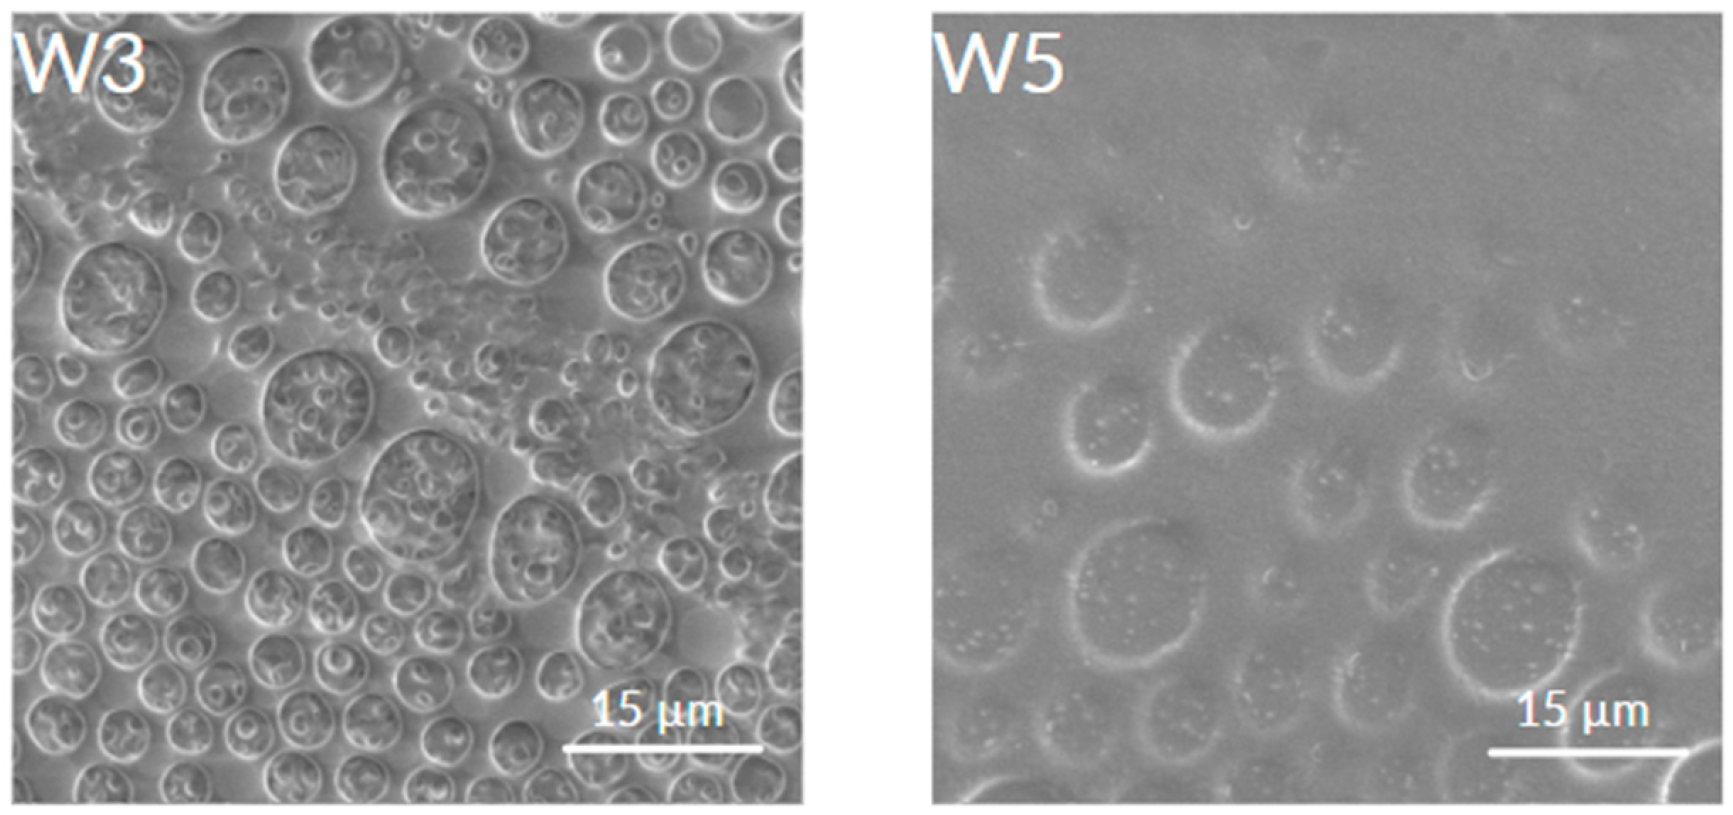
As can be observed, the surface activation process of the magnesium alloy did not significantly affect its microstructure. The microstructure of specimen W1 still shows clear grooves, which are a remnant of the mechanical treatment of the alloy. This effect is favourable from the point of view of further modifications, as the main objective of this step, apart from the removal of possible impurities from the alloy surface, was to ensure adequate adhesion of the biopolymer layers to the substrate, which would be difficult to fulfil in the case of a completely smooth surface. The visible micro-areas for the samples of the W2 and W4 series, with polylactide and polylactide-co-glycolide layers, respectively, are characterized by a continuous structure, with no visible areas of delamination. These results correspond directly with the research of Jiang et al. [37], who obtained layers of polylactide and polylactide-co-glycolide on pure magnesium. Analysis of the SEM images obtained enables us to conclude that the addition of caffeic acid to the polylactide matrix significantly altered the microstructure of the modified surface, as illustrated, among other things, by the micrographs/images for the W3 and W5 series (Figure 4). In this case, a characteristic porous structure with regular spherical protrusions resembling bubble film can be observed.
At higher magnifications, it can be seen that the aforementioned porous structure covers the entire thickness range of the obtained layers with the addition of caffeic acid. At the same time, it can be seen that the samples of the W5 series, with the polylactide-co-glycolide layer and addition of caffeic acid, show a much smaller effect of the additive on the characteristic changes in the microstructure than the samples of the W3 series. A similar porous structure is also observed in this case, but it occurs locally, over much smaller micro-areas and is not as clearly visible. This allows us to conclude that caffeic acid contributes to a more significant change in the microstructure of the modified surface, introducing a regular variation in its microgeometry, in the case of polylactide than polylactide-co-glycolide. In this case, caffeic acid acts as a porogen in polylactide (PLA) due to its ability to create pores during the polymer processing. This occurs due to limited solubility of CA in PLA, leading to phase separation upon cooling or solvent evaporation, thus creating voids or pores in the structure. The incorporation of CA into PLA can enhance its solubility in certain organic solvents (PLA acts a plasticizer). Another important factor is the possible interaction of CA with PLA, affecting the crystallization rate of PLA (a faster crystallization) and leading to a more disordered state and porous morphology. The effects, however, depend on the concentration of caffeic acid and the processing conditions used. This induced porous microstructure plays a dual role, it accelerates drug release (vide infra Section 3.7) but initially compromises the coating’s barrier function (vide infra Section 3.5).
The analysis of the average chemical composition of all AZ31 alloy surfaces was based on the EDS, and the concentrations of elements are presented in Table 4.
In the case of the unmodified substrate (W0 series), in addition to the alloying elements (magnesium, aluminum, and zinc), oxygen was also found. This may be due to the significant susceptibility of magnesium to be covered by an oxide layer (as a result of oxygen adsorption on the surface) when in contact with air, which was also confirmed in the study by Wu et al. [38], who also observed the formation of an oxygen-rich layer. In contrast, for the series of chemically and plasmochemically activated W1 samples, a much higher proportion of oxygen is observed, at around 15% w/w. This is due to the incorporation of this element into the surface of the modified alloy, which can be attributed to its presence in the plasma. The results obtained are in agreement with the findings of Tiyyagura et al. [39], who also used Ar-O2 plasma to modify the surface of a magnesium alloy. In the case of the series modified with polymer layers, the elements characteristic of the structures obtained, namely carbon and oxygen, were found to be present. The proportion of carbon for the W2–W5 experimental series is about 80% w/w, with the highest proportion of this element found for the W4 series (about 86% w/w). The analysis of the studied micro-coatings demonstrates that the thinnest coating (below 1 micrometre) was obtained for the W4 series (using polylactide-co-glycolide), as only in this case (among the W2–W5 series) is the presence of an alloying element, namely magnesium, observed in the spectrum. For the other series, the coatings obtained were much thicker, above 1 μm.

3.3. Surface Topography

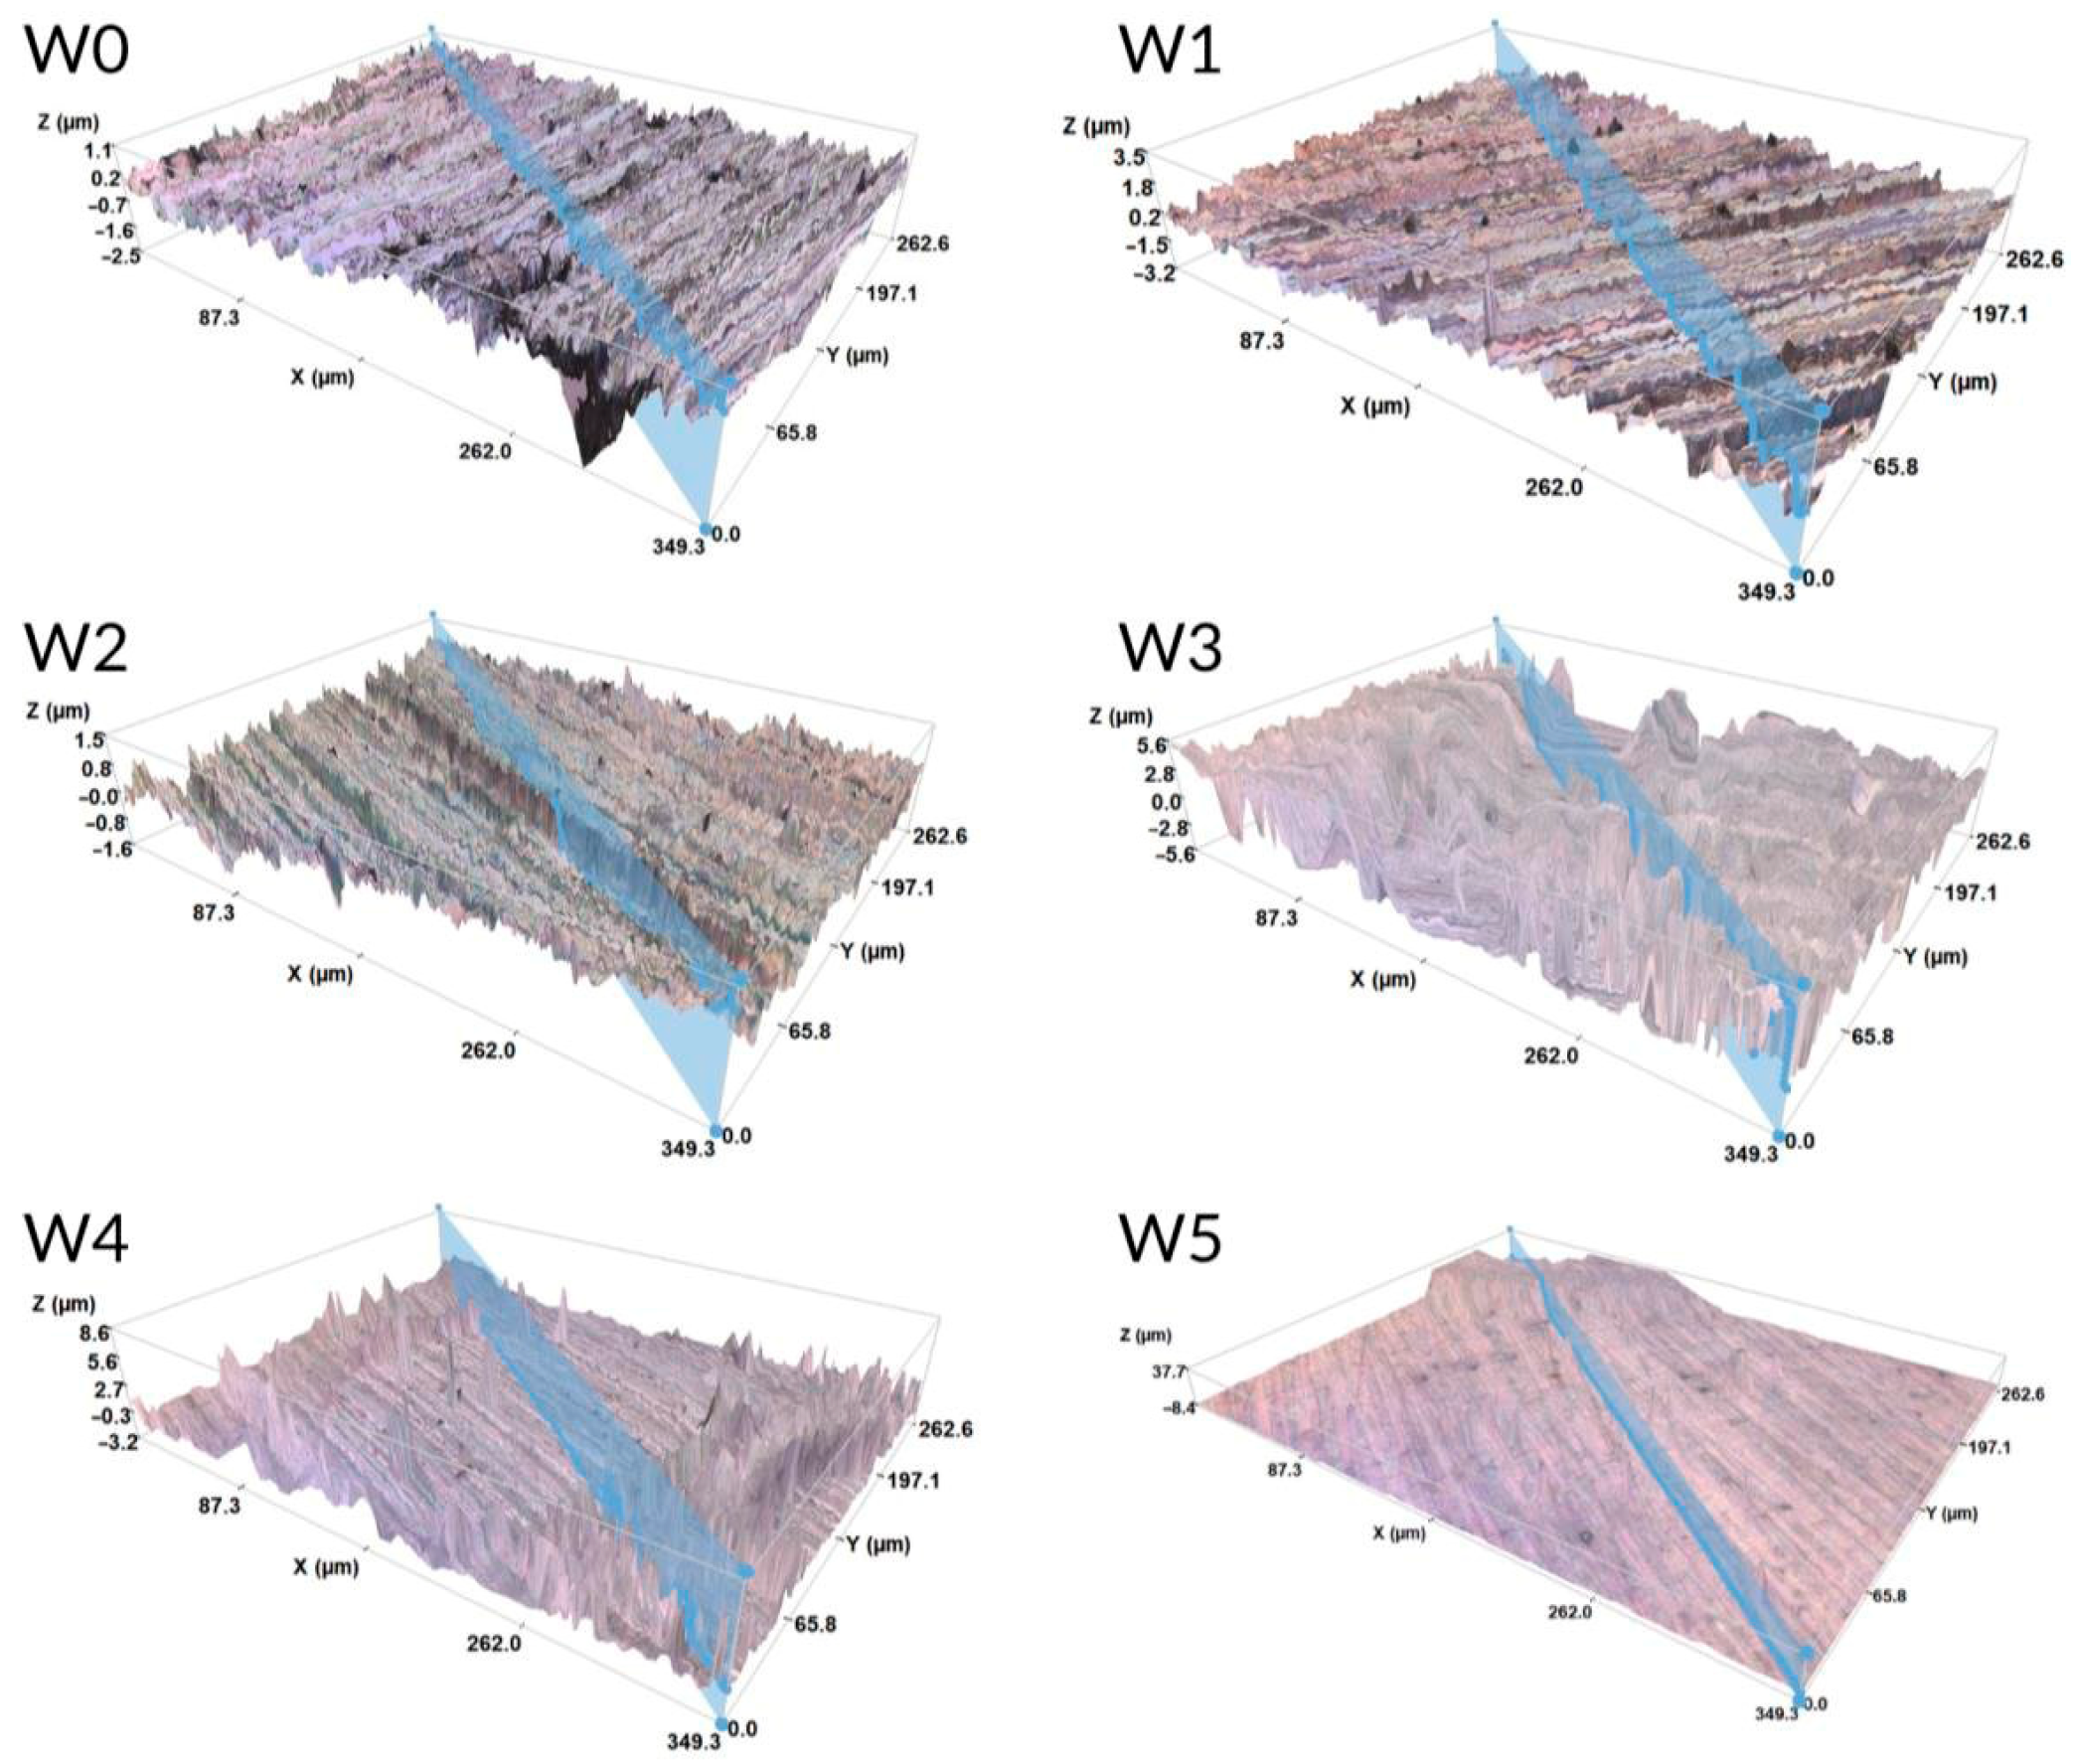
A patient’s bodily reaction to an implant depends both on its chemistry and surface topography. Implants with a diverse shape to their surfaces exhibit a greater ability for bone osteointegration. The surface topography of the AZ31 magnesium alloy samples of the studied series (W0—unmodified, W1—activated in Piranha solution followed by plasmochemical activation, W2–W5—activated and coated with biopolymer layers) was determined by optical profilometry; the results and the measured characteristics of surface topography (roughness parameters Ra and Rq) are presented in Figure 5.
According to knowledge and expectations, etching in Piranha solution should increase metallic alloy surface roughness, whereas plasmochemical treatment should decrease it due to the formation of oxides and nitrides [40,41]. In the case of the studied alloy, a change in the measured roughness between the W0 and W1 sample series due to the applied surface activation resulted in an increase in both parameters, Ra and Rq, from 0.24 to 0.37 μm and 0.26 to 0.39 μm, respectively. A 40% increase in Ra for the samples of AZ31 alloy subjected to joint chemical and plasmochemical treatment was also noticed by Abdelrahima et al. [41]. Deposition of the PLA layer (W2) diminished surface roughness, whereas the PLGA layer (W4) increased it in comparison with the biopolymer surface roughness value of the W1 series. This contrasting behaviour is a consequence of the differences in the molecular structure and rigidity of the two polymers during coating formation. PLA is typically semi-crystalline and stiffer, forming a continuous and levelling film that effectively bridges the micro-roughness of the activated substrate (W1), thus reducing the overall surface roughness parameters. In contrast, PLGA (50:50) is highly amorphous and more viscoelastic, causing it to be less effective at levelling. Furthermore, its amorphous nature can promote the formation of surface micro-aggregates or instabilities during the solvent evaporation, which contributes to a net increase in the roughness measured for the W4 series compared to the base activated substrate (W1). The admixture of caffeic acid to both biopolymer structures affects their roughness parameters inversely when compared to the unmodified biopolymers, raising them for PLA and lowering them for PLGA.
The noticed discrepancies in the measured values of surface profiles result from significant differences in the geometry of the analyzed surfaces and the choice of the studied area and scan direction.
Topography analysis of the studied unmodified and modified AZ31 alloy samples confirmed that the proposed surface activation increased surface roughness, the largest increase in this characteristic occurring for the PLA layer (W4), thus positively affecting the quality of the surface for application in implantology.

3.4. Surface Wettability

From the point of view of biomedical applications, surface wettability is an extremely useful parameter as it allows for, among other things, an indirect determination of the antibacterial potential of the implanted material, as well as the predisposition to biofilm formation. From the obtained contact angle values for water, it is possible to determine whether the material will be more susceptible to bacterial growth or will promote protein production and osteointegration of the implant [42].
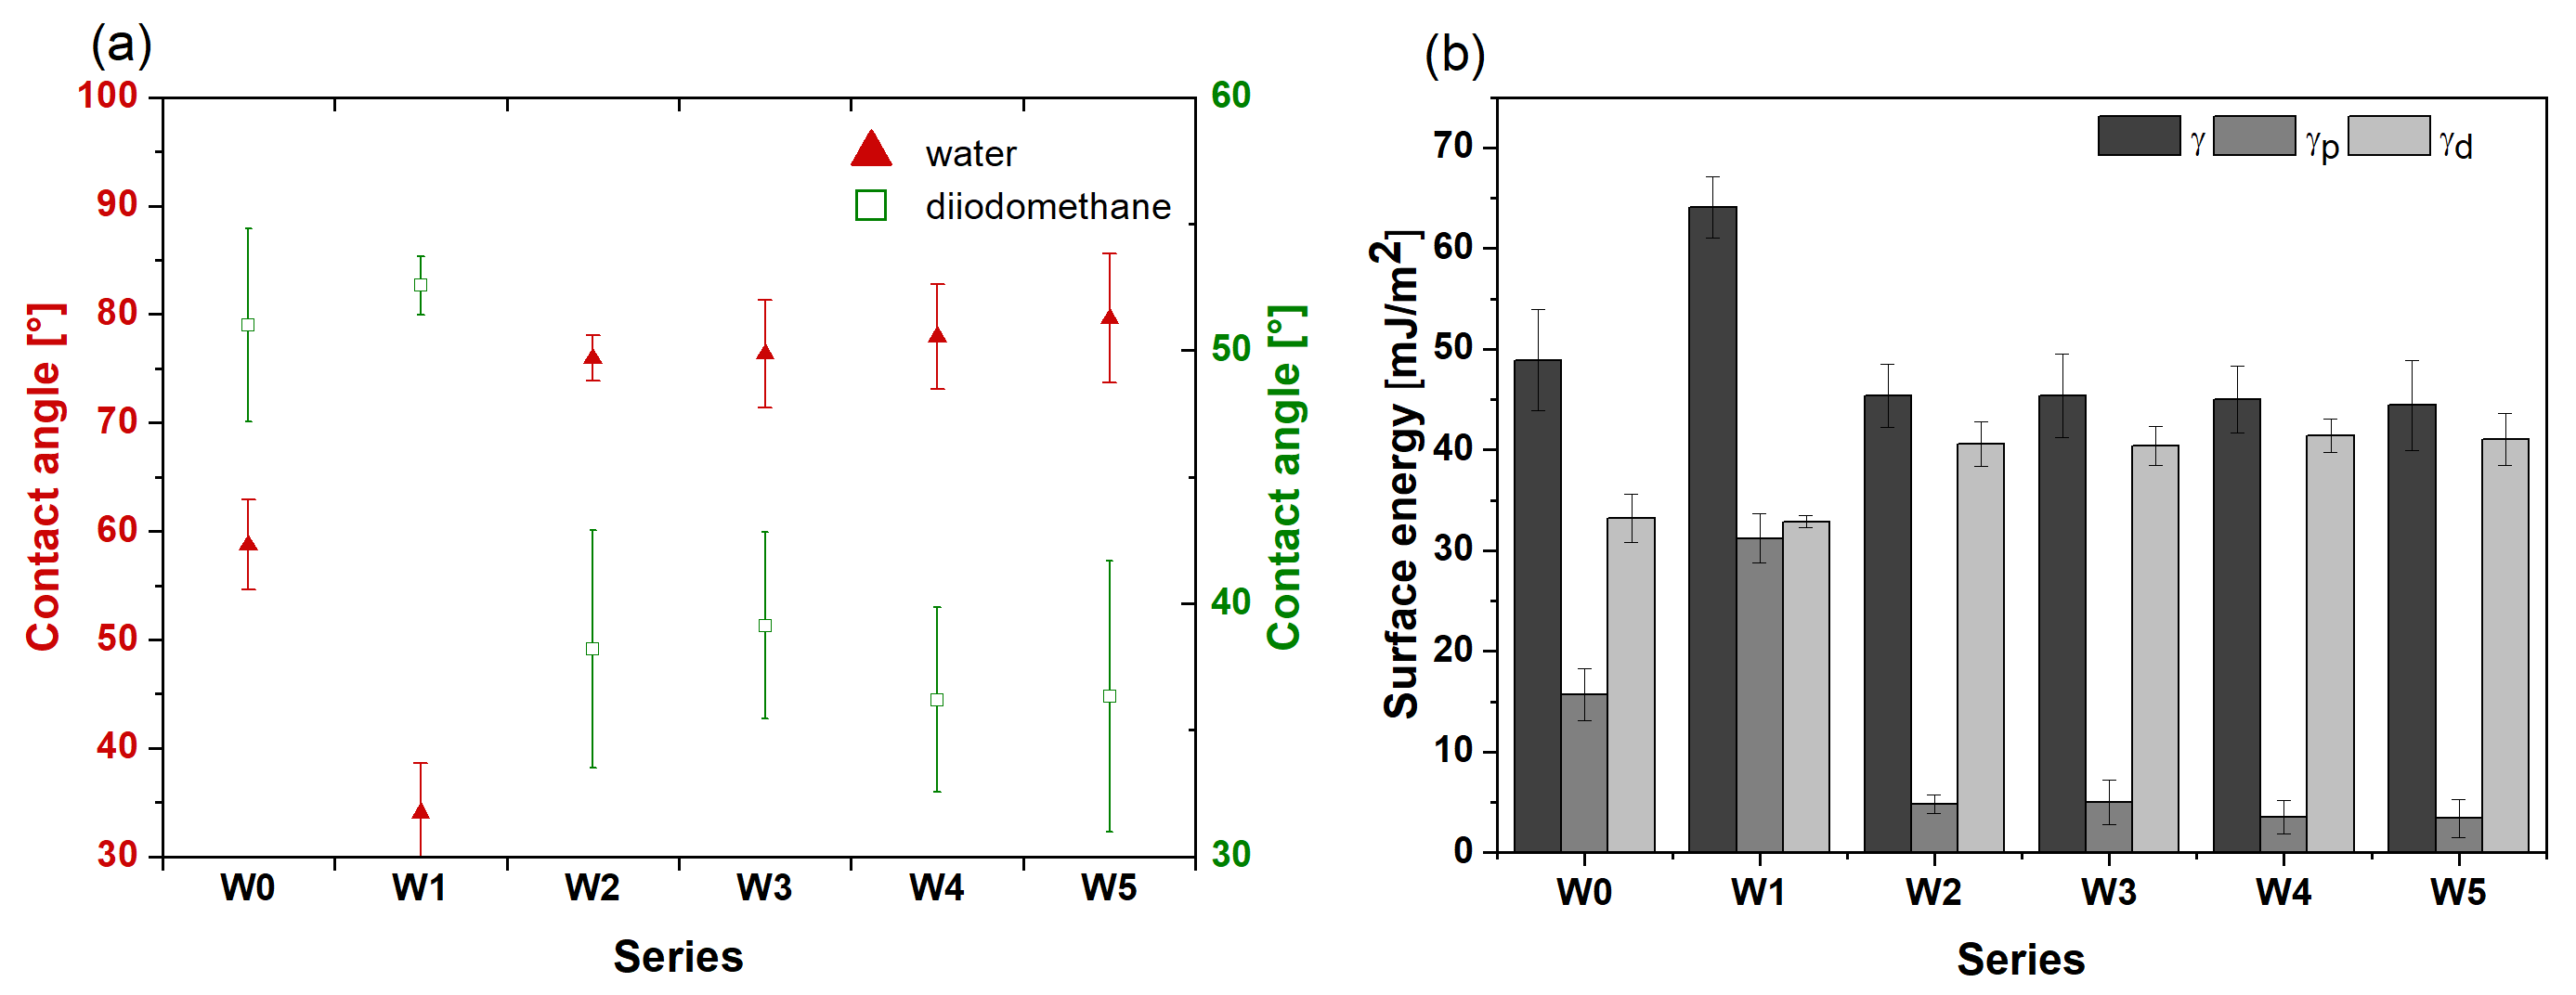
Contact angle and surface free energy (SFE) were measured for all experimental series using water and diiodomethane as measuring fluids; the results obtained are presented in Figure 6.
The chemical and plasmochemical treatment of the alloy significantly influenced the contact angle for water (WCA), which was 59° for the unmodified series (W0) and 34° for the modified series without biopolymer layers (W1). A similar relationship was not observed when diiodomethane was used as the measuring liquid; the difference in the value of the aforementioned parameter for these series is approximately 1%. This may be due to the incorporation of oxygen into the surface of the modified alloy due to the presence of this element in the reaction mixture, which usually results in an increase in the polar character of the surfaces tested. In the case of biopolymer-modified samples, for both polylactide and polylactide-co-glycolide, the contact angle for water adopts a similar value, 76° and 79°, respectively. This is in agreement with the results of Jiang et al. [37], who obtained similar contact angle results (using water) for the same polymers. Furthermore, no effect from the addition of caffeic acid is observed on the contact angle value for water. In the case of using diiodomethane as the measuring liquid, it is also observed that there are no mentioned changes, as in the case of using distilled water, but the obtained values of the contact angles are, in this case, about 20° lower for the W2–W5 series.
It can be concluded that the obtained values of surface free energy coincide with the results of surface wettability testing. Namely, an improvement in surface wettability corresponds to an increase in the surface energy of the sample. In line with this observation, the series subjected to chemical and plasmochemical activation has the highest value of total SFE (64.1 mJ/mm2). Furthermore, it can be concluded that surface modification with biopolymers contributes to a decrease in the value of SFE (down to 45 mJ/mm2), but no significant differences are observed between the series with polylactide and polylactide-co-glycolide, or the presence of caffeic acid. What is noticeable, however, is the predominance of the dispersive component over the polar one, as the contribution of the former to the value of total free energy is about 90%.
In summary, it can be concluded that the proposed surface modifications of the AZ31 magnesium alloy contribute to a clear change in the character of the surface, towards hydrophobic, compared to the unmodified alloy. However, the obtained values of the wetting angles are still within the range (below 90°) in which the surfaces are still considered hydrophilic. Based on the obtained contact angle for water, it can be concluded that the chemically and plasmochemically activated surface (W1, WCA ca. 34°) is the most hydrophilic (highest SFE) and is therefore expected to exhibit the lowest initial bacterial adhesion. This extreme hydrophilicity generally favours the rapid adsorption of host proteins and promotes host cell response (osteointegration), which outcompetes microbial attachment. The unmodified alloy (W0, WCA ca. 59°) falls within the intermediate wettability range (from 40° to 90°), which is often associated with the highest propensity for bacterial adhesion and biofilm formation. The biopolymer-modified surfaces (W2–W5, WCA ca. 76°–79°) are at the higher end of this intermediate range. Consequently, wettability alone may not offer a significant anti-adhesion benefit over W0. It is therefore expected that the final antibacterial performance of these series will be primarily governed by the active release of the incorporated caffeic acid, rather than by the surface wettability parameter alone.

3.5. Tribological Test

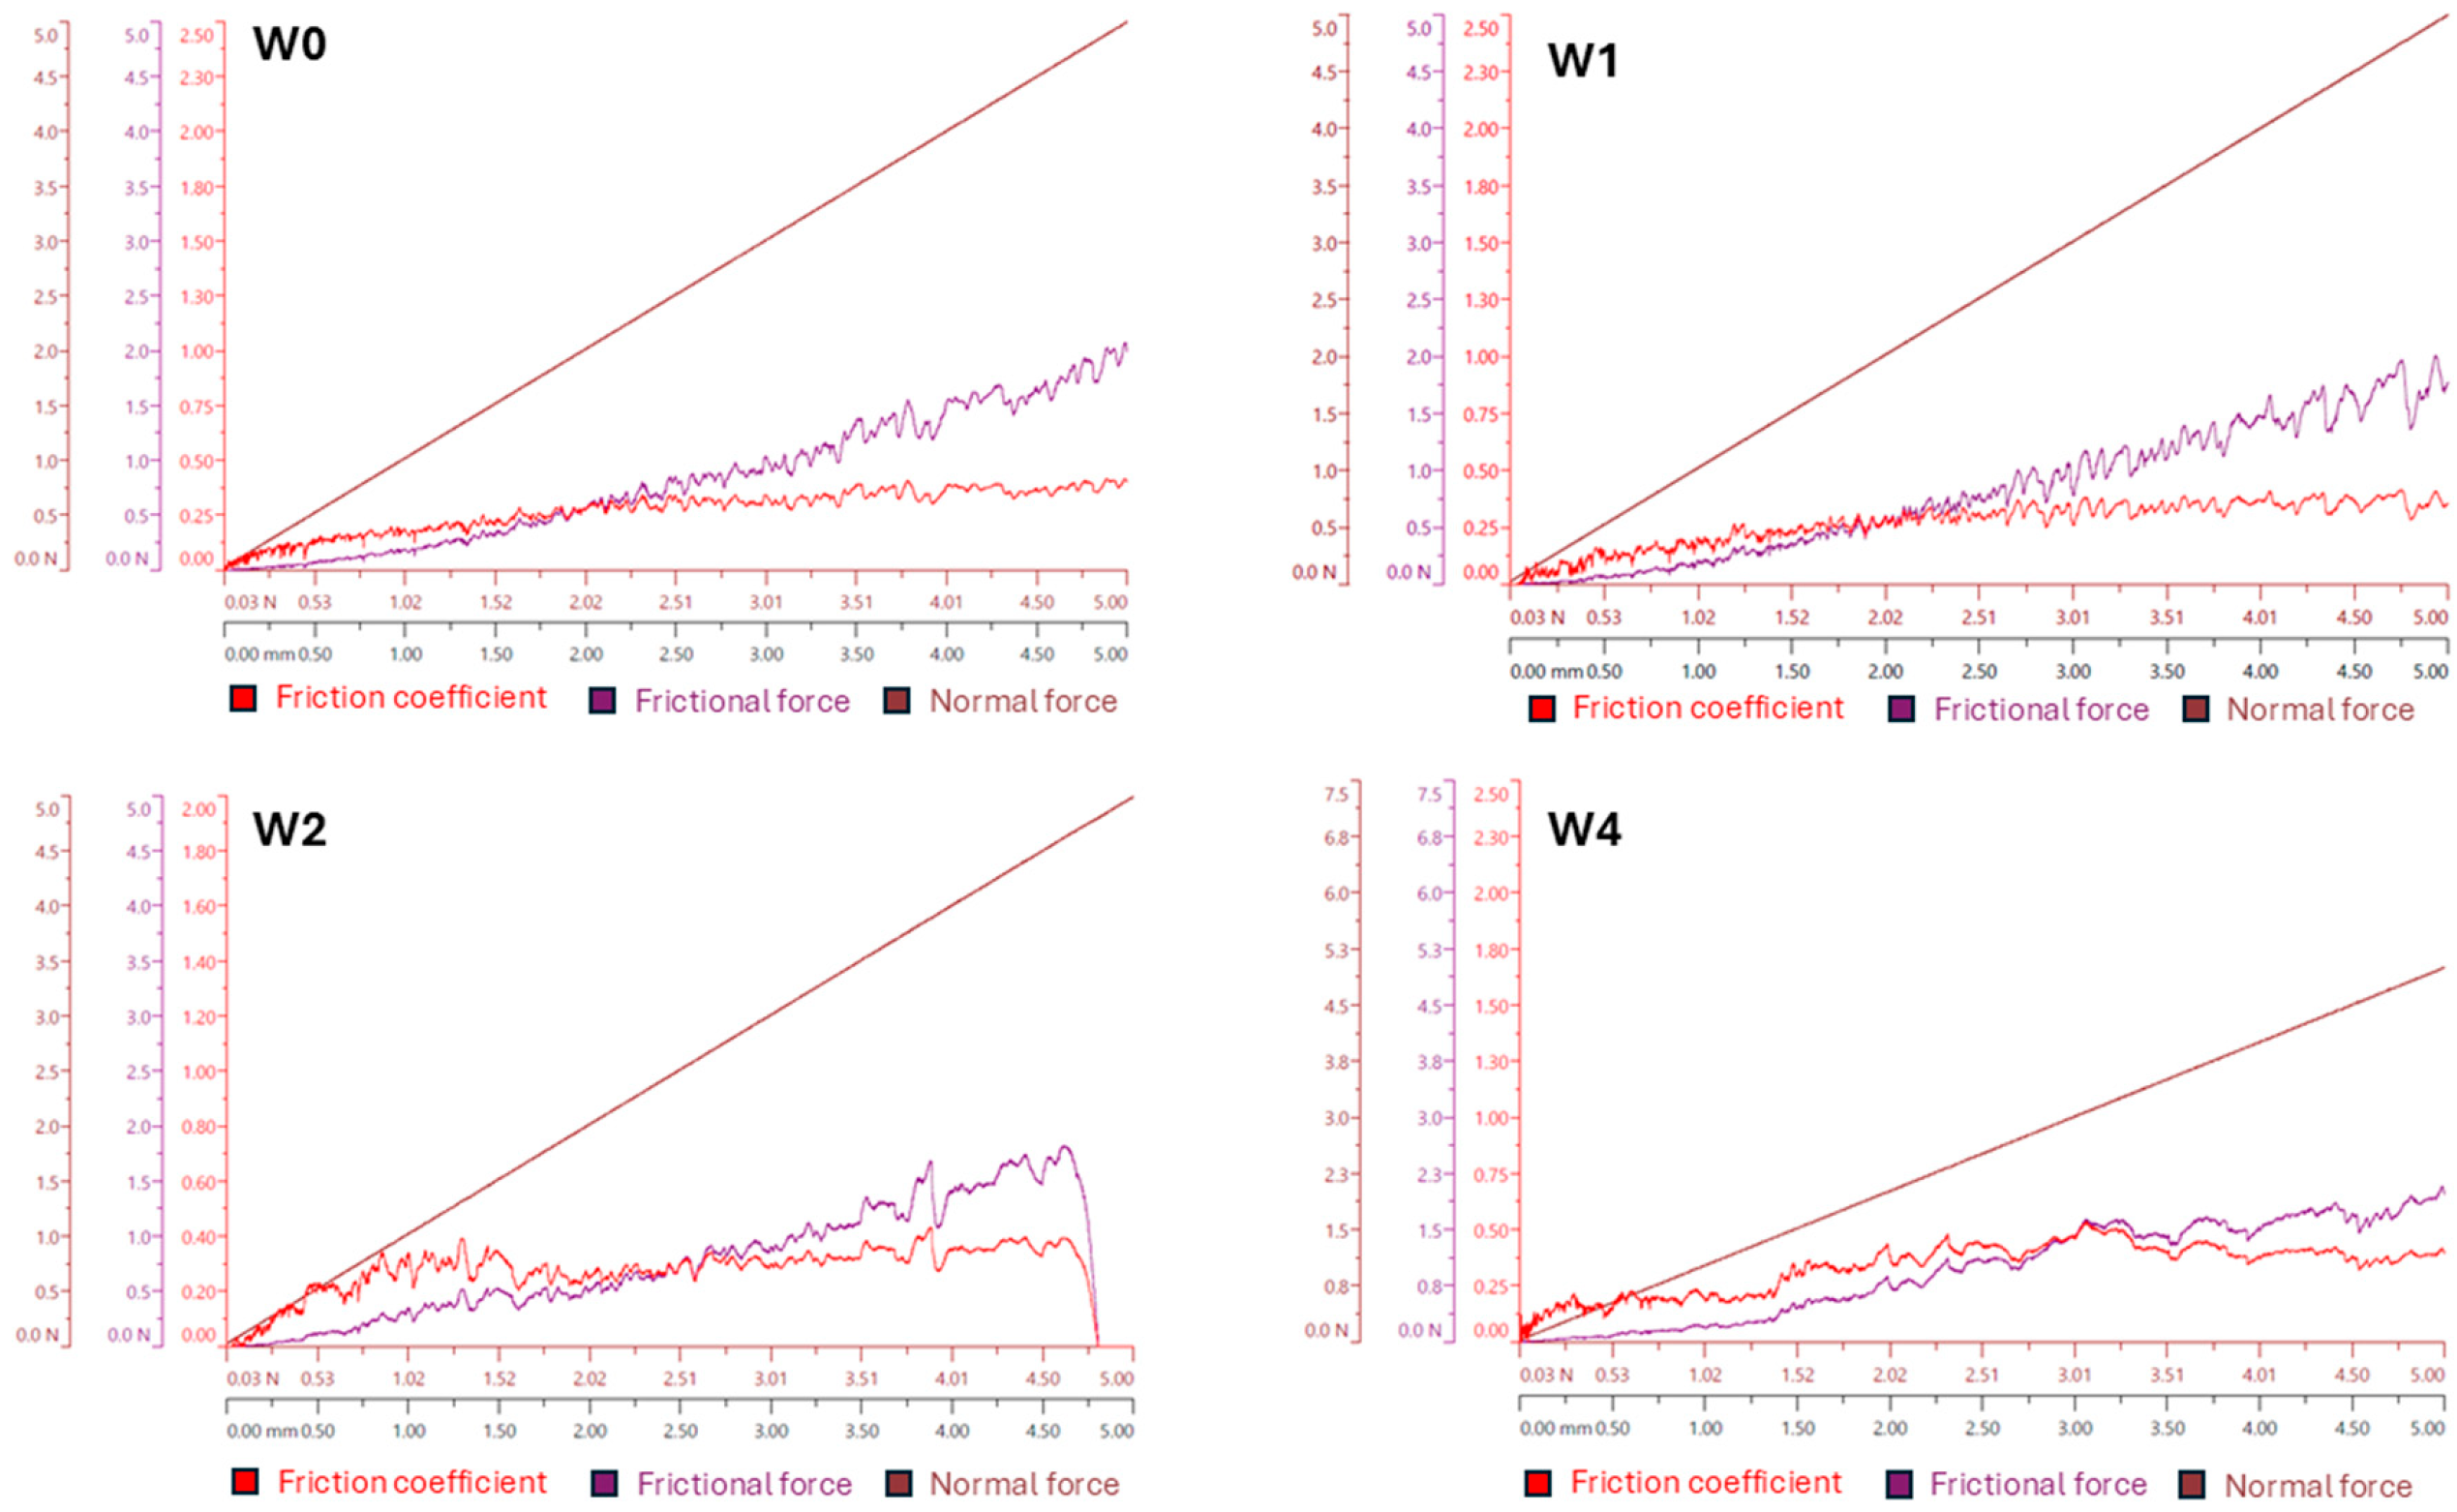
Evaluation of the adhesion of biopolymer coatings on unmodified and chemically and plasmochemically modified magnesium alloy substrates was determined by scratch test. The average values of the coefficient of friction (COF; μ) and frictional force (Ff) for all the experimental series tested are summarized in Table 5.
The chemical and plasmochemical treatment of the Mg alloys (W1 series) resulted in a lower COF value than that of the unmodified series (W0) samples. This may be due to the formation of new phases, involving oxygen and nitrogen, during the plasmochemical treatment process, which contribute to a reduction in surface roughness and, at the same time, a reduction in the value of COF [38,39]. The application of biopolymer coatings (W2 and W4) resulted in a significant increase in the COF value compared to the bare activated alloy (W1). This increase is a consequence of replacing the hard, low-friction surface layer of the activated alloy with a softer, viscoelastic polymer layer. In polymer tribology, friction is dominated by adhesion and ploughing (deformation). The soft nature of the polymer coatings facilitates greater material deformation under the indenter load, thus increasing the friction contribution from the ploughing component. The value of this parameter for the series modified with polylactide (W2) is 0.43, which is lower than that obtained in the study by Karacan et al. (0.68) [43]. This discrepancy is probably due to the use of a different alloy as a substrate (Ti-6Al-7Nb) and the use of a different method (dip-coating) for depositing the polylactide layer. In the case of the series modified with the polylactide-co-glycolide layer (W4), on the other hand, an increase in the value of COF (up to 0.53) is observed compared to that for the polylactide (W2). The higher COF for PLGA (W4) compared to PLA (W2) is likely due to the incorporation of glycolide units, resulting in a more amorphous and less stiff polymer structure. This increased viscoelasticity and softness in PLGA enhances the deformation (ploughing) component of friction, leading to a higher overall COF value. It is also observed that the addition of caffeic acid causes an increase in COF values by approximately 20% for both the W3 series (with polylactide) and the W5 series (with polylactide-co-glycolide). Similar trends of change for the tested experimental series are observed for the value of the determined friction force during the scratch test. Enhanced values of COF (Table 4) for the coatings containing CA (W3 and W5 series) can be an indication of a higher material softness/deformation caused by the introduction of CA, which leads to a higher ploughing component of friction, and is potentially exacerbated by the induced porosity. Alternatively, the higher COF may be evidence of better adhesion of such layers to the metallic substrates in comparison with those prepared from pure PLA or PLGA biopolymers (W2 and W4 series).
In addition, the results of the scratch test presented in Figure 7 for samples W0, W1, and W4 confirm the occurrence of the expected relationship of an increase in friction coefficient and friction force with an increase in normal force. The observed abrupt decrease in COF and Ff for sample W2 (for a normal force of approximately 5 N) may be due to rupture of the polymer layer continuity.
In summary, it can be concluded that the proposed surface modifications of AZ31 magnesium alloy across all the biopolymer layers contribute to an increase in COF value relative to that of the unmodified alloy. The lowest value (0.30) was obtained for the substrate after chemical and plasmochemical treatment, and the highest value (0.69) for W5 series, with a layer of polylactide-co-glycolide with the addition of caffeic acid.

3.6. Corrosion Analysis

The corrosion behaviour of the uncoated AZ31 magnesium alloy (W0 and W1 sample series) and the alloy coated with all studied biopolymer layers (W2–W5 series) in simulated body fluid (SBF) after immersion for 7 and 14 days was evaluated based on SEM surface morphology, the chemical composition of sample surfaces analyzed by EDS, and the concentrations of magnesium and aluminum ions released into the SBF determined by ICP-MS.
Figure 8 shows SEM micrographs of the surfaces of all the studied experimental series (W0–W5) after immersion for 7 days in the SBF solution outlined in Table 2.
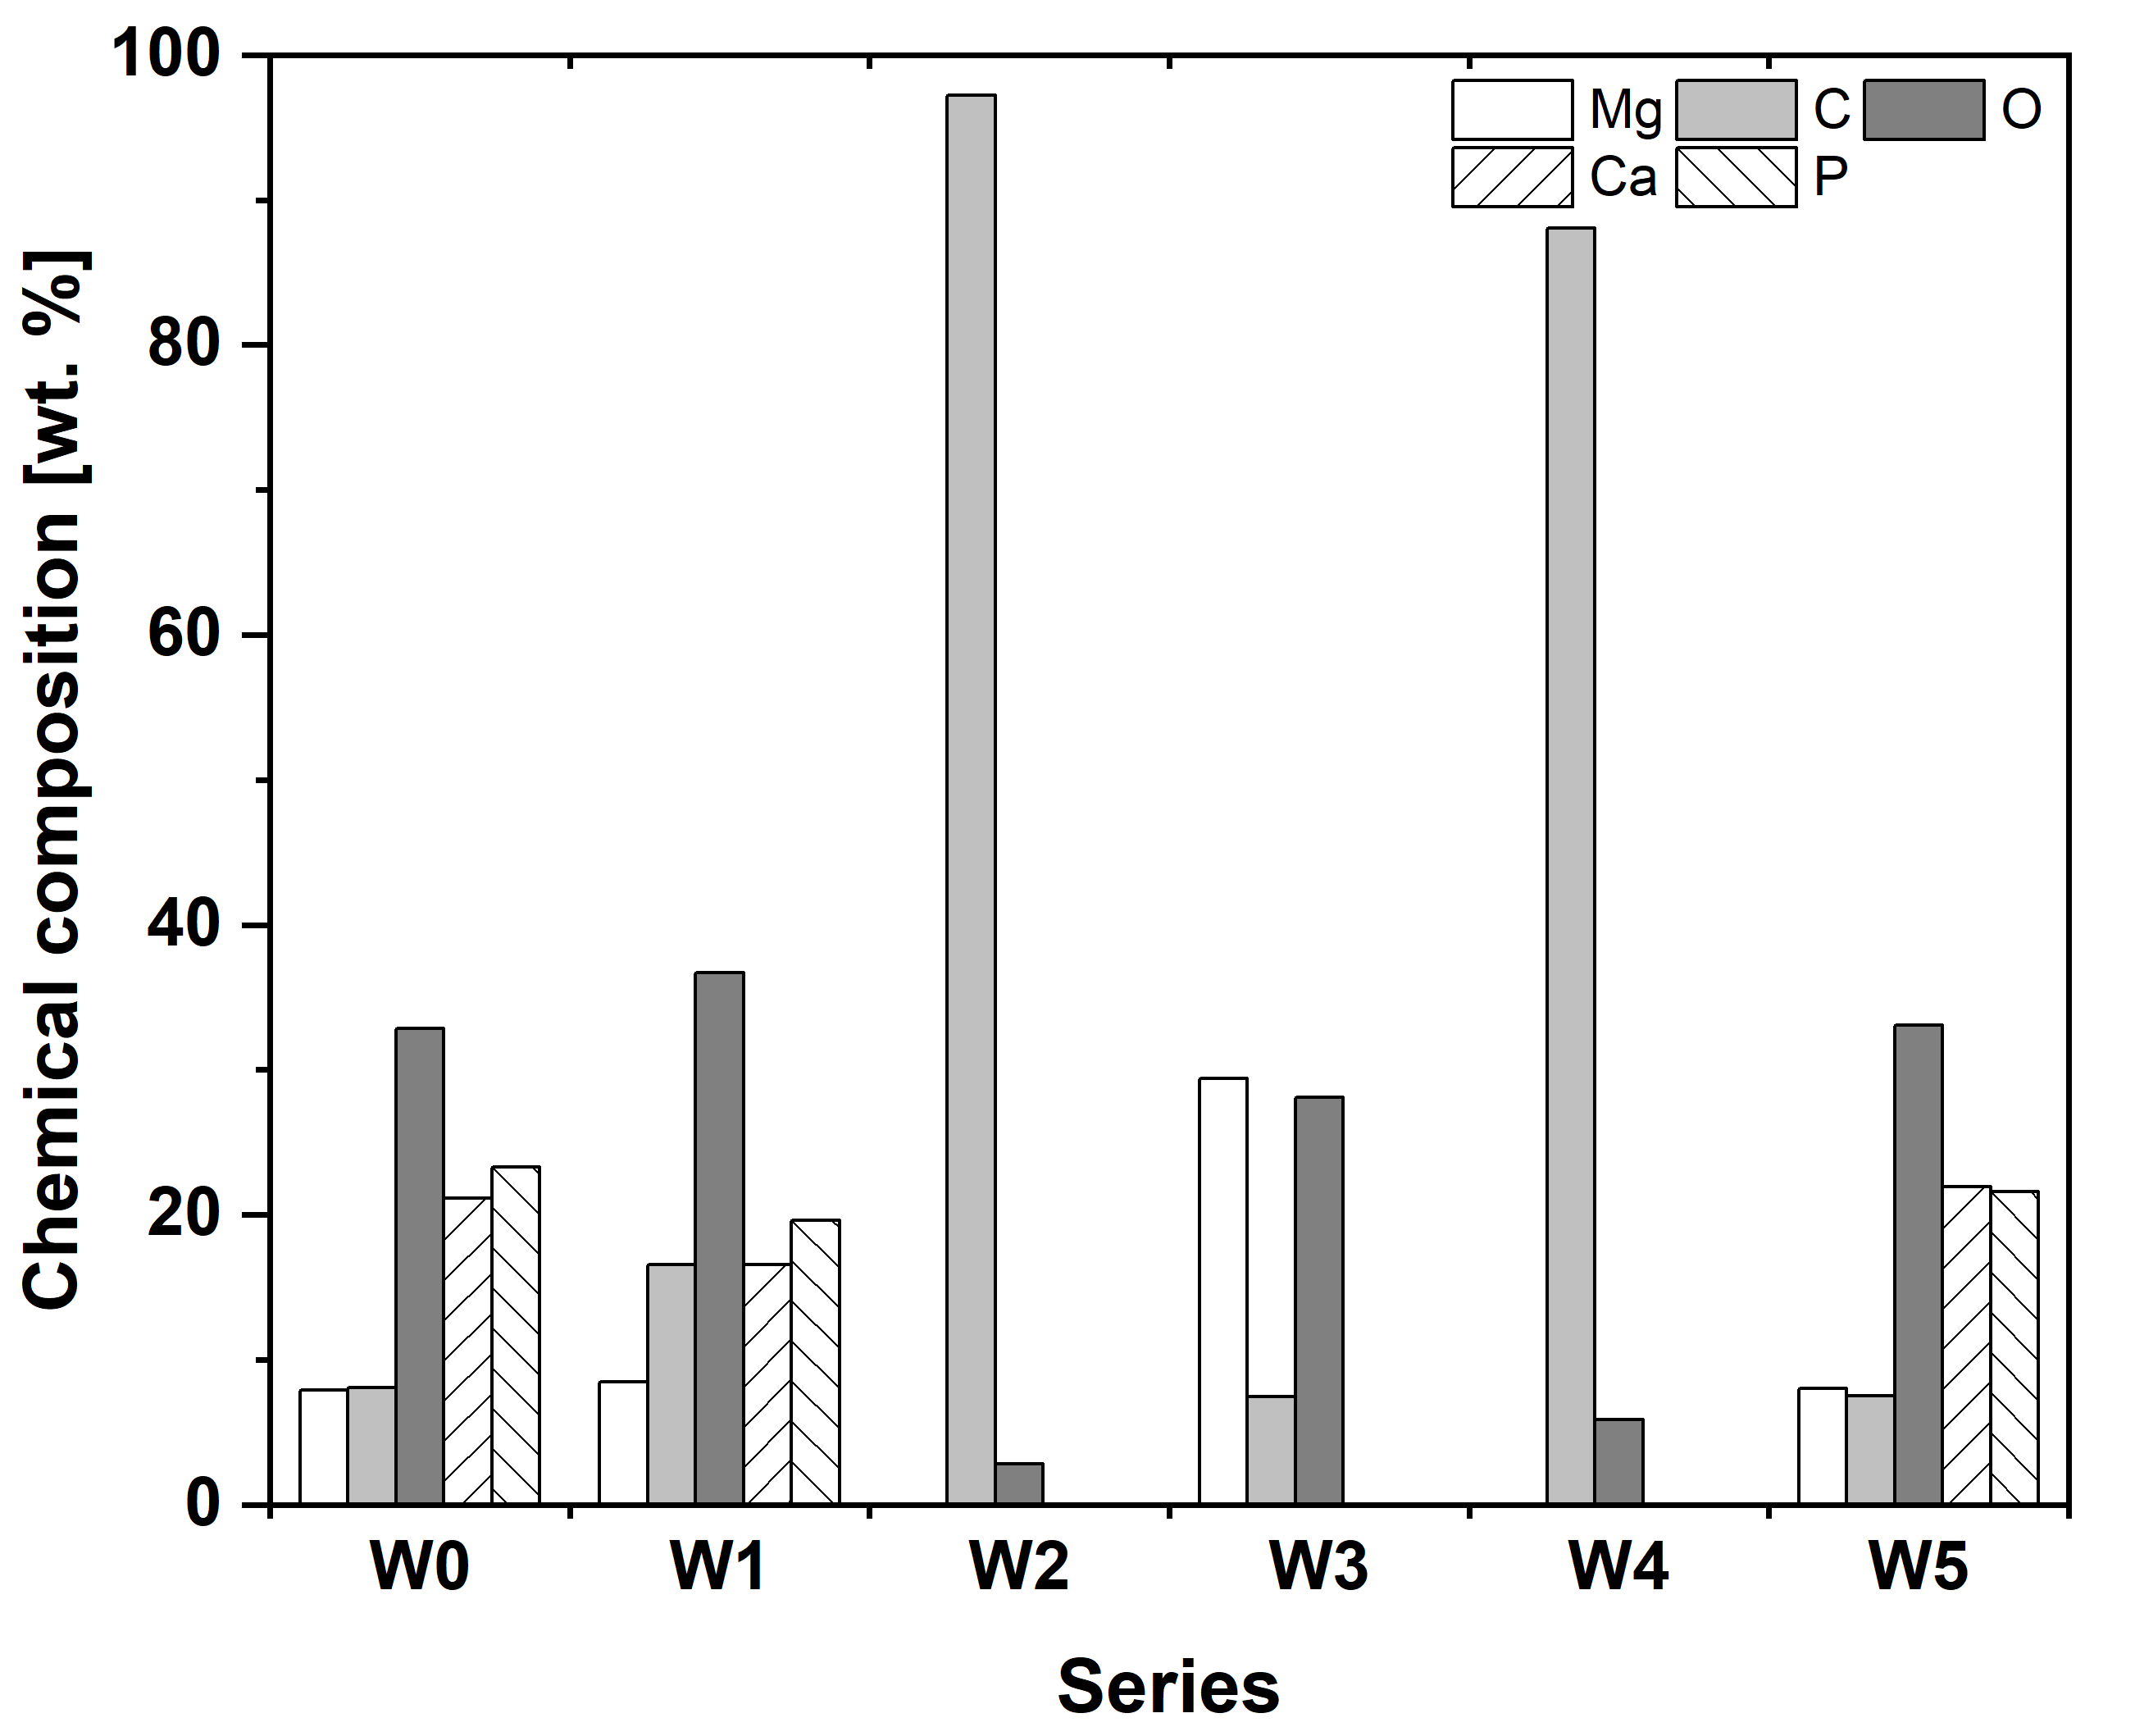
The surface microstructure of the unmodified W0 sample series is characterized by the presence of cracks, which is evidence of a corrosive effect. This effect may suggest a pure resistance of the studied alloy towards wet corrosion in a body fluid. Additionally, some globular structures are visible on the presented surface. Results of EDS analyses of average chemical compositions from the presented surfaces are shown in Figure 9.
The analysis of the W0 sample series exhibited the presence of phosphorus and calcium, in the proportions of 24 wt.% and 21 wt.%, respectively, which may suggest formation of phosphate phases, possibly apatite, on the studied surfaces. Similar morphology features (i.e., cracks, globular structures, and polishing marks) are visible on the surface of the W1 sample series (treated inclusively both in Piranha solution and plasmochemically), exhibiting the presence of phosphorus and calcium, in the proportions of 20 wt.% and 17 wt.%, respectively. The presence of cracks on the surface of the W1 sample series indicates that the applied surface activation was not sufficient to eliminate high corrosiveness of the alloy in the SBF environment. In the case of the alloy coated with polylactide (W2 series) and polylactide-co-glycolide (W4 series), SEM observations show smooth and homogeneous surfaces, free from cracks and structures that were typical for W0 and W1 sample series. The elemental analysis showed that only carbon, about 97 wt.% for W2 and 88 wt.% for W4, and oxygen were the two elements that constituted the modified coatings. In both cases, there was no evidence of magnesium on the surface. Additionally, leaf-like structures are visible on the surface of the W4 sample series, which may possibly be some chloride phases, as EDS analysis of these structures indicated chlorine at about 6 wt.%. These results correspond well with those obtained by Ren et al. [44] for samples of AZ31 alloy coated with PLA and subjected to an SBF for 15 days, for which no cracks in the outer polymer layer or apatite formation were observed. Different results are obtained for the alloy series coated with polymers (PLA for W3 and PLGA for W5 series) containing caffeic acid. In the case of both experimental series, the polymer layers lost their continuity, confirmed by EDS analyses showing only about 7 wt.% of carbon and a significant proportion of magnesium, about 29 wt.% for the W3 series. This loss of continuity and barrier function at 7 days for the CA-containing coatings (W3 and W5) is an undesirable effect, likely due to the induced porosity facilitating rapid SBF penetration. No apatite formation was observed on the surface of the W3 sample series in contrast to the W5 one, which was confirmed by the presence of globular structures rich in calcium and phosphorus at a proportion of about 22 wt.% for both elements. Surface analysis by scanning electron microscopy of all the experimental series after 14 days of immersion in the SBF solution (Figure 10) showed similar results to those of when the samples were immersed for 7 days for all of the series, except for those containing caffeic acid (CA) in the biopolymer layers (W3 and W5 series).
Surfaces of the W0 and W1 sample series are similarly characterized by the presence of cracks and apatite structures. The W2 and W4 sample series with PLA and PLGA coatings, respectively, showed surfaces free of cracks and apatite particles, which confirmed their enhanced resistance to corrosion in the applied SBF environment. The 14-day immersion of the sample coated with PLA + CA layer (W3 series) resulted in a continuous polymer layer free of cracks and apatite particles, while the sample coated with PGLA + CA (W5 series) demonstrated a noncontinuous polymer layer with apatite particles formed on it. EDS semiquantitative analysis from the surface of the W3 sample series indicated only carbon and oxygen, about 86 wt.% and 14 wt.%, respectively, thus confirming the existence of a continuous pure polymer layer. Finally, the induced porosity due to the addition of CA to PLA and PLGA (based morphology observations) strongly influences the coating’s barrier properties. Despite the initial (7-day) loss of integrity for W3 and W5, the subsequent 14-day results for W3 suggest a potential for self-repair or localized consolidation, recovering a continuous barrier layer.

3.7. ICP MS Analysis

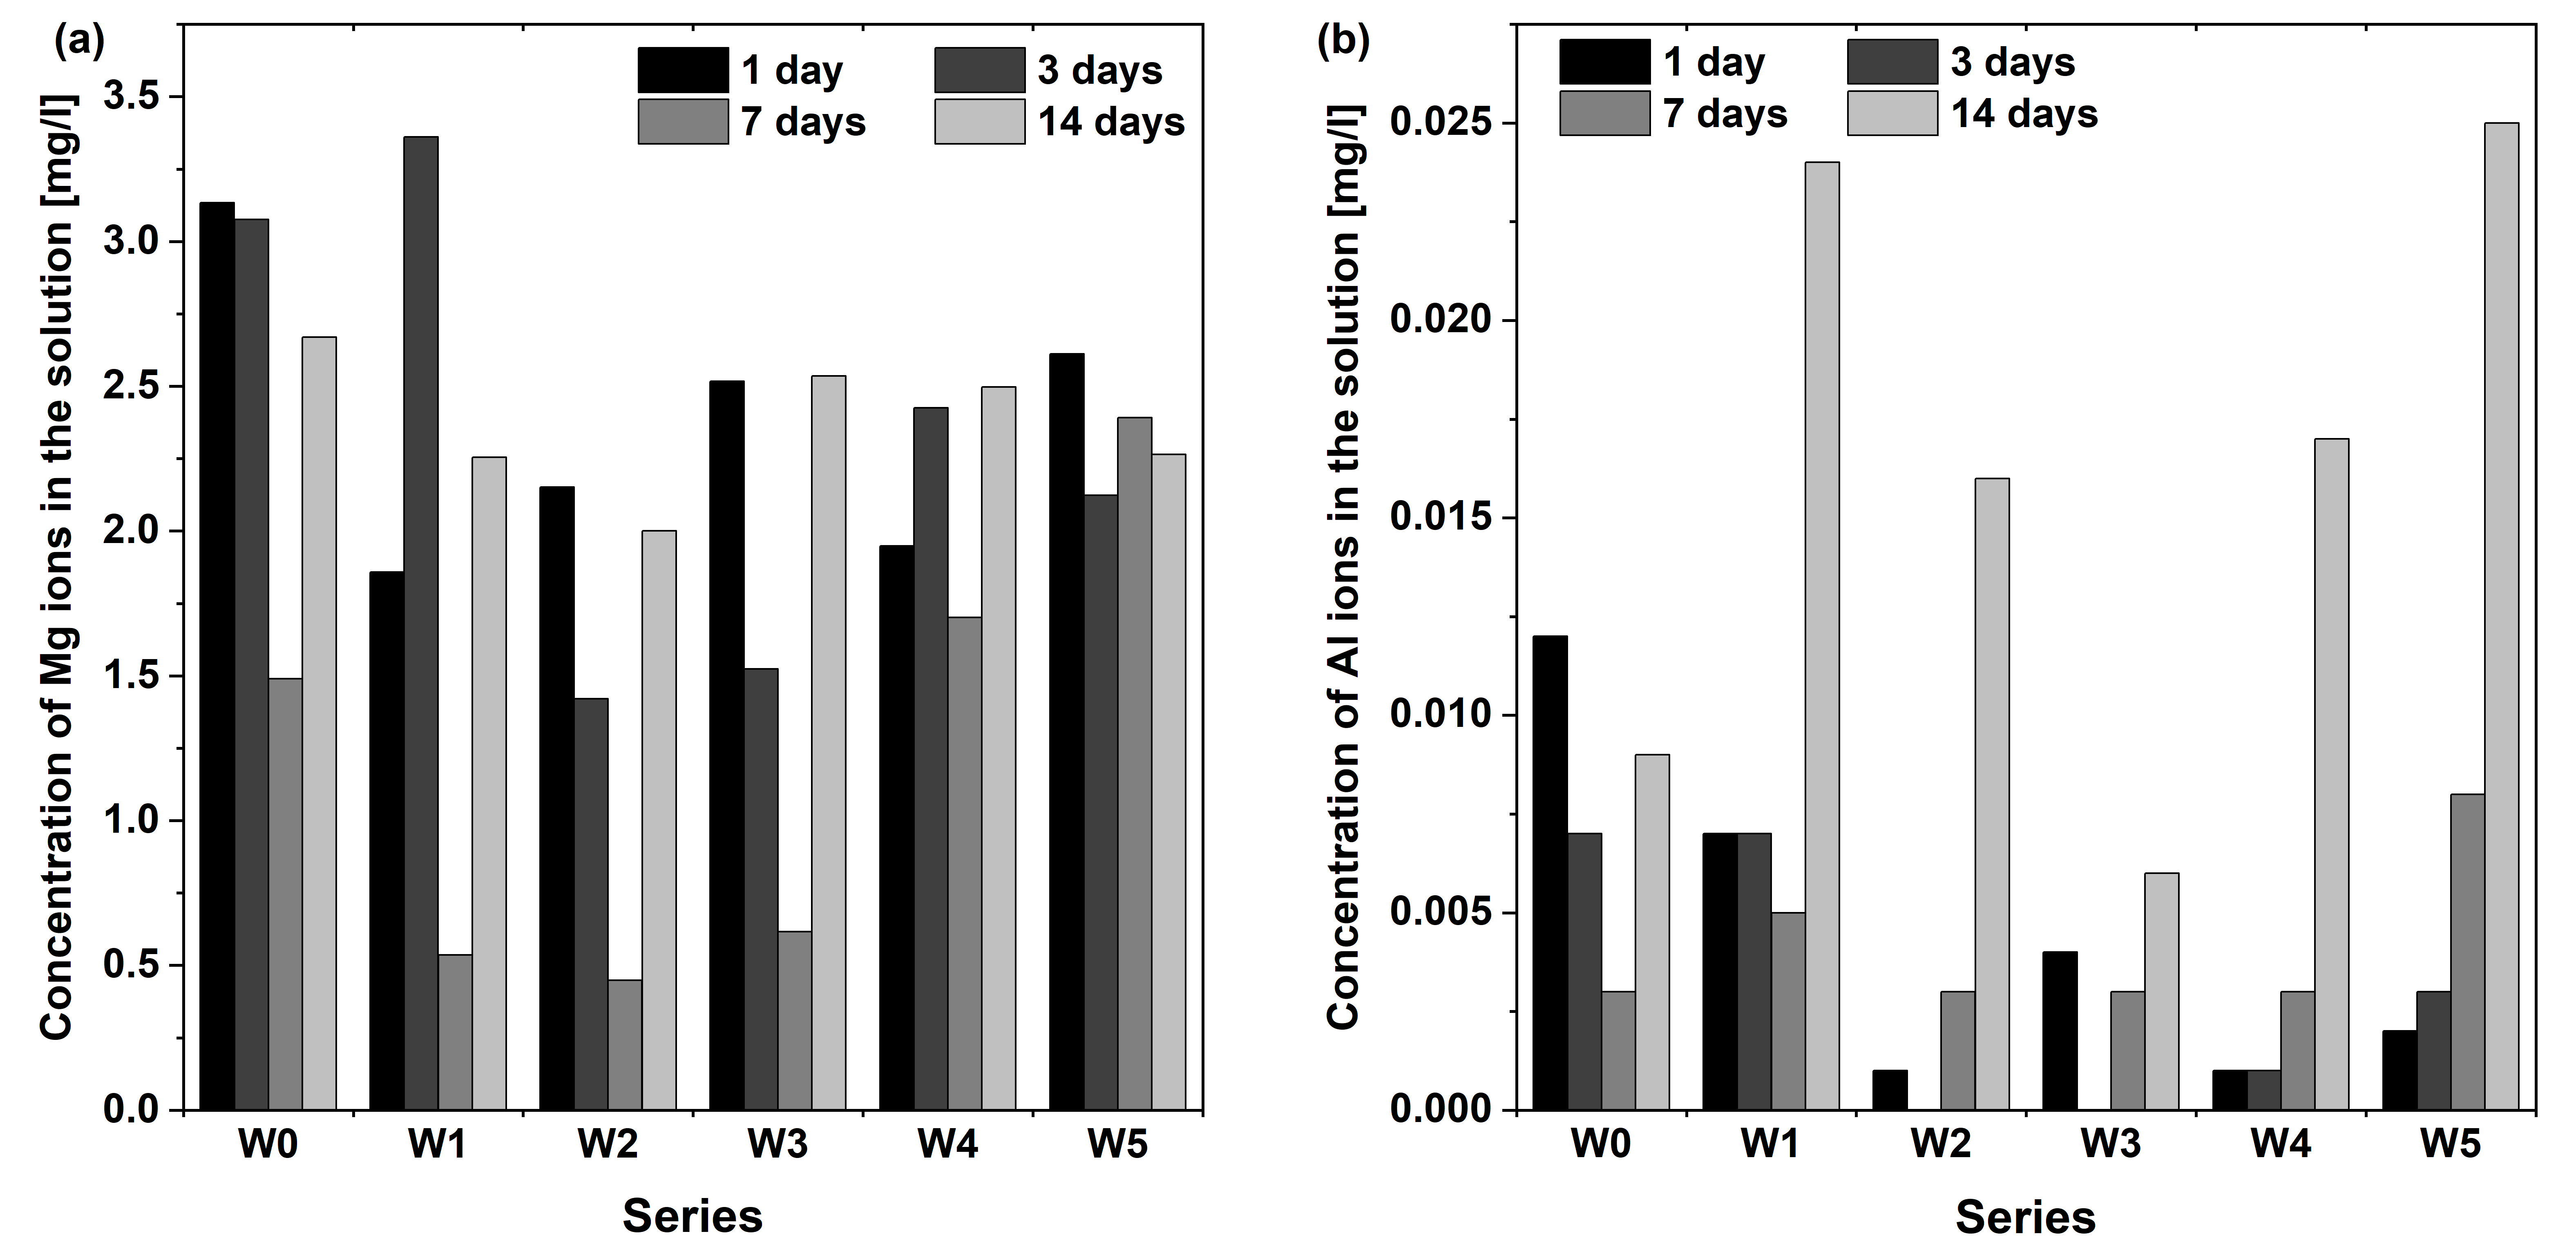
Corrosion behaviour of all experimental magnesium alloy series (W0–W5) in the simulated body fluid (SBF) at 37 °C after immersion for 1, 3, 7, and 14 days has been additionally evaluated based on the results of ICP-MS quantitative analysis of magnesium and aluminum ions released from the alloy substrates into this solution. The obtained results are presented in Figure 11a (data for magnesium) and Figure 11b (aluminum).
From Figure 11, it follows that after one day of reaction, the highest concentration of aluminum ions was in the W0 and W1 samples. The samples covered with biopolymers exhibited considerably smaller rates of aluminum ion release, the effect being especially significant for the samples protected by polylactide (W2 series) and PGLA (W4 series) surface layers, for which Al3+ concentration is minimal, about 0.001 mg/L. A similar dependence is observed for 3-day and 7-day immersions, thus confirming the advantageous effect of the applied biopolymer coatings on the aluminum passing to the corrosive solution. However, the 14-day reaction shows a greatly increased concentration of aluminum ions, which may be evidence of protective capability loss. Crucially, the lowest overall concentration of Al3+ ions after 14 days, and thus the best protective layer in this respect, was observed in PLA+CA (W3 sample series). This distinctive ability to suppress Al3+ release, even surpassing the pure polymer coatings (W2 and W4) at the end of the test, highlights a specific, desirable function of the caffeic acid component, likely by forming a complex or precipitate at the polymer/metal interface or within the polymer matrix. This is a novel and important finding, as aluminum toxicity is a significant concern for biomedical magnesium implants.
In conclusion, the corrosion study of AZ31 Mg alloy, both unmodified (W0 and W1) and surface-modified (W2–W5), in SBF solution demonstrated that the proposed modifications allowed for a distinct improvement in the alloy’s resistance to the corrosive activity of simulated body fluids. The most promising modifications for limiting AZ31 alloy biodegradation were PLA (W2) and PGLA (W4) coatings in terms of sustained barrier integrity, but W3 (PLA+CA) offered superior long-term suppression of Al3+ ion release.

3.8. Cumulative Caffeic Acid Release

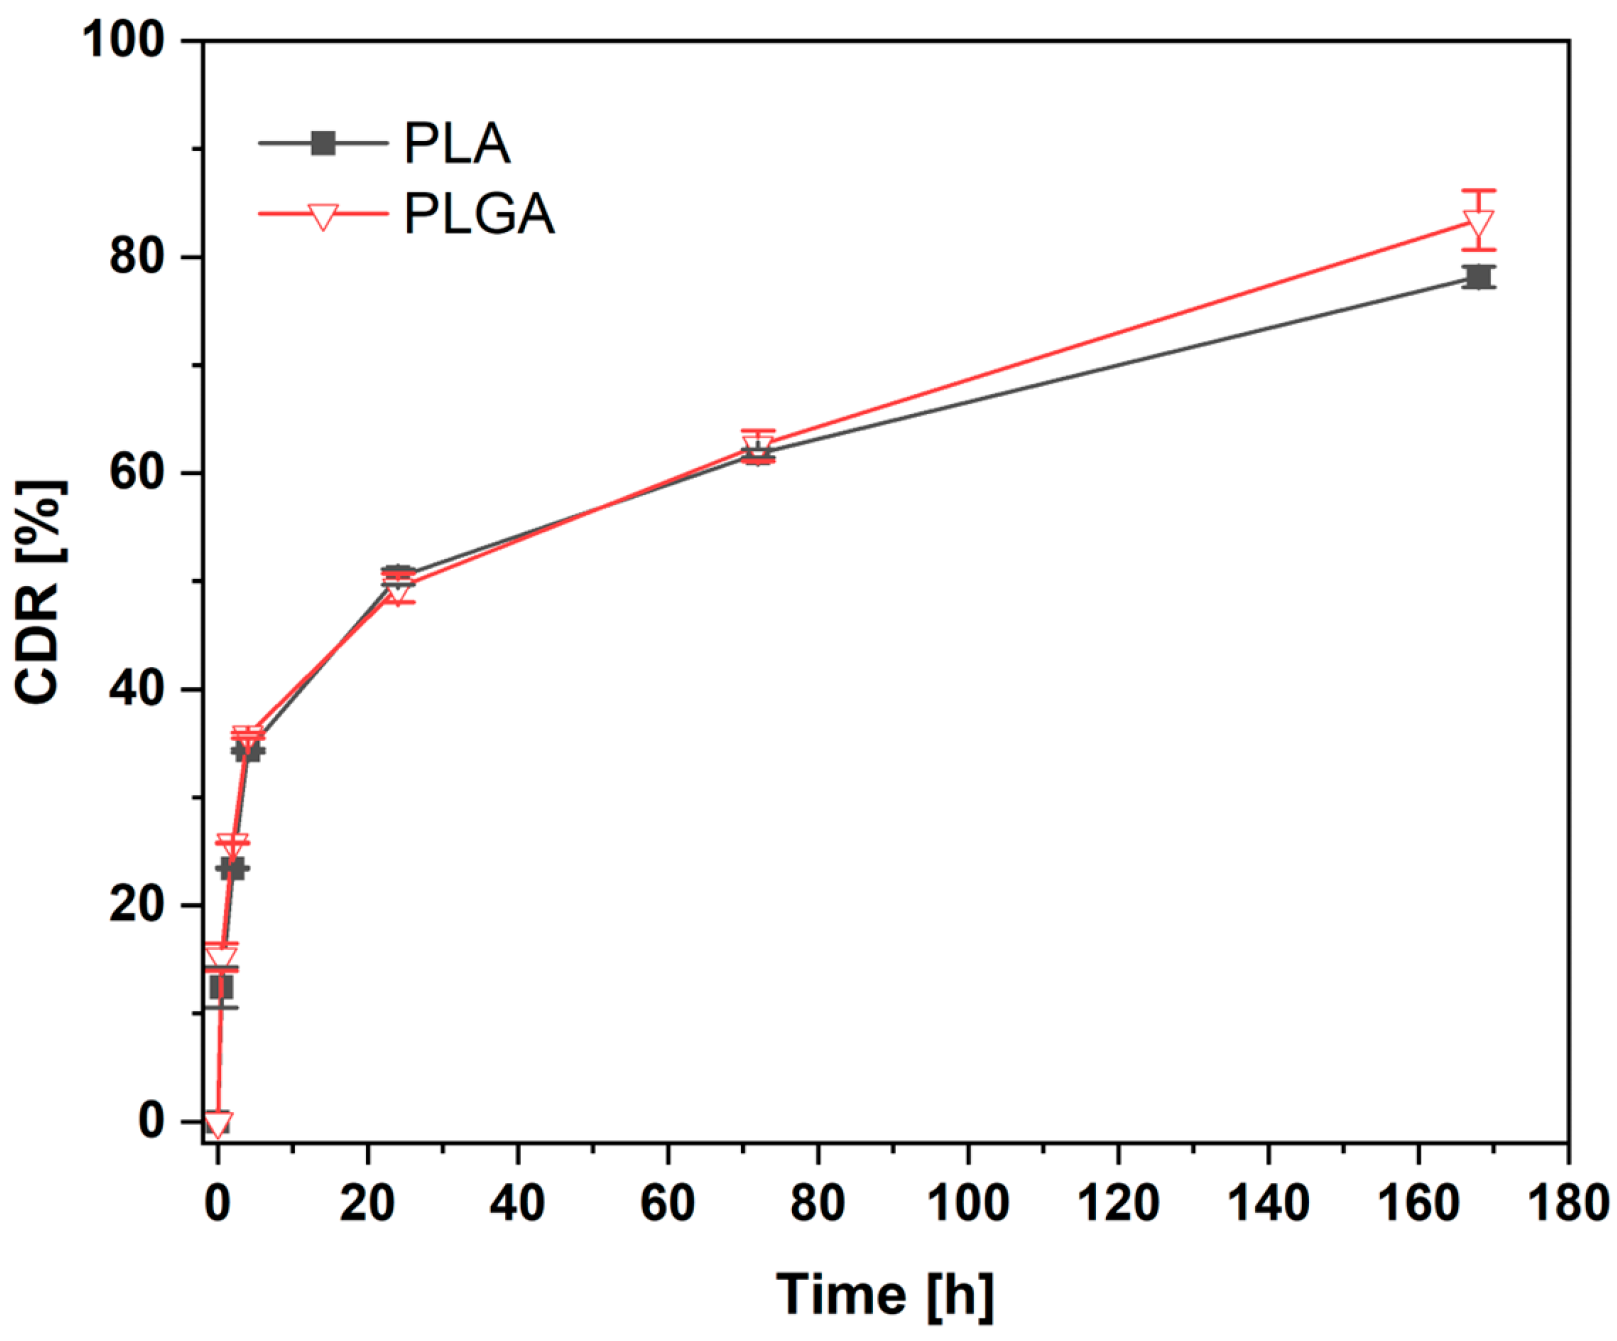
The analysis of cumulative drug release (CDR) for CA released from PLA + CA and PLGA + CA films in PBS media at 37 °C during 5 days of incubation was conducted. The concentration of CA released from polymeric films was determined by HPLC based on the calibration curve. The cumulative percentage of CA release dependence over incubation time is presented in Figure 12.
In general, in our experimental case of films prepared in such a way that the drug (CA) was mixed with polymers (PLA, PLGA) prior to pouring, the release profile in an aqueous environment was found to have biphasic kinetics. An initial burst release is followed by a much slower second process. The high burst release, observed up to the first 4 h, can be ascribed mainly to the fact that the small thickness and the high surface area of films guarantee a short diffusion pathway and are favourable to mass transfer of the drug.
The noticeable difference in the achieved final CDR value for PLGA + CA films (83.44% ± 2.74%) when compared with PLA + CA (78.17% ± 0.93%) after 5 days of release can be explained by the fact that the PLGA polymer is more hydrophilic than PLA. This property can be associated with faster water absorption with the increase in the experimental time, leading to an increase in the polymer relaxation/diffusion ratio. This, in turn, results in more efficient CA release and possible initial degradation of the coating.
The study on the release kinetics proved the combined transport mechanism with the predominant contribution of the Korsmeyer–Peppas simulation. In this model, in particular dedicated to describing polymeric drug delivery systems like hydrogels, the fraction of released agent is proportional to time raised to a diffusional exponent n. The exponents n = 0.30 ± 0.03 and n = 0.27 ± 0.02 for PLA and PLGA, respectively, provide crucial information about the drug release mechanism, indicating that it is driven by diffusion, swelling, and subsequent erosion. It is important to note the very fast kinetics of the initial stage of release (“burst release”). Such a release scenario is extremely important in the design of antibacterial coatings, which must ensure a rapid and effective release of antimicrobial agents in order to prevent the development of peri-implant infection. It is also an important aspect that caffeic acid can presumably be released from PLA and PLGA through hydrolysis. The release rate depends on the molecular structure of the polymer itself and the structure of the biopolymer film. In the case of PLA, the release rate is influenced by its molecular weight and environmental conditions. With PLGA being a copolymer, it releases CA at a rate depending on the ratio of lactic to glycolic acid (higher glycolic content generally leading to faster degradation and release). The observed differences in CA-containing PLA and PLGA porous layers (W3 and W5 series) compared to pure dense polymer ones (W2 and W4, respectively) can influence the release kinetics of caffeic acid. In addition, porosities caused by the introduction of CA to PLA and PLGA can enhance the release kinetics due to increased diffusivity of water-soluble molecules in the polymeric matrices.
Because non-toxic solvents and biopolymers are used in the fabrication process, the resulting coatings loaded with CA are highly promising for a variety of biomedical applications, including wound healing, regenerative medicine, and drug delivery systems.

3.9. Evaluation of Biocompatibility

To determine the biological compatibility of the modified AZ31 alloy surfaces, an in vitro evaluation was performed. This assessment involved a series of cell-based assays focused on tracking cell adhesion and spreading, proliferation, and differentiation. The osteoblast-like cells (MG-63, human osteosarcoma) were selected due to their wide application in bone cell differentiation, proliferation, and metabolism studies. In particular, this human bone-derived cell line is a valuable model to assess the biocompatibility of new biomaterials, including orthopedic implants, by evaluating cell adhesion, proliferation, and cell metabolism.
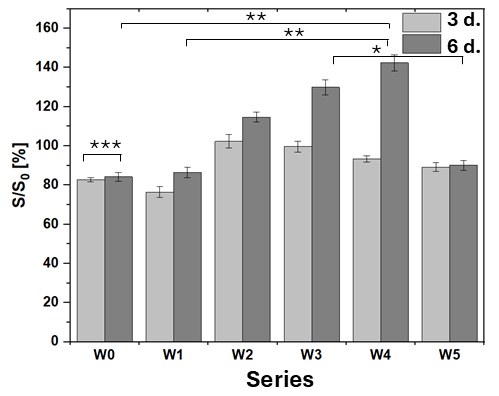
Cell proliferation on the AZ31 surfaces (both modified and unmodified) was assessed at 3 and 6 days via the Alamar Blue assay. Figure 13 shows the cytotoxicity of the substrates, expressed as the fraction of viable cells remaining after culturing.
Both the unmodified (W0) and modified (W1, W2, W3, W4, W5) surfaces supported a steady proliferation of MG-63 cells over the 6-day period of incubation. Cell viability throughout the treatment period was assessed using conventional optical microscopy, which showed no significant morphological changes. The observed increase in the proliferation rate of MG-63 cells over time on the modified AZ31 alloy surfaces suggests no obvious cytotoxicity for any specimen, even after 6 days. Since the relative proliferation rate exceeded 75%, the proposed modifications meet the biocompatibility requirements of the ISO 10993-5 standard, thereby proving their potential for biomedical applications. Additionally, the morphology of the MG-63 cells on the AZ31 alloy surfaces was further examined using a scanning electron microscope, as detailed in Figure 14.
The viability of the osteoblast cells was evident across all samples; they were well-flattened and adapted to the surfaces of both the unmodified (W0) and modified (W1–W5) AZ31 alloys. The clear observation of intercellular junctions confirms the cells’ successful differentiation and integration. Consequently, this demonstrates that the surface modifications are biocompatible and will effectively facilitate osseointegration; however, the W3 (PLA + CA) and W4 series, being a continuous layer, demonstrated the best biocompatibility. Specifically, the superior cell proliferation and morphology observed on the W3 (PLA + CA) surface suggest that the moderate increase in surface roughness and the active release of CA overcome the initial structural porosity to promote the best osteoblast-like cell response.
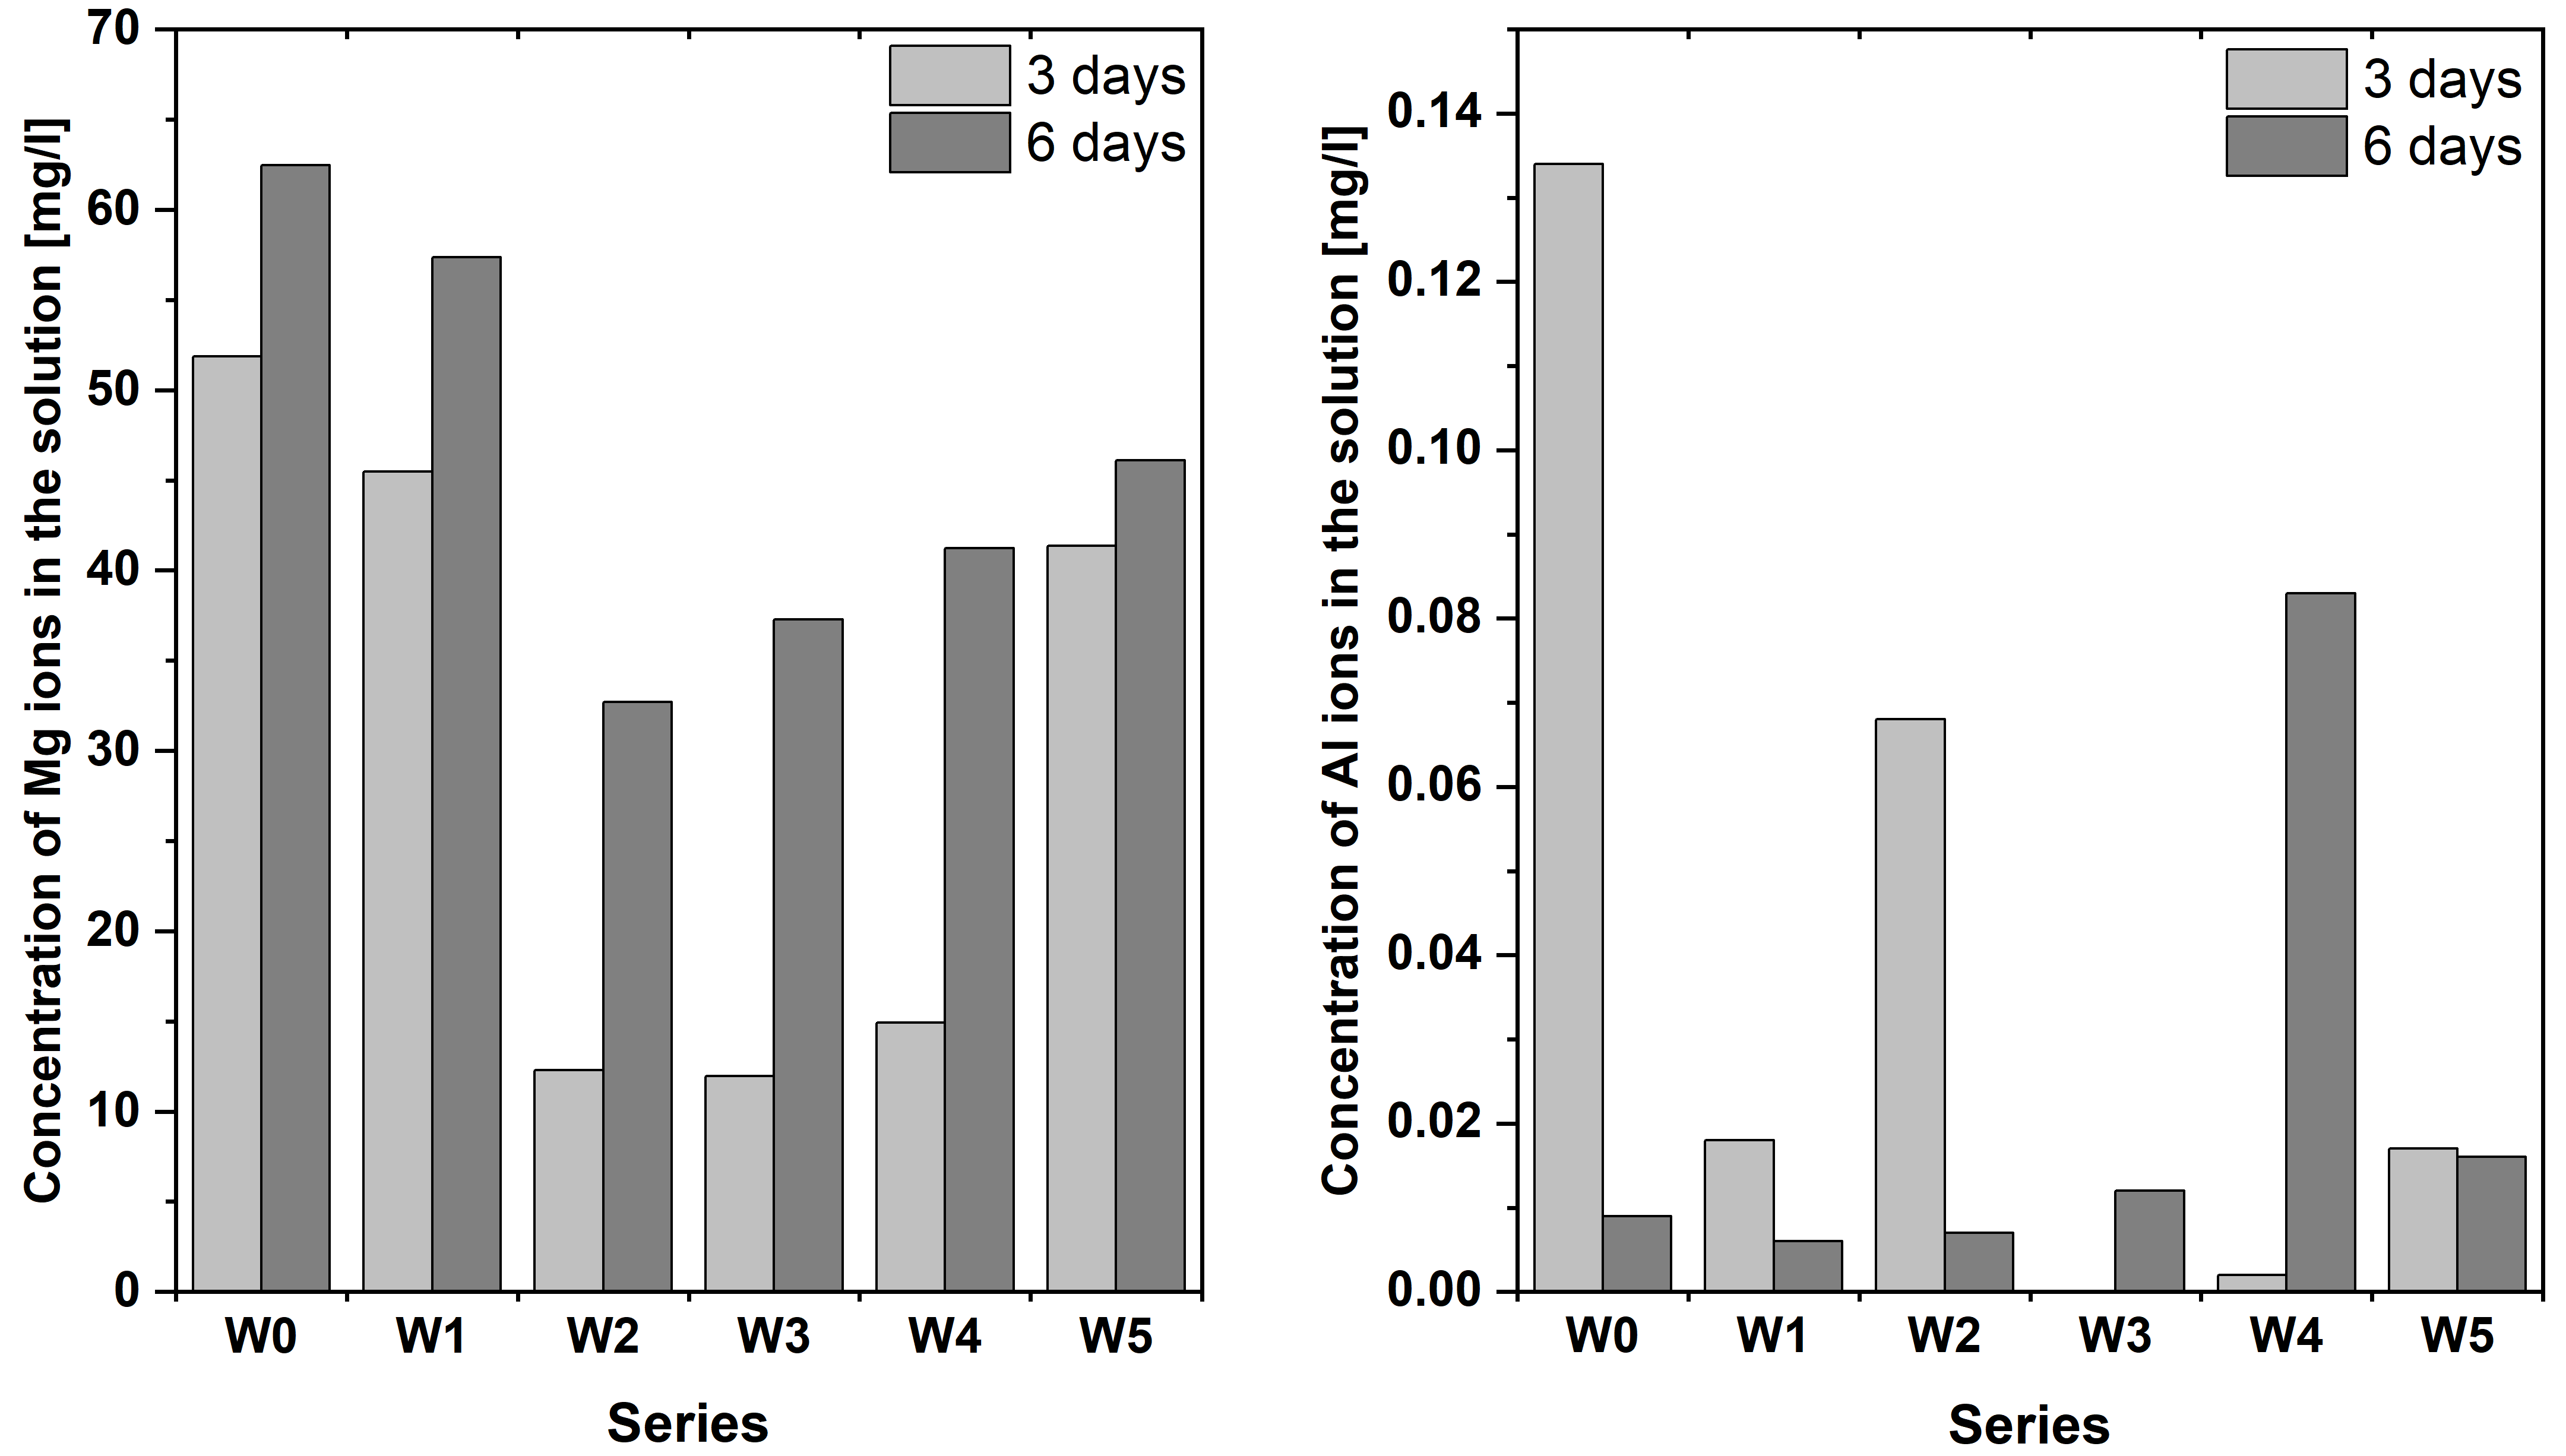
Despite the favourable biological and mechanical properties of magnesium alloys, their biomedical applications are limited due to their extremely rapid corrosion rates. This is particularly problematic in a physiological environment with a pH of 7.4–7.6 in the presence of body fluids and a chloride ion concentration of 150 mM [45]. Significant degradation rates can lead to the release of large amounts of Mg2+ ions, local accumulation of hydrogen, alkalization, and, consequently, loss of mechanical properties of the implant material [46]. Therefore, to enable clinical application of magnesium alloys, it is necessary to understand the corrosion mechanisms and release kinetics of the metallic elements. Thus, finally, the release of the Mg2+ and Al3+ ions from the AZ31 alloys after 3 and 6 days of MG-63 cells proliferation on substrates was determined by ICP-MS analysis (Figure 15).
Mg2+ ions are released at concentrations three orders of magnitude higher (ca. 12–63 mg/L) than Al3+ ions (ca. 0.005–0.134 mg/L). For all samples, the Mg2+ concentration increases over time (from 3 to 6 days), confirming continuous degradation of the alloy. The unmodified alloy (W0) shows the highest release of both Mg2+ and Al3+. All bio-polymer-based coatings (W2–W5) effectively reduce the overall corrosion rate compared to W0 and W1. The PLA coating (W2, W3) is the most effective at the early stage (3 days) in suppressing the release of Mg2+. The most critical finding relates to the release of potentially toxic Al3+ ions. While PLA and PLGA coatings (W2, W4) show some spikes in Al3+ release, the samples that included caffeic acid (CA), specifically W3 (PLA + CA) and W5 (PLGA + CA), were the most efficient at minimizing the release of Al3+ across both time points. The observed suppression of Al3+ ion release can also be explained by the chelate formation reaction. Aluminum ions complexation with both the catechol and carboxylic functional groups of caffeic acid is possible. The addition of the caffeic acid (CA) in the PLA (W3) and PLGA (W5) composite coatings imparts a synergistic effect, leading to superior corrosion mitigation and the minimization of systemic exposure to Al3+ ions, with prospects for biomedical application.

4. Conclusions

In the present work, surface modification of AZ31 magnesium alloy by preliminary plasmochemical and then chemical in Piranha solution treatment (W1 sample series), followed by immersion coating of biopolymers: polylactide (PLA) (W2 series), polylactide with caffeic acid (PLA + CA) (W3 series), polyglycolatide (PLGA) (W4 series), or polylactide-co-glycolide with caffeic acid (PLGA + CA) was conducted. The conducted study of the unmodified (W0 series) and surface-modified (W1–W5) alloy samples allowed us to draw the following conclusions:
(1)
Preliminary surface treatment allowed the successful removal of impurities and made a positive impact on the surface finish, increasing microscopic unevenness on the alloy surface of the W1 sample series. This effect allowed for obtaining continuous and well-adherent to the metallic core biopolymer coatings after deposition and also durability tests in SBF solution (except for the samples of W5 series).
(2)
Surfaces of PLA, PLGA, and PLGA + CA layers showed higher roughness in comparison to the metallic core and were hydrophilic, which can foster the osseointegration.
(3)
The addition of caffeic acid to PLA and PLGA changed the structure of the coating surfaces in comparison to those obtained from both pure biopolymers leading to the formation of porous bubbles and increasing the coefficient of friction values and friction force. The induced porosity for W3 and W5 resulted in a temporary loss of barrier integrity after 7 days, but the W3 coating recovered continuity at 14 days. This porous structure, while initially compromising corrosion protection, is beneficial for the necessary initial burst release of CA and, particularly for W3, supports the best cell proliferation.
(4)
PLA and PLGA biopolymer layers on the AZ31 alloy ensured desirable biofunctionality and no obvious cytotoxicity, enabling osseointegration of the implant in contact with the MG-63 osteoblast cell line, as confirmed by the progressive proliferation of the cells on the investigated surfaces of modified AZ31 alloy substrates for all specimens after 6 days. The relative proliferation rate exceeding 75% and the presence of intercellular junctions characteristic of osteoblasts prove the biocompatibility of proposed modifications, proving the potential of such surface modifications of the studied Mg alloy.
(5)
Efficient CA release with a possible transport mechanism based on the Korsmeyer–Peppas model and with the characteristic initial “burst release” ensures effective antimicrobial agent release at the initial step of curation after implantation, followed by slower release governed by the diffusion and further erosion of the polymeric coating.
(6)
The proposed surface modifications, by depositing PLA and PLGA layers on AZ31 alloy, improved its resistance to corrosion in the applied simulated body fluid (SBF) solution. Layers of the W2 and W4 series preserved their continuity and adhesion after 14-day contact with this solution, and, additionally, the W4 series showed the presence of globular structures typical of apatite. This formation on the surface of the obtained biopolymer layers is beneficial for the application of the material in bone implantology. Barrier protection against Al3+ ions release into the SBF solution for initial periods, less than 14 days, was also confirmed. A major and novel finding is that the CA-containing PLA coating (W3) exhibits superior performance in suppressing the long-term release of potentially toxic Al3+ ions into the SBF solution, which is a critical concern for AZ31-based implants.
In conclusion, it can be ascertained that the technology of modifying AZ31 Mg alloy surface by immersion coating with PLA and PLGA layers proposed and applied in this study is beneficial for the application of this alloy as a material for orthopedic implants. It allows for obtaining continuous and well-adherent to the alloy substrate biopolymer structures, exhibiting good biocompatibility and protective properties against corrosion in a body fluid. The best results in this respect were obtained for the W2 series, which features a PLA layer, in terms of initial barrier integrity, thus offering significant potential in biomedical applications, especially in orthopedic implantology. However, the most promising strategy balancing all the properties is polylactide with caffeic acid (W3 series). Coatings of this sample series are continuous at 14 days, exhibit the best overall cell proliferation likely due to a combination of increased surface roughness and active CA release, show the best proliferation of MG-63 cells, and, most significantly, demonstrate a unique capability to suppress the long-term release of Al3+ ions into the body fluid. Despite a spike in Al3+ release after 6 days, it exhibited relatively the best biocompatibility in the proliferation test and the lowest final Al3+ concentration.

Supplementary Materials

The following supporting information can be downloaded at: https://www.mdpi.com/article/10.3390/coatings15111309/s1, Figure S1. Photographic comparison of biopolymer coatings on the surface of AZ31 magnesium alloy: W0—unmodified AZ31 magnesium alloy, W1—samples after activation by chemical and plasmochemical treatment, W2—PLA coating, W3—PLGA/CA coating, W4—PLGA coating and W5—PLGA/CA coating.

Author Contributions

Conceptualization, K.K.; methodology, K.K. and A.K.; validation, M.G., A.K. and S.K.; formal analysis, J.P., M.G., A.K., M.H. and S.K.; investigation, K.K., M.G., A.K., M.H. and S.K.; resources, K.K. and A.K.; data curation, J.P., M.G., A.K., M.H. and S.K.; writing—original draft preparation, K.K., J.P., A.K. and S.K.; writing—review and editing, K.K.; visualization, K.K., M.G. and A.K.; supervision, K.K.; project administration, K.K. and A.K.; funding acquisition, K.K. All authors have read and agreed to the published version of the manuscript.

Funding

This work was supported from the subsidy of the Ministry of Education and Science for the AGH University of Kraków (Project No. 16.16.160.557). Agnieszka Kyzioł acknowledges the National Science Center (Poland) within project OPUS 22 (2021/43/B/ST4/02833).

Institutional Review Board Statement

Not applicable.

Informed Consent Statement

Not applicable.

Data Availability Statement

The original contributions presented in this study are included in the article. Further inquiries can be directed to the corresponding author.

Acknowledgments

The authors would like to thank Kinga Walczyk for carrying out part of the experimental research as part of her master’s thesis under the scientific supervision of Karol Kyzioł. The authors would also like to thank Dominika Pawcenis for providing the laboratory infrastructure (heat incubator) to perform the release tests of caffeic acid.

Conflicts of Interest

The authors declare no conflicts of interest.

References

  1. Chen, Q.; Thouas, G.A. Metallic Implant Biomaterials. Mater. Sci. Eng. R Rep. 2015, 87, 1–57. [Google Scholar] [CrossRef]
  2. Esen, Z.; Dikici, B.; Duygulu, O.; Dericioglu, A.F. Titanium-Magnesium Based Composites: Mechanical Properties and in-Vitro Corrosion Response in Ringer’s Solution. Mater. Sci. Eng. A 2013, 573, 119–126. [Google Scholar] [CrossRef]
  3. Mahapatro, A. Bio-Functional Nano-Coatings on Metallic Biomaterials. Mater. Sci. Eng. C 2015, 55, 227–251. [Google Scholar] [CrossRef] [PubMed]
  4. Babaei, M.; Murchio, S.; Emanuelli, L.; De Biasi, R.; Branca Vergano, L.; Giuliani, R.; Tian, S.; Wille, M.L.; Berto, F.; Pellizzari, M.; et al. Metal Additive Manufacturing of Lattice-Based Orthopedic Implants: A Comprehensive Review of Requirements and Design Strategies. Mater. Sci. Eng. R Rep. 2025, 166, 101075. [Google Scholar] [CrossRef]
  5. Rahman, M.; Dutta, N.K.; Roy Choudhury, N. Magnesium Alloys With Tunable Interfaces as Bone Implant Materials. Front. Bioeng. Biotechnol. 2020, 8, 564. [Google Scholar] [CrossRef]
  6. Morsada, Z.; Hossain, M.M.; Islam, M.T.; Mobin, M.A.; Saha, S. Recent Progress in Biodegradable and Bioresorbable Materials: From Passive Implants to Active Electronics. Appl. Mater. Today 2021, 25, 101257. [Google Scholar] [CrossRef]
  7. Khan, A.R.; Grewal, N.S.; Zhou, C.; Yuan, K.; Zhang, H.J.; Jun, Z. Recent Advances in Biodegradable Metals for Implant Applications: Exploring in Vivo and in Vitro Responses. Results Eng. 2023, 20, 101526. [Google Scholar] [CrossRef]
  8. Mohd Salaha, Z.F.; Abdullah, N.N.A.A.; Chan, K.F.; Gan, H.S.; Mohd Yusop, M.Z.; Ramlee, M.H. Biodegradable Orthopaedic Implants: A Systematic Review of in Vitro and in Vivo Evaluations of Magnesium, Iron, and Zinc Alloys. Results Eng. 2025, 27, 105746. [Google Scholar] [CrossRef]
  9. Xing, F.; Li, S.; Yin, D.; Xie, J.; Rommens, P.M.; Xiang, Z.; Liu, M.; Ritz, U. Recent Progress in Mg-Based Alloys as a Novel Bioabsorbable Biomaterials for Orthopedic Applications. J. Magnes. Alloy 2022, 10, 1428–1456. [Google Scholar] [CrossRef]
  10. Zhang, L.; Zhang, J.; Chen, C.; Gu, Y. Advances in Microarc Oxidation Coated AZ31 Mg Alloys for Biomedical Applications. Corros. Sci. 2015, 91, 7–28. [Google Scholar] [CrossRef]
  11. Ma, D.; Sun, Z.; Zhao, Q.; Zhang, Y.; Li, W.; Wang, J.; Chen, Y.; Zhao, M.; Wang, J.; Huang, J.; et al. In Vitro and in Vivo Degradation Behavior of an Assembled Magnesium Alloy Suture Anchor for Ligament-Bone Reconstruction. Acta Biomater. 2025, 205, 723–736. [Google Scholar] [CrossRef]
  12. Zhou, K.; Lu, Q.; Qin, J.; Shi, H.; Zhang, P.; Yan, H.; Shi, H.; Wang, X. A View of Magnesium Alloy Modification and Its Application in Orthopedic Implants. J. Mater. Res. Technol. 2025, 36, 1536–1561. [Google Scholar] [CrossRef]
  13. Sun, Z.; Wang, J.; Wang, J.; Li, W.; Zhao, Q.; Ma, D.; Li, W.; Zhang, Y.; Huang, J.; Zhao, M.; et al. Metabolic Behavior of the Degradation Products of Magnesium Alloys in Bone Tissue. J. Magnes. Alloy 2025. [Google Scholar] [CrossRef]
  14. Dong, J.; Lin, T.; Shao, H.; Wang, H.; Wang, X.; Song, K.; Li, Q. Advances in Degradation Behavior of Biomedical Magnesium Alloys: A Review. J. Alloys Compd. 2022, 908, 164600. [Google Scholar] [CrossRef]
  15. Zhou, H.; Liang, B.; Jiang, H.; Deng, Z.; Yu, K. Magnesium-Based Biomaterials as Emerging Agents for Bone Repair and Regeneration: From Mechanism to Application. J. Magnes. Alloy 2021, 9, 779–804. [Google Scholar] [CrossRef]
  16. Cundy, T.; Grey, A.; Reid, I.R. CHAPTER 6—Calcium, Phosphate and Magnesium. In Clinical Biochemistry: Metabolic and Clinical Aspects, 3rd ed.; Marshall, W.J., Lapsley, M., Day, A.P., Ayling, R.M., Eds.; Churchill Livingstone: London, UK, 2014; pp. 93–123. ISBN 978-0-7020-5140-1. [Google Scholar]
  17. Harris, E.D. Cofactors: Inorganic. In Encyclopedia of Human Nutrition, 3rd ed.; Caballero, B., Ed.; Academic Press: Waltham, MA, USA, 2013; pp. 357–365. ISBN 978-0-12-384885-7. [Google Scholar]
  18. Yu, T.; Jiang, J.; Yu, Q.; Li, X.; Zeng, F. Structural Insights into the Distortion of the Ribosomal Small Subunit at Different Magnesium Concentrations. Biomolecules 2023, 13, 566. [Google Scholar] [CrossRef]
  19. Ashique, S.; Kumar, S.; Hussain, A.; Mishra, N.; Garg, A.; Gowda, B.H.J.; Farid, A.; Gupta, G.; Dua, K.; Taghizadeh-Hesary, F. A Narrative Review on the Role of Magnesium in Immune Regulation, Inflammation, Infectious Diseases, and Cancer. J. Health Popul. Nutr. 2023, 42, 74. [Google Scholar] [CrossRef] [PubMed]
  20. Yavuzyegit, B.; Karali, A.; De Mori, A.; Smith, N.; Usov, S.; Shashkov, P.; Bonithon, R.; Blunn, G. Evaluation of Corrosion Performance of AZ31 Mg Alloy in Physiological and Highly Corrosive Solutions. ACS Appl. Bio. Mater. 2024, 7, 1735–1747. [Google Scholar] [CrossRef] [PubMed]
  21. Noviana, D.; Paramitha, D.; Ulum, M.F.; Hermawan, H. The Effect of Hydrogen Gas Evolution of Magnesium Implant on the Postimplantation Mortality of Rats. J. Orthop. Transl. 2016, 5, 9–15. [Google Scholar] [CrossRef] [PubMed]
  22. Mousavian, S.M.H.; Bautin, V.A.; Tabaian, S.H. Advanced Strategies for Mg-Based Biodegradable Implants: Alloying, Heat Treatment, and Coatings. J. Alloys Compd. 2025, 1040, 183575. [Google Scholar] [CrossRef]
  23. Panahi, Z.; Tamjid, E.; Rezaei, M. Surface Modification of Biodegradable AZ91 Magnesium Alloy by Electrospun Polymer Nanocomposite: Evaluation of in Vitro Degradation and Cytocompatibility. Surf. Coat. Technol. 2020, 386, 125461. [Google Scholar] [CrossRef]
  24. He, X.; Li, Y.; Zou, D.; Zu, H.; Li, W.; Zheng, Y. An Overview of Magnesium-Based Implants in Orthopaedics and a Prospect of Its Application in Spine Fusion. Bioact. Mater. 2024, 39, 456–478. [Google Scholar] [CrossRef]
  25. Ji, R.; Mo, F.; Liang, L.; Tian, C.; Dong, S.; Deng, C.; Wu, H.; Zhou, L.; Zhao, X. Biodegradable Polylactic Acid (PLA) Copolymer Materials: Structural Design, Synthesis Strategy, the Relationship between Structure and Performance, Industrial Application. Chem. Eng. J. 2025, 524, 169602. [Google Scholar] [CrossRef]
  26. Maadani, A.M.; Davoodian, F.; Salahinejad, E. Effects of PLGA Coating on Biological and Mechanical Behaviors of Tissue Engineering Scaffolds. Prog. Org. Coat. 2023, 176, 107406. [Google Scholar] [CrossRef]
  27. Shi, L.; Chen, S.; Zheng, F.; Liu, M.; Yang, H.; Zhang, B. Corrosion Resistance Evaluation of Biodegradable Magnesium Alloy Vascular Stents Optimized by Mechanical Adapted Polymer Coating Strategy. Colloids Surf. A Physicochem. Eng. Asp. 2023, 658, 130664. [Google Scholar] [CrossRef]
  28. Montero, C.; Ramírez, C.G.; Muñoz, L.; Sancy, M.; Azócar, M.; Flores, M.; Artigas, A.; Zagal, J.H.; Zhou, X.; Monsalve, A.; et al. Effect of Plasma Argon Pretreatment on the Surface Properties of AZ31 Magnesium Alloy. Materials 2023, 16, 2327. [Google Scholar] [CrossRef]
  29. Tian, P.; Liu, X. Surface Modification of Biodegradable Magnesium and Its Alloys for Biomedical Applications. Regen. Biomater. 2015, 2, 135–151. [Google Scholar] [CrossRef]
  30. Kokubo, T.; Takadama, H. How Useful Is SBF in Predicting in Vivo Bone Bioactivity? Biomaterials 2006, 27, 2907–2915. [Google Scholar] [CrossRef]
  31. Kyzioł, A.; Michna, J.; Moreno, I.; Gamez, E.; Irusta, S. Preparation and Characterization of Electrospun Alginate Nanofibers Loaded with Ciprofloxacin Hydrochloride. Eur. Polym. J. 2017, 96, 350–360. [Google Scholar] [CrossRef]
  32. Kyzioł, A.; Mazgała, A.; Michna, J.; Regiel-Futyra, A.; Sebastian, V. Preparation and Characterization of Alginate/Chitosan Formulations for Ciprofloxacin-Controlled Delivery. J. Biomater. Appl. 2017, 32, 162–174. [Google Scholar] [CrossRef]
  33. Garlotta, D. A Literature Review of Poly(Lactic Acid). J. Polym. Environ. 2001, 9, 63–84. [Google Scholar] [CrossRef]
  34. Tosovic, J. Spectroscopic Features of Caffeic Acid: Theoretical Study. Kragujev. J. Sci. 2017, 39, 99–108. [Google Scholar] [CrossRef]
  35. Xiao, H.; Wang, L. Effects of X-Shaped Reduction-Sensitive Amphiphilic Block Copolymer on Drug Delivery. Int. J. Nanomed. 2015, 10, 5309–5325. [Google Scholar] [CrossRef]
  36. Singh, G.; Tanurajvir, K.; Ravinder, K.; Kaur, A. Recent Biomedical Applications and Patents on Biodegradable Polymer-PLGA. Int. J. Pharmacol. Pharm. Sci. 2014, 1, 30–42. [Google Scholar]
  37. Jiang, W.; Tian, Q.; Vuong, T.; Shashaty, M.; Gopez, C.; Sanders, T.; Liu, H. Comparison Study on Four Biodegradable Polymer Coatings for Controlling Magnesium Degradation and Human Endothelial Cell Adhesion and Spreading. ACS Biomater. Sci. Eng. 2017, 3, 936–950. [Google Scholar] [CrossRef]
  38. Wu, G.; Feng, K.; Shanaghi, A.; Zhao, Y.; Xu, R.; Yuan, G.; Chu, P.K. Effects of Surface Alloying on Electrochemical Corrosion Behavior of Oxygen-Plasma-Modified Biomedical Magnesium Alloy. Surf. Coat. Technol. 2012, 206, 3186–3195. [Google Scholar] [CrossRef]
  39. Tiyyagura, H.R.; Puliyalil, H.; Filipič, G.; Kumar, K.C.; Pottathara, Y.B.; Rudolf, R.; Fuchs-Godec, R.; Mohan, M.K.; Cvelbar, U. Corrosion Studies of Plasma Modified Magnesium Alloy in Simulated Body Fluid (SBF) Solutions. Surf. Coat. Technol. 2020, 385, 125434. [Google Scholar] [CrossRef]
  40. Alberti, C.J.; Saito, E.; De Freitas, F.E.; Reis, D.A.P.; MacHado, J.P.B.; Dos Reis, A.G. Effect of Etching Temperature on Surface Properties of Ti6Al4V Alloy for Use in Biomedical Applications. Mater. Res. 2019, 22, e20180782. [Google Scholar] [CrossRef]
  41. Abdelrahim, R.A.; Badr, N.A.; Baroudi, K. The Effect of Plasma Surface Treatment on the Bioactivity of Titanium Implant Materials (in Vitro). J. Int. Soc. Prev. Community Dent. 2016, 6, 15–21. [Google Scholar] [CrossRef] [PubMed]
  42. Menzies, K.L.; Jones, L. The Impact of Contact Angle on the Biocompatibility of Biomaterials. Optom. Vis. Sci. 2010, 87, 387–399. [Google Scholar] [CrossRef] [PubMed]
  43. Karacan, I.; Ben-Nissan, B.; Wang, H.A.; Juritza, A.; Swain, M.V.; Müller, W.H.; Chou, J.; Stamboulis, A.; Macha, I.J.; Taraschi, V. Mechanical Testing of Antimicrobial Biocomposite Coating on Metallic Medical Implants as Drug Delivery System. Mater. Sci. Eng. C Mater. Biol. Appl. 2019, 104, 109757. [Google Scholar] [CrossRef]
  44. Ren, Y.; Babaie, E.; Bhaduri, S.B. Nanostructured Amorphous Magnesium Phosphate/Poly (Lactic Acid) Composite Coating for Enhanced Corrosion Resistance and Bioactivity of Biodegradable AZ31 Magnesium Alloy. Prog. Org. Coat. 2018, 118, 1–8. [Google Scholar] [CrossRef]
  45. Li, M.; Cheng, Y.; Zheng, Y.F.; Zhang, X.; Xi, T.F.; Wei, S.C. Surface Characteristics and Corrosion Behaviour of WE43 Magnesium Alloy Coated by SiC Film. Appl. Surf. Sci. 2012, 258, 3074–3081. [Google Scholar] [CrossRef]
  46. Witte, F. The History of Biodegradable Magnesium Implants: A Review: The THERMEC’2009 Biodegradable Metals. Acta Biomater. 2010, 6, 1680–1692. [Google Scholar] [CrossRef] [PubMed]
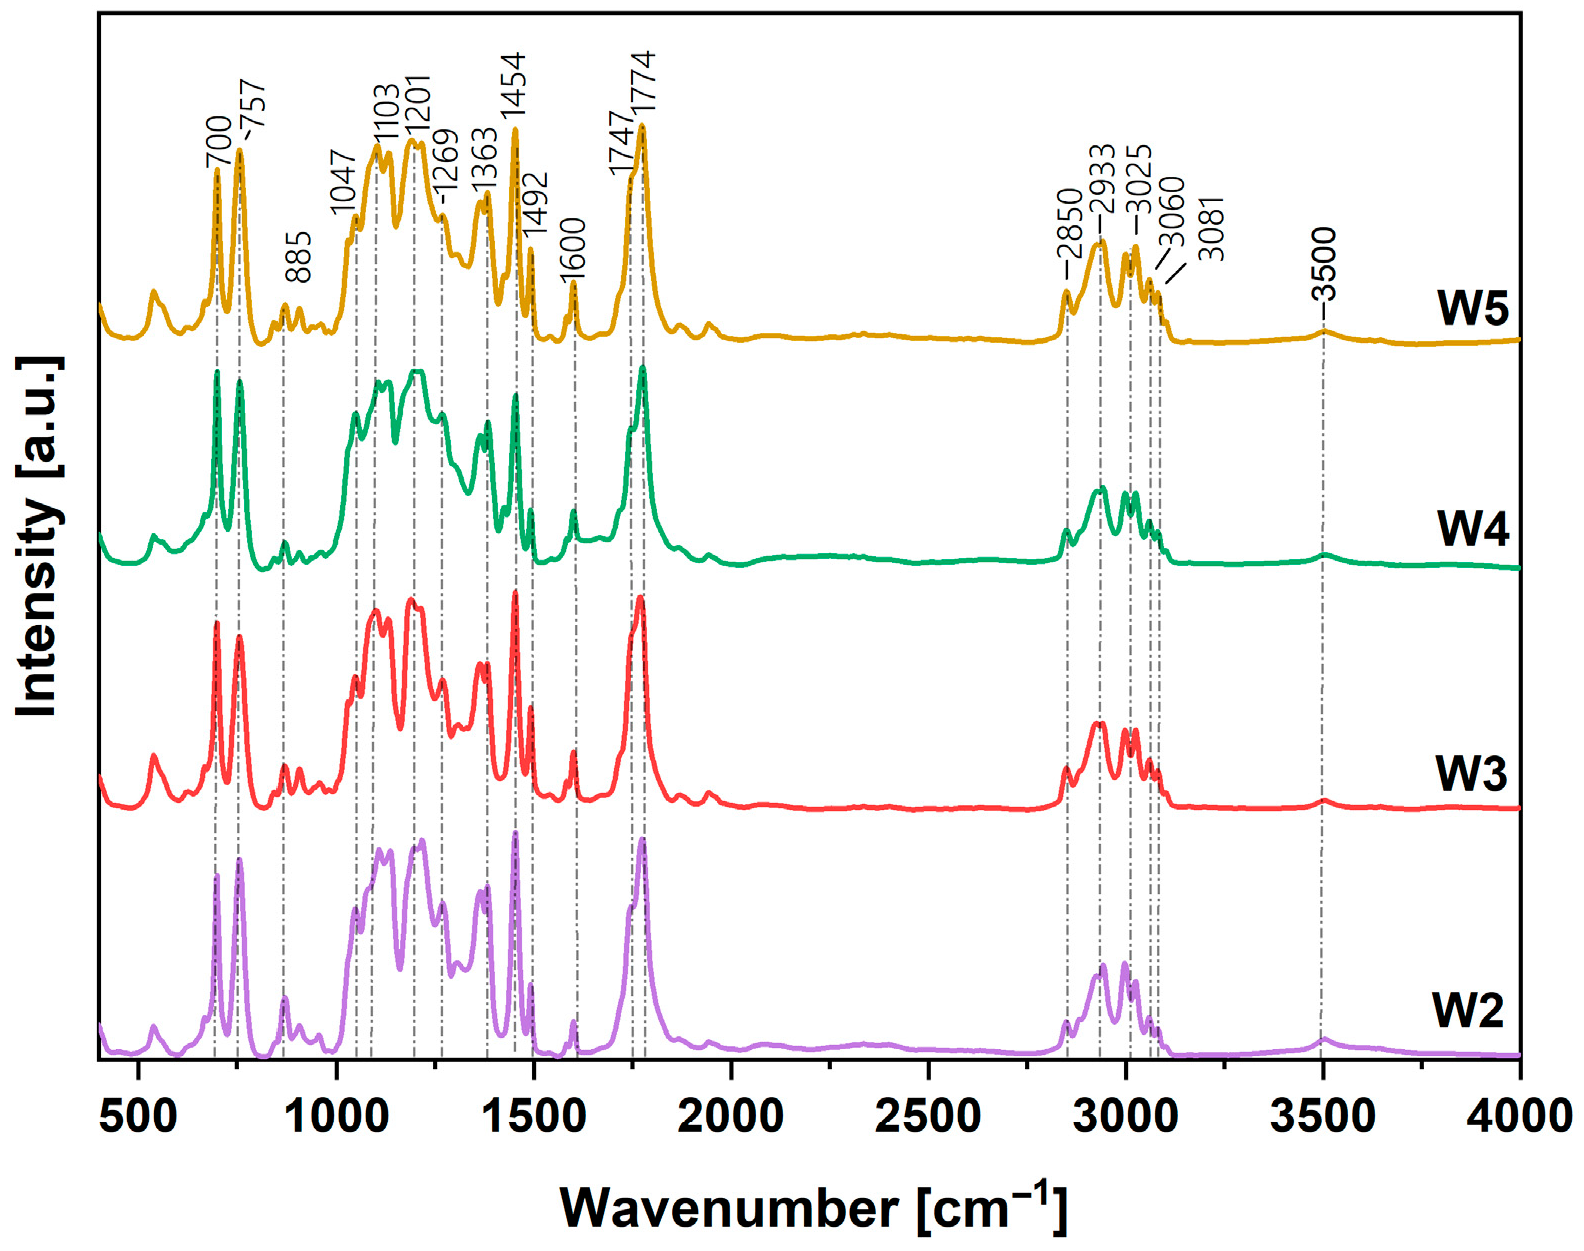
Figure 1. IR ATR spectra of the biopolymer layers formed on the surface of AZ31 alloy: W2—PLA, W3—PLGA/CA, W4—PLGA, and W5—PLGA/CA.
Coatings 15 01309 g001
Figure 2. Raman spectra of the biopolymer layers formed on the surface of AZ31 alloy: W2—PLA, W3—PLGA/CA, W4—PLGA and W5—PLGA/CA.
Coatings 15 01309 g002
Figure 3. SEM images of the surface of unmodified AZ31 magnesium alloy (W0) and subjected to different activation: (W1W5); 1000×.
Coatings 15 01309 g003
Figure 4. SEM images of the surface of AZ31 alloy after modification with the preparation of polylactide layers with caffeic acid (W3) and polylactide-co-glycolide layers with caffeic acid (W5); 5000×.
Coatings 15 01309 g004
Figure 5. Three-dimensional surface profiles of the magnesium alloy AZ31 samples with different surface treatments: W0—unmodified AZ31 alloy, W1—AZ31 alloy activated in Piranha solution and after plasmochemical activation; AZ31 alloys activated in Piranha solution, after plasmochemical activation, and after layers deposition: W2—PLA, W3—PLA + CA, W4—PLGA, W5—PLGA + CA. The blue section indicates the cross-section.
Coatings 15 01309 g005
Figure 6. Contact angle measurements for W0W5 series (a) and corresponding SFE values (γ) with polar (γp) and dispersive (γd) contributions obtained by OWRK model (b).
Coatings 15 01309 g006
Figure 7. Selected scratch test results of unmodified AZ31 magnesium alloy (W0) and after modification (W1, W2, and W4).
Coatings 15 01309 g007
Figure 8. SEM surface morphology of unmodified AZ31 magnesium alloy (W0) and those subjected to different activation: W1W5 after immersion for 7 days in the SBF solution; 1000×. (W1—activation in Piranha solution and plasmochemical treatment; AZ31 alloys activated in Piranha solution, after plasmochemical activation, and after layers of deposition: W2—PLA, W3—PLA + CA, W4—PLGA, W5—PLGA + CA).
Coatings 15 01309 g008
Figure 9. Results of EDS analysis from surfaces of unmodified AZ31 magnesium alloy (W0) and those subjected to different activation: W1W5 after immersion for 7 days in the SBF solution; 1000×. (W1—activation in Piranha solution and plasmochemical treatment; AZ31 alloys activated in Piranha solution, after plasmochemical activation, and after layers deposition: W2—PLA, W3—PLA + CA, W4—PLGA, W5—PLGA + CA).
Coatings 15 01309 g009
Figure 10. SEM surface morphology of unmodified AZ31 magnesium alloy (W0) and subjected to different activation: W1W5 after immersion for 14 days in the SBF solution; 1000×. (W1—activation in Piranha solution and plasmochemical treatment; AZ31 alloys activated in Piranha solution, after plasmochemical activation, and after layers deposition: W2—PLA, W3—PLA + CA, W4—PLGA, W5—PLGA + CA).
Coatings 15 01309 g010
Figure 11. W. Magnesium ion (a) and aluminum ion (b) concentrations in the analyzed simulated body fluid (SBF) after 1-,3-,7-, and 14-day immersions of AZ31 magnesium alloy (W0) and subjected to different activation: W1W5 after immersion for 7 days in the SBF solution; 1000×. (W1—activation in Piranha solution and plasmochemical treatment; AZ31 alloys activated in Piranha solution, after plasmochemical activation, and after layers deposition: W2—PLA, W3—PLA + CA, W4—PLGA, W5—PLGA + CA).
Coatings 15 01309 g011
Figure 12. Kinetic curves of caffeic acid release over time in PBS media at 37 °C from the PLA + CA (W3) and PLGA + CA (W5) layers.
Coatings 15 01309 g012
Figure 13. Proliferation of MG-63 cells on modified and unmodified AZ31 surfaces evaluated by Alamar Blue assay conducted at time points of 3 and 6 days. W0—unmodified AZ31 alloy, W1—AZ31 alloy activated in Piranha solution and after plasmochemical activation; AZ31 alloys activated in Piranha solution, after plasmochemical activation, and after layers deposition: W2—PLA, W3—PLA + CA, W4—PLGA, W5—PLGA + CA. Symbols denote groups with statistically significant differences: * p <0.01, ** p < 0.05, *** p > 0.05.
Coatings 15 01309 g013
Figure 14. SEM images of fixed MG-63 cells cultured for 6 days on the unmodified (W0) and modified AZ31 alloy substrates (W1—activation in Piranha solution and plasmochemical treatment; AZ31 alloys activated in Piranha solution, after plasmochemical activation, and after layers deposition: W2—PLA, W3—PLA + CA, W4—PLGA, W5—PLGA + CA).
Coatings 15 01309 g014
Figure 15. ICP-MS analysis of the culture media after 3 and 6 days of MG-63 cells proliferation on samples. W0—unmodified AZ31 alloy, W1—AZ31 alloy activated in Piranha solution and after plasmochemical activation; AZ31 alloys activated in Piranha solution, after plasmochemical activation, and after layers deposition: W2—PLA, W3—PLA + CA, W4—PLGA, W5—PLGA + CA.
Coatings 15 01309 g015
Table 1. Chemical composition of AZ31 magnesium alloy (wt.%) based on product specification provided by the manufacturer (GoodFellow Cambridge Ltd.).
ElementAlZnMnSiCuCaFeNiMg
Content [wt.%] 2.5 ÷ 3.50.7 ÷ 1.30.20.10.050.040.0050.005Balance
Table 2. Details of applied processes during modification of AZ31 substrate.
Sample No.Type of Surface Treatment
W0unmodified AZ31 magnesium alloy
W1after chemical and plasmochemical surface activation (SA)
W2SA + PLA coating
W3SA + PLA/CA coating
W4SA + PLGA coating
W5SA + PLGA/CA coating
Table 3. Ionic and reagent concentrations of proposed SBF formulation.
IonConcentration, mM
sodium ion142.7
potassium ion5.0
magnesium ion1.5
calcium ion2.6
chloride187.8
hydrogen carbonate1262.3
hydrogen phosphate1.0
sulphate0.5
Tris0.05
Table 4. Concentration of selected elements based on EDS analysis of W0–W5 samples.
ElementConcentration, wt.%
W0W1W2W4W5
Mg 95.6 ± 0.180.1 ± 0.12.3 ± 0.12.4 ± 0.1------------
Al2.1 ± 0.12.9 ± 0.11.2 ± 0.10.8 ± 0.1------------
Zn0.2 ± 0.1------------------------------------------------
O2.1 ± 0.117.0 ± 0.116.8 ± 0.110.7 ± 0.121.4 ± 0.1
C------------------------79.7 ± 0.186.1 ± 0.173.6 ± 0.1
Table 5. Average values of the coefficient of friction μ and friction force (Ff) for W0–W5 series.
Series NameCoefficient of Friction μ [-]Friction Force (Ff) [N]
W00.34 ± 0.261.73 ± 0.06
W10.30 ± 0.051.71 ± 0.07
W20.43 ± 0.041.88 ± 0.09
W30.56 ± 0.111.97 ± 0.08
W40.53 ± 0.091.94 ± 0.08
W50.69 ± 0.042.08 ± 0.14
Disclaimer/Publisher’s Note: The statements, opinions and data contained in all publications are solely those of the individual author(s) and contributor(s) and not of MDPI and/or the editor(s). MDPI and/or the editor(s) disclaim responsibility for any injury to people or property resulting from any ideas, methods, instructions or products referred to in the content.