Article

Mechanical Consequences of Gap-Graded Soils Subjected to Internal Erosion: The Effect of Mode of Removal of Fine Particles Using Discrete Element Method

1
Nanchang Urban Planning & Design Institute Group Co., Ltd., Nanchang 330038, China
2
School of Civil Engineering, Central South University, Changsha 410075, China
*
Author to whom correspondence should be addressed.
Coatings 2025, 15(10), 1218; https://doi.org/10.3390/coatings15101218
Submission received: 10 September 2025 / Revised: 2 October 2025 / Accepted: 13 October 2025 / Published: 16 October 2025
(This article belongs to the Section Corrosion, Wear and Erosion)

Abstract

Seepage-induced internal erosion occurs when the hydraulic forces are sufficient to detach fine particles and transport them out of the structure, leading to notable changes in soil characteristics such as particle size distribution, pore size distribution, and pore structure, which will, in turn, have significant influences on the mechanical properties of soil. In this study, three approaches were utilized to model the erosion-induced loss of fine particles, i.e., deleting fine particles randomly (RM), by contact force (CF), and by coordination number (CN) using the discrete element method (DEM). The impact of each fine particle removal mode on both micro- and macro-mechanical soil properties, including peak strength, dilation, critical state characteristics, average particle coordination number, and contact force distribution, is comprehensively analyzed and compared. The results demonstrate that residual strength was insensitive to removal method, whereas at 10% fines loss, peak strength decreased by up to 17% and the secant stiffness E50 decreased by nearly 48%. This work provides a foundation for simulating the internal erosion of gap-graded soils.

Graphical Abstract

1. Introduction

Internal erosion is a multifaceted phenomenon that involves the movement and redistribution of fine soil particles within the pore network formed by the soil structure under the action of seepage flow. It has been shown through various investigations that internal erosion can cause substantial changes to both the macroscopic and microscopic characteristics of soil, such as particle size distribution (PSD), void ratio, and pore structure and distribution. Consequently, this process influences key soil properties including strength, deformation behavior, and permeability, serving as a critical contributor to geotechnical failures like dam breaches [1], tunnel leakage [2], and slope instability [3]. Recent studies also link internal erosion to the seismic behavior of shallow underground stations [4].
In recent decades, internal erosion has emerged as a focal research topic among scholars. Numerous studies have employed comprehensive theoretical and experimental approaches in addressing vital issues like criteria for assessing internal erosion susceptibility and characterizing its developmental patterns. For example, substantial efforts have been devoted to proposing various empirical criteria for evaluating the internal instability of soil based on synthesizing a wealth of test results [5,6]. By leveraging traditional permeability devices as well as custom-made apparatuses, researchers have explored critical factors such as the threshold hydraulic gradient for triggering internal erosion [7], the evolution of fine-particle loss [8,9], permeability coefficient [10], particle size distribution [11,12], and pore network morphology [13]. Meanwhile, the development of internal erosion under diverse hydraulic conditions has been deduced following the mass conservation law with consideration of the governing skeleton grains, erodible fines, and pore fluid [14,15]. The aforementioned efforts have considerably advanced the accurate comprehension of internal erosion mechanisms.
Furthermore, to elucidate the impacts of internal erosion on soil mechanical properties, some scholars have performed stress path tests on samples both prior to and post-erosion, aiming to establish quantitative links between the varying degrees of internal erosion and soil stress–strain behavior [16,17]. In addition, soluble additives such as salt or sugar have been used to simulate fine-particle loss, known as the “pre-dissolution method”, and discrepancies in soil mechanical properties before and after dissolution have been examined [18,19].
Numerical simulations have proven effective for investigating the micro-scale mechanisms of internal erosion. For gap-graded granular materials prone to erosion, elucidating the evolution of their mechanical properties requires a multi-scale approach. Determining the representative volume element (RVE) ensures accurate numerical simulations of homogenized behavior [20], and homogenization techniques can link micro-scale particle interactions to macro-scale stiffness [21]. Additionally, advanced coupled methods model particle migration under hydraulic forces highlighting complex fluid–particle interactions [22,23,24]. In terms of DEM research, a prevalent method involves eliminating mobile fine particles to explore the consequences of fine depletion on soil properties. For example, Scholtès et al. [25] constructed a three-dimensional (3D) discrete element model and analytical micro-mechanical framework using the open-source discrete element software Yade-OpenDEM to examine the influences of partial component deletion on soil mechanical response. Muir Wood et al. [26] employed the two-dimensional (2D) discrete element model to systematically extract fines in ascending particle size order, simulating internal erosion development and establishing relationships between gradation evolution and soil critical state as well as peak strength. Additionally, Hicher et al. [11] adopted a similar method to investigate dam instability and failure mechanisms attributable to hydraulic erosion by progressively eliminating the finest fractions under constant deviatoric stress triaxial loading conditions. In addition, other studies mimic the progress of internal erosion by deleting fine particles randomly [27], or based on the contact force [28]. However, a question might arise as to whether those different methods have different effects on the mechanical properties of eroded soil, which still lacks a comprehensive comparative study in the literature.
Nonetheless, it is uncertain whether various DEM deletion methods result in different macro- and micro-mechanical behavior. This work fills this knowledge gap through an extensive comparison of three fine particle removal methods—random deletion (RM), contact force (CF), and coordination number (CN)—on several mechanical and microstructural characteristics.

2. Numerical Simulation

2.1. Model Establishment

2.1.1. Sample Preparation

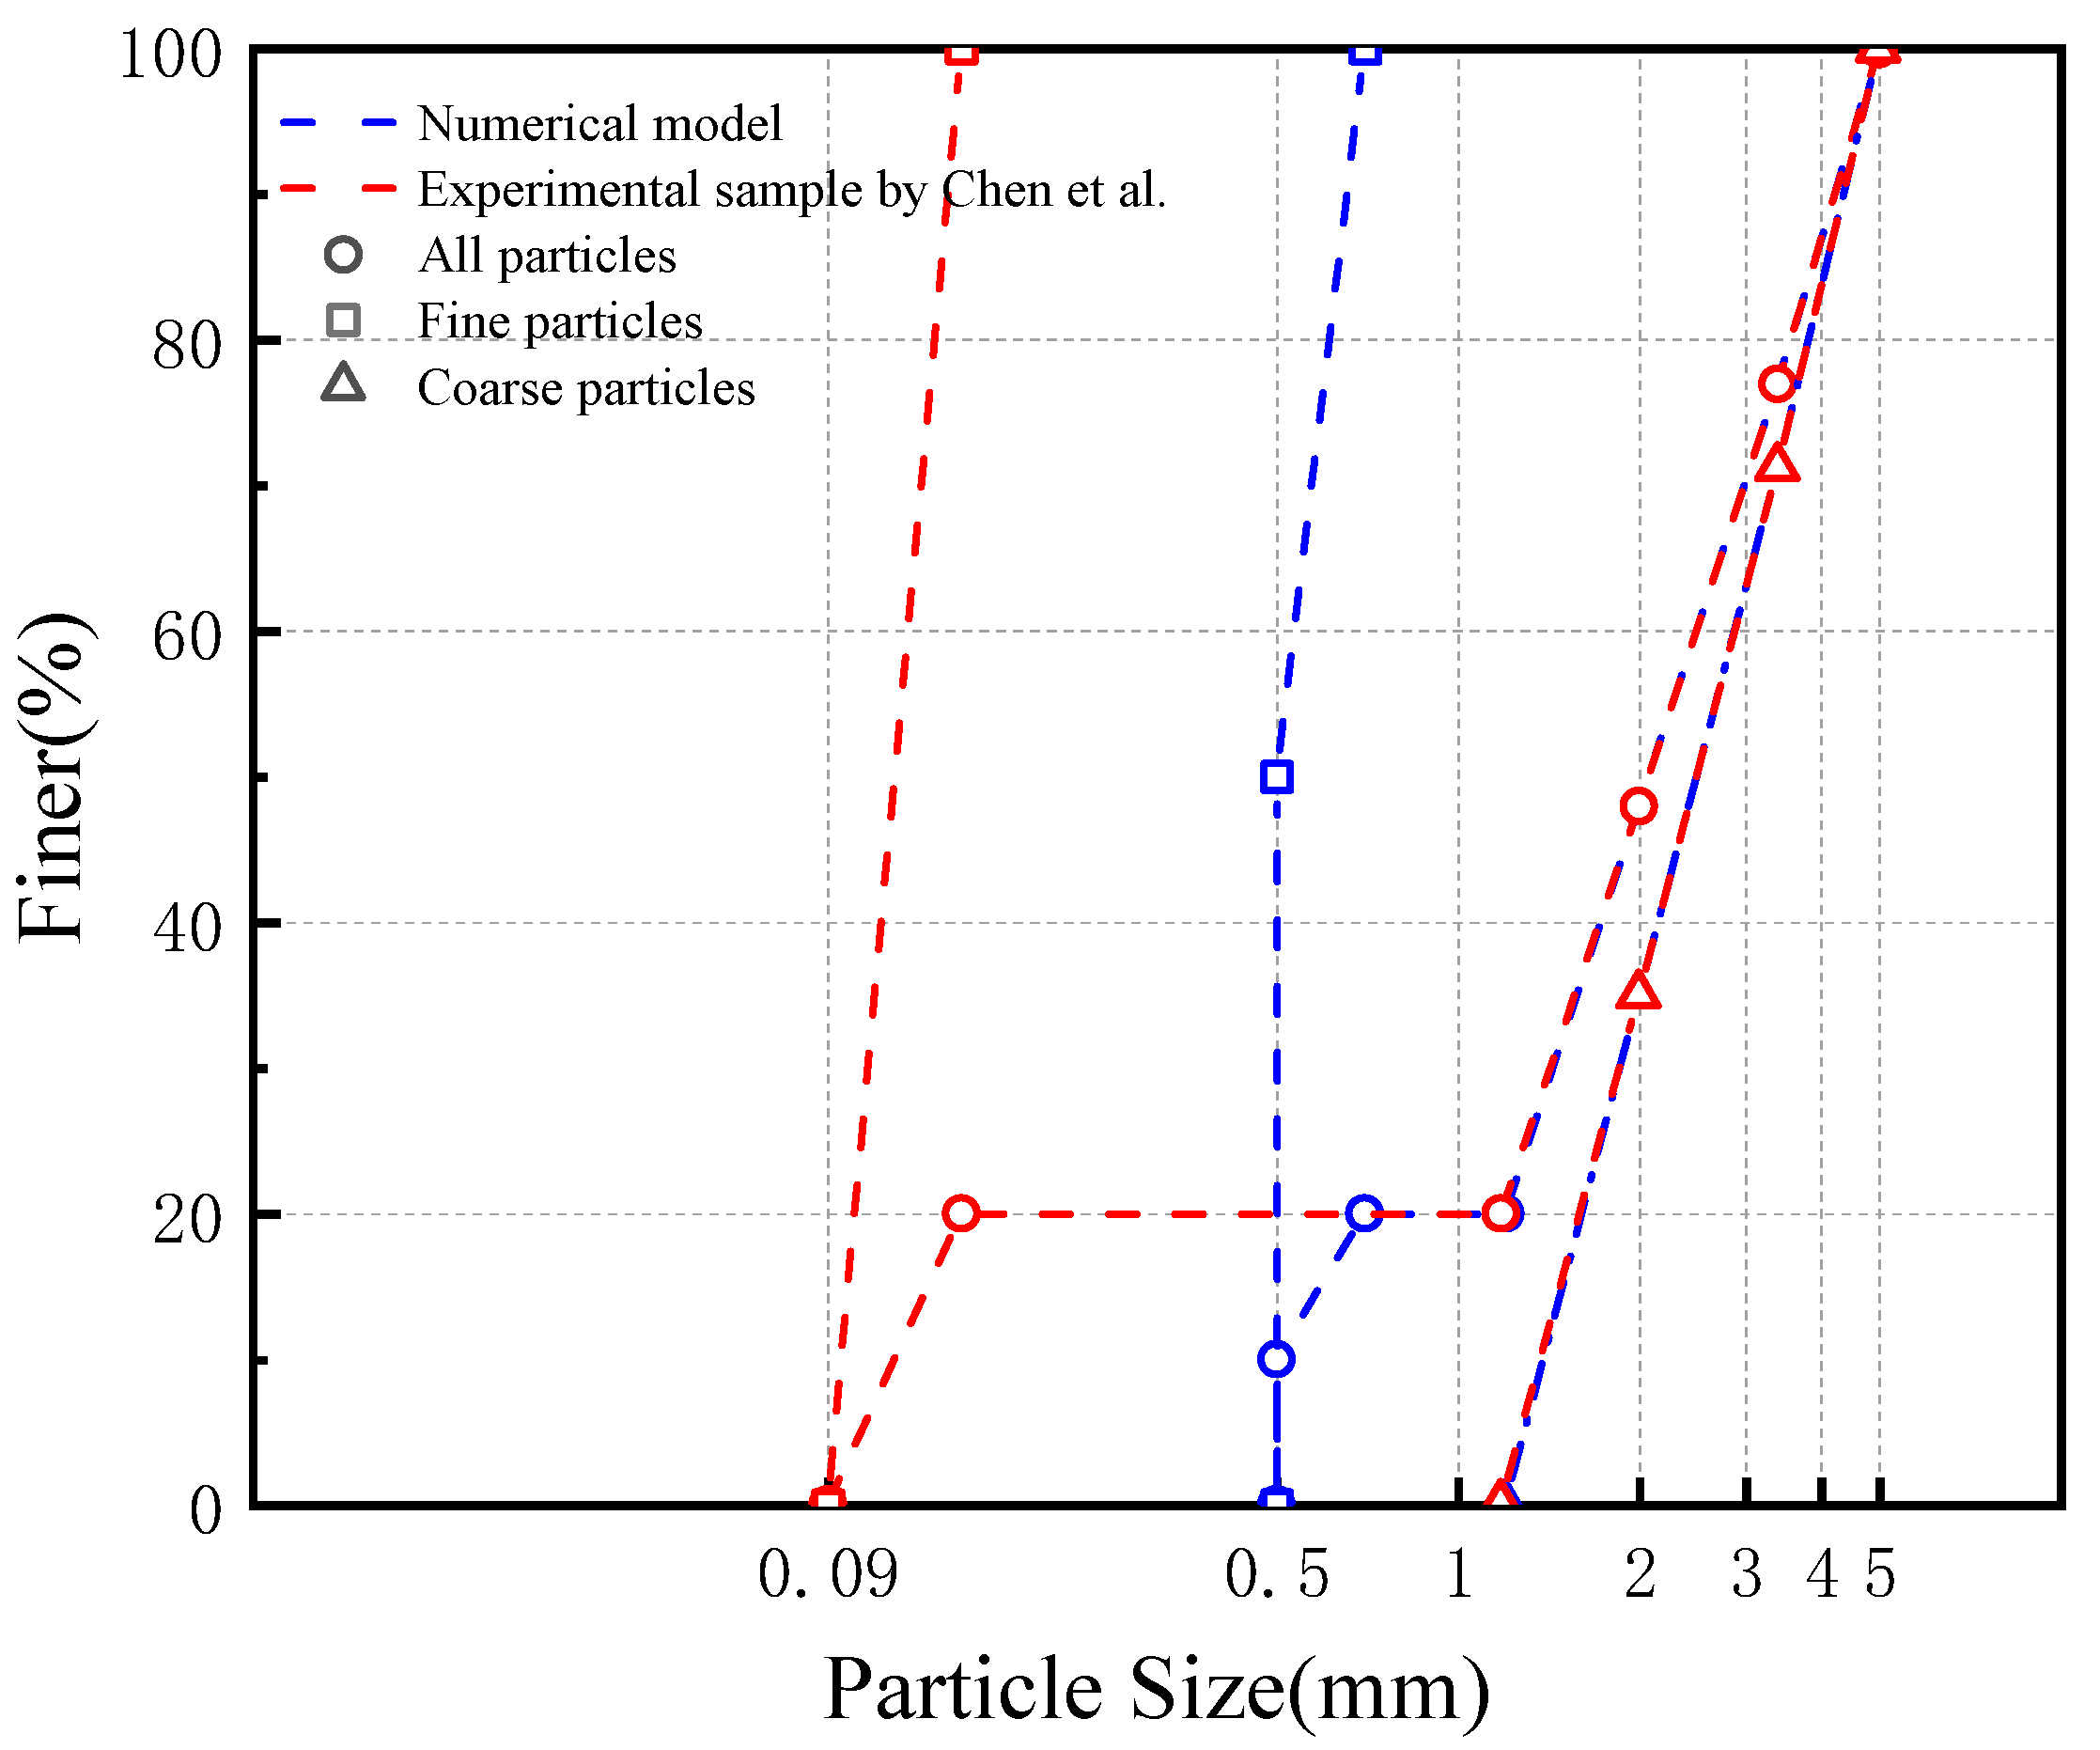
A gap-graded soil sample is adopted in the simulations with particle size less than 0.7 mm being considered as erodible fine particles and particle size larger than 1.2 mm being treated as the skeleton coarse particles. The PSD simulated in this study is presented in Figure 1, which is considered as unstable soil using the stability criteria proposed by Kézdi et al. [29], who suggested that the soil is deemed stable if the following Equation (1) is satisfied.
D 15 / d 85 > 4
where D15 is the particle size below which 15% of the coarse/skeleton fraction lies by mass; d85 is the size below which 85% of the fine fraction lies by mass. Accordingly, the ratio of D15/d85 was evaluated as 4.06 for the current sample, which indicates that the fine particles are prone to be washed out from the particle skeleton.
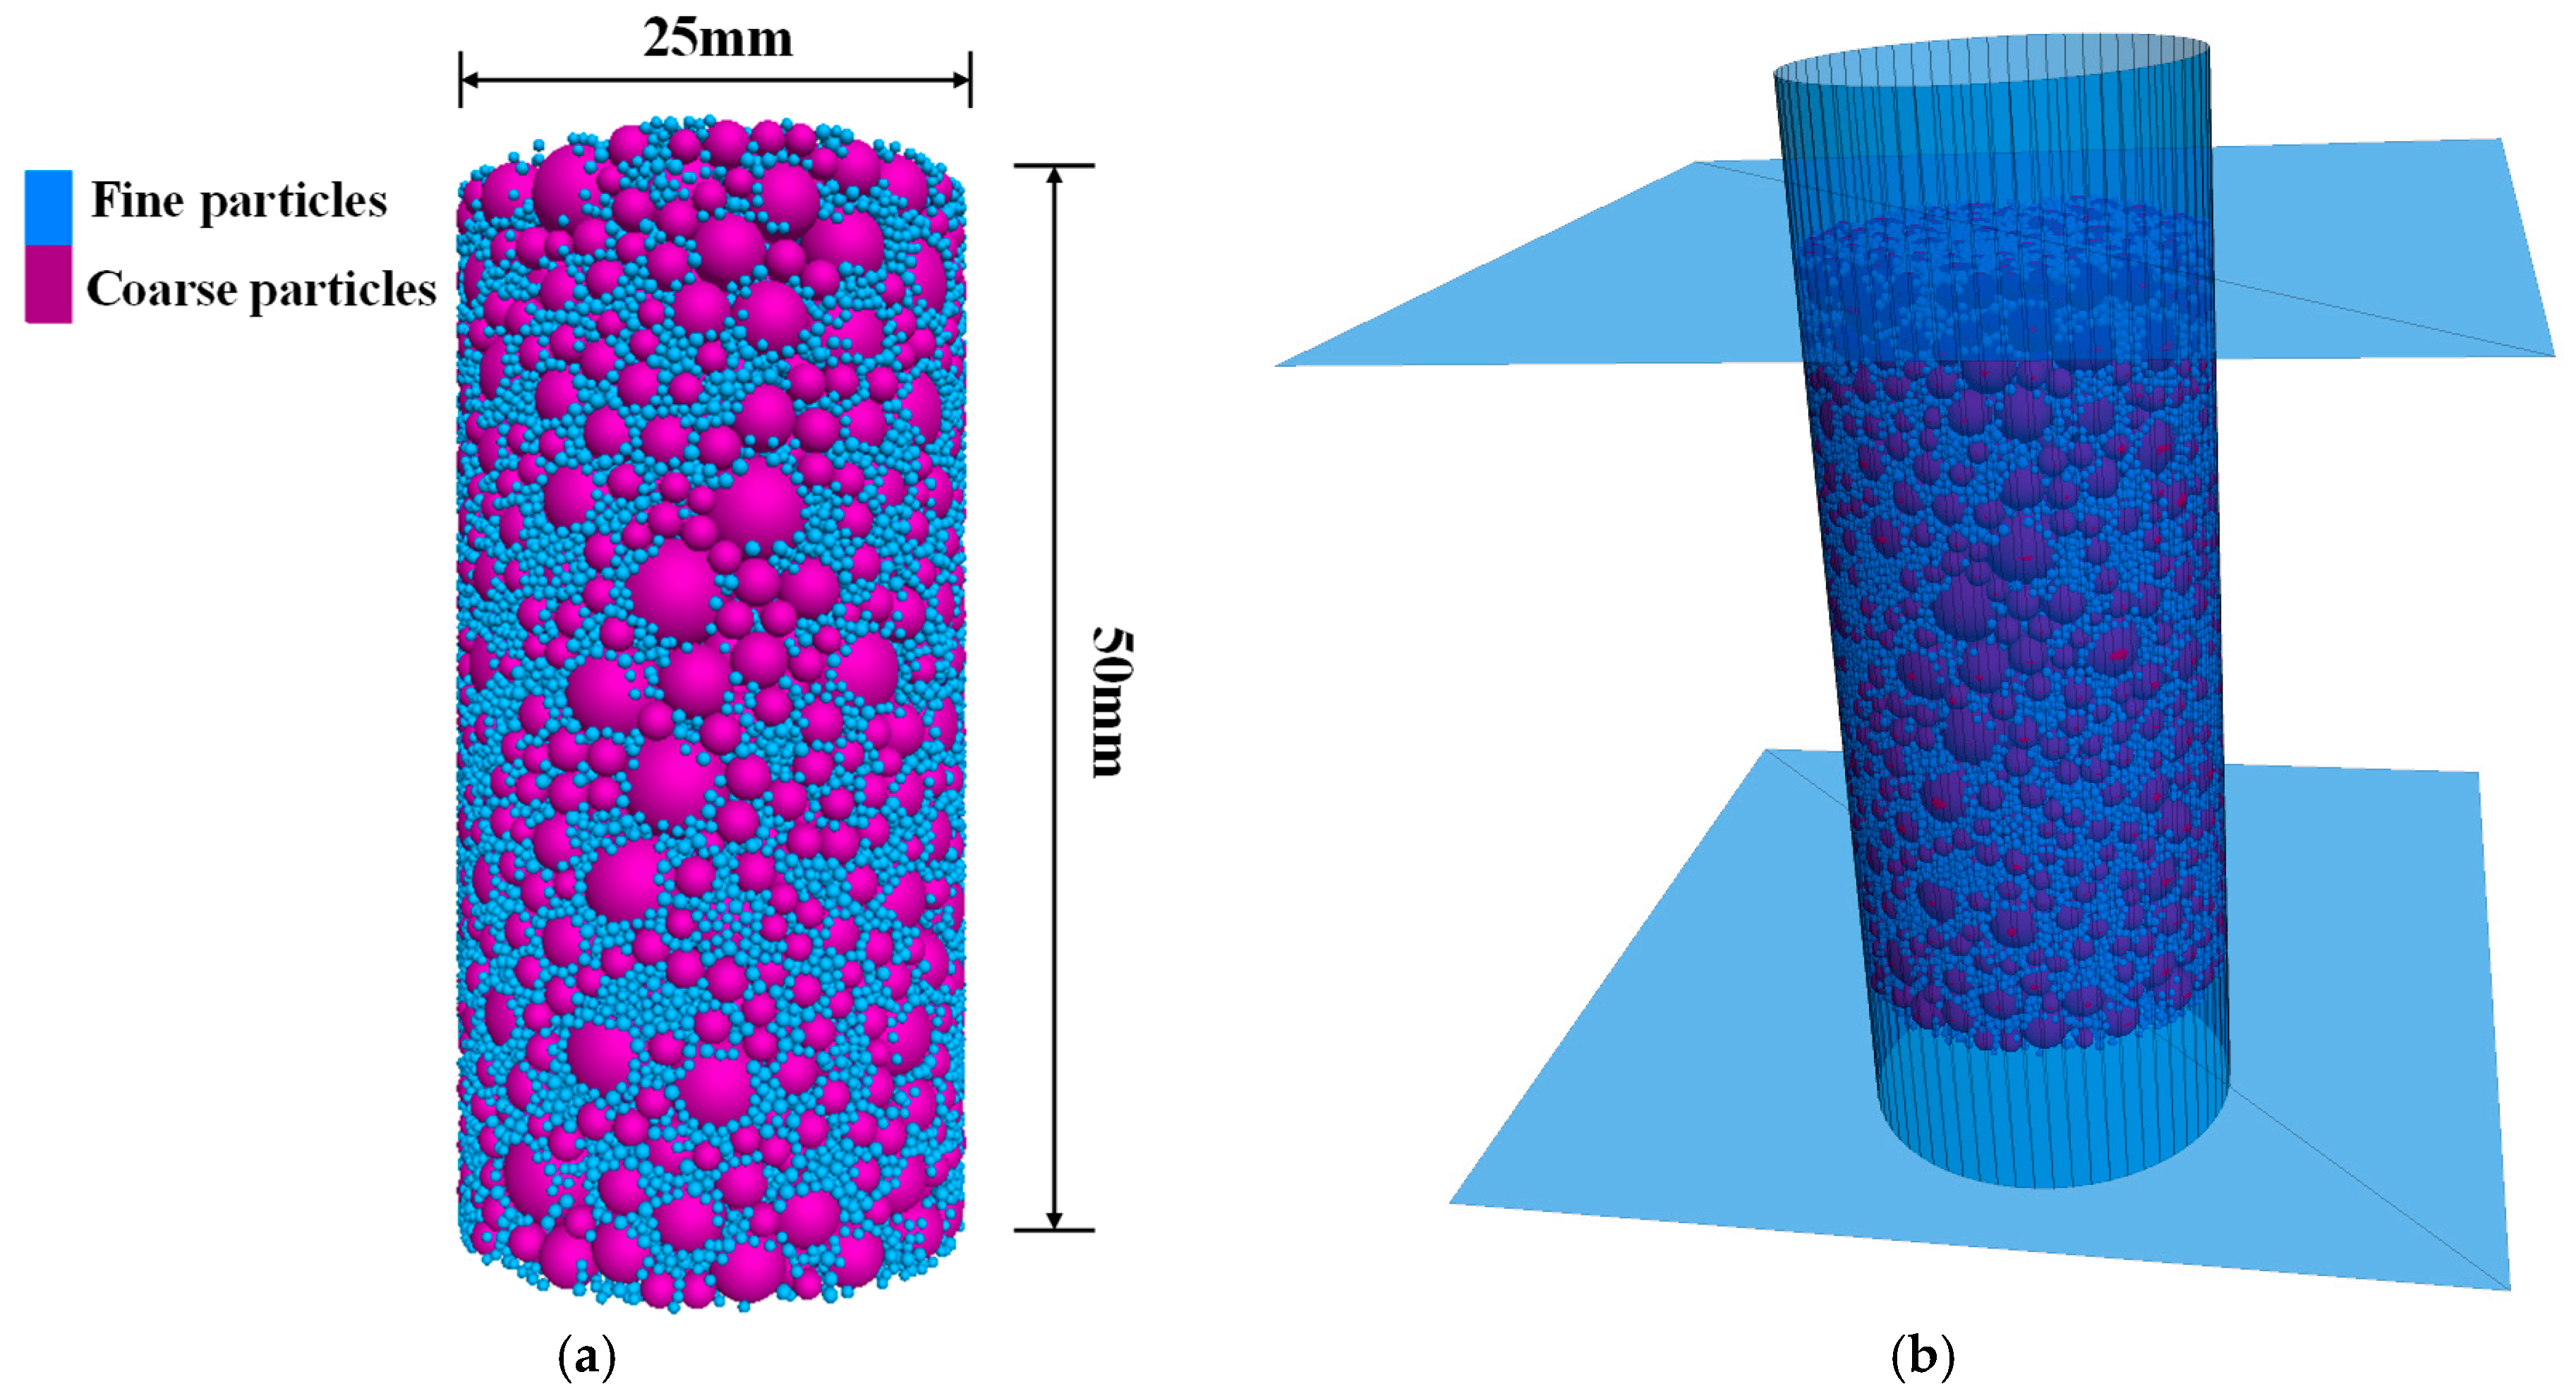
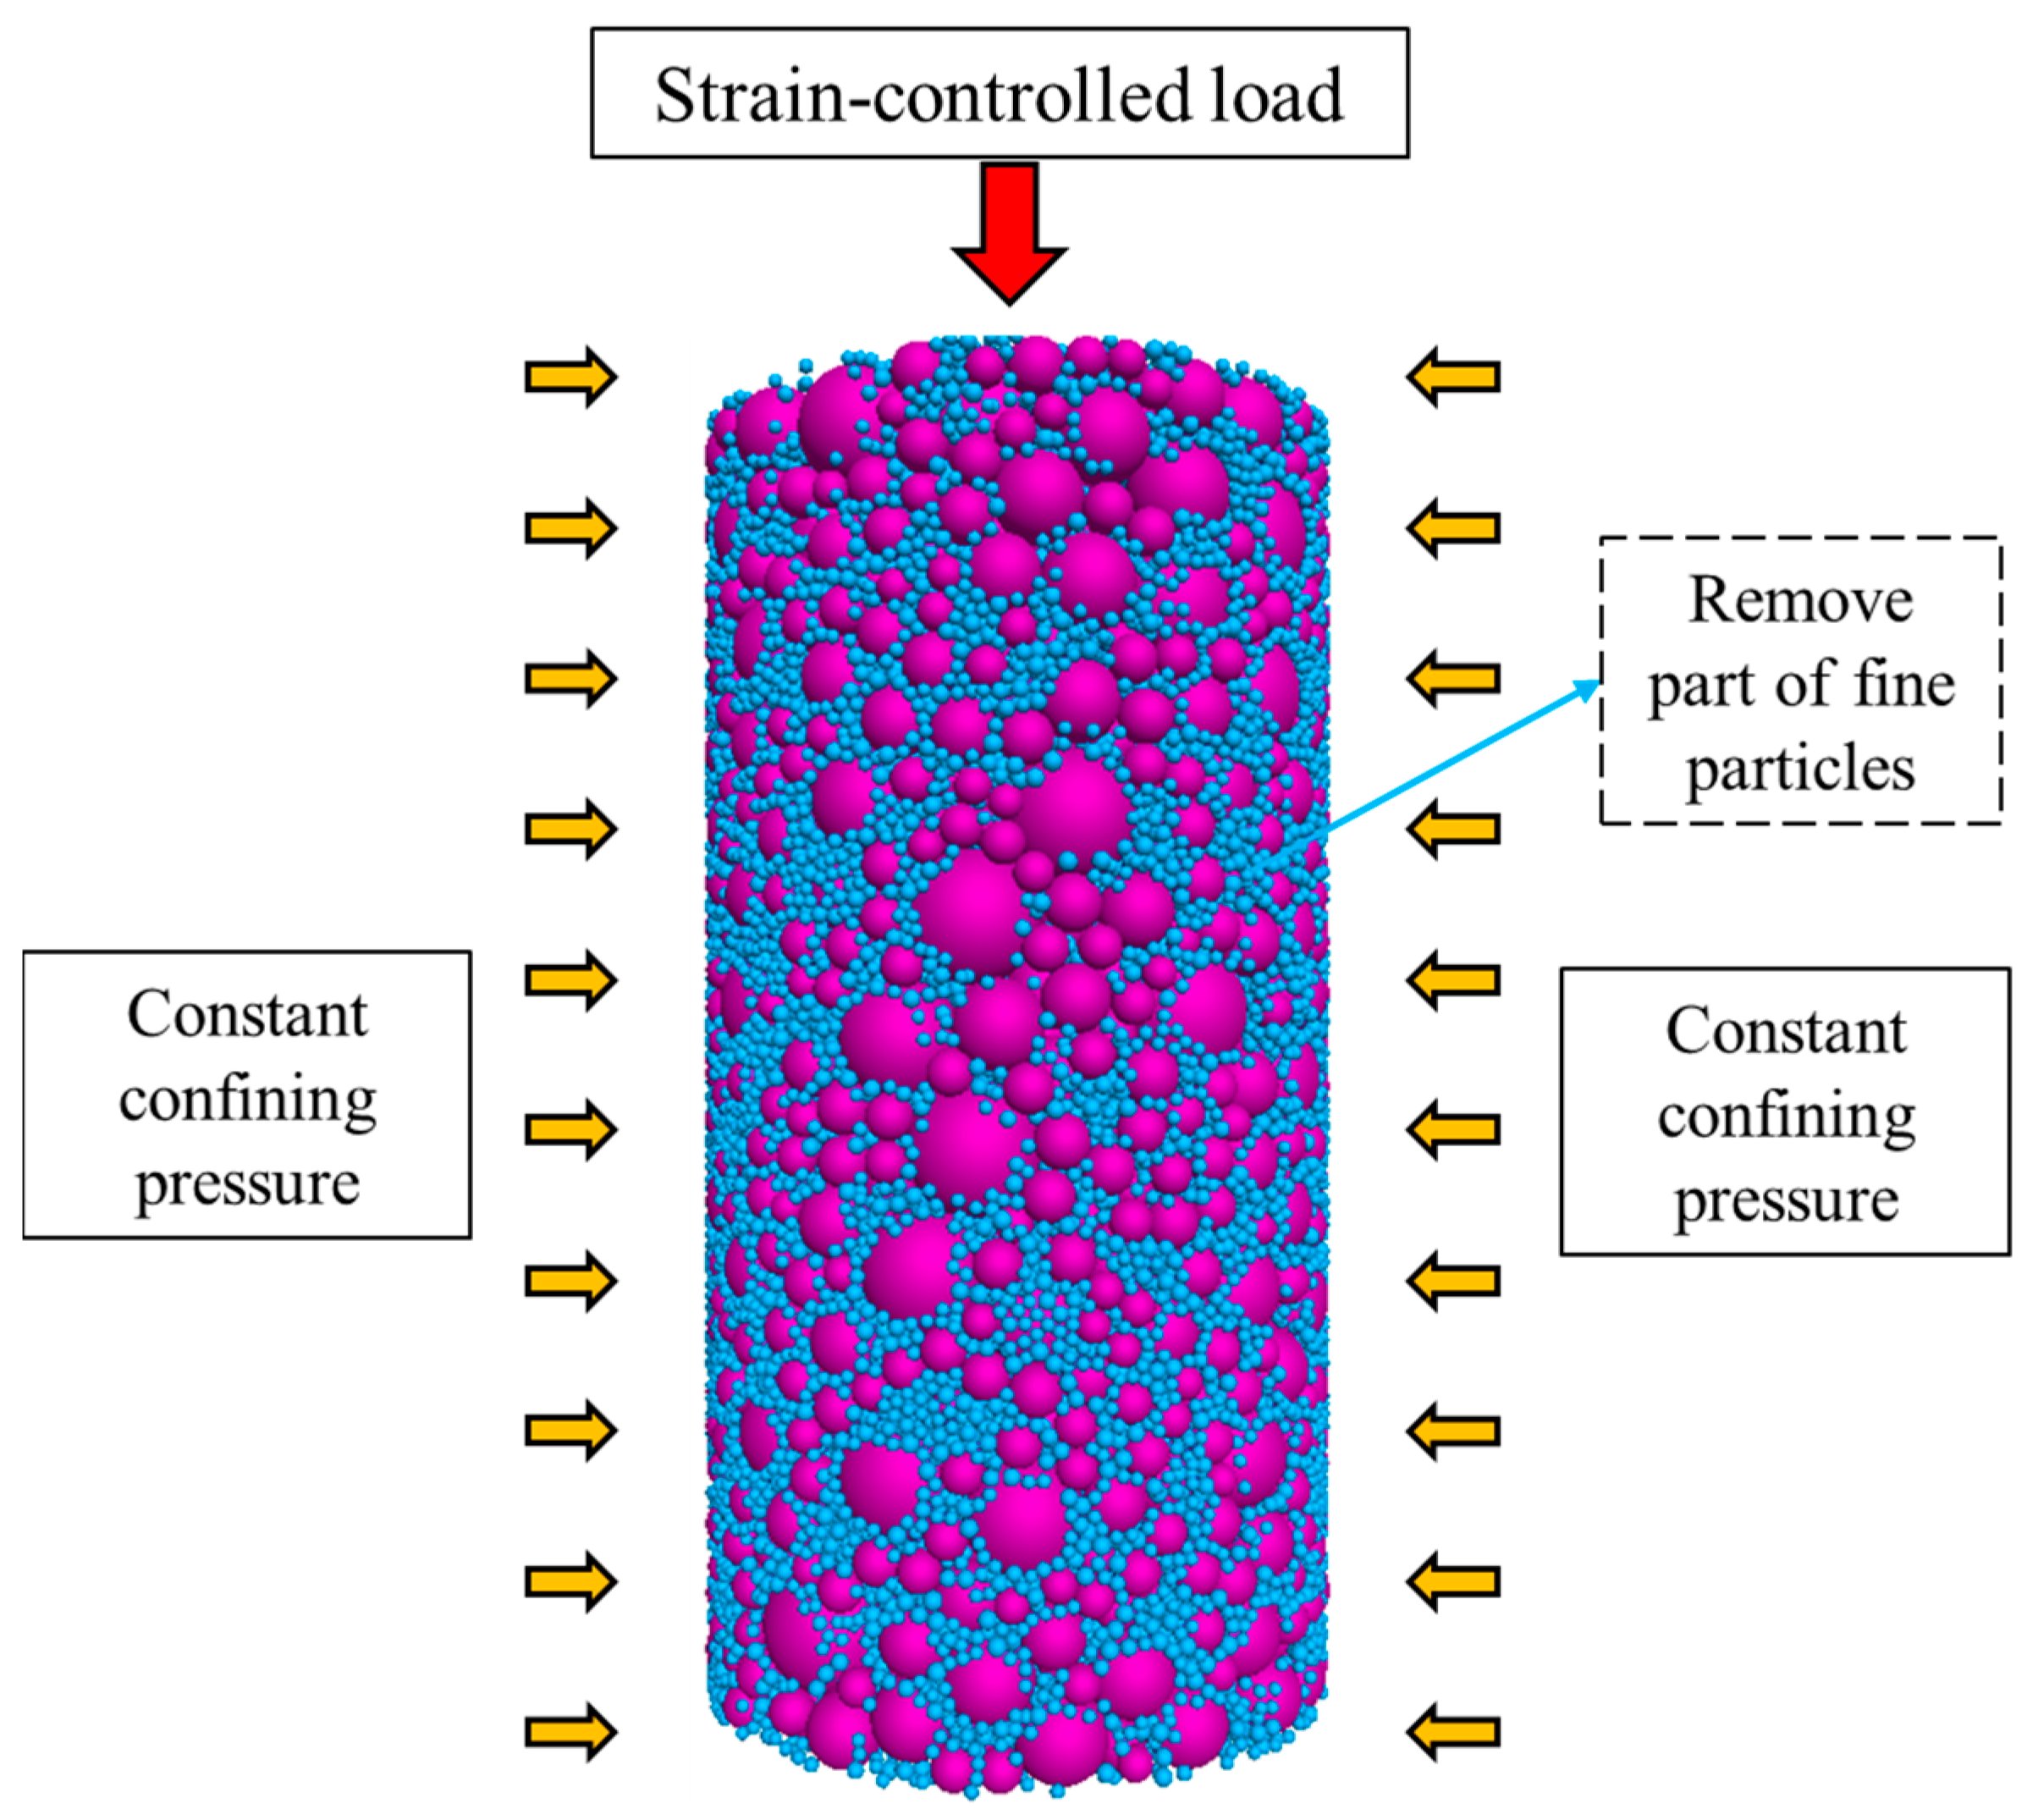
A cylindrical sample with 50 mm in height and 25 mm in diameter was established using DEM, containing a total of 39,642 particles fulfilling the prescribed PSD. Particle generation involved first positioning the largest size fractions at specified locations followed by sequentially filling inter-particle voids with progressively smaller sizes to minimize overlaps while attaining a dense randomly packed initial structure. Figure 2a illustrates the 3D sample and microstructure, where blue and purple particles signify the two fractions classified as fine and coarse particles, respectively. During specimen generation, lateral confinement was provided by a rigid cylindrical wall, and rigid planar platens were placed at the top and bottom as end boundaries. After particle insertion, dynamic cycling was applied to achieve static equilibrium, yielding a specimen state free of initial stress (Figure 2b).

2.1.2. Contact Models

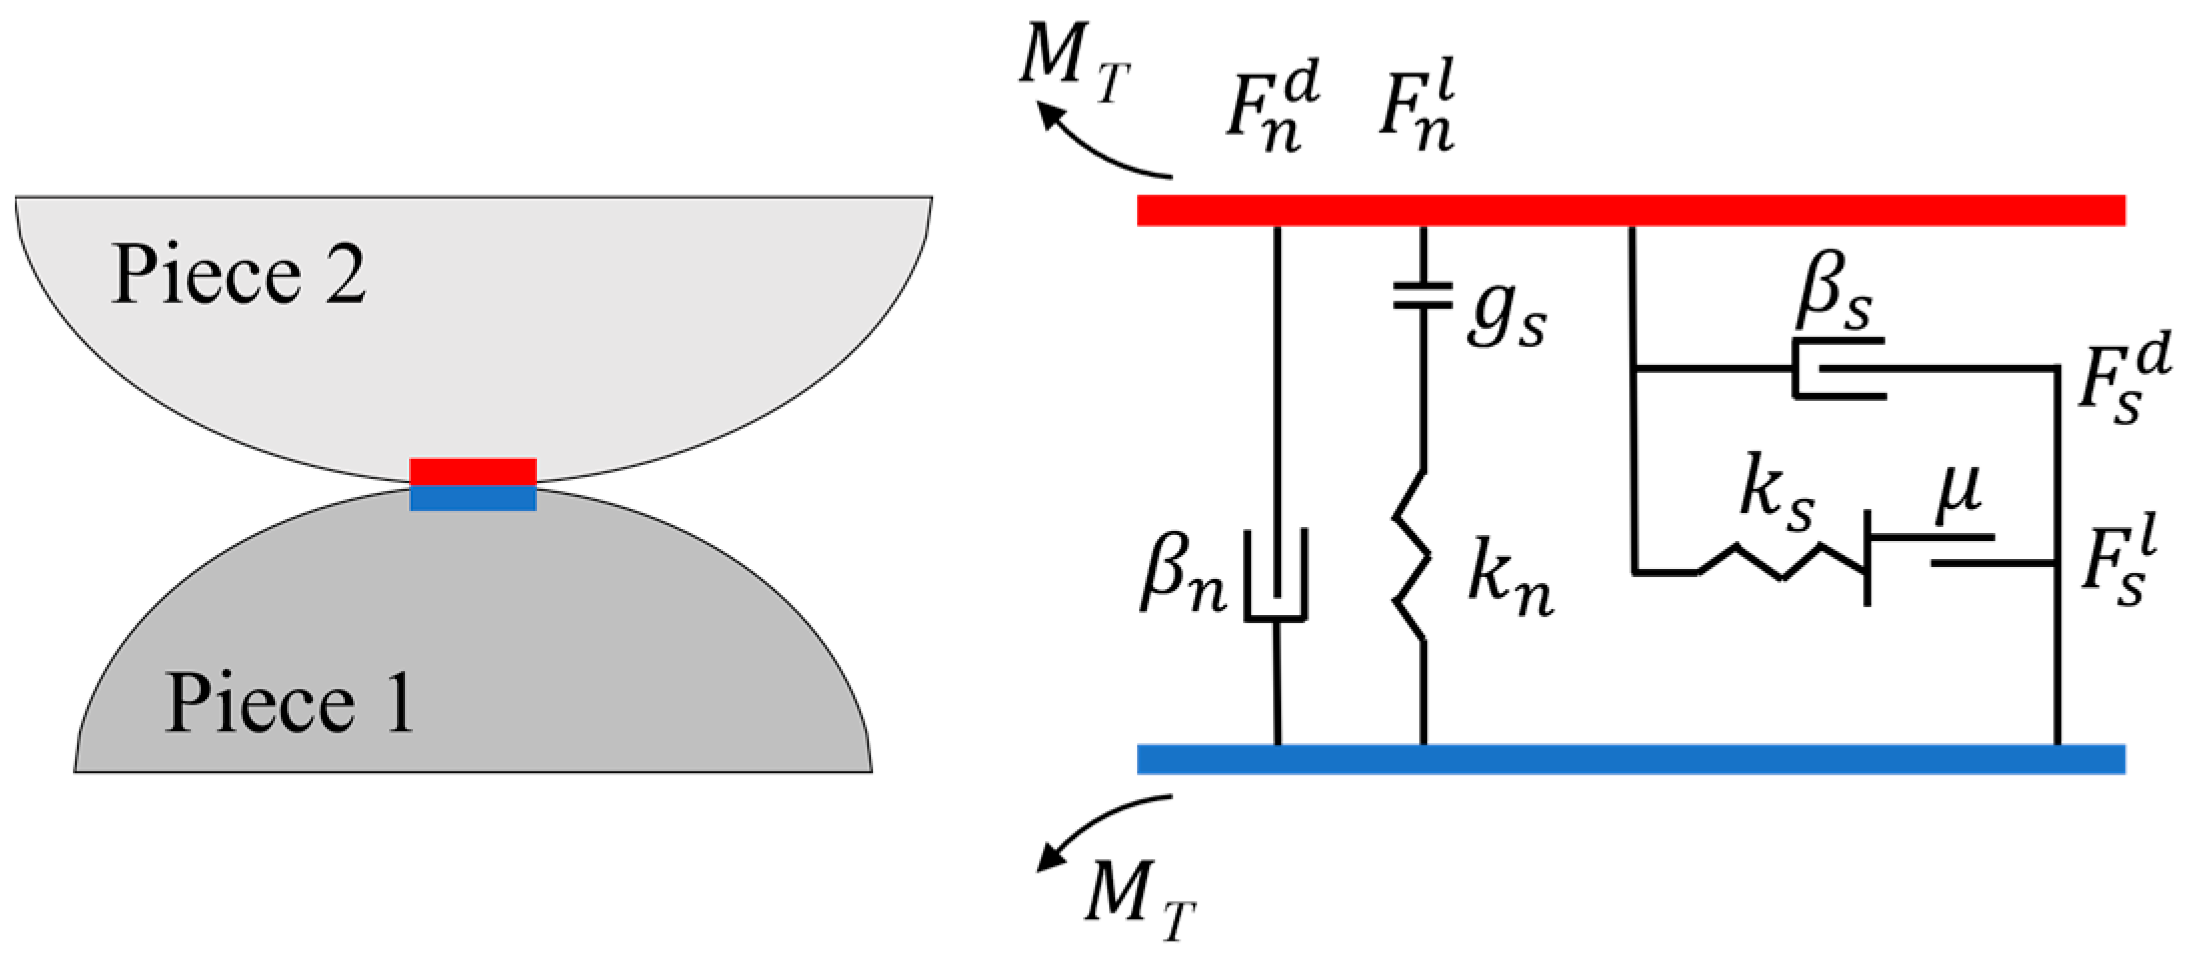
The rolling resistance linear contact model was adopted to account for frictional resistance at contacts arising due to particle shapes [30]. As shown in Figure 3, this model considered the mechanism of rolling resistance based on the linear contact model. At the contact point, the internal bending moment was increased linearly with the accumulated relative rotation, thus achieving consideration of rolling resistance.
In accordance with the law of force and displacement, the contact force and moment can be expressed in Equation (2).
F c = F l + F d , M c = M T
where Fl represents linear force; Fd represents damping force. The rolling resistance moment is expressed as
M T : = M T k r Δ θ b
where ∆θb is the relative bending–rotation increment. It is important to note that the rolling resistance moment only considers the relative bending at the contact point, without considering the relative twisting component. kr represents the rolling resistance stiffness.
When the accumulated relative rotation at the contact point reaches the maximum value of the product of the linear normal force, the rolling friction coefficient, and the effective contact radius, the limit value M* is attained, as shown in Equation (4).
M * = μ r R ¯ F n l
where μr is the coefficient of rolling friction, which is defined as the tangent value of the maximum tilt angle at which the rolling resistance moment and the particle gravity moment are balanced. R ¯ is the effective contact radius, which refers to the physical radius at the two endpoints of contact. If one of the entities is a wall, the radius is considered infinite.
This study employed the rolling resistance linear model because of its fewer built-in parameters, simplicity, and high computational efficiency.
Table 1 presents the microscopic parameters of the contact model employed in this simulation. The rolling friction coefficient was set at the conventional value of 0.1, at which point the particles can attain a state of self-equilibrium under the influence of the rolling resistance moment. All the parameters are carefully calibrated and more details will be presented in the following section.

2.1.3. Three Different Modes of Internal Erosion

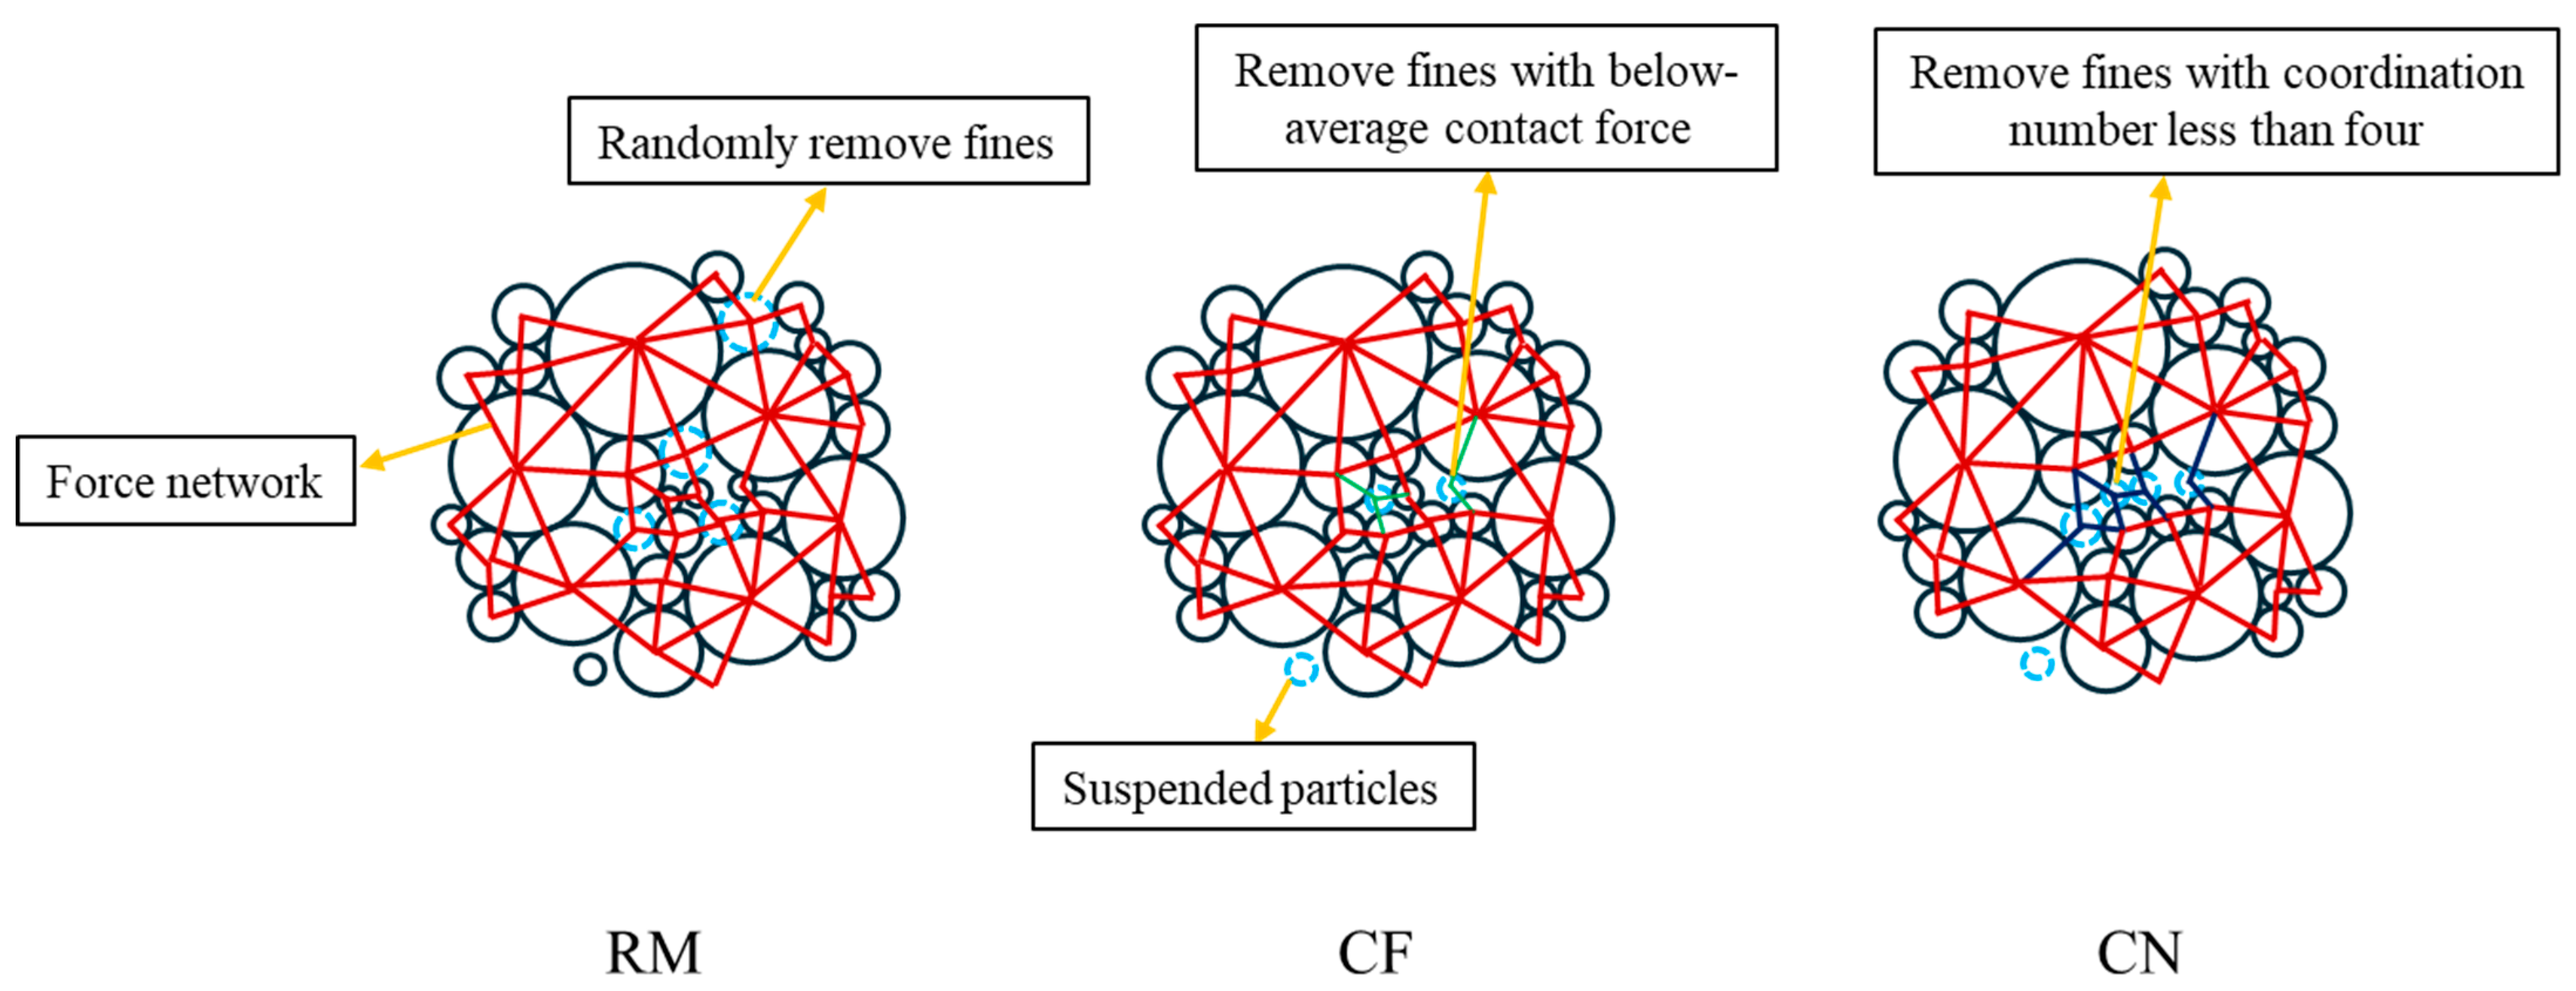
To investigate the mechanical consequences of eroded soils, numerous attempts have been made from experimental testing to numerical simulations. As for the latter approach, it is of great interest to start from those first-order factors, for example, the mechanical behavior of soils will be significantly affected by the erosion-induced changes in PSD. In that case, it is important to faithfully replicate the characteristic process of unpredictable fines depletion from soil over time. It is widely accepted that coarse particles serve as skeleton particles, remaining intact, while fine particles exit the system through the pore channels formed between coarse particles, leading to fines deletion within the soil sample. Therefore, the key issue in simulating internal erosion is to eliminate fine particles with different volume fractions selectively. In this study, three approaches were employed to model internal erosion, i.e., (1) delete fine particles randomly (RM), (2) delete fine particles by contact force (CF), and (3) delete fine particles by coordination number (CN).
(1)
RM approach
This stochastic technique approximates scenarios where fine particles are washed out at random locations within the soil sample, irrespective of the inter-particle stress state or other mechanical properties. It attempts to simulate cases where a soluble substance such as salt is uniformly blended with the soil and dissolution occurs in an uncontrolled manner over time [18]. Using this approach, fine particles were removed randomly, and the initial determination of the volume fraction of the deleted particles was made. If the deletion volume fraction was below that of the smallest particle size group (0.5 mm), particles were randomly eliminated from the smallest particle size group. In cases where the deletion volume fraction fell between the smallest and second-smallest particle size groups (0.5–0.7 mm), all particles from the smallest size group were deleted first, followed by random deletion from the second-smallest particle size group until the specified deletion volume fraction was achieved.
(2)
CF approach
This approach attempts to simulate erosion processes that are sensitive to the local inter-particle stress conditions. It is based on observations from physical experiments, which indicate that fine particles tend to detach first from locations experiencing relatively low contact forces within the soil matrix. Specifically, particles with a contact force of 0 were given priority for deletion, followed by particles with progressively lower contact forces. In this approach, the deletion of particles was also determined by the magnitude of the maximum normal contact force. Initially, suspended particles (i.e., particles not in contact with any other particles) were deleted, followed by fine particles in the smallest particle size group with contact forces below the average. Deletion continued until the specified volume fraction was reached. If not, fine particles with contact forces below the average in the second-smallest particle size group were removed until the specified deletion volume fraction was attained.
(3)
CN approach
The coordination number refers to the number of contact forces between a particle and other particles. Particles with a lower coordination number are more prone to lose flow through pore channels under certain hydraulic gradients due to the lack of effective contacts, while particles with a higher coordination number are constrained by surrounding particles and are less likely to be lost. Similarly to the CF approach, unconnected particles were initially removed, followed by the extraction of fines ranked from the lowest to highest values of coordination number in connected clusters. This simulated detachment, favoring isolated or weakly held particles over those experiencing stronger multilateral confinement from neighboring particles, aligns with conceptual models of internal instability progression guided by inter-particle forces.
The schematic of the three particle-deletion methods is shown in Figure 4. The deletion volume fraction upper limit of 10% was selected based on practical and experimental considerations. In many laboratory and field investigations of internal erosion phenomena, fine-particle loss often stabilizes well below complete depletion, and measurable strength degradation is observed at moderate loss levels. For example, Wan et al. [32] documented that fine-particle loss under seepage becomes asymptotic after an initial rapid stage. Moreover, empirical and review studies on embankment dam failures emphasize that internal erosion tends to induce structural degradation and instability well before wholesale core collapse [33]. A 10% loss is thus a conservative threshold that captures significant mechanical deterioration but remains within a regime where the structure has not yet catastrophically failed, and further erosion would lead to complete structural failure beyond the focus of this study. Six degrees of erosion (i.e., 0%, 2%, 4%, 6%, 8%, 10%) were replicated for each method. Following the removal of fine particles, the particle assemblies were consolidated again to equilibrium densities before shearing.

2.2. Calibration of Numerical Model

To ensure the numerical model realistically captures the mechanical response of erodible sand soils, it was imperative to calibrate key micro-mechanical parameters against laboratory test data on a representative soil. For this purpose, the model was tuned to replicate the triaxial consolidation-drained shear tests conducted by Chen et al. [18] on a granite sand sample. The granite sand comprised sub-angular to sub-rounded particles ranging in size from 0.09 mm to 5 mm. A thoroughly mixed sample with a height of 150 mm was consolidated under 50 kPa confining pressure and sheared under strain-controlled conditions. In our DEM model, the servo boundary consists of a cylindrical sidewall and two parallel loading platens (Figure 2b). To improve computational efficiency, a parallel PSD of fine-particle fraction was adopted in DEM simulations, and the PSDs for the numerical and experimental specimens are presented in Figure 5; the particle size of the fines group was increased to 0.5–0.7 mm, while the coarse particles were kept unchanged.
Figure 6 illustrates the stress–strain and volume change responses of drained triaxial simulations compared to the experimental data from Chen et al. [18]. Regarding the stress–strain correlation, the numerical simulation exhibited good agreement with the experimental findings. For peak strength, the simulation results deviated from the experimental data of Chen et al. by only 0.6%, while the deviation in residual strength was as small as 0.4%. However, discrepancies were observed in the volume strain, the relative difference in the final volumetric change reached 220%. Such fluctuations might be attributed to the different sizes of the fine particles and the perfect spherical particles adopted in the simulations, which strongly influence fabric evolution and compressibility [27], the present DEM model employs an idealized contact law (linear spring–dashpot with rolling resistance), spherical particles with a lower bound on fine size, and no particle breakage or clogging, those are the limitations of the model. Nevertheless, the overall agreement confirmed that the numerical model effectively replicated the key stress–strain and volume change characteristics of the original uneroded soil sample. Therefore, the calibrated parameters used in the DEM model as presented in Table 1 are adopted for evaluating the influences of fine-particle loss on the mechanical responses of gap-graded soil in subsequent Section 3.

2.3. Numerical Experiment Scheme

In this section, a series of drained triaxial (CD) tests were conducted to investigate the mechanical consequences of eroded soils using the above-mentioned three approaches. Initially, uneroded samples were consolidated under constant effective confining pressures of 100 kPa, 200 kPa, 400 kPa, and 800 kPa. Subsequently, three erosion approaches were utilized to prepare five sets of samples with various erosion levels (2%, 4%, 6%, 8%, and 10%) after particle deletion, and then sheared until the axial strain reached 40%. Triaxial tests were conducted under strain-controlled loading at a constant axial strain rate. the schematic of servo control and loading is illustrated in Figure 7. For comparison, uneroded samples were also sheared under different effective confining pressures. A total of 64 CD tests were carried out, and the detailed experimental scheme is provided in Table 2.
Macroscopic stress was computed by volume averaging of contact interactions, axial strain was obtained from platen displacement and volumetric strain from specimen volume change, peak strength was taken at the maximum deviatoric stress, and residual strength as the post-peak plateau average over a prescribed strain window.

3. Results and Discussion

3.1. Variations in Sample Properties

3.1.1. Evolution of PSD

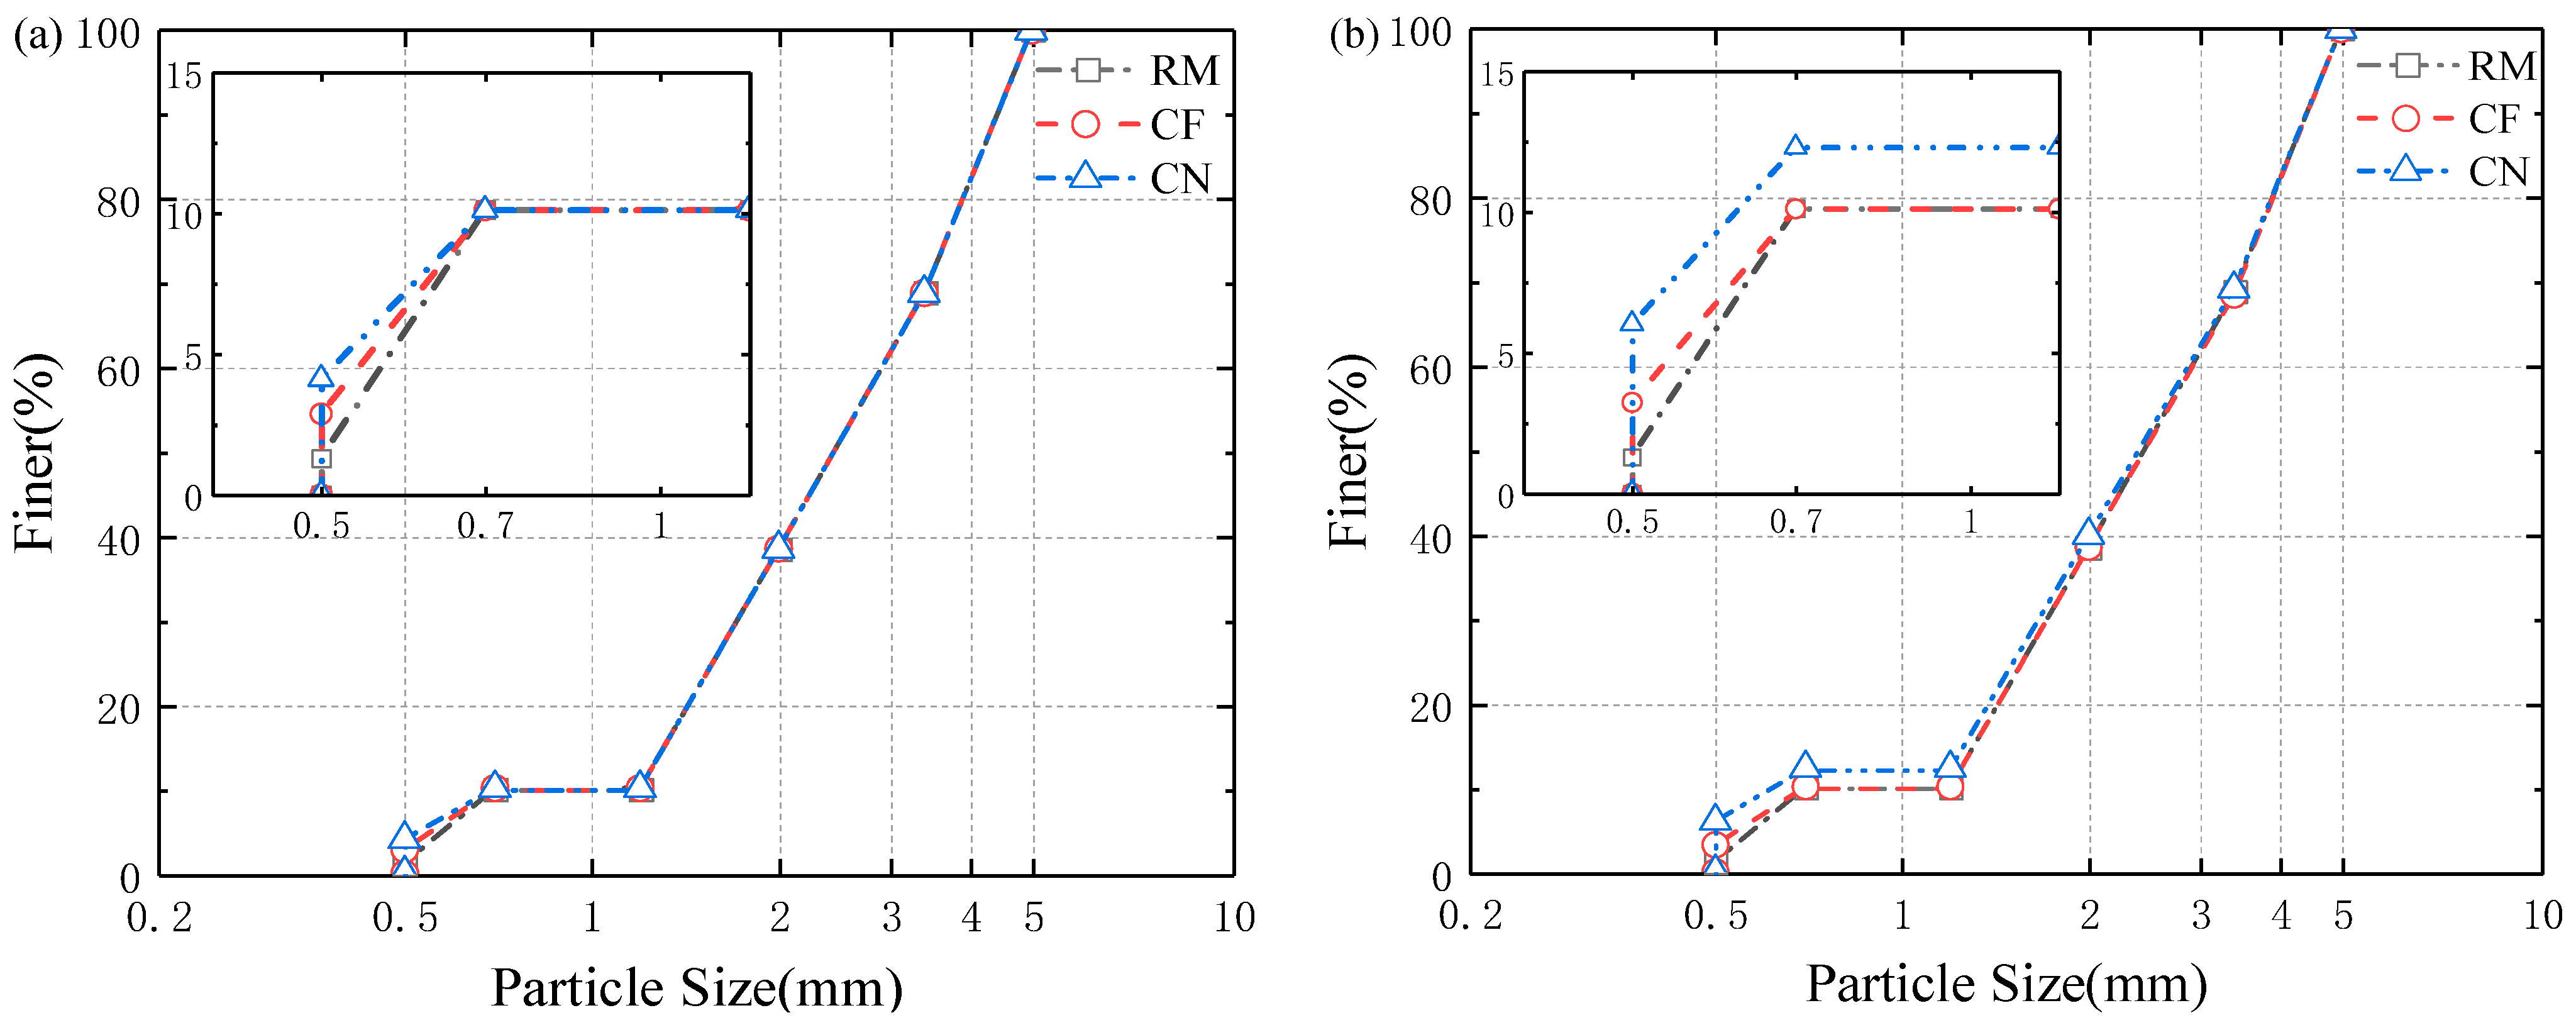
Samples subjected to 8% degree of internal erosion under effective confining pressures of 400 kPa and 800 kPa were selected to assess the impacts of different erosion approaches (i.e., RM, CF, and CN) on the evolution of PSD of soil samples, which are presented in Figure 8, respectively. It was evident from Figure 8 that confining pressure had a negligible influence on the evolution of PSD. For samples prepared with the RM approach, the proportion of fines eliminated from the smallest size fraction (0.5 mm) exceeded that of the other two methods. This occurred because the RM approach unconditionally extracted particles regardless of stress state, whereas the CF and CN approaches prioritized suspending and poorly confining fines, retaining those higher contact force/coordination number of fines with the smallest size fraction. Additionally, it can be observed that the residual fraction of fines under the CN scheme is markedly higher than that of the other two methods. Because in the particle-deletion routine, we specify explicit removal criteria. Under the CN scheme, fines with a coordination number Z < 4 are treated as unstable [34]. Accordingly, the rule is to delete fines with Z < 4 until the prescribed deletion percentage is reached. In our case, however, the mass fraction of fines with Z < 4 was less than 8%. Once all particles meeting this criterion had been removed, the algorithm stopped, resulting in a noticeably higher residual fine-particle content for CN compared with the other two deletion methods. Overall, the three deletion strategies produced distinct PSD evolutions. Compared with the CF and CN methods, the RM method removed a substantially larger proportion of the smallest particles (0.5 mm), leading to a more pronounced shift in the PSD towards coarser fractions. By contrast, the CN method retained the highest proportion of fines because its selective removal criterion stopped once all particles with low coordination numbers were deleted. The CF method exhibited an intermediate behavior, with fines removal governed by contact force thresholds.

3.1.2. Evolution of Void Ratio

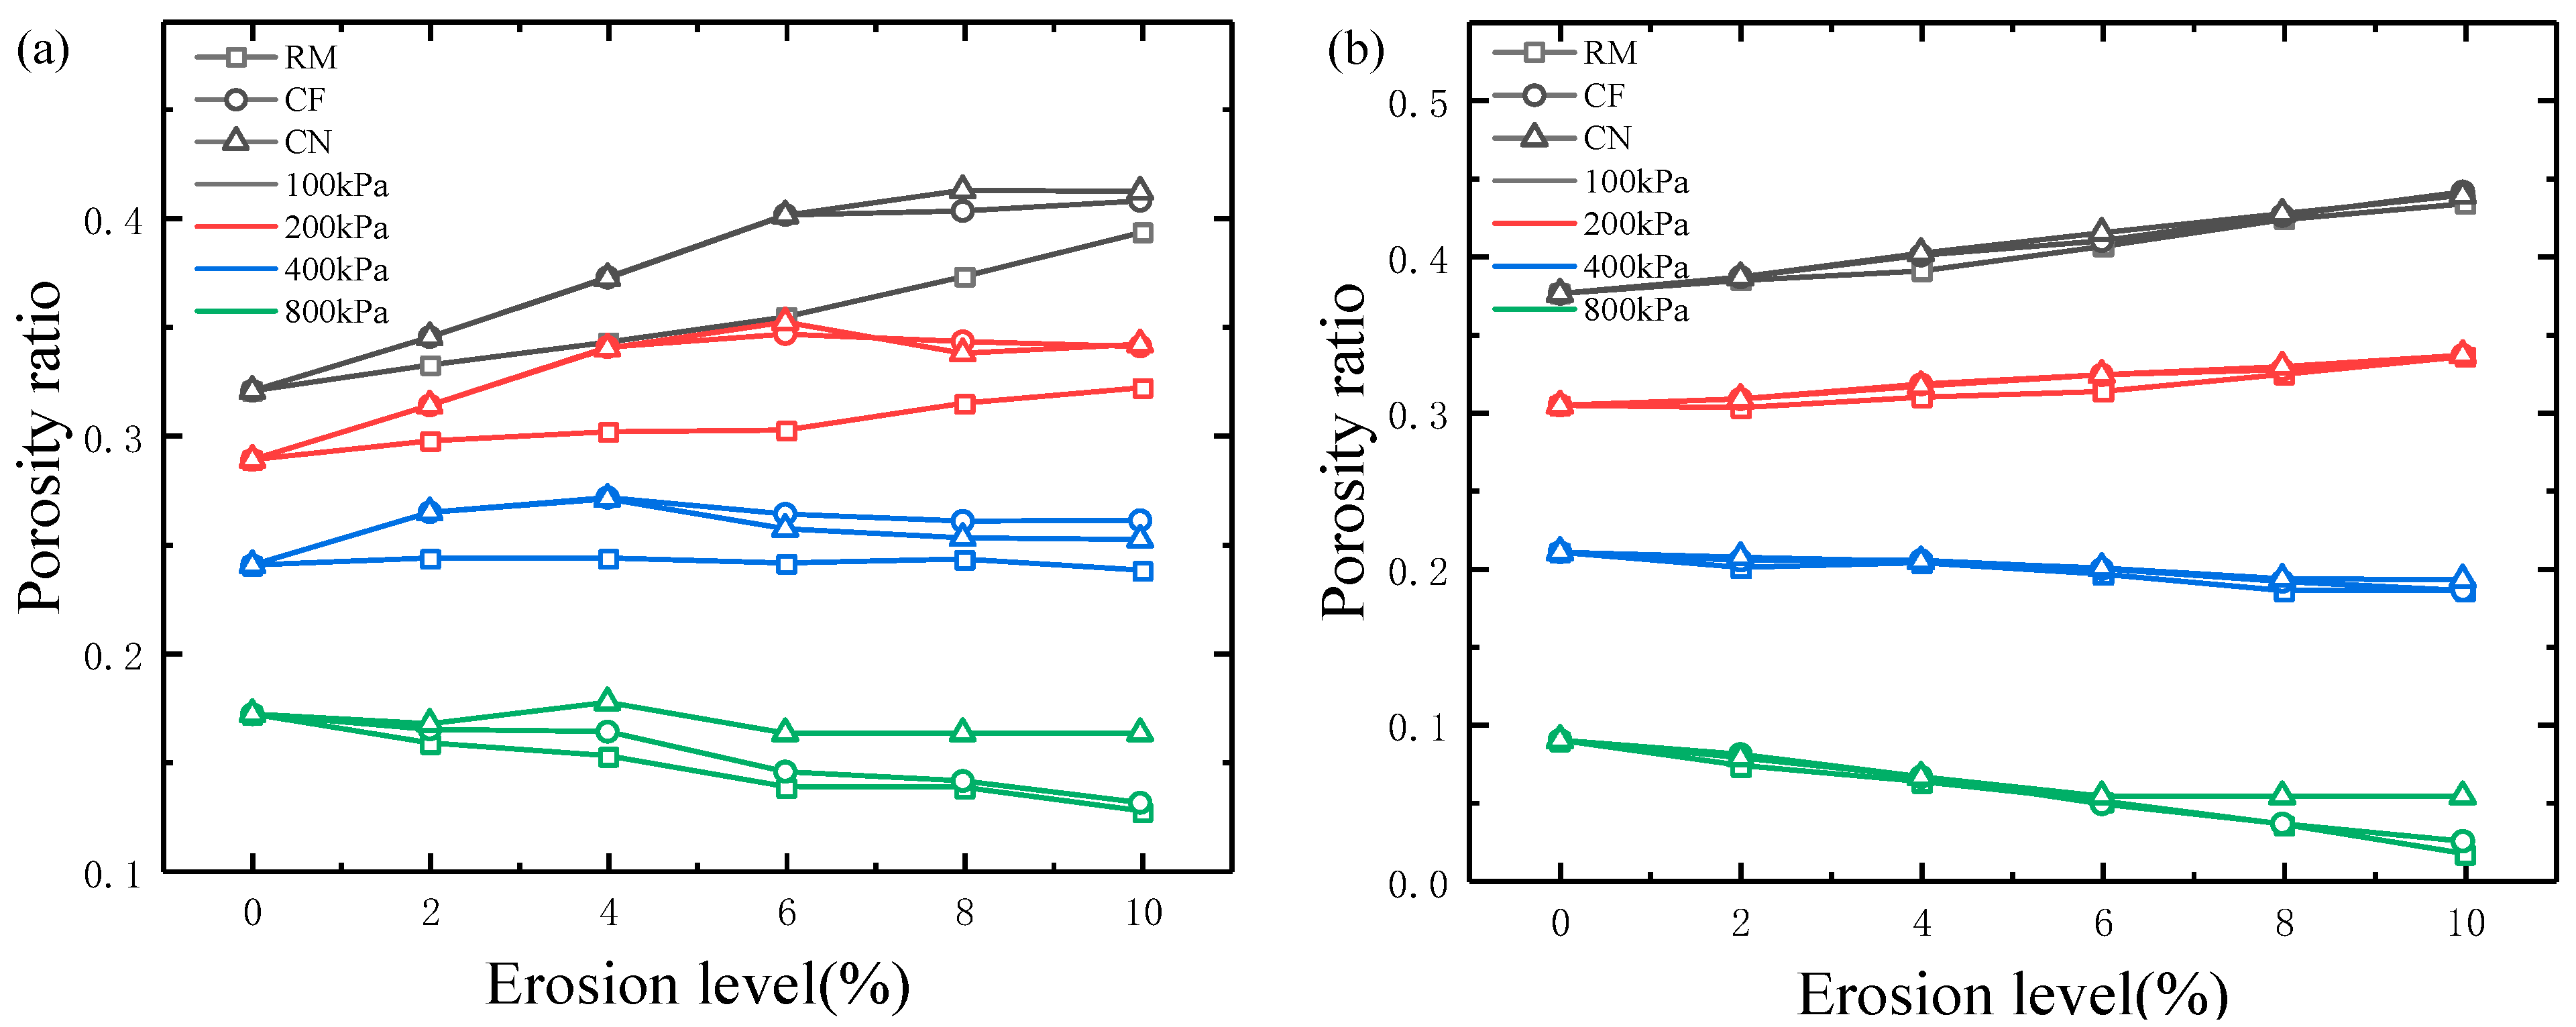
Generally, a smaller void ratio indicates denser soil with lower compressibility, while a larger void ratio indicates looser soil with higher compressibility. Figure 9a presents the void ratios of samples at different degrees of internal erosion after initial consolidation at different effective confining pressures. Samples prepared by the RM approach consistently exhibited the smallest void ratios than those of the other two approaches due to the denser initial packing from fine-particle removal, while samples prepared by the CN approach displayed marginally looser structures with larger void ratios than those samples prepared by the CF approach. Furthermore, the findings indicated that the void ratio exhibited a more significant increase with the degree of internal erosion at lower effective confining pressures (i.e., 100 kPa, and 200 kPa). However, this trend became less apparent at higher effective confining pressures (i.e., 400 kPa), with the void ratio even decreasing in some samples as the internal erosion progressed at the effective confining pressure of 800 kPa in this study. This is likely because, at higher confining pressures, after the fine particles are lost, the remaining particles are more easily rearranged under the influence of the large confining pressure. This results in an increase in the specimen’s density, ultimately leading to a porosity that is even smaller than before the particle loss occurred.
Figure 9b presents the evolution of void ratios after triaxial shearing, revealing discrepancies between the proposed three approaches diminished markedly after shearing. Similarly to the pre-shearing responses, the void ratio increases with increasing degree of internal erosion at lower effective confining pressures (i.e., 100 kPa, and 200 kPa), but decreases with increasing degree of internal erosion when the effective confining pressure is larger than 400 kPa in the present study.

3.2. Stress–Strain Behavior

3.2.1. Effect of Degree of Internal Erosion

To evaluate the influence of varying degrees of internal erosion, the deviatoric stress-volumetric strain–axial strain responses of eroded samples prepared by CF approaches under the effective confining pressures of 100 kPa and 800 kPa were selected for analysis, as indicated in Figure 10. The black curve represented the initial uneroded sample, while curves with different points and colors denoted a varying degree of internal erosion.
As indicated in Figure 10, samples exhibited shear dilation when the effective confining pressure was 100 kPa, whereas contraction when the effective confining pressure was 800 kPa, regardless of the degree of internal erosion. The peak strength progressively declined with an increasing degree of internal erosion, indicating the transition from strain-softening to strain-hardening behaviors. A 13% reduction in peak strength at 800 kPa confining pressure (Figure 10b) is a serious engineering issue for dam cores, where relatively small strength losses can compromise stability under seismic loading conditions [35]. However, the residual strength diverged minimally, signifying internal erosion exerted limited impacts on the drained frictional properties of samples post-yield. Furthermore, a higher degree of internal erosion led to more pronounced contraction and less dilation behavior under effective confining pressures of both 100 kPa and 800 kPa.
In addition, the small fluctuations in Figure 10 arise from (i) discrete contact network rearrangements during peak and post-peak shearing, (ii) feedback of the servo-controlled confining pressure, which together produce non-smooth stress–strain and volumetric curves in DEM. Idealized spherical grains and a stiff platen also accentuate sudden microstructural adjustments. However, it must be noted that the fluctuations do not affect the reported metrics.

3.2.2. Effect of the Eroded Sample Preparation Method

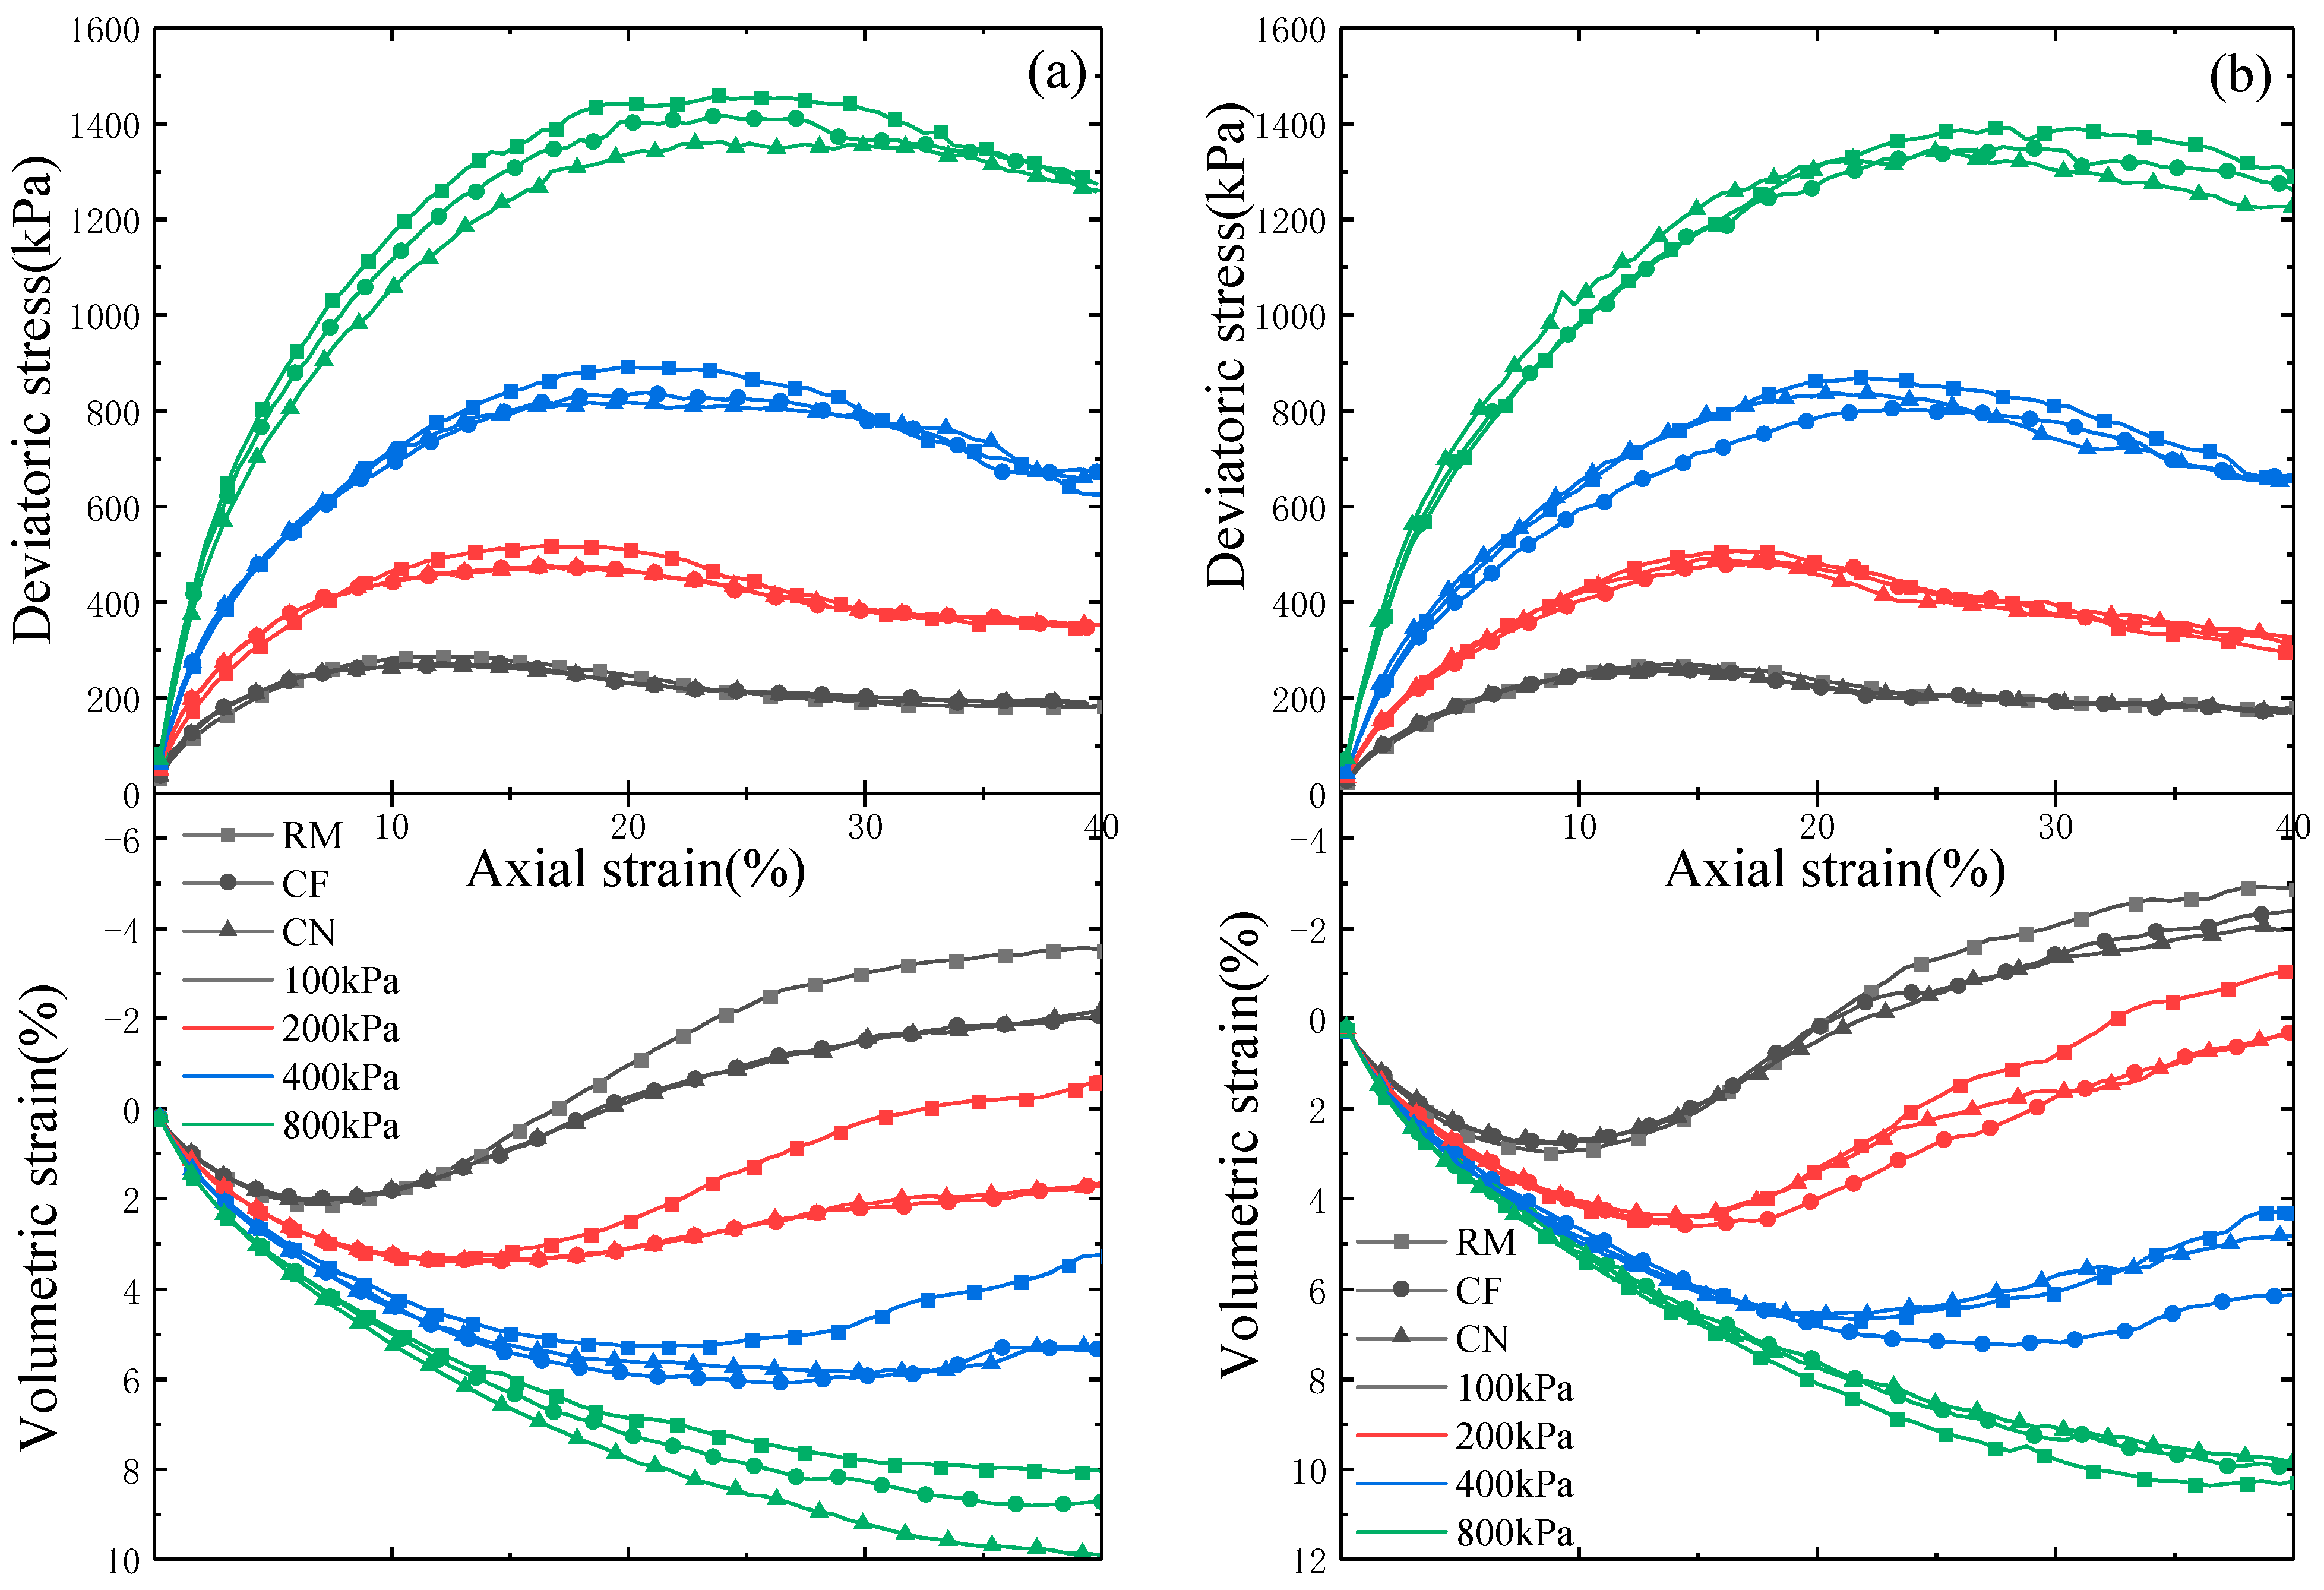
Figure 11 presents the deviatoric stress-volumetric strain–axial strain responses of eroded samples prepared by different approaches under varying effective confining pressures (100, 200, 300, and 400 kPa) and degrees of internal erosion (4% and 10%). The solid lines with square dots, circle dots, and triangle dots represent the RM, CF, and CN approaches, respectively. As indicated in Figure 11, the peak deviatoric stress of the eroded sample prepared by the RM approach was larger than those prepared by the other two approaches; for example, at 4% erosion degree and a confining pressure of 800 kPa, the peak strength increases by 4% for CF and by 7.5% for RM relative to CN, while the residual strengths of the sample prepared by the three approaches were almost the same, suggesting that utilizing different eroded sample preparation methods to simulate internal erosion had a minimal impact on the residual strength of the sample. Furthermore, the differences between the samples prepared by the CN and CF approaches were negligible in terms of the deviatoric stress-volumetric strain–axial strain responses. This is due to the fact that when the fine particles are randomly removed, the probability of particle removal is the same irrespective of the stress and contact states of the particles. In contrast, the other two approaches involve the deletion of particles with smaller contact forces, as well as lower coordination numbers, which may lead to initially high contact force and high coordination number particles becoming particles with lower contact forces and coordination numbers due to the deletion of neighboring particles. Consequently, the eroded samples prepared by the RM approach demonstrates a higher shear strength on the stress–strain curve.
As for the volume strain–axial strain curves, the eroded samples prepared by the RM approach displayed more pronounced dilation characteristics, while the difference between the other two approaches is not obvious at a low degree of internal erosion as shown in Figure 11a. However, the eroded samples prepared by the RM approach displayed the maximum dilation behavior at a low effective confining pressure (100 and 200 kPa) and the maximum contraction behavior at a high effective confining pressure (i.e., 800 kPa), as indicated in Figure 11b; at 10% erosion degree and a confining pressure of 100 kPa, RM exhibits 21% greater volumetric dilation than CF and 51% greater than CN. Under 800 kPa confinement, RM shows approximately 4% more volumetric contraction than both CF and CN.
In summary, internal erosion reduced the peak strength and increased the volume contraction but had a marginal impact on critical state and residual strengths. The eroded samples prepared by the RM approach exhibited higher peak strengths. However, the volume dilation of the eroded samples was primarily dependent on the degree of internal erosion and the effective confining pressure.

3.3. Shear Secant Modulus

The secant modulus E50 is an important parameter used to characterize the deformation behavior of soils, particularly in representing the stiffness at a specific stage of the stress–strain relationship. It is defined as the slope of the secant line drawn from the origin (i.e., zero stress and zero strain) to the point where the deviatoric stress reaches 50% of its peak value during a triaxial compression test, namely
E 50 = σ d ( 50 % ) ε a ( 50 % )
where σd (50%) denotes the deviatoric stress at 50% of the peak stress, and εa (50%) is the corresponding axial strain.
This modulus reflects the overall stiffness of the soil from the initial loading stage to the intermediate strain level. It is widely used in numerical modeling and in the selection of parameters for constitutive models, especially for analyzing the evolution of soil stiffness under nonlinear deformation. Unlike the initial tangent modulus, the secant modulus E50 better captures the stiffness characteristics at medium strain levels, making it more practical and representative for describing soil responses under actual engineering loads. Figure 12 presents the relations between E50, the degree of internal erosion, and the effective confining pressure. As indicated in Figure 12, the value of E50 decreases with an increasing degree of internal erosion, which is attributed to the weakening network fabric because of the progressive removal of fine particles. Furthermore, the value of E50 increases with increased effective confining pressure, which is aligned with enhanced interlocking conferred by the larger effective confining pressure. It is interesting to note that the eroded samples prepared by the CN approach displayed the largest value of E50, while the eroded samples prepared by the RM approach exhibited the lowest value of E50 for most cases; for example, at 10% erosion degree under an 800 kPa confining pressure, E50 of CN is 10.8% higher than CF and 19% higher than RM. These observations can be supported by the contact behavior as described in Section 3.3, with the eroded samples prepared by the CN and RM approaches showing the maximum and the minimum total number of contacts, respectively. Overall, the degradation of E50 amplifies with the degree of internal erosion increases and the effective confining stress decreases.

3.4. Micro-Mechanical Behavior

3.4.1. Evolution of Contact Number and Contact Force

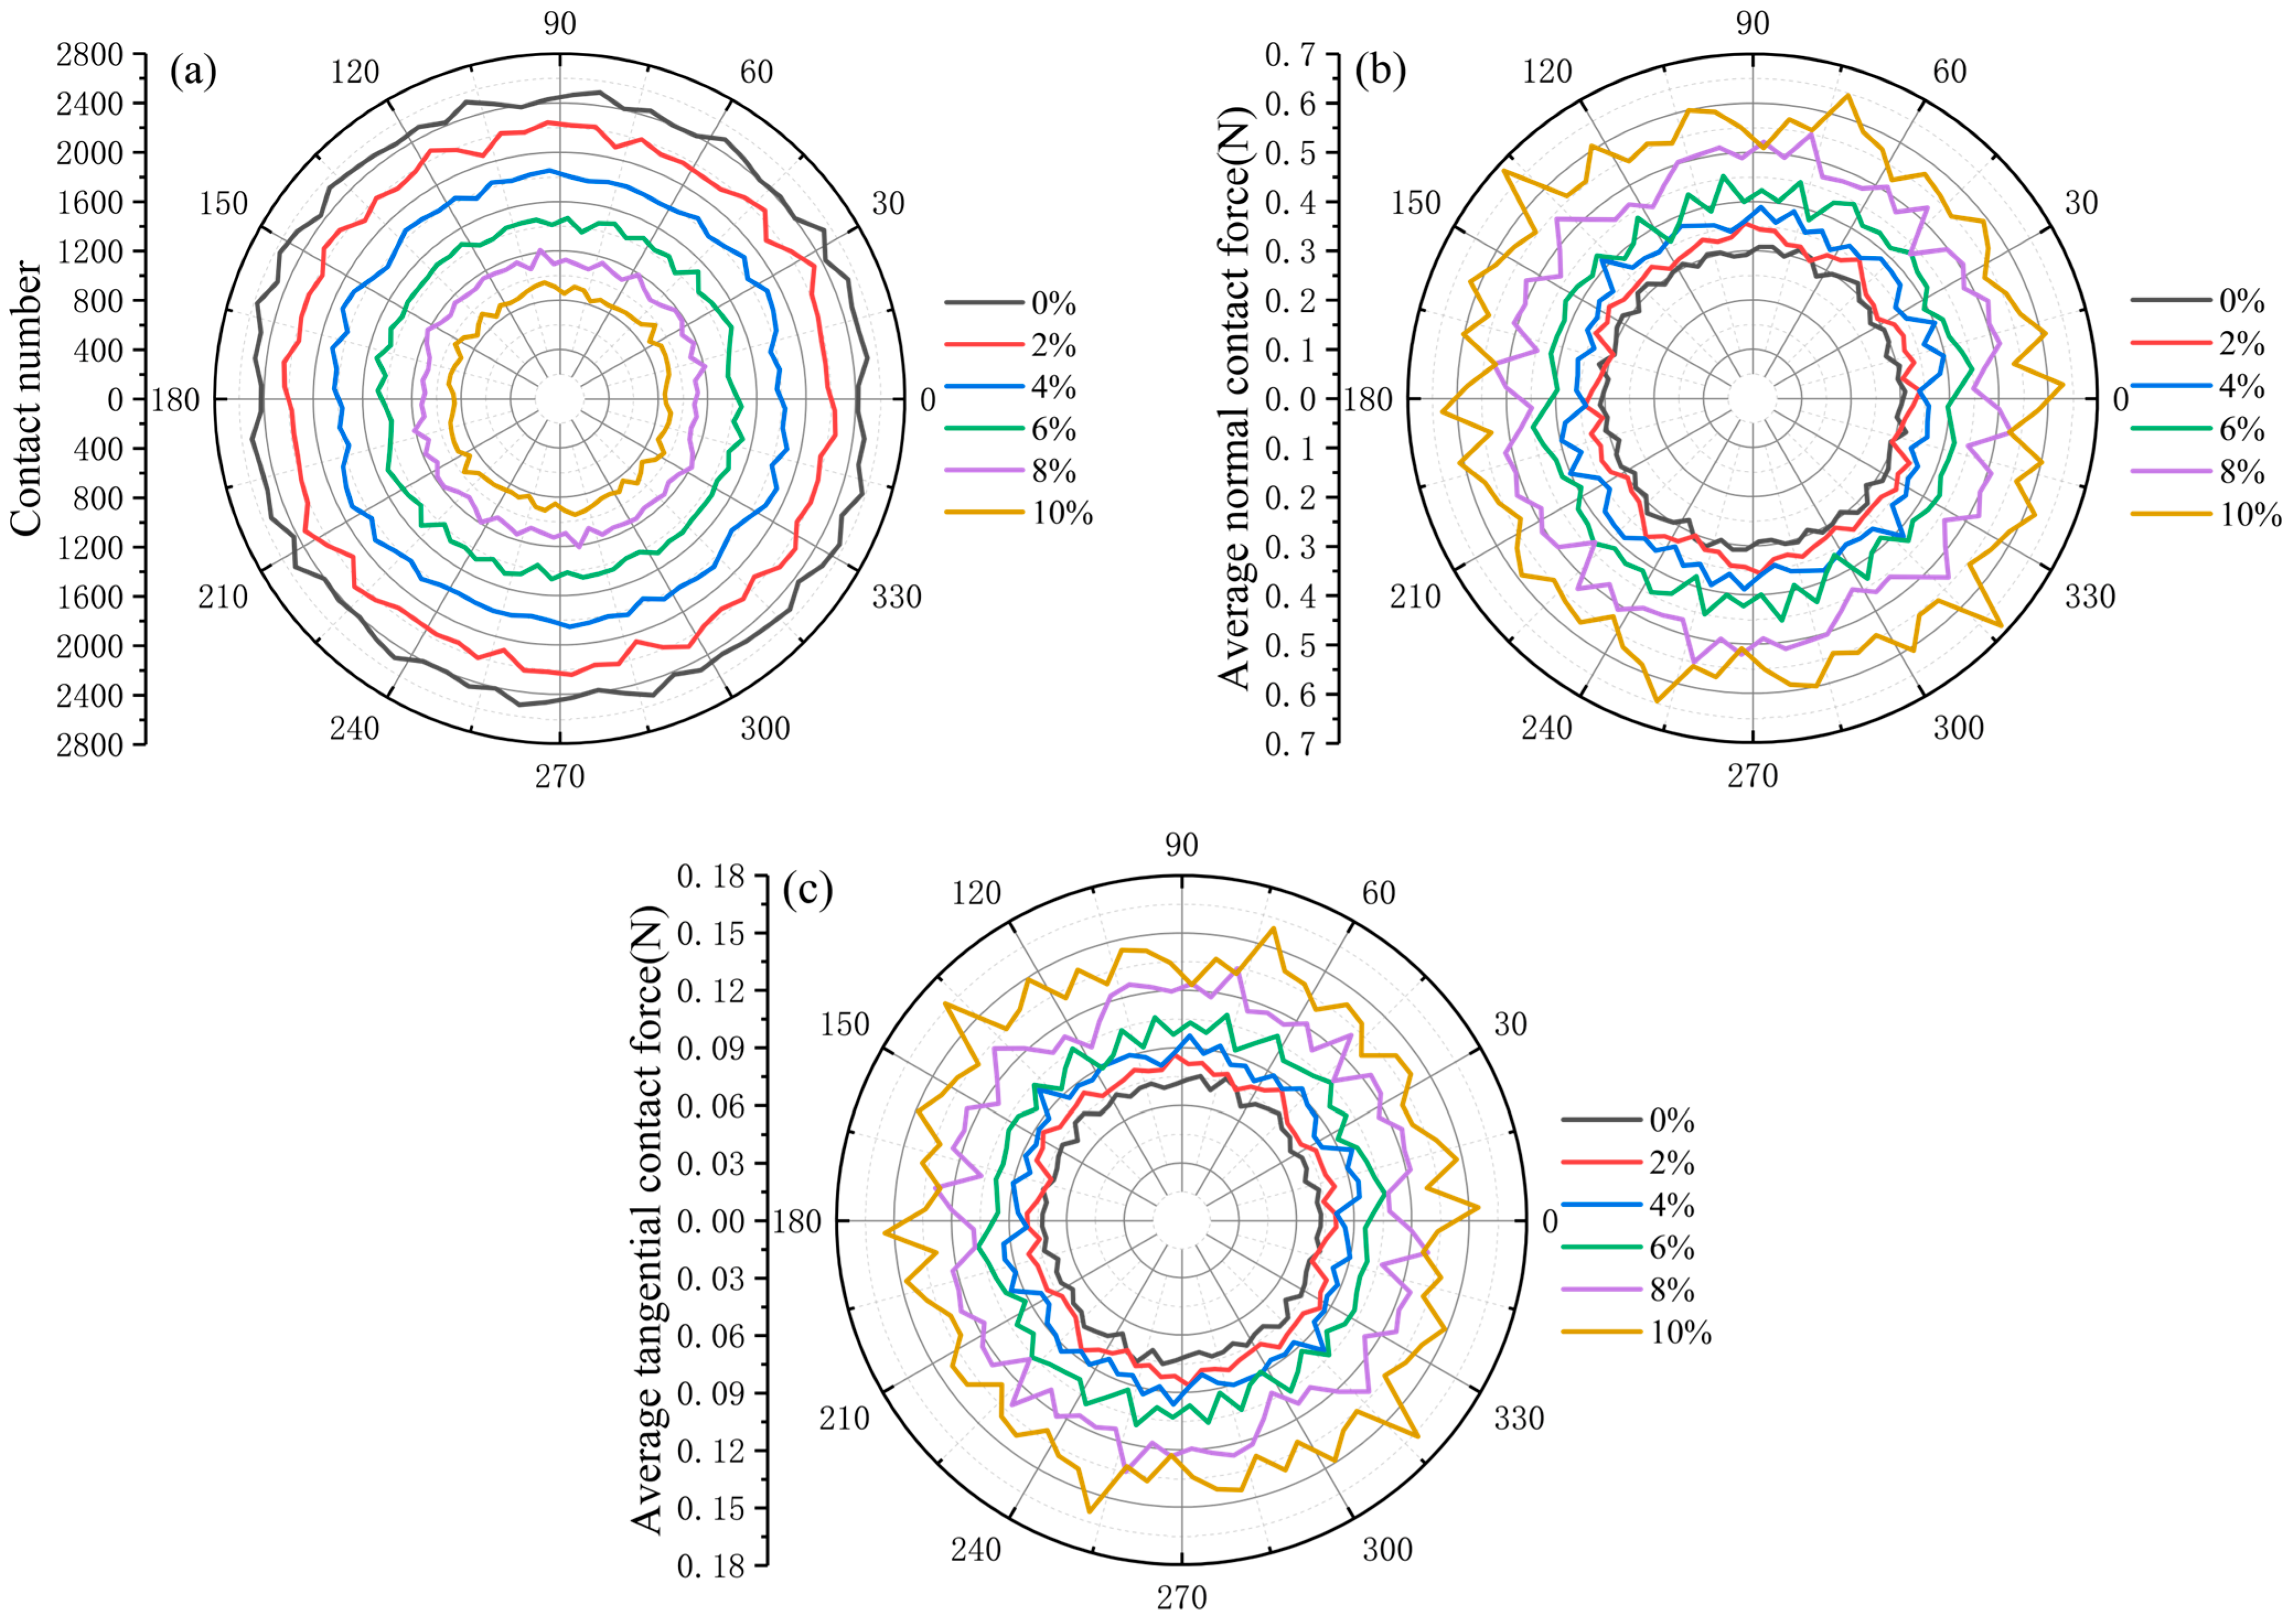
To investigate how the distributions of contact number, normal force, and tangential force evolve as the internal erosion progresses, the eroded samples prepared by the CF approach were chosen as an example. Figure 13 shows the distributions of contact number, normal force, and tangential force for the CF samples experiencing the effective confining pressure of 400 kPa at varying degrees of internal erosion, respectively, where the contact number represented the statistical values of the total number of contacts in each contact direction, the average normal contact force and average tangential contact force illustrated the ratio of the normal and tangential contact forces at contact points within each angular interval to the corresponding total contact number.
Figure 13a illustrates the distribution of contact numbers in different contact directions, which appeared relatively uniform, indicating a homogeneous particle distribution after loading. Moreover, it was observed that the number of contacts between particles decreased significantly with the increased degree of internal erosion. Figure 13b,c present the distribution of average normal, and tangential contact force under different degrees of internal erosion, respectively. It is clear that the average normal contact force was greater than the average tangential contact force at a given degree of internal erosion. Additionally, the average contact force exhibited a gradual increasing trend with the increase in the degree of internal erosion, due to the significant decrease in the total number of contact points as presented in Figure 13a.
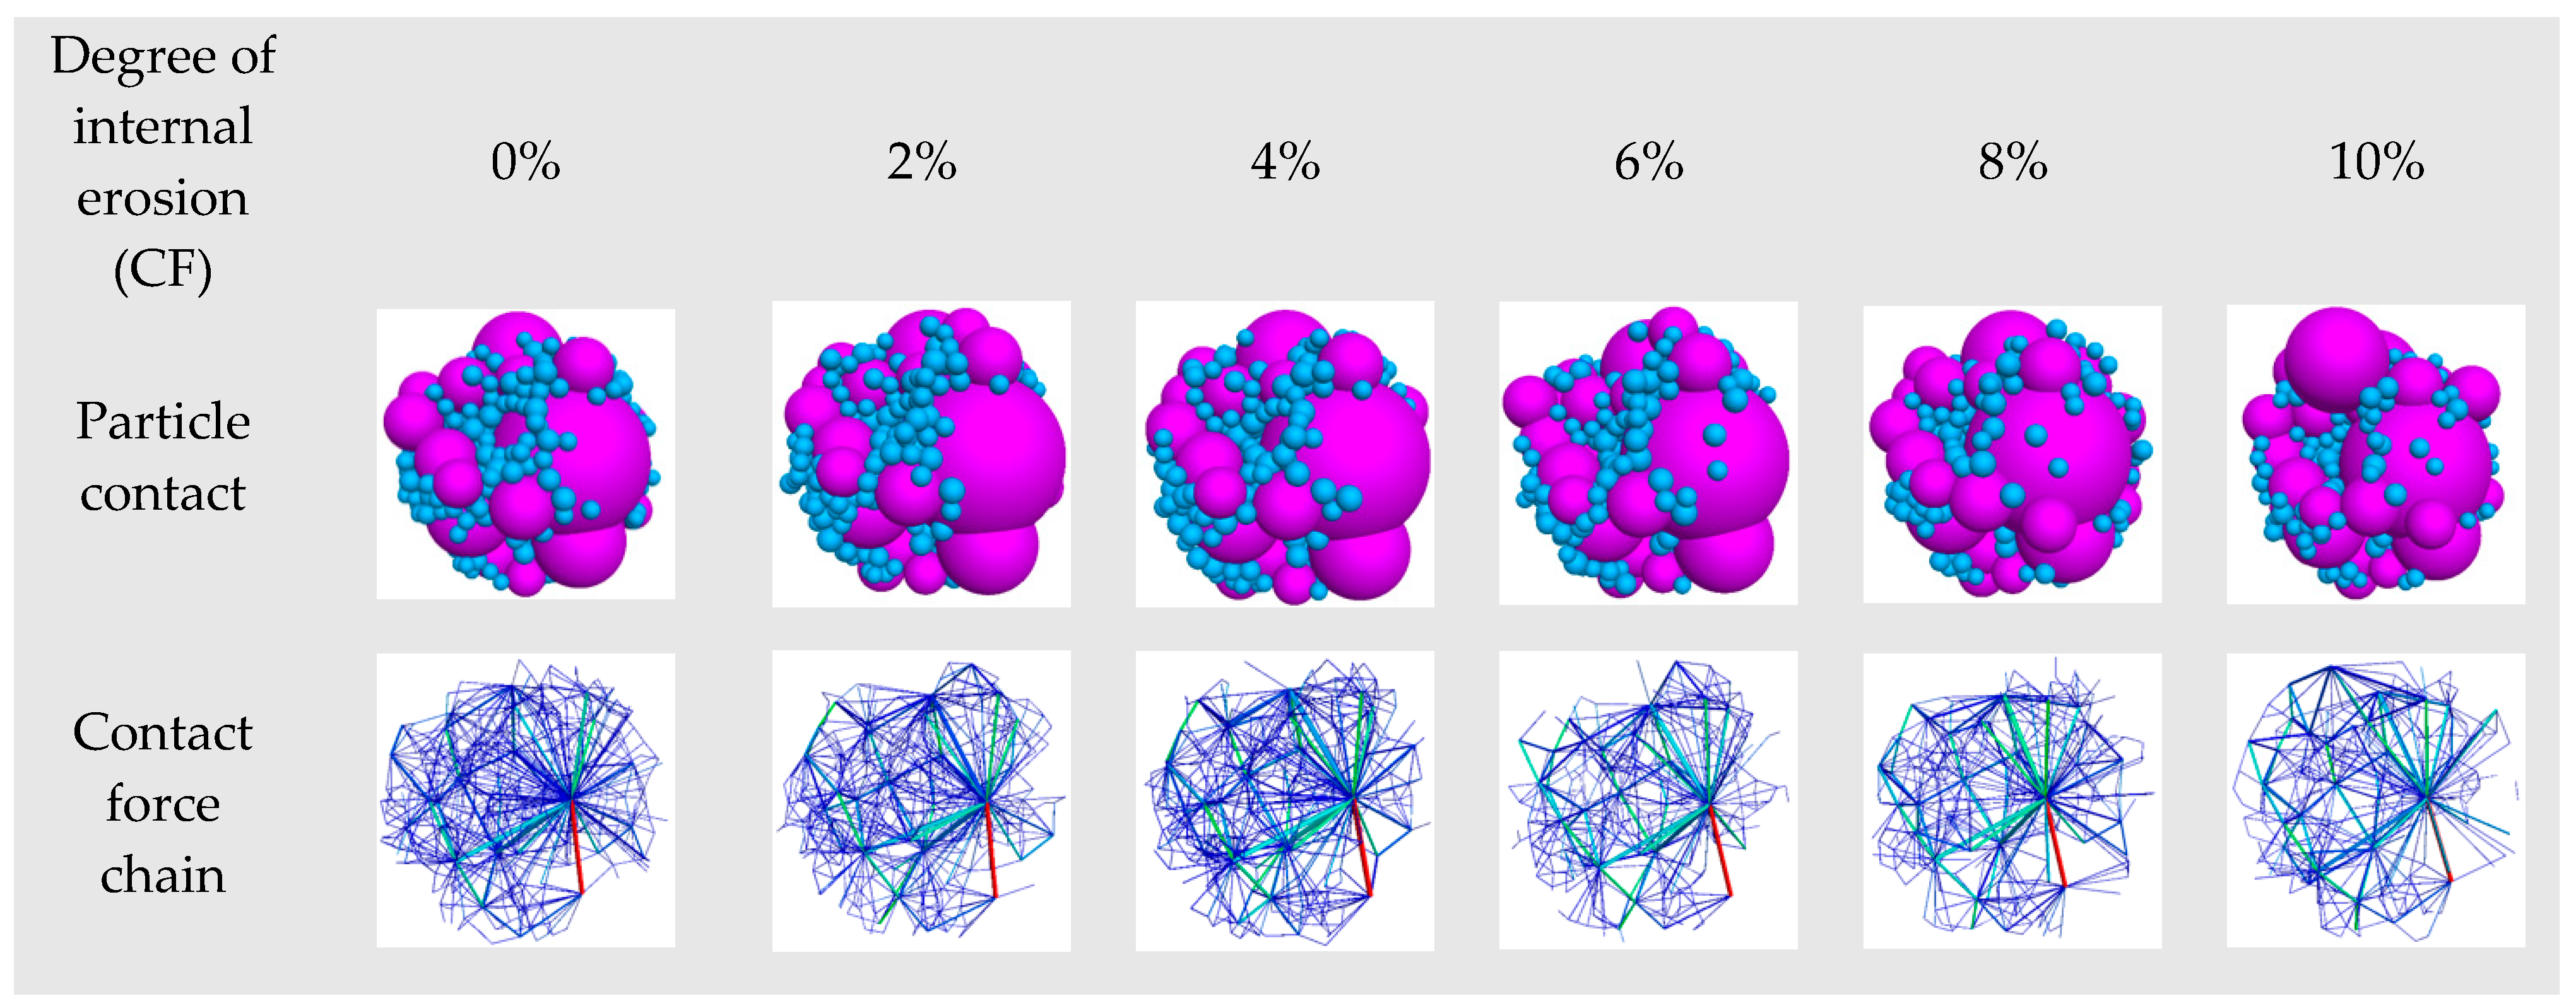
A closer look at the evolution of the contact force chain of the eroded sample is presented in Figure 14, where a spherical area with the sample center as the origin and a radius of 4 mm was sliced at the sample center with the fine particles denoted in blue, while coarse particles represented in purple. As indicated in Figure 14, lines of varying thicknesses and colors indicate the magnitude of contact forces, with thicker lines representing greater contact forces. It was observed that as the internal erosion progressed, the total number of contacts decreased significantly, and the contacts became more concentrated between coarse particles. Furthermore, with the increase in the degree of internal erosion, the contact forces between fine particles or between fine and coarse particles disappear, leading to the gradual compression of coarse particles towards the central region.

3.4.2. Effect of the Eroded Sample Preparation Method

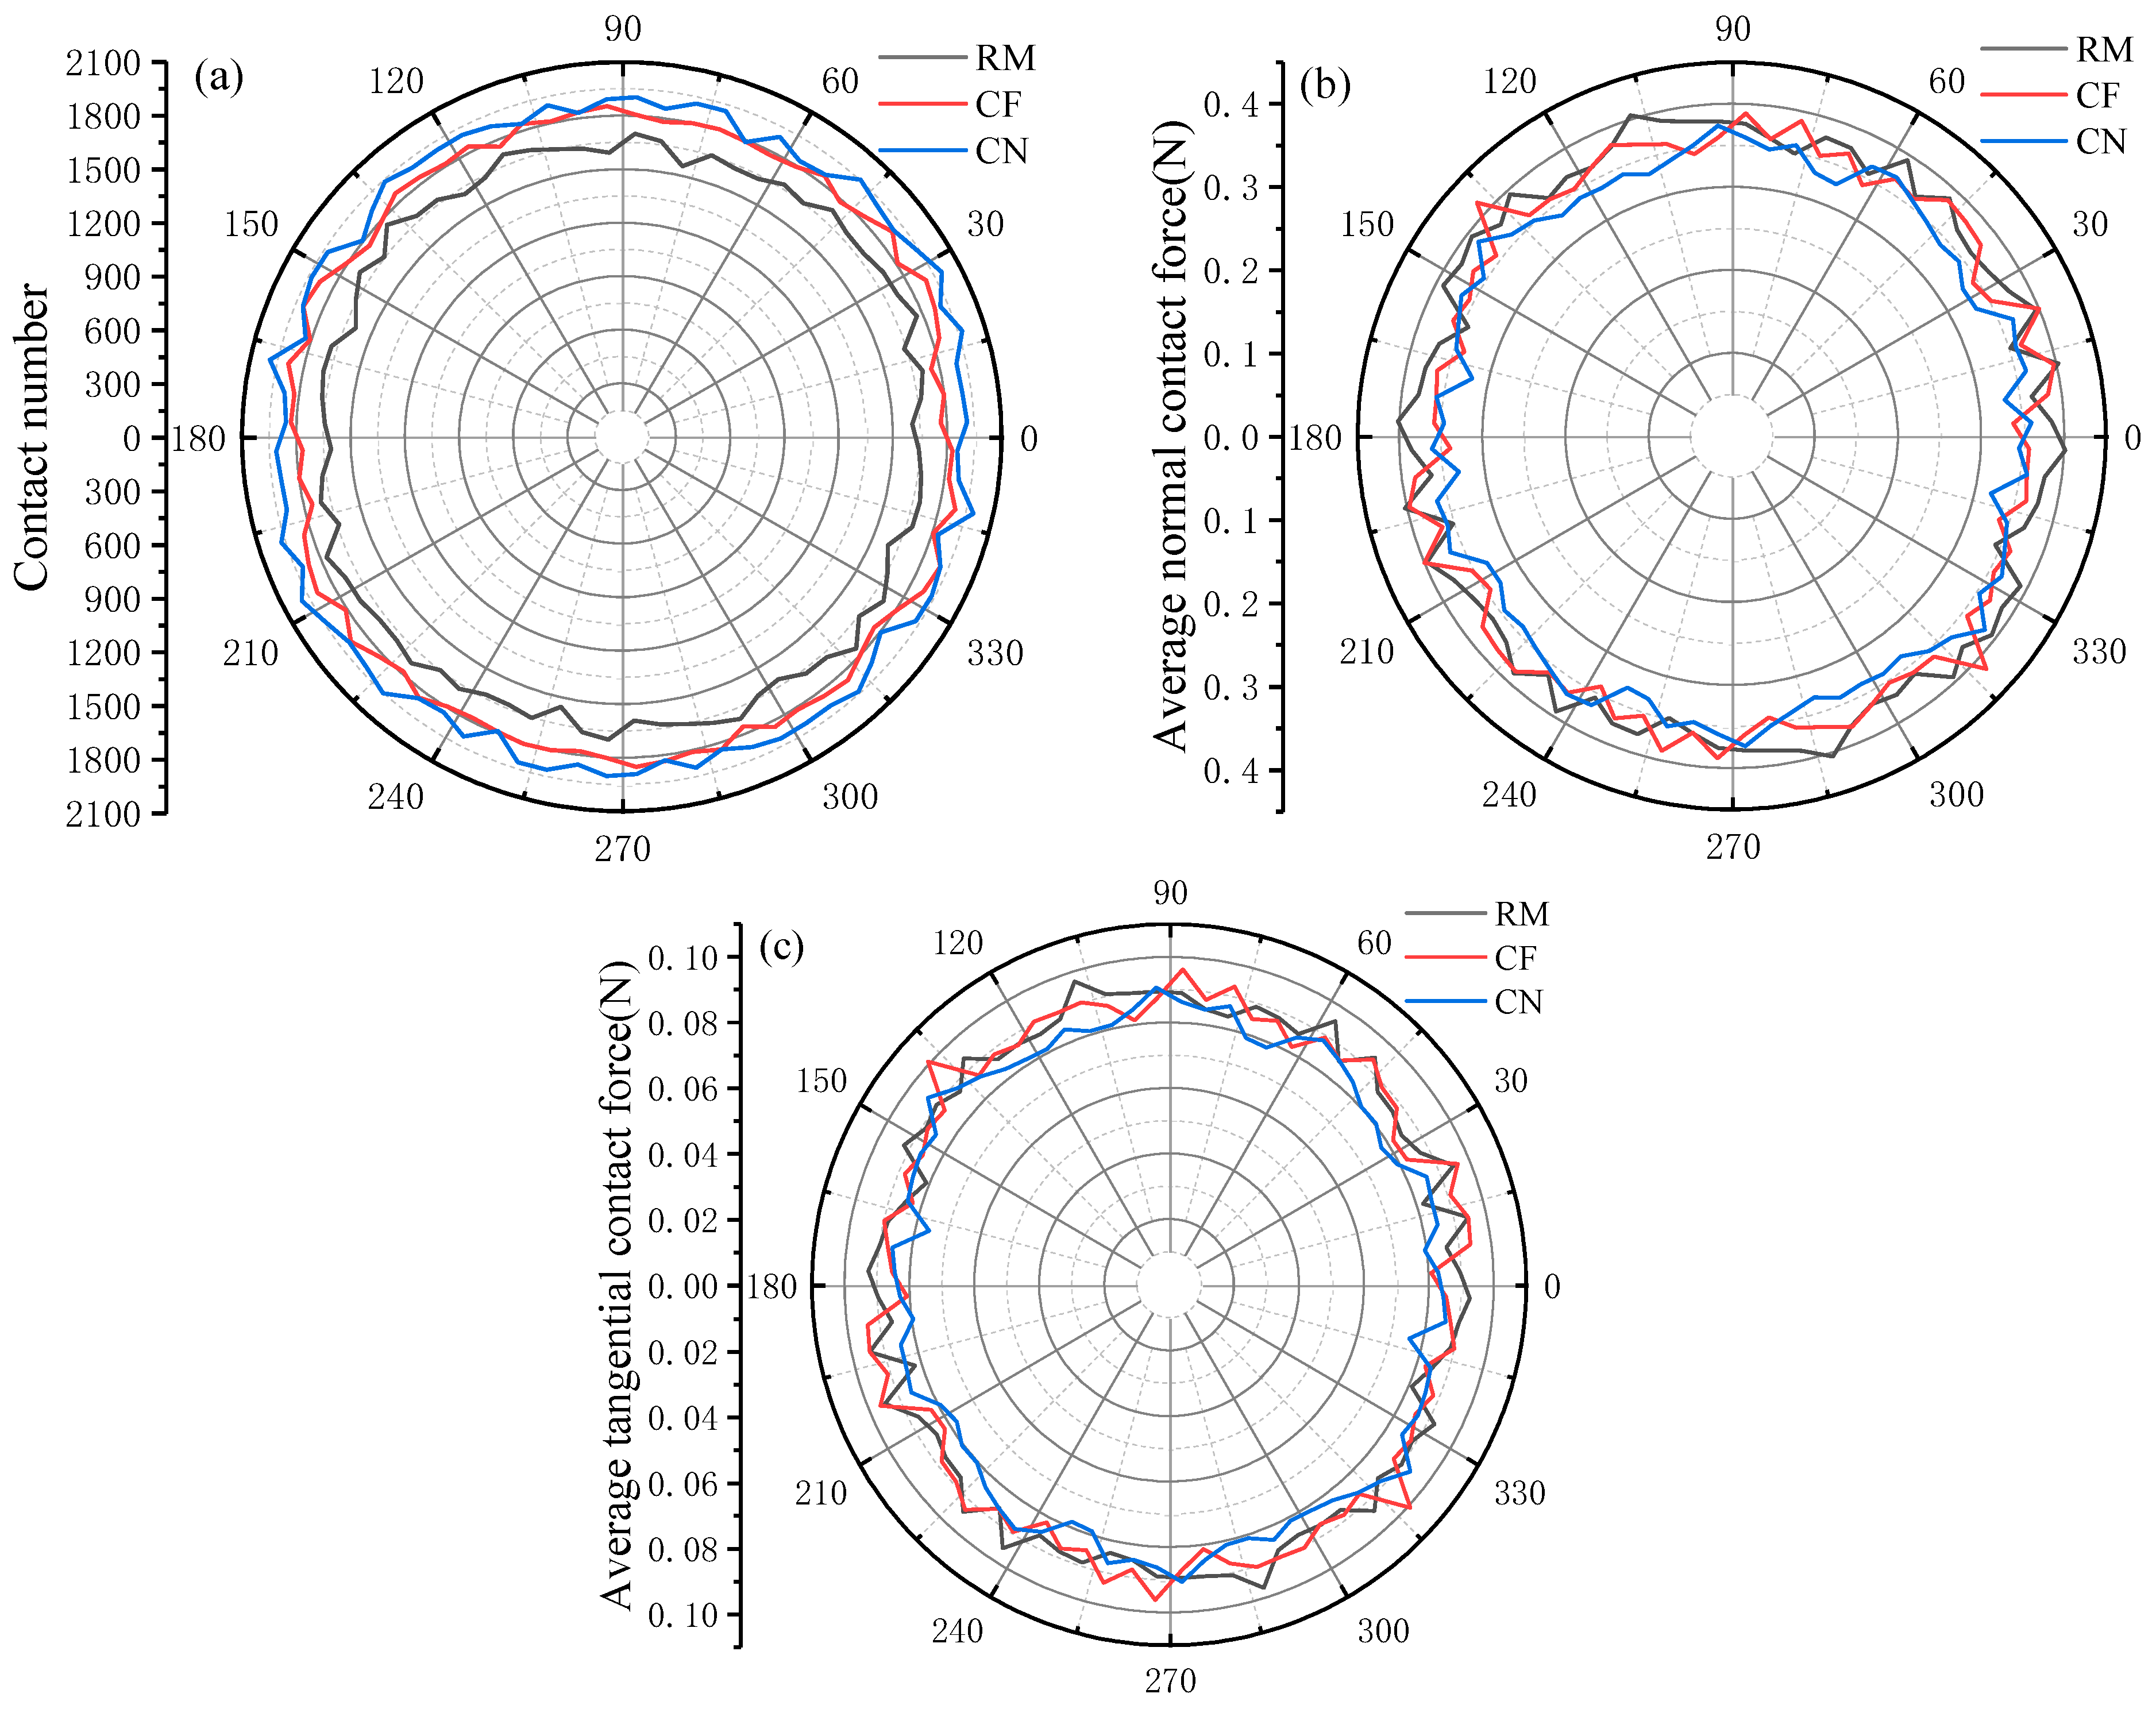
To further investigate the differences in the distributions of the contact number and contact forces of eroded samples prepared by different approaches, samples with the degree of internal erosion of 4% under the confining pressure of 400 kPa were employed for analysis and compared as shown in Figure 15.
As shown in Figure 15, the three approaches exhibited clear differences in contact force distributions. The RM samples displayed fewer contacts but higher average normal forces, whereas the CN samples showed more contacts accompanied by lower average contact forces, with the CF samples generally falling between these two extremes. These differences can be explained by the underlying deletion rules: the RM approach removed more particles from the smallest size fraction (Figure 8), thereby reducing the number of contacts but increasing the force carried by each contact, while the CN approach retained more particles with higher coordination numbers, leading to more contacts but smaller average forces.

3.5. Probability Distribution Function of Contact Force

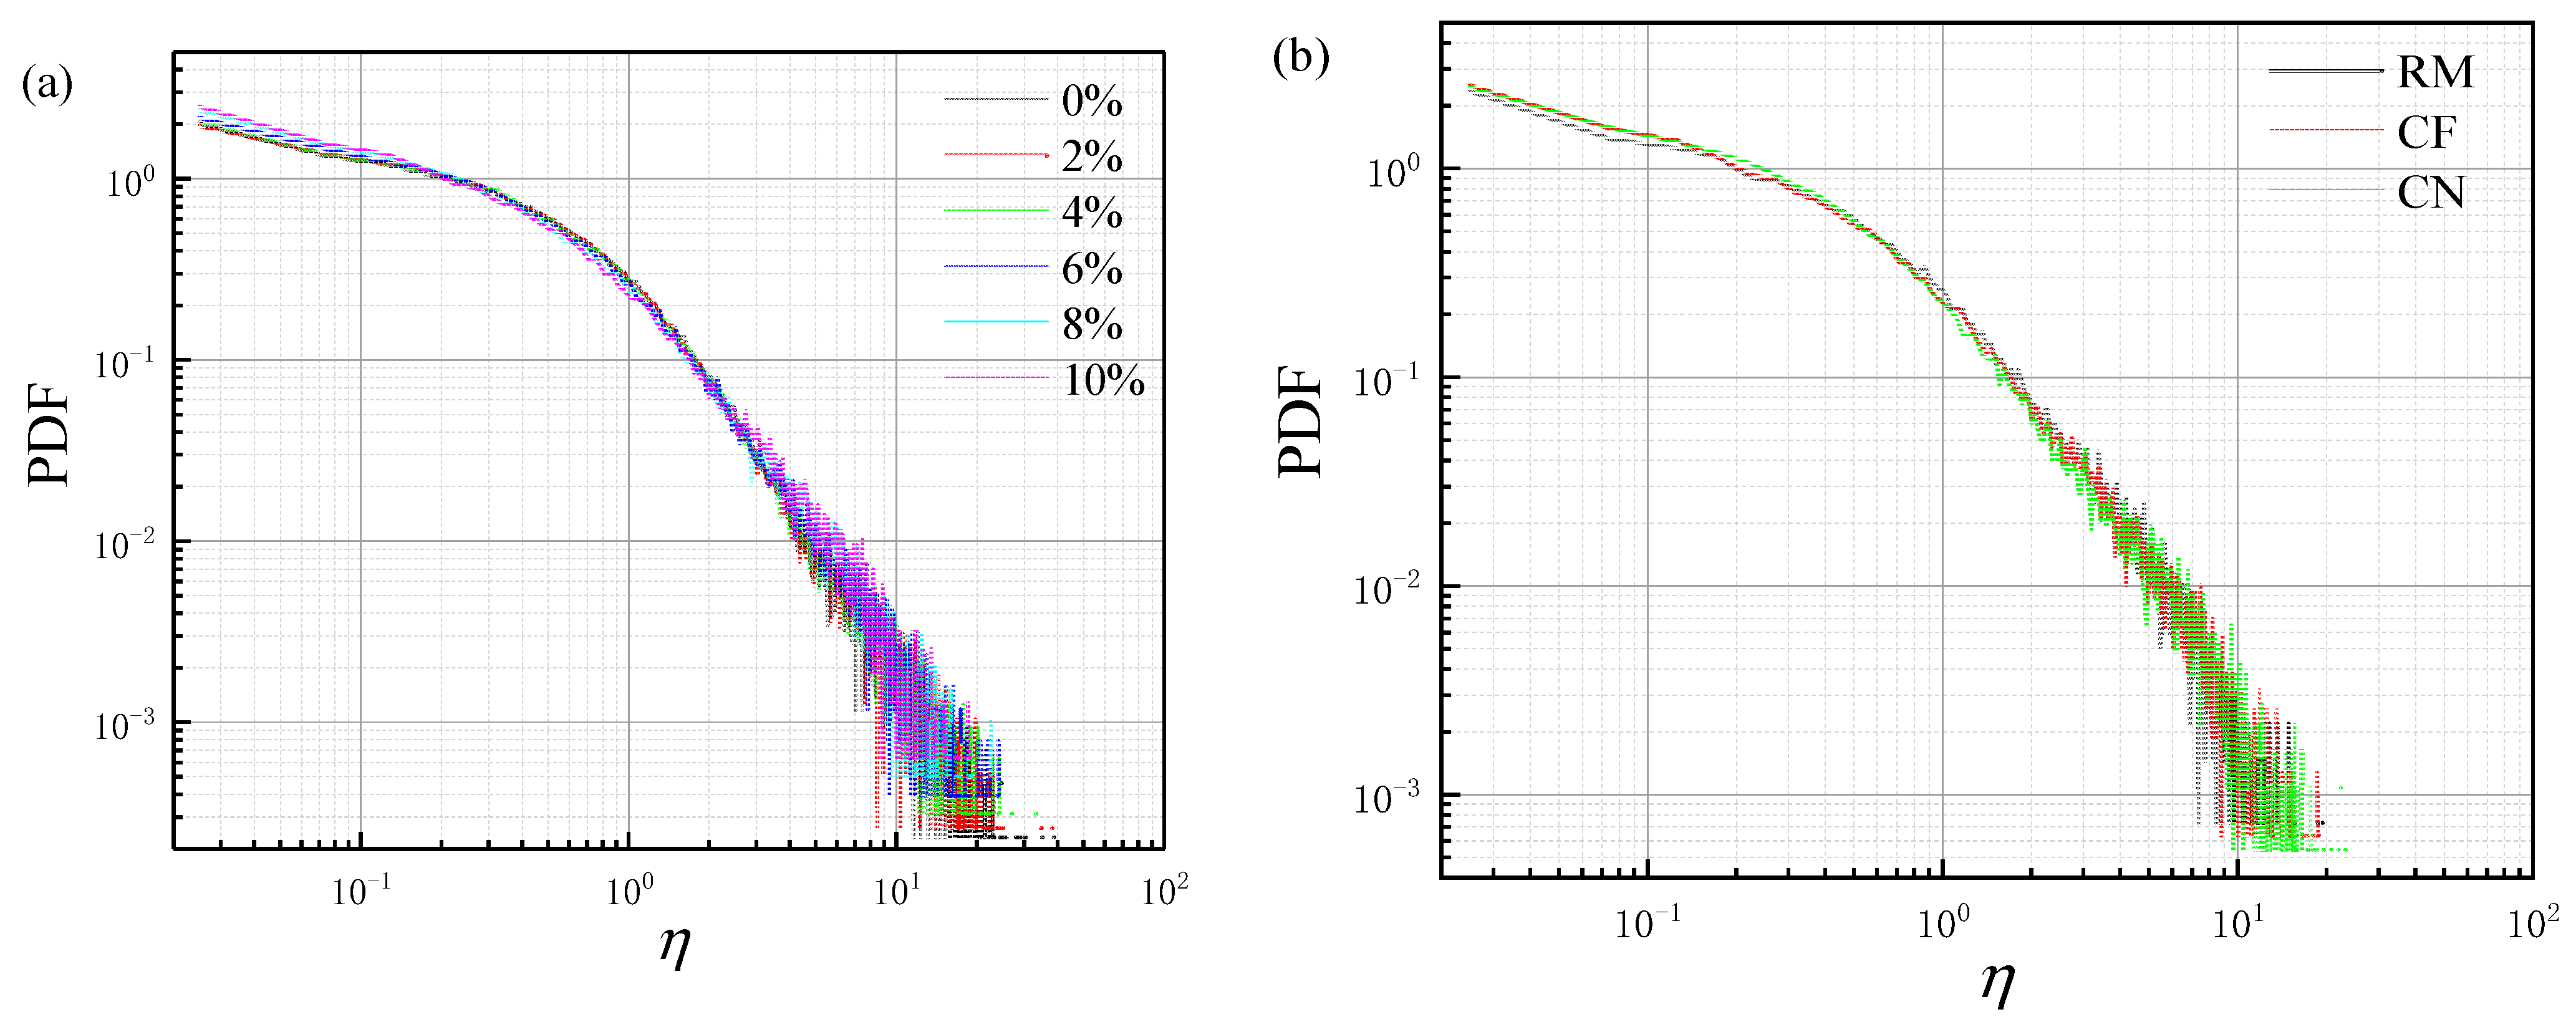
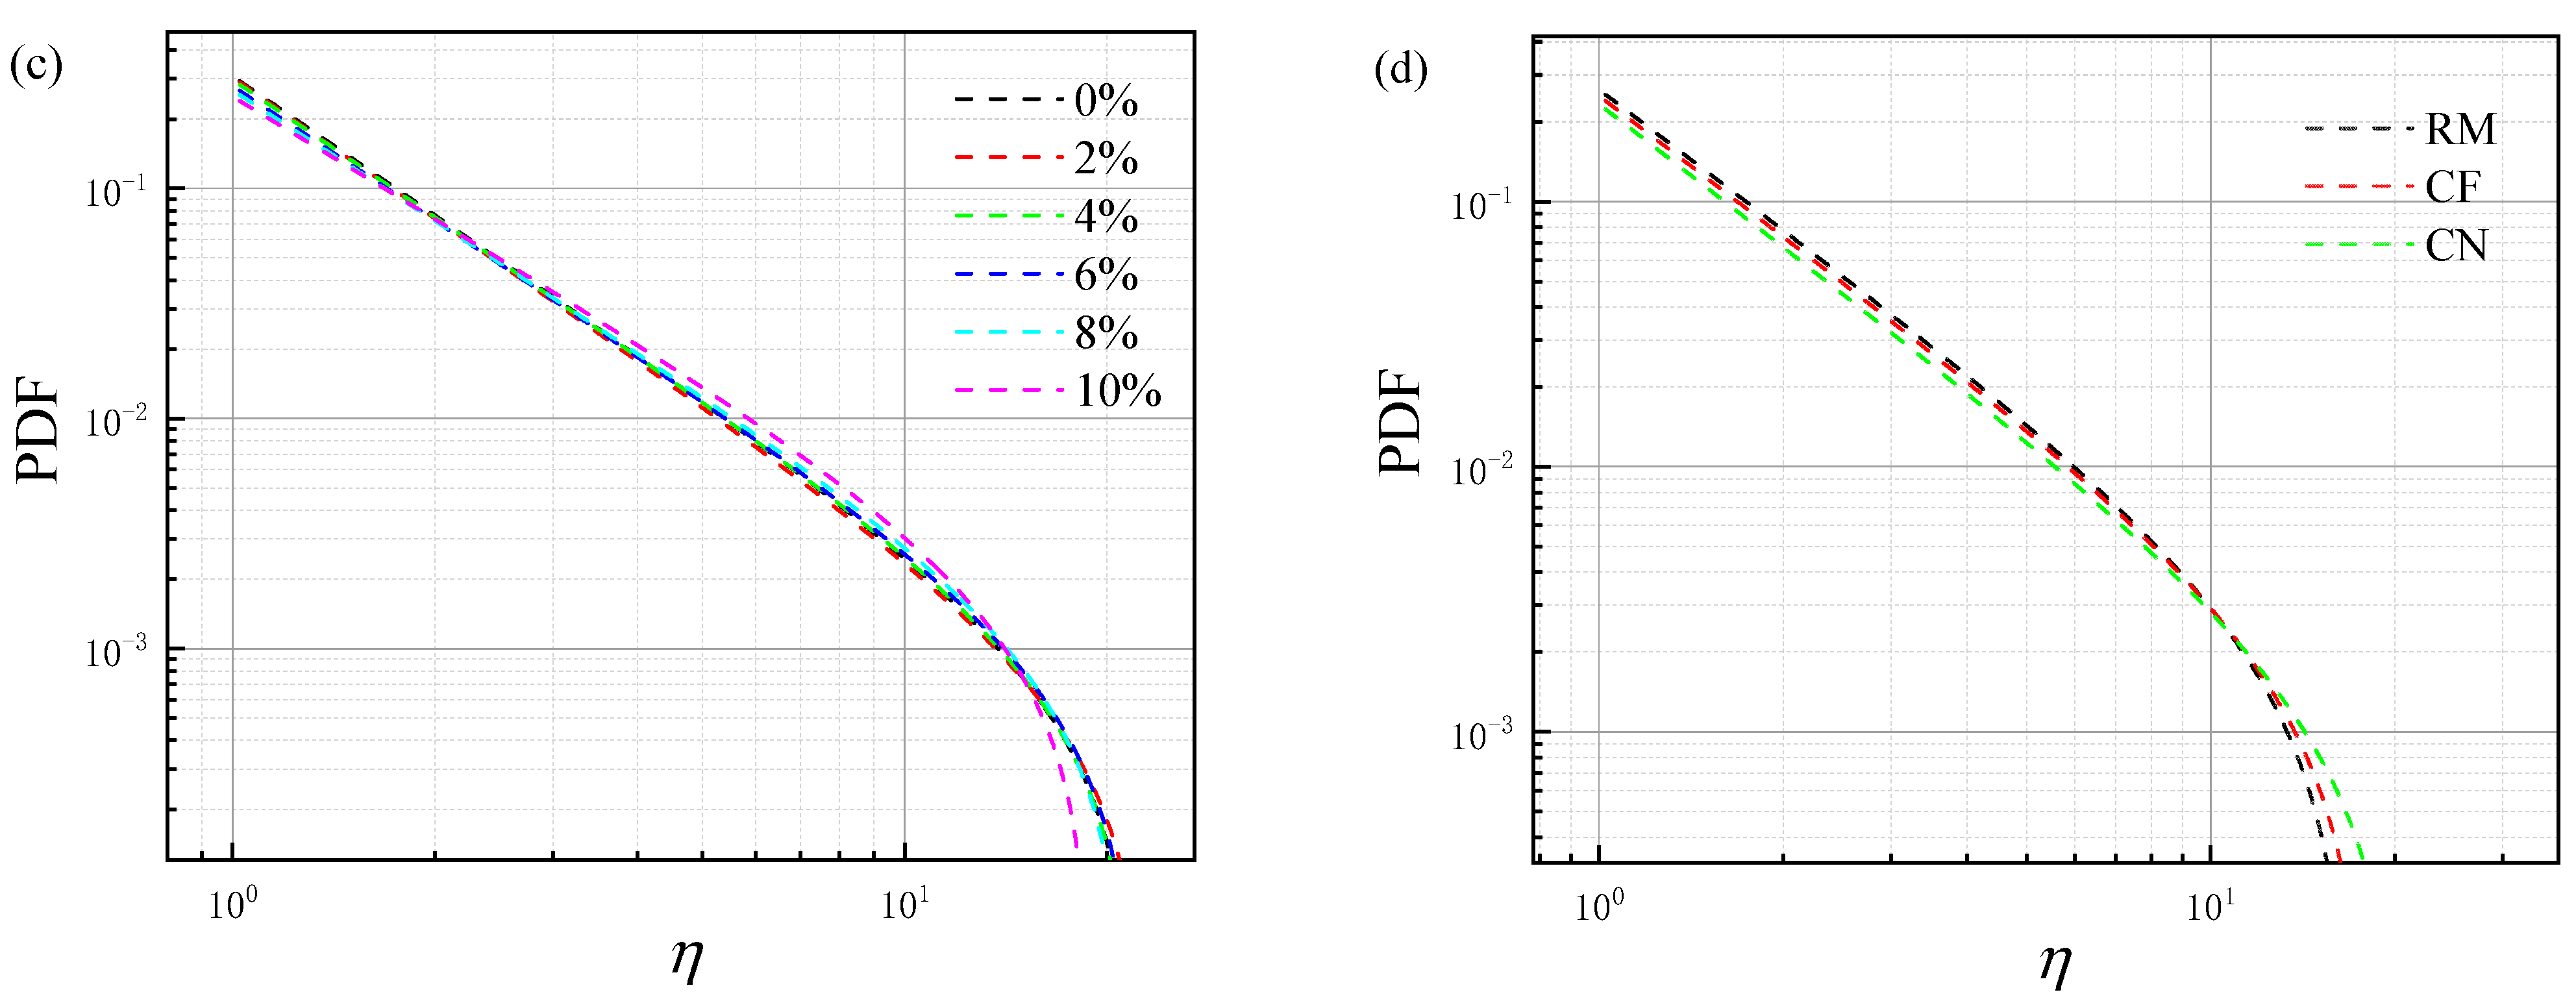
Figure 16 shows the probability distribution functions (PDF) [36] of inter-particle contact forces for samples prepared by different approaches with varying degrees of internal erosion, where η denotes the ratio of contact force to average contact force. The PDF curves for each sample group exhibit similar patterns. As the contact force increases, a clear downward trend is observed, indicating a lower probability of occurrence for higher contact forces. The tail of the distribution corresponds to rare, large-force events with very low probability. Under finite sample size, the counts per bin are sparse and the log–log plotting amplifies sampling noise; intermittent force chain rearrangements in DEM further introduce variability. To clarify the analysis, we fitted the tail data points of the curves (η > 1) with a power-law function, as shown in Figure 16c,d, and the fitted results are reported in Table 3 and Table 4.
As shown in Figure 16a, it was found that at lower contact forces, the higher the degree of internal erosion, the higher the curve. However, the overall differences between the curves were small, indicating that the degree of internal erosion had little impact on the distribution of lower contact forces. At higher contact forces, with an increasing degree of internal erosion, the likelihood of encountering higher contact forces decreased, and the peak contact force gradually decreased (Figure 16c). As shown in Figure 16b,d, it could be seen that the probability of encountering small contact forces of the eroded samples prepared by the RM approach was lower than the other two approaches, while the probability of encountering higher contact forces was highest for CN, followed by CF, and RM samples. This indicated that the distribution of contact force of the RM samples was more concentrated compared to the other two samples.

3.6. Average Coordination Number of Particles

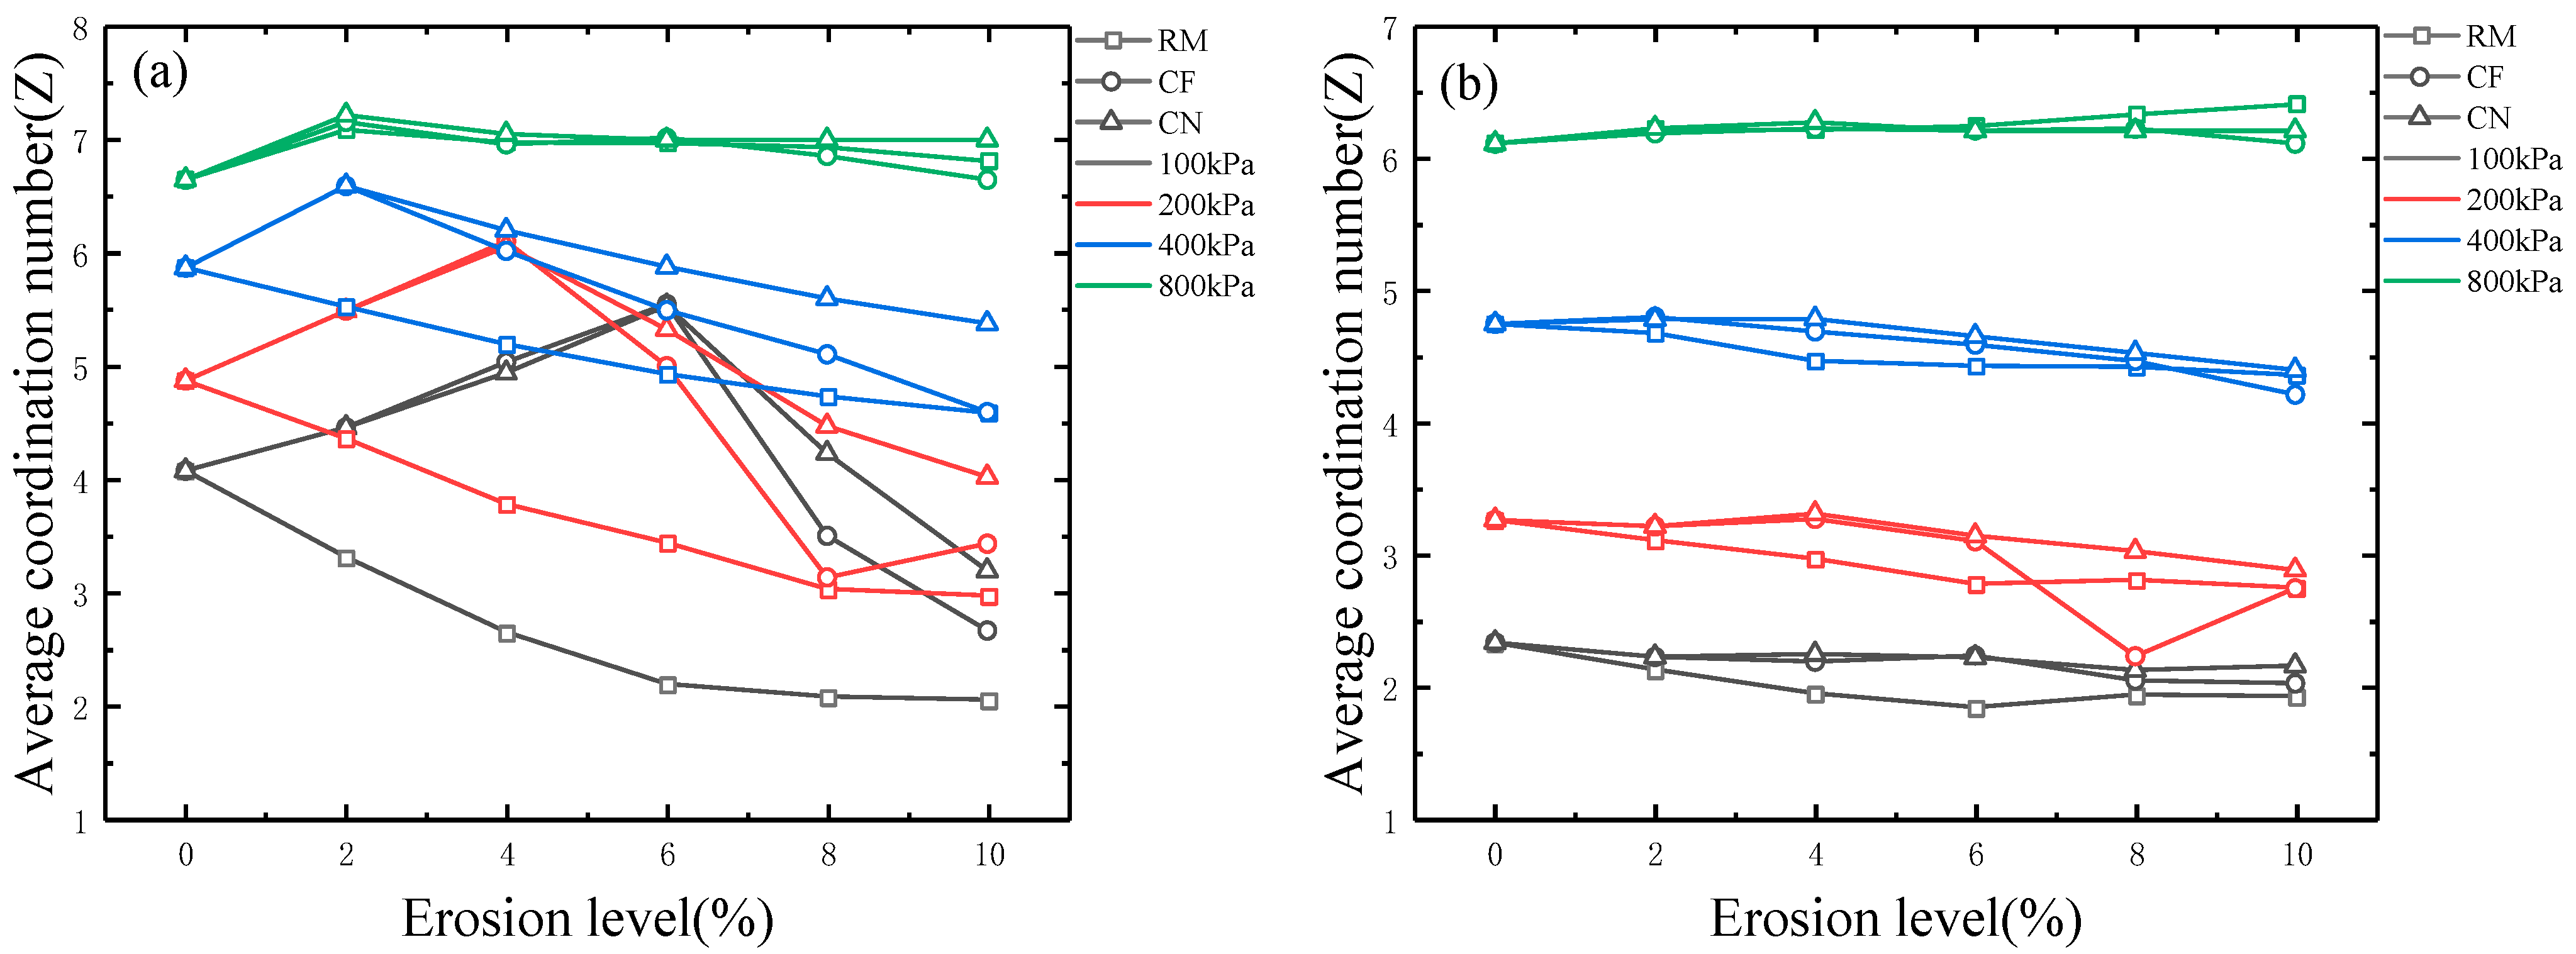
Figure 17 shows the evolution of the average coordination number of eroded samples with different degrees of internal erosion under different effective confining pressures before and after shearing, respectively. The average coordination number of particles is a microscopic parameter used to describe the average number of contacts per particle [37], which can be calculated using the following Equation (6).
Z = 2 N c N p
where Z is the average coordination number of particles; Nc is the total number of contacts within the sample; Np is the total number of particles within the sample.
It was observed from Figure 17a that the Z value of the eroded samples prepared by the RM approach was significantly smaller than that of the CF and CN approaches before shearing. Additionally, both the Z values for the CF and CN samples initially increased with the degree of internal erosion and then decreased after reaching the peak state. Such a trend was less pronounced for the RM samples where particles were randomly deleted. This discrepancy was attributed to the prioritized deletion of suspended particles without contacts for the CF and CN approaches, whereas the uncertainty of the RM approach led to the deletion of finer particles with higher coordination numbers, resulting in an overall smaller Z value. Similarly, the preferential deletion of suspended particles and particles with fewer contacts led to a reduction in Np, with Nc remaining unchanged or decreasing slightly. Consequently, for lower degrees of internal erosion, the Z values for the CF and CN approaches increased with evolving internal erosion due to the deletion of suspended particles and particles with fewer contacts. Additionally, Figure 17a shows that under low effective confining pressures (100 and 200 kPa), the average coordination number Z for the CF and CN schemes increases during erosion and only begins to decline at about 6% and 4% fines loss, respectively. This occurs because both schemes preferentially remove suspended particles with zero coordination. At low confinement the specimens are looser and contain more suspended particles, so Np decreases much faster than Nc. Since Z is effectively proportional to Nc divided by Np, this imbalance causes Z to rise until most suspended particles have been eliminated; with further erosion, fines with nonzero coordination are removed, and Z then starts to decrease. However, the minimal variations in Z values among the sample with varying degrees of internal erosion were observed as shown in Figure 17b, indicating that the contacts between particles after shearing were primarily provided by larger particles.
Moreover, as indicated in Figure 17, as the degree of erosion increases, the average coordination number (Z) typically shows an increasing trend. This is because, as internal erosion progresses, the contact network of larger particles is strengthened, leading to an increase in the number of inter-particle contacts. However, as the degree of erosion deepens, fine particles gradually lose contact, particularly those particles that initially had fewer or no contacts with other particles, which are preferentially removed during erosion. This process leads to a decrease in the overall coordination number, especially at higher erosion levels, where Z values are significantly reduced due to the loss of contact by fine particles. Therefore, although internal erosion may initially cause an increase in Z values, as the degree of erosion progresses, the Z value may ultimately show a decreasing trend. And it was evident that for the eroded samples prepared by the CF approach subjected to an effective confining pressure of 200 kPa, a significant decrease in Z value was observed with the degree of internal erosion of 8%. This could be attributed to the deletion of a substantial number of fine particles with high coordination numbers but low contact forces.

3.7. Influence of Internal Erosion on Critical State Line

The concept of critical state is defined as a state at which plastic shearing could continue indefinitely with no change in effective stress or specific volume [38]. These critical states were reached with a unique line or curve in both p′-q space and e-log(p′) space, which is the fundamental of the pioneering work of critical state soil mechanics (CSSM) [38]. Experimental studies in the literature have revealed that the critical state line (CSL) of remolded clay in the e-log(p′) space can be represented by a linear relationship; however, for the granular materials like sandy soil, the CSL in the e-log(p′) space is not a straight line, which might be attributed to the breakage of granular particles [39]. To model the nonlinear CSL as observed by many laboratory studies, several empirical formulas have been proposed. Among these, the power function approach proposed by Li et al. [40] has been approved to be effective and accurate, which can be written as
e c = e τ λ c p / p a ξ
where ec is the critical state void ratio; eτ is the critical state void ratio corresponding to p′ = 0; λc is the slope of the CSL; p′ is the mean effective stress; pa represents a standard atmospheric pressure, typically taken as 101.325 kPa; ξ is a material parameter, generally taken within the range of 0.6–0.8.
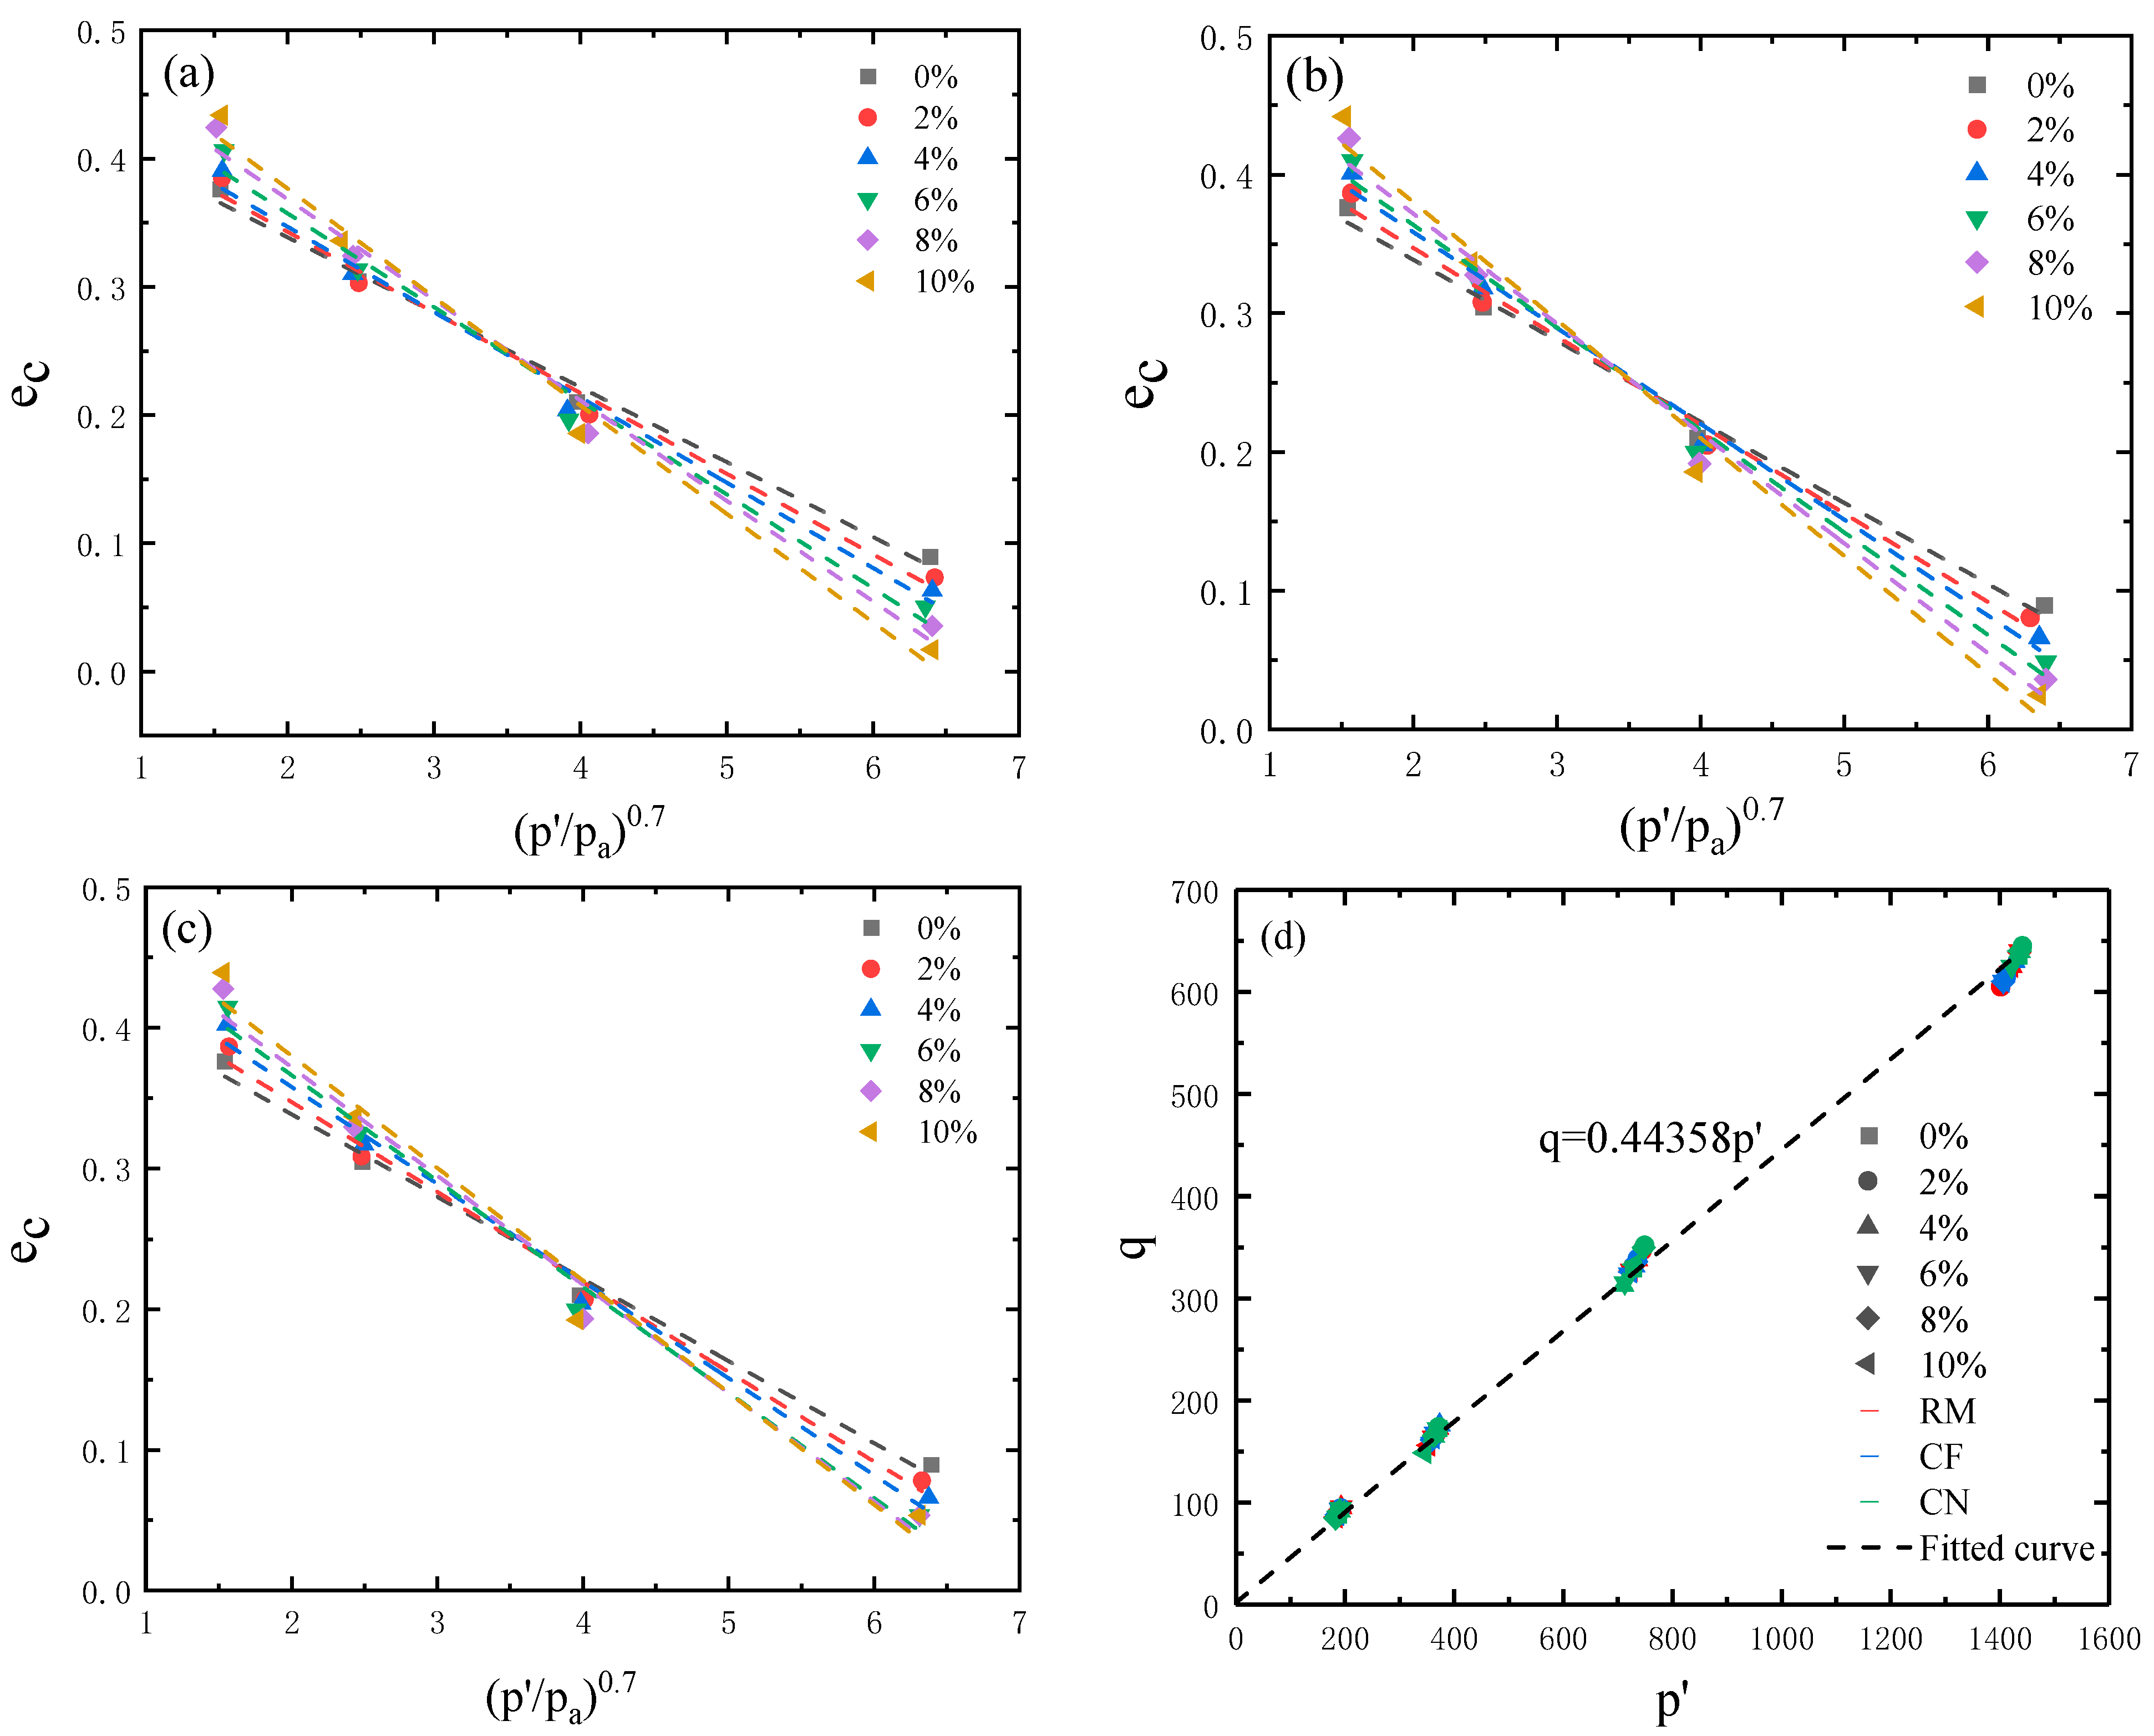
Therefore, the experimental data obtained from the triaxial consolidated drained shear numerical simulation tests in this study were substituted into Equation (7). Subsequently, the critical state void ratio and mean effective stress of samples under different degrees of internal erosion and effective confining pressure were determined and plotted in the plane of e-(p′/pa)ξ, as illustrated in Figure 18, with the material parameter ξ set to 0.7, Equation (7) is changed as
e c = e τ λ c p / p a 0.7
As shown in Figure 18, Equation (8) can well capture the CSL of samples subjected to a given degree of internal erosion, and the values of the CSL are fitted and presented in Table 5 with the coefficient of determination being larger than 0.97. Moreover, both the intercept and the slope of CSL in the e-(p′/pa)ξ space of the sample increased with evolving internal erosion. It was clear that the CSL shifts upwards together with a rotation in the e-(p′/pa)ξ space with the progress of internal erosion, while the critical state friction angle will not change significantly for the eroded soil samples. It is interesting to note that the evolution of CSL of the eroded soil is opposite to that of the crushable soils to some extent. Numerous studies have found that particle breakage will not only result in a downward shift but also a rotation of the CSL [39,41], such that the opposite trend is primarily attributed to the difference in the evolution of PSD. For an eroded soil sample, the PSD will evolve towards a state with less fine particles and a narrower grading, while for the crushable soil sample, the PSD will evolve towards a state with more fine particles and broader grading [26].
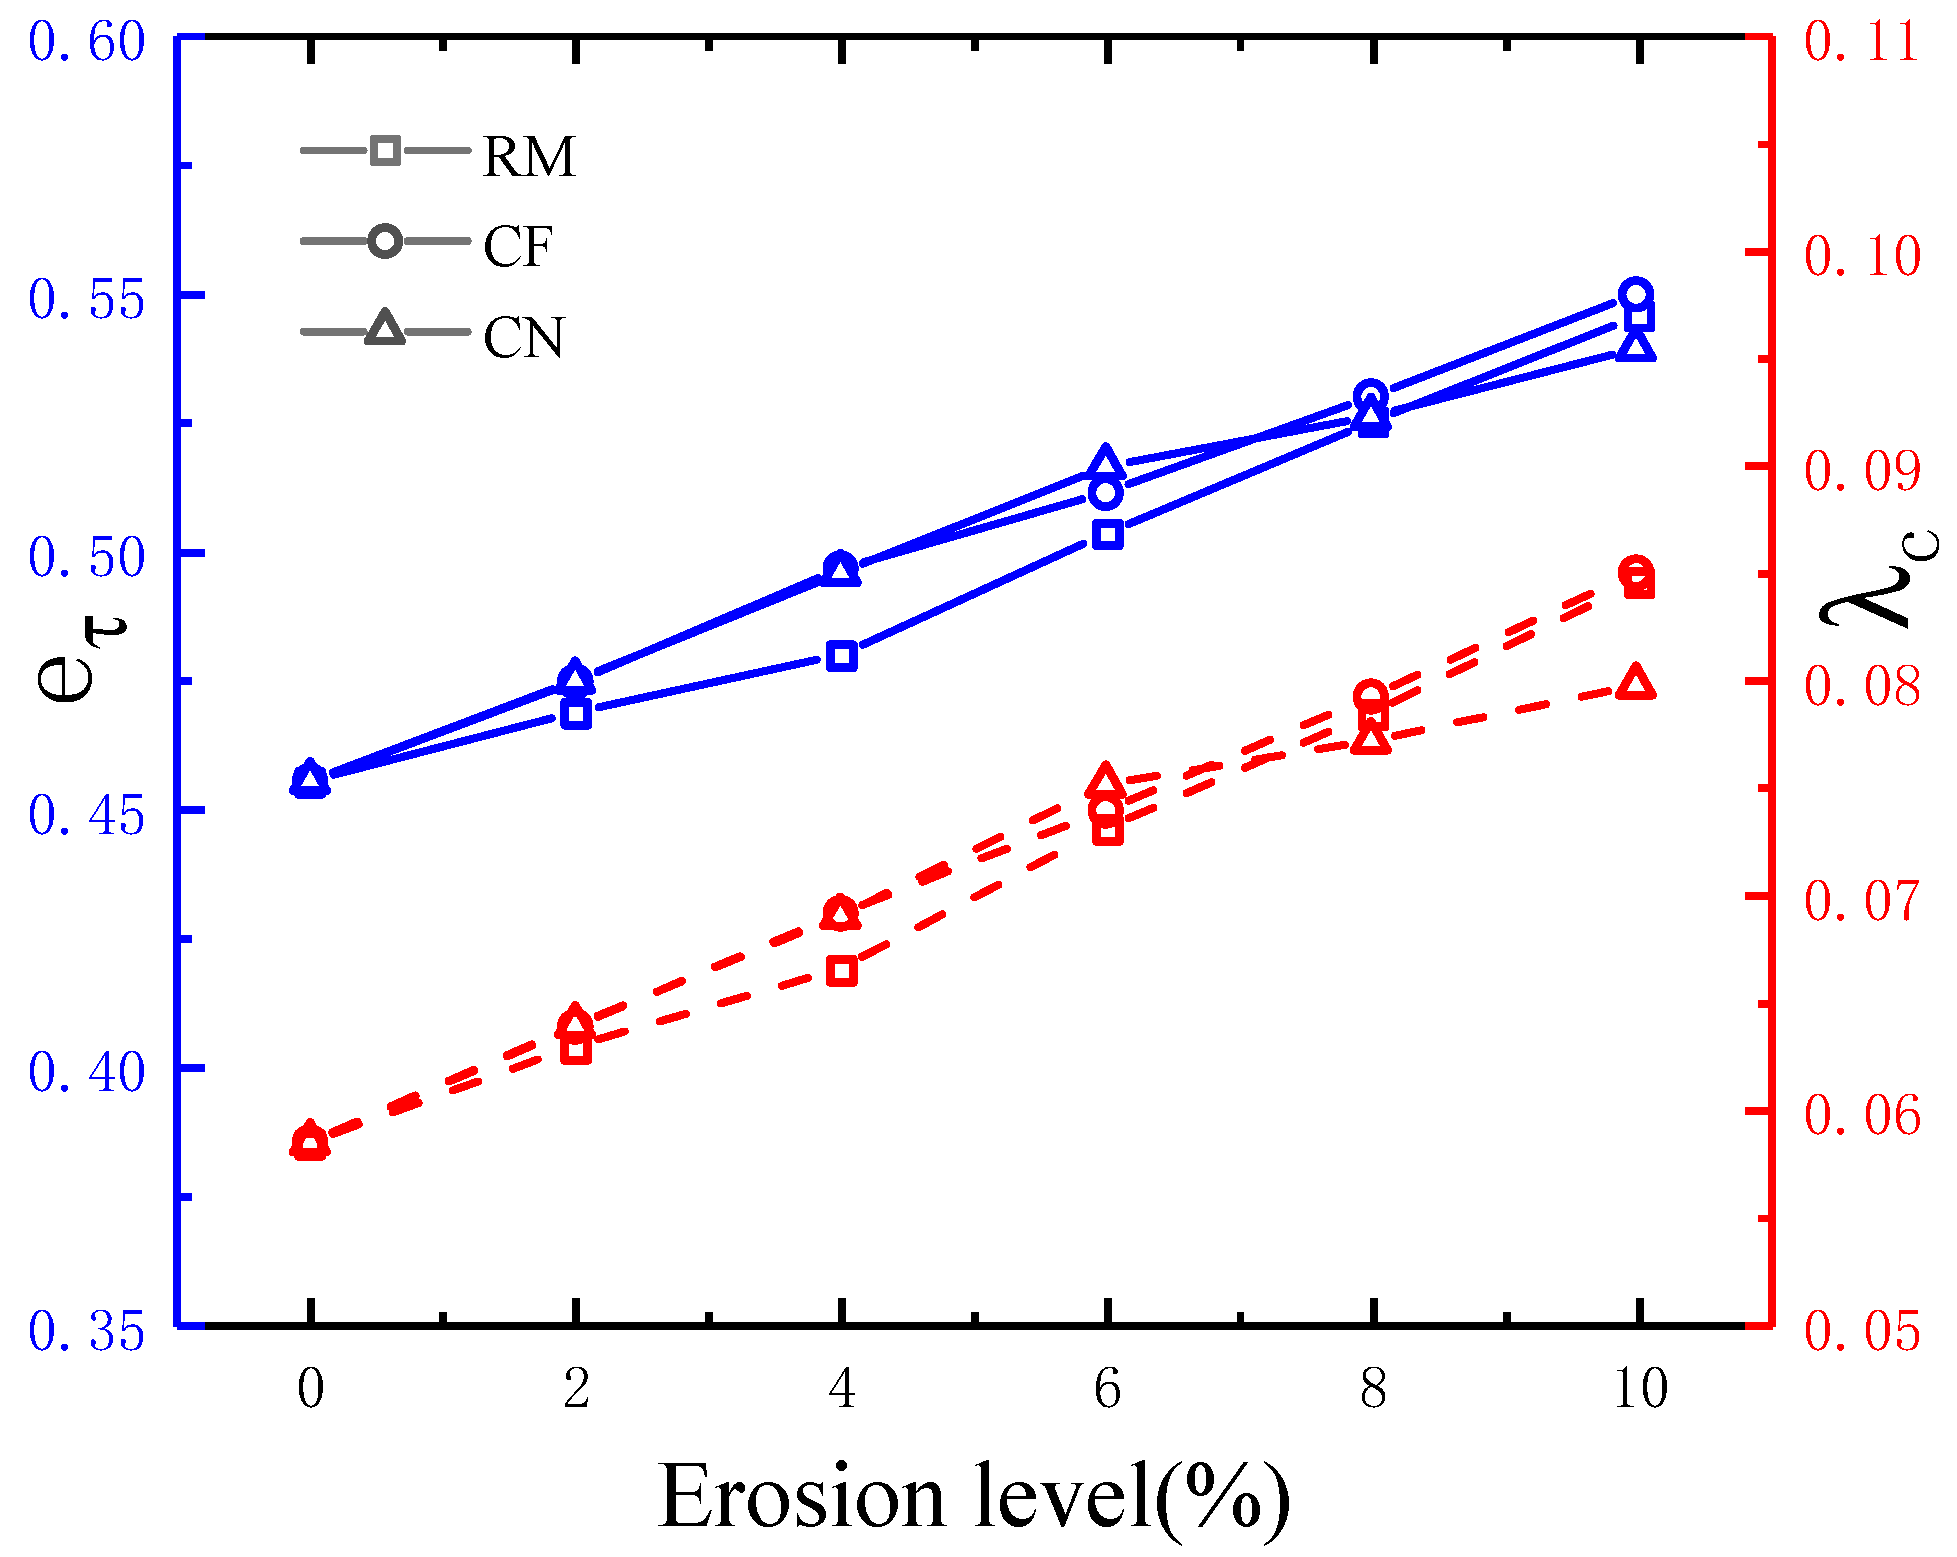
Figure 19 further compared the evolution of the critical state parameters (eτ, λc) with increasing degree of internal erosion. It was clear that both the critical state parameters eτ and λc of the eroded samples prepared by three different approaches are slightly different and exhibit a similar trend with the progress of internal erosion.

4. Conclusions

This study employs the discrete element method to systematically analyze the mechanical responses of gap-graded soils subjected to internal erosion and explicitly evaluates whether alternative fine particle-deletion strategies—random deletion (RM), contact force-based (CF), and coordination number-based (CN)—lead to distinct macro- and micro-mechanical outcomes. Through comparisons across erosion levels of peak behavior, stiffness, contact statistics, and critical state characteristics, the study provides systematic evidence on the influence of deletion strategy in DEM-based erosion simulations, addressing an issue that has received limited attention in prior research, these findings carry direct implications for design and monitoring of earth structures. The following conclusions have been drawn:
(1)
Peak strength, stiffness, and deformation resistance have decreased, whereas residual strength has remained essentially constant with increasing internal erosion. RM-prepared specimens have exhibited larger peak strength, a smaller secant modulus E50, and more pronounced dilation. The choice of removal method has had a very limited influence on residual strength.
(2)
The total number of contacts has decreased markedly, while the average normal and tangential contact forces have increased as erosion has progressed. RM has produced the fewest contacts, the largest average normal contact forces, and the smallest average coordination number; CN has produced the most contacts, the smallest average contact forces, and the largest average coordination number. Differences in average coordination number between methods have become less pronounced after shearing.
(3)
Fine-particle loss has led to an upward shift and rotation of the CSL as internal erosion has developed, whereas its influence on the critical state friction angle has been less evident. The removal method has had only a limited effect on the CSL.
Regarding the selection among the three deletion schemes, CN removes poorly connected fines, preserves the load bearing skeleton, and provides a conservative lower bound on degradation. RM removes fines regardless of stress, produces stronger PSD coarsening, fewer contacts, and larger dilation, and represents an upper bound on degradation. CF reflects stress-driven selectivity and typically falls between CN and RM; use it where stress localization and force chain effects are expected. Engineering recommendation: bracket design and monitoring by treating CN as the lower bound and RM as the upper bound, and apply CF in zones prone to localization.

Author Contributions

Writing—original draft, formal analysis, F.H.; software, H.X.; data curation, H.X., Y.X. and S.H.; investigation, resources, M.L. and Y.X.; methodology, H.X. and C.T.; validation, F.H. and S.H.; visualization, M.L. and F.H.; writing—review and editing, supervision, C.T. All authors have read and agreed to the published version of the manuscript.

Funding

This research was supported by the Excellent Youth Project of Hunan Provincial Department of Education (Grant No. 23B0007).

Institutional Review Board Statement

Not applicable.

Informed Consent Statement

Not applicable.

Data Availability Statement

The original contributions presented in this study are included in the article. Further inquiries can be directed to the corresponding author.

Conflicts of Interest

Authors Feng He, Yongqing Xu, Shengliang Hu, Maowen Li were employed by the company Nanchang Urban Planning & Design Institute Group Co., Ltd. The remaining authors declare that the research was conducted in the absence of any commercial or financial relationships that could be construed as a potential conflict of interest.

Abbreviations

The following abbreviations are used in this manuscript:
DEMDiscrete element method
RMRandom particle deletion
CFDeletion by contact force magnitude
CNDeletion by coordination number
PSDParticle size distribution
PDFProbability distribution functions
D15Particle size below which 15% of the coarse/skeleton fraction lies by mass
d85Particle size below which 85% of the fine fraction lies by mass
FlLinear force
FdDamping force
MTRolling resistance moment
θbRelative bending-rotation increment
krRolling resistance stiffness
R ¯ 2 Effective contact radius
μrCoefficient of rolling friction
EkrRolling strain energy
EurRolling slip energy
(MT)0Rolling resistance moment at the initial time step
θbkElastic increment
θbμrSlip increment
E50Secant modulus
ηRatio of contact force to average contact force
ZAverage coordination number of particles
NcTotal number of contacts in the sample
NpTotal number of particles in the sample
ecCritical state porosity
eτCritical state porosity corresponding to p′ = 0
λcSlope of the critical state line
pAverage effective stress
paA standard atmospheric pressure
ξMaterial parameter
R2Coefficient of determination

References

  1. Muir Wood, D. The magic of sands—The 20th Bjerrum Lecture presented in Oslo, 25 November 2005. Can. Geotech. J. 2007, 44, 1329–1350. [Google Scholar] [CrossRef]
  2. Liu, Y.J.; Yang, J.; Yin, Z.Y. Numerical analysis of the impact of internal erosion on underground structures: Application to tunnel leakage. Rock Soil Mech. 2022, 43, 8. [Google Scholar] [CrossRef]
  3. Hu, W.; Hicher, P.Y.; Scaringi, G.; Xu, Q.; Van Asch, T.W.J.; Wang, G. Seismic precursor to instability induced by internal erosion in loose granular slopes. Geotechnique 2018, 68, 989–1001. [Google Scholar] [CrossRef]
  4. Qin, T.X.; Song, Z.; Wang, C.; Liang, F.Y. Two-point MPM study of fluidized grains in internal erosion around metro tunnel characterized by an erosion law. Comput. Geotech. 2025, 183, 107227. [Google Scholar] [CrossRef]
  5. Kenney, T.C.; Lau, D. Internal stability of granular filters. Can. Geotech. J. 1985, 22, 215–225. [Google Scholar] [CrossRef]
  6. Chang, D.S.; Zhang, L.M. Critical Hydraulic Gradients of Internal Erosion under Complex Stress States. J. Geotech. Geoenviron. Eng. 2013, 139, 1454–1467. [Google Scholar] [CrossRef]
  7. Chang, D.S.; Zhang, L.M. Extended internal stability criteria for soils under seepage. Soils Found. 2013, 53, 569–583. [Google Scholar] [CrossRef]
  8. Sterpi, D. Effects of the erosion and transport of fine particles due to seepage flow. Int. J. Geomech. 2003, 3, 111–122. [Google Scholar] [CrossRef]
  9. Zhang, S.; Li, Z.Q.; Tong, C.X.; Chen, C.; Chen, G.J.; Sheng, D.C. Suffusion of gravel-sand mixtures under cyclic hydraulic gradient with emphasis on tracking the migration of fine particles. Géotechnique, 2025; accepted. [Google Scholar]
  10. Dickinson, S.; Brachman, R.W.I. Permeability and internal erosion of a GCL beneath coarse gravel. Geosynth. Int. 2010, 17, 112–123. [Google Scholar] [CrossRef]
  11. Hicher, P.Y. Modelling the impact of particle removal on granular material behaviour. Geotechnique 2013, 63, 118–128. [Google Scholar] [CrossRef]
  12. Dai, S.H.; He, X.Z.; Tong, C.X.; Gao, F.; Zhang, S.; Sheng, D.C. Stability of sandy soils against internal erosion under cyclic loading and quantitatively examination of the composition and origin of eroded particles. Can. Geotech. J. 2024, 61, 732–747. [Google Scholar] [CrossRef]
  13. Sufian, A.; Bittner, T.; Bore, T.; Bajodek, M.; Scheuermann, A. Physical observations of the transient evolution of the porosity distribution during internal erosion using spatial time domain reflectometry. Can. Geotech. J. 2022, 59, 1443–1458. [Google Scholar] [CrossRef]
  14. Bi, J.F.; Zhang, H.T.; Luo, X.Q.; Shen, H.; Li, Z.M. Modeling of internal erosion using particle size as an extra dimension. Comput. Geotech. 2021, 133, 104021. [Google Scholar] [CrossRef]
  15. Yang, J.; Yin, Z.Y.; Laouafa, F.; Hicher, P.Y. Hydromechanical modeling of granular soils considering internal erosion. Can. Geotech. J. 2020, 57, 157–172. [Google Scholar] [CrossRef]
  16. Ke, L.; Takahashi, A. Strength reduction of cohesionless soil due to internal erosion induced by one-dimensional upward seepage flow. Soils Found. 2012, 52, 698–711. [Google Scholar] [CrossRef]
  17. Ouyang, M.; Takahashi, A. Influence of initial fines content on fabric of soils subjected to internal erosion. Can. Geotech. J. 2016, 53, 299–313. [Google Scholar] [CrossRef]
  18. Chen, C.; Zhang, L.M.; Chang, D.S. Stress-Strain Behavior of Granular Soils Subjected to Internal Erosion. J. Geotech. Geoenviron. Eng. 2016, 142, 06016014. [Google Scholar] [CrossRef]
  19. Yang, Y.; Jiang, J.G.; Mao, W.W.; Xu, C. Investigation on the mechanical consequence of different internal erosion scenarios in gap-graded sandy soils. J. Eng. Geol. 2021, 29, 67–73. [Google Scholar] [CrossRef]
  20. Shi, X.S.; He, Z.H.; Zhao, J.D.; Liu, J.Y. Determination of the size of representative volume element for gap-graded granular materials. Powder Technol. 2024, 437, 119578. [Google Scholar] [CrossRef]
  21. Shi, X.S.; Nie, J.Y.; Zhao, J.D.; Gao, Y.F. A homogenization equation for the small strain stiffness of gap-graded granular materials. Comput. Geotech. 2020, 121, 103440. [Google Scholar] [CrossRef]
  22. Xiong, H.; Qiu, Y.Y.; Liu, J.Y.; Yin, Z.Y.; Chen, X.S. Macro-microscopic mechanism of suffusion in calcareous sand under tidal fluctuations by coupled CFD-DEM. Comput. Geotech. 2023, 162, 105676. [Google Scholar] [CrossRef]
  23. Zhang, F.S.; Wang, T.; Liu, F.; Peng, M.; Furtney, J.; Zhang, L.M. Modeling of fluid-particle interaction by coupling the discrete element method with a dynamic fluid mesh: Implications to suffusion in gap-graded soils. Comput. Geotech. 2020, 124, 103617. [Google Scholar] [CrossRef]
  24. Wang, T.; Chen, S.H.; Li, M.L.; An, M.K. A resolved CFD-DEM investigation of near-wellbore fine sand migration and production during methane hydrate extraction. Geomech. Energy Environ. 2024, 38, 100561. [Google Scholar] [CrossRef]
  25. Scholtès, L.; Hicher, P.Y.; Sibille, L. Multiscale approaches to describe mechanical responses induced by particle removal in granular materials. C. R. Mec. 2010, 338, 627–638. [Google Scholar] [CrossRef]
  26. Muir Wood, D.; Maeda, K.; Nukudani, E. Modelling mechanical consequences of erosion. Géotechnique 2010, 60, 447–457. [Google Scholar] [CrossRef]
  27. Zhang, F.S.; Li, M.L.; Peng, M.; Chen, C.; Zhang, L.M. Three-dimensional DEM modeling of the stress-strain behavior for the gap-graded soils subjected to internal erosion. Acta Geotech. 2019, 14, 487–503. [Google Scholar] [CrossRef]
  28. Taha, H.; Nguyen, N.S.; Marot, D.; Hijazi, A.; Abou-Saleh, K. A DEM study of the effect of the loss of fine particles on the mechanical behavior of gap-graded soils. Geomech. Energy Environ. 2022, 31, 100305. [Google Scholar] [CrossRef]
  29. Kézdi, Á. Soil Physics: Selected Topics; Elsevier: Amsterdam, The Netherlands, 2013; Volume 25. [Google Scholar]
  30. Itasca Consulting Group. PFC3D Documentation: Particle Flow Code, Ver. 6.0 Minneapolis, USA. Available online: https://docs.itascacg.com/pfc600/contents.html (accessed on 20 June 2025).
  31. Li, M.-W.; Hu, S.-L.; Tong, C.-X. Numerical Simulation of Mechanical Properties of Soil Considering the Effect of Internal Erosion. Mathematics 2023, 11, 2959. [Google Scholar] [CrossRef]
  32. Wan, S.F.; Pan, H.; Luo, G.Y.; Peng, S.G. Experimental study on the impact of water flow velocity on internal erosion of granite residual soil. Sci. Rep. 2025, 15, 28469. [Google Scholar] [CrossRef]
  33. Robbins, B.A.; Griffiths, D. Internal erosion of embankments: A review and appraisal. In Proceedings of the Rocky Mountain Geo-Conference 2018, Reston, VA, USA, 2 November 2018; pp. 61–75. [Google Scholar]
  34. Shire, T.; O’Sullivan, C.; Hanley, K.J. The influence of fines content and size-ratio on the micro-scale properties of dense bimodal materials. Granul. Matter 2016, 18, 52. [Google Scholar] [CrossRef]
  35. Tosun, H. Dynamic stability of large embankment dams and a case study. In Proceedings of the 6rd International Conference on Civil Structural and Transportation Engineering (ICCSTE21), Virtual Conference, Niagara Falls, ON, Canada, 17–19 May 2021; pp. 17–19. [Google Scholar]
  36. Mueth, D.M.; Jaeger, H.M.; Nagel, S.R. Force distribution in a granular medium. Phys. Rev. E 1998, 57, 3164. [Google Scholar] [CrossRef]
  37. Haq, S.; Indraratna, B.; Nguyen, T.T.; Rujikiatkamjorn, C. Micromechanical Analysis of Internal Instability during Shearing. Int. J. Geomech. 2023, 23, 04023078. [Google Scholar] [CrossRef]
  38. Roscoe, K.H.; Schofield, A.N.; Wroth, C.P. On the yielding of soils. Geotechnique 1958, 8, 22–53. [Google Scholar] [CrossRef]
  39. Tong, C.X.; Zhai, M.Y.; Li, H.C.; Zhang, S.; Sheng, D.C. Particle breakage of granular soils: Changing critical state line and constitutive modelling. Acta Geotech. 2022, 17, 755–768. [Google Scholar] [CrossRef]
  40. Li, X.S.; Wang, Y. Linear representation of steady-state line for sand. J. Geotech. Geoenviron. Eng. 1998, 124, 1215–1217. [Google Scholar] [CrossRef]
  41. Bandini, V.; Coop, M.R. The Influence of Particle Breakage on the Location of the Critical State Line of Sands. Soils Found. 2011, 51, 591–600. [Google Scholar] [CrossRef]
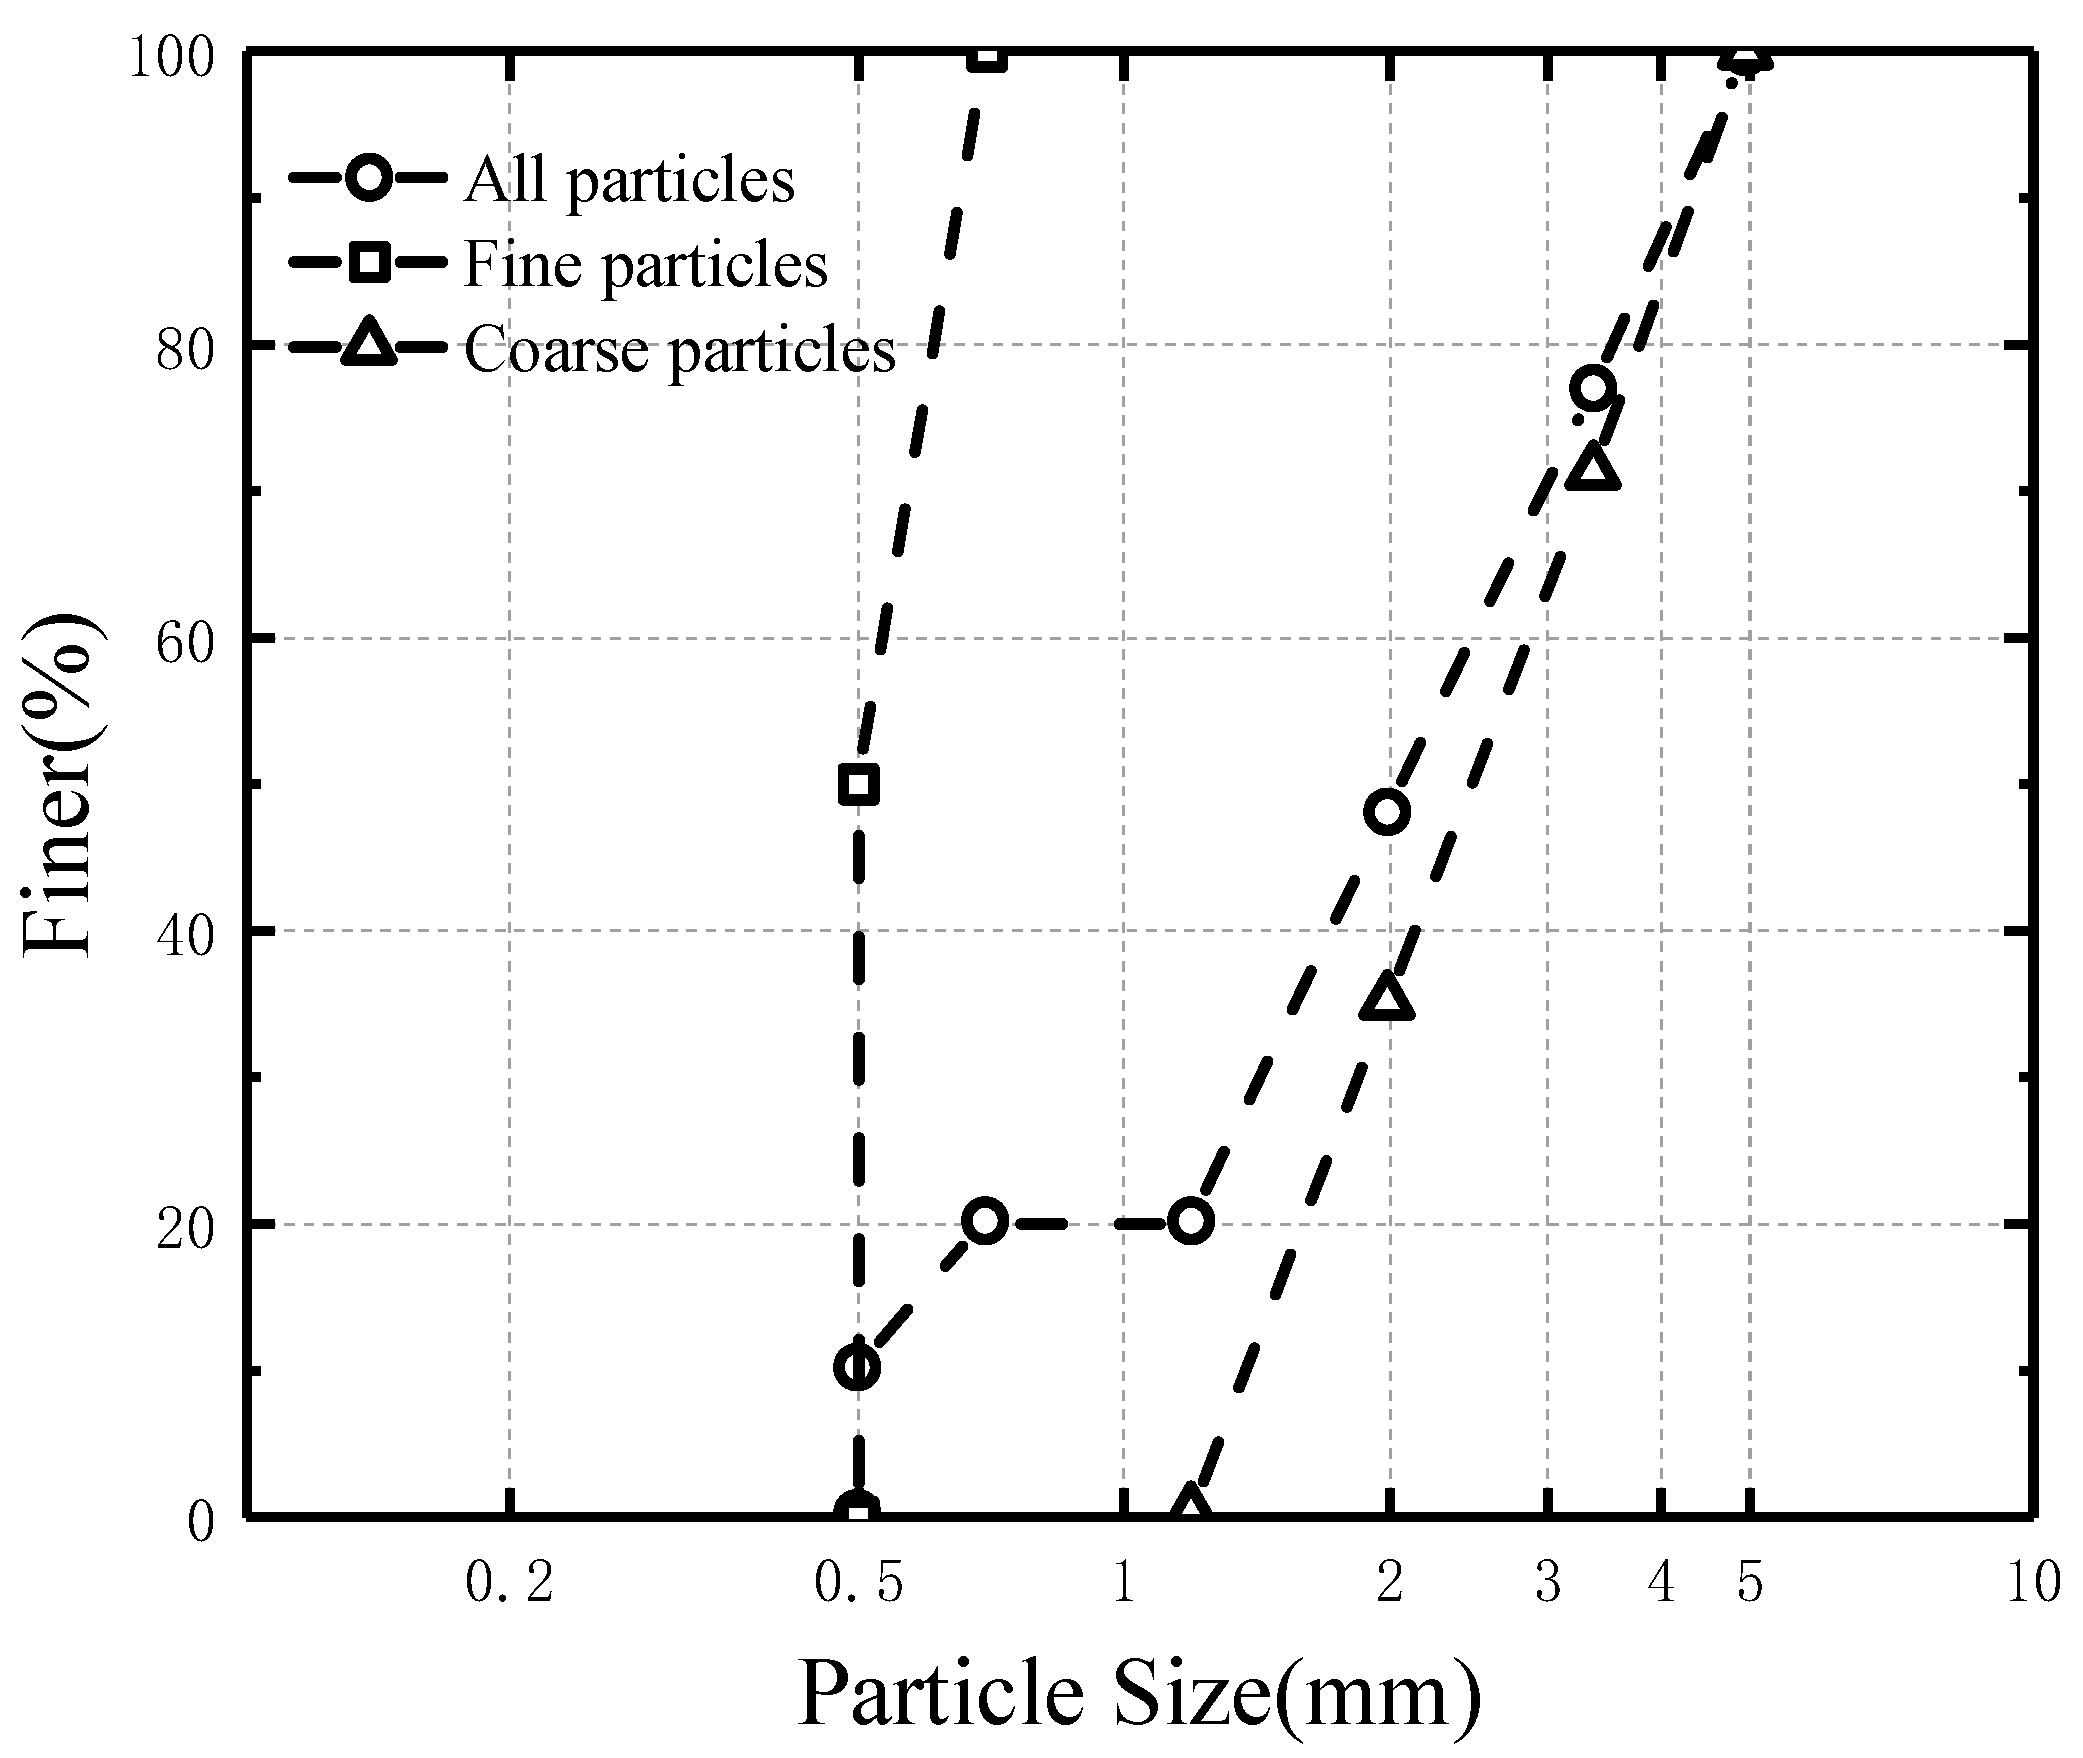
Figure 1. PSD curve of the tested sample before internal erosion.
Coatings 15 01218 g001
Figure 2. (a) Initial numerical model of soil sample; (b) specimen boundary constraints.
Coatings 15 01218 g002
Figure 3. Schematic diagram of rolling resistance linear model [31].
Coatings 15 01218 g003
Figure 4. Schematic of the three particle-deletion methods (Blue dashed circles indicate particles that have been removed; red lines denote the force chain network; green lines denote force chains whose magnitudes are below the mean contact force).
Coatings 15 01218 g004
Figure 5. Comparison of PSD curves between numerical model and experimental sample [18].
Coatings 15 01218 g005
Figure 6. Comparison of numerical and experimental results [18]: (a) deviatory stress and axial strain; (b) deviatory stress and volume strain.
Coatings 15 01218 g006
Figure 7. Schematic of servo control and loading for the model.
Coatings 15 01218 g007
Figure 8. Evolution of PSD of the sample with 8% degree of erosion: (a) under a confining pressure of 400 kPa; (b) under a confining pressure of 800 kPa.
Coatings 15 01218 g008
Figure 9. Void ratio of samples: (a) before shear loading; (b) after shear loading.
Coatings 15 01218 g009
Figure 10. Deviatoric stress-volumetric strain–axial strain of samples prepared by CF approach under confining pressure of (a) 100 kPa and (b) 800 kPa.
Coatings 15 01218 g010
Figure 11. Deviatoric stress-volumetric strain–axial strain of eroded samples with different degrees of internal erosion; (a) 4% and (b) 10%.
Coatings 15 01218 g011
Figure 12. Relations between the secant modulus E50, degree of internal erosion, and effective confining pressure.
Coatings 15 01218 g012
Figure 13. (a) Distribution of contact number; (b) distribution of average normal contact force; (c) distribution of average tangential contact force under different degrees of internal erosion.
Coatings 15 01218 g013
Figure 14. Evolution of contact force chain within the central spherical area with different degrees of internal erosion levels.
Coatings 15 01218 g014
Figure 15. (a) Distribution of contact numbers; (b) distribution of average normal contact forces; (c) distribution of average tangential contact forces eroded samples prepared with different approaches.
Coatings 15 01218 g015
Figure 16. Comparison of probability distribution functions of contact forces of eroded samples (a) with different degrees of internal erosion (CF under 400 kPa confining pressure); (b) prepared by different approaches (10% erosion degree and 400 kPa confining pressure); (c) power law fitted PDF curves at different erosion degrees; (d) power law fitted PDF curves for different fines deletion methods.
Coatings 15 01218 g016aCoatings 15 01218 g016b
Figure 17. Evolution of average coordination number of eroded samples (a) before shearing; (b) after shearing.
Coatings 15 01218 g017
Figure 18. Evolution of CSL for the eroded samples prepared by different approaches: (a) RM approach, (b) CF approach, (c) CN approach, (d) CSLs in the p′-q space.
Coatings 15 01218 g018
Figure 19. Comparison of critical state line parameters for models under different simulation modes.
Coatings 15 01218 g019
Table 1. Microscopic parameters of rolling resistance linear model.
Model ParametersValue
Particle density (kg/m3)2650
Normal stiffness of coarse particles (N/m)4.5 × 105
Normal stiffness of fine particles (N/m)1.2 × 105
Normal-to-shear stiffness ratio2.0
Particle damping coefficient0.7
Particle friction coefficient0.2
Normal stiffness of wall (N/m)1 × 106
Rolling friction coefficient0.1
Table 2. Scheme of CD test in the DEM simulations.
Particle-Deletion MethodVolume Fraction of Erosion (%)Effective Confining Pressure σc (kPa)
No deletion0100, 200, 400, 800
RM2, 4, 6, 8, 10100, 200, 400, 800
CF2, 4, 6, 8, 10100, 200, 400, 800
CN2, 4, 6, 8, 10100, 200, 400, 800
Table 3. Power law fit results of PDF for x > 1 at different erosion degrees.
Functiony = axb
Erosion Degree0%2%4%6%8%10%
Parameters
a0.308620.305090.297880.280050.268150.25258
b−2.00051−2.03013−1.97658−1.93415−1.87352−1.75223
R20.993770.994750.995060.993310.992710.99346
Table 4. Power law fit results of PDF for x > 1 across fines deletion methods.
Functiony = axb
Fines Deletion MethodsRMCFCN
Parameters
a0.266590.252410.23457
b−1.73793−1.74604−1.78004
R20.992240.993480.99172
Table 5. Comparison of critical state line parameters for test sample models.
ParametersSimulation Mode0%2%4%6%8%10%
eτRM0.455290.468650.479840.503410.525080.54564
CF0.455290.474590.496590.511350.530030.54992
CN0.455290.474870.495740.516430.526170.53944
λcRM0.058410.062880.066520.073080.07840.08455
CF0.058410.06380.069090.073890.07920.08499
CN0.058410.063870.068940.075110.077140.07972
R2RM0.988120.985880.9850.979890.98230.98284
CF0.988120.988250.987920.985180.980570.97759
CN0.988120.988790.985860.983510.976310.96797
Disclaimer/Publisher’s Note: The statements, opinions and data contained in all publications are solely those of the individual author(s) and contributor(s) and not of MDPI and/or the editor(s). MDPI and/or the editor(s) disclaim responsibility for any injury to people or property resulting from any ideas, methods, instructions or products referred to in the content.