Article

Active Surfaces in Sensor Technologies Utilizing Ceramic Nanotube-Conducting Polymer Composites Containing Embedded Gold Nanoparticles

by
Alexandru Florentin Trandabat
1,
Romeo Cristian Ciobanu
1,* and
Oliver Daniel Schreiner
1,2
1
Department of Electrical Measurements and Materials, Gheorghe Asachi Technical University, 700050 Iasi, Romania
2
Department of Medical Specialties III, Faculty of Medicine, University of Medicine and Pharmacy “Grigore T. Popa”, 700115 Iasi, Romania
*
Author to whom correspondence should be addressed.
Coatings 2025, 15(10), 1211; https://doi.org/10.3390/coatings15101211
Submission received: 9 September 2025 / Revised: 2 October 2025 / Accepted: 3 October 2025 / Published: 14 October 2025
(This article belongs to the Special Issue Advances in Nanostructured Thin Films and Coatings, 3rd Edition)

Abstract

This study describes the approach to develop hybrid nanostructures made of four varieties of ceramic nanotubes and three types of conductive polymers embedded with gold nanoparticles through a novel technique, which can exhibit distinct sensory properties not documented in the existing literature. Atomic force microscopy (AFM) analysis highlighted the characteristics of their surface roughness, identifying which could be the best choice for electrochemical electrodes depending on their surface structure. The incorporation of gold nanoparticles modifies the surface structure and forces the original grains to create voids that allow the gold particles to penetrate deeper and gather in small clusters, which in turn leads to a minor increase in grain size and localized sharpening of the peaks. The analysis mainly identified the peaks that were higher in relation to the valleys to identify a Gaussian distribution. It turned out that the configuration of ZnO nanotubes in the composites leads to the highest Ra values, with Al2O3 nanotubes coming in second place. Regarding the contribution of conducting polymers, PANI:EB presented the highest importance for all composites, while P3HT was relevant in several other cases. The evaluation of the electrode roughness, as described in this paper, is essential for the evaluation of its potential electrochemical activity and acts as a reliable measure that goes beyond the role of the evaluation of the active surface area (EASA). In our opinion, the evaluation of the EASA by traditional approaches described in the literature is not relevant for sensor applications, since the evaluation of the electrode surface structure must be performed before electrochemical tests, because the general electrochemical tests designed for sensor applications do not evaluate the EASA. Consequently, a thorough assessment of the electrode surface structure is advised, choosing the optimal electrodes according to this design, and additional data obtained from cyclic voltammetry will finally ascertain the true EASA and the actual performance of the respective electrode for identifying the target molecules.

1. Introduction

Electrochemical analysis offers numerous benefits, including high sensitivity, selectivity, simplicity, lower cost compared to alternative methods, and rapid analysis [1]. The binding interaction occurs between the target molecule and the active site. As a prerequisite, a larger surface area and surface texture are essential for optimal adhesion of the molecules of interest. The electrical signal generated originates from either the generation or consumption of electroactive species in stoichiometric amounts. However, the use of bare electrodes presents several disadvantages, including electrode fouling and inadequate electron transfer. The intercalation of physical modifiers plays a crucial role in addressing the problems associated with the use of bare electrodes. Nanomaterials are often used as modifiers that lower the potential required for electron propagation, thereby enhancing the selectivity and sensitivity of an electrode. Numerous studies have investigated the application of nanomaterials to achieve higher sensitivity, including hybridization of transition metals [2,3], metal oxides [4,5], carbon nanomaterials [6,7,8], nanowires [9,10], metallic nanomaterials [11,12,13,14], and various hybrid nanostructures, among others [15,16,17,18,19]. Typically, it has been shown that higher surface roughness improves the adsorption of target molecules onto the sensing surface by providing more active sites, leading to significant interaction between the adsorbed molecules and the sensing material [20,21,22,23,24,25]. Conversely, it has been shown that a higher degree of electrode roughness positively influences the shapes of cyclic voltammograms, and the corresponding peak currents are at significantly higher levels [26].
The effect of higher roughness on sensor performance impacts reaction kinetics, which are improved, charge transfer rates, by modifying ion/electron motion, and generally, sites for reactant adsorption, by providing additional sites. The main focus has been on the development of optical sensors, as shown in [27,28,29,30,31], but in recent years, there has been an increased interest in custom-designed electrodes with specific architectures for electrochemical applications, including sensors, as well [32,33,34,35,36]. The texture and irregularities present on the surface of an electrode, known as roughness, can significantly influence its electrochemical properties, including charge transfer and capacitance. In the last 15 years, numerous studies have focused on the synthesis of ceramic nanotubes using different technologies [37,38,39,40,41,42]. While many authors have focused on the surface characteristics of hybrid structures involving carbon nanotubes or graphene, especially those incorporating conducting polymers for sensing applications, none have investigated the properties of composites comparable to ceramic nanotubes, despite their potential for various types of electrochemical sensors. However, the clear advantages that such hybrid structures offer in terms of compactness, precision, and improved detection sensitivity should inspire researchers to continuously improve current ceramic nanotube-based composite technologies, primarily in terms of improving their electrochemical active surface area (EASA) [43,44], by tailoring the electrode surface structure.
The innovation of this work mainly concerns the development of hybrid nanostructures made of ceramic nanotubes and conductive polymers containing embedded gold nanoparticles, which could exhibit unique sensing capabilities not recorded in the current literature. The surface structure of ceramic nanotube-based electrodes is an important aspect that may have an impact on future advances in electrochemical sensor applications. This work presents hybrid structures of four types of ceramic nanotubes associated with three types of conductive polymers, with the aim of evaluating their physical characteristics and surface roughness properties and, finally, determining which of them could be the optimal selection for electrochemical electrodes based on their surface architecture.

2. Materials, Technology, and Characterization Methods

2.1. Sample Preparation

Based on the technological steps detailed in [38,42,45,46,47], the method for fabricating ceramic nanotubes consisted of three phases: forming polymer fiber networks with poly(methyl methacrylate), applying ceramic coatings to the nanofiber networks by magnetron sputtering, and heating the nanotubes to 600 °C for complete removal of the polymer support, [38,42,46,47]. Figure 1 shows the images of TiO2, Al2O3, Y2O3, and ZnO ceramic nanotubes, respectively, emphasizing the uniformity of the ceramic nanotube structures, which are hollow inside.
The subsequent method of obtaining hybrid nanostructures from ceramic nanotubes and conducting polymers, including emeraldine-based polyaniline (PANI:EB), poly(3, 4-ethylenedioxy-thiophene)-polystyrene sulfonate (PEDOT:PSS), and poly(3-hexylthiophene) (P3HT), involved drop-casting. Five specimens from each category were prepared to evaluate the technological feasibility. The technological procedure used the solutions detailed in [46,47]. In each case, 240 μL of each polymer solution was deposited onto ceramic nanotubes (SiO2/Si substrate) using Pasteur pipettes. Each solvent was evaporated for 60 min under vacuum conditions, using a Pfeiffer vacuum pump connected to a desiccator [42]. Figure 2, Figure 3, Figure 4 and Figure 5 show the deposition process of PANI:EB, PEDOT:PSS, and P3HT on TiO2, Al2O3, Y2O3, and ZnO nanotubes, respectively. A different adhesion of the polymers to the nanotubes can be briefly observed. As for the nanotubes, Al2O3 and Y2O3 are applied over a large surface. As for the polymers, it happens that PEDOT:PSS covers the nanotube network with a thicker film; for Al2O3, Y2O3, and ZnO, the ceramic nanotubes are completely covered, which raises questions about their influence on the new hybrid structure in terms of surface parameters.
However, these initial findings may change significantly upon deposition of gold nanoparticles. A more comprehensive examination of the gold nanotube composites will discuss X-ray photoelectron spectroscopy (XPS), energy-dispersive X-ray spectroscopy (EDS), and scanning electron microscopy (SEM) analysis later, which could clarify the structure of these materials. The conductive polymer composites with ceramic nanotubes were further immersed in a dilute HAuCl4/2-propanol solution (0.001 M) by dip-coating and allowed to stand for 24 h. After impregnation, the samples were dried in an oven at 150 °C with an Ar flow (100 sccm) for 30 min. The samples were then cooled to room temperature in an argon flow. Au nanoparticles with an average size of 100 nm were quasi-uniformly integrated into the hybrid structures. This approach to obtain specific Au nanoparticles from a highly dilute 132 HAuCl4 solution on the polymer substrate, heated from room temperature to just over one hundred degrees Celsius, is similar to those presented in [48,49]. However, the approach described in this paper involves immersing the polymer film in a significantly dilute 135 HAuCl4 solution, which helps in the generation and almost uniform spreading of gold nanoparticles over larger regions, an essential factor for the development of more sensitive electrochemical sensors.

2.2. Characterization Equipment

X-ray photoelectron spectroscopy (XPS) and energy-dispersive X-ray spectroscopy (EDS) were performed with an AXIS Supra+ unit (Kratos Analytical Ltd., Manchester, UK). Measurement conditions: anode Al (1486.74 eV), U = 15.kV, I = 15 mA, P = 225 W, p SAC 5 X 10⁻⁹ mbar, parameter spectrum recording line extended spectrum E start (eV) 1200, Estop (eV) −5, step (eV) 0.1, pass energy (eV) 140, number of passes 1.
Scanning electron microscopy (SEM) provides insights into the surface structure and was conducted using Lyra III XMU equipment from TESCAN GROUP a.s., located in Brno-Kohoutovice, Czech Republic.
Atomic force microscopy (AFM) delivers high-resolution visuals to measure surface roughness at the nanoscale. AFM was performed with a Dimension Edge device from Bruker (Billerica, MA, USA) for optical applications. The roughness evaluation was performed with the following derived parameters: Ra = Roughness Average; Rsk = Skewness; RMS = Root Mean Square Roughness; Rku = Kurtosis. Average roughness values are given for four scanned areas on each sample type. The evaluation of the surface roughness parameters was conducted in accordance with ISO 21920-2:2021 [45,50].

3. Results and Discussion

3.1. XPS and EDS Analysis

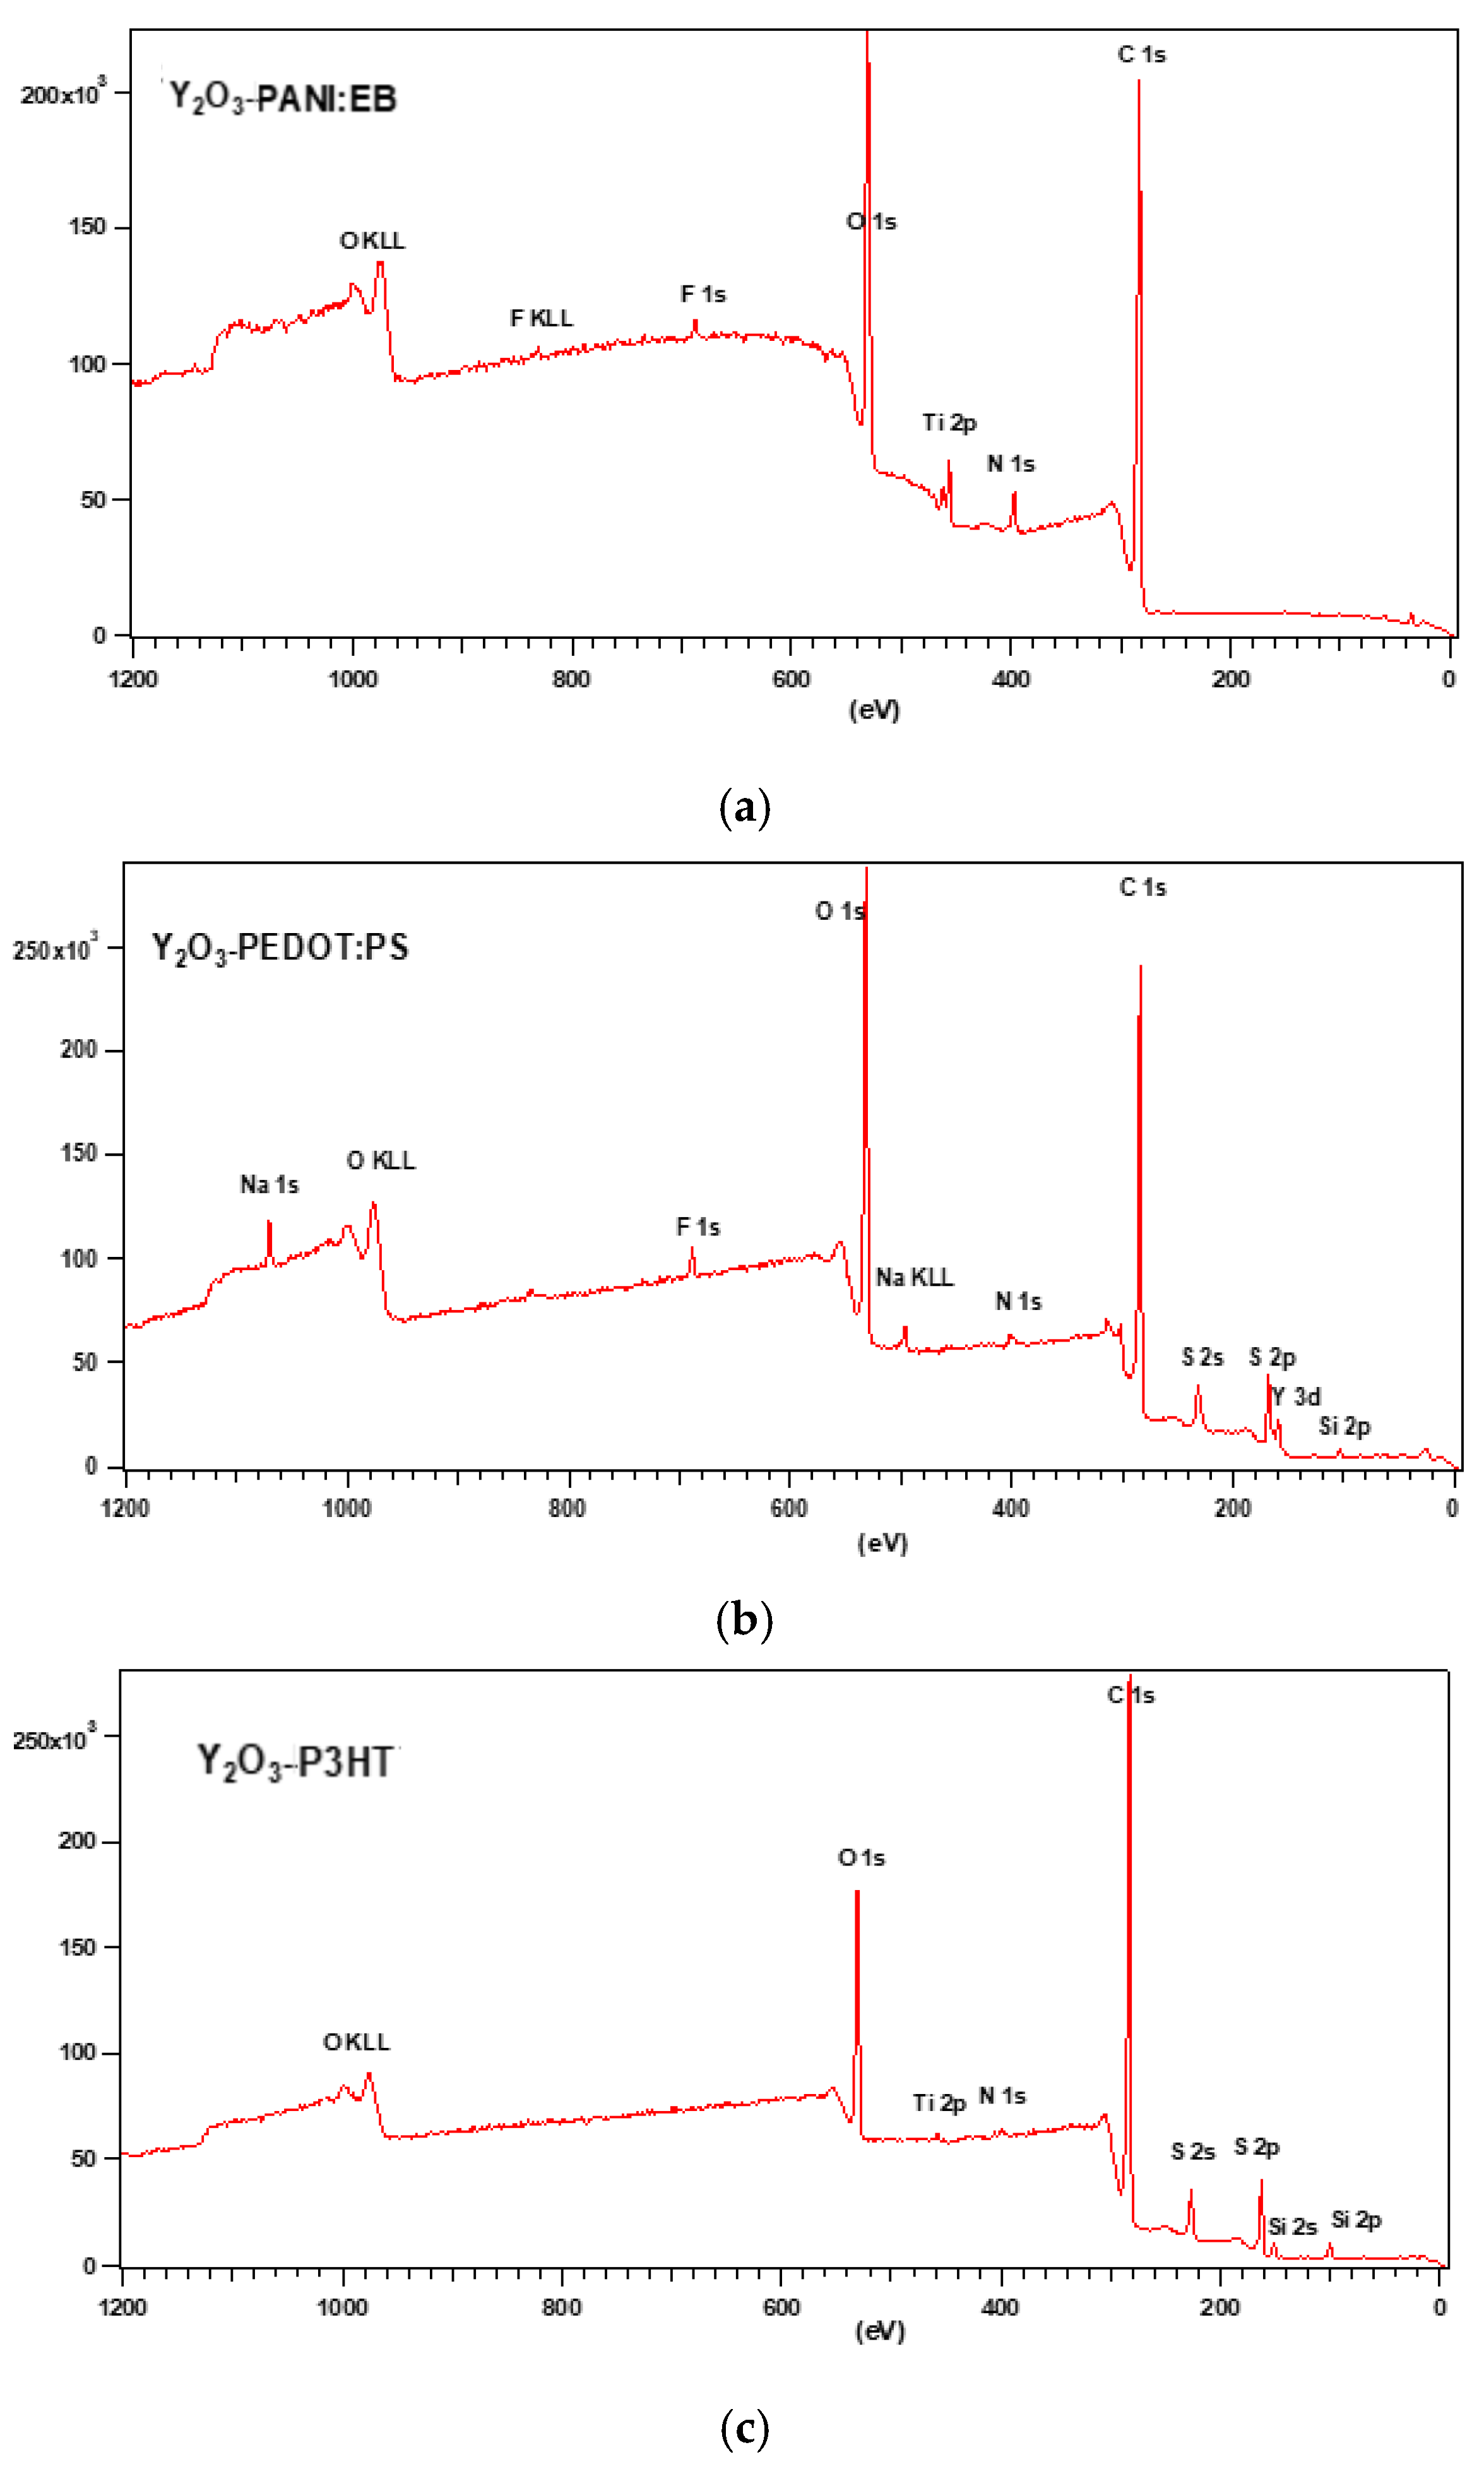
The novel XPS analysis of Y2O3–nanotube composites is presented in Figure 6, and the rest of the XPS analyses for the other nanotube composites, are included as Supplementary Materials Figures S1–S3 [46,47].
In all these figures that highlight the samples of ceramic nanotube-P3HT, the elements recognized on the basis of the general spectrum include oxygen, carbon, sulfur, and silicon, as well as the metal that produces the specific oxide of the corresponding nanotubes. Regarding all figures that highlight the ceramic nanotube-PANI:EB, elements recognized on the basis of the general spectrum include sodium, oxygen, nitrogen, carbon, and sulfur, as well as the metal that produces the specific oxide of the corresponding nanotubes. In figures that highlight the samples of ceramic nanotube-PEDOT:PSS, the elements recognized on the general spectrum include sodium, oxygen, nitrogen, carbon, and sulfur, as well as the metal responsible for the specific oxide of the corresponding nanotubes. X-ray analysis with energy dispersion was performed to evaluate the amount of gold. Identifying the differences between the intensities of the golden peaks in the images has proven to be quite difficult, because the amount of gold is very low compared to the ceramic nanotube-conductive polymers, and there are few variations in the gold atomic percentage, which makes the images inconclusive. On the other hand, due to the low EDS signal of tiny nanoparticles, the time of detection for these particles has become longer, and other elements, such as Cu, Fe, and Co (probably related to sample supports, etc.), appeared in images, diminishing the quality of the golden peaks.
However, the EDS analysis, being a semi-quantitative technique, has satisfactorily validated the inclusion of gold nanoparticles in hybrid structures. Table 1 illustrates the weight percentage of gold nanoparticles in hybrid samples, but the accuracy of these data is limited under the previously mentioned experimental conditions. Because the metals responsible for the specific oxides of the respective nanotubes have different atomic masses, a direct comparison for all the hybrid structures collectively is not feasible. Conversely, a clear comparison can be made for hybrid structures containing the same nanotube in terms of polymer activity. A clearer understanding of the effect of Au nanoparticles upon hybrid structures can be related to SEM analysis. No special chemical interaction between ceramic nanotubes and conductive polymers was observed, nor between gold nanoparticles and polymers. The XPS/EDS analysis indicates that the attachment of the gold nanoparticles to the ceramic nanotubes and conductive polymers is a primary physical interface interaction, in accordance with the comparable results reported in [51,52].
An analysis of the data in Table 1 must be made in relation with each ceramic nanotube type, one the one hand, and related to the influence of the conducting polymer used, on the other hand. The highest values of the weight percentage of gold nanoparticles in the hybrid structures were found for ZnO/PEDOT:PSS+Au (1.85%), Al2O3/PEDOT:PSS+Au (1.78%), and, respectively, TiO2/PANI:EB+Au and ZnO/P3HT+Au (both with 1.66%). Even if the lowest values of weight percentage of gold nanoparticles were found for Y2O3 nanotubes in all their configurations, we need to note that a direct comparison cannot be made because the atomic mass of Y is much larger comparing to, e.g., Al, or Ti. For this reason, a more reliable comparison might be made between, e.g., Zn and Y nanotubes with different conducting polymers, due to closer atomic mass values. In this peculiar case, it is clear that ZnO nanotubes may offer a better affinity compared to Y2O3 nanotubes. As regards the influence of the conducting polymers, PEDOT:PSS and P3HT seem to positively influence the gold affinity to the hybrid structures in most of the cases.

3.2. SEM Analysis

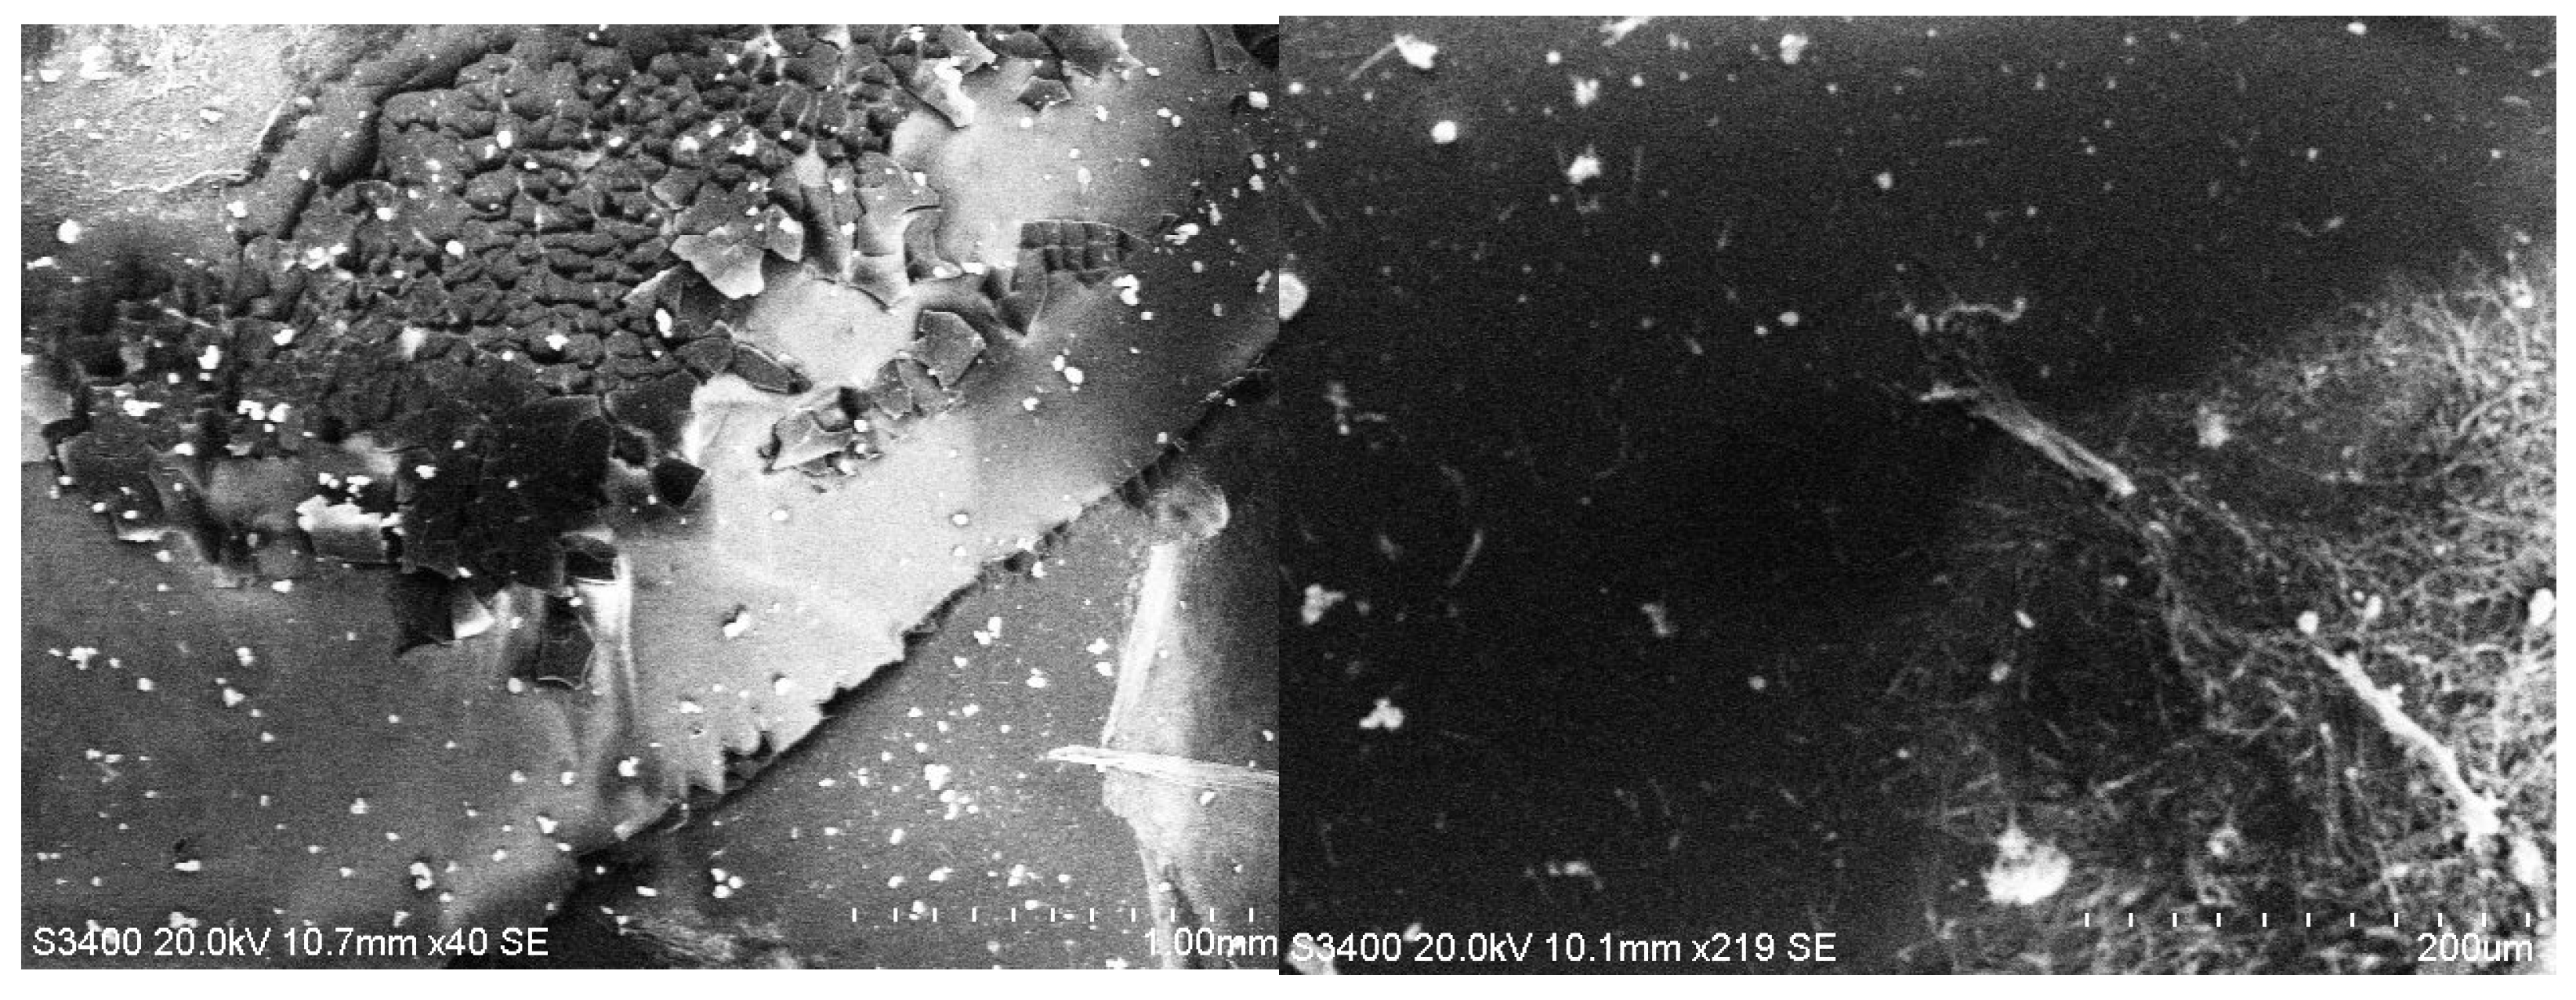
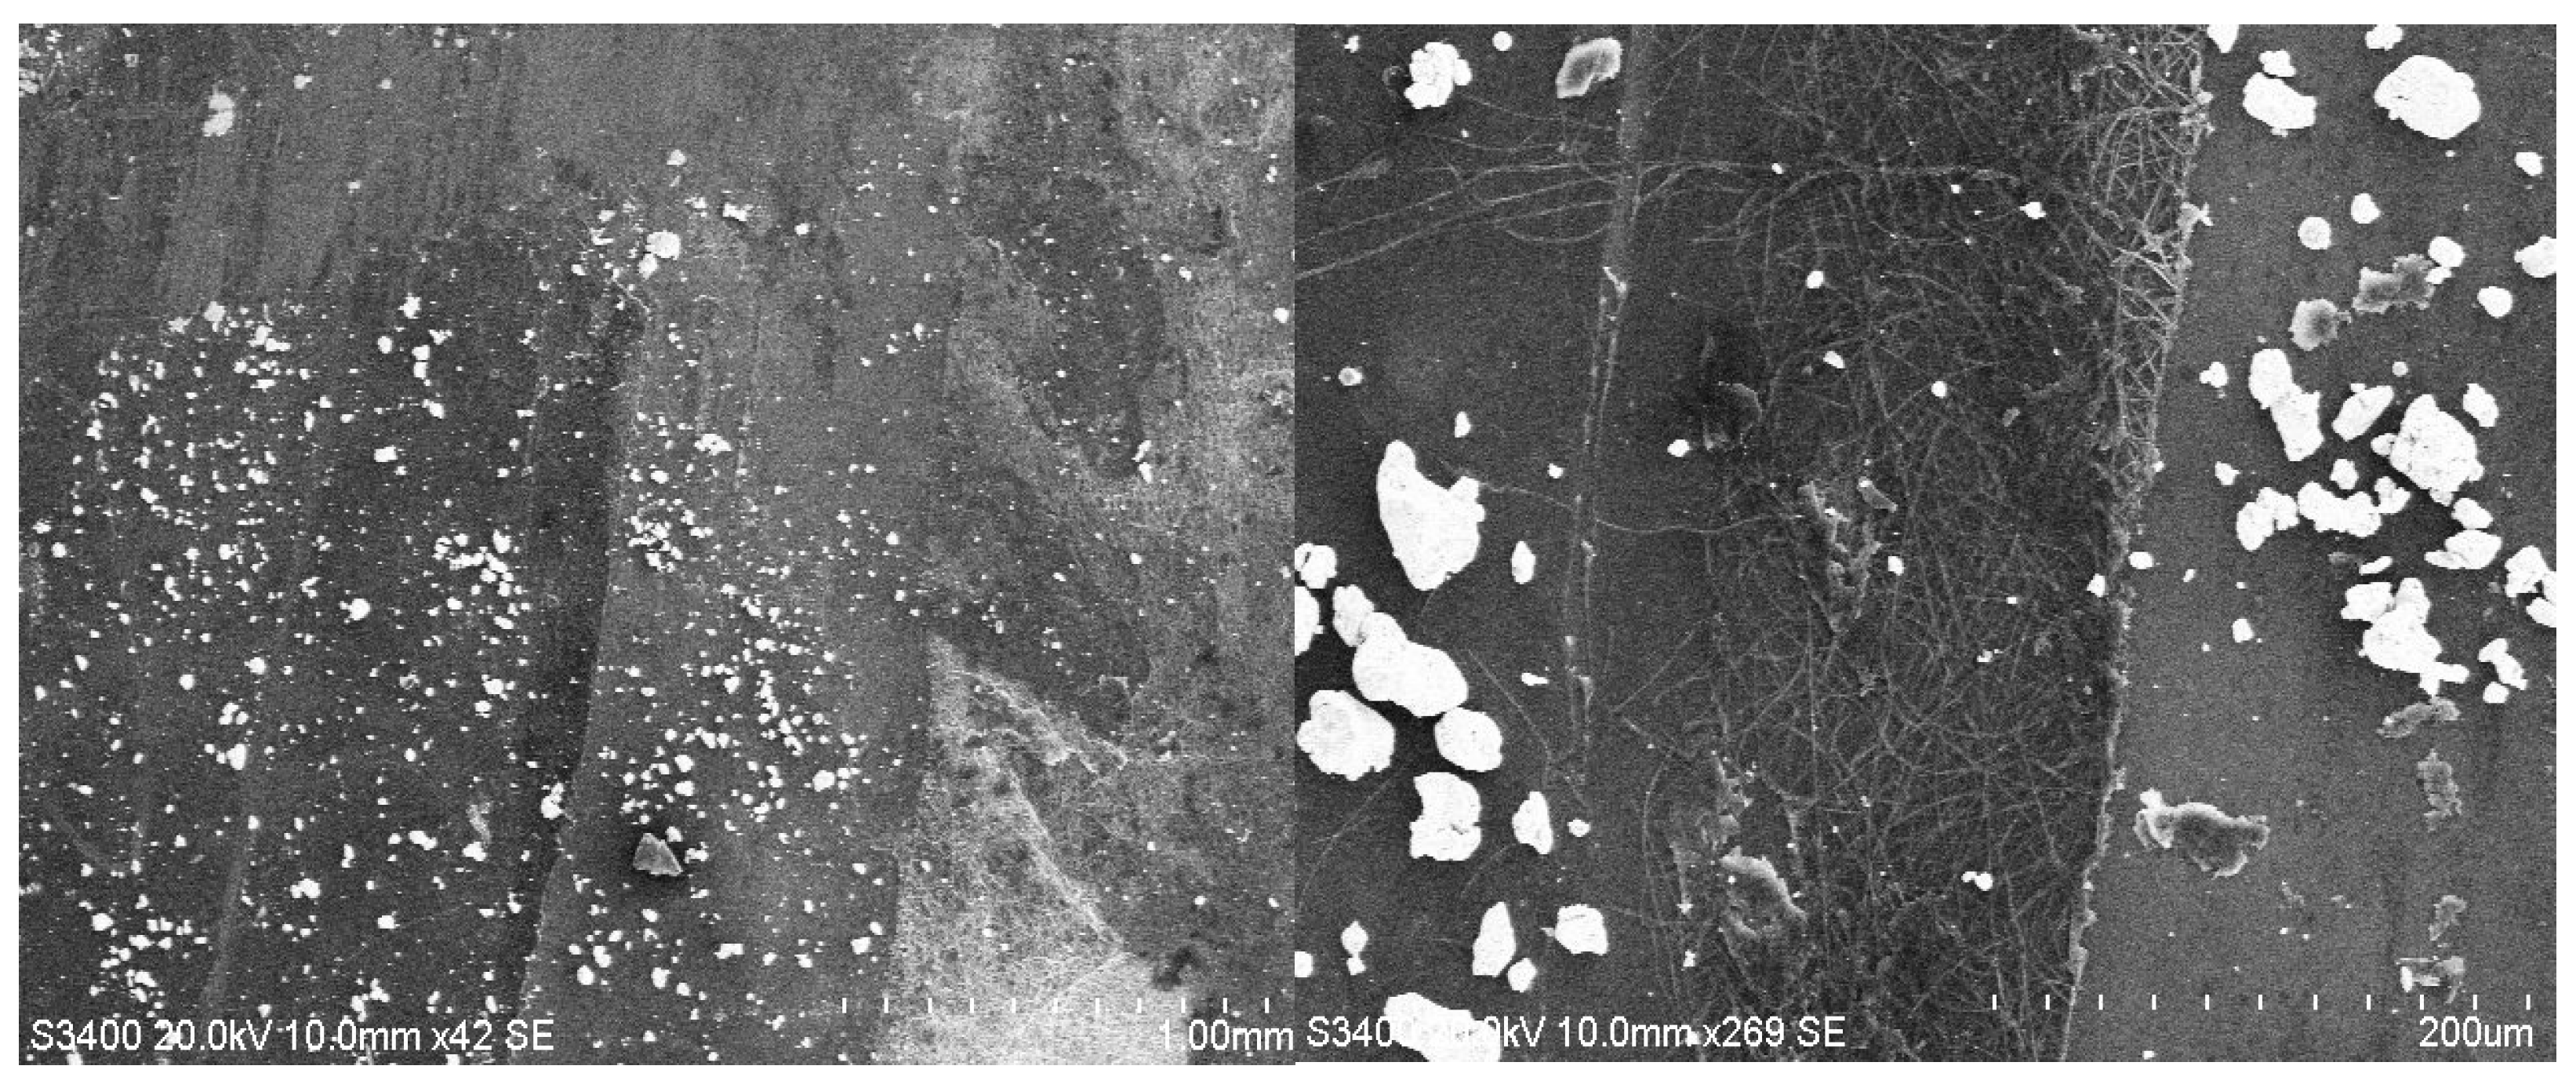
The SEM imagery in Figure 7 for TiO2/PANI:EB composites containing Au shows that most gold nanoparticles adhere to the TiO2 nanotubes, while others occupy the spaces between the ceramic nanotubes. Gold was frequently found in the form of individual nanoparticles, but some agglomerations may be noted at μm size, up to 30 μm. The distribution of gold nanoparticles is quite uniform, and the quantity is significant.
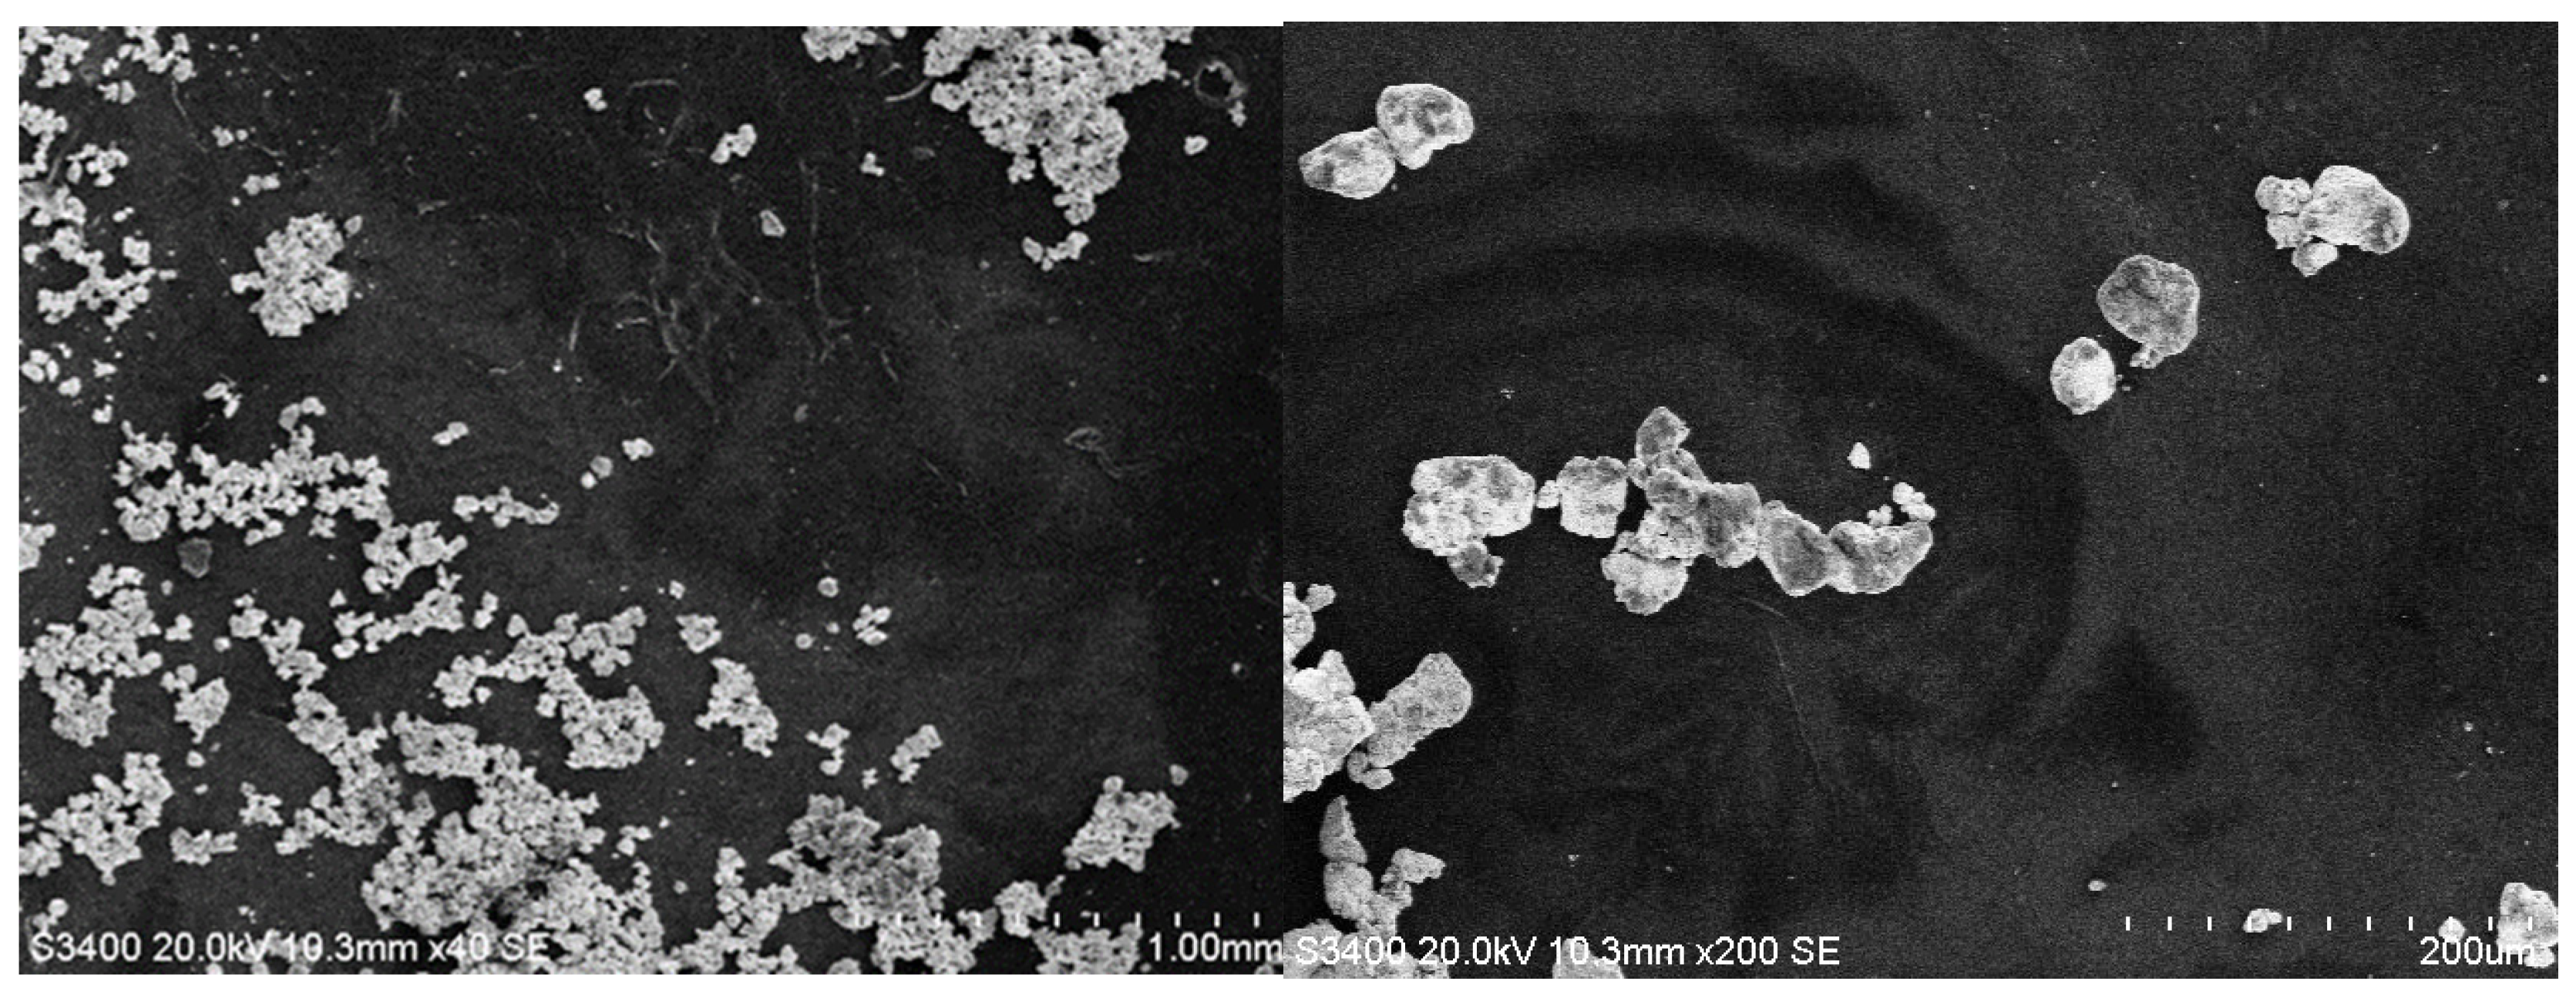
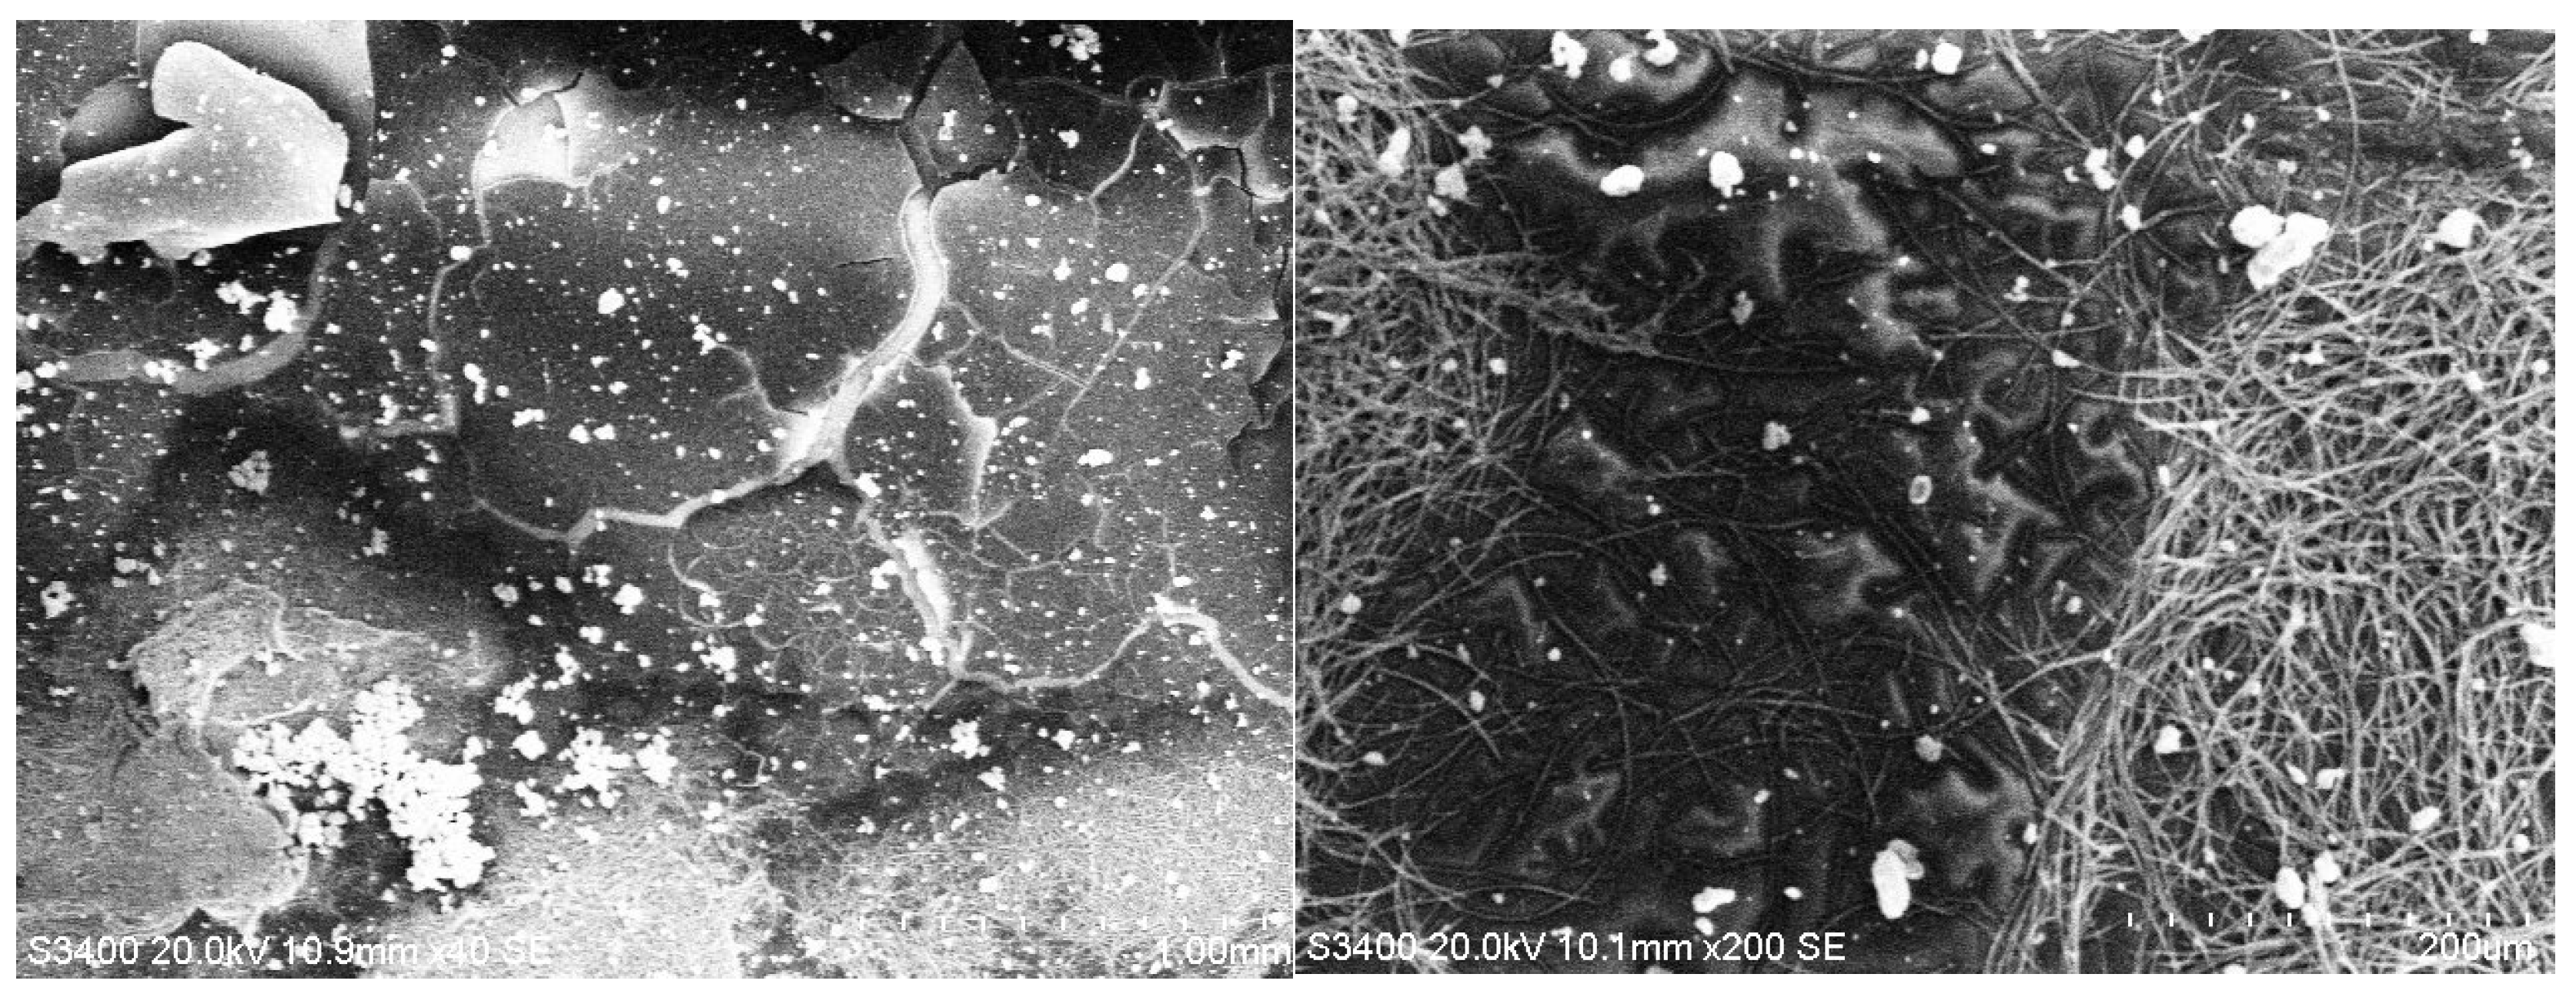
In the SEM imagery in Figure 8 of TiO2/PEDOT:PSS composites with Au, it can be seen that gold was rarely found as nanoparticles, but more frequently in the form of clusters with dimensions of tens of micrometers. It seems that the gold-occupied region is clearly limited, and hence the gold particles to be adhered are few.
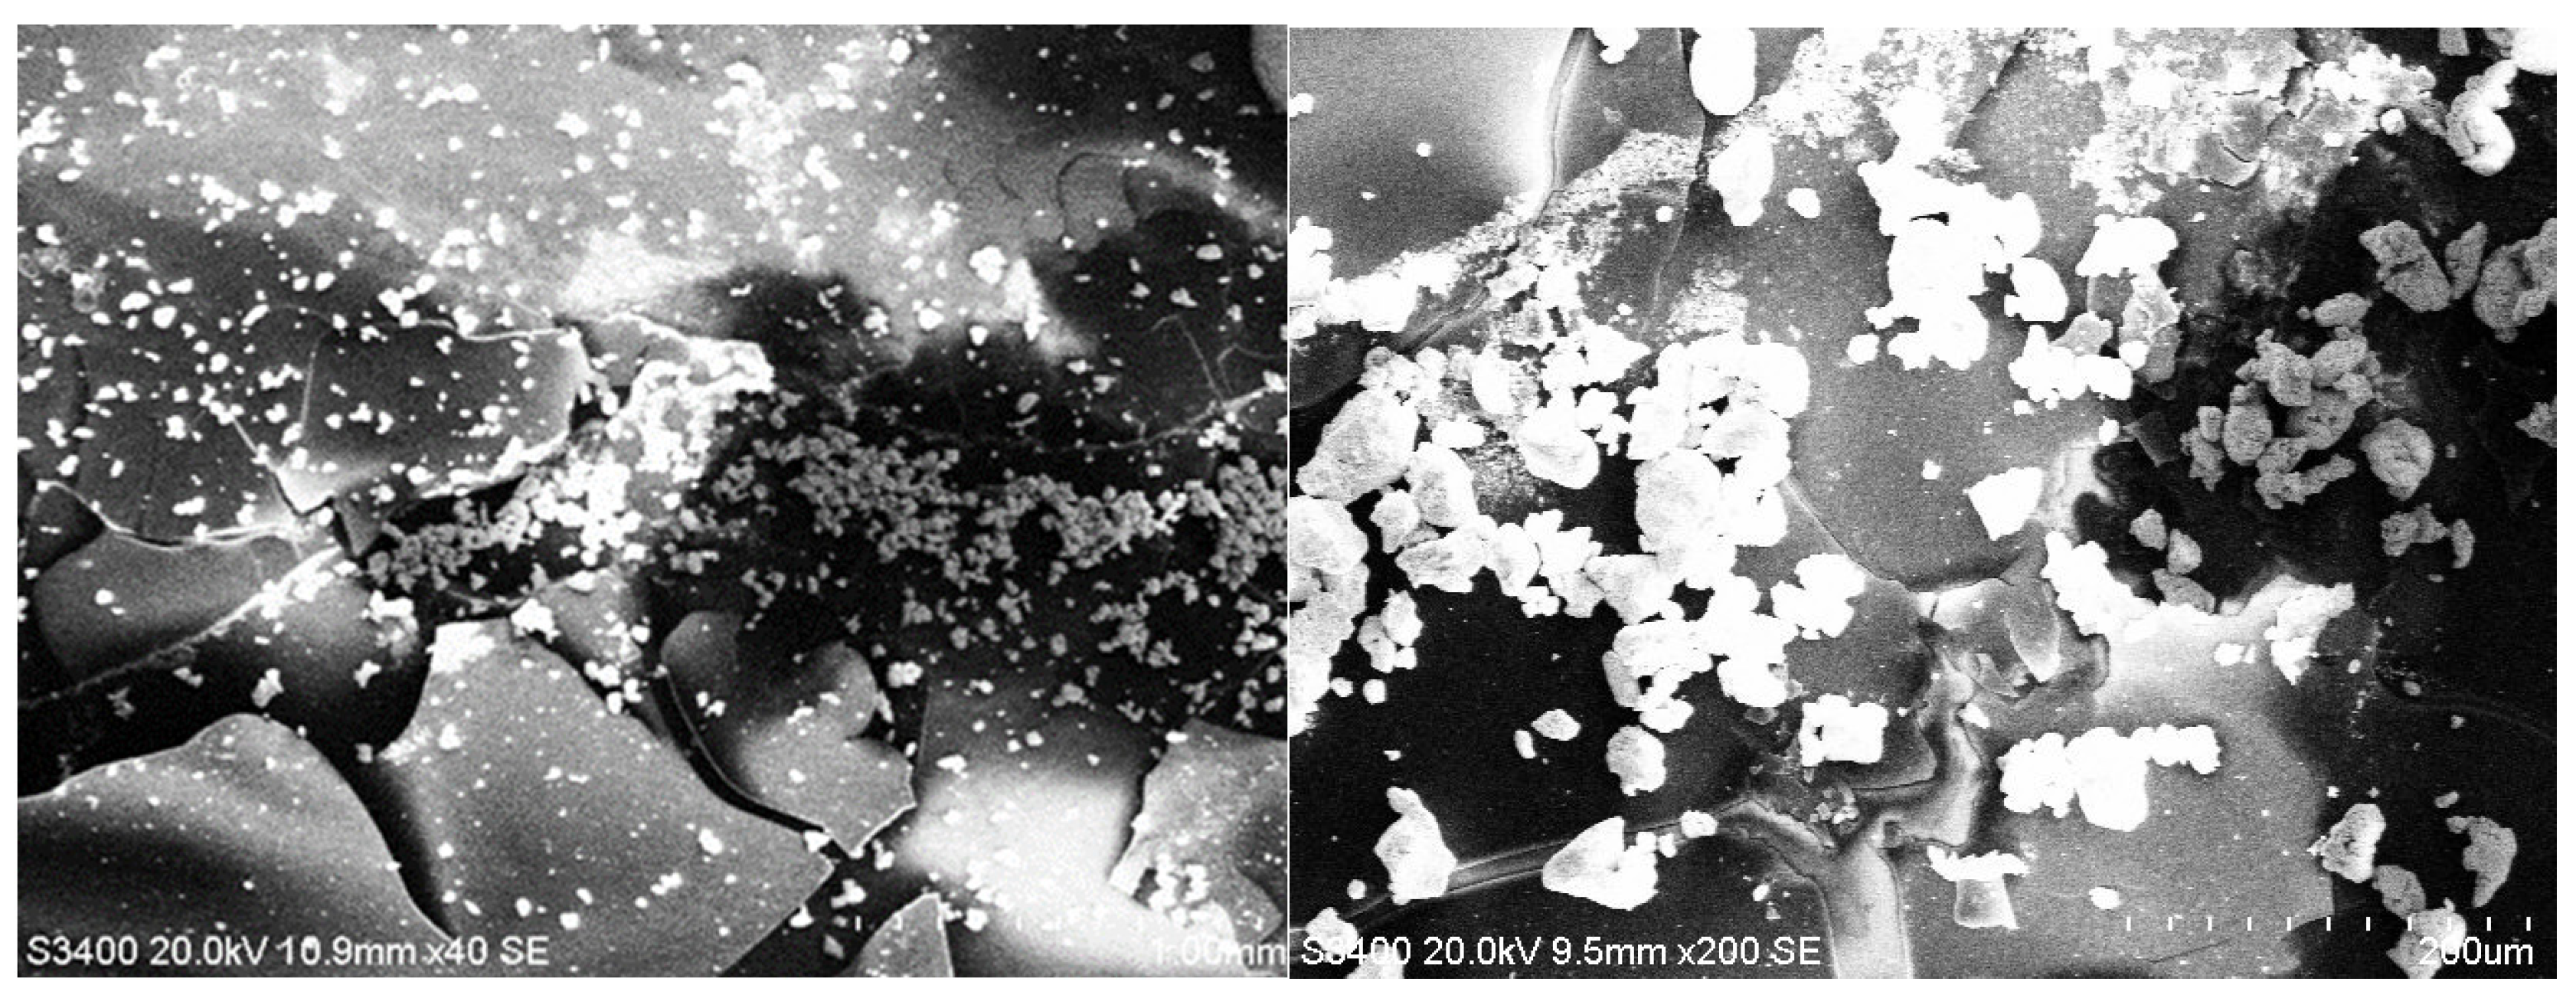
In the SEM imagery in Figure 9 of TiO2/P3HT composites with Au, it is clear that gold appears mainly in the form of nanoparticles, although some groups are visible at μm size, mainly up to 20 μm. The morphology resembles the composites of TiO2/PANI:EB with Au, but the surface covered with gold seems to be somewhat smaller.
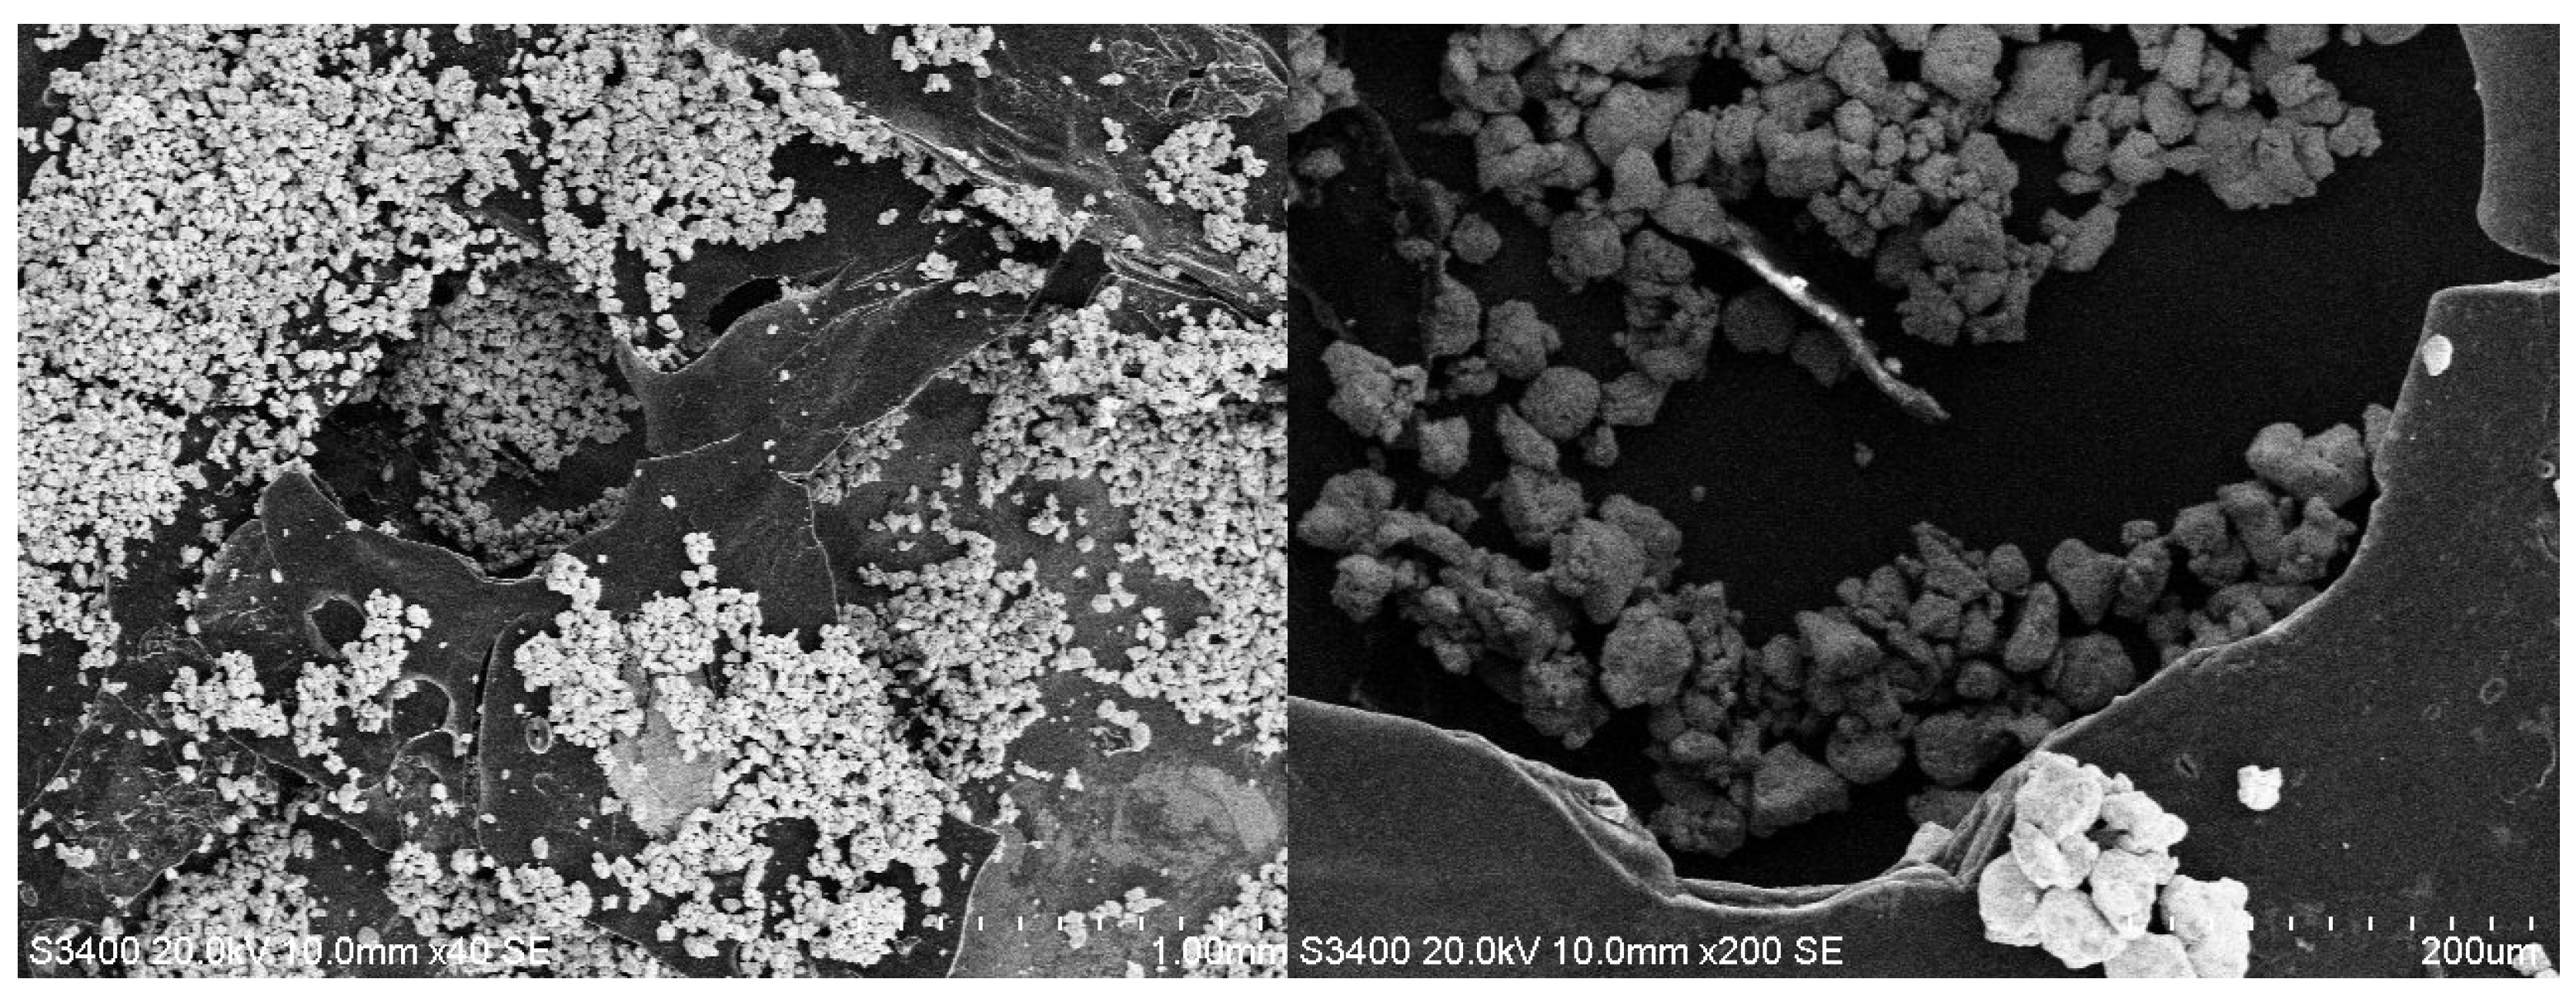
The SEM imagery in Figure 10 for Al2O3/PANI:EB composites with gold shows that very few gold nanoparticles adhere individually to nanotubes. The distribution of gold nanoparticles is rare and the quantity is insignificant, with the adhesion effect being minimal.
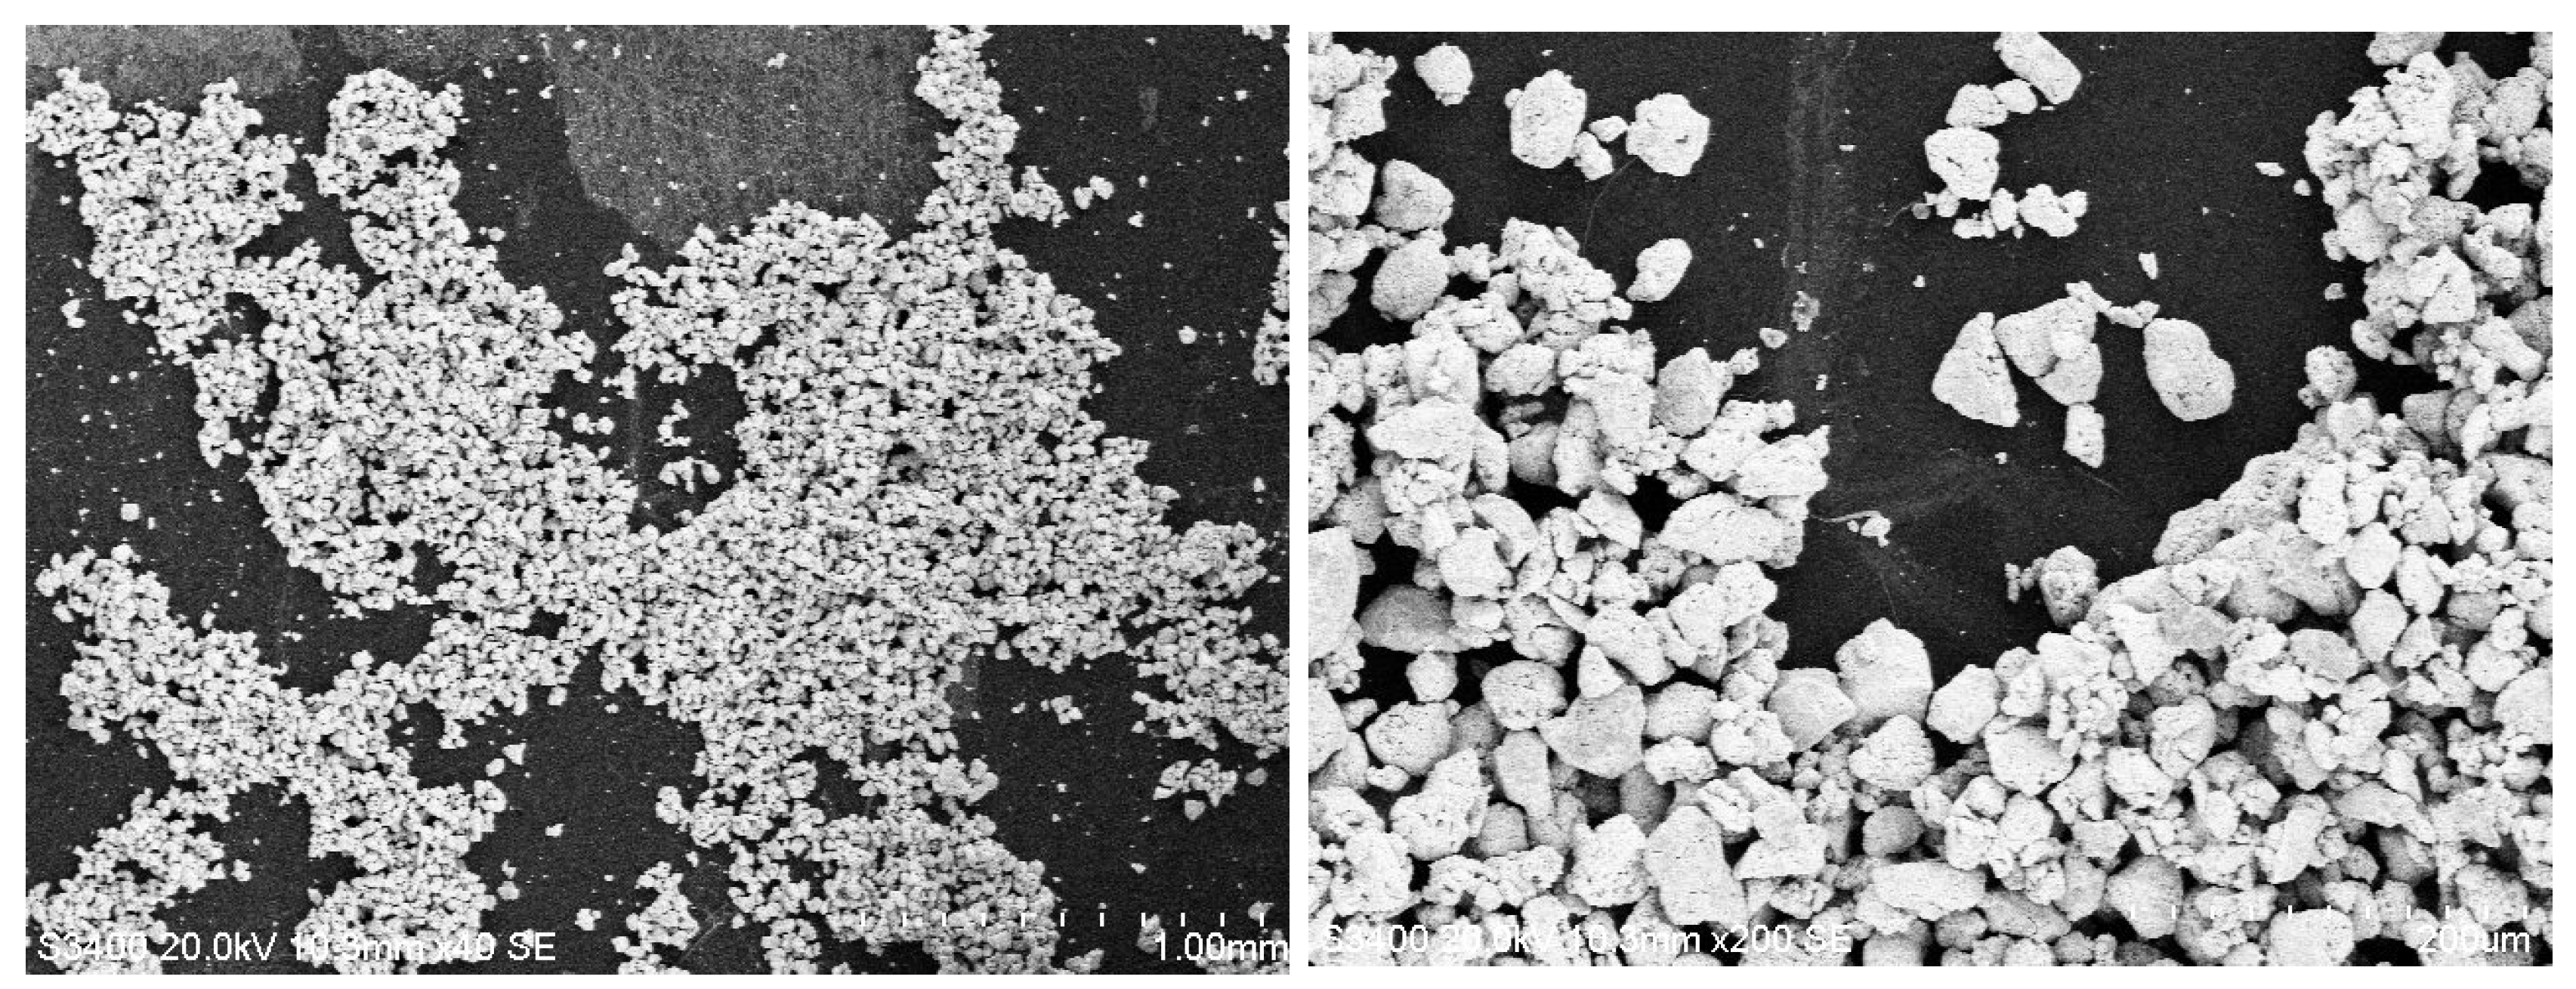
From the SEM imagery in Figure 11 for Al2O3/PEDOT:PSS composites containing Au, it is clear that the gold was mainly deposited in the form of small clusters of 10–30 μm dimensions, presenting an almost uniform distribution of these clusters on the surface of the composite. The morphology resembles the composites of TiO2/PANI:EB with Au, but, here being predominantly clusters, the surface covered with gold seems larger, and the amount of gold is clearly larger.
From the SEM imagery in Figure 12 for Al2O3/P3HT composites with Au, it is clear that gold has mainly been deposited in the form of separate nanoparticles, although a few small groups can be observed at μm size, mainly up to 10 μm, presenting an almost uniform distribution on the entire surface of the composite. The structure looks similar to the TiO2/P3HT composite with Au, in terms of the region covered with gold and the amount of gold deposited, which are comparable.
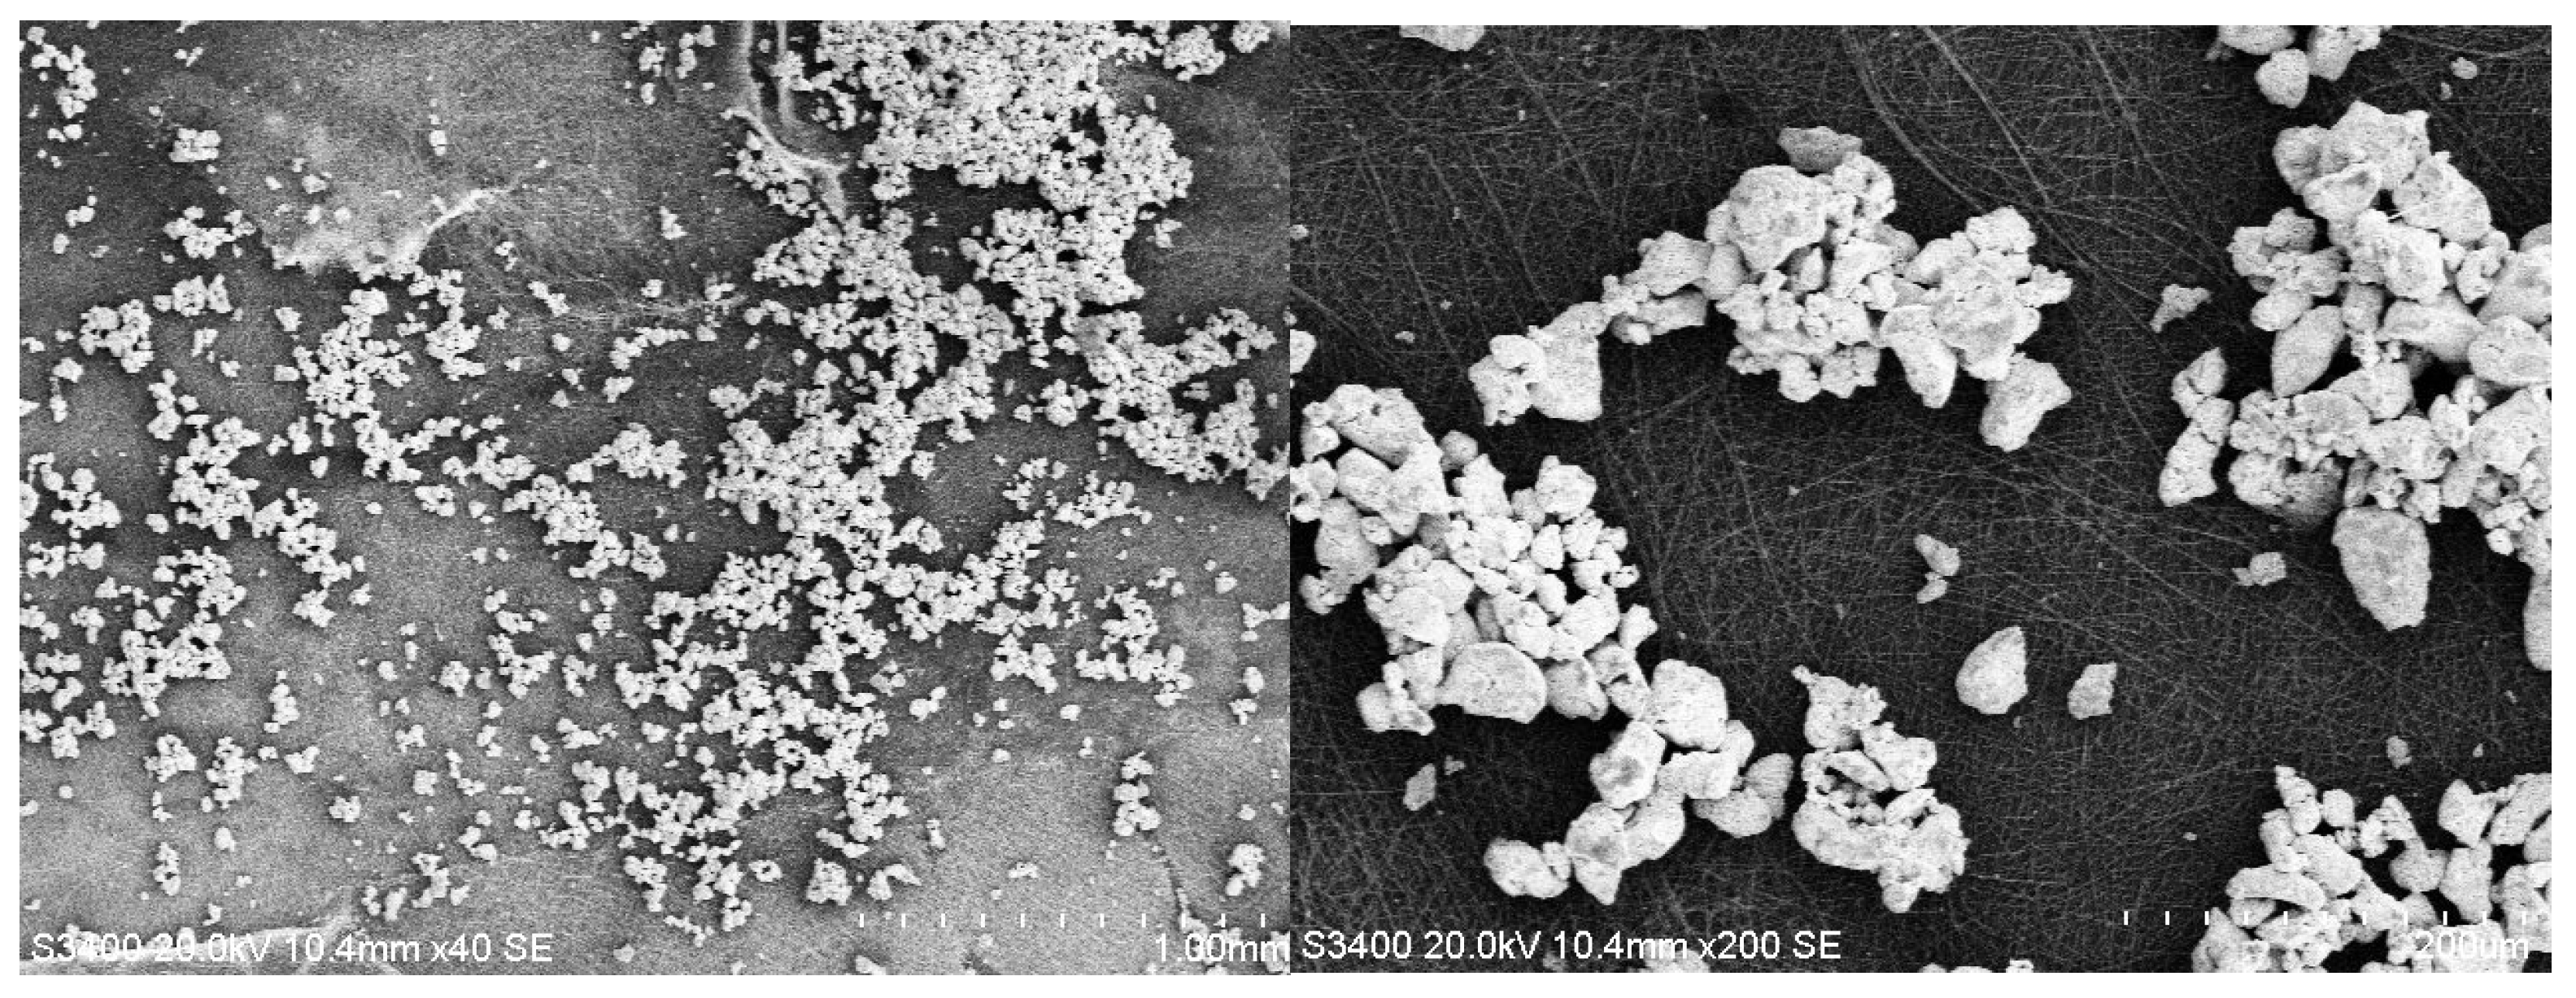
The SEM imagery in Figure 13 for Y2O3/PANI:EB composites containing Au shows that gold is deposited mainly in the form of individual nanoparticles on nanotubes, while other particles fall into the spaces between ceramic nanotubes.
The distribution of gold nanoparticles is relatively uniform, even if some small groups of nanoparticles up to 10 μm can be observed, but the quantity is significant.
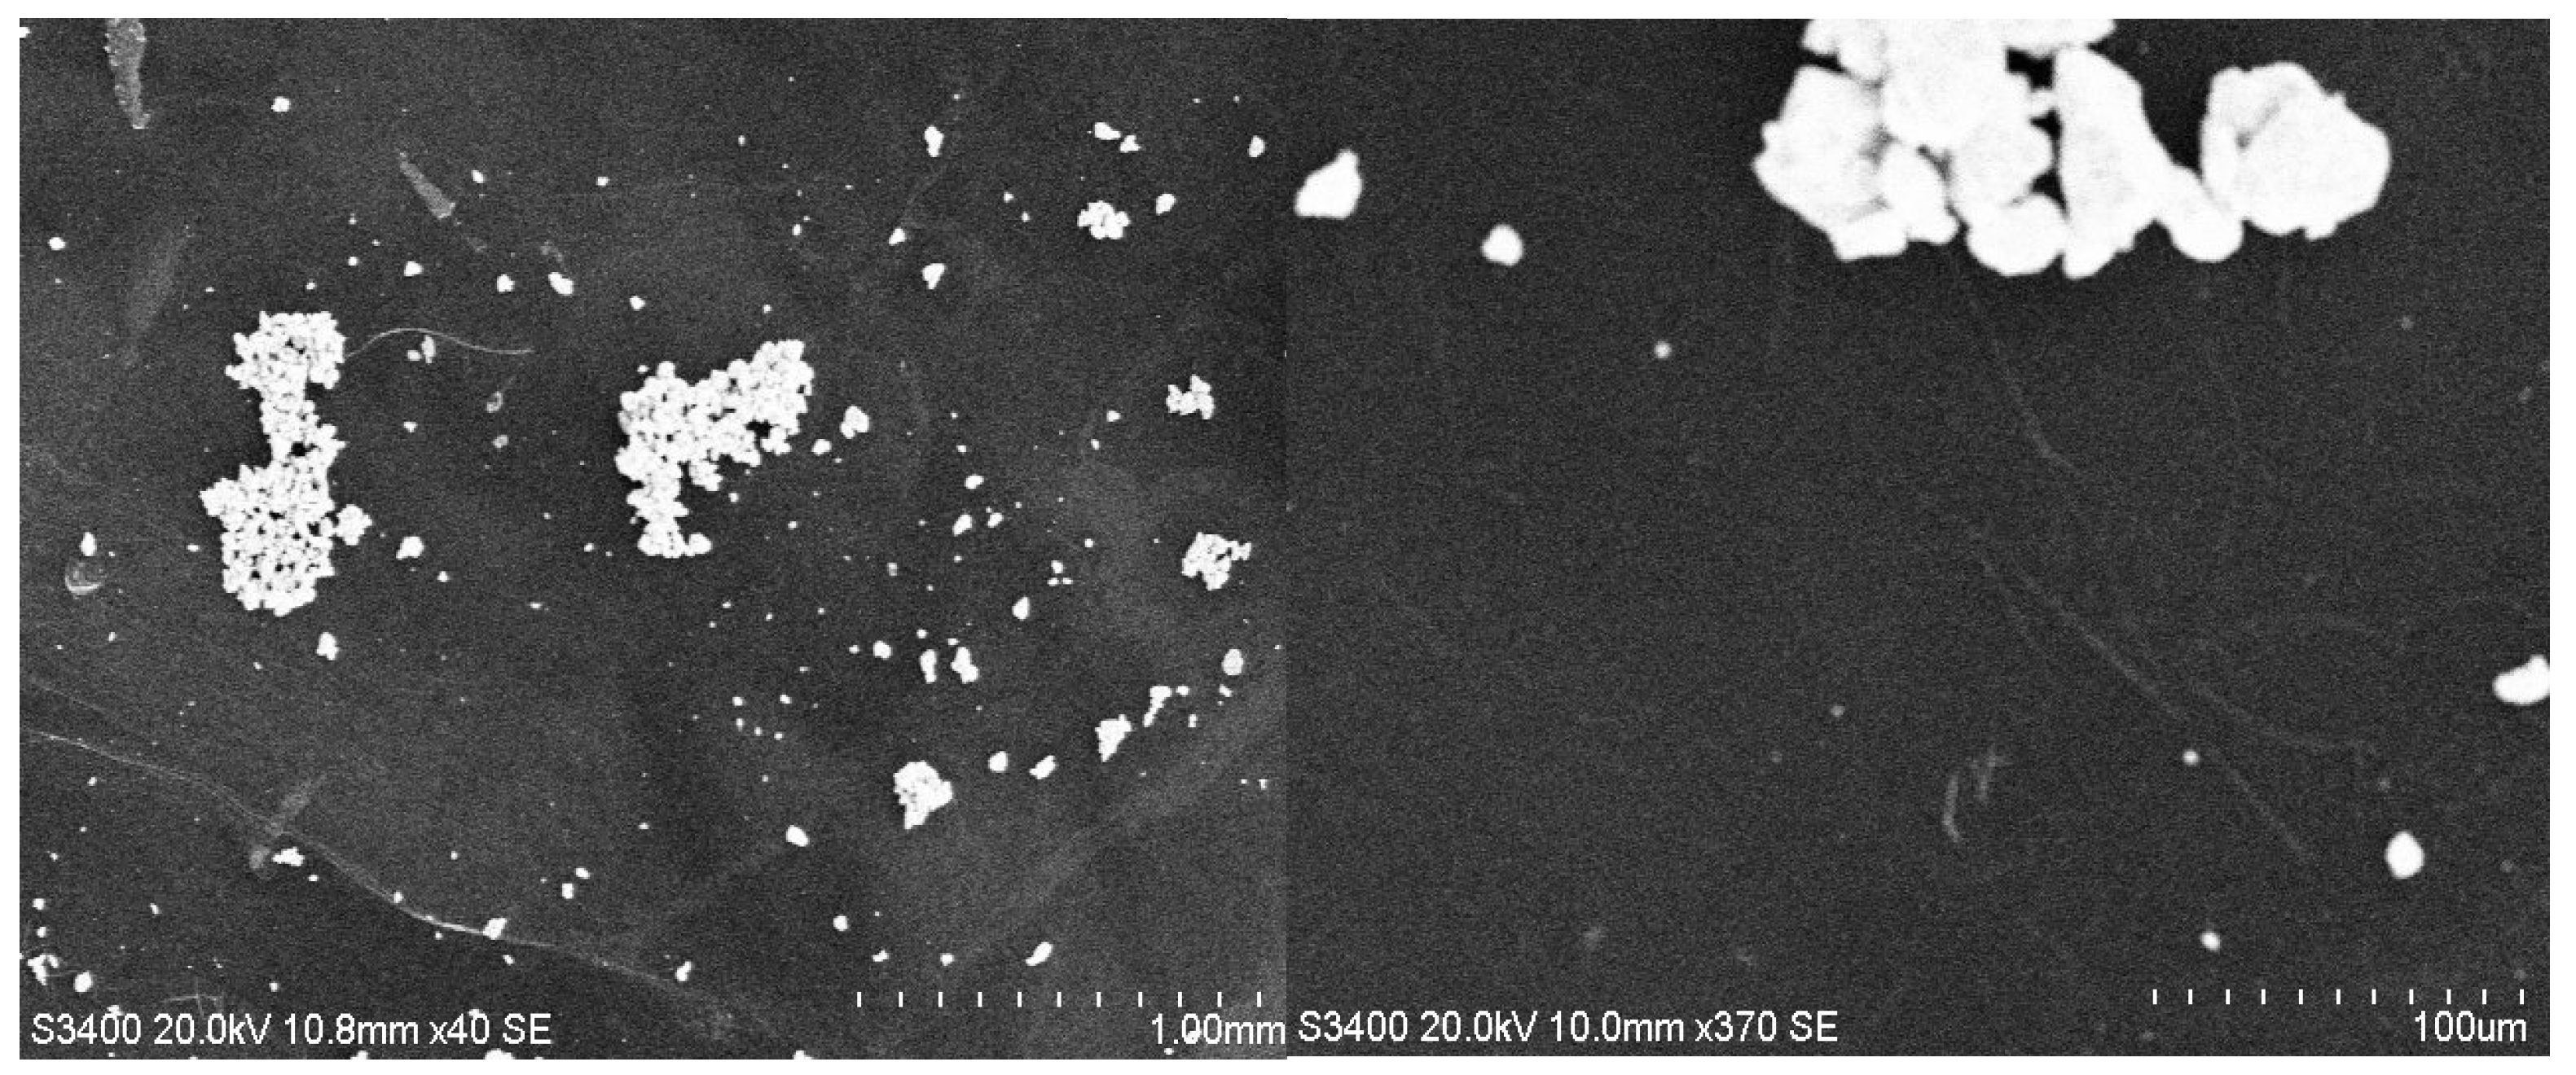
From the SEM imagery in Figure 14 for Y2O3/PEDOT:PSS composites containing Au, it can be seen that the morphology resembles the structure of the composites Y2O3/PANI-EB with Au, presenting a significant number of dispersed nanoparticles and small clusters on and among nanotubes. However, here, the gold region and the amount of gold are larger.
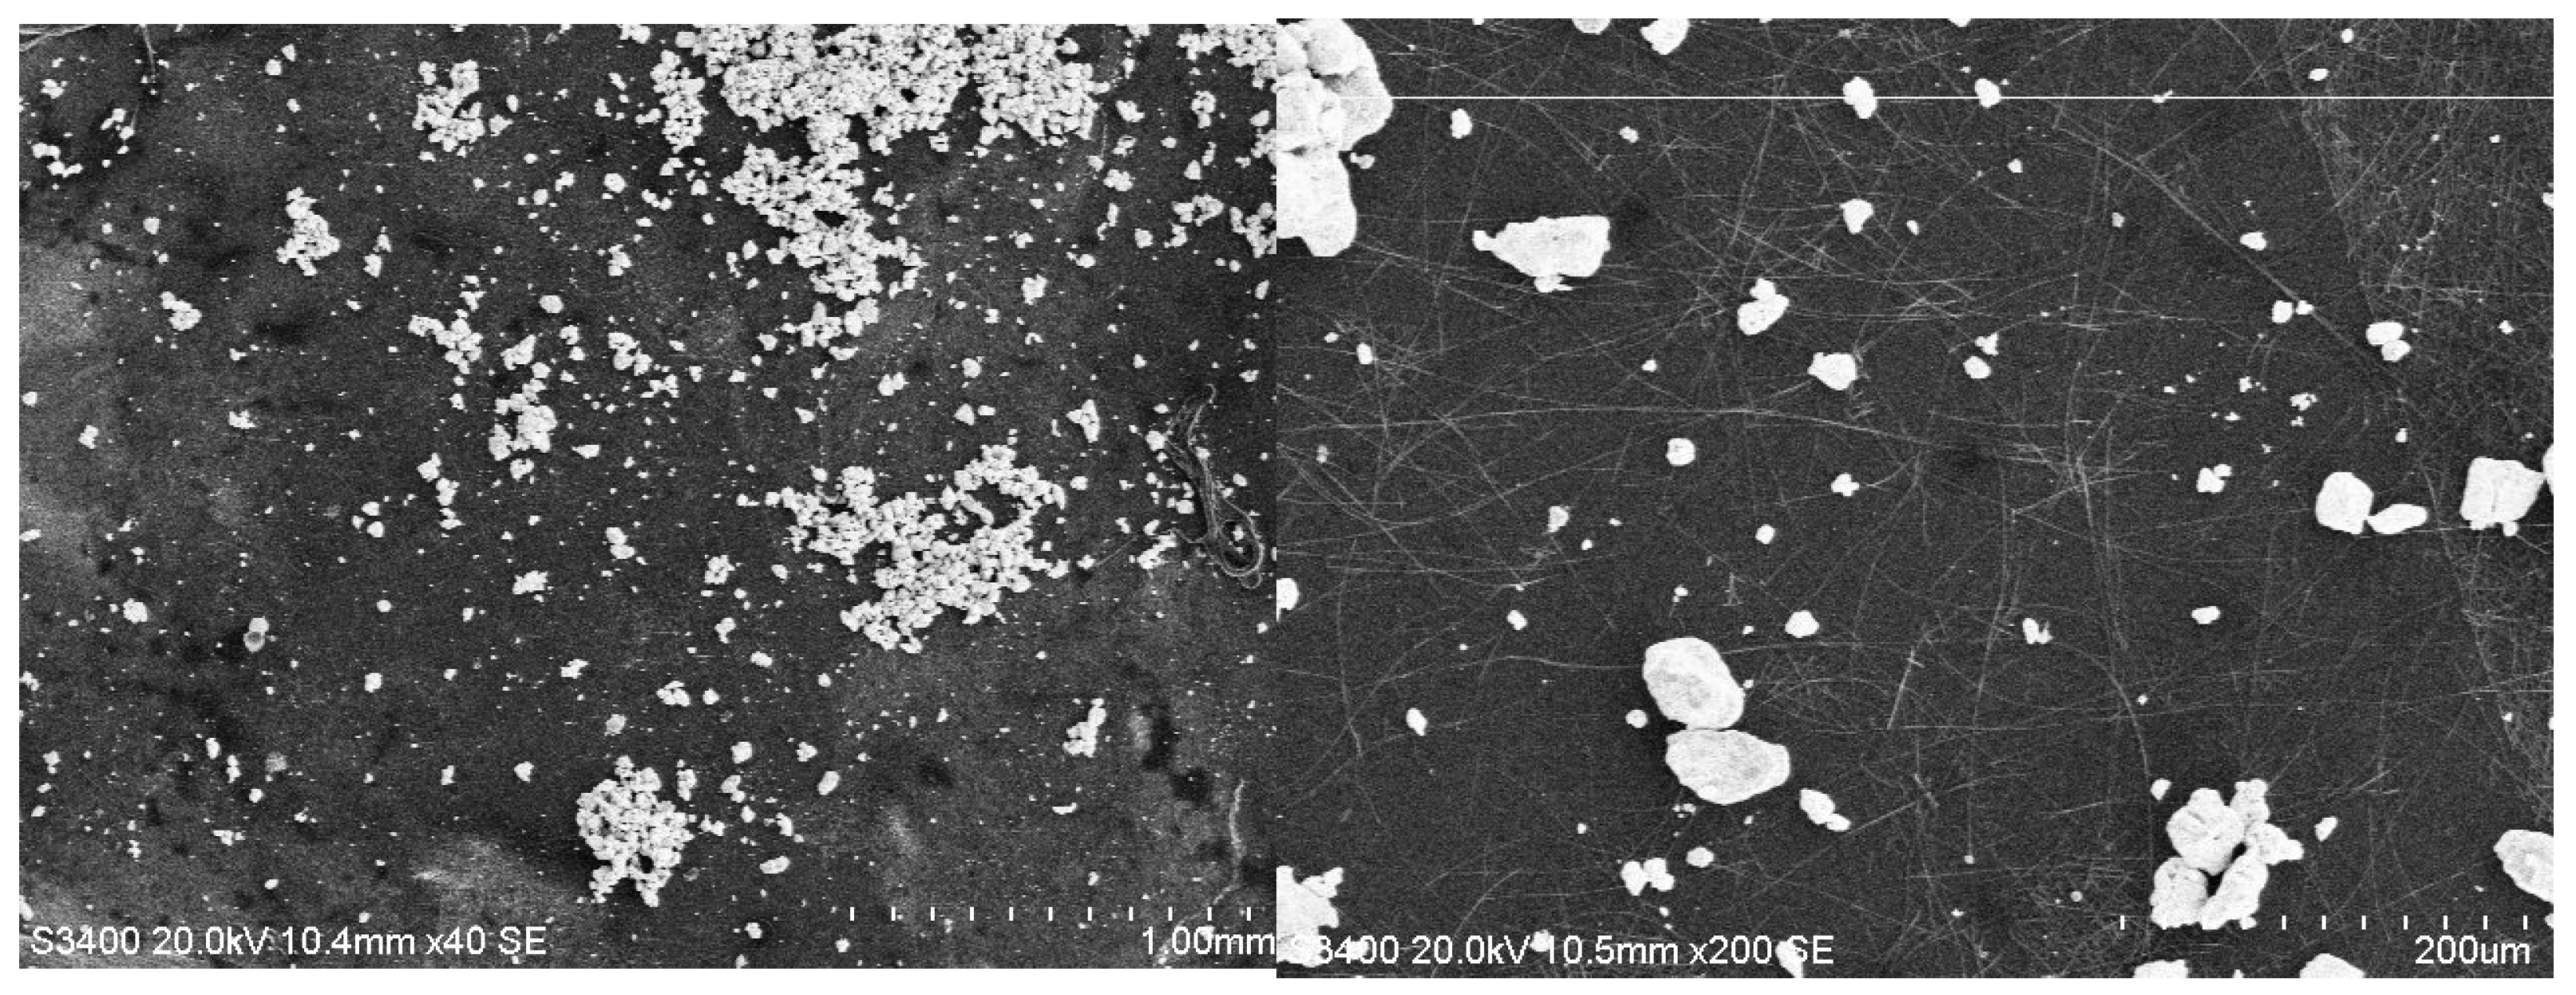
From the SEM imagery in Figure 15 for Y2O3/P3HT composites containing Au, it is observed that gold was mainly deposited in the form of nanoparticles and very small clusters, ideally filling the spaces between nanotubes. The morphology shows a very uniform distribution of nanoparticles. However, the amount of gold is quite minimal and the surface covered with gold seems significantly reduced comparing to the precedent cases.
The SEM imagery in Figure 16 for ZnO/PANI:EB composites containing Au shows that gold appeared primarily in the form of nanoparticles with deep penetration within the structure. The distribution of gold nanoparticles is quite uniform, although in a few cases, some larger groups of nanoparticles may be identified. The gold quantity is less significant, suggesting a weak attraction of gold nanoparticles to this composite structure.
The SEM imagery in Figure 17 for ZnO/PEDOT:PSS composites containing Au may resemble Al2O3/PEDOT:PSS composites that include Au, presenting a substantial amount of gold deposited in the form of individual nanoparticles and small clusters of 10–30 μm dimensions, with a rather uniform distribution on the surface. The surface containing gold and the amount of gold are significantly larger comparing to the ZnO/PANI:EB structure.
From the SEM imagery in Figure 18 for ZnO/P3HT composites containing Au, it turns out that gold was deposited in the form of nanoparticles and small clusters up to 10 μm dimensions that crowd and even overlap. There is a larger region full of gold, but there are also some sections with smaller gold deposition, which makes the general distribution to be seen uneven, presenting a combination of two distinct areas. The amount of gold seems to be considerable, comparable to ZnO/PEDOT:PSS composites.
In general, it is believed that the deposition of gold nanoparticles on composite sites can mainly be influenced by the type of polymer, as well as its deposition on ceramic nanotubes, which was firstly observed when analyzing Figure 2, Figure 3, Figure 4 and Figure 5. However, when evaluating the integration of gold nanoparticles with polymers and ceramic nanotubes through EDS and SEM, it becomes clear that the interaction between gold and polymer structures varies significantly, contrary to expectations, and the gold nanotubes and architecture of the surface are distinctly affected by the ceramic nanotubes.
An overview of the distribution of gold nanoparticles upon the surface of hybrid composites of ceramic nanotubes and conducting polymers is briefly given in Table 2.
The analysis of the SEM images and the conclusions from Table 2 generally correspond to the results presented in Table 1. Based on the interpretation of the SEM images, the PANI:EB polymer has shown the most relevant physical connection with the gold nanoparticles, mainly when the nanotubes of TiO2 and Y2O3 are present, while the bond is weak with other nanotubes. The PEDOT:PSS polymer has demonstrated a more significant deposition of gold nanoparticles only in connection with Al2O3, Y2O3, and ZnO. Finally, regarding the P3HT polymer, the gold deposition is considerable only in relation to TiO2, Al2O3, and ZnO, while in the case of Y2O3, the effect is minimal.
However, the optimal placement of gold nanoparticles on the surface of ceramic nanotubes and their content are essential requirements for improving the sensitivity of the material for sensory purposes, but this effect must be increased by the special structure from the surface of the material, which will be evaluated below by the AFM analysis.

3.3. AFM Analysis

The AFM optical analysis shows the size of the grains, their distribution on the surface, and the general roughness of the surface. The qualitative correlation between the shape and density of the peaks and the values of the roughness parameters are described by Figure 19 and explained in [45]. Essentially, the ideal architecture for efficient sensors would be the one with a higher value of the roughness of the peaks (RA), more sharpened peaks (characterized by RSK), and a reasonably consistent distribution of peaks and valleys, with a greater uniformity of their form and a lower asymmetry (characterized by RKU).
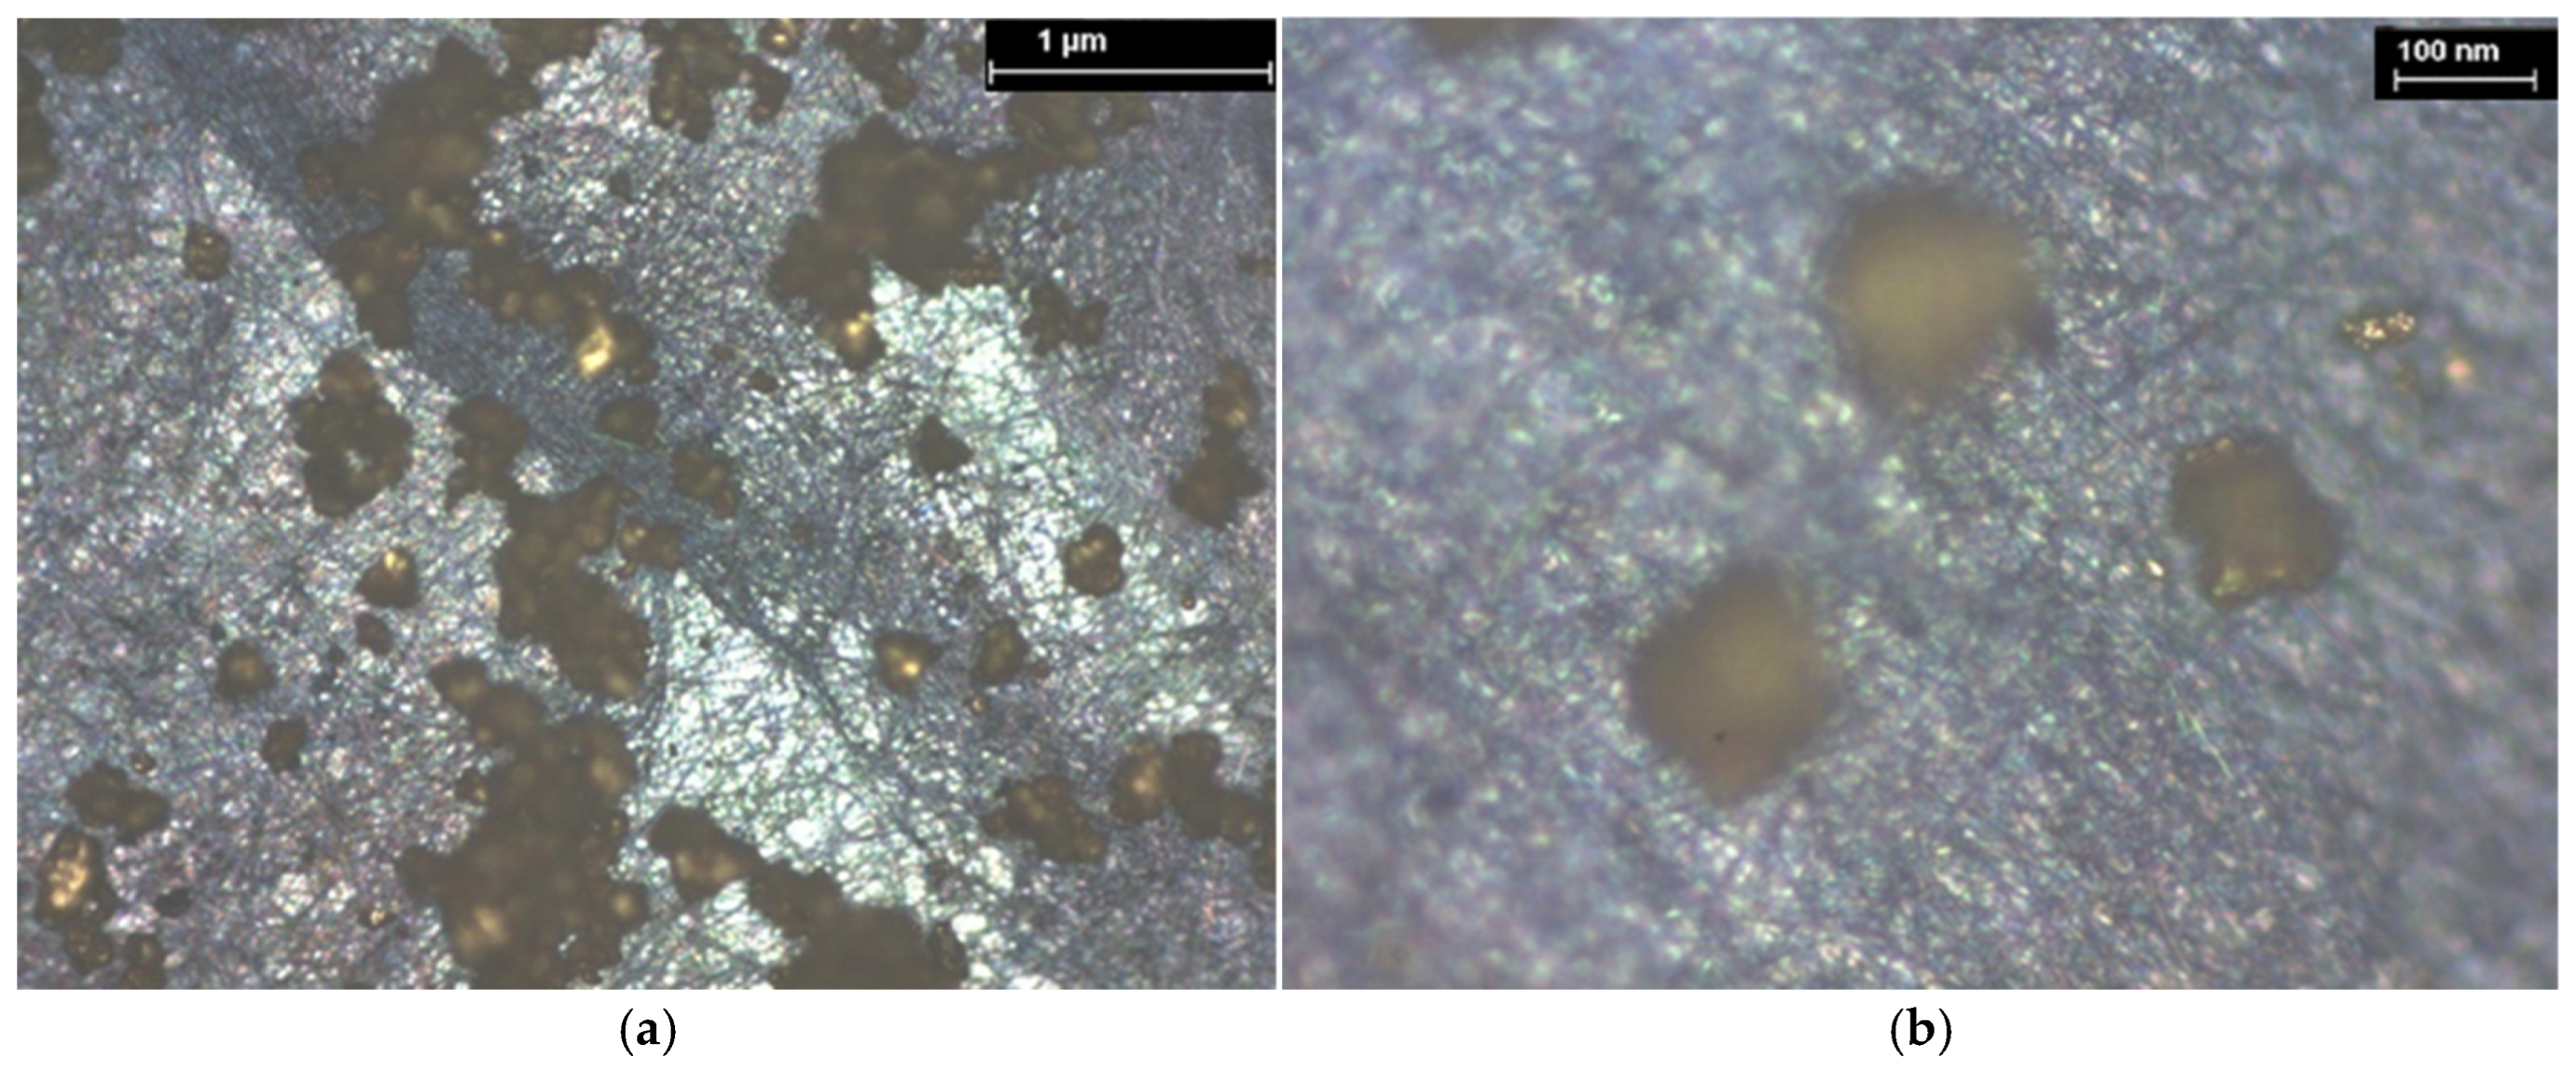
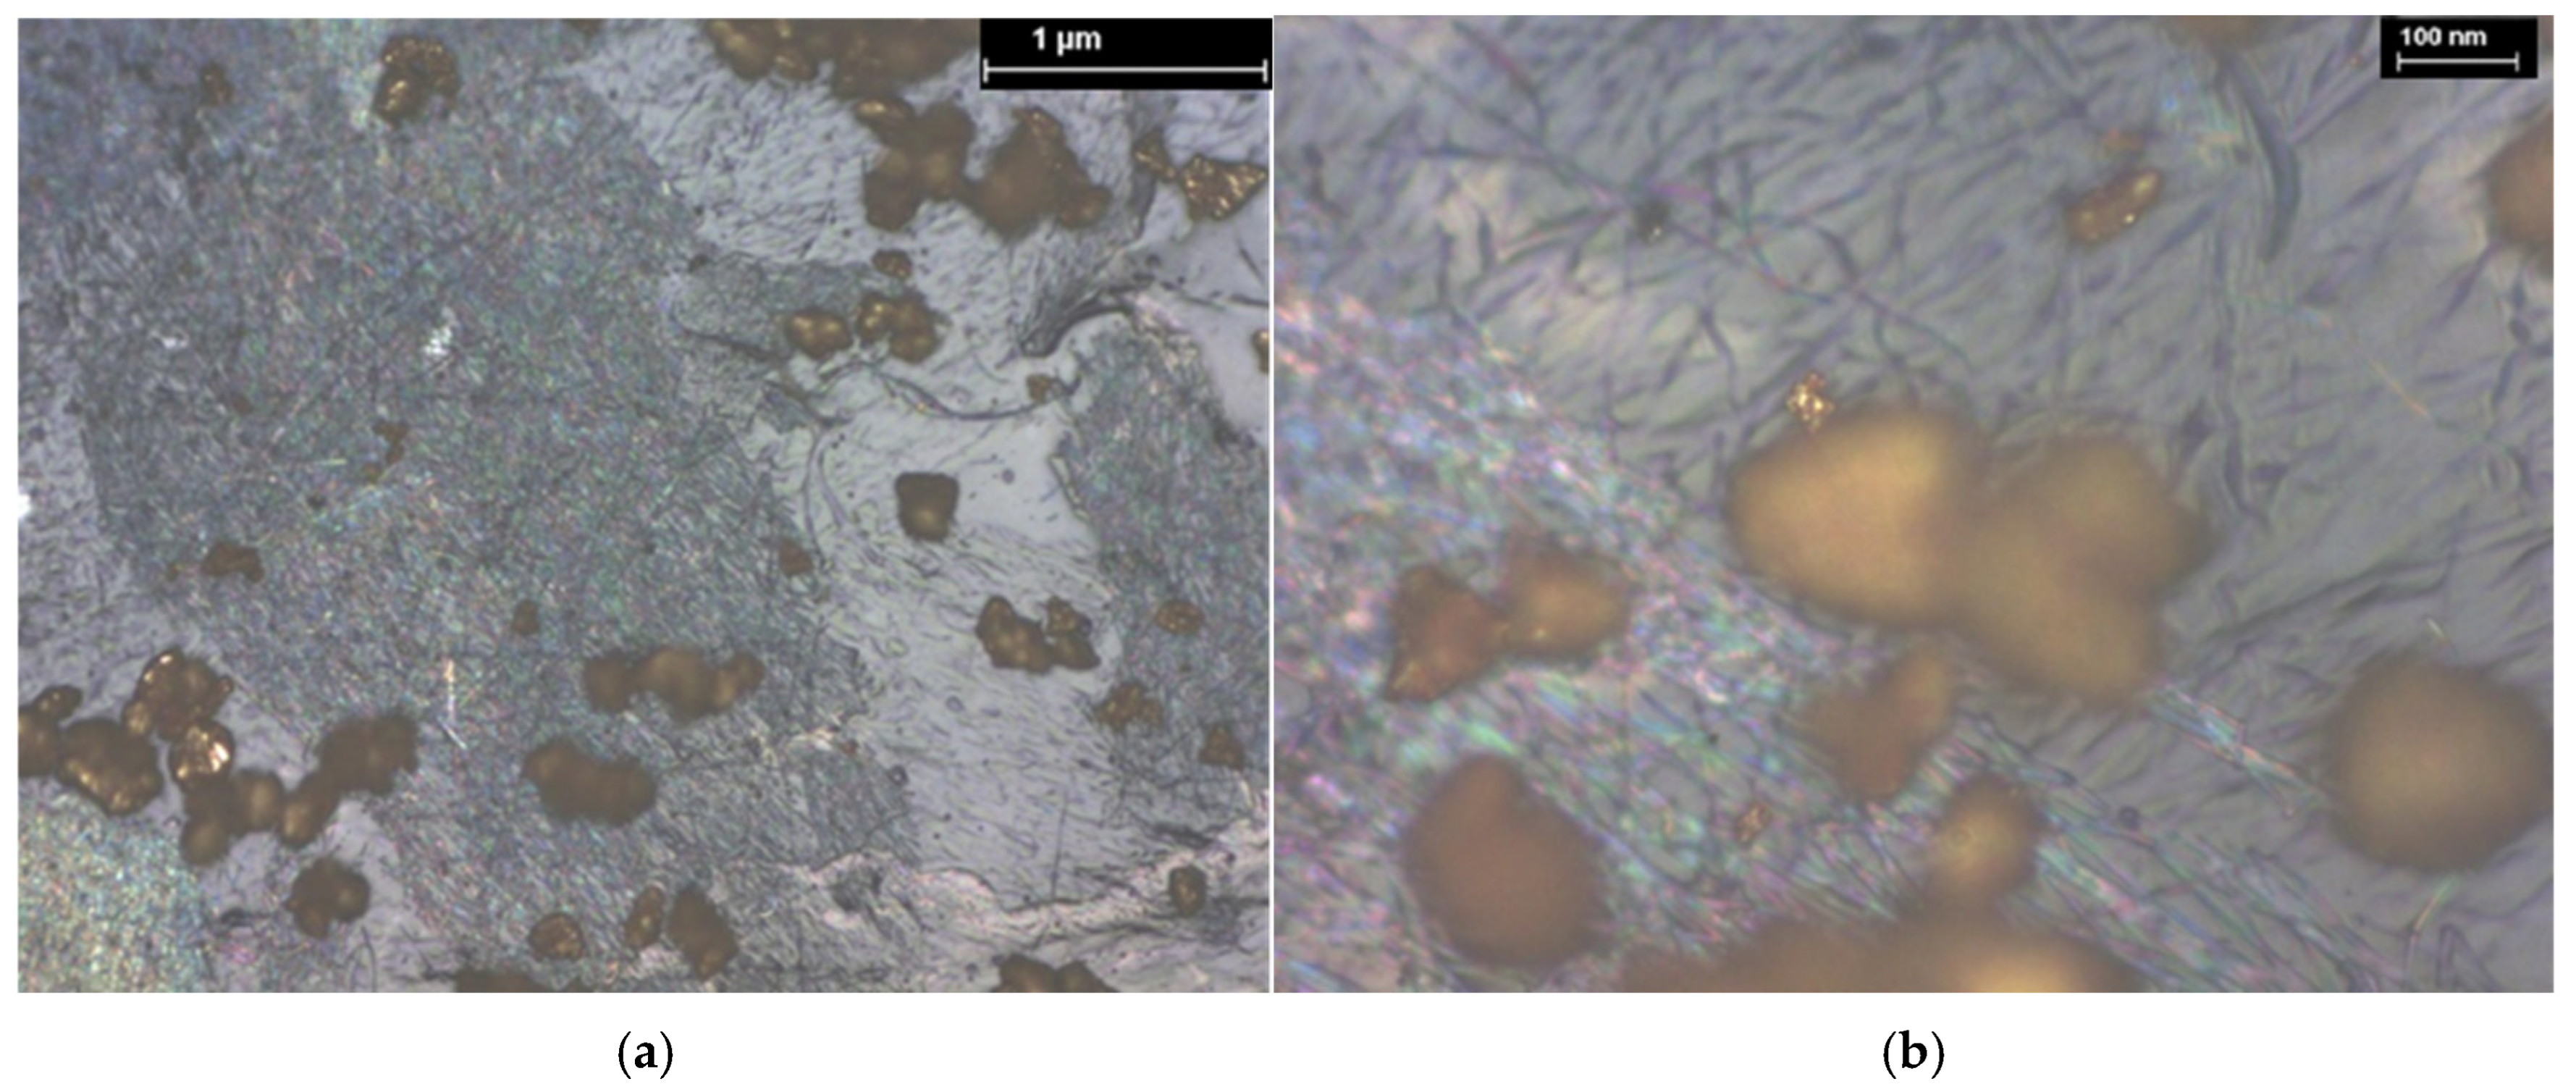
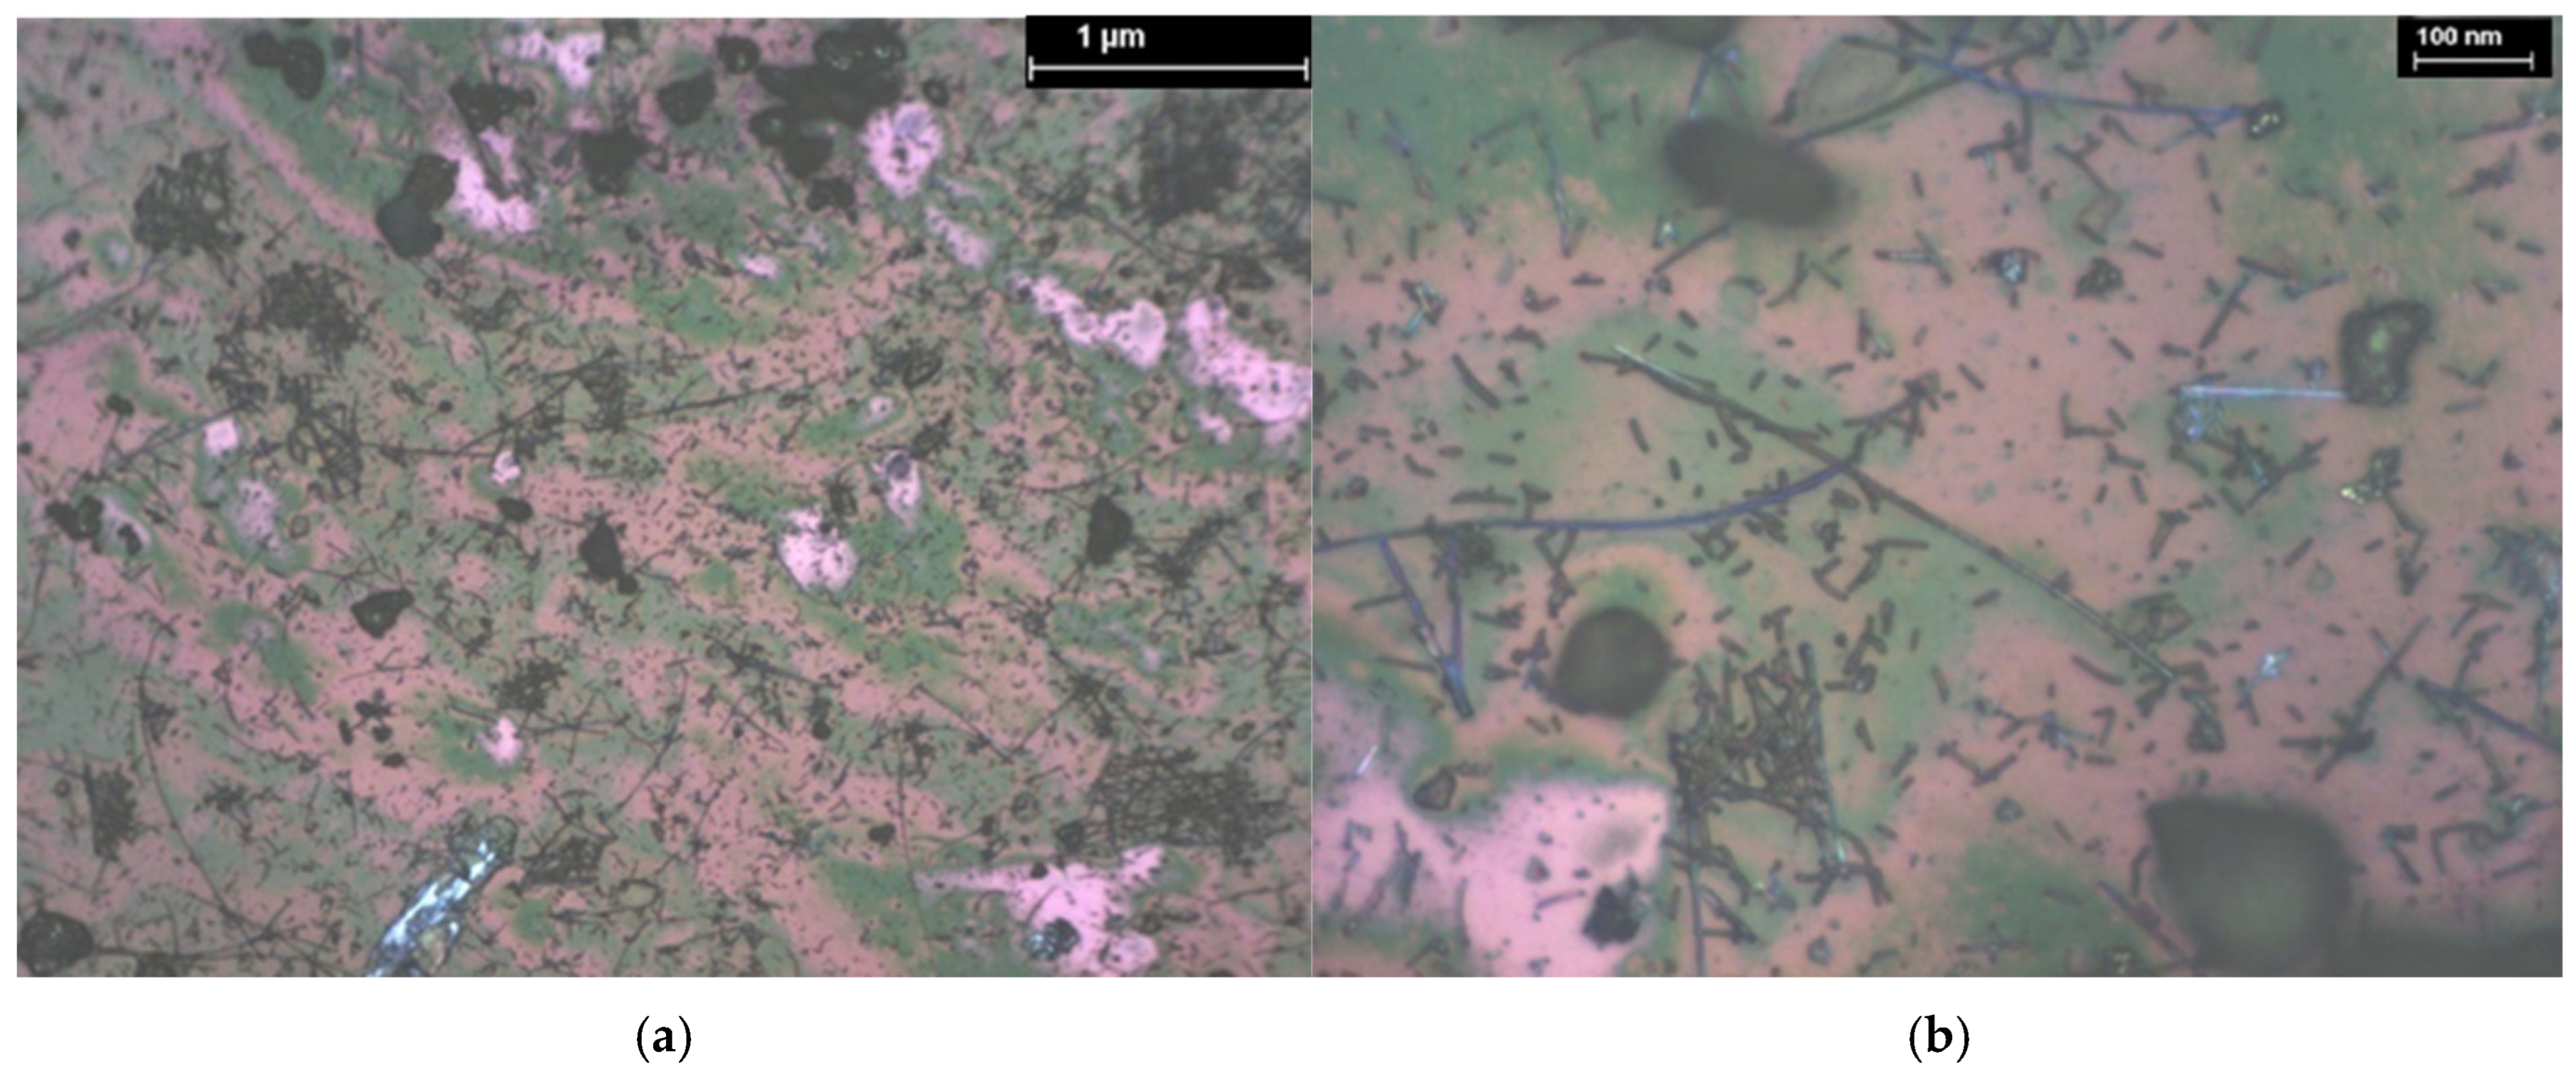
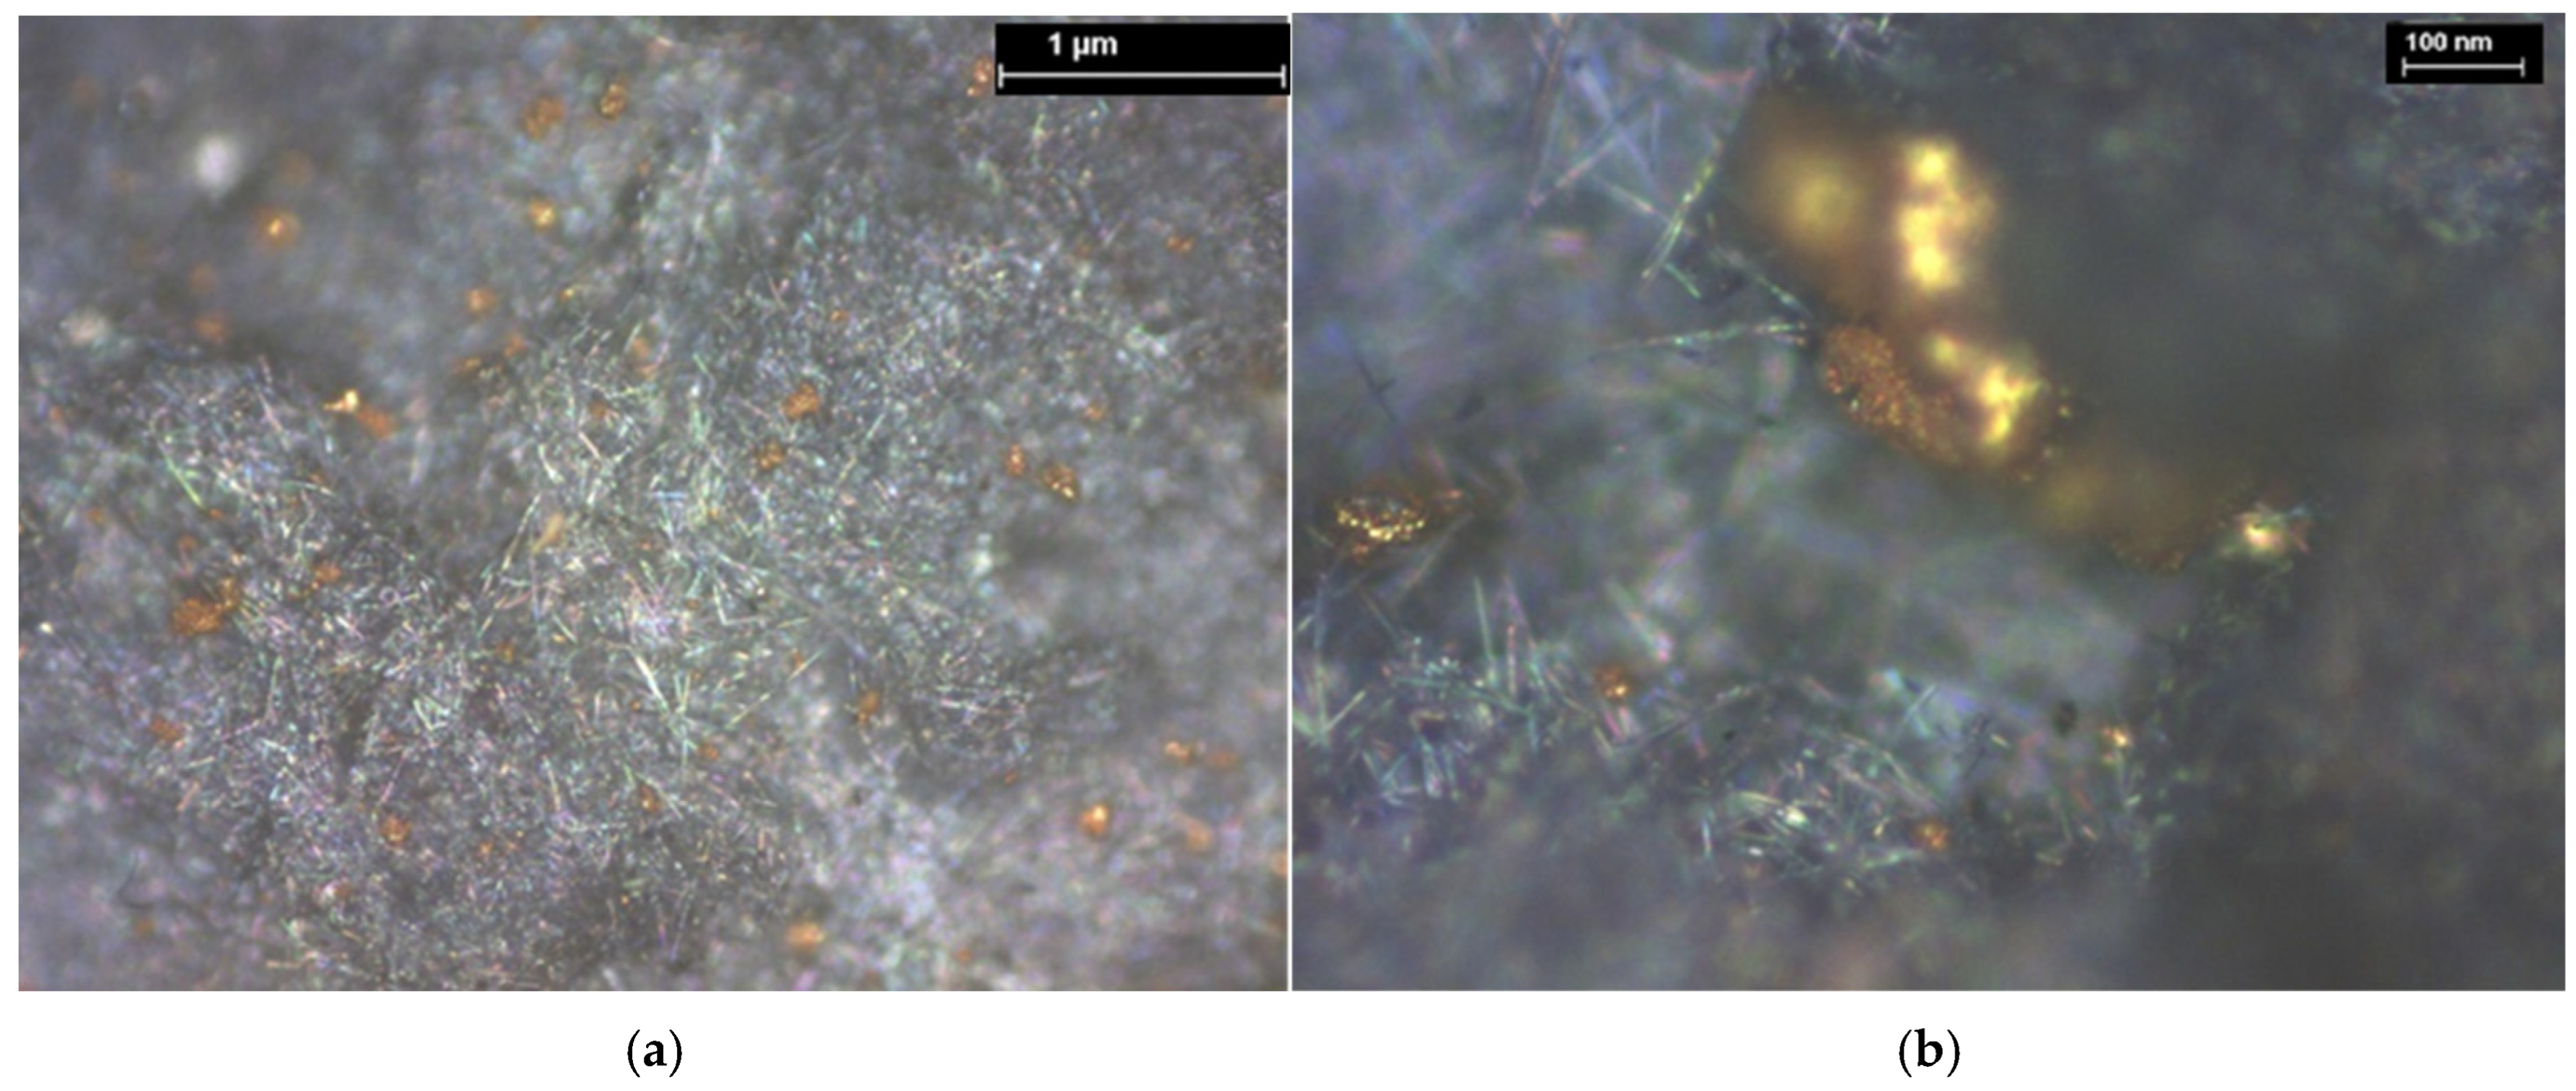
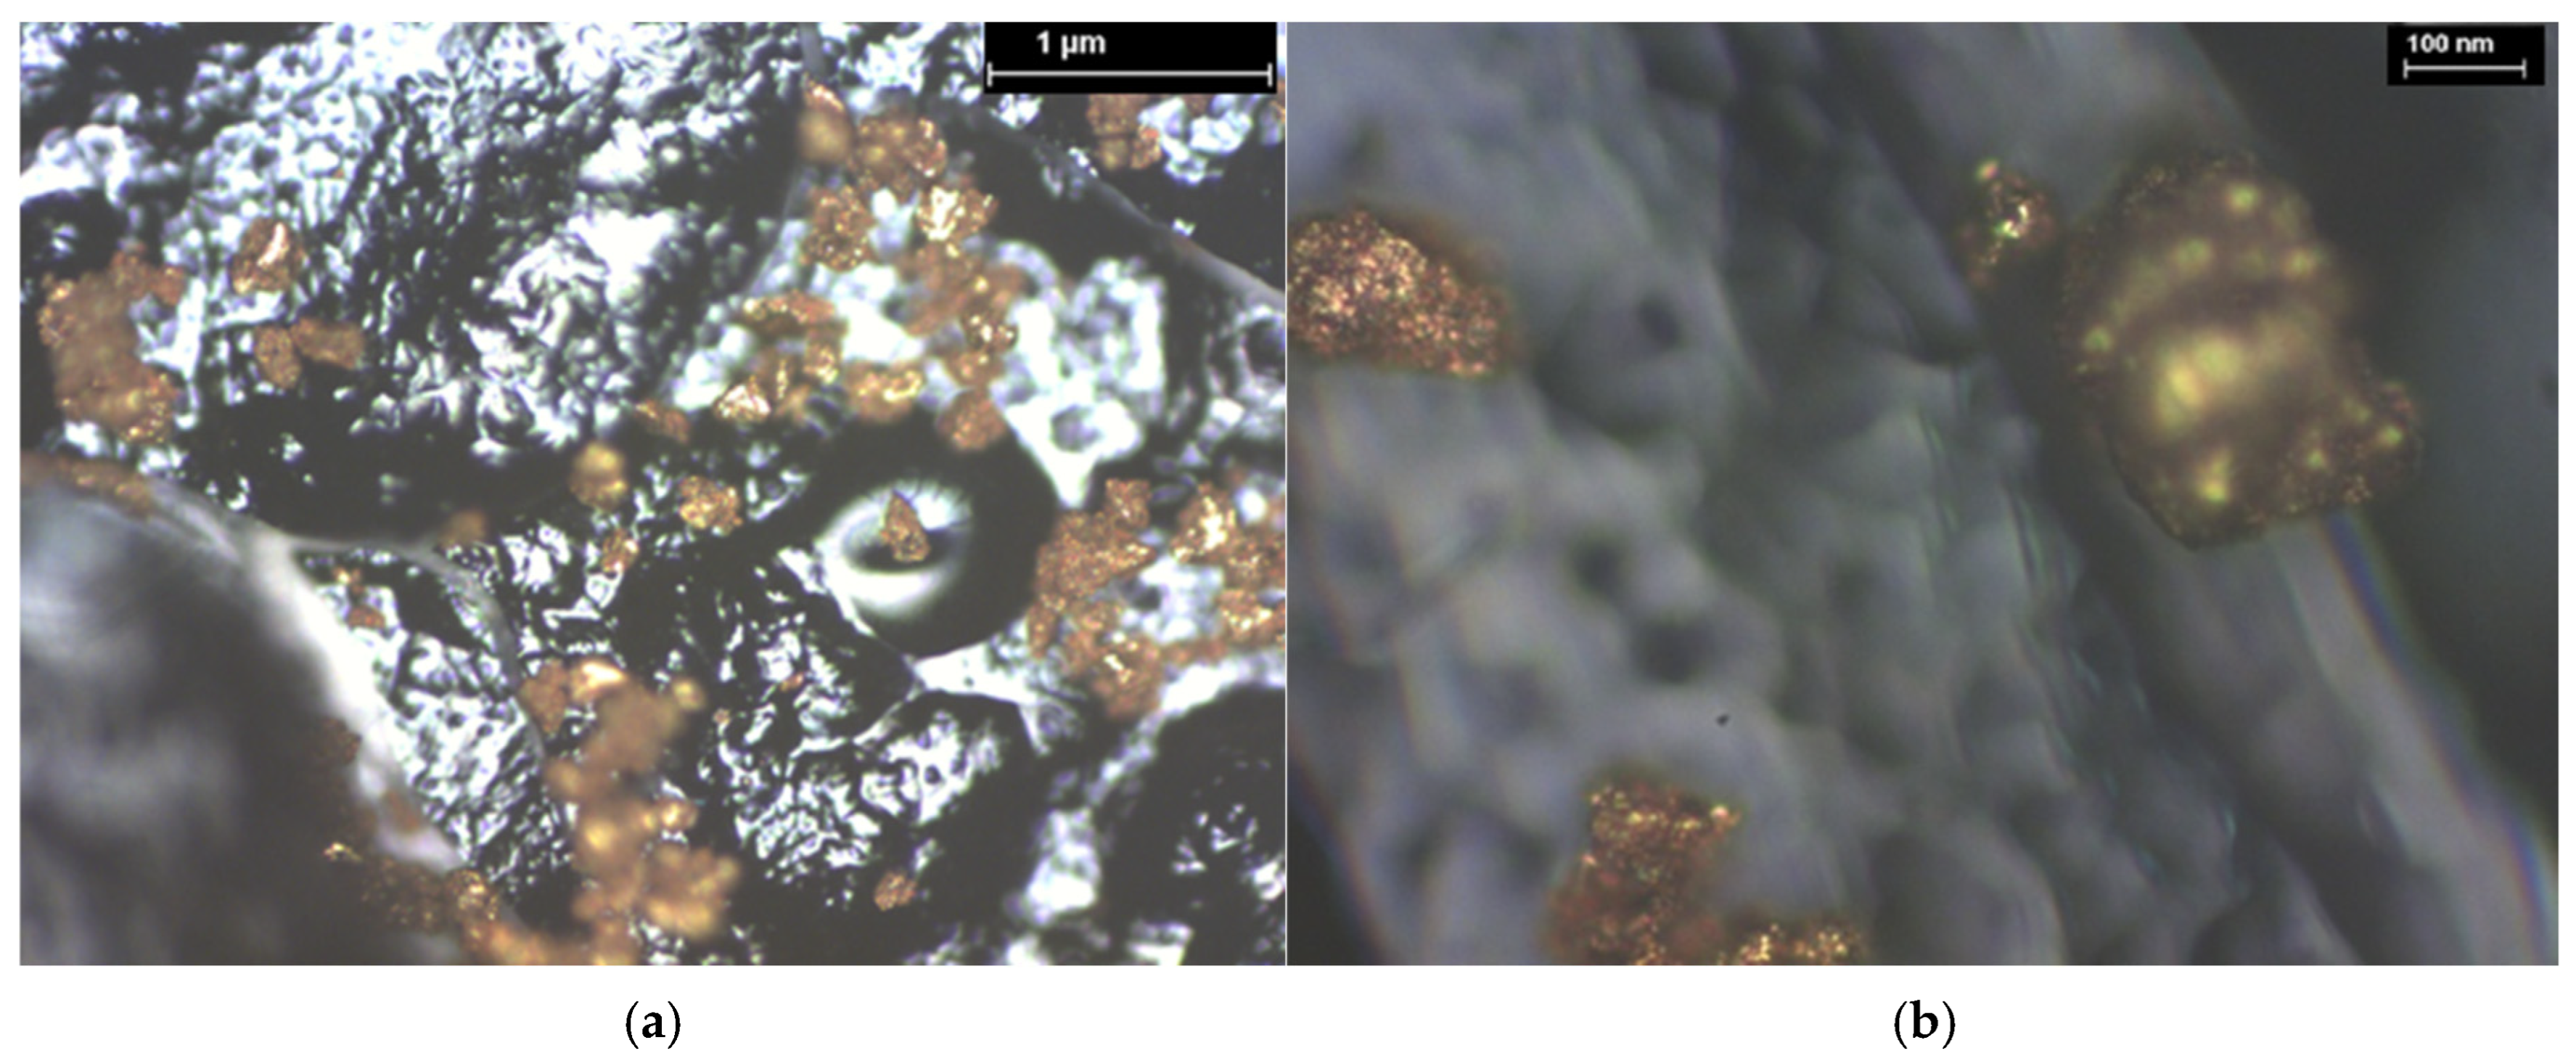
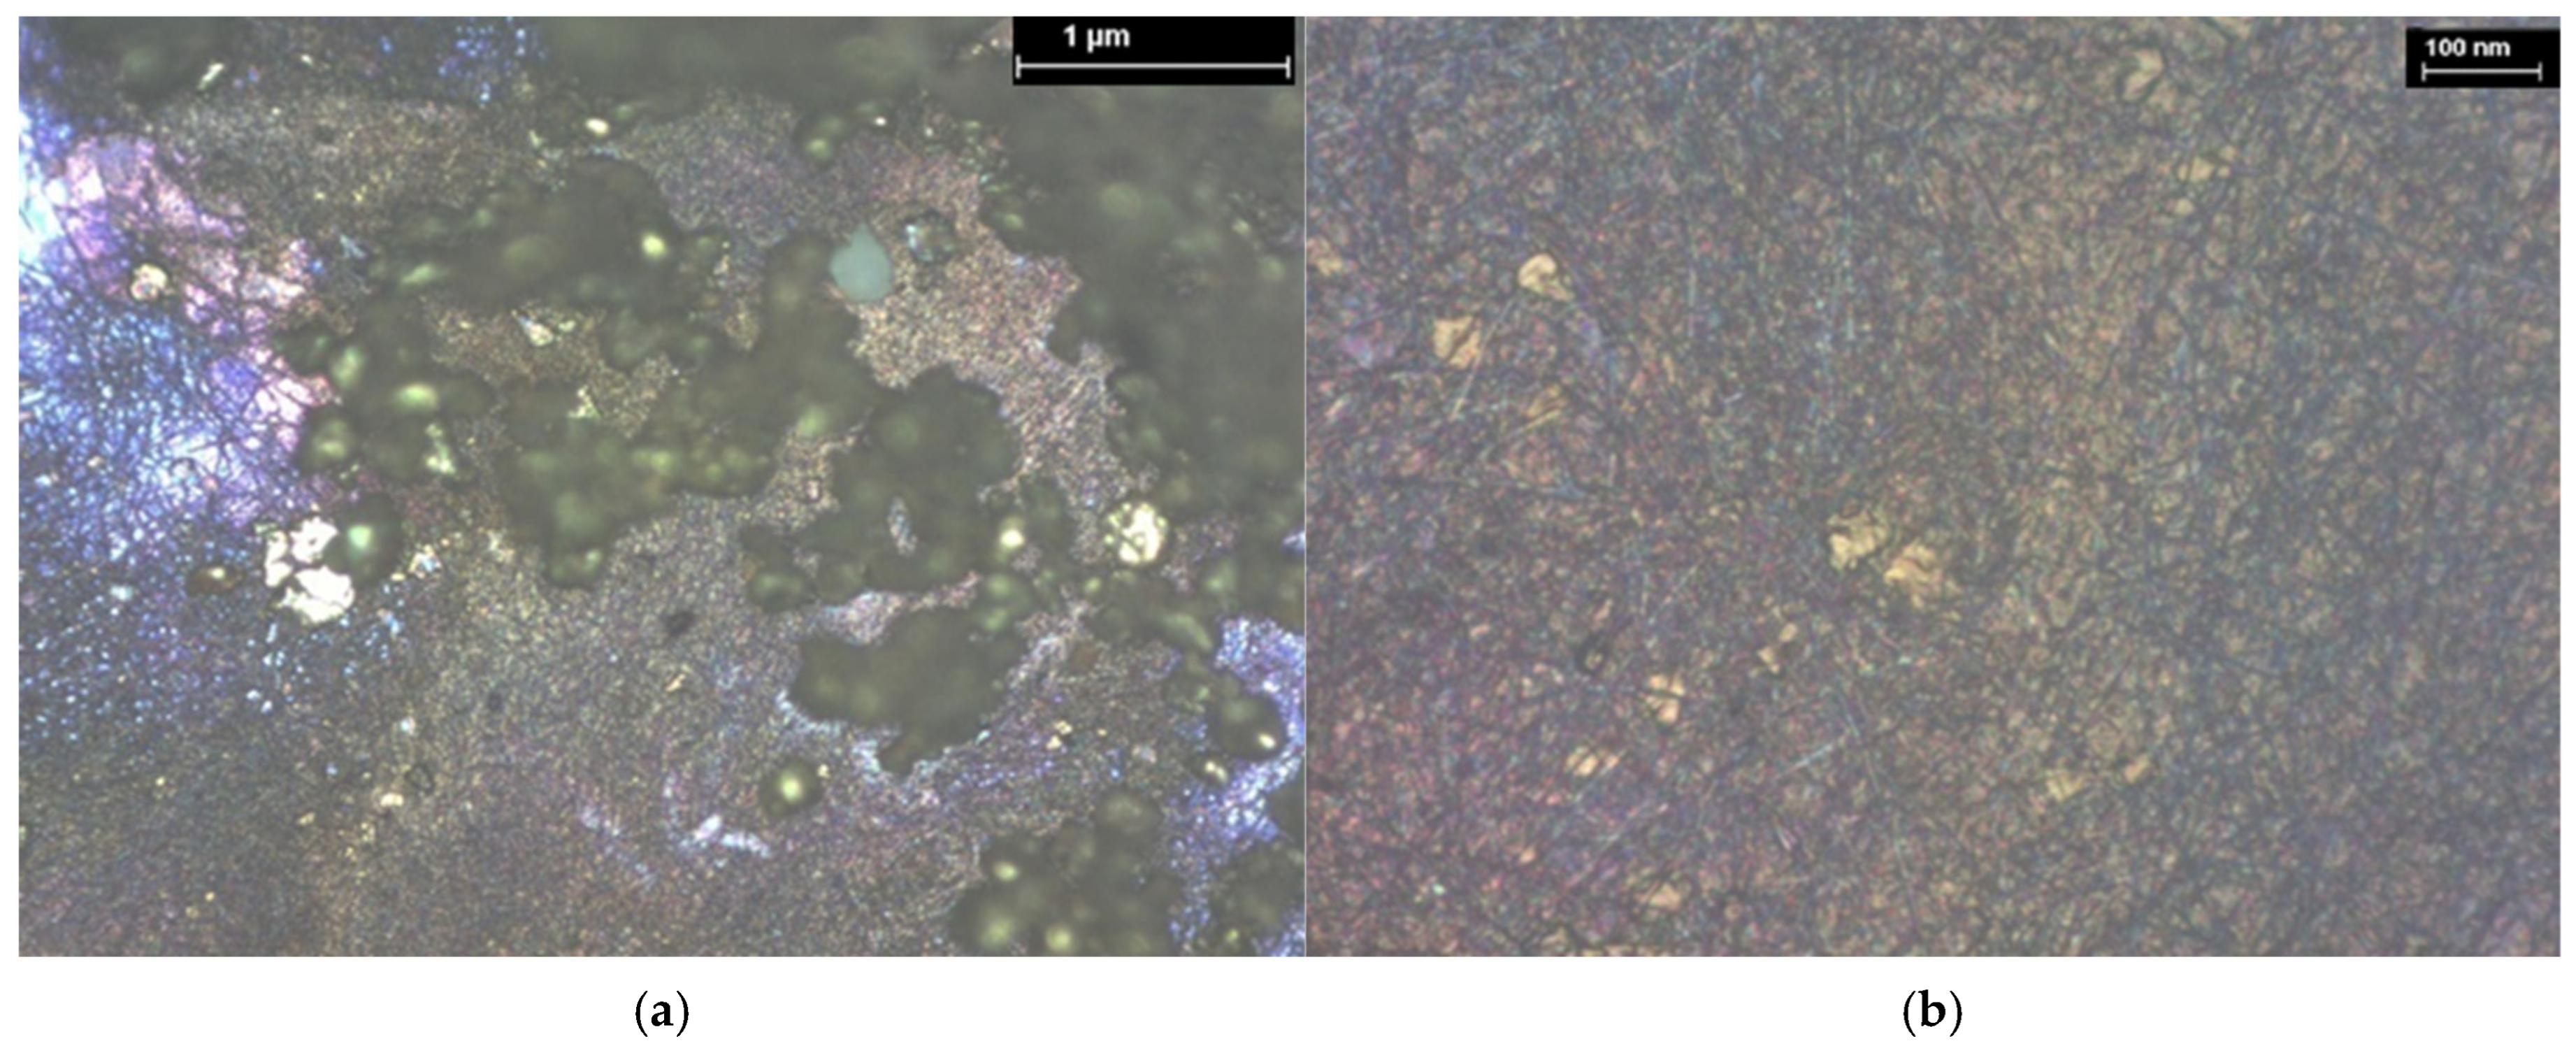
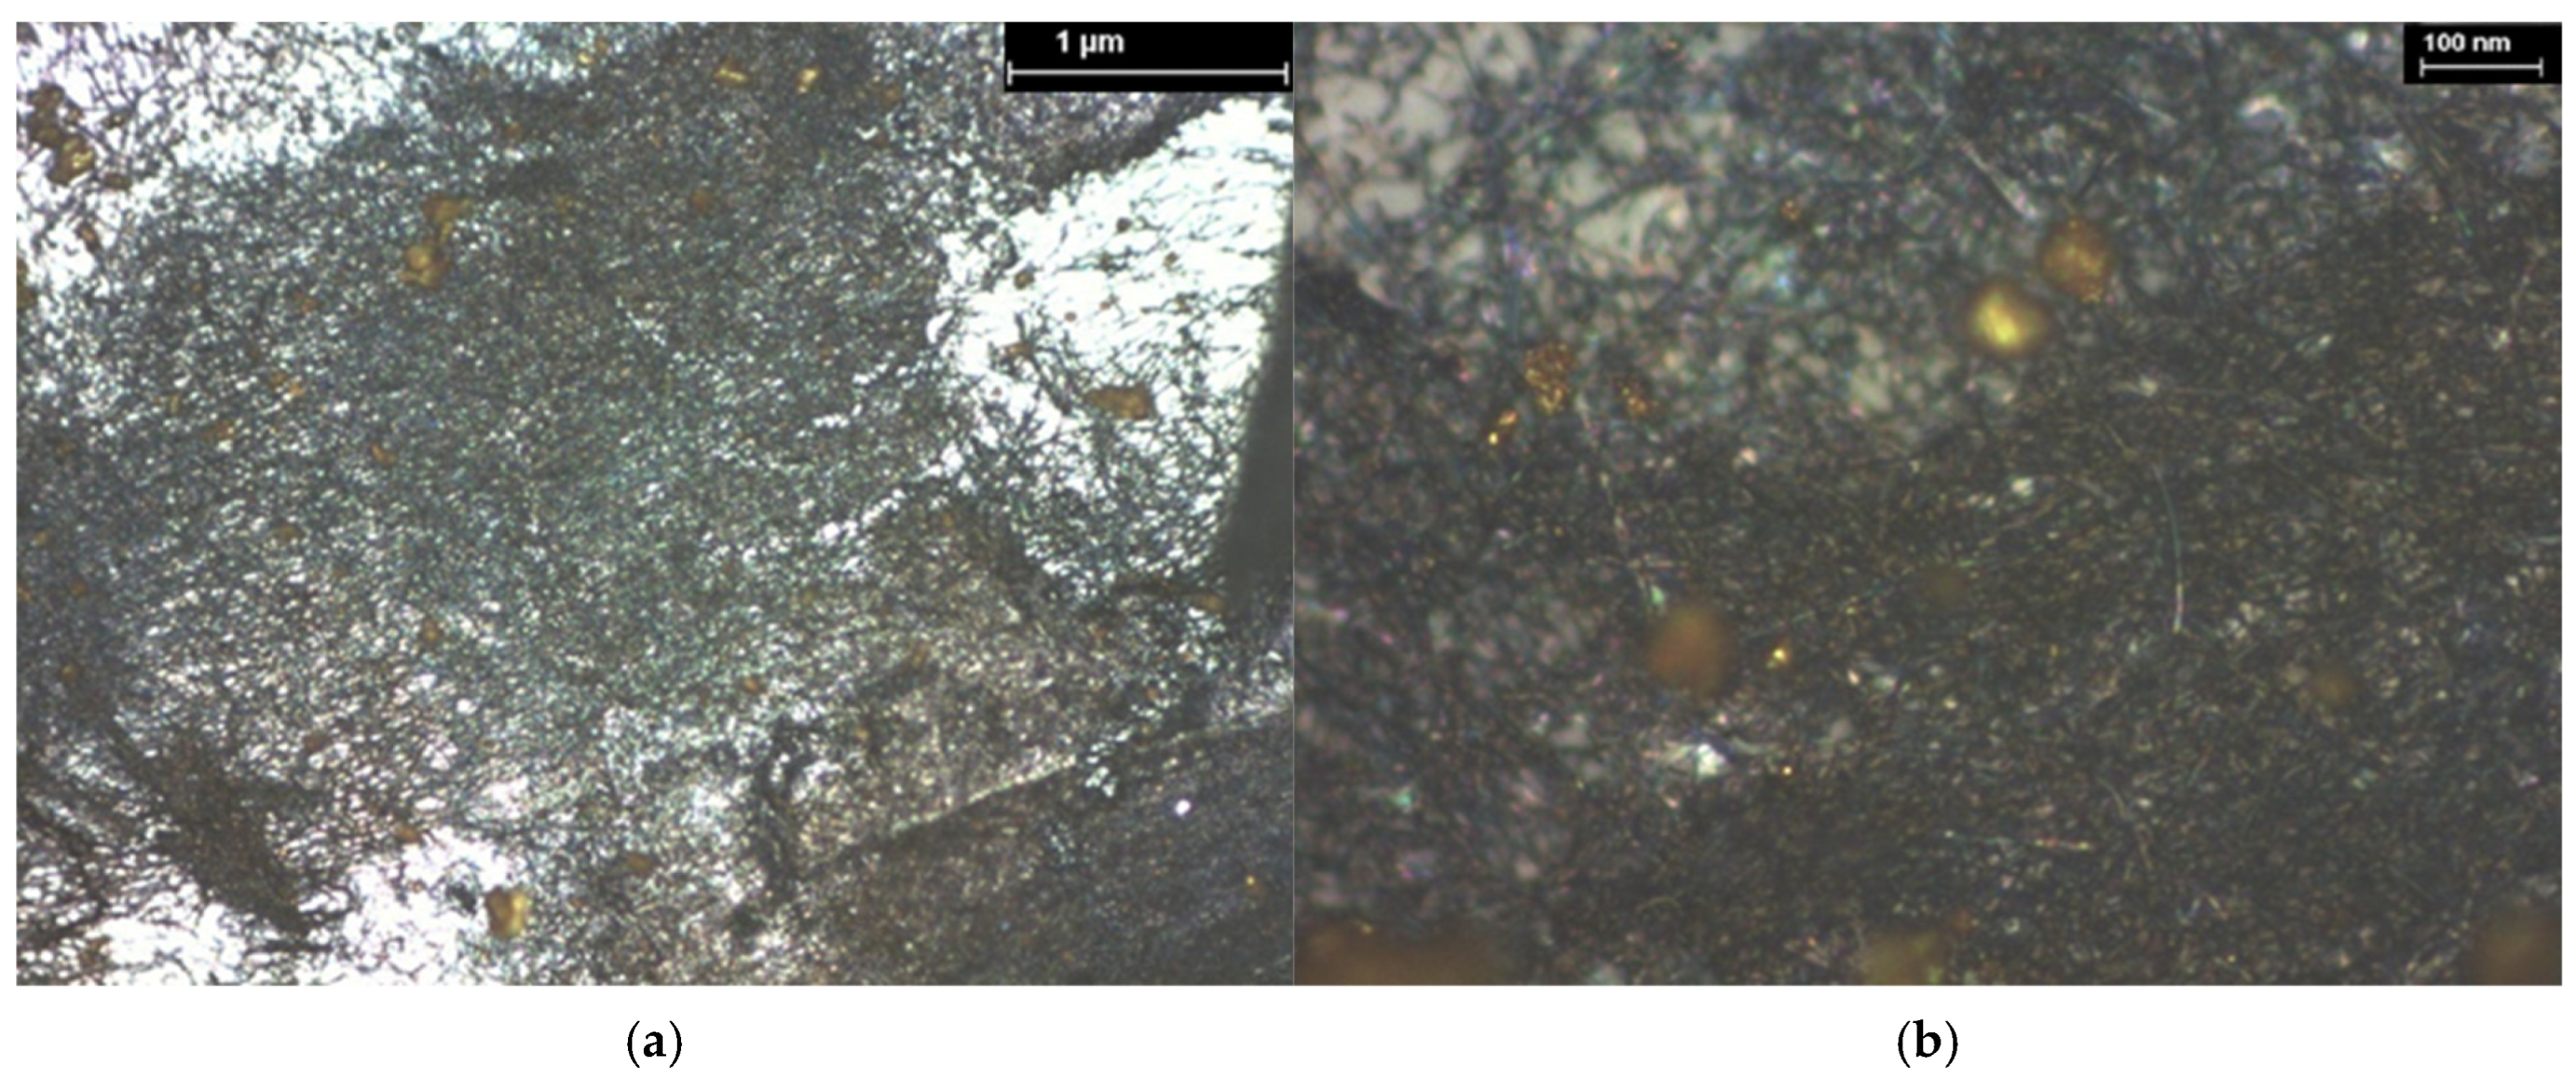
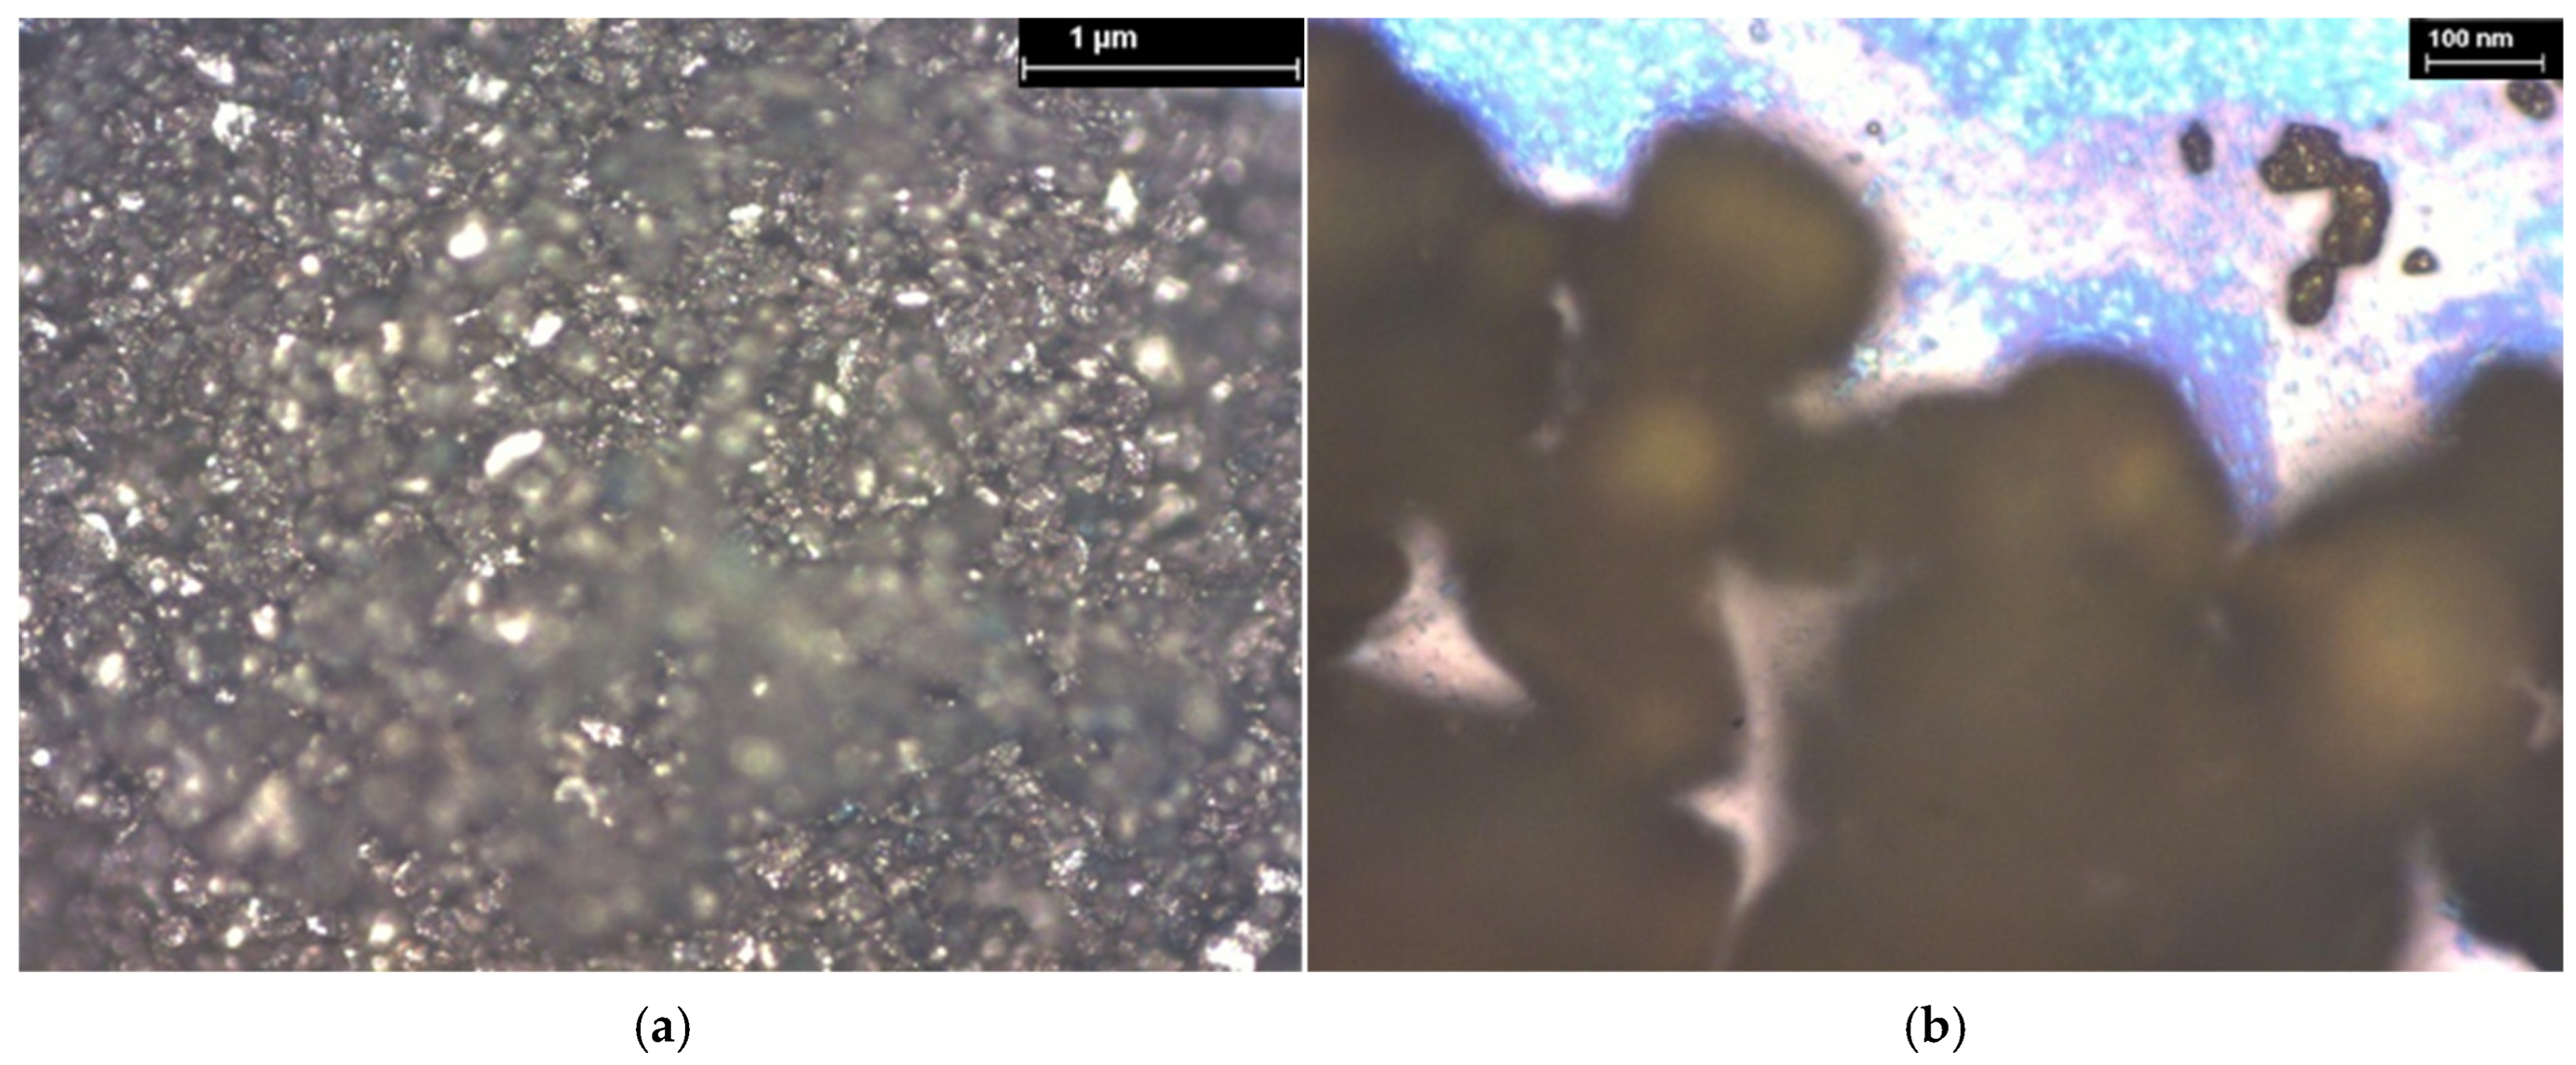
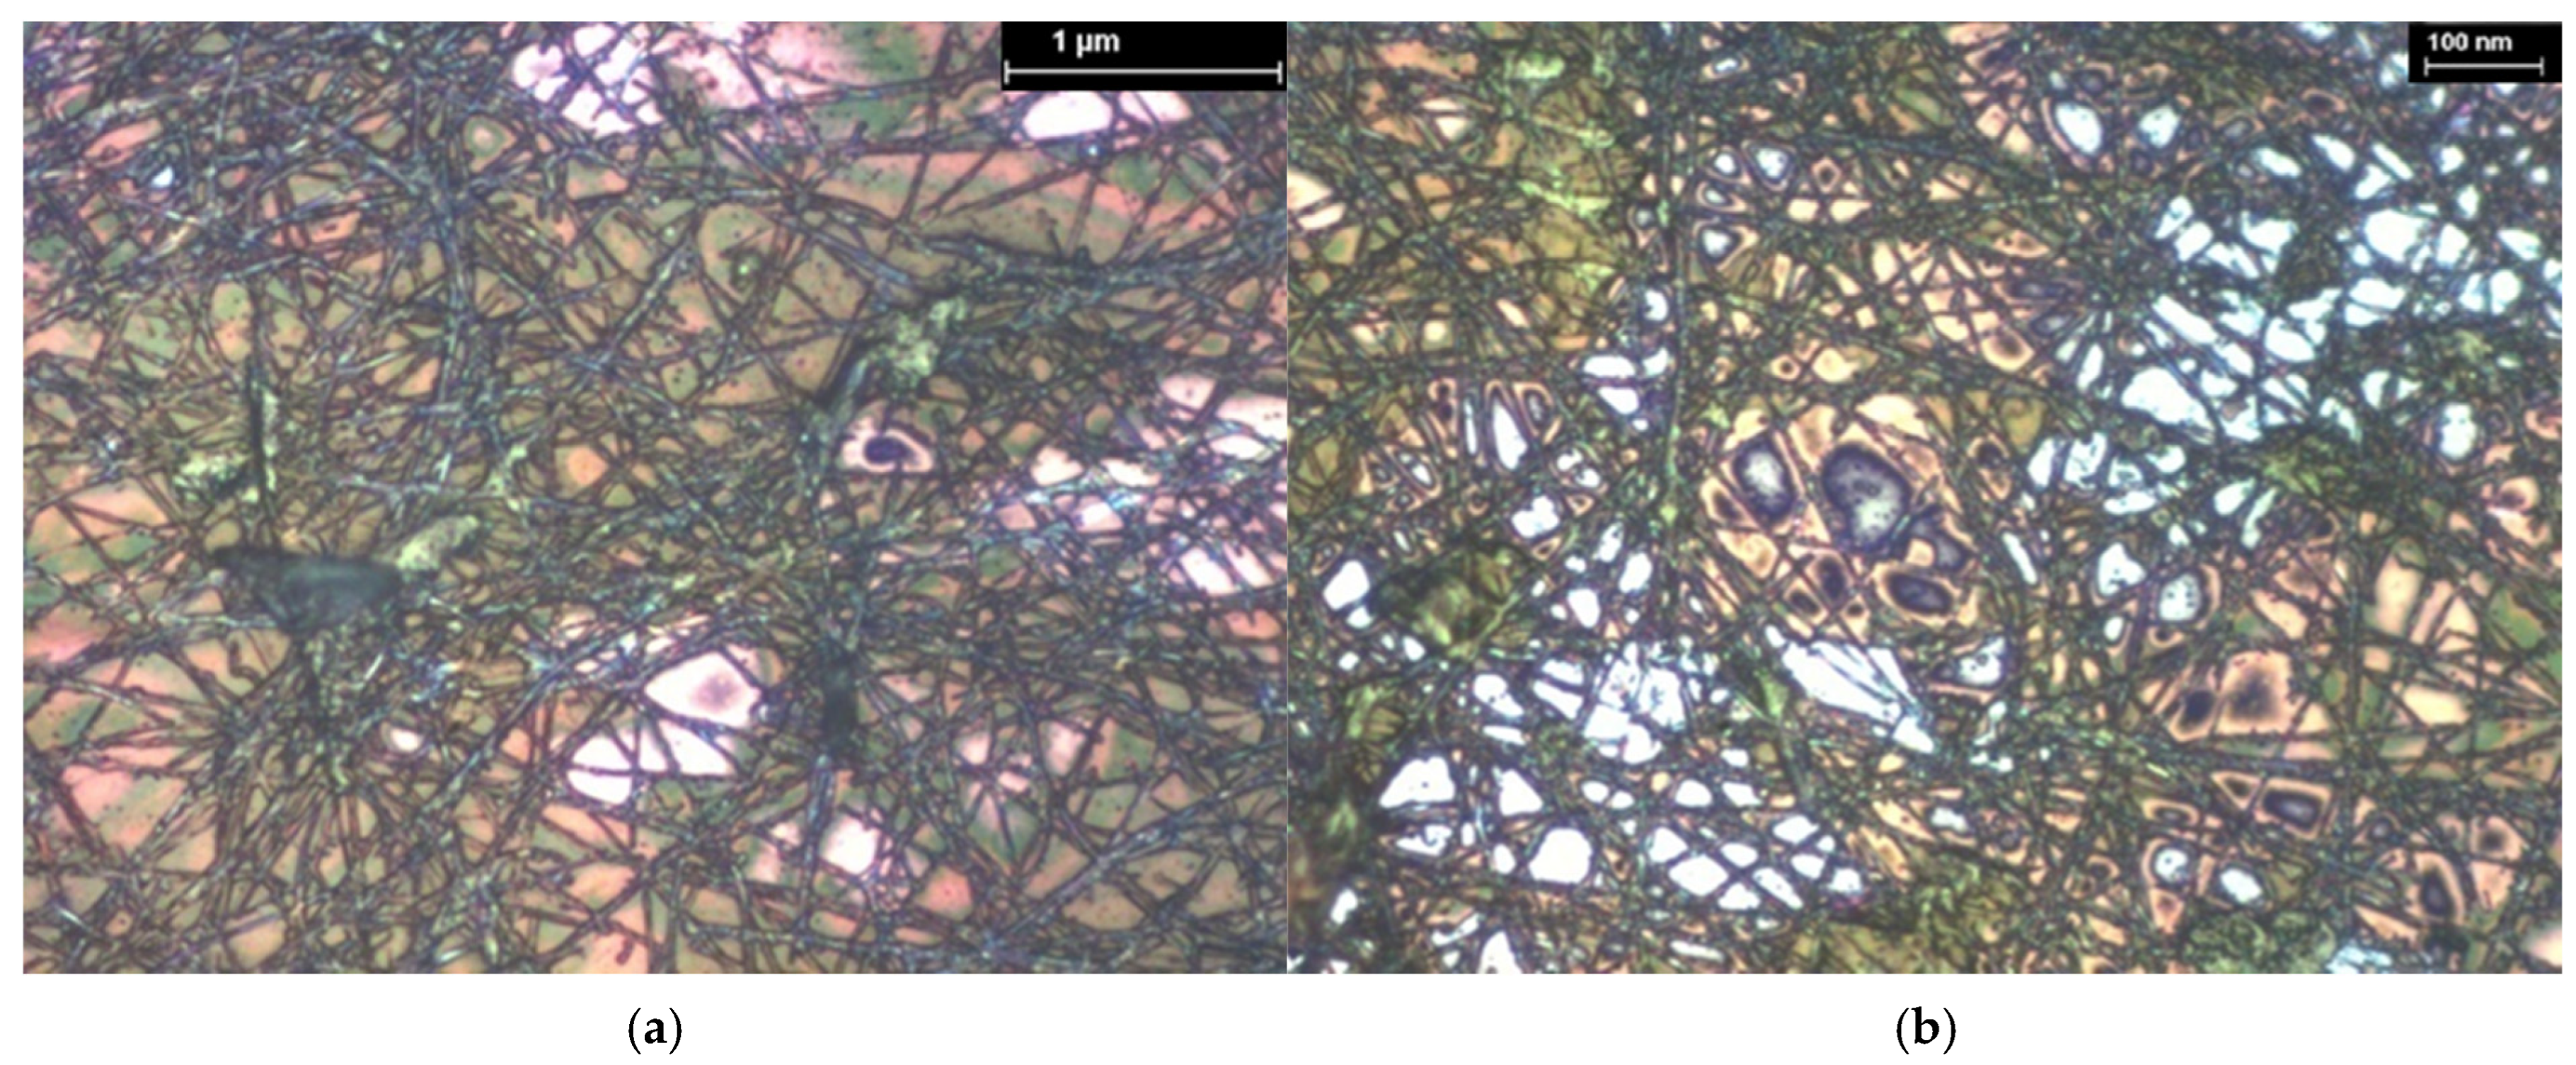
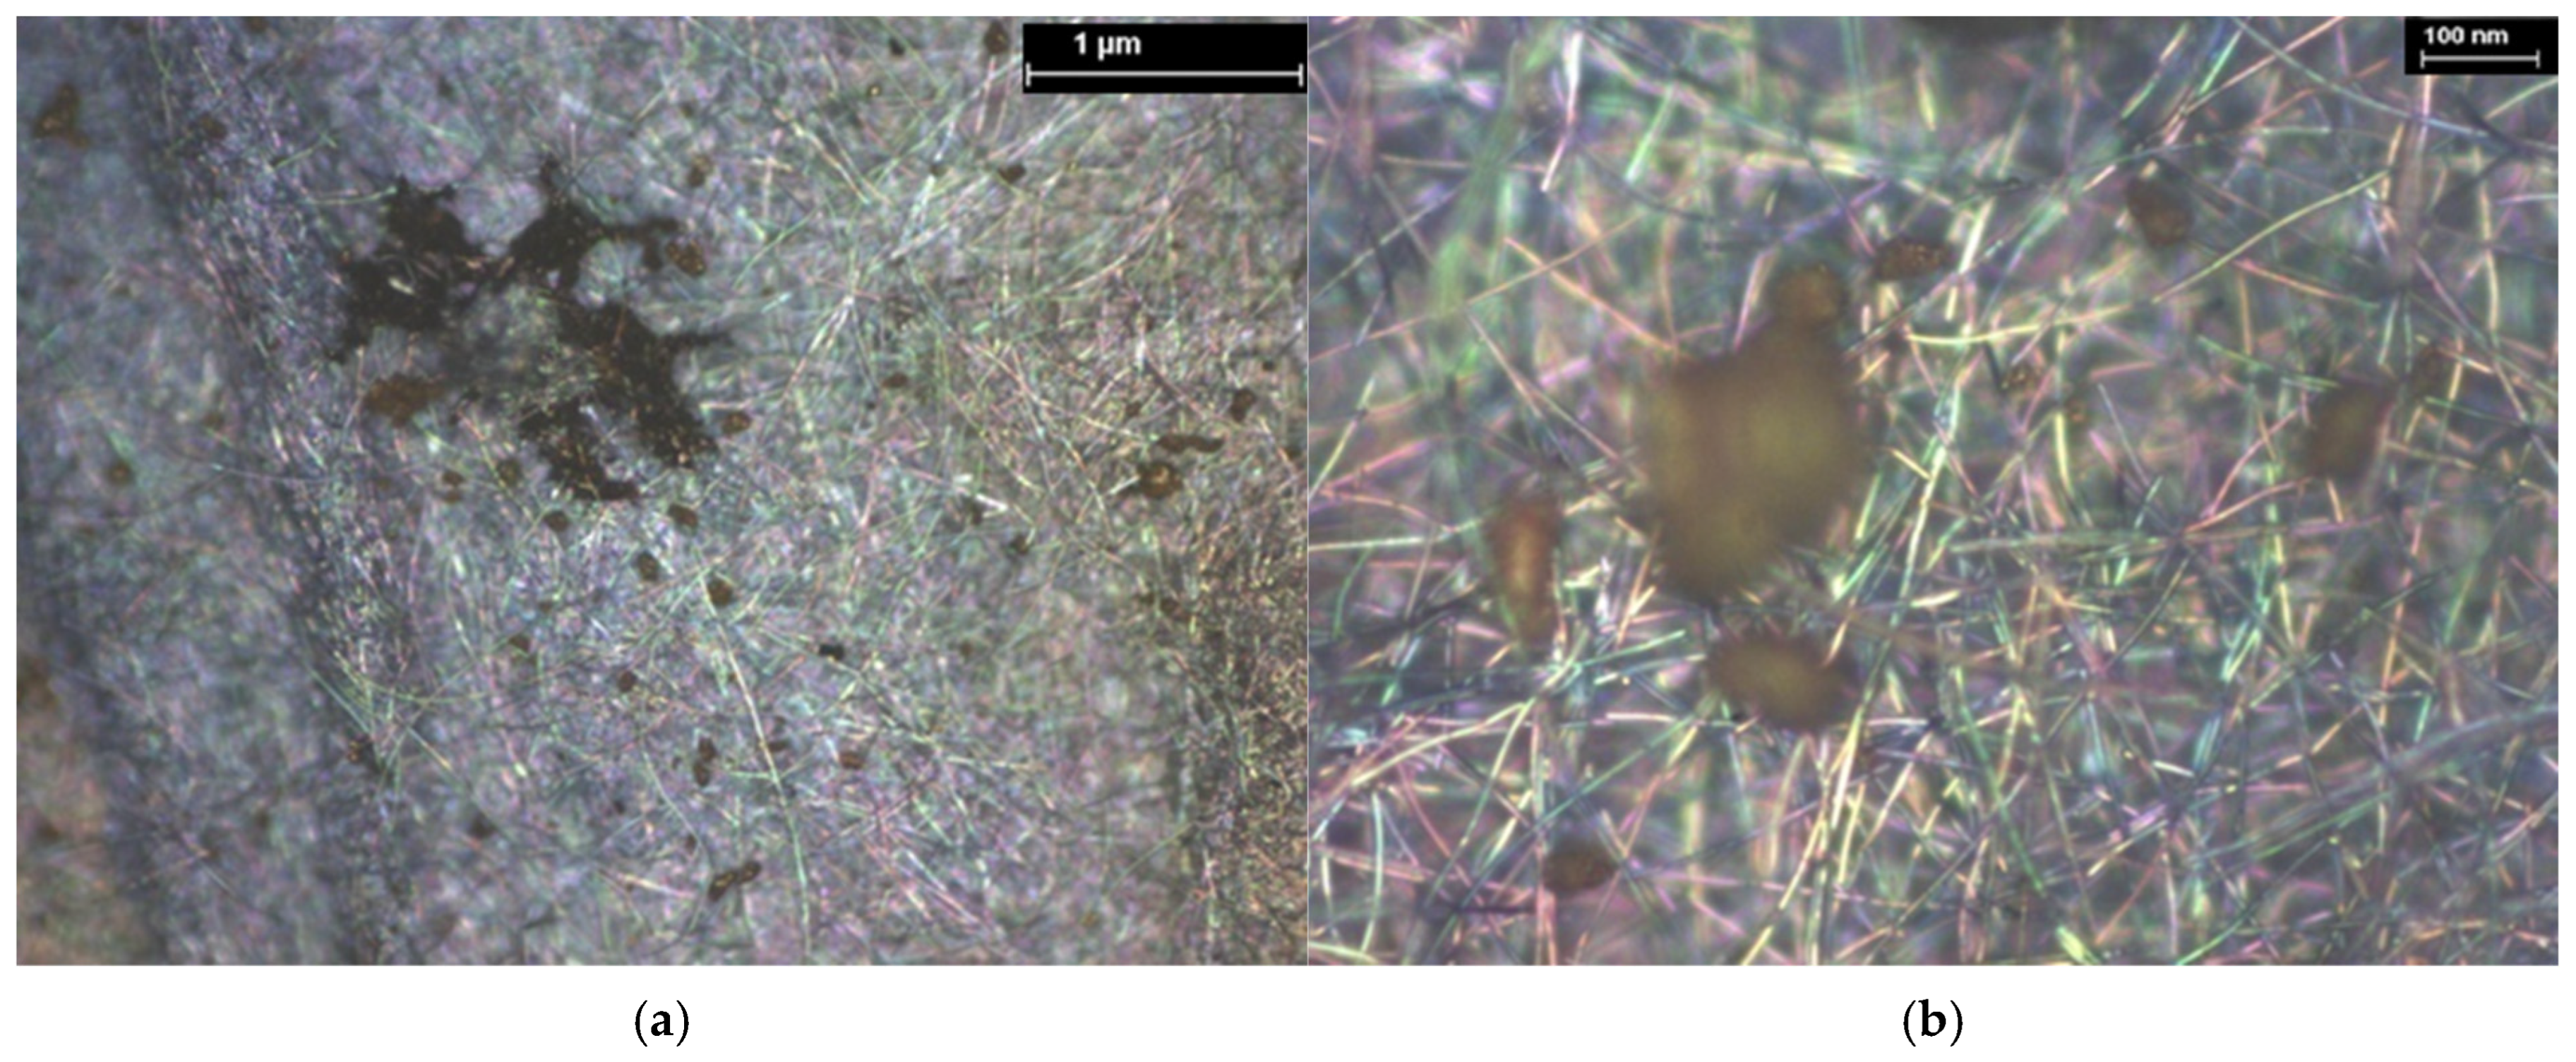
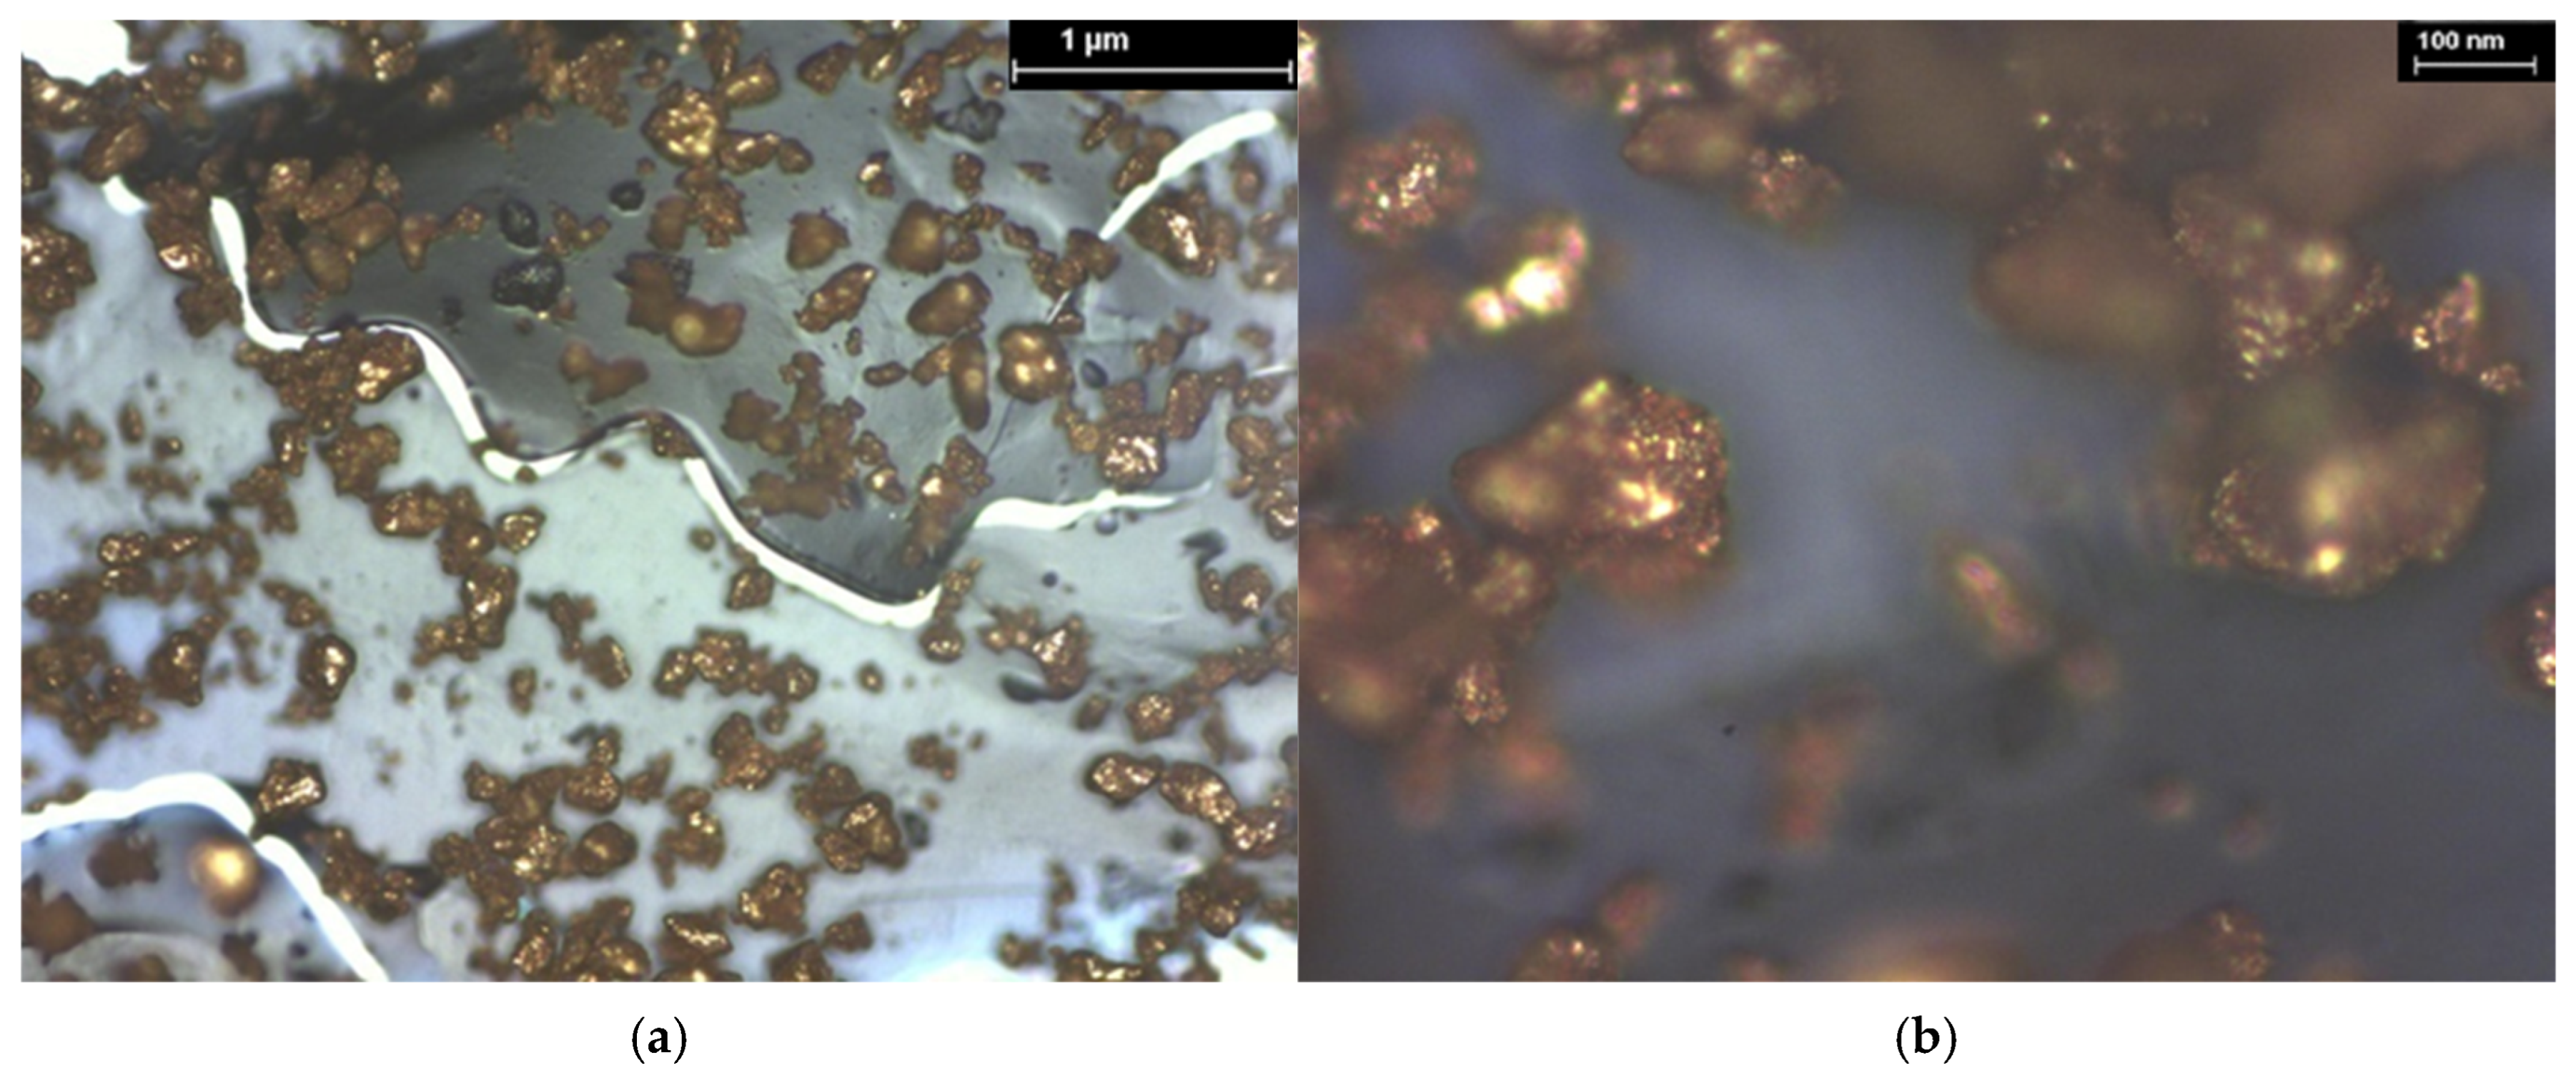
The optical analysis was performed up to 100 nm size, and the individual particles of gold can be easily identified as dispersion and dimensions, in most cases confirming their individual dimensions of 100 nm. It is clear that gold was deposited in both nanoparticles and clusters, affected by the affinity of the polymer used as a deposition support and also related to the spatial structure of a ceramic nanotube–conductor polymer before being subjected to coverage with Au nanoparticles by the dip-coating method.
It should be noted that in the case of the optical analysis at 100× and 500×, specifically the images shown in Figure 20, Figure 21, Figure 22, Figure 23, Figure 24, Figure 25, Figure 26, Figure 27, Figure 28, Figure 29, Figure 30 and Figure 31, these images completely validate the technical discussion presented in the SEM images of homologous structures shown in Figure 7, Figure 8, Figure 9, Figure 10, Figure 11, Figure 12, Figure 13, Figure 14, Figure 15, Figure 16, Figure 17 and Figure 18, regarding the formation and distribution of nanoparticles on the surfaces of the composites.
As regards the profile lines of TiO2/PANI:EB composites with Au, shown in Figure 32 [46], the formation of layers is predominantly characterized by peaks and not by valleys, demonstrated also by the Rsk value; the Rku value is close to 3, indicating an almost Gaussian distribution of the grains. The grain size is exceptionally large, at about 3.7 μm.
As regards the profile lines of TiO2/PEDOT:PSS composites with Au, shown in Figure 33 [46], the formation of layers is predominantly characterized by large valleys and fewer peaks. The Rsk value increases beyond 4, indicating a distinct asymmetry, and indicating that the inclusion of gold nanoparticles in the clusters significantly changes the initial structure. The size of the granules is very low, at about 0.6 μm, which raises doubts about the effectiveness of such a structure for detection applications.
As regards the profile lines of TiO2/P3HT composites with Au, shown in Figure 34 [46], the grains are generally arranged in smaller clusters, and the formation of layers is predominantly characterized by peaks and not by valleys (Rsk = 0.42); the Rku values remained near 3, indicating that the grain distribution is symmetrical.
In the case of Al2O3 PANI:EB composites with Au, shown in Figure 35, the structure resembles that of TiO2/PANI:EB composites with Au, but the Rsk value is reduced, which means a balance between peaks and valleys.
The Rku value is close to 3, indicating an almost Gaussian distribution of the grains. The grain size is remarkably large, at about 4.1 μm.
In the case of Al2O3/PEDOT:PSS composites with Au, shown in Figure 36, the surface architecture resembles that of TiO2/PEDOT:PSS composites with Au. The formation of layers presents larger valleys and shorter peaks, of about 0.51 μm; the Rku value exceeds 3, indicating a beginning of asymmetry.
As regards the architecture of Al2O3/P3HT composites with Au, shown in Figure 37, small, but very crowded peaks are obtained, of about 0.62 μm. Their distribution has highlighted a balance between peaks and valleys (RSK near zero), remaining uniform despite the larger roughness (the RKU parameter is close to 3).
The topography of Y2O3/PANI:EB composites with Au is presented in Figure 38. Both Rku and Rsk are higher, indicating the formation of layers with larger valleys and irregular peaks, with a clear asymmetry. Although the architecture seems chaotic, the size of the granules, of about 2.1 μm, encourages us to consider this structure to still be suitable for detection applications.
As regards the architecture of Y2O3/PEDOT:PSS with Au, shown in Figure 39, we observed the creation of layers that have chaotic dimensions and the spread of peaks and valleys, a fact also demonstrated by the significantly increased values of RKU and RSK. The unique presence of certain peaks with higher values, such as 1.9 μm, does not indicate an advantage when taking into account increased asymmetry.
As regards the architecture of Y2O3/P3HT composites with Au, shown in Figure 40, it resembles that of Y2O3/PEDOT:PSS with Au. We observed the creation of layers that have chaotic dimensions of narrower peaks and valleys, which was demonstrated by the much higher values of RKU and RSK. In conclusion, the composites made up of Y2O3 nanotubes, regardless of the conductive polymer used, despite their exotic presence, do not offer the essential properties for an efficient electrode, first of all because of their accentuated asymmetry.
As regards the topography of ZnO/PANI:EB composites with Au, shown in Figure 41 it resembles that of Y2O3/PANI:EB composites with Au. Both Rku and Rsk are higher, indicating the formation of layers with irregular tips and valleys, with a clear asymmetry. Although the architecture seems disorganized, the existence of a substantial number of high peaks, with a notable size of the granules of about 5.1 μm, motivates us to consider this framework to still be suitable for sensing applications.
As regards the architecture of ZnO/PEDOT:PSS composites with Au, shown in Figure 42, it resembles that of Al2O3/P3HT composites with Au, presenting very crowded, irregular peaks, separated by very narrow valleys. The RKU and RSK values are both raised. There are still a few granules with a size of 1.7 μm, but not enough to justify the use of this structure for detection purposes.
Finally, the architecture of ZnO/P3HT composites with Au is presented in Figure 43. There are significant grains of larger size, of 4.5 μm. The Rku value is slightly negative, confirming the presence of the balance between the narrow peaks and larger valleys. The Rku value is close to 3, indicating an almost Gaussian distribution of the grains.
In summary, the composites created from ZnO nanotubes, irrespective of the conducting polymer used, could offer the necessary characteristics for a highly effective electrode, mainly due to their reasonable symmetry and higher grain values, presenting an almost Gaussian distribution.
Table 3 presents a comparison of the roughness parameters of the composites with gold nanoparticles discussed above and those before incorporating gold nanoparticles by the immersion coverage method, in accordance with the results presented in [46,47] for different ceramic nanotubes while using the same polymers.
According to the explanations offered in [45], the ideal values in our scenario would be, preferably, RA > 400 nm to ensure a better fixation of the target molecules, RSK > 0, but not excessively high, ideally below 0.5 for a reasonable acuity of the peaks and valleys, and RKU around 3, to provide a dense structure (almost Gaussian distribution). When comparing the roughness parameters obtained from the AFM composite lines before and after incorporating the gold nanoparticles, in Table 2, it was constantly observed that there is a relatively uniform distribution of granules.
However, the addition of gold nanoparticles changes the structure of the surface and forces the original granules to form spaces that allow the gold particles to penetrate deeper and accumulate in small groups, which leads to a slight increase in the size of the granules (higher Ra values) and to a local sharpening of the peaks (increased RSK values). In many cases, the shape of the peaks compared to that of the valleys is improved by narrowing the RKU value to about 3, indicating a transition from a random distribution to an almost Gaussian granule distribution, confirming that the presence of metal nanoparticles contributes to the uniformity of structures.
In our scenario, the optimal structures regarding the ideal roughness parameters are TiO2 nanotubes—PANI:EB/Au; TiO2 nanotubes—P3HT/Au; Al2O3 nanotubes—PANI:EB/Au; Y2O3 nanotubes—PANI:EB/Au; ZnO nanotubes—PANI:EB/Au; and ZnO nanotubes—P3HT/Au. The greatest Ra value was attained in order by ZnO nanotubes—PANI:EB/Au; ZnO nanotubes—P3HT/Au; and finally, TiO2 nanotubes—PANI:EB/Au. It seems that the disposition of the nanotubes of ZnO within composites results in the highest Ra values, followed by Al2O3 nanotubes. As for conductive polymers’ contribution, PANI:EB showed the greatest significance for all composites, with P3HT being relevant in some other instances. In the particular situation of the PANI:EB polymer, although the incorporation of gold nanoparticles may not be particularly significant, such as in relation with Al2O3, Y2O3, and ZnO (according to SEM images and the interpretation in Table 1 and Table 2), their presence greatly improves the surface structure of materials. Given the conditions regarding the surface architecture, the use of PEDOT:PSS for detection electrodes is not recommended, even if, in some cases, the inclusion of gold nanoparticles together with, for example, Al2O3 and ZnO could be relevant, but without great improvement.
In applications that involve electrochemical reactions, the area responsible for transferring charge from species in solution is the crucial factor, and this is why AFM analysis may be more relevant than EDS or SEM analysis. This is based on the efficiency with which the electrolyte reaches the pores and is affected by the texture of the surface. The region available for an electrochemical reaction, the EASA, frequently varies with the geometric surface area, and the ratio between them is called “electrochemical roughness”. However, comparing porous electrodes is not a simple task. In fact, from a practical perspective, increasing the surface of the electrode to increase the current density is a typical method of increasing the general density of the current or, in other words, the activity of the electrode. Consequently, establishing the EASA or, more generally, connecting slightly quantifiable parameters (such as peak shape, surface geometry) to the performance of the electrode would allow the systematic design of surfaces with specific characteristics.
Regardless of the theoretical approach to calculate the EASA [44], the values given in Table 1 for the roughness parameters determined by the AFM lines produce the optimal surface under the experimental conditions described above and can be verified by any calculation method.
It should be emphasized that the EASA can be evaluated qualitatively by taking into account the roughness of the anterior presented electrodes. However, it can often be identified by alternative methods, based, e.g., on roughness approaches [53]. Another related method is the capacity of the double layer, obtained from the slope of a current graph according to the scan speed and then divided by the capacity per surface unit [54,55]. However, this approach is recognized for the significant inaccuracies it causes. An alternative approach is the spectroscopy of the electrochemical impedance, used to measure the capacity on the surface unit and, subsequently, to evaluate the capacity of the double layer [56,57]. It is essential to emphasize that each electrical component must have a physical significance, and in reality, the behavior of the double layer is not perfect.
Conversely, the integration of redox peaks can also be used to evaluate the surface of the electrode [50,51,52,53,54,55,56,57,58,59,60]. It is important to note that the ability obtained from galvanostatic loading and cyclical voltammetry experiments is called whole capacity, while the capacity obtained from impedance spectroscopy measurements is known as differential capacity. Specifically, the cathodic and anodic peaks correspond to the creation and reduction in the different reactors, and the area below these peaks is associated with the load involved in the transition. A possible source of error in this type of measurement comes from the inclusion of possible non-pharadaic or parasitic currents, as well as from the potential development of unwanted species.
In summary, the evaluation of the roughness of the electrode, as presented in this work, is essential for determining its potential electrochemical activity and serves as a reliable indicator for the EASA value. The determination of the EASA by the previously mentioned methods remains approximate, partly due to the inaccuracy of these methods and also due to the use of electrolytes that may not be relevant to the potential application of such electrolytes in the practical use of certain electrochemical sensors.
From our point of view, evaluation of the EASA by the previously mentioned methods is not relevant to sensor applications, although it could be applicable for corrosion, sources of electrochemical energy, or electrochemical synthesis. In the case of sensors, the true importance of the EASA depends on the actual use of the electrode, especially in terms of its interaction with the molecules of interest, and not as a general measurement with a regular reactive. Thus, after evaluating the architecture of the electrode surface and after choosing the optimal electrodes based on this architecture during the initial phase, the following real measurements in the cyclic voltammetry experiments can evaluate the true EASA, as well as the real functionality of the respective electrode for measuring the chosen molecules of interest.
Our research will continue in this direction, in particular by evaluating optimal structures, such as ZnO nanotubes—PANI:EB/Au, ZnO nanotubes—P3HT/Au, or TiO2 nanotubes—PANI:EB/Au, by use of cyclic voltammetry experiments, as electrochemical sensors with dedicated biomedical applications aimed at various chosen biomarkers.
This study could be relevant for the practical development of sensing areas, particularly because there are limited investigations into electrochemical nanosensors that focus on the roughness of their active surfaces, which is often treated only as a secondary analysis linked to a specific technology applied, as described in [32,33,34,35,36,37,61,62,63,64,65], with no explicit enhancement of surface roughness aimed at obtaining more sensitive measurements. Nevertheless, research studies aligned more with our approach regarding roughness analysis were linked more to the performance of optical sensors [27,29,66], where those characteristics were considered more significant. However, in none of the aforementioned cases was a detailed analysis of roughness parameters obtained through AFM lines conducted to link the roughness characteristics with the sensing capabilities.

4. Conclusions

This research presents the surface analysis of hybrid nanostructures derived from four types of ceramic nanotubes (ZnO, TiO2, Al2O3, and Y2O3) with three types of conducting polymers: poly(3-hexylthiophene), polyani-line emeraldine-base (PANI:EB), and poly(3, 4-ethylenedioxythiophene)-polystyrene sulfonate, with embedded Au nanoparticles. The method for manufacturing ceramic nanotubes followed three stages: manufacturing of polymer fiber networks with poly(methyl methacrylate), applying ceramic coatings onto the nanofiber networks via magnetron deposition, and heating the nanotubes to 600 °C to eliminate the polymer support. Hybrid nanostructures from ceramic nanotubes and conducting polymers were further obtained by drop-casting. Finally, the gold nanoparticles were embedded within a ceramic nanotube–conductive polymer composite, utilizing a dip-coating technique with a diluted HAuCl4/2-propanol solution (0.001 M) followed by controlled heating, which represents a novelty in the domain of nanosensor development.
It is usually believed that placing gold nanoparticles on composite locations can mainly be affected by the type of polymer and its positioning on ceramic nanotubes. However, when the incorporation of gold nanoparticles into conductive polymers with ceramic nanotubes through EDS and SEM is evaluated, it is clear that the relationship between gold and polymer structures differs greatly, contrary to assumptions, and the gold nanotubes and the surface structure are significantly influenced by the ceramic nanotubes.
However, the ideal positioning of gold nanoparticles on the surfaces of ceramic nanotubes and their concentration are essential factors for increasing the sensitivity of the material in order for it to be used in sensory applications. This effect must be amplified by the specific structure of the surface of the material, evaluated by AFM analysis. The AFM analysis highlighted the characteristics of the roughness of the surfaces of the different structures, eventually determining which materials could be the most suitable options for electrochemical electrodes due to their optimal surface structure. It has been shown that the addition of gold nanoparticles changes the structure of the surface and forces the granulations inherent in the ceramic–polymer composites to form gaps that allow the particles to advance deeper and to aggregate in small groups, leading to a slight increase in the granulation and to a localized intensification. The evaluation of roughness has mainly focused on the higher peaks in relation to the valleys to recognize a Gaussian distribution. In our case, the optimal structures have been designated, e.g., ZnO nanotubes—PANI:EB/Au, ZnO nanotubes—P3HT/Au, or TiO2 nanotubes—PANI:EB/Au, which will be tested further by use of cyclic voltammetry experiments, as electrochemical sensors with dedicated biomedical applications for various chosen biomarkers.
The evaluation of electrode roughness, as presented in this work, is essential for determining its potential electrochemical activity. We consider that the EASA evaluation using the conventional methods described in the specialized literature is not applicable for sensor design. Thus, an initial comprehensive evaluation of the electrode surface structure is recommended, selecting the best electrodes based on this design, and further information gathered from cyclic voltammetry will ultimately confirm the accurate EASA and the genuine effectiveness of the respective electrode in detecting the target molecules.

Supplementary Materials

The following supporting information can be downloaded at https://www.mdpi.com/article/10.3390/coatings15101211/s1, Figure S1: XPS analysis of TiO2 nanotube composites with (a) PANI:EB, (b) PEDOT:PSS, and (c) P3HT [46]. Figure S2: XPS analysis of Al2O3 nanotube composites with (a) PANI:EB, (b) PEDOT:PSS, and (c) P3HT [47]. Figure S3: XPS analysis of ZnO nanotube composites with (a) PANI:EB, (b) PEDOT:PSS, and (c) P3HT [47].

Author Contributions

Conceptualization, R.C.C., A.F.T. and O.D.S.; methodology, R.C.C. and A.F.T.; validation, R.C.C. and A.F.T.; formal analysis, A.F.T., O.D.S. and R.C.C.; investigation, R.C.C., A.F.T. and O.D.S.; data curation, R.C.C. and A.F.T.; writing—original draft preparation, A.F.T. and R.C.C.; writing—review and editing, R.C.C.; visualization, R.C.C. and A.F.T.; supervision, A.F.T. and R.C.C. All authors have read and agreed to the published version of the manuscript.

Funding

This research received no external funding.

Institutional Review Board Statement

Not applicable.

Informed Consent Statement

Not applicable.

Data Availability Statement

Data are contained within the article.

Conflicts of Interest

The authors declare no conflicts of interest.

References

  1. Baranwal, J.; Barse, B.; Gatto, G.; Broncova, G.; Kumar, A. Electrochemical Sensors and Their Applications: A Review. Chemosensors 2022, 10, 363. [Google Scholar] [CrossRef]
  2. Iacob Dinu, I.; Constantin, A.; Apetrei, C. Development of Polypyrrole Modified Screen-Printed Carbon Electrode Based Sensors for Determination of L-Tyrosine in Pharmaceutical Products. J. Mol. Sci. 2021, 22, 7528. [Google Scholar] [CrossRef]
  3. Zhiyang, L.Z.; Leung, C.; Gao, F.; Gu, Z. Effects of Nanowire Length and Surface Roughness on the Electrochemical Sensor Properties of Nafion-Free, Vertically Aligned Pt Nanowire Array Electrodes. Sensors 2015, 15, 22473–22489. [Google Scholar] [CrossRef]
  4. Miller, C.; Keattch, O.; Shergill, R.; Patel, B. Evaluating diverse electrode surface patterns of 3D printed carbon thermoplastic electrochemical sensors. Analyst 2024, 149, 1502–1508. [Google Scholar] [CrossRef]
  5. Kılıç, Y.; Manickham, P.; Bhansali, S. Brief Fine Polishing of Thin-film Gold Electrode Sensors Leads to Better Reproducibility than Electrochemical Pretreatment. Int. J. Electrochem. Sci. 2020, 15, 5067–5075. [Google Scholar] [CrossRef]
  6. Sarmphim, P.; Teeparuksapun, K.; Wunsri, S.; Sorngodchagorn, S.; Duangsiri, W.; Tapparak, P.; Sirisathitkul, C. Facile Fabrication of Screen-Printed Carbon Electrodes for Electrochemical Sensors. Int. J. Nanoelectron. Mater. 2021, 14, 1–10. Available online: https://ijneam.unimap.edu.my/index.php/vol-14-no-1-january-2021 (accessed on 17 July 2025).
  7. González-Martínez, E.; Saem, S.; Beganovic, N.; Moran-Mirabal, J. Electrochemical Nano-Roughening of Gold Microstructured Electrodes for Enhanced Sensing in Biofluids. Angew. Chem. 2023, 62, e202218080. [Google Scholar] [CrossRef]
  8. Ostertag, B.; Porshinsky, E.; Nawarathne, C.; Ross, A. Surface-Roughened Graphene Oxide Microfibers Enhance Electrochemical Reversibility. Langmuir 2024, 40, 12124–12136. [Google Scholar] [CrossRef] [PubMed]
  9. Min, K.; Yoon, S.; Kim, D. Effect of surface roughness on the extinction-based localized surface plasmon resonance biosensors. Appl. Opt. 2008, 47, 5886–5892. [Google Scholar] [CrossRef] [PubMed]
  10. AL-Mosht, S.; Al-Fandi, M.; Al-Ebbini, L. Nanoarchitectonics of composite biosensor for early detection of hepatocellular carcinoma. Appl. Phys. A 2022, 128, 536. [Google Scholar] [CrossRef]
  11. El-Said, W.; Saleh, T.; Al-Bogami, A.; Wani, M.; Choi, J. Development of Novel Surface-Enhanced Raman Spectroscopy-Based Biosensors by Controlling the Roughness of Gold/Alumina Platforms for Highly Sensitive Detection of Pyocyanin Secreted from Pseudomonas aeruginosa. Biosensors 2024, 14, 399. [Google Scholar] [CrossRef]
  12. Shergill, R.S.; Miller, C.L.; Patel, B.A. Influence of instrument parameters on the electrochemical activity of 3D printed carbon thermoplastic electrodes. Sci. Rep. 2023, 13, 339. [Google Scholar] [CrossRef] [PubMed]
  13. Patil, M.; Ganbavle, V.V.; Rajpure, K.Y.; Deshmukh, H.P.; Mujawar, S.H. Fast response and highly selective nitrogen dioxide gas sensor based on Zinc Stannate thin films. Mater. Sci. Energy Technol. 2020, 3, 36–42. [Google Scholar] [CrossRef]
  14. Ghaderi, A.; Sabbaghzadeh, J.; Dejam, L.; Pour, G.; Moghimi, E.; Matos, R.; da Fonseca Filho, H.; Țălu, S.; Salehishayegan, A.; Aval, L.; et al. Nanoscale morphology, optical dynamics and gas sensor of porous silicon. Sci. Rep. 2024, 14, 3677. [Google Scholar] [CrossRef]
  15. Abdelkarem, K.; Saad, R.; El Sayed, A.M.; Fathy, M.I.; Shaban, M.; Hamdy, H. Design of high-sensitivity La-doped ZnO sensors for CO2 gas detection at room temperature. Sci. Rep. 2023, 13, 18398. [Google Scholar] [CrossRef] [PubMed]
  16. Sehit, E.; Altintas, Z. Significance of nanomaterials in electrochemical glucose sensors: An updated review. Biosens. Bioelectron. 2020, 159, 112165. [Google Scholar] [CrossRef]
  17. Zeng, Y.; Camarada, M.B.; Lu, X.; Tang, K.; Li, W.; Qiu, D.; Wen, Y.; Wu, G.; Luo, Q.; Bai, L. A portable wireless intelligent electrochemical sensor based on layer-by-layer sandwiched nanohybrid for terbutaline in meat products. Food Chem. 2022, 371, 131140. [Google Scholar] [CrossRef]
  18. Zeng, Y.; Camarada, M.B.; Lu, X.; Tang, K.; Li, W.; Qiu, D.; Wen, Y.; Wu, G.; Luo, Q.; Bai, L. Detection and electrocatalytic mechanism of zearalenone using nanohybrid sensor based on copper-based metal-organic framework/magnetic Fe3O4-graphene oxide modified electrode. Food Chem. 2022, 370, 131024. [Google Scholar] [CrossRef]
  19. Kumar, N.; Navani, N.K.; Manhas, S.K. Effect of Metal Oxide Nanoparticles on Carbon Nanotube Device Characteristics. J. Electron. Mater. 2021, 50, 528–536. [Google Scholar] [CrossRef]
  20. Hovancová, J.; Šišoláková, I.; Oriňaková, R.; Oriňak, A. Nanomaterial-based electrochemical sensors for detection of glucose and insulin. J. Solid. State Electrochem. 2017, 21, 2147–2166. [Google Scholar] [CrossRef]
  21. Tee, S.Y.; Teng, C.P.; Ye, E. Metal nanostructures for non-enzymatic glucose sensing. Mater. Sci. Eng. C 2017, 70, 1018–1030. [Google Scholar] [CrossRef]
  22. Lu, Y.; Yang, M.; Qu, F.; Shen, G.; Yu, R. Enzyme-functionalized gold nanowires for the fabrication of biosensors. Bioelectrochemistry 2007, 71, 211–216. [Google Scholar] [CrossRef]
  23. Hira, S.A.; Yusuf, M.; Annas, D.; Saravanan Nagappan, S.; Song, R.; Park, S.; Park, K. Recent Advances on Conducting Polymer-Supported Nanocomposites for Nonenzymatic Electrochemical Sensing. Ind. Eng. Chem. Res. 2021, 60, 13425–13437. [Google Scholar] [CrossRef]
  24. Saboor, F.H.; Ataei, A. Decoration of Metal Nanoparticles and Metal Oxide Nanoparticles on Carbon Nanotubes. Adv. J. Chem. 2024, 7, 122–145. [Google Scholar]
  25. Wang, H.; Li, P.; Sun, G.; Jiang, Z. Influence of substrate surface roughness on the properties of a planar-type CO2 sensor using evaporated Li3PO4 film. In Proceedings of the 8th Annual IEEE International Conference on Nano/Micro Engineered and Molecular Systems 2013, Suzhou, China, 7–10 April 2013. [Google Scholar] [CrossRef]
  26. MenshykauIan, D.; Compton, R. Influence of Electrode Roughness on Cyclic Voltammetry. J. Phys. Chem. C 2008, 112, 14428–14438. [Google Scholar] [CrossRef]
  27. Treebupachatsakul, T.; Shinnakerdchoke, S.; Pechprasarn, S. Analysis of Effects of Surface Roughness on Sensing Performance of Surface Plasmon Resonance Detection for Refractive Index Sensing Application. Sensors 2021, 21, 6164. [Google Scholar] [CrossRef] [PubMed]
  28. Possan, A.; Menti, C.; Beltrami, M.; Santos, A.; Roesch-Ely, M.; Missell, F. Effect of surface roughness on performance of magnetoelastic biosensors for the detection of Escherichia coli. Mater. Sci. Eng. C Mater. Biol. Appl. 2016, 58, 541–547. [Google Scholar] [CrossRef]
  29. Alvez, H.; de Barros, T.; Nascimento, D.; Silva, D.; Peixoto e Silva, M.; do Nascimento, J.; Fontana, E.; Martins-Filho, J. Influence of surface roughness on the sensitivity of a D-shaped optical fiber-based refractive index sensor. Sens. Actuators A Phys. 2022, 344, 113702. [Google Scholar] [CrossRef]
  30. Saitta, L.; Celano, G.; Tosto, C.; Arcadio, F.; Zeni, L.; Sergi, C.; Cennamo, N.; Cicala, G. The effect of surface roughness on the performance of 3D printed surface plasmon resonance sensors for refractive index measurements. Int. J. Adv. Manuf. Technol. 2024, 132, 5503–5519. [Google Scholar] [CrossRef]
  31. Hashim, J.; Salim, M.; Qazi, H.; Noor, M.; Azmi, A.; Ibrahim, M.; Manap, H. Effect of Surface Roughness on Sensitivity of Unclad Fiber-Optic Sensors. J. Phys. Conf. Ser. 2023, 2550, 12018. [Google Scholar] [CrossRef]
  32. Zhang, J.; Kuang, Z.; Li, H.; Li, S.; Xia, F. Electrode surface roughness greatly enhances the sensitivity of electrochemical non-enzymatic glucose sensors. J. Electroanal. Chem. 2022, 919, 116541. [Google Scholar] [CrossRef]
  33. Dutta, G.; Fernandes, F.; Estrela, P.; Moschou, D.; Bueno, P. Impact of surface roughness on the self-assembling of molecular films onto gold electrodes for label-free biosensing applications. Electrochim. Acta 2021, 378, 138137. [Google Scholar] [CrossRef]
  34. Golba, S.; Kubisztal, J. The Influence of Roughness on the Properties of Electroactive Polypyrrole. Molecules 2024, 29, 5436. [Google Scholar] [CrossRef] [PubMed]
  35. Perry, S.; Gateman, S.; Sifakis, J.; Pollegioni, L.; Mauzeroll, J. Enhancement of the Enzymatic Biosensor Response through Targeted Electrode Surface Roughness. J. Electrochem. Soc. 2018, 165, G3074. [Google Scholar] [CrossRef]
  36. Surdo, S.; Barillaro, G. Impact of Fabrication and Bioassay Surface Roughness on the Performance of Label-Free Resonant Biosensors Based On One-Dimensional Photonic Crystal Microcavities. ACS Sens. 2020, 5, 2894–2902. [Google Scholar] [CrossRef]
  37. Dobri, G.; Banu, A.; Donath, C.; Neacsu, E.; Anastasescu, M.; Maxim, M.; Vasilescu, C.; Preda, L.; Marcu, M. Effect of Surface Roughness on the Electrochemical Behavior and Corrosion Resistance of TiTaNbZrAg Alloy with Different Amounts of Tantalum in Bulk Composition. Materials 2024, 17, 5217. [Google Scholar] [CrossRef] [PubMed]
  38. Enculescu, M.; Costas, A.; Evanghelidis, A.; Enculescu, I. Fabrication of ZnO and TiO2 Nanotubes via Flexible Electrospun Nanofibers for Photocatalytic Applications. Nanomaterials 2021, 11, 1305. [Google Scholar] [CrossRef]
  39. Ramasamy, P.; Lim, D.H.; Kim, J.; Kim, J. A general approach for synthesis of functional metal oxide nanotubes and their application in dye-sensitized solar cells. RSC Adv. 2014, 4, 2858–2864. [Google Scholar] [CrossRef]
  40. Li, Y.; Yang, X.Y.; Feng, Y.; Yuan, Z.Y.; Su, B.L. One-Dimensional Metal Oxide Nanotubes, Nanowires, Nanoribbons, and Nanorods: Synthesis, Characterizations, Properties and Applications. Crit. Rev. Solid. State Mater. Sci. 2012, 37, 1–74. [Google Scholar] [CrossRef]
  41. Muench, F.; Sun, L.; Kottakkat, T.; Antoni, M.; Schaefer, S.; Kunz, U.; Molina-Luna, K.; Duerrschnabel, M.; Kleebe, H.; Ayata, S.; et al. Free-Standing Networks of Core-Shell Metal and Metal Oxide Nanotubes for Glucose Sensing. ACS Appl. Mater. Interfaces 2017, 9, 771–781. [Google Scholar] [CrossRef]
  42. Trandabat, F.; Ciobanu, R.; Schreiner, O.; Aradoaei, M.; Aradoaei, S. Manufacturing of TiO2, Al2O3 and Y2O3 Ceramic Nanotubes for Application as Electrodes for Printable Electrochemical Sensors. Crystals 2024, 14, 454. [Google Scholar] [CrossRef]
  43. Trasatti, S.; Petrii, O.A. Real Surface Area Measurements in Electrochemistry. Pure Appl. Chem. 1991, 63, 711–734. [Google Scholar] [CrossRef]
  44. Coelho, D.; Luiz, G.; Machado, S. Estimating the Electrochemically Active Area: Revisiting a Basic Concept in Electrochemistry. J. Braz. Chem. Soc. 2021, 32, 1912–1917. [Google Scholar] [CrossRef]
  45. Surface Roughness Parameters. Available online: https://www.keyence.eu/ss/products/microscope/roughness/line/tab03_b.jsp (accessed on 17 July 2025).
  46. Schreiner, O.; Trandabat, A.F.; Ciobanu, R.; Schreiner, T. TiO2 Ceramic Nanotubes—Conducting Polymer Assemblies with Embedded Gold Particles for Potential Use as Chemosensors in the Detection of Oral Diseases. Chemosensors 2025, 13, 117. [Google Scholar] [CrossRef]
  47. Trandabat, A.F.; Ciobanu, R.; Schreiner, O.; Schreiner, T.; Aradoaei, D. Ceramic Nanotubes—Conducting Polymer Assemblies with Potential Application as Chemosensors for Breath Hydrogen sulfide Detection in Chronic Kidney Disease. Chemosensors 2024, 12, 198. [Google Scholar] [CrossRef]
  48. Umeda, H.; Mezaki, Y.; Oshio, A.; Kaneko, Y.; Okamoto, R.; Kusumoto, S.; Kunimura, S. Gold Nanoparticles Produced by Low-temperature Heating of the Dry Residue of a Droplet of an HCl Acidic Solution of HAuCl4·4H2O in a Low Vacuum. Anal. Sci. 2021, 37, 1427–1432. [Google Scholar] [CrossRef]
  49. Ii, K.; Kurita, Y.; Kida, N.; Kunimura, S. Preparation of gold nanoparticles using low-temperature heating of the dry residue of a droplet of an HAuCl4 solution in air. Anal. Sci. 2024, 40, 213–217. [Google Scholar] [CrossRef]
  50. ISO 21920-2:2021 (Previously ISO 4287:1997). Available online: https://www.iso.org/standard/72226.html (accessed on 17 July 2025).
  51. Zhang, R.; Sun, D.; Zhang, R.; Lin, W.; Macias-Montero, M.; Patel, J.; Askari, S.; McDonald, C.; Mariotti, D.; Maguire, P. Gold nanoparticle-polymer nanocomposites synthesized by room temperature atmospheric pressure plasma and their potential for fuel cell electrocatalytic application. Sci. Rep. 2017, 7, 46682. [Google Scholar] [CrossRef] [PubMed]
  52. Yi, G.; Hoffmann, M.; Seçkin, S.; König, T.; Hermes, I.; Rossner, C.; Fery, A. Toward coupling across inorganic/organic hybrid interfaces: Polyaniline-coated gold nanoparticles with 4-aminothiophenol as gold-anchoring moieties. Colloid. Polym. Sci. 2024, 303, 1743–1751. [Google Scholar] [CrossRef]
  53. Lai, L.; Irene, E. Area evaluation of microscopically rough surfaces. J. Vac. Sci. Technol. B 1999, 17, 33–39. [Google Scholar] [CrossRef]
  54. Sekretareva, A.; Vagin, M.; Volkov, A.; Zozoulenko, I.; Eriksson, M. Evaluation of the Electrochemically Active Surface Area of Microelectrodes by Capacitive and Faradaic Currents. ChemElectroChem 2019, 6, 4411–4417. [Google Scholar] [CrossRef]
  55. Connor, P.; Schuch, J.; Kaiser, B.; Jaegermann, W. The determination of electrochemical active surface area and specific capacity revisited for the system MnOx as an oxygen evolution catalyst. Z. Phys. Chem. 2020, 234, 979–994. [Google Scholar] [CrossRef]
  56. Cossar, E.; Houache, M.; Zhang, Z.; Baranova, E. Comparison of electrochemical active surface area methods for various nickel nanostructures. J. Electroanal. Chem. 2020, 870, 114246. [Google Scholar] [CrossRef]
  57. Serapinienė, B.; Gudavičiūtė, L.; Tutlienė, S.; Grigucevičienė, A.; Selskis, A.; Juodkazytė, J.; Ramanauskas, R. On the Electrochemically Active Surface Area Determination of Electrodeposited Porous Cu 3D Nanostructures. Coatings 2023, 13, 1335. [Google Scholar] [CrossRef]
  58. Queiroz, M.A.R.; Vasconcellos, S.; Ribeiro, M.A.; Luz, P.; de Moura Souza, F.; dos Santos, M.; Guimarães, M.; Salgado, J.; Pedicini, R.; Ribeiro, J. Determination of the electrochemically active surface area by CO and hydrogen of PtSnRuTa/C-based electrocatalysts and their relationship with catalytic activity against alcohol oxidation. Chem. Pap. 2022, 76, 4597–4613. [Google Scholar] [CrossRef]
  59. Martínez-Hincapié, R.; Wegner, J.; Anwar, M.; Raza-Khan, A.; Franzka, S.; Kleszczynski, S.; Čolić, V. The determination of the electrochemically active surface area and its effects on the electrocatalytic properties of structured nickel electrodes produced by additive manufacturing. Electrochim. Acta 2024, 476, 143663. [Google Scholar] [CrossRef]
  60. Watzele, S.; Hauenstein, P.; Liang, Y.; Xue, S.; Fichtner, J.; Garlyyev, B.; Scieszka, D.; Claudel, F.; Maillard, F.; Bandarenka, A. Determination of electroactive surface area of Ni-, Co-, Fe-, and Ir-based oxide electrocatalysts. ACS Catal. 2019, 9, 9222–9230. [Google Scholar] [CrossRef]
  61. Lai, T.; Shu, H.; Yao, B.; Lai, S.; Chen, T.; Xiao, X.; Wang, Y. A Highly Selective Electrochemical Sensor Based on Molecularly Imprinted Copolymer Functionalized with Arginine for the Detection of Chloramphenicol in Honey. Biosensors 2023, 13, 505. [Google Scholar] [CrossRef]
  62. Tan, C.; Yin, H.; Brooks, V.; Arumugam, P.U.; Siddiqui, S. A Study of the Effect of Electrochemical Roughening of Platinum on the Sensitivity and Selectivity of Glutamate Biosensors. J. Electrochem. Soc. 2022, 169, 037510. [Google Scholar] [CrossRef]
  63. Darvishi, S.; Ensafi, A.A.; Mousaabadi, K.Z. Design and fabrication of electrochemical sensor based on NiO/Ni@C-Fe3O4/CeO2 for the determination of niclosamide. Sci. Rep. 2024, 14, 7576. [Google Scholar] [CrossRef]
  64. Huang, J.; Liu, P.; Wang, Y.; Dai, K.; Dou, Q.; Yin, Y.; Wang, X.; You, Z. Double-kill contribution of high-roughness high-density porous carbon electrodes to mechanically self-sensing supercapacitors. Nano Res. 2024, 17, 6157–6167. [Google Scholar] [CrossRef]
  65. Liu, J.; Shen, J.; Ji, S.; Zhanga, Q.; Zhao, W. Research progress of electrode materials for non-enzymatic glucose electrochemical sensors. Sens. Diagn. 2023, 2, 36–45. [Google Scholar] [CrossRef]
  66. Zhong, N.; Zhu, X.; Liao, Q.; Wang, Y.; Chen, R.; Sun, Y. Effects of surface roughness on optical properties and sensitivity of fiber-optic evanescent wave sensors. Appl. Opt. 2013, 52, 3937–3945. [Google Scholar] [CrossRef] [PubMed]
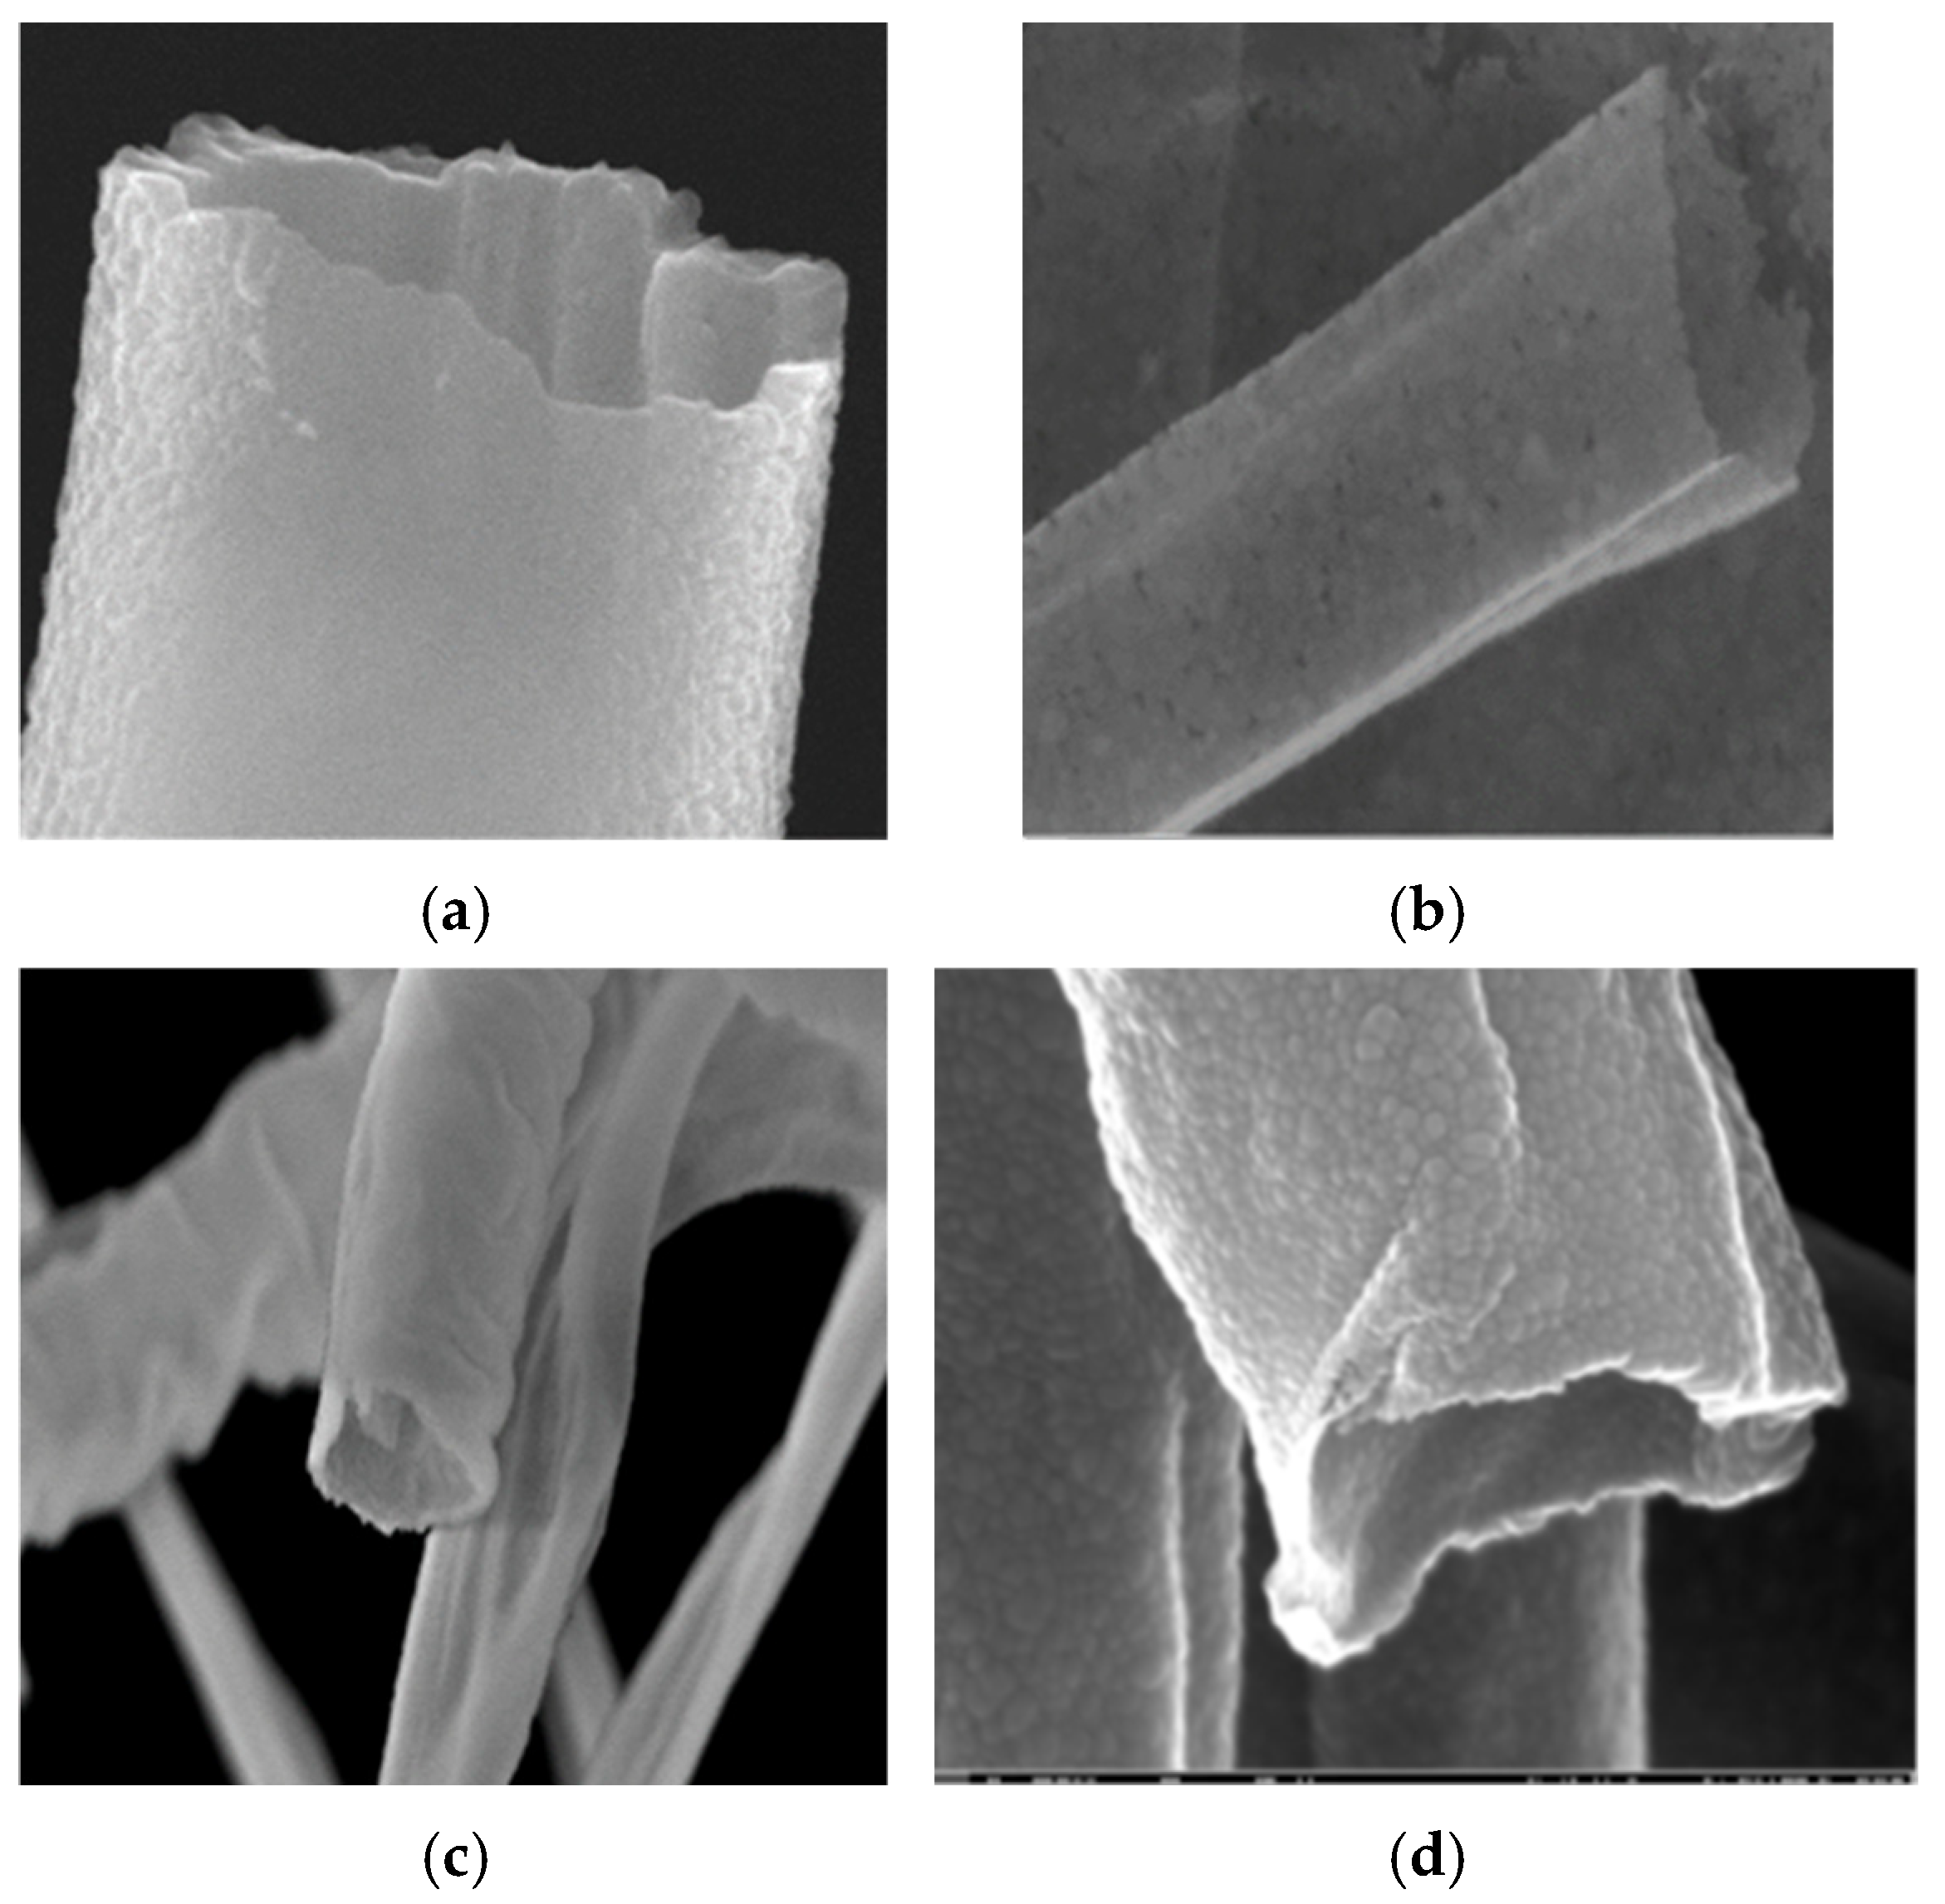
Figure 1. Images of nanotubes of (a) TiO2, (b) Al2O3, (c) Y2O3, and (d) ZnO (200 k magnitude, with image processing) [38,42,46,47].
Coatings 15 01211 g001
Figure 2. Deposition of (a) PANI:EB, (b) PEDOT:PSS, and (c) P3HT upon TiO2 nanotubes.
Coatings 15 01211 g002
Figure 3. Deposition of (a) PANI:EB, (b) PEDO:PSS, and (c) P3HT upon Al2O3 nanotubes.
Coatings 15 01211 g003
Figure 4. Deposition of (a) PANI:EB, (b) PEDO:PSS, and (c) P3HT upon Y2O3 nanotubes.
Coatings 15 01211 g004
Figure 5. Deposition of (a) PANI:EB, (b) PEDOT:PSS, and (c) P3HT upon ZnO nanotubes.
Coatings 15 01211 g005
Figure 6. XPS analysis of Y2O3 nanotube composites with (a) PANI:EB, (b) PEDOT:PSS, and (c) P3HT.
Coatings 15 01211 g006
Figure 7. SEM images of TiO2/PANI:EB composites with Au [46].
Coatings 15 01211 g007
Figure 8. SEM images of TiO2/PEDOT:PSS composites with Au [46].
Coatings 15 01211 g008
Figure 9. SEM images of TiO2/P3HT composites with Au.
Coatings 15 01211 g009
Figure 10. SEM images of Al2O3/PANI:EB composites with Au.
Coatings 15 01211 g010
Figure 11. SEM images of Al2O3/PEDOT:PSS composites with Au.
Coatings 15 01211 g011
Figure 12. SEM images of Al2O3/P3HT composites with Au.
Coatings 15 01211 g012
Figure 13. SEM images of Y2O3/PANI:EB composites with Au.
Coatings 15 01211 g013
Figure 14. SEM images of Y2O3/PEDOT:PSS composites with Au.
Coatings 15 01211 g014
Figure 15. SEM images of Y2O3/P3HT composites with Au.
Coatings 15 01211 g015
Figure 16. SEM images of ZnO/PANI:EB composites with Au.
Coatings 15 01211 g016
Figure 17. SEM images of ZnO/PEDOT:PSS composites with Au.
Coatings 15 01211 g017
Figure 18. SEM images of ZnO/P3HT composites with Au.
Coatings 15 01211 g018
Figure 19. Roughness parameters values vs. peak shape and density [45].
Coatings 15 01211 g019
Figure 20. Optical analysis at (a) 100× and (b) 500× of TiO2/PANI:EB composites with Au.
Coatings 15 01211 g020
Figure 21. Optical analysis at (a) 100× and (b) 500× of TiO2/PEDOT:PSS composites with Au.
Coatings 15 01211 g021
Figure 22. Optical analysis at (a) 100× and (b) 500× of TiO2/P3HT composites with Au.
Coatings 15 01211 g022
Figure 23. Optical analysis at (a) 100× and (b) 500× of Al2O3/PANI:EB composites with Au.
Coatings 15 01211 g023
Figure 24. Optical analysis at (a) 100× and (b) 500× of Al2O3/PEDOT:PSS composites with Au.
Coatings 15 01211 g024
Figure 25. Optical analysis at (a) 100× and (b) 500× of Al2O3/P3HT composites with Au.
Coatings 15 01211 g025
Figure 26. Optical analysis at (a) 100× and (b) 500× of Y2O3/PANI:EB composites with Au.
Coatings 15 01211 g026
Figure 27. Optical analysis at (a) 100× and (b) 500× of Y2O3/PEDOT:PSS composites with Au.
Coatings 15 01211 g027
Figure 28. Optical analysis at (a) 100× and (b) 500× of Y2O3/P3HT composites with Au.
Coatings 15 01211 g028
Figure 29. Optical analysis at (a) 100× and (b) 500× of ZnO/PANI-EB composites with Au.
Coatings 15 01211 g029
Figure 30. Optical analysis at (a) 100× and (b) 500× of ZnO/PEDOT:PSS composites with Au.
Coatings 15 01211 g030
Figure 31. Optical analysis at (a) 100× and (b) 500× of ZnO/P3HT composites with Au.
Coatings 15 01211 g031
Figure 32. AFM topographic 2D and 3D images and profile lines—TiO2/PANI:EB composites with Au [46].
Coatings 15 01211 g032
Figure 33. AFM topographic 2D and 3D images and profile lines—TiO2/PEDOT:PSS composites with Au [46].
Coatings 15 01211 g033
Figure 34. AFM topographic 2D and 3D images and profile lines—TiO2/P3HT composites with Au [46].
Coatings 15 01211 g034
Figure 35. AFM topographic 2D and 3D images and profile lines—Al2O3/PANI-EB composites with Au.
Coatings 15 01211 g035
Figure 36. AFM topographic 2D and 3D images and profile lines—Al2O3/PEDOT:PSS composites with Au.
Coatings 15 01211 g036
Figure 37. AFM topographic 2D and 3D images and profile lines—Al2O3/P3HT composites with Au.
Coatings 15 01211 g037
Figure 38. AFM topographic 2D and 3D images and profile lines—Y2O3/PANI:EB composites with Au.
Coatings 15 01211 g038
Figure 39. AFM topographic 2D and 3D images and profile lines—Y2O3/PEDOT:PSS composites with Au.
Coatings 15 01211 g039
Figure 40. AFM topographic 2D and 3D images and profile lines—Y2O3/P3HT composites with Au.
Coatings 15 01211 g040
Figure 41. AFM topographic 2D and 3D images and profile lines—ZnO/PANI:EB composites with Au.
Coatings 15 01211 g041
Figure 42. AFM topographic 2D and 3D images and profile lines—ZnO/PEDOT:PSS composites with Au.
Coatings 15 01211 g042
Figure 43. AFM Topographic 2D and 3D images and profile lines—ZnO/P3HT composites with Au.
Coatings 15 01211 g043
Table 1. Weight percentages of gold nanoparticles in the hybrid structures.
Hybrid StructureWeight Percentage (%)
TiO2/PANI:EB+Au1.66 ± 0.14
TiO2/PEDOT:PSS+Au0.64 ± 0.11
TiO2/P3HT+Au0.92 ± 0.08
Al2O3/PANI:EB+Au0.22 ± 0.04
Al2O3/PEDOT:PSS+Au1.78 ± 0.16
Al2O3/P3HT+Au0.89 ± 0.12
Y2O3/PANI:EB+Au0.37 ± 0.07
Y2O3/PEDOT:PSS+Au0.54 ± 0.08
Y2O3/P3HT+Au0.26 ± 0.03
ZnO/PANI:EB+Au0.46 ± 0.09
ZnO/PEDOT:PSS+Au1.85 ± 0.18
ZnO/P3HT+Au1.66 ± 0.15
Table 2. Type of distribution and area covered with gold nanoparticles in the hybrid structures.
Hybrid StructureType of Distribution/Area Covered
TiO2/PANI:EB+Auuniform/large
TiO2/PEDOT:PSS+Auuniform/very reduced
TiO2/P3HT+Auuniform/reduced
Al2O3/PANI:EB+Auuneven/very reduced
Al2O3/PEDOT:PSS+Auuniform/very large
Al2O3/P3HT+Auuniform/large
Y2O3/PANI:EB+Auuniform/quite large
Y2O3/PEDOT:PSS+Auuniform/large
Y2O3/P3HT+Auuniform/very reduced
ZnO/PANI:EB+Auuniform/reduced
ZnO/PEDOT:PSS+Auuniform/very large
ZnO/P3HT+Aurelatively uniform/very large
Table 3. Average roughness parameters determined by AFM lines—scanned area 40 × 40 μm.
Scanned MaterialRa (nm)RMS (nm)RSkRKu
TiO2 nanotubes—PANI:EB715947−0.184.04
TiO2 nanotubes—PANI:EB/Au 94811970.282.97
TiO2 nanotubes—PEDOT:PSS105131−0.153.04
TiO2 nanotubes—PEDOT:PSS/Au791070.164.42
TiO2 nanotubes—P3HT2983620.172.53
TiO2 nanotubes—P3HT/Au3414200.422.89
Al2O3 nanotubes—PANI:EB—7028810.083.44
Al2O3 nanotubes—PANI:EB/Au105313210.033.12
Al2O3 nanotubes—PEDOT:PSS1942730.163.97
Al2O3 nanotubes—PEDOT:PSS/Au1151460.223.35
Al2O3 nanotubes—P3HT 1231980.625.86
Al2O3 nanotubes—P3HT/Au1341660.022.69
Y2O3 nanotubes—PANI:EB 3624640.313.16
Y2O3 nanotubes—PANI:EB/Au3684650.503.84
Y2O3 nanotubes—PEDOT:PSS2182890.345.44
Y2O3 nanotubes—PEDOT:PSS/Au2693420.744.21
Y2O3 nanotubes—P3HT1321660.465.86
Y2O3 nanotubes—P3HT/Au1722570.527.11
ZnO nanotubes—PANI:EB10861413−0.212.89
ZnO nanotubes—PANI:EB/Au11341418−0.112.87
ZnO nanotubes—PEDOT:PSS196265−0.134.23
ZnO nanotubes—PEDOT:PSS/Au3324660.465.86
ZnO nanotubes—P3HT9561191−0.152.88
ZnO nanotubes—P3HT/Au10421327−0.033.29
Disclaimer/Publisher’s Note: The statements, opinions and data contained in all publications are solely those of the individual author(s) and contributor(s) and not of MDPI and/or the editor(s). MDPI and/or the editor(s) disclaim responsibility for any injury to people or property resulting from any ideas, methods, instructions or products referred to in the content.