Article

Influence of Laser Power on Crack Evolution During Selective Laser Melting Manufacturing Process of Aluminum–Lithium Alloys

1
School of Mechanical and Electrical Engineering, Xuzhou College of Industrial Technology, Xuzhou 221140, China
2
School of Mechanical Engineering, Jiangsu University, Zhenjiang 212013, China
3
School of Biological Equipment, Xuzhou Vocational College of Bioengineering, Xuzhou 221006, China
*
Author to whom correspondence should be addressed.
Coatings 2025, 15(10), 1212; https://doi.org/10.3390/coatings15101212 (registering DOI)
Submission received: 16 August 2025 / Revised: 26 September 2025 / Accepted: 2 October 2025 / Published: 14 October 2025
(This article belongs to the Section Laser Coatings)

Abstract

Aluminum–lithium alloys, as promising next-generation aerospace materials, exhibit outstanding properties, such as high strength, low density, excellent cryogenic performance, and superior corrosion resistance. In this study, aluminum–lithium alloy powders were processed via selective laser melting to systematically investigate the effects of processing parameters on manufacturing quality, microstructure, microhardness, residual stress, and tensile properties, with a particular emphasis on crack initiation and evolution. The results demonstrate that increasing laser power significantly improves specimen densification and reduces surface roughness. Moreover, the number of cracks decreases while their average length increases with elevated laser power. The maximum microhardness of 106.8 HV was achieved at the highest laser power, which also corresponded to the optimal tensile performance. These findings provide valuable insights into the relationship between laser parameters, microstructural evolution, and mechanical behavior, offering practical guidance for optimizing process parameters in the SLM fabrication of Al-Li alloy components for aerospace applications.

1. Introduction

The pursuit of lightweight structural materials is a constant priority in aerospace engineering. Among lightweight metals, aluminum alloys are widely used in aircraft and advanced equipment manufacturing [1,2,3,4]. With the evolving design requirements of modern aircraft, aluminum–lithium (Al-Li) alloys have emerged as a promising extension of conventional aluminum alloys. The introduction of lithium, the lightest metallic element, in quantities of 1–2 wt% into aluminum alloys results in a reduction in alloy density by 3%–10% [2,5,6,7,8]. Consequently, Al-Li alloys exhibit superior specific WSstrength, stiffness, cryogenic performance, and stress-corrosion resistance compared to traditional aluminum alloys [9,10]. Substituting conventional 2XXX and 7XXX alloys with Al-Li alloys in aerospace components enables weight reductions of 10%–20% alongside a 15%–20% increase in stiffness. As a result, Al-Li alloys are increasingly deployed in critical aircraft structures such as fuselages, wings, and pressure compartments [11,12].
However, as applications expand toward large, complex, primary load-bearing structures, traditional processing routes-casting [13,14,15], forging [16,17], rolling [18,19], and extrusion [20,21]—combined with riveting and welding [22], face significant challenges. These methods are often costly, time-intensive, and limited by the alloys’ intrinsic manufacture ability issues, including cracking susceptibility and anisotropy [5,23]. To overcome these limitations, additive manufacturing (AM) has gained traction. Among AM technologies, selective laser melting (SLM) employs high-energy laser beams to melt powders layer by layer, enabling the fabrication of high-density, complex components [24,25,26,27]. SLM offers distinct advantages such as near-net-shape manufacturing, material efficiency, rapid solidification, and design flexibility, making it highly attractive for aerospace, automotive, marine, defense, and biomedical applications [28,29,30,31,32,33,34].
Nevertheless, SLM-fabricated aluminum alloys face persistent challenges due to steep thermal gradients and rapid cooling, which induce residual stresses and microstructural heterogeneity. Post-processing techniques such as solution heat treatment and hot isostatic pressing (HIP) have shown improvements in fatigue resistance and microstructural stability [35,36], but systematic studies on residual stress mitigation in Al-Li alloys remain limited. More critically, crack manufacture continues to hinder the reliable application of SLM-processed Al-Li alloys. Previous work has explored strategies for crack suppression through process parameter optimization [37,38,39], alloying modifications [40], and scan strategy adjustments [41]. While these studies underscore the importance of process parameters, particularly laser power, the underlying mechanisms of crack evolution in SLM-manufactured Al-Li alloys are still insufficiently understood.
In this study, Al-Li alloy specimens were fabricated via SLM under varying laser power levels. The objective is to systematically investigate the influence of laser power on manufacturing quality, microstructural crack behavior, and mechanical performance, thereby providing new insights into optimizing process parameters for crack mitigation and performance enhancement in SLM-fabricated Al-Li alloys.

2. Materials and Methods

2.1. Experimental Powders

For the substrate of SLM, a 316 L stainless steel base was chosen. The ing powder employed herein was aluminum–lithium alloy powder produced by the Institute of Rare Metals in Shenyang. The powder particle size distribution ranged between 15 and 53 μm (D10 = 22.50 μm, D50 = 35.30 μm, D90 = 55.60 μm), with an average size of 38 μm. The powder exhibited an oxygen content of 1500 ppm. The chemical composition is presented in Table 1. Predominantly, the powder exhibited regular spherical morphology with a smooth and even surface. A minor fraction of irregularly shaped powder particles was observed, accompanied by instances of smaller particles adhering to larger ones.

2.2. SLM Manufacturing Process

Prior to the initiation of SLM, the powder underwent pre-processing through a 2 h drying process within a DHG101-1A drying oven (Shanghai, China) set at 100–110 °C. This meticulous drying regimen aimed to attenuate moisture content while optimizing powder flowability. The SLM system employed in this study was a product of Shanghai Hanbang Technology, denoted as HBD-80 (Shanghai, China). Based on the exploration of existing process parameters [41], the SLM process parameters, crucial to shaping the aluminum–lithium alloy, are enumerated in Table 2. A scanning strategy characterized by a 67° rotation was adopted, as illustrated in Figure 1. Throughout the manufacturing sequence, an environment fortified by pure argon gas with oxygen content below 100 ppm enveloped the process. The dimensions of the printed cubic specimens were 8 × 8 × 8 mm3, whereas the dimensions of the tensile specimens are illustrated in Figure 2. Each distinct parameter combination was utilized to fabricate three individual sets of tensile specimens. All samples were tested in the as-built condition, without post-processing such as stress-relief annealing or HIP, so the reported microstructure and mechanical properties reflect the as-built state.

2.3. Material Characterization

For the cubic specimens, every lateral surface underwent a rigorous protocol of grinding and polishing. The relative density of the specimens was determined through Archimedes’ displacement method. Precise mass measurements were executed using an analytical balance (Sartorius). Multiple measurements were conducted for each sample, and the average value was computed to determine the relative density through a designated formula. The specimens were subjected to corrosion in Keller’s reagent. Subsequently, Field Emission Scanning Electron Microscopy (FESEM; NovaNano450, FEI, Hillsboro, OR, USA) coupled with Electron Backscatter Diffraction (EBSD) was employed to scrutinize the microscopic structure and grain size of each specimen. The EBSD analysis was performed on a cross-section of the fabricated components, aligned parallel to the build direction. To investigate the crystalline characteristics of SLM-fabricated aluminum–lithium alloys, EBSD analysis was conducted on cross-sectional areas. Scans were performed with a step size of 0.75 µm over a grid of 745 × 558 points. Multiple map types were acquired for comprehensive analysis, including IPF X0 + GB, IPF X0 + GB + GB, and IPF X0, allowing visualization of crystal orientations and both low- and high-angle grain boundaries. Three regions of interest were analyzed for each processing condition, yielding a total of 1029 indexed grains. EBSD data were post-processed using a confidence index (CI) threshold of 0.1, and non-indexed points were removed to ensure statistical reliability. The specimens intended for EBSD analysis were prepared through ion-beam polishing. Microhardness measurements of the manufactured components were conducted using a microhardness tester (MH-VK, Shanghai, China). A load of 100 gf was applied for 10 s at each testing point. On the XOZ plane of each specimen, three hardness measurements were taken every 1 mm along the print direction, with the average value being computed to represent the Vickers hardness at that specific depth. Surface topography of the manufactured components was surveyed utilizing a laser scanning confocal microscope (VK-X1000; Keyence, Osaka, Japan). A multifunctional high-resolution X-ray diffractometer (SmartLab, Rigaku, Tokyo, Japan) was used with Cu Kα radiation (λ = 0.15406 nm), a 2θ range of 20–100°, and a scanning speed of 10°/min. Peak fitting and lattice parameter refinement were conducted using Jade software (6.0) Residual stresses were measured using an X-350A residual stress tester (StressTech Group, Vaajakoski, Finland) with an accuracy of ≤±8 MPa, a penetration depth of 10–30 μm, and a minimum spot size of 0.1 mm. Measurements were performed on the {311} diffraction peak using the sin2ψ method. ψ tilts ranging from −45° to +45° were applied at 5° intervals. Linear regression was used to fit the sin2ψ data, with the regression residuals used to estimate measurement uncertainty. Sampling points were arranged along predetermined paths, and each point was measured three times with the average taken as the representative value. For each processing condition, three specimens were tested, and the overall average was reported as the final residual stress. For depth profiling, the electrolytic layer-by-layer removal method was applied at 10 V using an electrolyte composed of H2SO4, H3PO4, CrO3, and H2O in a volume ratio of 1:1:0.12:0.82 (solution densities: H2SO4 = 1.7 g/cm3, H3PO4 = 1.84 g/cm3). Each polishing step removed approximately 20 μm of material, calibrated by profilometry. The residual stress at each depth was corrected for thickness variation, and the combined uncertainty from both XRD measurement and layer removal was propagated and reported as error bars in the depth–stress plots. Tensile tests were conducted on an electronic universal testing machine (UTM4104, Shenzhen, China) at a pulling rate of 1 mm/min, with each parameter combination subjected to three repetitions, and the average value was extracted. Subsequently, Field Emission Scanning Electron Microscope was used to carefully examine the fracture morphology of each tensile specimen.

3. Results and Discussion

3.1. Densification and Surface Morphology

Considering the layer-by-layer approach of SLM, the laser parameters can be set according to the volumetric energy density (VED), which is defined as follows [42,43]:
E = P v h t
where P is the laser power (W), v is the scan speed (mm/s), h denotes the hatching space (mm), t is the layer thickness (mm). And the corresponding relationship between laser power and VED is shown in Table 3.
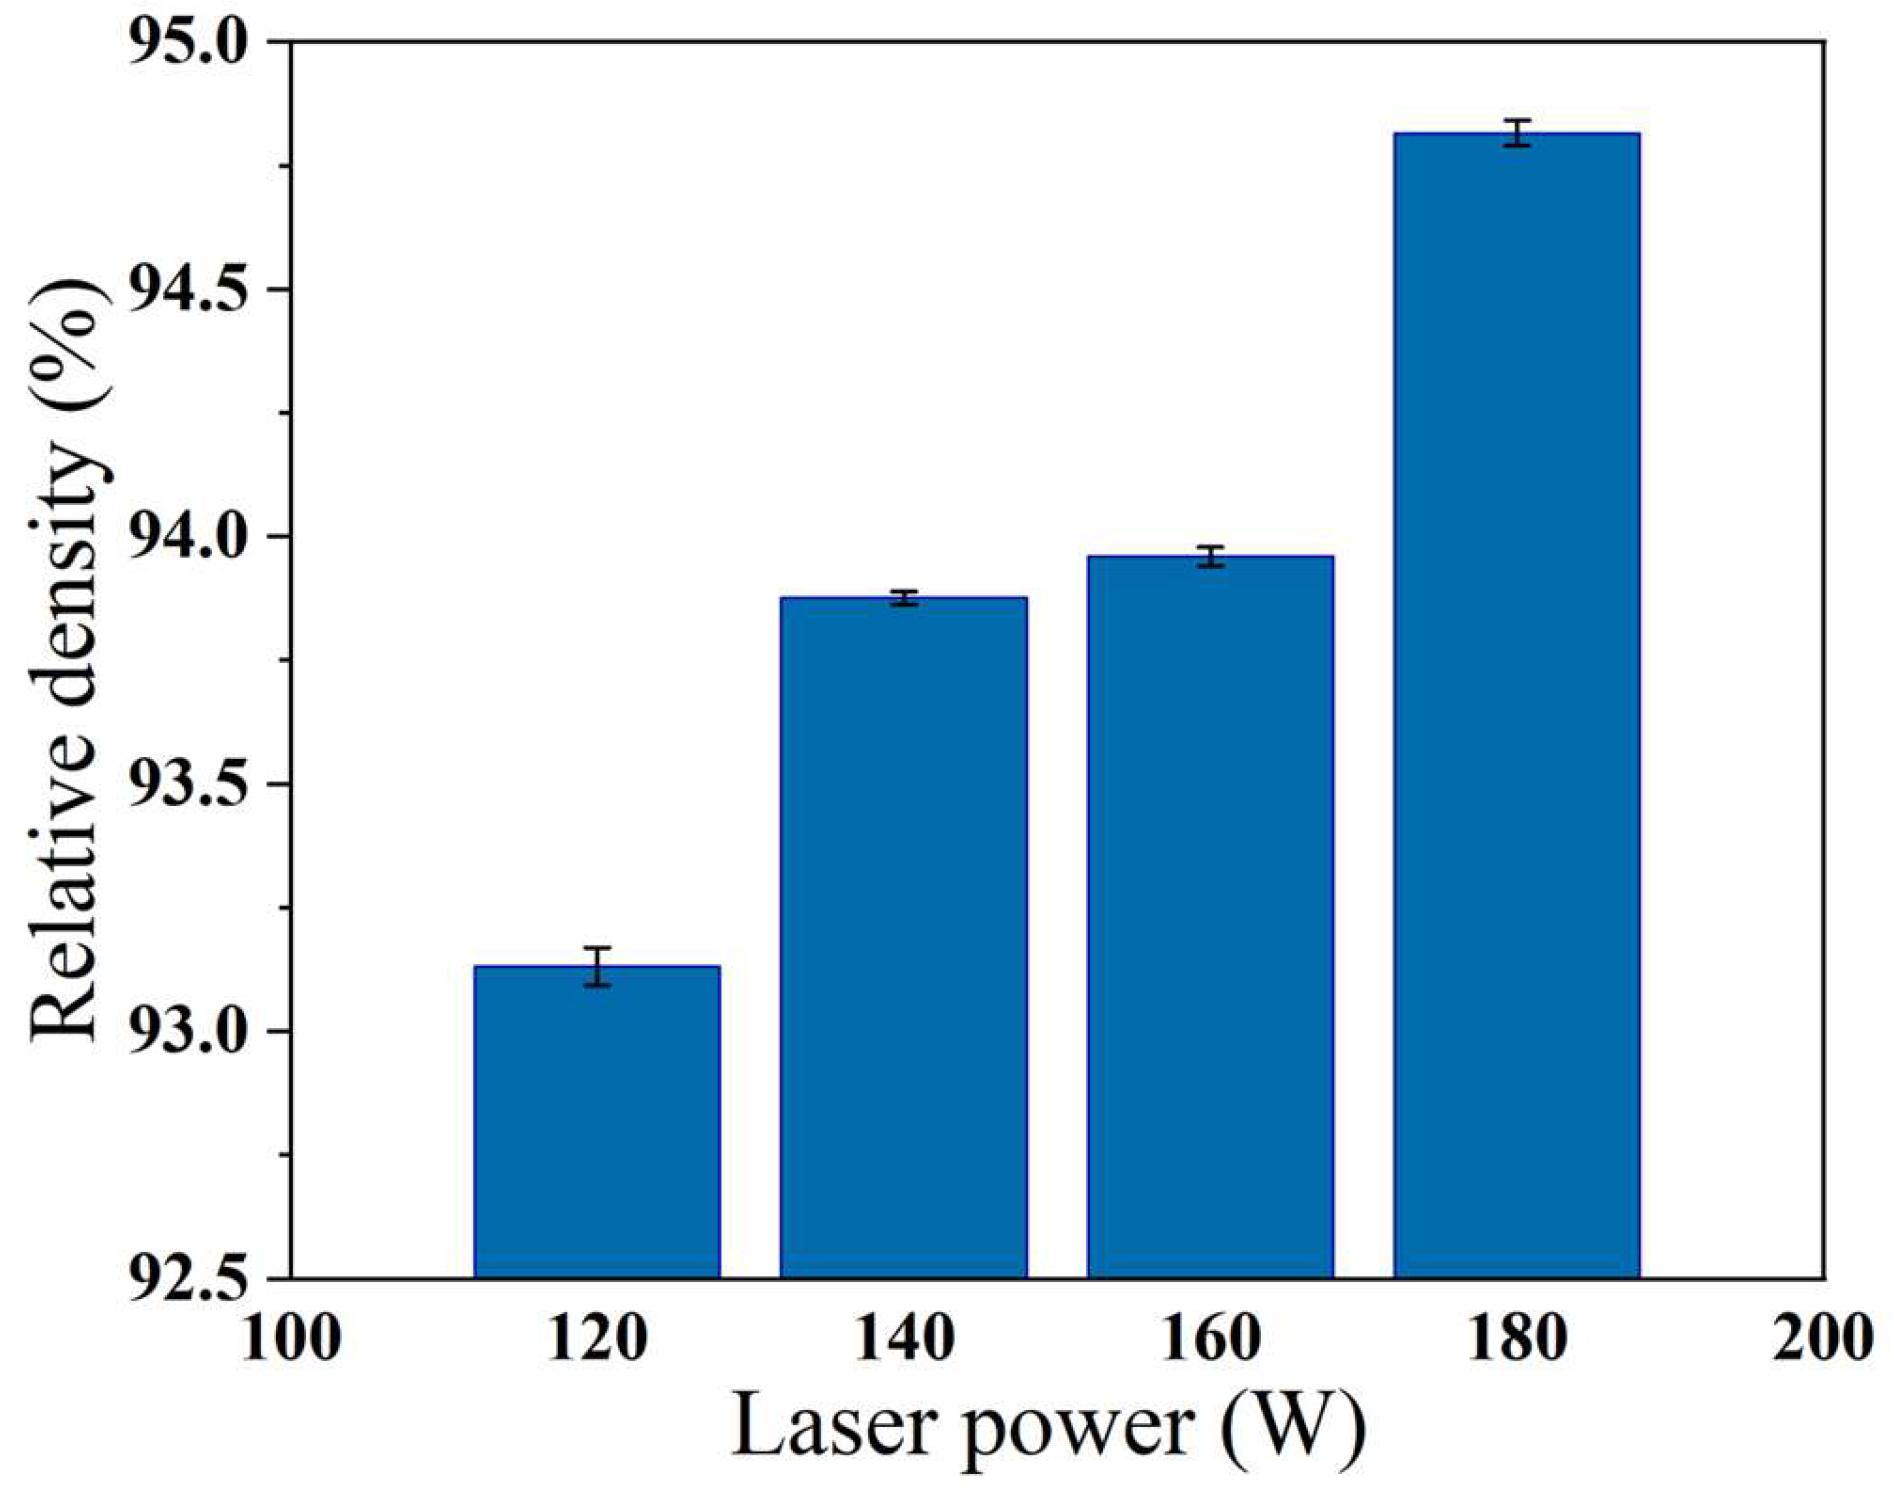
The alteration in relative density in response to varying laser power is elucidated in Figure 3, and the corresponding values of volumetric energy density (VED, calculated by Equation (1)) are listed in Table 3. Under a constant scanning speed of 1000 mm/s, the VED increases from 50.0 J/mm3 at 120 W to 75.0 J/mm3 at 180 W.
The relative density of the specimens was measured using the Archimedes drainage method. The dry-state mass of the as-built specimen was recorded as m 1 . During the relative density test, industrial anhydrous ethanol was used as the auxiliary liquid. A beaker filled with anhydrous ethanol was placed on a precision balance and tared. The specimen was suspended with a thin wire and fully immersed in the ethanol without touching the bottom or wall of the beaker. Once the balance reading stabilized, the apparent mass was recorded as m 2 . The actual density of the specimen was then calculated according to Equation (2), where ρ L is the density of anhydrous ethano, ρ G is the density of air, and ρ 0 is the measured density of the specimen. The relative density was subsequently obtained using Equation (3), where K represents the relative density of the specimen and ρ 1 is the theoretical density of the alloy.
ρ 0 = m 1 m 2 ( ρ L ρ G ) + ρ G
K = ρ 0 ρ 1 × 100 %
As shown in Figure 3, the relative density exhibits a clear upward trend with increasing VED. At lower VED levels (e.g., 50.0 J/mm3 at 120 W), the input energy is insufficient for complete melting of Al-Li alloy powder, leading to the presence of partially unmelted particles. The lack of adequate liquid-phase filling between adjacent powder particles results in defects such as voids and depressions, thereby reducing relative density [33]. As the VED increases, the energy absorbed by powder particles is sufficient to ensure full melting, producing a larger amount of liquid phase. The elevated molten pool temperature promotes enhanced flow and spreading of molten metal, thereby manufacturing a more uniform metallurgical bond. Consequently, higher VED (e.g., 75.0 J/mm3 at 180 W) enables the fabricated specimens to achieve improved densification. Quantitatively, the relative density increases from 93.1% at 50.0 J/mm3 to 94.8% at 75.0 J/mm3, confirming a strong correlation between VED and densification.
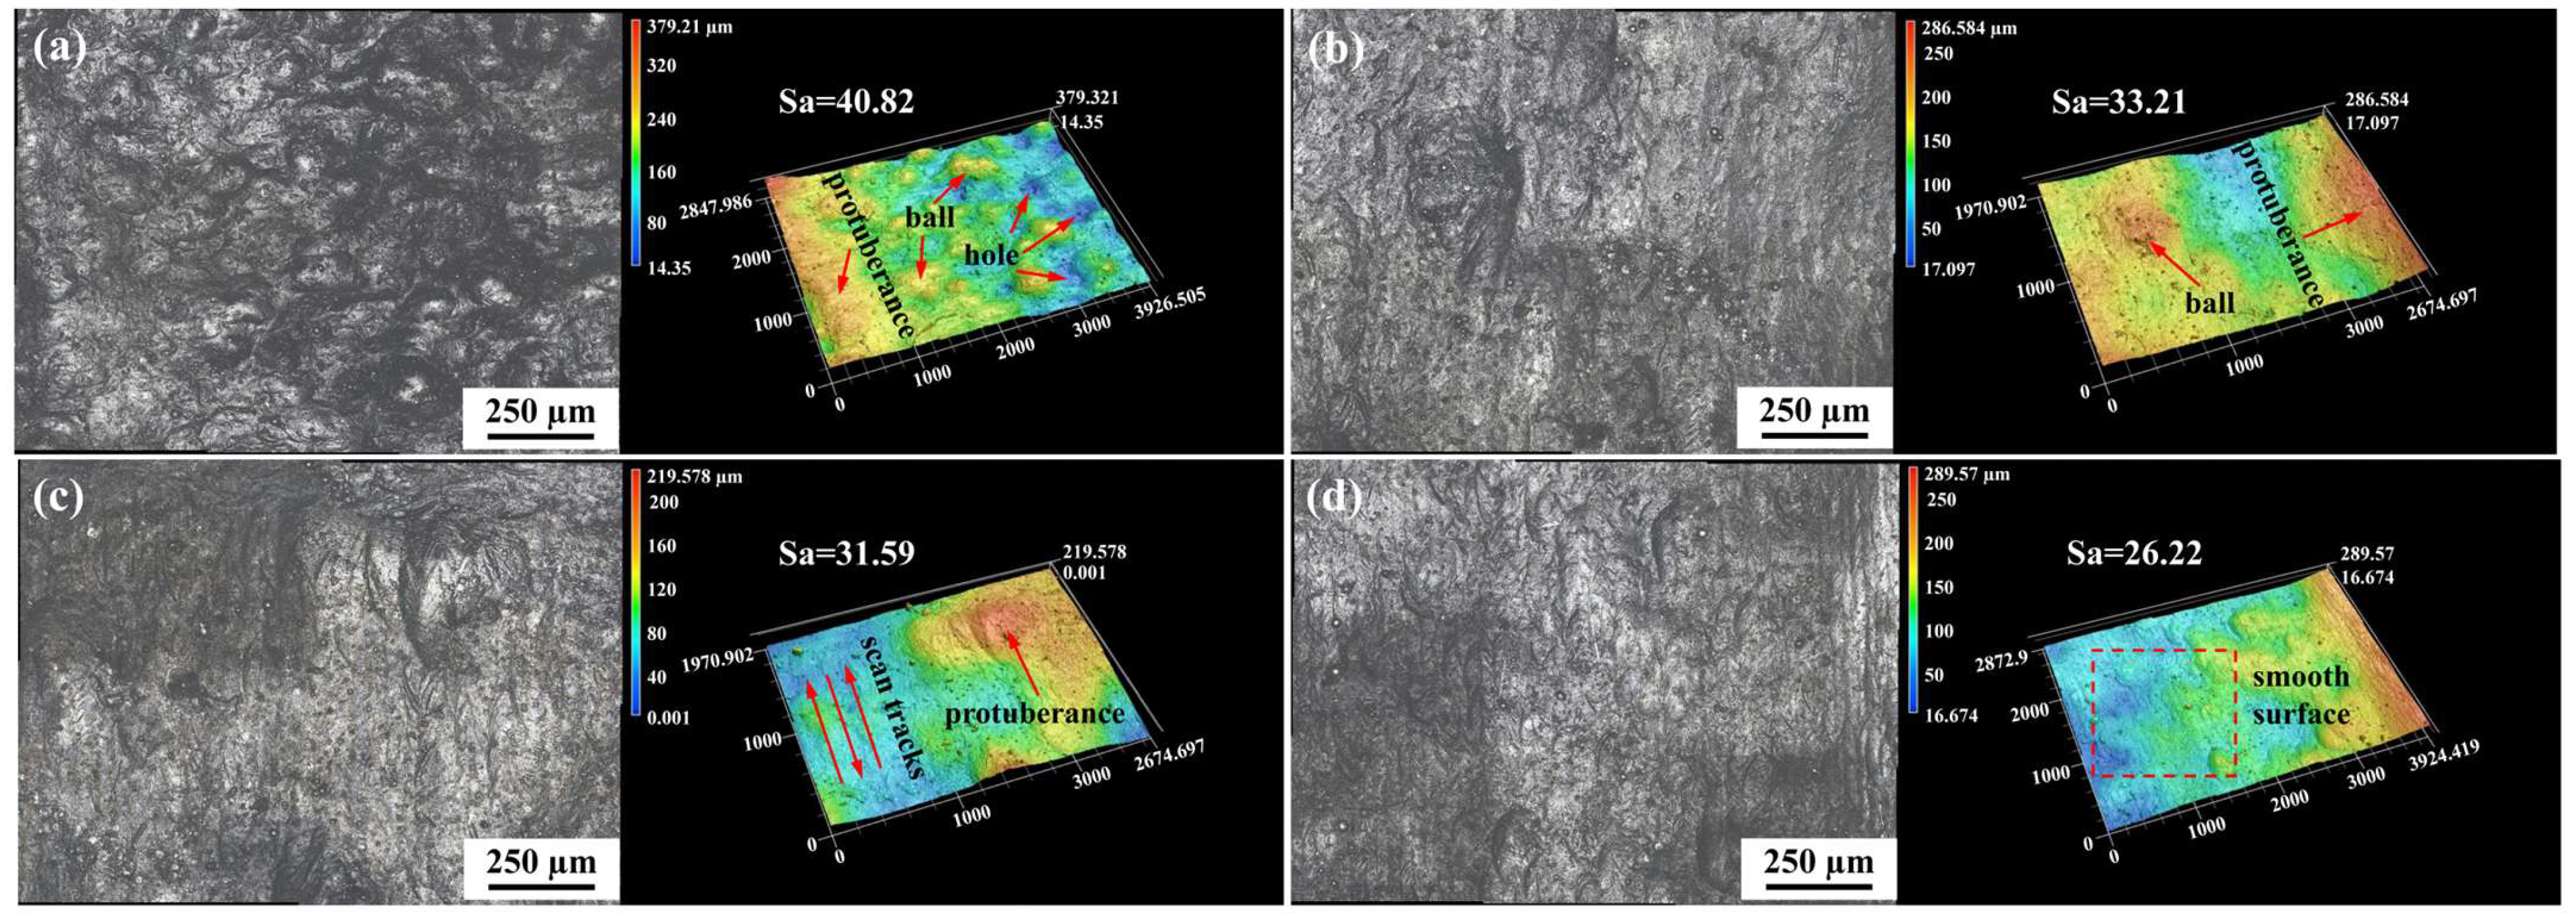
The surface topography and associated surface roughness of SLM-fabricated aluminum–lithium alloy specimens at varying laser powers are depicted in Figure 4. Evidently, the surface exhibits the presence of unmelted powder particles and defects, significantly compromising surface quality. At lower laser powers, the insufficient absorption of laser energy by the powder impedes complete melting. Consequently, a substantial accumulation of powder particles on the surface, combined with constrained diffusion within the molten pool, results in a tendency for liquid metal to coalesce into spherical forms. Moreover, the Gaussian distribution of laser energy yields elevated temperatures at the central region of the molten pool, leading to a topographically uneven final molten track, characterized by elevated central portions and lowered edges, thus engendering protrusion phenomena [44]. Consequently, lower laser powers contribute to heightened surface roughness of the manufactured specimens. Conversely, with escalating laser powers, the population of unmelted powder particles on the surface diminishes. The molten track exhibits continuous smoothness, diminishing the trend towards spherical coalescence and reducing the height of protrusions. As a consequence, the surface roughness gradually diminishes from 40.82 μm to 26.22 μm.

3.2. Defects and Microstructure

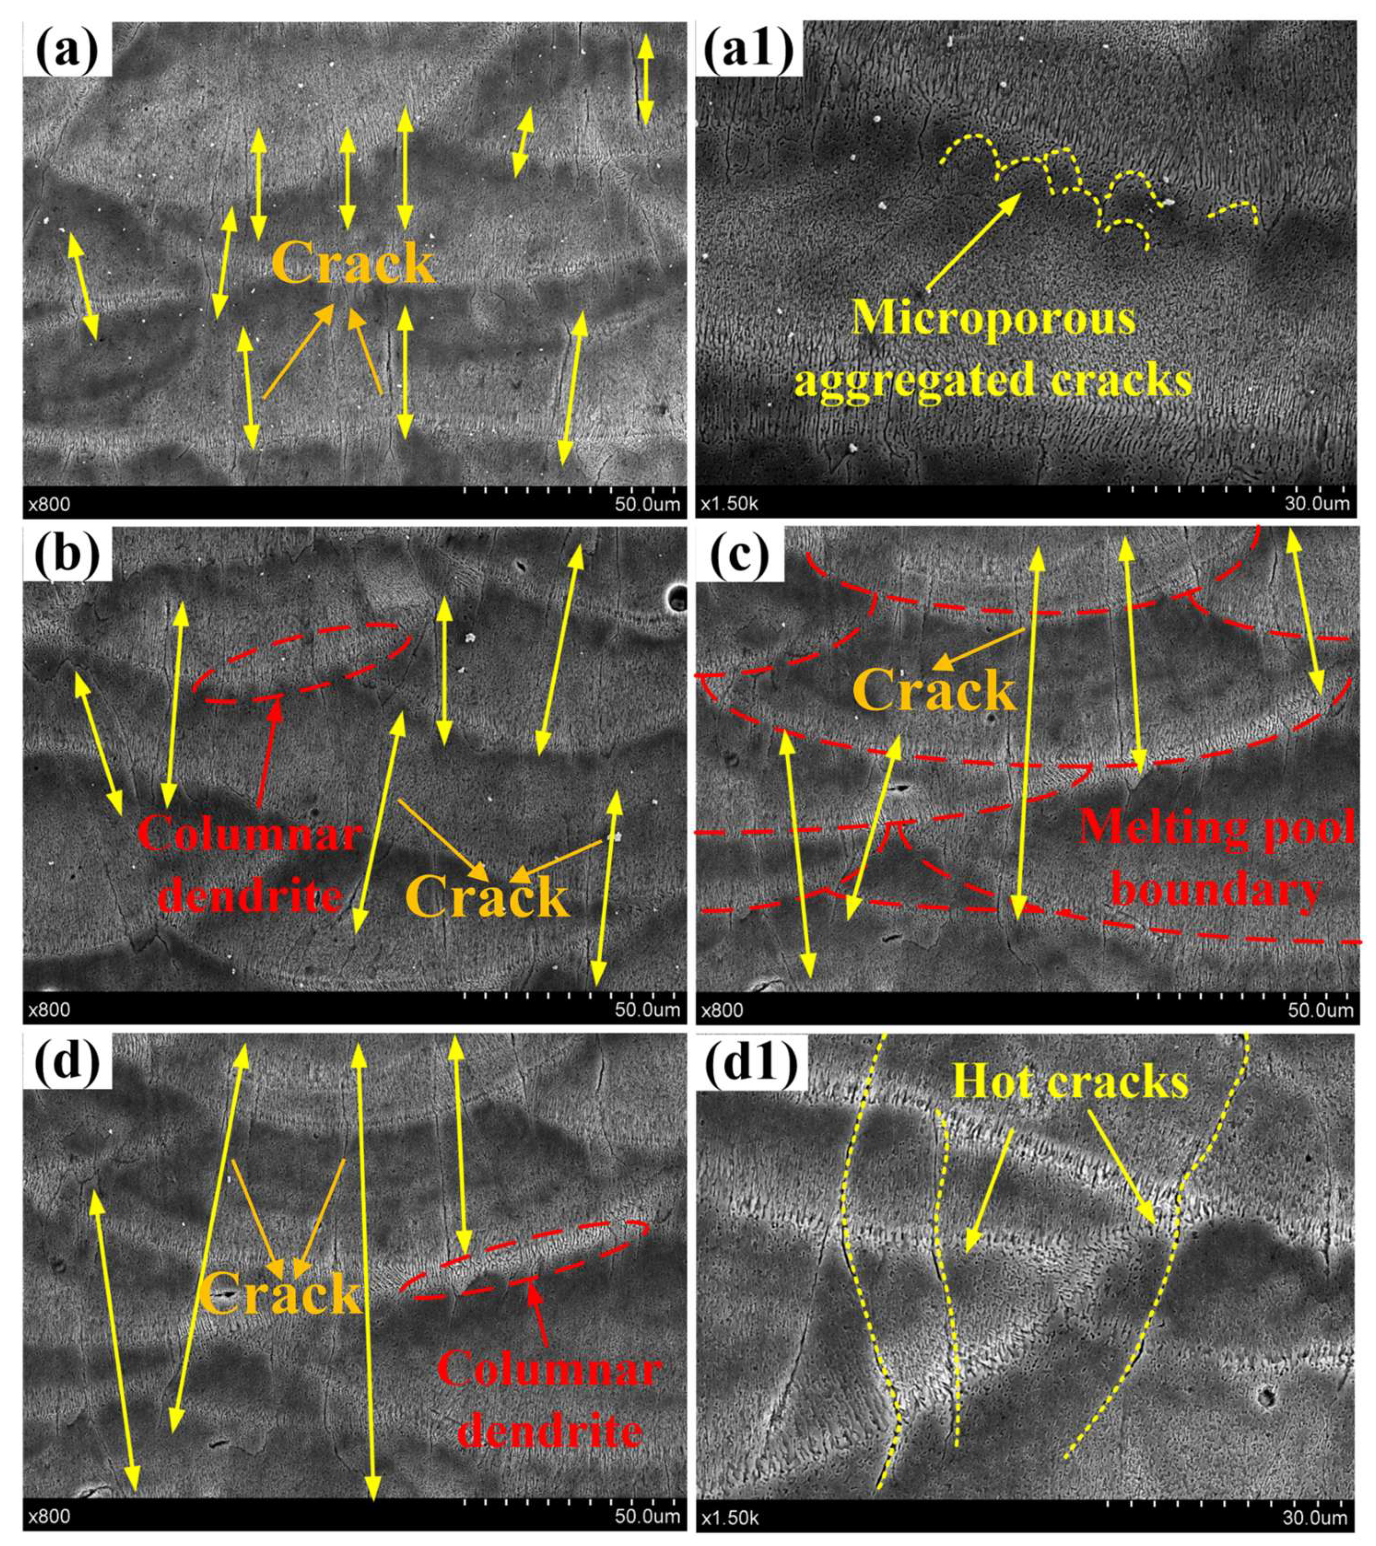
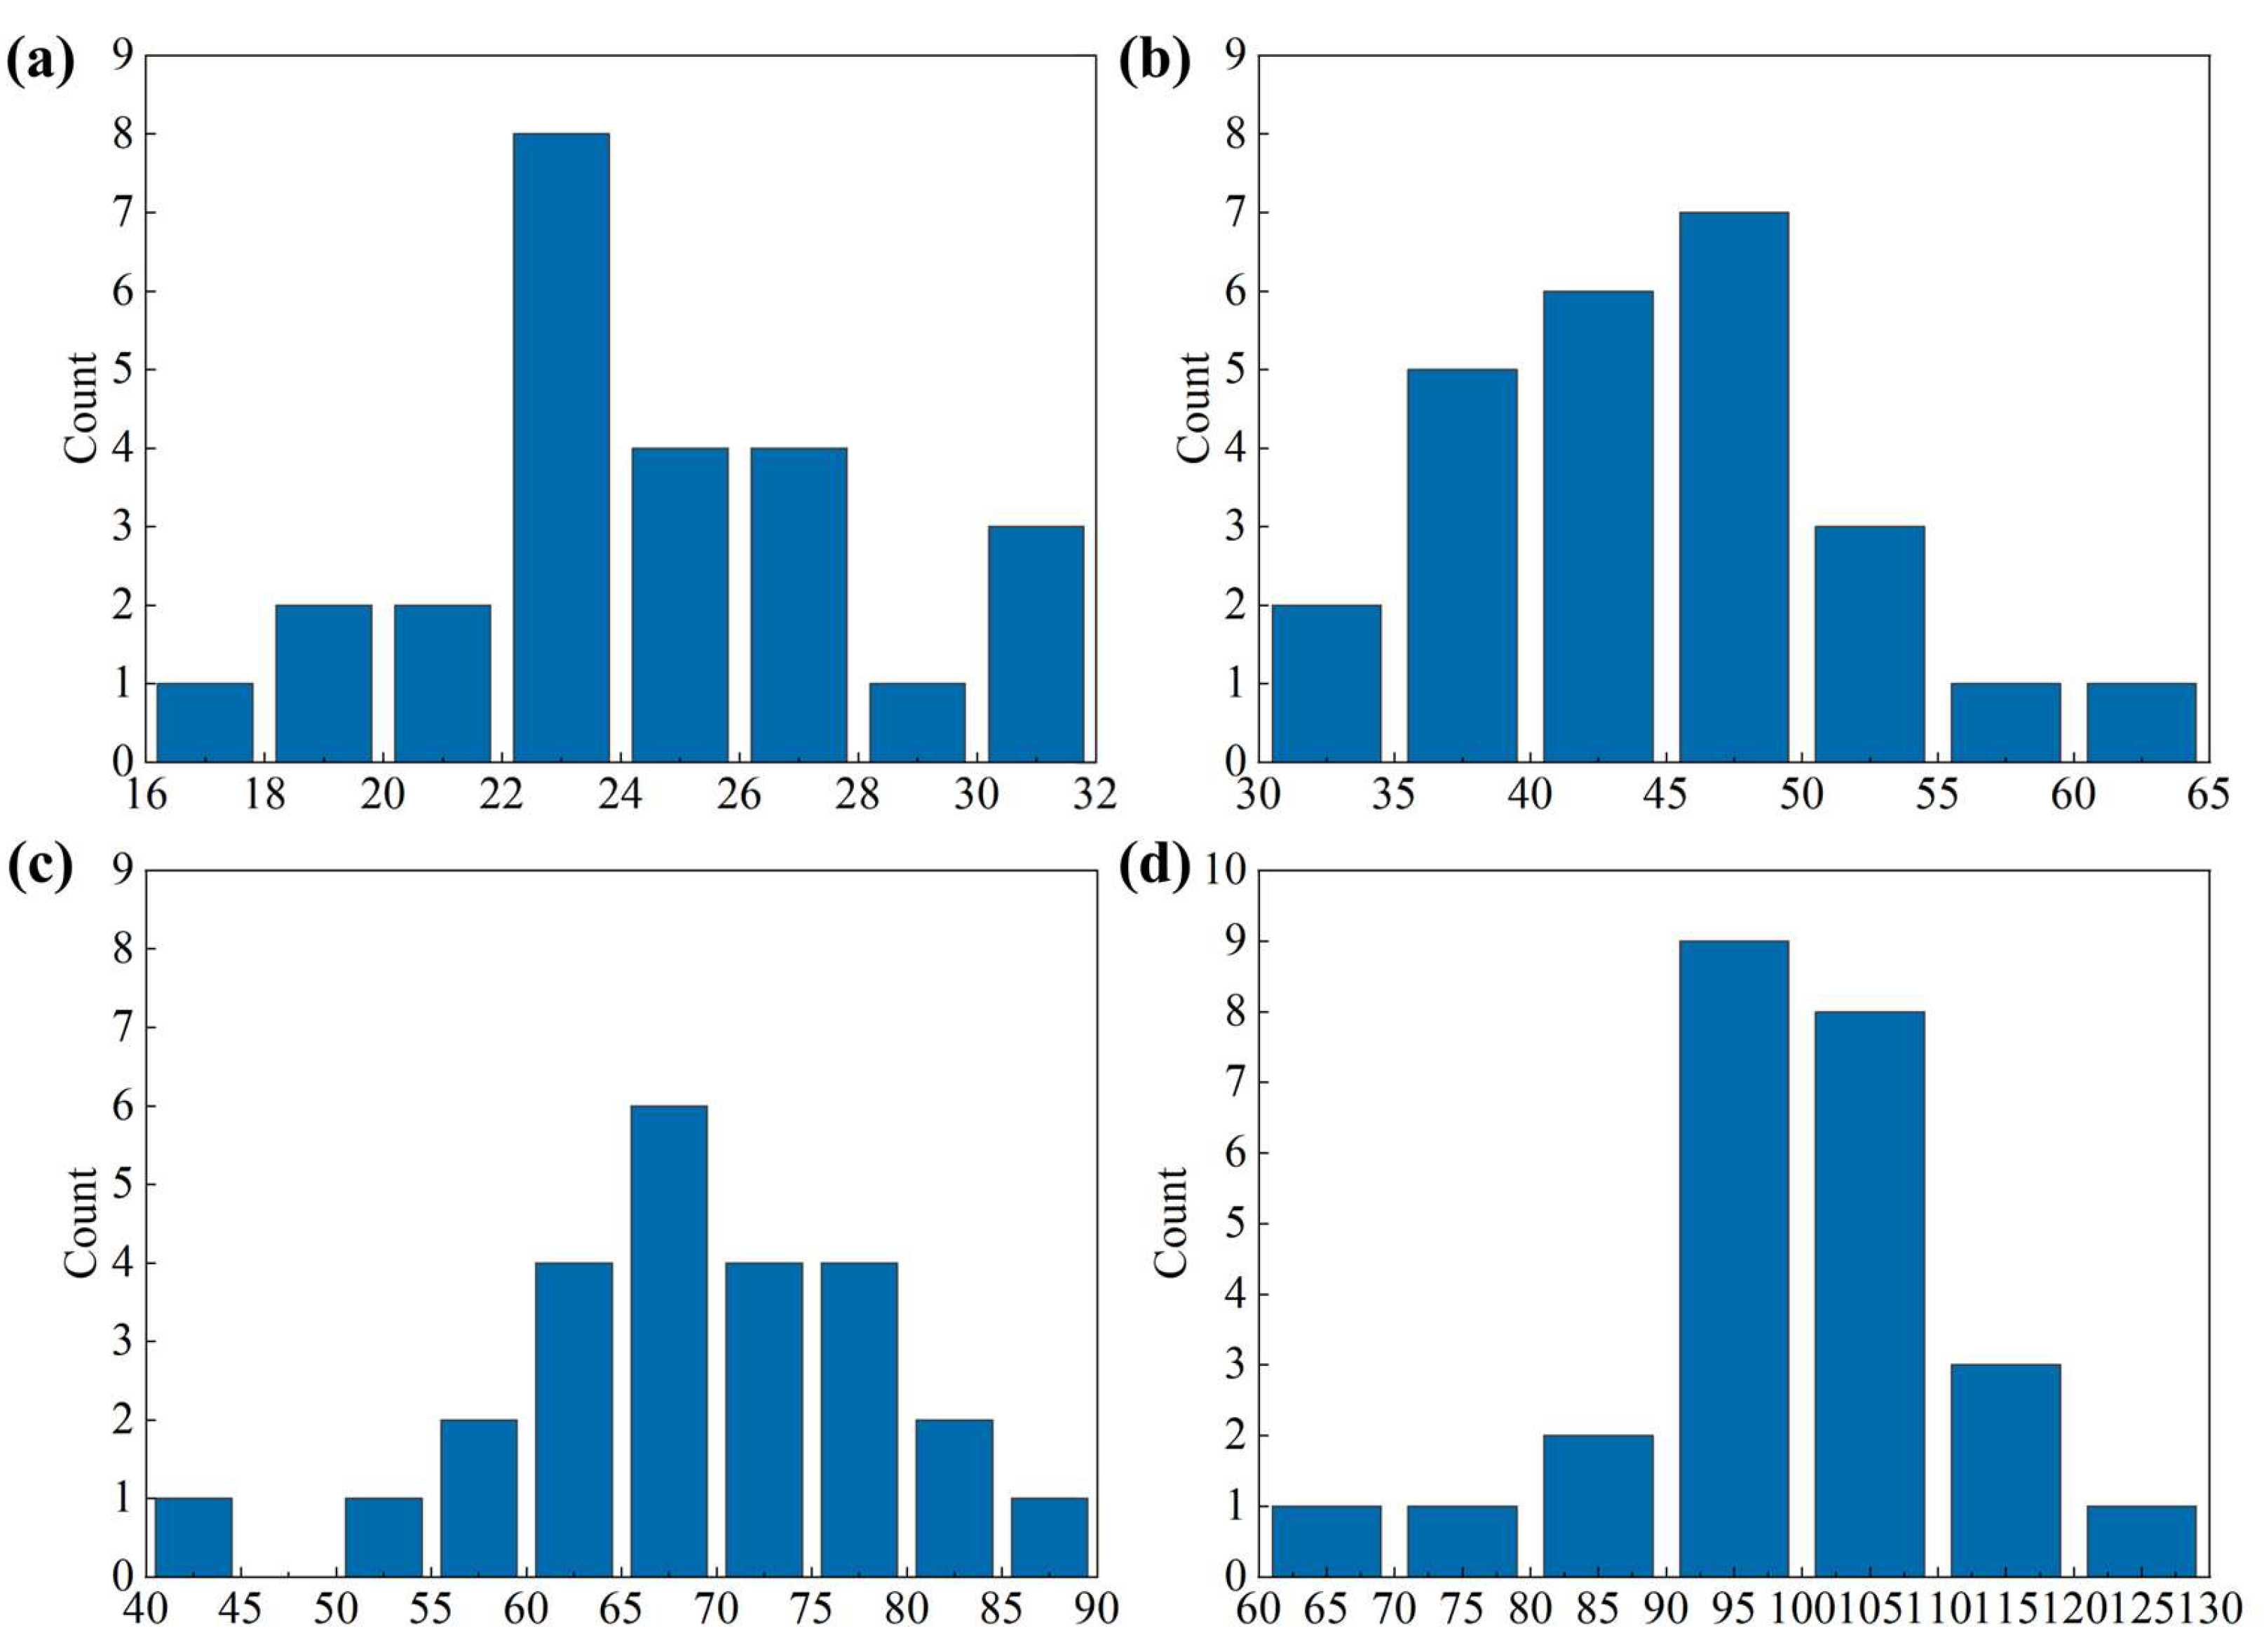
As illustrated in Figure 5, a clear trend is observed between laser power and crack characteristics. With increasing laser power, the overall number of cracks per unit area decreases, while the average crack length increases, as confirmed by quantitative analysis using Nano Measurer software(1.2) (24.608 μm at 120 W, 46.645 μm at 140 W, 68.975 μm at 160 W, and 98.960 μm at 180 W). For each condition, cracks were quantified from SEM images acquired at 800× magnification, corresponding to a scanned area of approximately 160 × 110 μm2, with three randomly selected regions analyzed per sample. Only cracks with a minimum detectable length of ≥1 μm were considered valid, and the measurement uncertainty was estimated to be ±0.5 μm based on repeated evaluations. The resulting datasets (25 cracks per condition) are presented as histograms in Figure 6, which clearly reveal the distribution of crack lengths in addition to their mean values. Statistical analysis using one-way ANOVA confirms that the differences among the four groups are highly significant (F = 359.63, p < 0.001). It should be noted that all cracks reported in this study are surface cracks observed directly from SEM images. At the lowest laser power of 120 W, cracks appear in dense clusters with crescent-like morphologies, often oriented perpendicular to the manufacturing direction and accompanied by micro-pores concentrated at track overlap regions. These pores are primarily attributed to the vaporization or incomplete evacuation of low-boiling-point elements during SLM, which promotes their agglomeration [45]. The combination of qualitative SEM observations, quantitative crack analysis, and statistical distribution assessment provides a more transparent and rigorous basis for understanding the influence of laser power on crack manufacture in SLM-fabricated Al-Li alloys.
In contrast, at higher powers (160–180 W), cracks become fewer but extend across multiple molten layers, exhibiting typical thermal-crack features aligned with the build direction. Their enlargement correlates with the enhanced re-melting capacity of the laser, which fosters columnar crystal growth across several layers. Low-melting-point eutectic phases segregated at columnar boundaries act as weak zones; under lateral tensile stress in the molten pool, these regions fracture and initiate cracks. Residual stress accumulation further drives their propagation and lengthening.
Overall, the observed negative correlation between crack count and laser power, and the positive correlation between crack length and laser power, reflect the interplay of solidification segregation and columnar crystal development, which destabilize local solid–liquid interfaces and promote crack evolution [46].
To further elucidate the crystalline characteristics of the SLM-produced aluminum–lithium alloys under different laser powers, Electron Backscatter Diffraction (EBSD) analysis was performed, as shown in Figure 7. The Inverse Pole Figure (IPF) maps in Figure 7a,b reveal a bimodal microstructure consisting of columnar and equiaxed grains, a typical feature of SLM-processed metals [47,48]. The corresponding grain boundary maps in Figure 7c,d distinguish high-angle grain boundaries (HAGBs, >15°, black) and low-angle grain boundaries (LAGBs, 2–15°, red), highlighting the prevalence of LAGBs. Quantitative analysis shows that with increasing laser power, the fraction of HAGBs rises from ~35% to ~52%, while the average grain size decreases from ~9.6 µm to ~6.8 µm. These results indicate that higher laser power promotes grain refinement and enhances the formation of high-angle boundaries, which are generally beneficial for hindering dislocation motion and improving mechanical strength. Kernel Average Misorientation (KAM) maps in Figure 7e,f, calculated with a maximum misorientation of 5° between neighboring points, provide insights into localized strain distributions. The predominance of green–yellow regions at higher laser powers indicates enhanced residual strain accommodation through dislocation structures [49]. This microstructural evolution correlates well with the observed increase in hardness and tensile performance, establishing a clear grain boundary–mechanical property linkage.
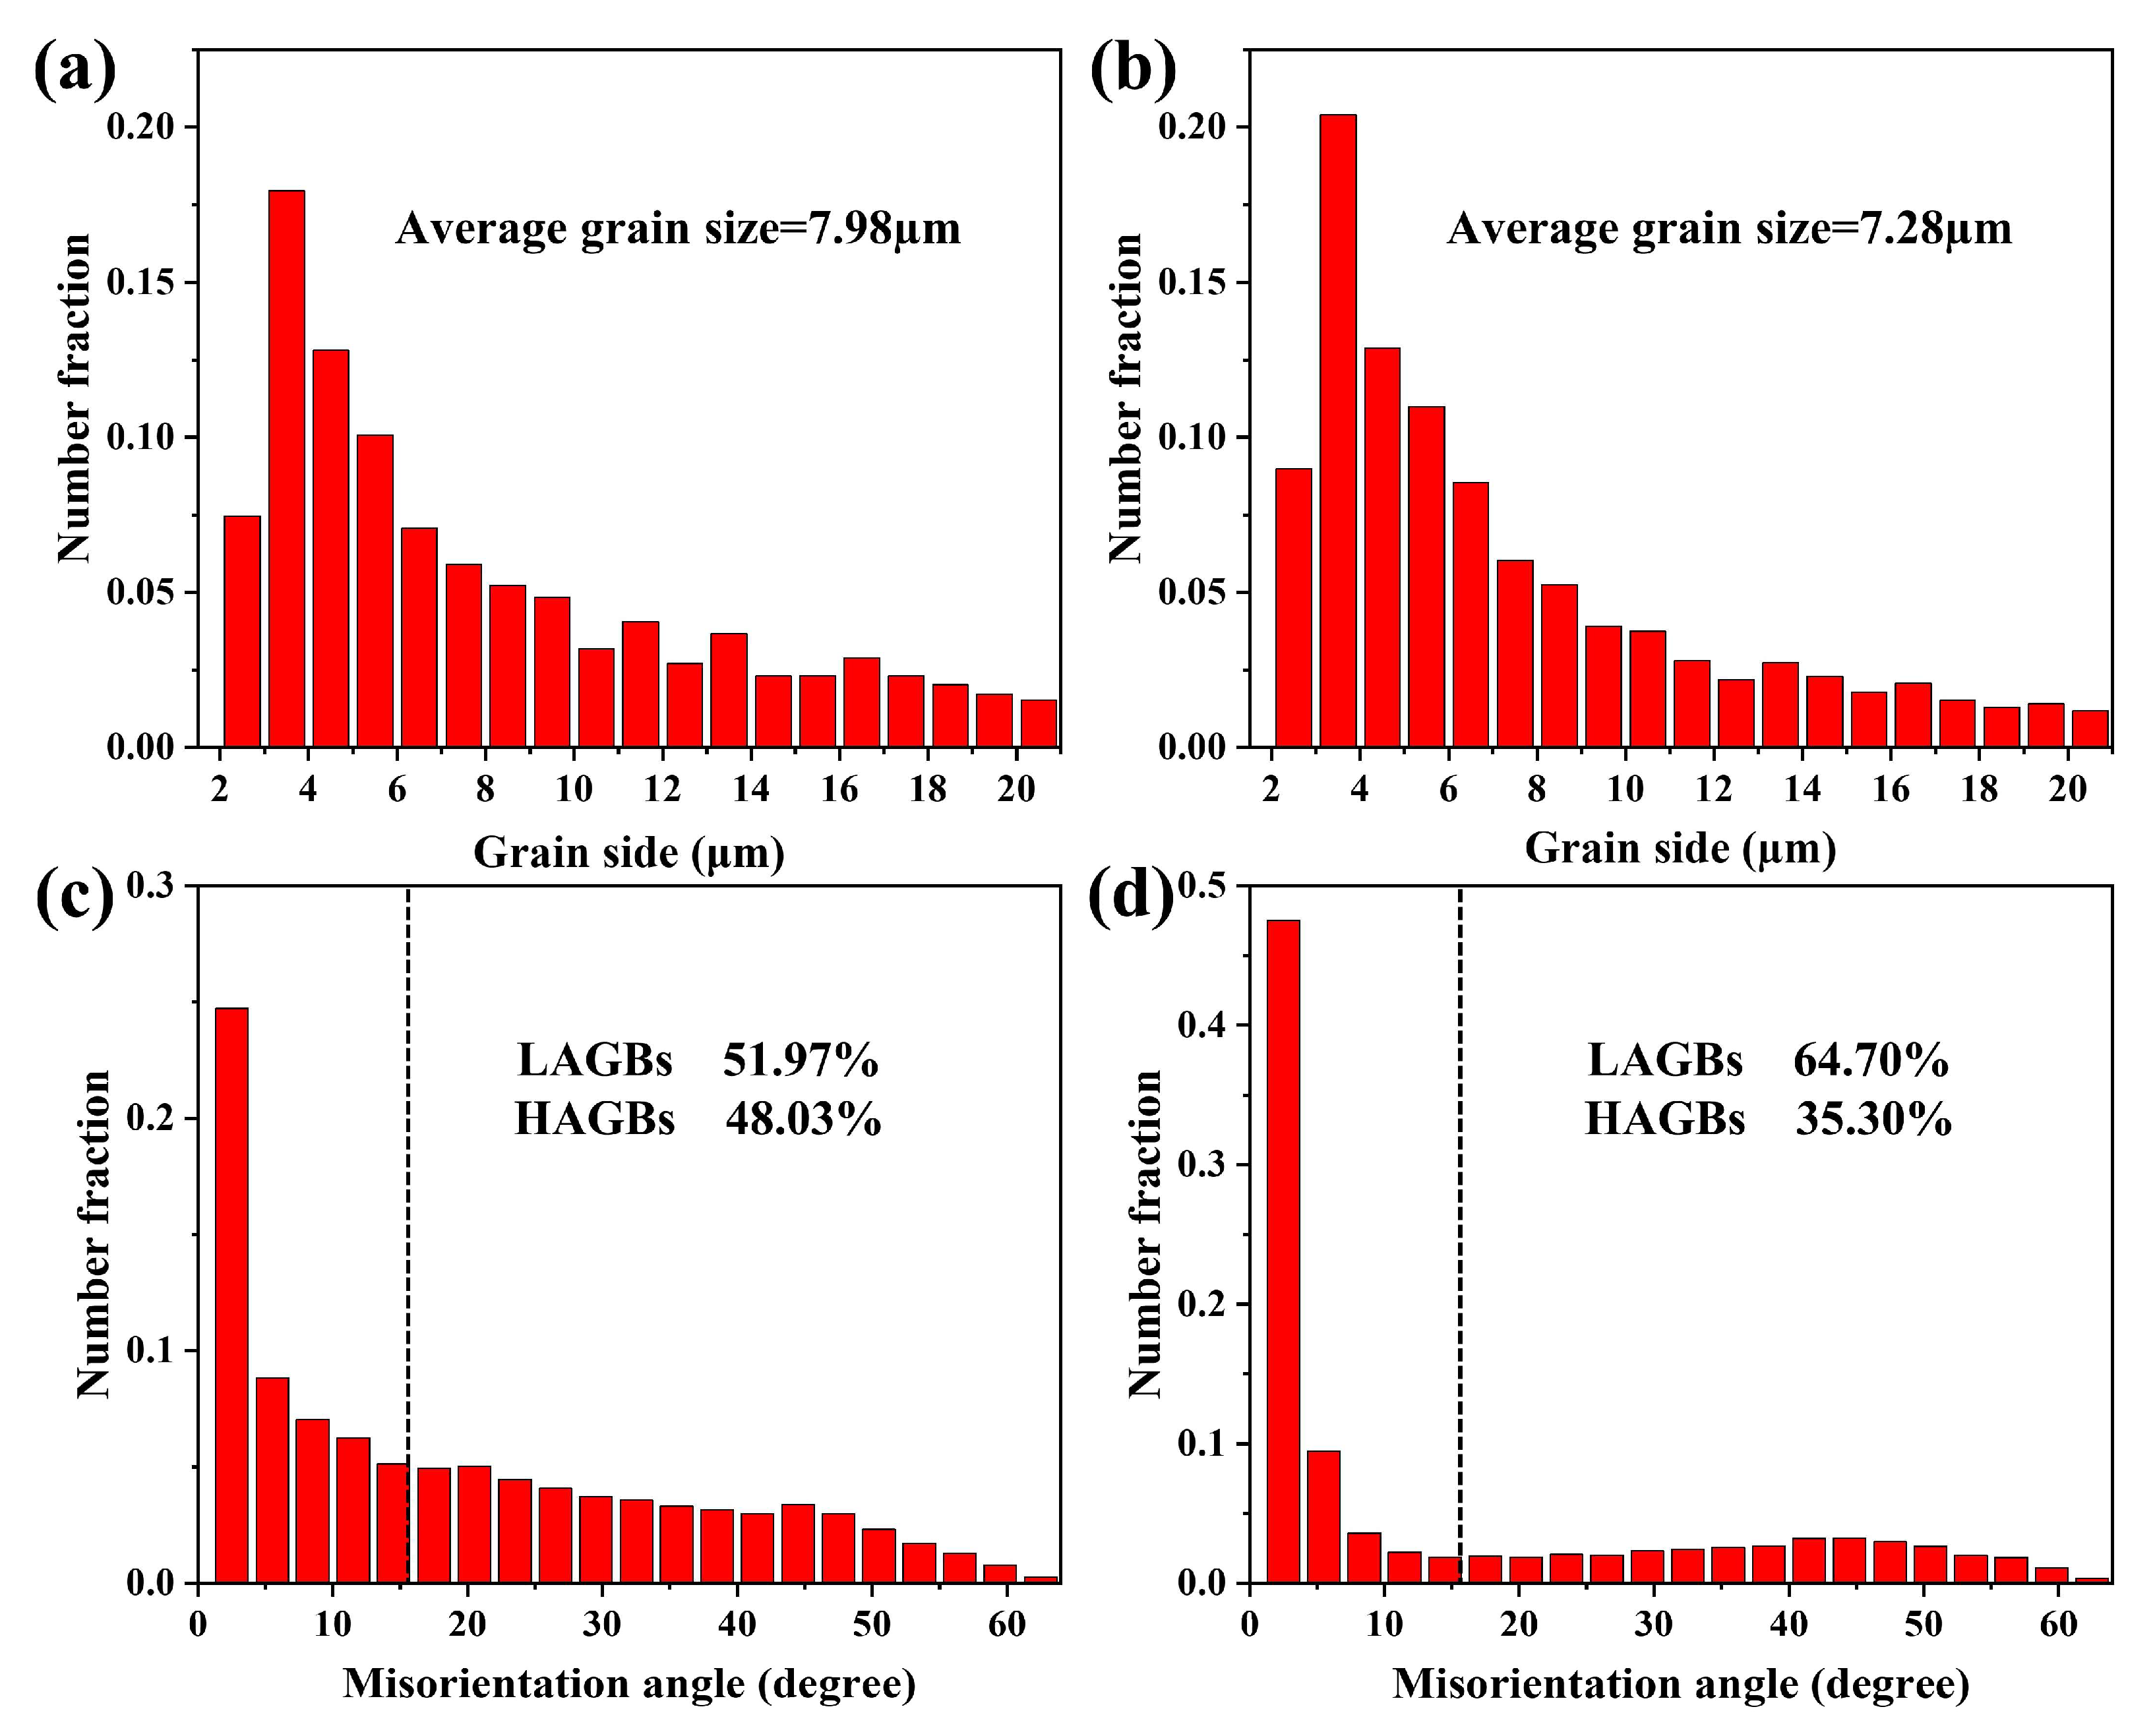
Figure 8a,b present the grain size distributions obtained from Electron Backscatter Diffraction (EBSD) analysis. The average grain sizes at laser powers of 120 W and 180 W are 7.98 μm and 7.28 μm, respectively, with the higher laser power yielding a larger fraction of finer grains. This refinement is attributed to the increased temperature gradient at higher laser powers, which enhances nucleation rates and limits grain growth. The angular misorientation distributions, shown in Figure 8c,d, indicate that within the 0–5° range, the frequencies of orientation differences are 33.5% and 56.9% for the 120 W and 180 W samples, respectively, reflecting a pronounced prevalence of low-angle grain boundaries (LAGBs). These LAGBs, characterized by high dislocation densities, serve to accommodate residual thermal strains induced by the rapid cooling intrinsic to the Selective Laser Melting (SLM) process [50].
Importantly, these microstructural features exhibit a direct correlation with the mechanical properties. The finer grains and increased LAGB fraction in the 180 W sample act as effective barriers to dislocation motion, thereby enhancing hardness and tensile strength. Conversely, the coarser grains and lower LAGB fraction in the 120 W sample result in reduced resistance to dislocation glide, corresponding to lower hardness and diminished tensile performance. This quantitative linkage between grain size, LAGB prevalence, and mechanical response provides a mechanistic basis for the observed variations in hardness and tensile behavior under different laser power conditions, thereby strengthening the microstructure–property correlation.

3.3. Phase Analysis

Figure 9 depicts the X-ray diffraction (XRD) patterns of the metal powder and SLM-manufactured Al-Li alloy samples under different laser power conditions. The XRD results indicate that α-Al is the predominant phase in all SLM specimens, with no other detectable phases. The Al(200) diffraction peak is the strongest, while the Al(111) peak is comparatively weaker, suggesting that the primary grain growth orientation is along the <100> direction, which is commonly observed in additive manufacturing of aluminum alloys [51,52].
Quantitative analysis of the XRD data using Jade software shows that, as the laser power increases from 120 W to 180 W, the overall lattice constant of Al increases from 0.367172 nm to 0.367753 nm, indicating enhanced Li dissolution in the Al matrix and a higher solid solution fraction. A distinct local trend is observed in the diffraction peak corresponding to Al’s (220) plane, which shifts slightly towards higher angles at elevated laser power. This shift reflects minor Li evaporation in the high-temperature SLM environment or local stress relaxation. Since Li atoms are larger than Al atoms, their partial loss slightly reduces the local lattice parameter according to Bragg’s law [51,53]. Nevertheless, the net effect is an increase in lattice constant due to the overall higher Li solubility in the Al matrix. At lower laser power (120 W), diffraction peaks shift slightly to lower angles, reflecting residual tensile stress in the samples. Higher laser power increases the melt pool temperature, promoting stress relief and facilitating higher Li solubility.
Overall, the XRD results suggest that Li evaporation likely occurred during the SLM process, contributing to the observed phase evolution. This is consistent with the relatively low boiling point of Li compared with Al, leading to preferential evaporation under high laser energy input. It should be noted that no direct chemical composition analysis (such as ICP) was performed in this study to quantitatively confirm Li depletion. This represents a limitation of the present work, and future studies will incorporate direct compositional characterization to validate and quantify Li loss.

3.4. Microhardness and Residual Stress Analysis

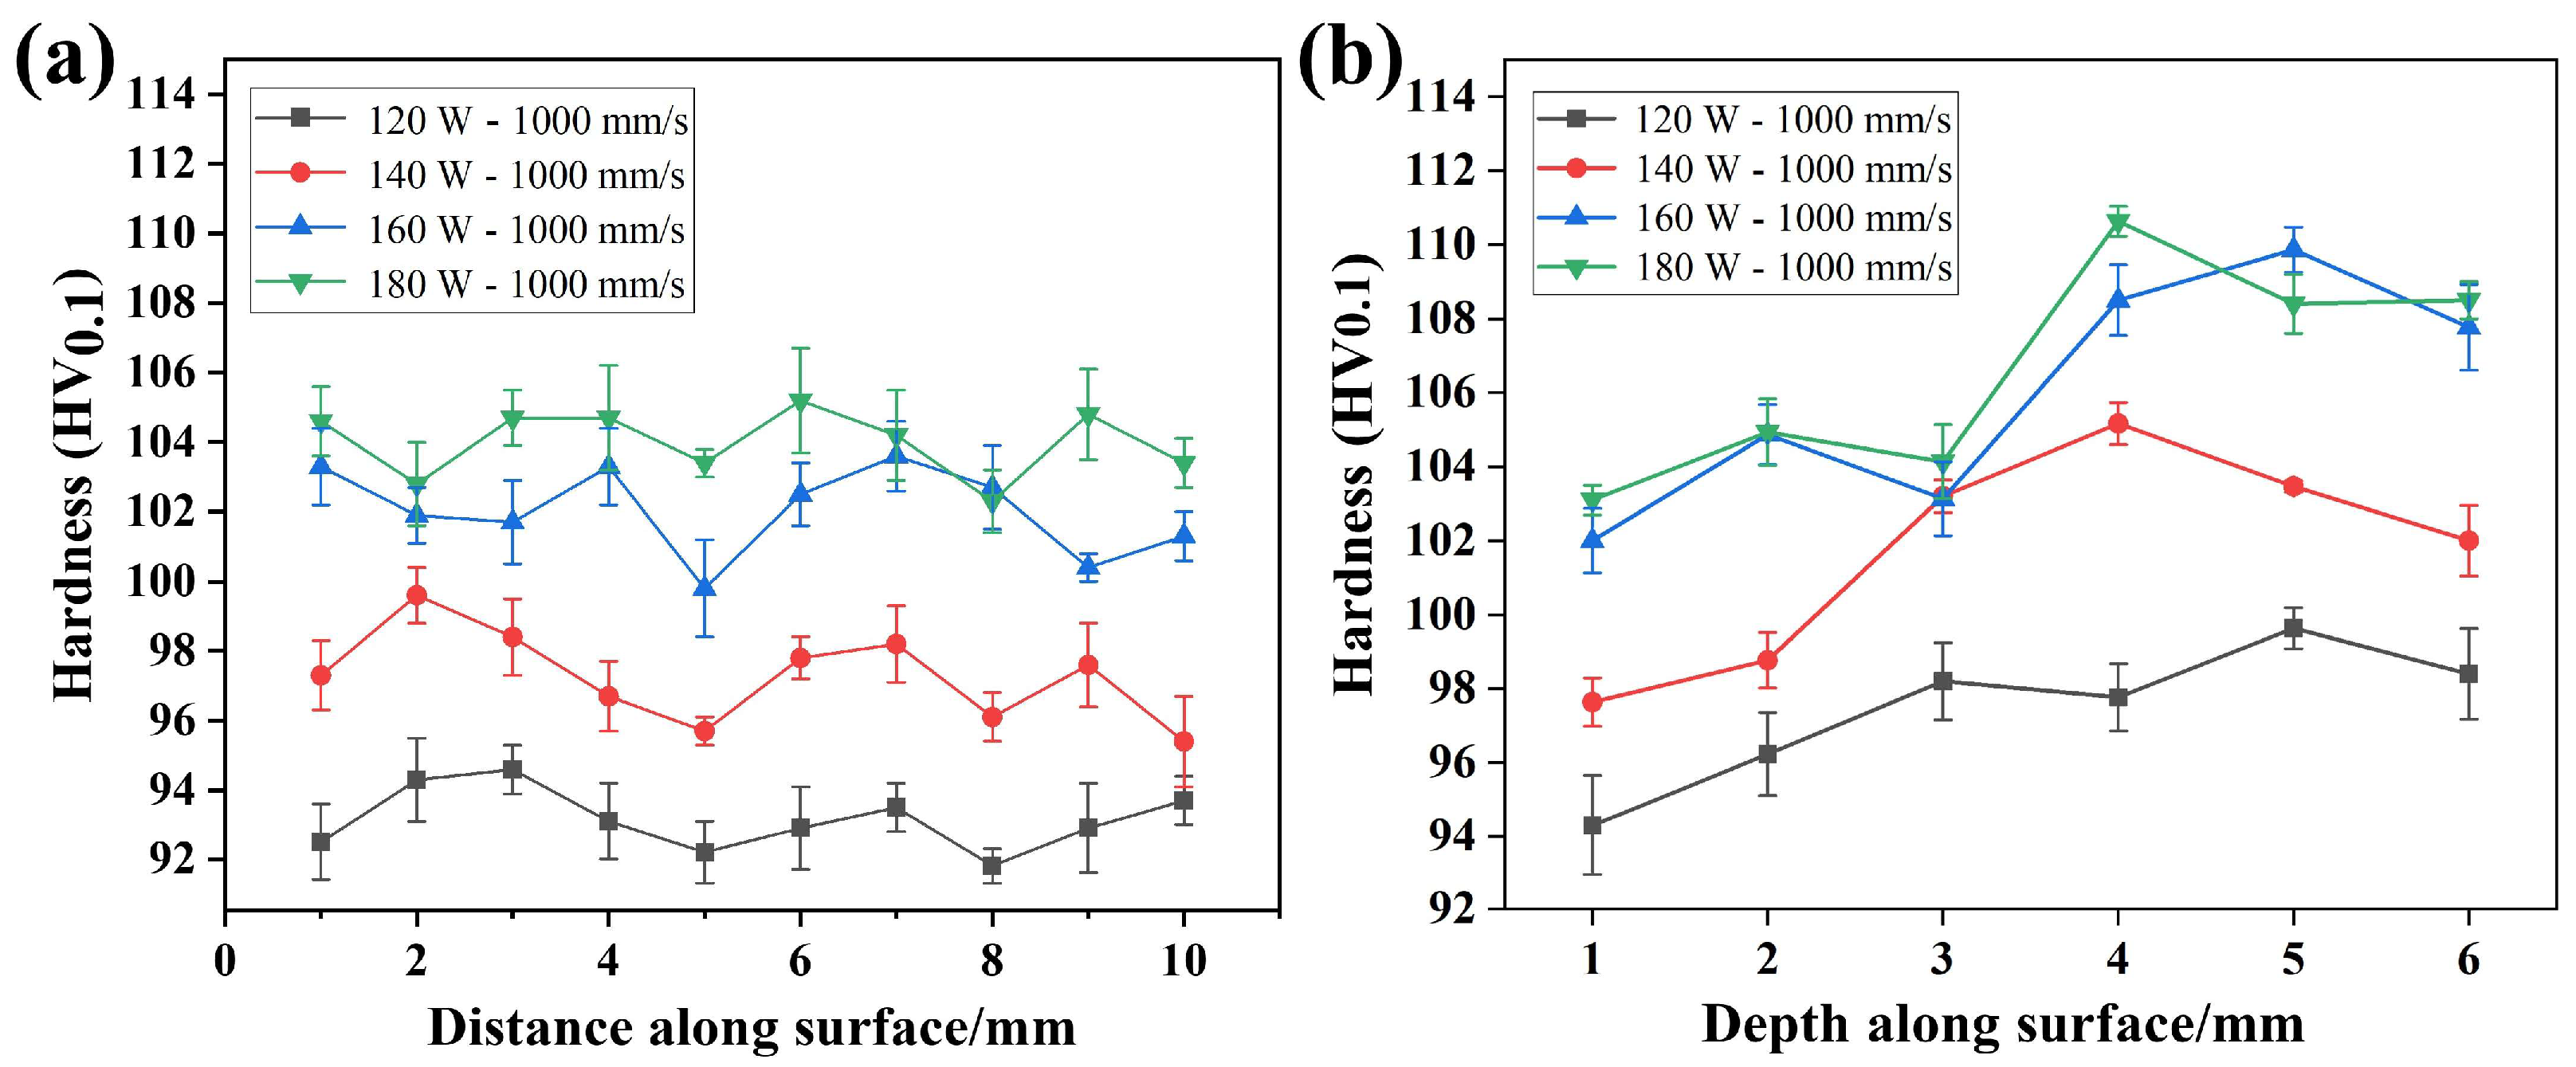
Figure 10 showcases the microhardness values of the SLM aluminum–lithium alloy at different laser power levels. An evident ascending trend in microhardness of the sample surface is observed with increasing laser power. The presence of residual stress within the specimens during the SLM process plays a pivotal role in influencing the microhardness, particularly as higher residual stress can contribute to enhanced microhardness in densely consolidated specimens. As the laser power is augmented, the mean microhardness values of the sample surface correspondingly measure 95.27, 97.28, 102.9, and 105.15 HV0.1, respectively. In tandem with the XRD outcomes, the augmentation in laser power engenders an increased solid solution content within the fabricated specimens, thereby leading to elevated microhardness levels.
Furthermore, it is noteworthy that a discernible reduction in microhardness is discerned in the uppermost region of the manufactured specimens along the build direction. This phenomenon can be attributed to the inherent nature of the SLM process, which operates in a bottom-up manner. The solidification of each subsequent layer upon the preceding one can be likened to a successive re-melting process. Consequently, the cumulative effects of residual stress give rise to localized crack propagation, ultimately leading to reduced local density and, thereby, a diminished microhardness profile in the upper regions.
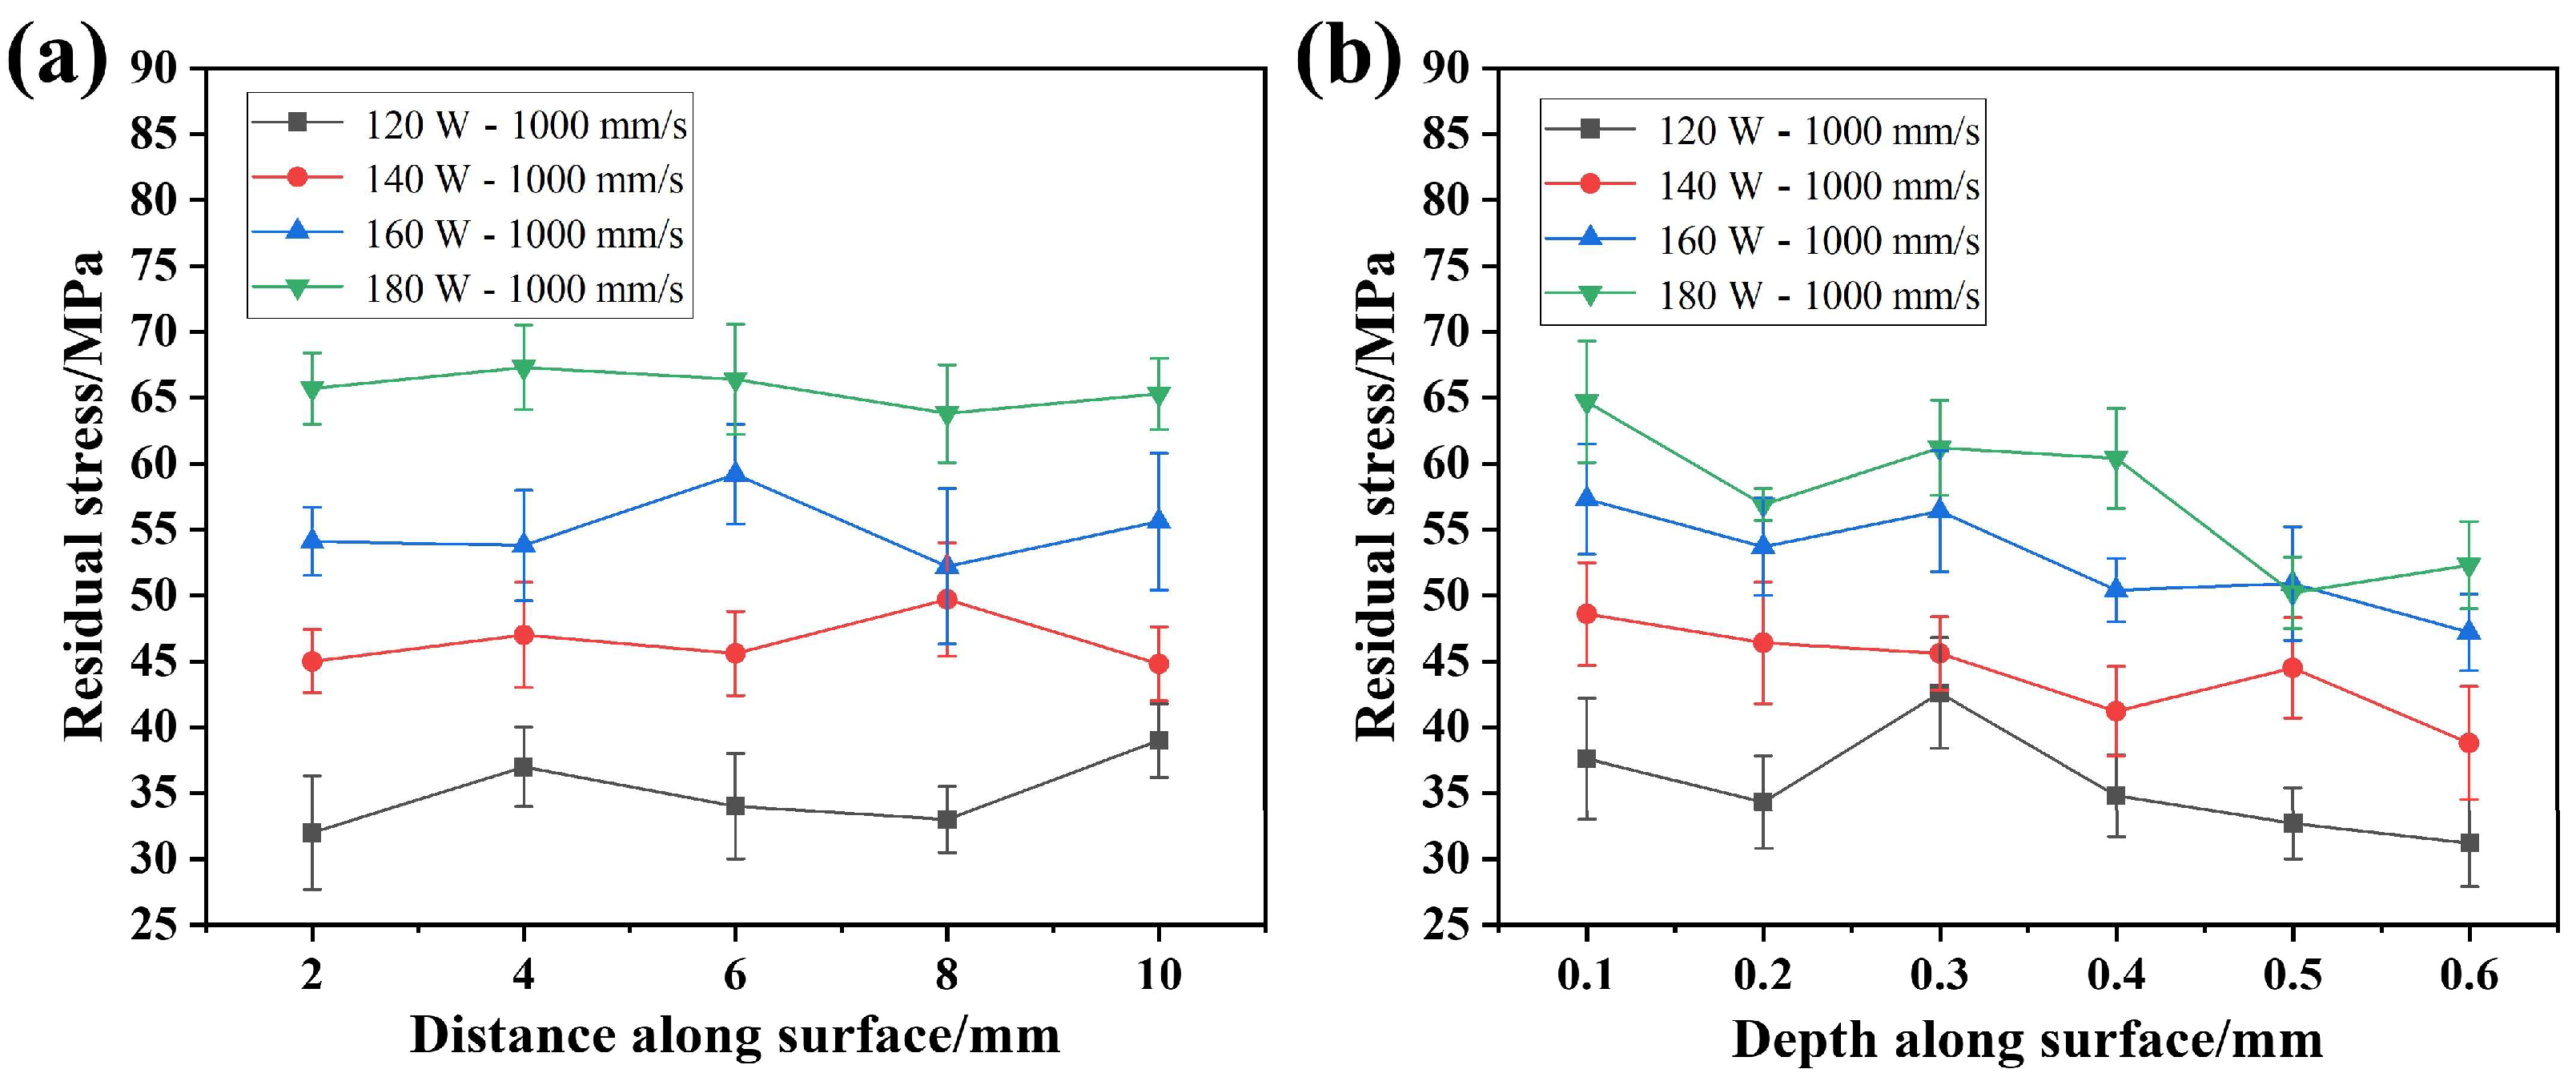
Figure 11 illustrates the evolution of residual stress values of SLM aluminum–lithium alloy samples with varying laser power levels. The stress state at the uppermost region of the SLM-manufactured components is identified as residual tensile stress, and it is evident that the residual stress values exhibit an increasing trend with escalating laser power. This observation unveils a complex interplay between the thermal and mechanical dynamics inherent in the SLM fabrication process.
During SLM fabrication, the absorption of laser energy by aluminum–lithium alloy powder induces rapid melting followed by rapid solidification and cooling within the melt pool. This process engenders substantial temperature gradients and exceedingly rapid cooling rates in the vicinity of the melt pool, thereby inducing notably high levels of thermal and residual stresses within the internal structure of the specimen [54,55]. As the laser power is augmented, the temperature and temperature gradients within the melt pool intensify, thereby magnifying the thermal stress effects. Additionally, the enlargement of the melt pool dimensions, coupled with increased volume contraction upon solidification, leads to elevated stress levels [56]. Consequently, the observed escalation in residual stress values with increasing laser power is a direct consequence of these interconnected thermal and mechanical influences. Additionally, the residual stress value of the sample exhibits a decreasing trend from the top region downwards along the depth direction. This is attributed to the cumulative nature of residual stress resulting from the bottom-up fabrication characteristic of SLM.
The cumulative effects of residual stresses, stemming from the layer-by-layer fabrication process and the rapid thermal cycles inherent to SLM, serve to amplify the reservoir of residual stresses. This, in turn, contributes as an auxiliary driving force to the initiation and propagation of cracks. The insights garnered from Figure 11 not only unravel the intricate interplay between laser power and residual stress distribution but also provide valuable cues for comprehending the underlying nexus between phase transition behaviors and mechanical properties in SLM-fabricated aluminum–lithium alloys.

3.5. Tensile Behavior and Fracture Morphology

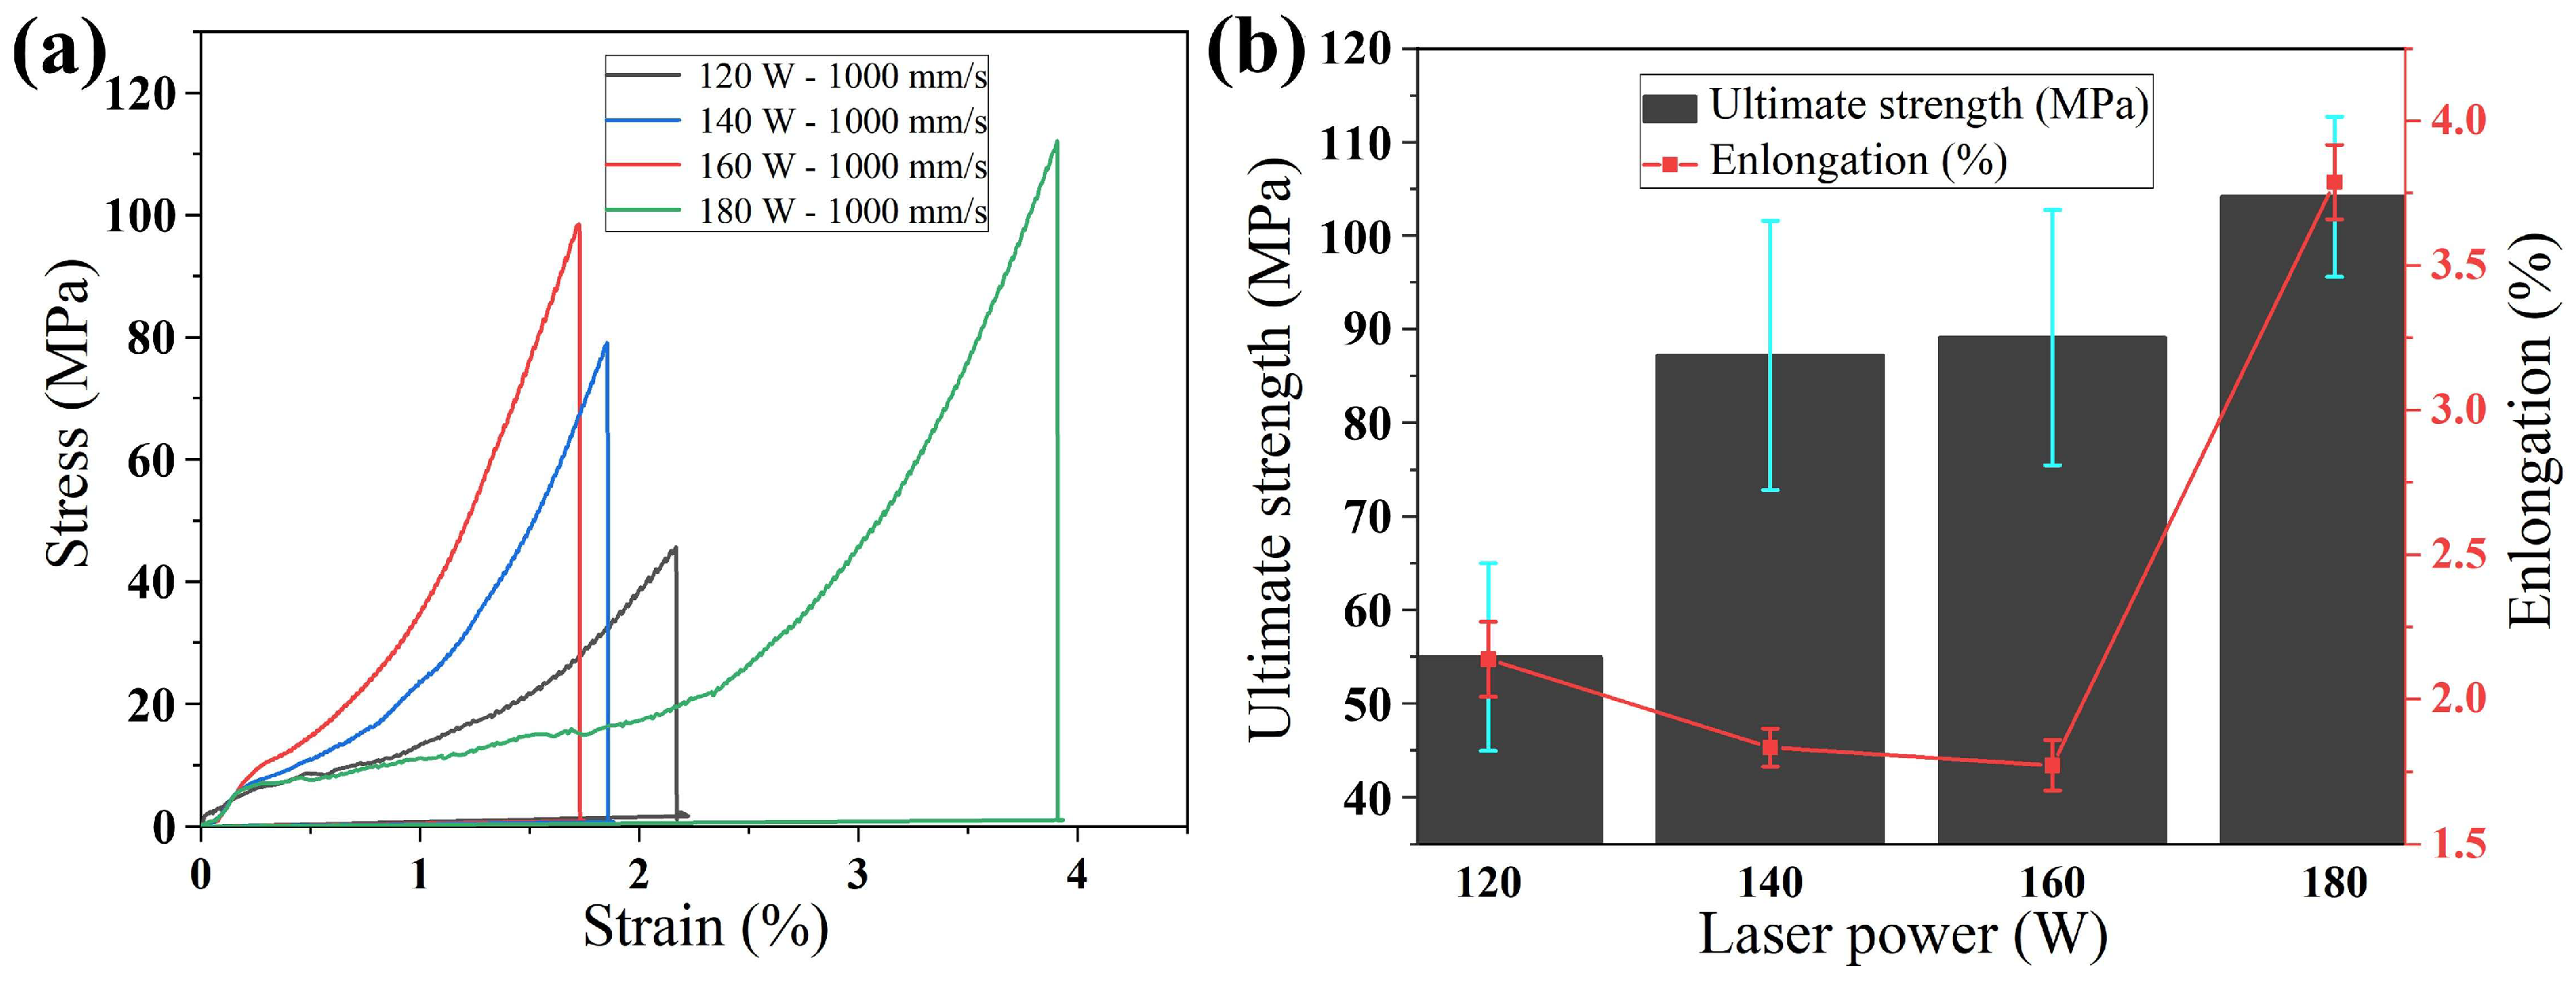
Figure 12a presents the engineering stress–strain curves for the SLM aluminum–lithium alloy, obtained directly from the tensile testing machine, with specimen geometry specified in Figure 2. The conversion from engineering to true stress is explicitly explained using standard formulas:
σ t = σ e ( 1 + σ e )
ε t = ln ( 1 + ε e )
Figure 12b summarizes the corresponding tensile properties under different laser power conditions. Notably, an investigation of the impact of laser power reveals a clear trend, with the ultimate tensile strength reaching 104.1472 MPa at 180 W, accompanied by an elongation that first decreases and then increases. Impressively, the highest elongation of 3.933% is observed at 180 W. This mechanical behavior results from the complex interplay of microstructural features and thermal dynamics inherent to SLM, which fundamentally govern tensile response. The observed variation in tensile properties is attributed to differences in specimen morphology across laser power regimes. Lower power settings yield specimens with reduced density, promoting the pronounced presence of defects such as pores and cracks. The prevalence of these defects significantly diminishes tensile performance, leading to less stable and lower overall mechanical properties. Moreover, the distinctive “layer-by-layer” SLM fabrication process, characterized by rapid heating and cooling cycles, profoundly affects solidification, with the wide solidification temperature range predisposing specimens to periodic thermal cracking and increased fracture susceptibility under low stress. For reference, conventional cast Al-3Li-5.5Mg-0.5Mn-0.1Zr exhibits a tensile strength of approximately 200 MPa and elongation of 2.3% [57]. In contrast, the SLM-processed Al-3.2Li-0.08Fe-0.02Si-Al powder in this study achieves a maximum ultimate tensile strength of 104.15 MPa at 180 W, with elongation showing an initial decline followed by an increase, peaking at 3.93% at the same power. The relatively lower strength compared to conventional cast alloys is attributed to the simpler laboratory powder composition, lacking additional strengthening elements such as Mg, Mn, and Zr. Nevertheless, the observed ductility indicates that the SLM process produces a microstructure capable of plastic deformation, and further optimization of powder composition or post-processing could enhance mechanical performance toward aerospace-grade benchmarks.
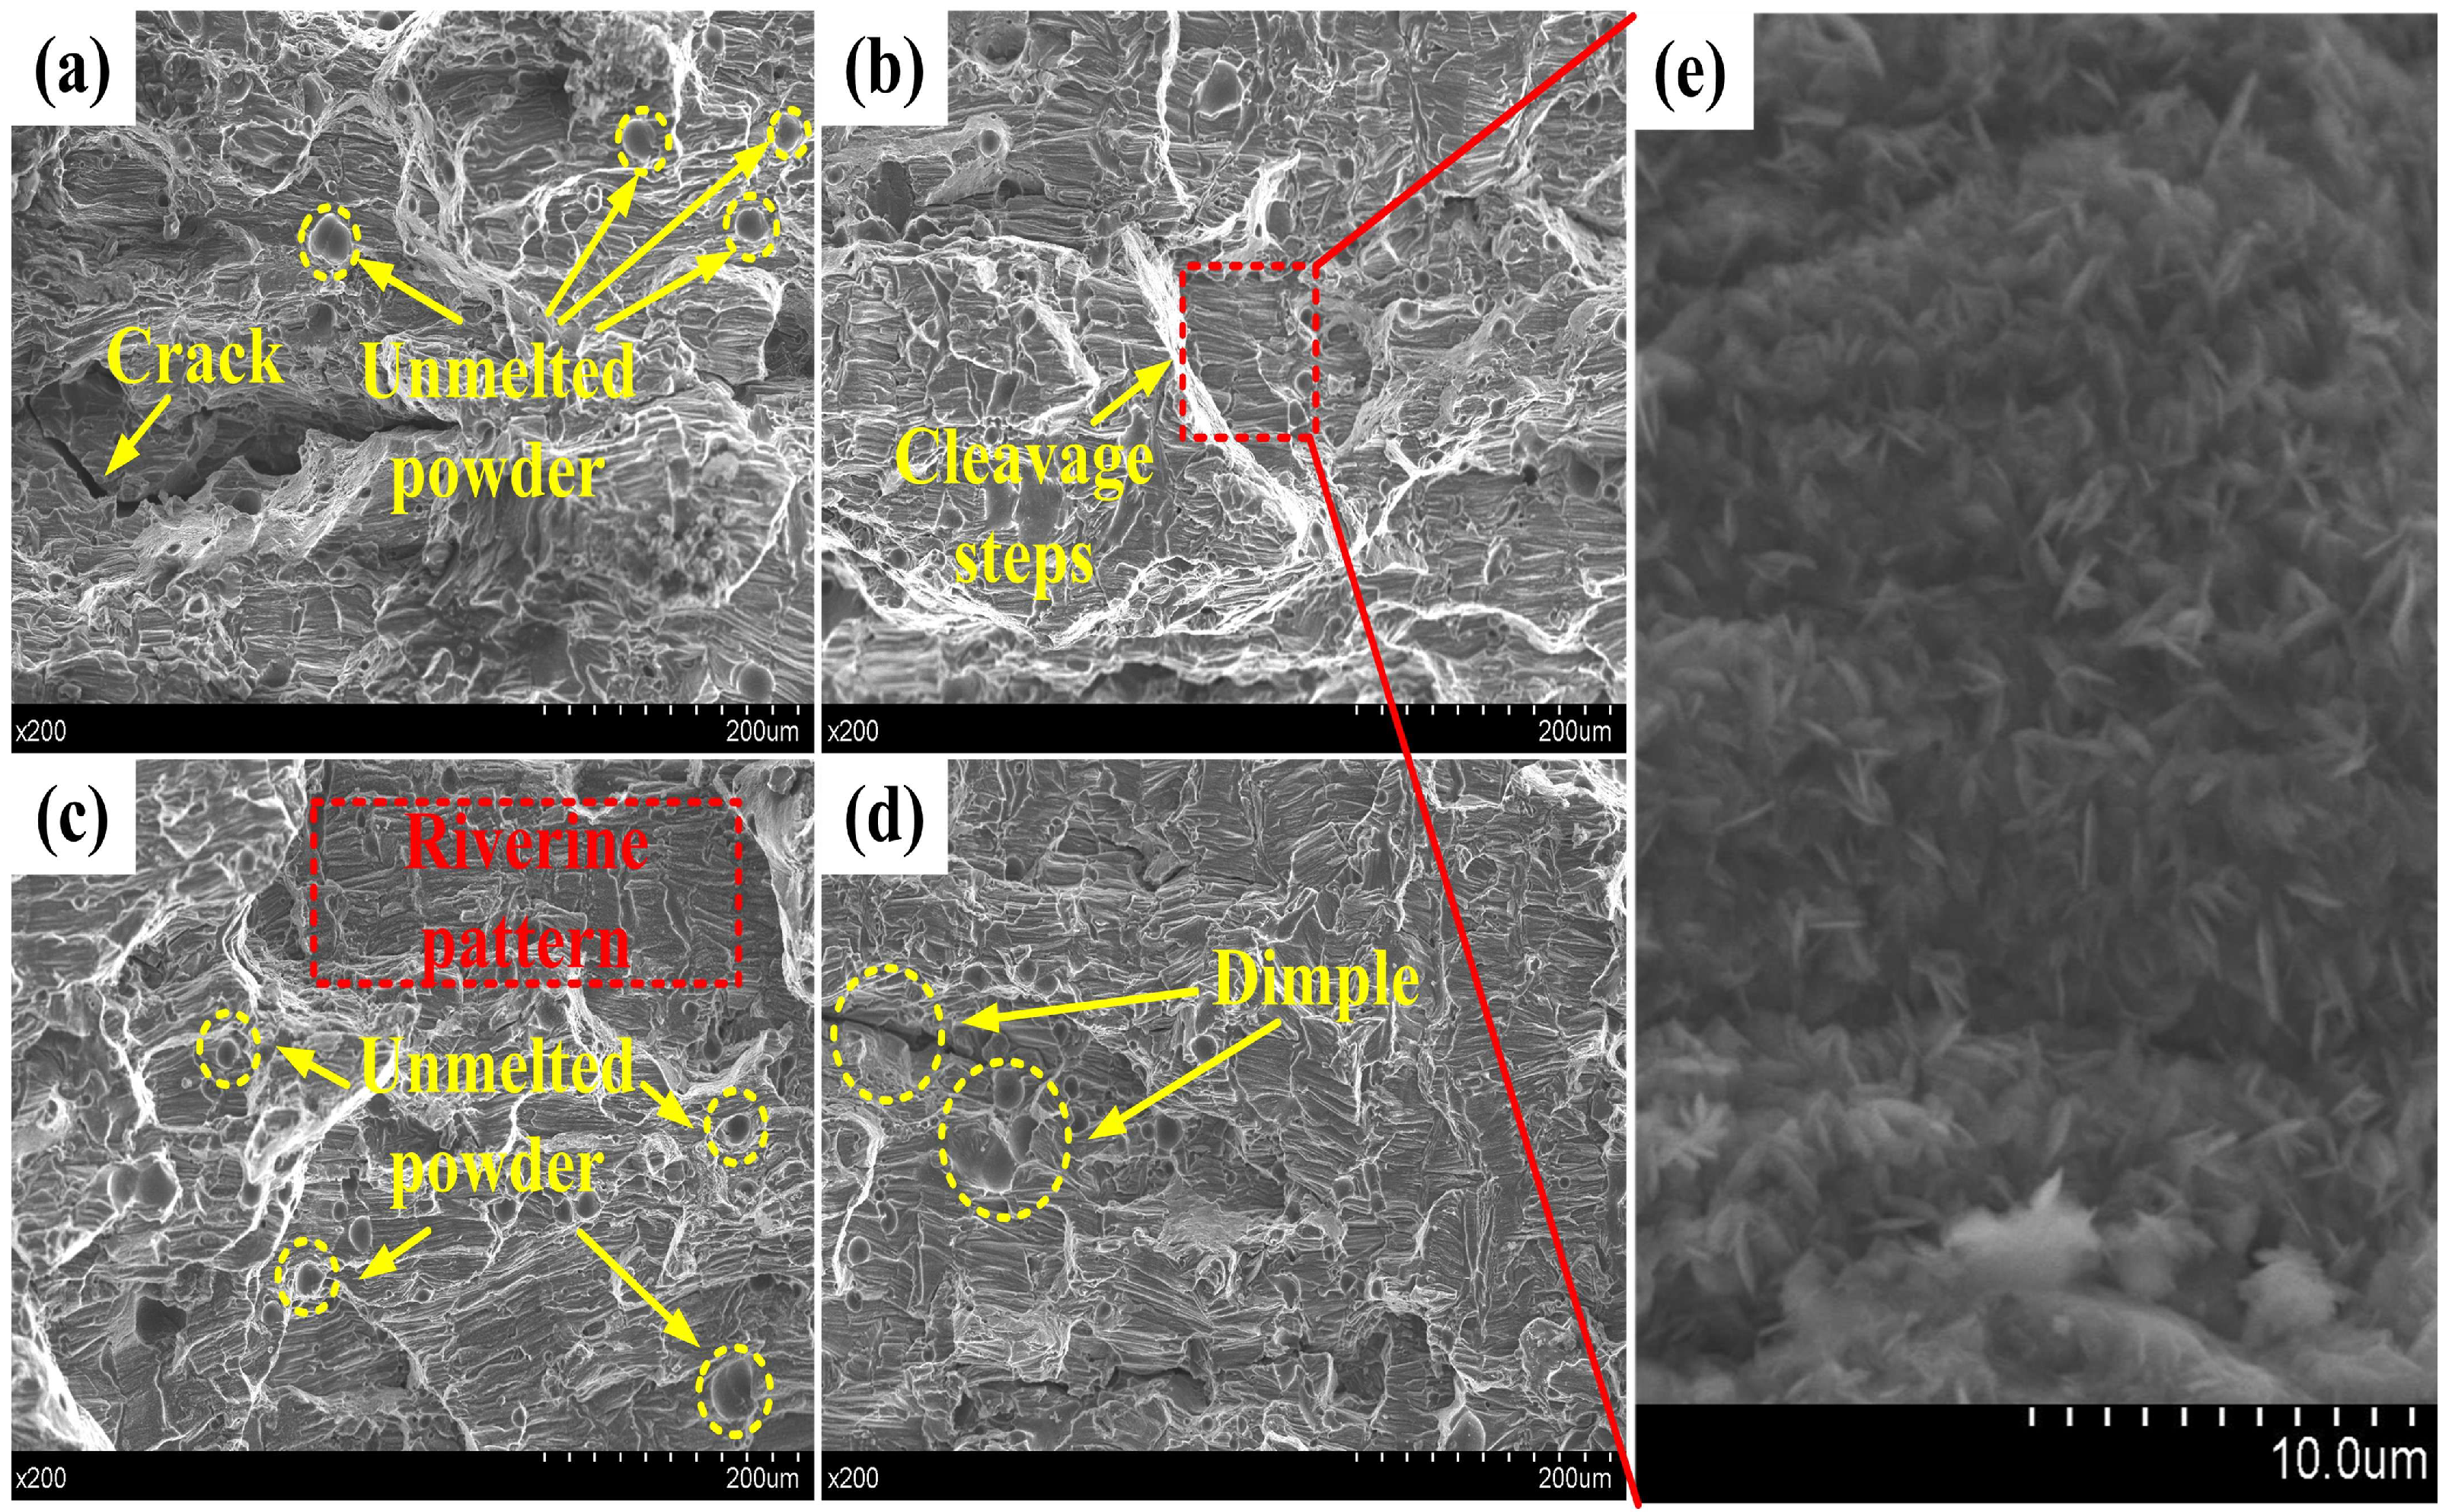
The fracture morphology of SLM-fabricated aluminum–lithium alloy at room temperature is depicted in Figure 13. Evident from the micrographs is the conspicuous presence of numerous unmelted powder particles along the fracture surfaces, which inherently contribute to the initiation of voids. These voids serve as stress concentrators during tensile deformation, thereby facilitating brittle fracture modes. The fracture surfaces are predominantly characterized by transgranular fractures, exhibiting an intricate array of stepped features and meandering patterns. Microscopically, these patterns emanate from an amalgamation of small fracture facets corresponding to individual crystallographic planes, as exemplified in Figure 13e. The unmelted particles and voids clearly demonstrate the microstructural origins of crack initiation and propagation, establishing a direct link between microstructure and tensile behavior.
The observed fracture characteristics evolve distinctly with varying laser power. Under lower laser power settings, conspicuous cracks and associated voids are discernible, frequently nucleating around unmelted powder particles and pore clusters. Fractures in proximity to these defects are particularly prone to propagation, highlighting the role of process-induced microstructural heterogeneities. Additionally, stepped topography, tear ridges, and ripples underscore the localized stress concentration and brittle fracture behavior. As laser power increases, the distribution of tear ridges becomes more uniform and dense, accompanied by the emergence of sporadic circular dimples. This transition from quasi-cleavage fracture to a mixed-mode fracture signifies improved ductility, reflecting the reduction in defects and more homogeneous microstructure. Overall, the fracture evolution clearly demonstrates how cracks, voids, and microstructural features jointly govern the tensile performance of SLM-fabricated Al-Li alloys.

3.6. Mechanism of Cracking Manufacturation

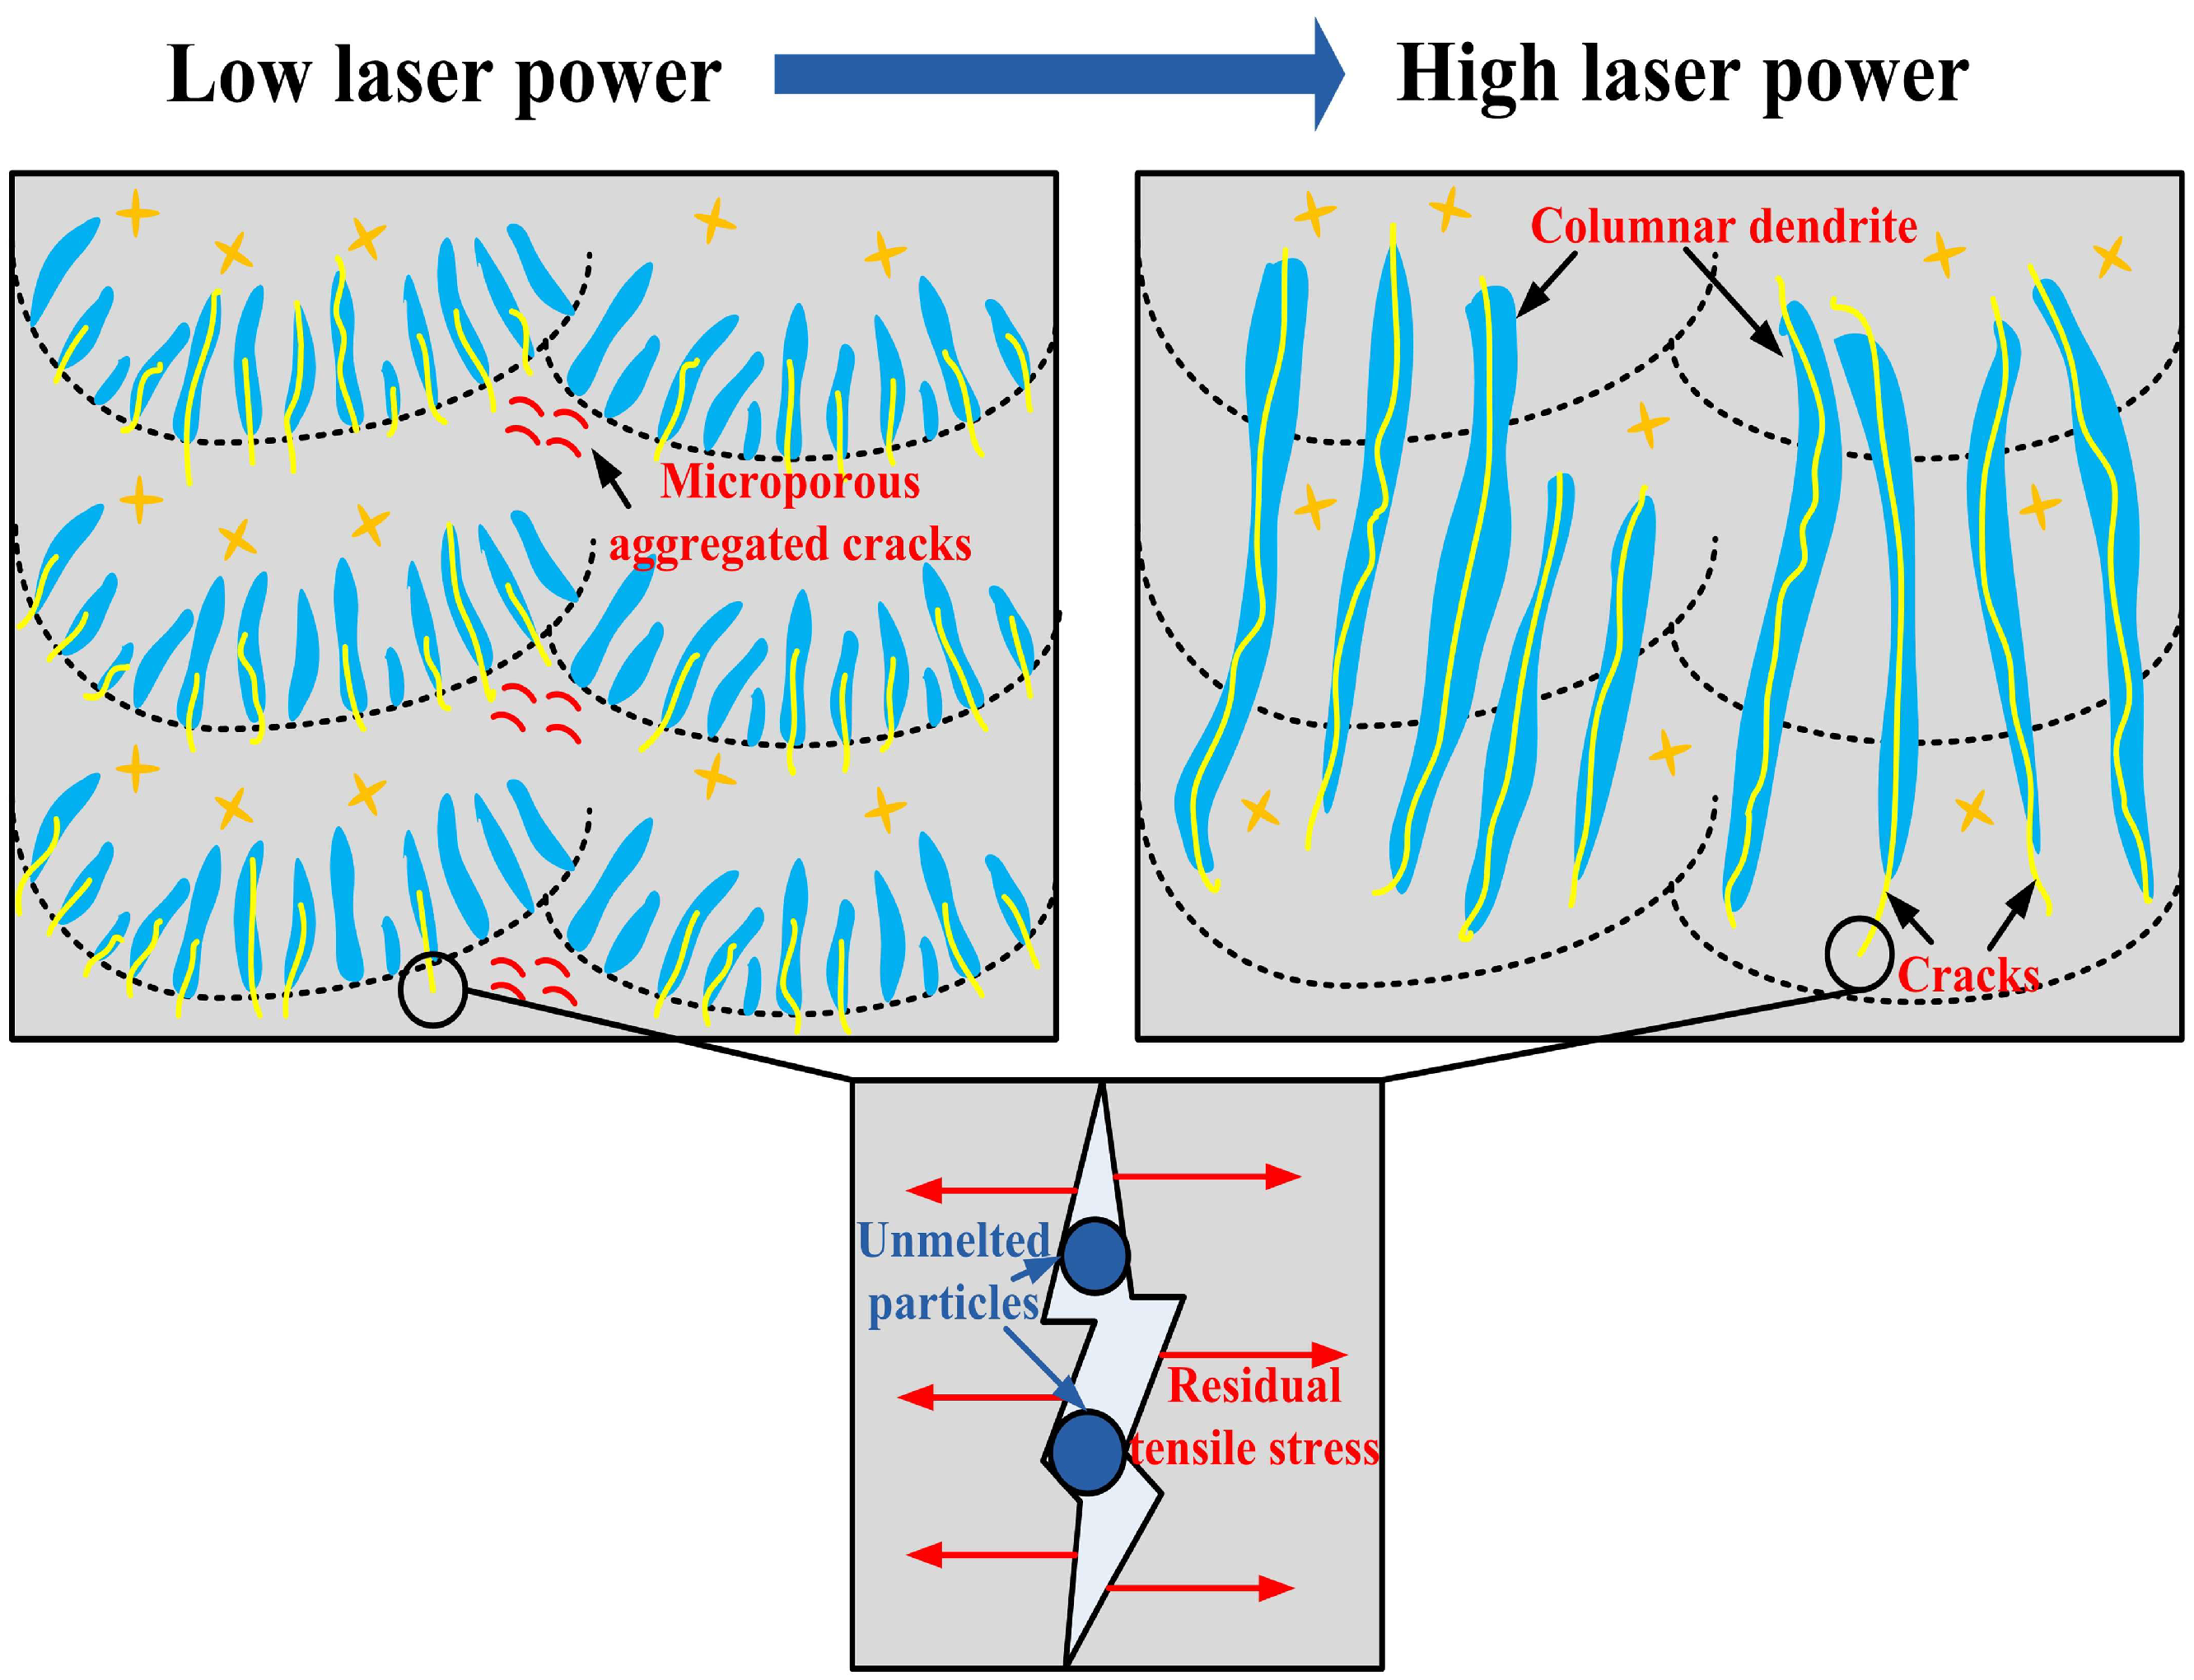
Figure 14 elucidates the underlying mechanism governing the initiation and propagation of cracks within SLM-fabricated aluminum–lithium alloy. A discernible correlation emerges between laser power levels and the evolution of crack features. As the laser power escalates, the growth of columnar crystals within the melt pool becomes prominent, progressively spanning multiple melt tracks. Consequently, the expansion of cracks correlates with the elongation of these columnar crystals. These crystals exhibit a perpendicular growth orientation to the melt pool, inducing tensile stresses perpendicular to the grain boundaries due to thermal contraction.
At lower laser power levels, a preponderance of microcracks with relatively shorter lengths characterizes the material. These microcracks, often manifested as pore-clustered fractures, tend to congregate around the overlapping regions of melt tracks, manufacturing crescent-shaped patterns oriented perpendicular to the build direction. Conversely, at higher laser power settings, the cracks predominantly propagate as thermal cracks along the growth direction of the columnar crystals. Their lengths notably increase with the augmentation of power, and these thermal cracks frequently traverse through multiple layers of melt tracks, with their initiation often located at the midsection of the tracks.
The occurrence of cracks, regardless of the specific timing, hinges upon several key factors [46]: Firstly, the aluminum–lithium alloy’s substantial solidification temperature range facilitates the precipitation of elements along grain boundaries, leading to the manufacturing of low-melting eutectic compounds. Secondly, the rapid heating and cooling dynamics inherent to the SLM process facilitate the preferential extension of columnar crystals along the direction of maximal temperature gradient, thereby rendering it prone to crack propagation along this path. Lastly, the accumulation of tensile stresses, primarily transverse in nature, ensues during the SLM process, owing to the intricate thermal cycling of remelting and solidification, thereby endowing the specimen with residual tensile stresses.

4. Conclusions

In this comprehensive investigation, an in-depth analysis of aluminum–lithium alloy fabricated through selective laser melting (SLM) under distinct laser power levels has yielded valuable insights into its multifaceted characteristics. A synthesis of findings from density measurements, surface morphology examinations, microstructural analyses, phase characterizations, microhardness assessments, and tensile permanufacturance evaluations has culminated in the following salient conclusions:
(1)
The augmentation of laser power engenders a transmanufacturative impact on the alloy’s physical attributes. Enhanced energy absorption by the powder particles at higher power levels facilitates complete melting within the melt pool. Consequently, the metal melt exhibits accelerated flow dynamics, promoting unimanufactur metallurgical bonding and yielding a pronounced increase in density alongside a notable reduction in surface roughness. These findings are drawn under fixed process parameters, and future work will extend to multi-parameter studies to provide a more comprehensive understanding.
(2)
The SLM process exerts a profound influence on the material’s microstructural features. Increasing laser power prompts the progressive growth of columnar crystals within the melt pool. This growth trajectory correlates directly with the expansion of cracks, transitioning from micro-pore aggregate cracks at lower power settings to thermally induced cracks aligned with the elongation of the columnar crystals at higher power levels. Notably, augmented laser power corresponds to diminished grain size and a heightened prevalence of low-angle grain boundaries.
(3)
X-ray diffraction (XRD) analyses reveal a compelling correlation between laser power and solid solution content, underpinning subsequent microhardness variations. Higher laser power precipitates an elevated solid solution fraction within the fabricated component, in turn translating to enhanced microhardness values. Remarkably, the surface of the manufactured specimen adopts a state of residual tensile stress, which escalates progressively with increasing laser power.
(4)
The tensile testing of SLM-fabricated aluminum–lithium alloy unravels a fracture behavior predominantly characterized by brittleness. The highest laser power level yields maximal tensile strength and elongation, marked by distinct step-like cleavage facets adorned with river-like patterns. In addition, a limited presence of circular dimples on the fracture surface at elevated laser powers signifies an augmentation in ductility, indicative of a measured improvement in plasticity.
This multifaceted investigation sheds light on the intricate interplay of laser power, microstructural evolution, mechanical attributes, and material response within SLM-fabricated aluminum–lithium alloys. These findings not only enrich our fundamental understanding of the underlying mechanisms but also hold substantial promise for the manufactured design and optimization of advanced lightweight alloy systems via judicious manipulation of SLM processing parameters. However, this study is limited by the restricted processing window, the absence of post-processing treatments, and the relatively small sample size. Future work will focus on expanding the parameter space, incorporating heat HIP treatments, and validating the results on larger-scale components.

Author Contributions

Conceptualization, H.J. and K.L.; methodology, K.L.; software, Y.G.; validation, H.J., Y.G. and K.L.; manufactural analysis, H.J.; investigation, C.S. and Y.G.; resources, S.W.; data curation, K.L. and H.J.; writing—original draft preparation, H.J.; writing—review and editing, K.L.; visualization, C.S.; supervision, S.W., Y.G. and C.S.; project administration, K.L. and H.J.; funding acquisition, K.L. All authors have read and agreed to the published version of the manuscript.

Funding

This research received no external funding.

Institutional Review Board Statement

Not applicable.

Informed Consent Statement

Not applicable.

Data Availability Statement

Data are contained within the article.

Conflicts of Interest

The authors declare no conflicts of interest.

References

  1. Santos, M.C.; Machado, A.R.; Sales, W.F.; Barrozo, M.A.S.; Ezugwu, E.O. Machining of aluminum alloys: A review. Int. J. Adv. Manuf. Technol. 2016, 86, 3067–3080. [Google Scholar] [CrossRef]
  2. Williams, J.C.; Starke, E.A. Progress in structural materials for aerospace systems. Acta Mater. 2003, 51, 5775–5799. [Google Scholar] [CrossRef]
  3. Zhang, X.S.; Chen, Y.J.; Hu, J.L. Recent advances in the development of aerospace materials. Prog. Aerosp. Sci. 2018, 97, 22–34. [Google Scholar] [CrossRef]
  4. Zhu, L.J.; Li, N.; Childs, P.R.N. Light-weighting in aerospace component and system design. Propuls. Power Res. 2018, 7, 103–119. [Google Scholar] [CrossRef]
  5. Abd El-Aty, A.; Xu, Y.; Guo, X.Z.; Zhang, S.H.; Ma, Y.; Chen, D.Y. Strengthening mechanisms, demanufacturation behavior, and anisotropic mechanical properties of Al-Li alloys: A review. J. Adv. Res. 2018, 10, 49–67. [Google Scholar] [CrossRef] [PubMed]
  6. Dursun, T.; Soutis, C. Recent developments in advanced aircraft aluminium alloys. Mater. Des. 2014, 56, 862–871. [Google Scholar] [CrossRef]
  7. Rioja, R.J.; Liu, J. The Evolution of Al-Li Base Products for Aerospace and Space Applications. Metall. Mater. Trans. A 2012, 43, 3325–3337. [Google Scholar] [CrossRef]
  8. Wu, L.; Li, X.F.; Wang, H.W. Significant roles of minor Mg addition in microstructural evolution and mechanical properties of cast Al–3Li–2Cu-0.15Zr alloy. J. Alloys Compd. 2021, 857, 157600. [Google Scholar] [CrossRef]
  9. El-Aty, A.A.; Xu, Y.; Zhang, S.H.; Ma, Y.; Chen, D.Y. Experimental investigation of tensile properties and anisotropy of 1420, 8090 and 2060 Al-Li alloys sheet undergoing different strain rates and fibre orientation: A comparative study. Procedia Eng. 2017, 207, 13–18. [Google Scholar] [CrossRef]
  10. Han, B.; Tao, W.; Chen, Y.B.; Li, H. Double-sided laser beam welded T-joints for aluminum-lithium alloy aircraft fuselage panels: Effects of filler elements on microstructure and mechanical properties. Opt. Laser Technol. 2017, 93, 99–108. [Google Scholar] [CrossRef]
  11. Gupta, R.K.; Nayan, N.; Nagasireesha, G.; Sharma, S.C. Development and characterization of Al–Li alloys. Mat. Sci. Eng. A 2006, 420, 228–234. [Google Scholar] [CrossRef]
  12. Han, B.; Chen, Y.B.; Tao, W.; Li, H.; Li, L.Q. Microstructural evolution and interfacial crack corrosion behavior of double-sided laser beam welded 2060/2099 Al-Li alloys T-joints. Mater. Des. 2017, 135, 353–365. [Google Scholar] [CrossRef]
  13. Akhtar, N.; Akhtar, W.; Wu, S.J. Melting and casting of lithium containing aluminium alloys. Int. J. Cast Met. Res. 2015, 28, 1–8. [Google Scholar] [CrossRef]
  14. Wang, C.C.; Min, G.H.; Lu, Q.L.; Lu, Z. Solidification structure and mechanical properties of Al–Li–Cu–Zr cast alloys. Int. J. Cast Met. Res. 2004, 17, 264–266. [Google Scholar] [CrossRef]
  15. Zhang, X.J.; Wang, H.W.; Yan, B.; Zou, C.M.; Wei, Z.J. The effect of grain refinement and precipitation strengthening induced by Sc or Er alloying on the mechanical properties of cast Al-Li-Cu-Mg alloys at elevated temperatures. Mat. Sci. Eng. A 2021, 822, 141641. [Google Scholar] [CrossRef]
  16. Kapil, R.; Joshi, A.; Jayaganthan, R.; Gairola, S.; Verma, R. Improvement of fracture toughness of ultra fine grained Al–Li 8090 alloy processed through multi axial forging. Mater. Res. Express 2019, 6, 085064. [Google Scholar] [CrossRef]
  17. Borkowski, L.B.; Staroselsky, A. Multiscale Model for Al–Li Material Processing Simulation Under Forging Conditions. In Light Metals 2018; Springer: Cham, Switzerland, 2018; pp. 355–364. [Google Scholar]
  18. Zhao, D.; Chen, X.H.; Li, J.B.; Tan, J.; Pan, F.S. Microstructure, texture and mechanical properties of the rolled high modulus Mg-Y-Zn-Al-Li alloy. Mat. Sci. Eng. A 2022, 831, 142242. [Google Scholar] [CrossRef]
  19. Qin, S.S.; Lee, S.; Tsuchiya, T.; Matsuda, K.; Horita, Z.; Kocisko, R.; Kvackaj, T. Aging behavior of Al-Li-(Cu, Mg) alloys processed by different demanufacturation methods. Mater. Des. 2020, 196, 109139. [Google Scholar] [CrossRef]
  20. Chen, X.X.; Zhao, G.Q.; Liu, G.L.; Sun, L.; Chen, L.; Zhang, C.S. Microstructure evolution and mechanical properties of 2196 Al-Li alloy in hot extrusion process. J. Mater. Process. Technol. 2020, 275, 116348. [Google Scholar] [CrossRef]
  21. Wang, Y.X.; Zhao, G.Q. Hot Extrusion Processing of Al–Li Alloy Profiles and Related Issues: A Review. Chin. J. Mech. Eng. 2020, 33, 64. [Google Scholar] [CrossRef]
  22. Uz, M.V.; Koçak, M.; Lemaitre, F.; Ehrström, J.C.; Kempa, S.; Bron, F. Improvement of damage tolerance of laser beam welded stiffened panels for airframes via local engineering. Int. J. Fatigue 2009, 31, 916–926. [Google Scholar] [CrossRef]
  23. Xiao, R.S.; Zhang, X.Y. Problems and issues in laser beam welding of aluminum–lithium alloys. J. Manuf. Process. 2014, 16, 166–175. [Google Scholar] [CrossRef]
  24. Yue, P.P.; Zhang, M.; Zhao, T.; Liu, P.; Peng, F.; Yang, L.Q. Eco-friendly epoxidized Eucommia ulmoides gum based composite coating with enhanced super-hydrophobicity and corrosion resistance properties. Ind. Crops Prod. 2024, 214, 118523. [Google Scholar] [CrossRef]
  25. Romanova, V.; Balokhonov, R.; Zinovieva, O.; Emelianova, E.; Dymnich, E.; Pisarev, M.; Zinoviev, A. Micromechanical simulations of additively manufactured aluminum alloys. Comput. Struct. 2021, 244, 106412. [Google Scholar] [CrossRef]
  26. Zhang, J.L.; Song, B.; Wei, Q.S.; Bourell, D.; Shi, Y.S. A review of selective laser melting of aluminum alloys: Processing, microstructure, property and developing trends. J. Mater. Sci. Technol. 2019, 35, 270–284. [Google Scholar] [CrossRef]
  27. Olakanmi, E.O.; Cochrane, R.F.; Dalgarno, K.W. A review on selective laser sintering/melting (SLS/SLM) of aluminium alloy powders: Processing, microstructure, and properties. Prog. Mater. Sci. 2015, 74, 401–477. [Google Scholar] [CrossRef]
  28. Guan, C.S.; Fu, J.J.; Cui, Z.C.; Wang, S.L.; Gao, Q.S.; Yang, Y.T. Evaluation of the tribological and anti-adhesive properties of different materials coated rotary tillage blades. Soil Till. Res. 2021, 209, 104933. [Google Scholar] [CrossRef]
  29. Chen, S.R.; Ding, H.T.; Tang, Z.; Hao, S.H.; Zhao, Y.F. Influence of rice straw manufacturing factors on ring die wear and improved wear prediction model during briquetting. Biosyst. Eng. 2022, 214, 122–137. [Google Scholar] [CrossRef]
  30. Tang, Z.; Liang, Y.Q.; Wang, M.L.; Zhang, H.; Wang, X.Z. Effect of mechanical properties of rice stem and its fiber on the strength of straw rope. Ind. Crops Prod. 2022, 180, 114729. [Google Scholar] [CrossRef]
  31. Sing, S.L.; An, J.; Yeong, W.Y.; Wiria, F.E. Laser and electron-beam powder-bed additive manufacturing of metallic implants: A review on processes, materials and designs. J. Orthop. Res. 2016, 34, 369–385. [Google Scholar] [CrossRef]
  32. Zhang, L.C.; Attar, H. Selective Laser Melting of Titanium Alloys and Titanium Matrix Composites for Biomedical Applications: A Review. Adv. Eng. Mater. 2016, 18, 463–475. [Google Scholar] [CrossRef]
  33. Yap, C.Y.; Chua, C.K.; Dong, Z.L.; Liu, Z.H.; Zhang, D.Q.; Loh, L.E.; Sing, S.L. Review of selective laser melting: Materials and applications. Appl. Phys. Rev. 2015, 2, 041101. [Google Scholar] [CrossRef]
  34. Aboulkhair, N.T.; Simonelli, M.; Parry, L.; Ashcroft, I.; Tuck, C.; Hague, R. 3D printing of Aluminium alloys: Additive Manufacturing of Aluminium alloys using selective laser melting. Prog. Mater. Sci. 2019, 106, 100578. [Google Scholar] [CrossRef]
  35. Schneller, W.; Leitner, M.; Pomberger, S.; Springer, S.; Beter, F.; Grün, F. Effect of Post Treatment on the Microstructure, Surface Roughness and Residual Stress Regarding the Fatigue Strength of Selectively Laser Melted AlSi10Mg Structures. J. Manuf. Mater. Process. 2019, 3, 89. [Google Scholar] [CrossRef]
  36. Bian, P.; Jammal, A.; Xu, K.; Ye, F.; Zhao, N.; Song, Y. A Review of the Evolution of Residual Stresses in Additive Manufacturing During Selective Laser Melting Technology. Materials 2025, 18, 1707. [Google Scholar] [CrossRef] [PubMed]
  37. Nie, X.J.; Zhang, H.; Zhu, H.H.; Hu, Z.H.; Ke, L.D.; Zeng, X.Y. Analysis of processing parameters and characteristics of selective laser melted high strength Al-Cu-Mg alloys: From single tracks to cubic samples. J. Mater. Process. Technol. 2018, 256, 69–77. [Google Scholar] [CrossRef]
  38. Wang, P.; Gammer, C.; Brenne, F.; Prashanth, K.G.; Mendes, R.G.; Rümmeli, M.H.; Gemming, T.; Eckert, J.; Scudino, S. Microstructure and mechanical properties of a heat-treatable Al-3.5Cu-1.5Mg-1Si alloy produced by selective laser melting. Mat. Sci. Eng. A 2018, 711, 562–570. [Google Scholar] [CrossRef]
  39. Zhang, H.; Zhu, H.H.; Qi, T.; Hu, Z.H.; Zeng, X.Y. Selective laser melting of high strength Al–Cu–Mg alloys: Processing, microstructure and mechanical properties. Mat. Sci. Eng. A 2016, 656, 47–54. [Google Scholar] [CrossRef]
  40. Qi, T.; Zhu, H.H.; Zhang, H.; Yin, J.; Ke, L.D.; Zeng, X.Y. Selective laser melting of Al7050 powder: Melting mode transition and comparison of the characteristics between the keyhole and conduction mode. Mater. Des. 2017, 135, 257–266. [Google Scholar] [CrossRef]
  41. Li, L.; Meng, X.K.; Huang, S.; Wang, H.; Li, P.F.; Zhou, J.Z. Investigating the effect of the scanning speed on the characteristics of Al-Li alloy fabricated by selective laser melting. J. Manuf. Process. 2022, 75, 719–728. [Google Scholar] [CrossRef]
  42. Niu, P.D.; Li, R.D.; Yuan, T.C.; Zhu, S.Y.; Chen, C.; Wang, M.B.; Huang, L. Microstructures andproperties of an equimolar AlCoCrFeNi high entropy alloy printed by selective lasermelting. Intermetallics 2019, 104, 24–32. [Google Scholar] [CrossRef]
  43. Gu, D.D.; Hagedorn, Y.C.; Meiners, W.; Meng, G.B.; Batista, R.J.; Wissenbach, K.; Poprawe, R. Densification behavior, microstructure evolution, and wear permanufacturance of selective laser melting processed commercially pure titanium. Acta Mater. 2012, 60, 3849–3860. [Google Scholar] [CrossRef]
  44. Khairallah, S.A.; Anderson, A.T.; Rubenchik, A.; King, W.E. Laser powder-bed fusion additive manufacturing: Physics of complex melt flow and manufacturation mechanisms of pores, spatter, and denudation zones. Acta Mater. 2016, 108, 36–45. [Google Scholar] [CrossRef]
  45. King, W.E.; Barth, H.D.; Castillo, V.M.; Gallegos, G.F.; Gibbs, J.W.; Hahn, D.E.; Kamath, C.; Rubenchik, A.M. Observation of keyhole-mode laser melting in laser powder-bed fusion additive manufacturing. J. Mater. Process. Technol. 2014, 214, 2915–2925. [Google Scholar] [CrossRef]
  46. Liang, J.W.; Lei, Z.L.; Chen, Y.B.; Wu, S.B.; Chen, X.; Jiang, M.; Cao, S.Y. Manufacturability, microstructure, and thermal crack characteristics of selective laser melting of ZK60 magnesium alloy. Mat. Sci. Eng. A 2022, 839, 142858. [Google Scholar] [CrossRef]
  47. Ardi, D.T.; Guowei, L.; Maharjan, N. Effects of post-processing route on fatigue permanufacturance of laser powder bed fusion Inconel 718. Addit. Manuf. 2020, 36, 101442. [Google Scholar]
  48. Sanjari, M.; Hadadzadeh, A.; Pirgazi, H. Selective laser melted stainless steel CX: Role of built orientation on microstructure and micro-mechanical properties. Mater. Sci. Eng. A 2020, 786, 139365. [Google Scholar] [CrossRef]
  49. Kamaya, M. A Smoothing Filter for Misorientation Mapping Obtained by EBSD. Mater. Trans. 2010, 51, 1516–1520. [Google Scholar] [CrossRef]
  50. Qi, Y.; Zhang, H.; Nie, X. A high strength Al–Li alloy produced by laser powder bed fusion: Densification, microstructure, and mechanical properties. Addit. Manuf. 2020, 35, 101346. [Google Scholar] [CrossRef]
  51. Li, R.; Wang, M.; Yuan, T. Selective laser melting of a novel Sc and Zr modified Al-6.2Mg alloy: Processing, microstructure, and properties. Powder. Technol. 2017, 319, 117–128. [Google Scholar] [CrossRef]
  52. Spierings, B.A.; Dawson, K.; Voegtlin, M. Microstructure and mechanical properties of as-processed scandium-modified aluminium using selective laser melting. CIRP Ann. 2016, 65, 213–216. [Google Scholar] [CrossRef]
  53. Liu, Y.; Liu, Z.; Jiang, Y. Gradient in microstructure and mechanical property of selective laser melted AlSi10Mg. J. Alloys Compd. 2018, 735, 1414–1421. [Google Scholar] [CrossRef]
  54. Xiao, Z.X.; Chen, C.P.; Zhu, H.L. Study of residual stress in selective laser melting of Ti6Al4V. Mater. Des. 2020, 193, 108846. [Google Scholar] [CrossRef]
  55. Fang, Z.C.; Wu, Z.L.; Huang, C.G. Review on residual stress in selective laser melting additive manufacturing of alloy parts. Opt. Laser Technol. 2020, 129, 106283. [Google Scholar] [CrossRef]
  56. Yakout, M.; Elbestawi, M.; Veldhuis, C.S. A study of the relationship between thermal expansion and residual stresses in selective laser melting of Ti-6Al-4V. J. Manuf. Process. 2020, 52, 181–192. [Google Scholar] [CrossRef]
  57. Sun, Y.M. A Study on High Permanufacturance Aluminum-Lithium Casting Alloy; Shenyang Aerospace University: Shenyang, China, 2018. [Google Scholar]
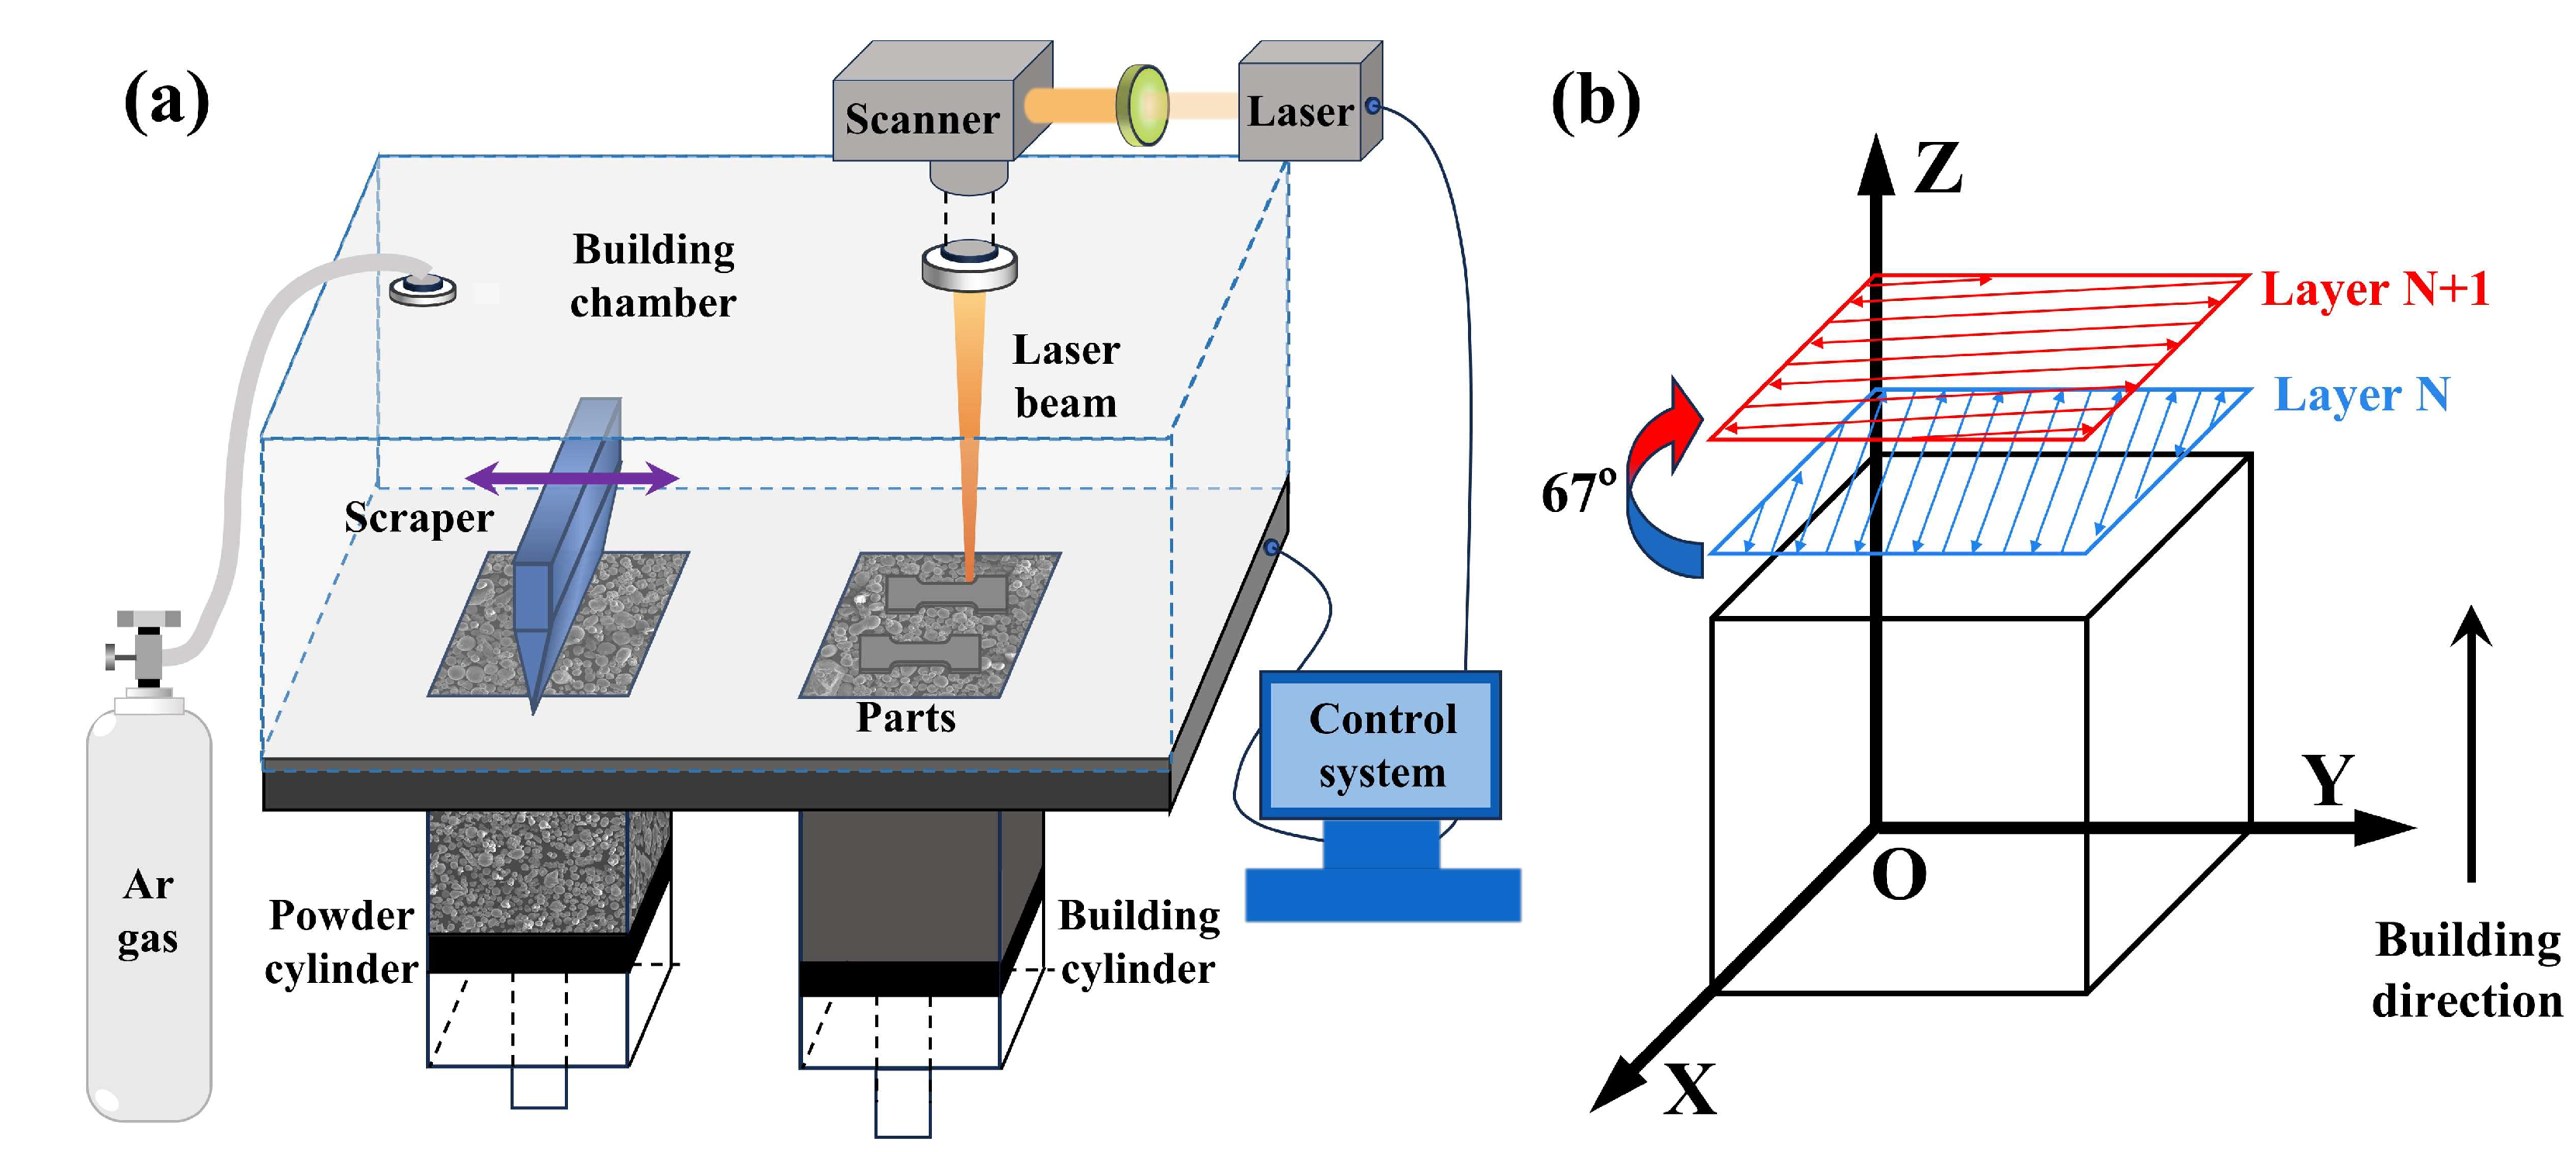
Figure 1. (a) Schematic illustration of the SLM manufacturing process; (b) Scanning strategy.
Coatings 15 01212 g001
Figure 2. (a) Aluminum–Lithium alloy tensile specimens fabricated via SLM; (b) Their dimensions.
Coatings 15 01212 g002
Figure 3. Variation in relative density of SLM aluminum–lithium alloy with laser power.
Coatings 15 01212 g003
Figure 4. Three-dimensional surface morphology of SLM aluminum–lithium alloy specimens: (a) 120 W; (b) 140 W; (c) 160 W; (d) 180 W.
Coatings 15 01212 g004
Figure 5. Cross-sectional SEM images of SLM aluminum–lithium alloy specimens at distinct laser power settings: (a) 120 W; (a1) partial enlargement of (a); (b) 140 W; (c) 160 W; (d) 180 W; (d1) partial enlargement of (d).
Coatings 15 01212 g005
Figure 6. Crack length distribution (a) 120 W; (b) 140 W; (c) 160 W; (d) 180 W.
Coatings 15 01212 g006
Figure 7. EBSD analysis of SLM aluminum–lithium alloy at different laser powers: (a,c,e) 120 W; (b,d,f) 180 W. The panel encompasses three distinct aspects: (a,b) Inverse Pole Figure (IPF) maps, (c,d) Grain Boundary (GB) maps; (e,f) Kernel Average Misorientation (KAM) maps.
Coatings 15 01212 g007
Figure 8. Grain size distribution and orientation angle distribution of SLM aluminum–lithium alloy at different laser powers: (a,c) 120 W; (b,d) 180 W.
Coatings 15 01212 g008
Figure 9. X-ray diffraction (XRD) spectra of SLM aluminum–lithium alloy samples. (a) full XRD patterns within the 2θ range of 30° to 80°; (b) enlarged view of the Al (111) and Al (200) diffraction peaks.; (c) enlarged view of the Al (220) diffraction peak.
Coatings 15 01212 g009
Figure 10. Microhardness values of the SLM aluminum–lithium alloys at different laser power levels: (a) On the surface; (b) Along the depth direction.
Coatings 15 01212 g010
Figure 11. Residual stress of the SLM aluminum–lithium alloys at different laser power levels: (a) On the surface; (b) Along the depth direction.
Coatings 15 01212 g011
Figure 12. (a) Engineering stress–strain curves from tensile tests of printed samples at different laser power levels; (b) Corresponding mechanical data.
Coatings 15 01212 g012
Figure 13. Fractographic analysis of specimens subjected to tensile tests under varied laser power conditions: (a) 120 W; (b) 140 W; (c) 160 W; (d) 180 W. (e) A magnified view of the region.
Coatings 15 01212 g013
Figure 14. Crack generation mechanism of SLM aluminum–lithium alloy.
Coatings 15 01212 g014
Table 1. Chemical composition of aluminum–lithium alloy (wt.%).
LiFeSiAl
3.200.080.02Bal.
Table 2. SLM Process Parameters for Aluminum–Lithium Alloy.
Process ParameterValue
Laser power120, 140, 160, 180 W
Scanning speed1000 mm/s
Layer thickness30 μm
Hatching space (block specimen)80 μm
Table 3. The corresponding relationship between scanning speed and VED.
Laser Power (W)120140160180
Volumetric energy density (J/mm3)50.0058.3366.6775.00
Disclaimer/Publisher’s Note: The statements, opinions and data contained in all publications are solely those of the individual author(s) and contributor(s) and not of MDPI and/or the editor(s). MDPI and/or the editor(s) disclaim responsibility for any injury to people or property resulting from any ideas, methods, instructions or products referred to in the content.