Article

The Influence Mechanism of the Hardness Homogeneity of the Grind-Hardening Layer on Its Wear Resistance

1
School of Mechanical Engineering and Automation, Northeastern University, Shenyang 110819, China
2
School of Mechanical Engineering, Shenyang Jianzhu University, Shenyang 110168, China
*
Author to whom correspondence should be addressed.
Coatings 2025, 15(10), 1196; https://doi.org/10.3390/coatings15101196
Submission received: 20 July 2025 / Revised: 14 September 2025 / Accepted: 24 September 2025 / Published: 11 October 2025

Abstract

Due to the random factors that influence grinding stability, hardness distribution appears in inhomogeneity at different locations on the hardened layer in grind-hardening technology. It may affect the wear resistance of parts. Therefore, in order to explore the influence mechanism of hardness homogeneity on the wear resistance comprehensively, grind-hardening and friction experiments on AISI 1045 steel are carried out. Then, the causes of inhomogeneous hardness distribution are analyzed, and the influence of hardness homogeneity on wear resistance is also discussed. Combining the Archard wear model, the wear process of the hardened layer is simulated for analyzing the effect of contact stress distribution and action range on material loss in the worn area and finally realizing the prediction of the wear depth. The results show that the difference in microstructure distribution caused by the nonlinear variation in grinding force is the fundamental reason for the hardness inhomogeneity of the hardened layer. The hardness homogeneity results in the wear resistance of the cut-out end being superior to that of cut-in end. Additionally, the error between the predictive and the experimental value of the wear depth with different parameters is between 3.6% and 11.3%, thereby verifying the effectiveness of the theoretical research.

1. Introduction

The grinding process is a precise machining approach which makes use of abrasives to remove materials. The part achieves very high geometric accuracy and surface integrity [1]. As modern industry advances, the traditional grinding process has gradually been unable to meet the current demands for high-quality parts. Thus, the development of advanced grinding processes has become an urgent problem that needs to adapt to the increasingly higher requirements for the application performance and service life as part of high-end equipment in the manufacturing industry at present. In addition to fulfilling the basic dimensional, geometric accuracy and surface integrity indicators, advanced grinding processes should also endow parts with high fatigue resistance, wear resistance and corrosion resistance. In addition, it is certainly possible to achieve the combination of multiple processing procedures in the grinding process when fully exploring the characteristics of advanced grinding processes, optimizing the process parameters and combining a rational machine design. Therefore, a composite grinding process is in line with the development requirements of advanced manufacturing technology, and it is also one of the developing directions of grinding processes in the future.
As a composite processing technology, grind-hardening basically uses the heat generated instantaneously in the grinding area to quench the workpiece surface directly and causes microstructure transformation within a short period of time, thereby forming a hardened layer mainly composed of martensite [2]. The formation of the hardened layer can improve the application performance of the part notably. In summary, the grind-hardening process can not only achieve the purpose of strengthening the workpiece surface by effectively utilizing the heat but also has the characteristics of simplifying the processing procedures, reducing energy consumption and processing costs, which meets the development requirements of the green manufacturing model [3,4,5]. On this basis, the process has broad engineering prospects in metal material processing and surface modification, and its application will bring amazing economic value and significant social benefits.
After advances, grind-hardening attracts many focuses from scholars on exploring the feasibility of integrating surface quenching and grinding processes by numerous experimental studies. At the same time, the extent to which the hardened layer can improve the application performance of the workpiece surface is analyzed as well. Brockhoff [6] carried out experimental studies innovatively on grind-hardening of SAE 4140 steel and SAE 52100 steel and found that the process formed a hardened layer with martensite on workpiece surface. In addition, there is residual compressive stress in the hardened layer. Research by Zarudi et al. [7] discovered that because of extremely high heat, a hardened layer was found on the surface of AISI 4140 steel during the grind-hardening process. Compared with the traditional grinding process, the hardened layer improves the wear resistance significantly and enhances the fatigue resistance by 12%–20%. Alonso et al. [8] conducted a metallographic analysis on the hardened layer of AISI 1045 steel with cylindrical traverse grinding tests and proposed a method for selecting grinding parameters that achieved the process control of the hardened penetration depth (HPD). By analyzing the effect of the feeding rate on HPD of AISI O2 steel with the grind-hardening experiment, Sölter et al. [9] revealed the deformation causes and compensation methods of single-side and double-sided grind-hardened prismatic workpieces. Shahri et al. [10] studied the influence rules of grinding parameters on HPD of AISI 1045 steel and combined the Taguchi method with regression analysis to determine the optimal parameters for enhancing workpiece hardness. Shi et al. [11,12] analyzed the influence of the grind-hardening process on the micro-damage of the workpiece surface whose results showed that grinding depth is the key factor generating micro-cracks. In addition, an electrochemical corrosion experimental study was also carried out on the hardened layer, which proved that the formation of the hardened layer can significantly enhance corrosion resistance. After a large number of experimental verifications, many scholars have begun to adopt the finite element method (FEM) to study the formation mechanism of the hardened layer. Foeckerer et al. [13] set up an analytical model of a three-dimensional temperature field based on a triangular heat source and the grinding fluid effect. Moreover, the microstructure transformation of the workpiece surface and HPD are analyzed according to the distribution state of the transient heat source during the grind-hardening process. Nguyen et al. [14] explored the strengthening effect of the transverse grind-hardening process on the surface of cylindrical workpieces through heat transfer model of a moving heat source and then analyzed the influence of the feeding rate on HPD. Zhang et al. [15] conducted a theoretical study on the thermal deformation problem of plane workpieces during the grind-hardening process and calculated the deformation, stress as well as strain with different sizes at each moment. Xiu et al. [16] built a novel coupling model for investigating the influence of dynamic hardening effect on surface topography of workpiece and verified the effectiveness of the model by experiments with different grinding depths. Taking AISI 5140 steel as the research object, Gao et al. [17] studied the influence of heat on the changes in hardness and microstructure of the hardened layer with different regrinding amounts by simulating the temperature distribution during the grind-hardening process. On the basic study of multi-abrasive grinding, real abrasive geometries, binder effect and real workpiece–wheel kinematics, Lerra et al. [18] proposed an approach that simulates the formation of the hardened layer during the grind-hardening process.
From the above research, scholars have conducted extensive studies on the grind-hardening process and achieved fruitful results. However, there are still two remaining issues as follows. First, although the current studies have proven that the grind-hardening process can effectively integrate surface quenching and grinding processes and have comprehensively explored the formation mechanism of the hardened layer based on theoretical approaches, a qualitative analysis has been conducted on its improvement of application performance, though the research on the influence mechanism of hardened layer on the wear resistance of parts remains insufficiently in-depth. Second, during the grind-hardening process, random factors such as the size and distribution of abrasives on the wheel, machine chatter and workpiece deformation will inevitably cause changes in instantaneous grinding force and heat, which lead to an inhomogeneous distribution of hardness on workpiece surface. As a crucial indicator for evaluating the quality of the hardened layer, the inhomogeneous hardness distribution not only affects the application performance of parts but also shortens their service life in practical application. However, relevant research has rarely been found so far on the wear resistance of hardened layers considering the influence of hardness homogeneity. To address the above issues, the wear process of the hardened layer is simulated by combining physical experiments and the FEM. Studies on the influence mechanism of hardness homogeneity on the wear resistance of hardened parts are capable of providing support for accelerating the development of the grind-hardening process.

2. Materials and Methods

2.1. Experimental Condition

It is necessary to carry out grind-hardening and friction experiments ahead of conducting research on the wear resistance of the hardened layer. First of all, grind-hardening experiments are carried out on a BLOHM ORBIT 36CNC precision surface grinder (Korber Schleifring, Shanghai, China). The workpiece material is made of AISI 1045 steel, with dimensions of 35 mm (length) × 25 mm (width) × 12 mm (height). The chemical composition of the material is listed in Table 1. As a widely used metal material in engineering, AISI 1045 steel often requires surface strengthening treatment in practical applications. Additionally, this type of material is a kind of carbon steel, which has lower hardenability compared with alloy steel. Therefore, if a hardened layer is formed on the material surface during the grind-hardening process, and the wear resistance of the workpiece is improved significantly, it is convincing that the grind-hardening process can be applied to the surface strengthening treatment of various materials. A white corundum wheel with dimensions of 300 mm (diameter) × 30 mm (width) and grit size of F36 is adopted as grinding tool. To ensure that there is sufficient heat on workpiece surface in grind-hardening, dry grinding is chosen as the cooling method. Also, many precision instruments are applied in the experiment to detect the grinding force, microstructure and hardness distribution of the hardened layer, aiming at fully uncovering the inhomogeneous hardness distribution in the grind-hardening process. Subsequently, a reciprocating sliding friction test is conducted on the workpiece using an MFT5000 multifunctional friction and wear tester (Rtec-Instruments, San Jose, CA, USA). The variation laws of the coefficient of friction (COF), wear morphology and profile of the hardened layer with different experimental parameters are analyzed, so as to provide experimental basis for studying the influence mechanism of hardness homogeneity on the wear resistance. The dry friction is adopted for experimental lubrication, and the friction pair is a silicon nitride ball (diameter = 6.35 mm). Experiment conditions are shown in Figure 1. Since the grinding depth is the most important parameter affecting the hardness of the hardened layer [19], it is set as the only variable in the experimental parameters. More importantly, the results of the microstructure, hardness, COF and wear amount of the hardened layer at the locations 3 mm, 15 mm and 32 mm away from the workpiece’s cut-in end are focused on testing. It is beneficial to establish the relationship between the hardness distribution of the hardened layer and its wear resistance in theoretical research. Meanwhile, to ensure the accuracy of the experimental results, it is necessary to conduct 5 repeated experiments and tests for each scheme. The experimental parameters are shown in Table 2.

2.2. Grind-Hardening Experiment

2.2.1. Grinding Force

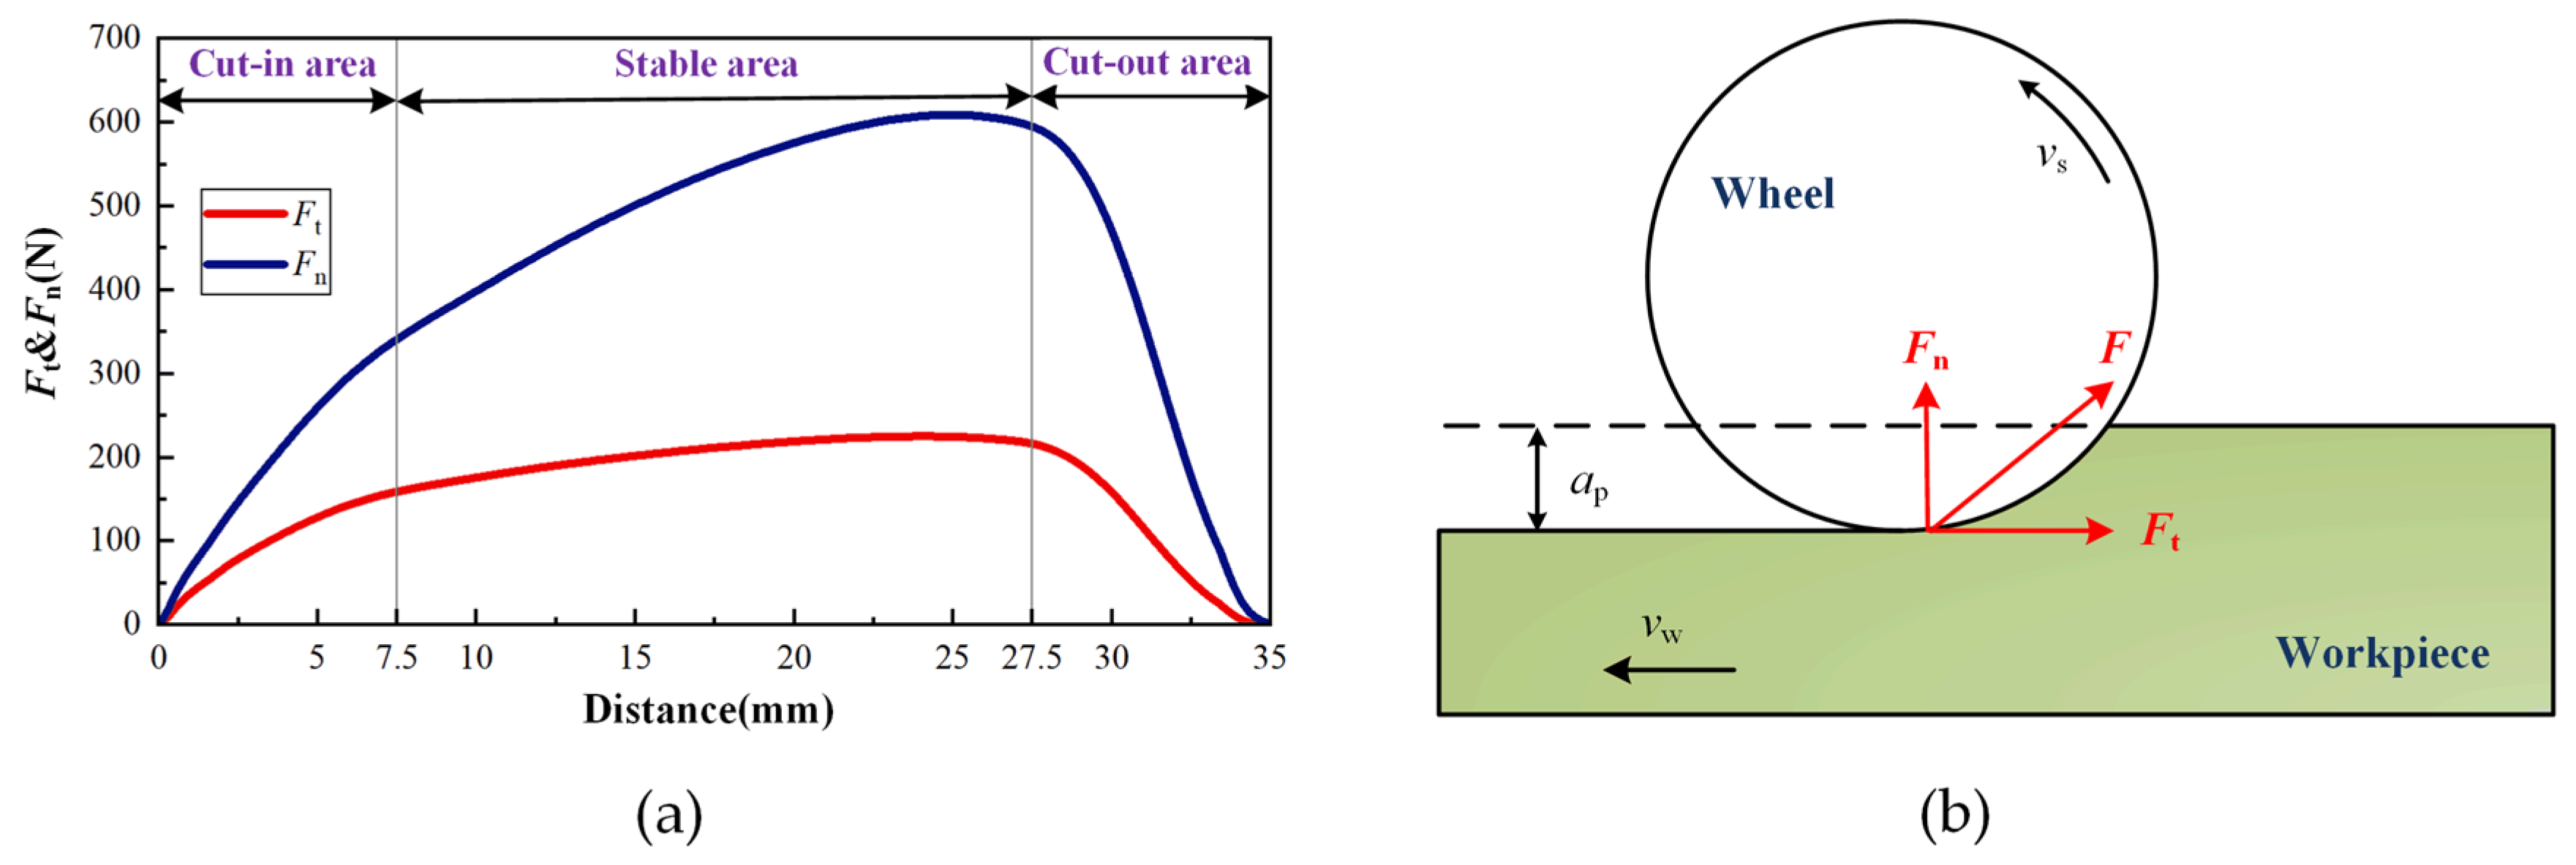
The grinding force data are collected by an FC3D100-2KN three-axis piezoelectric dynamometer (NaiChuang, Shanghai, China). The measurement method is as follows: Ahead of the experiment, the dynamometer is installed between the machining worktable and the fixture. During the grinding process, the piezoelectric crystal sensors inside the dynamometer convert the grinding force signals generated by the cutting action of the wheel on the workpiece into electrical signals. These electrical signals are then transmitted to a computer via a signal amplifier and a data acquisition card, thereby completing the high-precision and dynamic measurement of the grinding force. The instantaneous grinding force of No. 3 workpiece during the grind-hardening process is measured online, and the results are shown in Figure 2. It can be seen from Figure 2 that, according to the variation characteristics of the grinding force with time, the workpiece surface can be divided into the cut-in area, the stable area and the cut-out area. Among them, since the wheel has just started to contact the workpiece during the cut-in area, the contact area between the wheel and the workpiece may change. As the grinding progresses, the contact area expands rapidly, which leads to an increase in the number of effective abrasives participating in cutting per unit time. It further causes an increase in the amount of workpiece material removed. Meanwhile, the grinding force also shows a rapid upward trend. When grinding reaches the stable area, the contact area does not change theoretically. At the same time, the grinding force remains constant. While the air-cooling method is adopted in grind-hardening, the temperature of the workpiece surface increases rapidly during the process. Although the rise in temperature induces the softening effect of the material and reduces the grinding force, the accumulation of chips at the front end of the wheel and the influence of the elastoplastic deformation of the workpiece surface make the actual grinding depth greater than theoretical value. Obviously, the increase in the actual grinding depth has a greater impact on the grinding force than the softening effect on the material. Therefore, in the stable area, grinding force shows an upward trend, but the rising rate is relatively small. When grinding reaches the cut-out area, due to the shortening of the contact arc length between the wheel and the workpiece, the number of effective abrasives and the maximum undeformed chip thickness decrease, resulting in a sudden reduction in the removal rate of the material. At the same time, the tangential force Ft and the normal force Fn also drops rapidly.
From the above analysis, the instantaneous grinding force during the grind-hardening process changes continuously with time because of the influence of factors such as the contact area, the elastoplastic deformation of the workpiece and the softening of the material. This change leads to differences in the grinding temperature at various locations on the workpiece surface. As is well known, temperature is the key factor affecting the microstructure transformation. At the same time, the final type, size and distribution of the microstructure determine the properties of the workpiece material. Therefore, it is reasonable to believe that the nonlinear change in the grinding force is the fundamental reason of inhomogeneous distribution in the hardness of hardened layer.

2.2.2. Microstructure

To observe the microstructure distribution better, sandpapers with 4 different grit sizes are adopted to polish the workpiece surface. Moreover, diamond grinding paste and metal metallographic etchant are applied to treat the surface as well. Finally, the microstructure at different locations on workpiece surface is observed by an IE500M metallurgical microscope (Sunny, Yuyao, China). The microstructure at different locations on the surface of No. 2 workpiece after grind-hardening is observed, as shown in Figure 3. It can be seen from Figure 3a that at location A, the microstructure has not transformed and is still composed of ferrite and pearlite. Combined with Figure 2, it can be found that since the wheel has just started to cut the workpiece, the grinding force at this location and grinding heat are both relatively small. So, the temperature of the workpiece surface has not reached the critical temperature (Ac1 = 724 °C) for the austenite transformation of AISI 1045 steel. Therefore, there is not a hardened layer which is mainly composed of martensite. It can be seen from Figure 3b that a large amount of martensite appears in the workpiece surface at location B. It is because the increase in the grinding force enables the workpiece surface to have a sufficient grinding temperature to induce the transformation among the initial microstructure, austenite and martensite. Figure 3c shows the distribution of the microstructure at location C. By comparing it with Figure 3b, martensite in the workpiece surface is higher than that in the stable area. From the heat transfer theory, when a large amount of heat is generated on workpiece surface, part of heat is conducted to the interior of the workpiece due to the thermal conductivity of the metal material during the grind-hardening process. In addition, due to the significant temperature difference between the workpiece and the surrounding environment, the heat also dissipates to the surroundings in the forms of convective heat transfer and thermal radiation. The dissipation of heat significantly increases the cooling rate and provides an important condition for the formation of martensite. Unlike others, location C is close to the cut-out end of the workpiece. Due to differences in the thermal conductivity of the material, convective heat transfer coefficient and thermal radiation coefficient, the heat at the cut-out end cannot be effectively dissipated to the surrounding environment. Instead, more heat is conducted inside the workpiece. Coupled with the long-term heat accumulation, all the factors result in a higher temperature and cooling rate in the cut-out area of workpiece surface collectively. Therefore, although the grinding force decreases at this location, the martensitic transformation is more sufficient.

2.2.3. Hardness

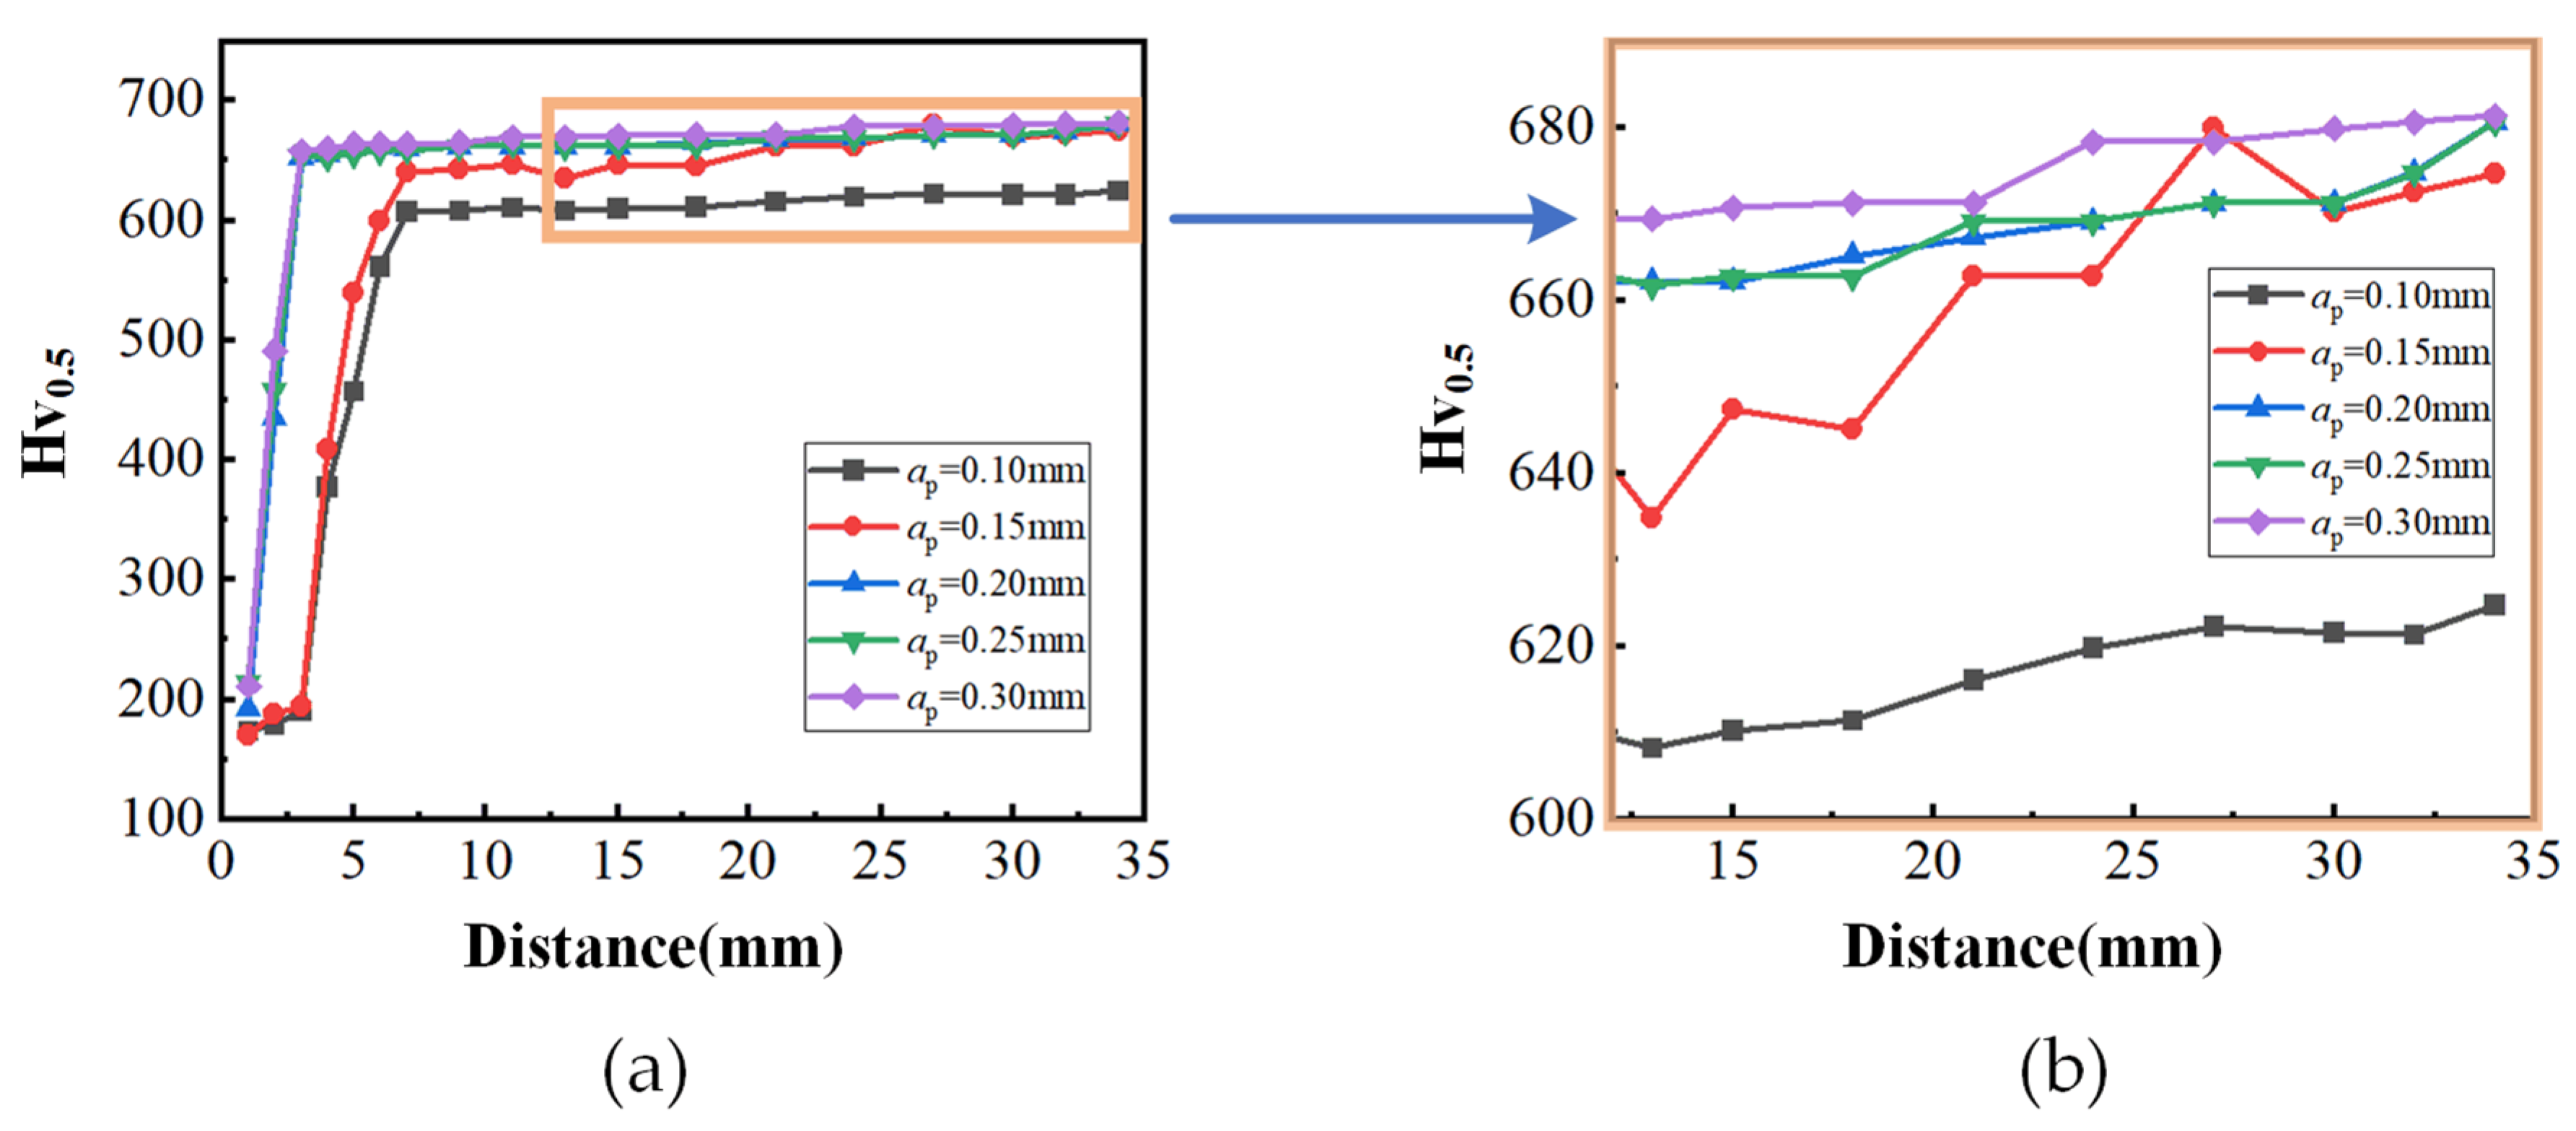
The hardness of the hardened layer is measured using a THV-5 Vickers hardness tester (Yizong, Shanghai, China). The testing principle is as follows: a diamond indenter with a regular quadrangular pyramid shape is used on a dynamometer to indent the surface under a certain pressure. The pressure is maintained for a period and then removed. Subsequently, the lengths of the two diagonals are measured to calculate the surface area of the indentation. After that the hardness is determined. In the testing process, the indenter pressure is 0.5 kgf and the maintained period is 15 s. Figure 4 shows the hardness distribution on workpiece surface with different grinding parameters. To observe the overall hardness variation law of the hardened layer better (as shown in Figure 3a), the hardness distribution in the middle area and the cut-out area of the workpiece are magnified (Figure 3b). From Figure 4 it can be seen that the hardness is inhomogeneously distributed with the condition of variable grinding depth but has the same change trend. Specifically, the hardness increases rapidly between 0 and 5 mm away from the cut-in end of the workpiece, but it increases relatively slowly between 5 mm and 32 mm. It is in line with martensite distribution at different locations of the hardened layer in Figure 3. Since the type and volume fraction of the microstructure determines the hardness of the workpiece material, significant differences appear in the hardness distribution within the hardened layer, which indirectly verifies that the nonlinear change in the grinding force is the key to the inhomogeneous hardness distribution of the hardened layer in grind-hardening. It can also be found from Figure 4 that the hardness increases with the growth of the grinding depth.

2.3. Friction Experiment

2.3.1. COF

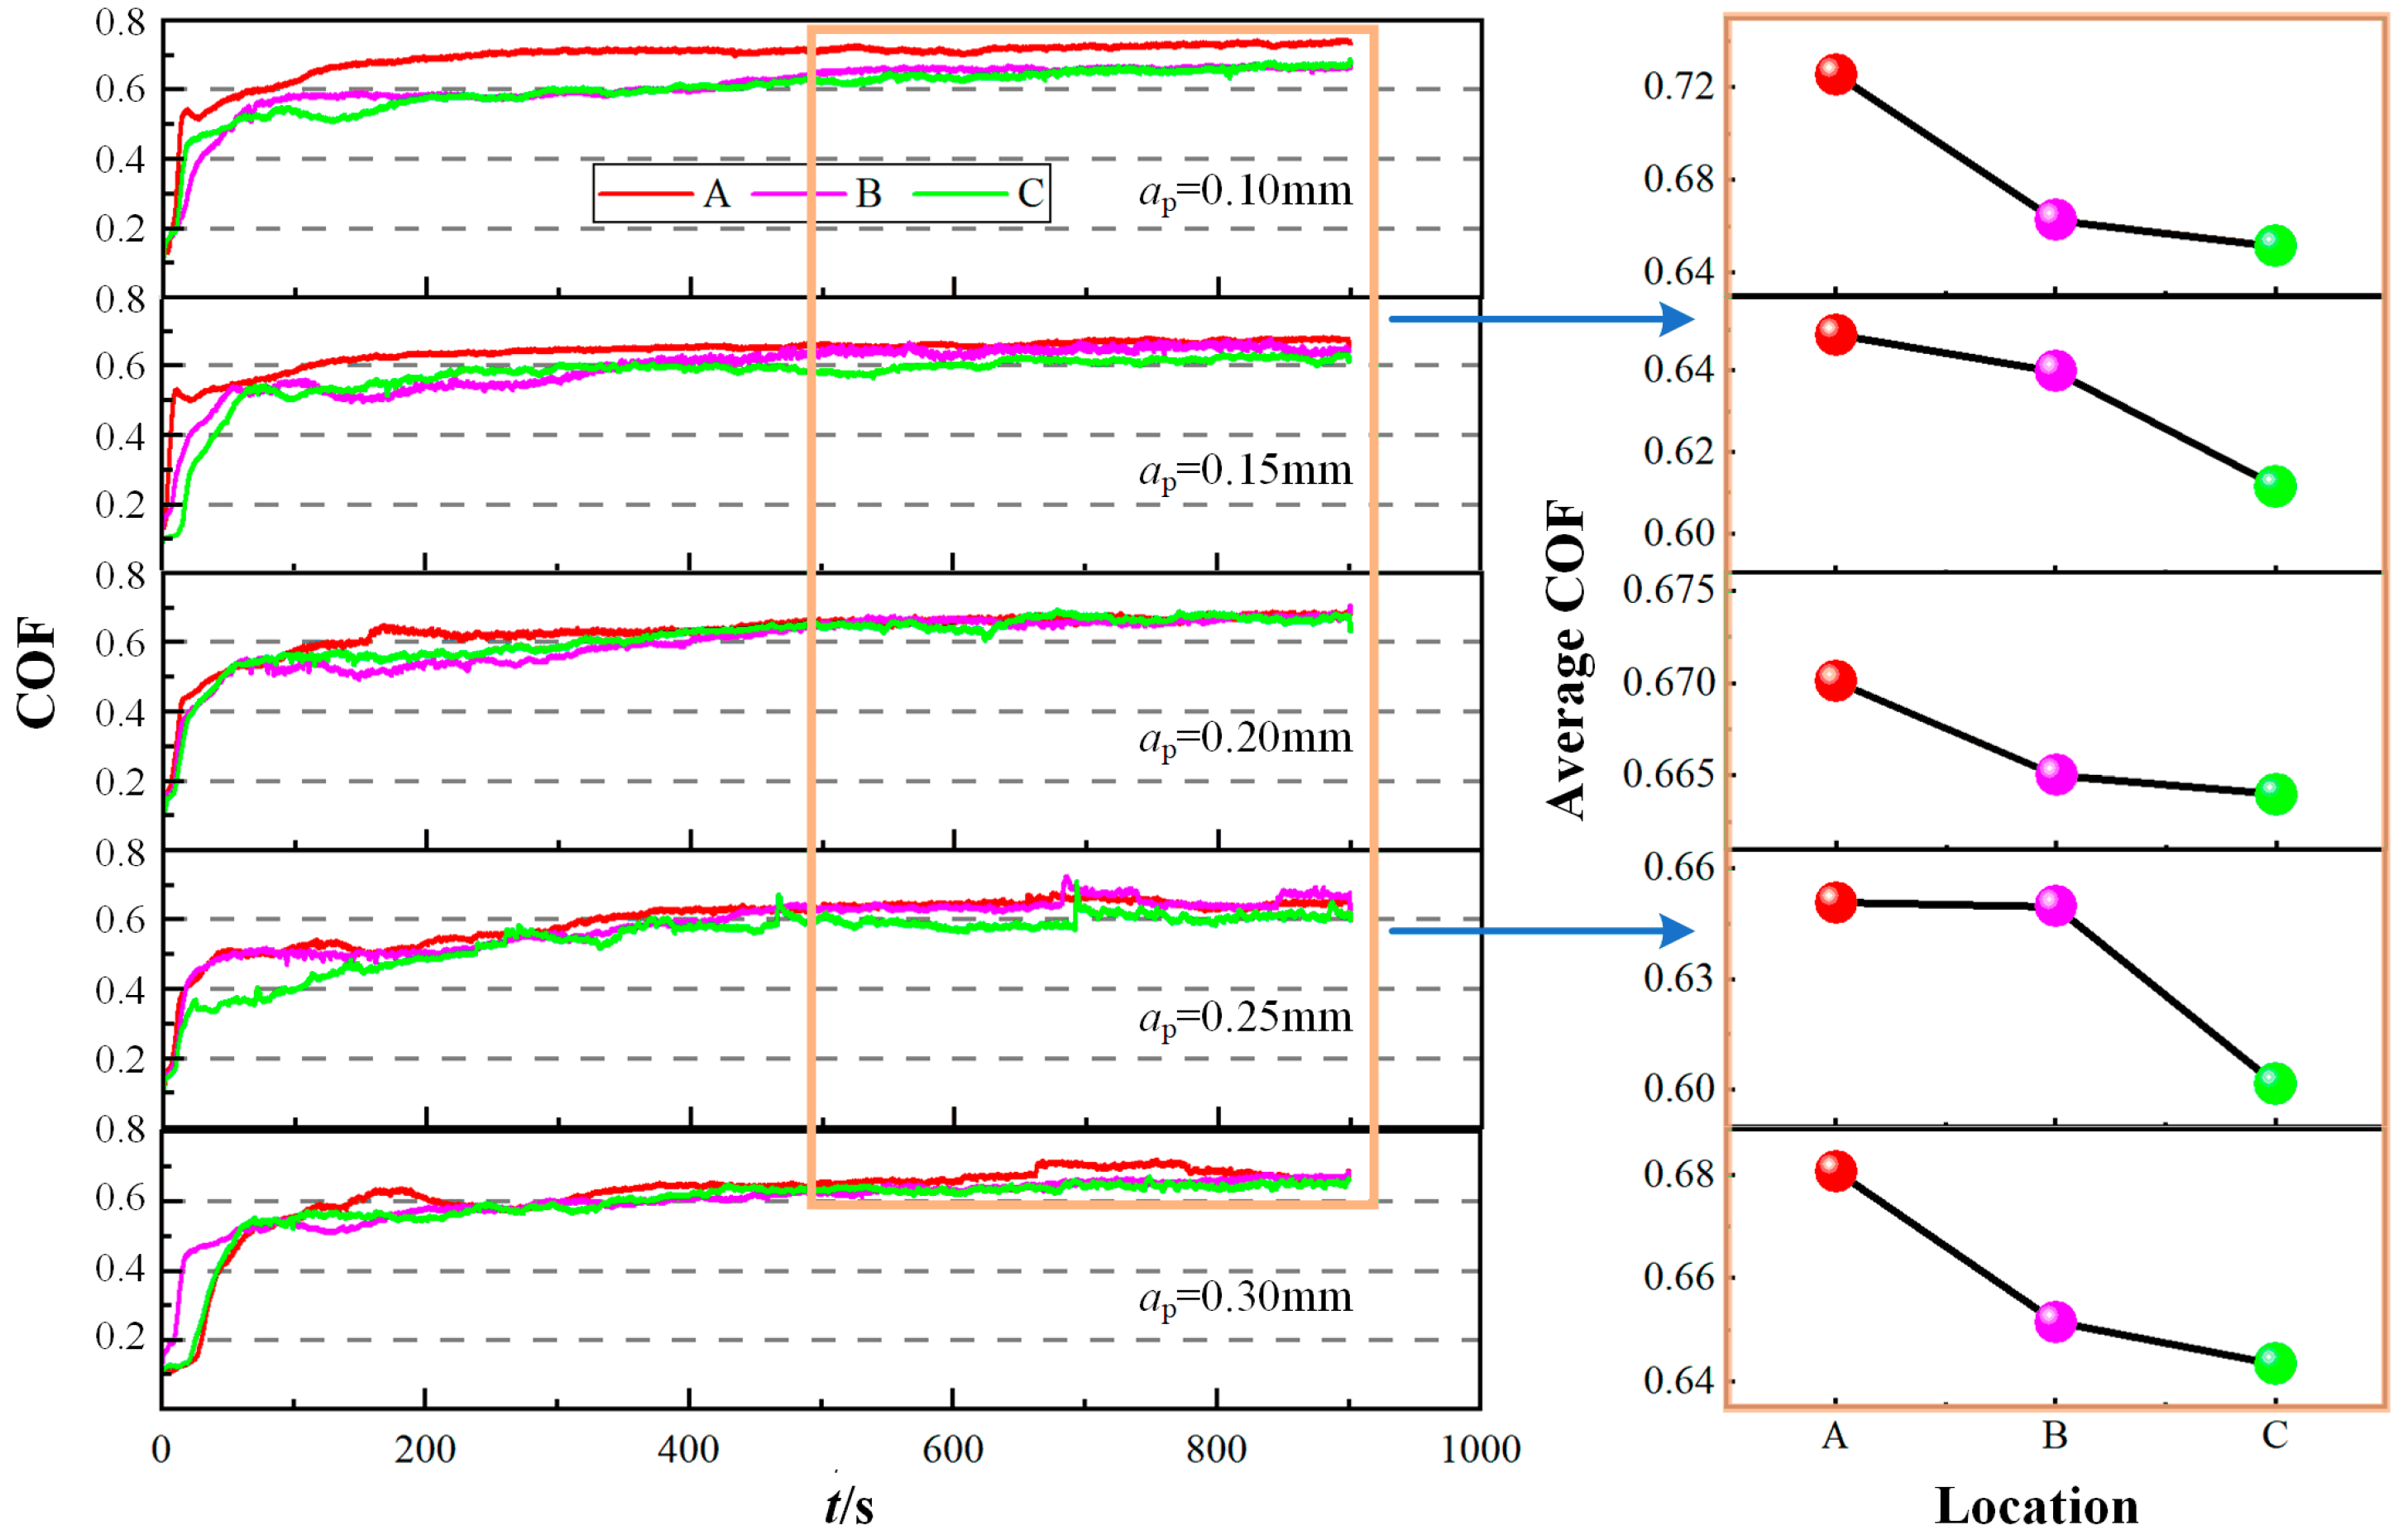
As an important parameter for measuring the relative motion resistance between the contact surfaces of friction pairs, the COF is capable of reflecting the wear resistance of workpieces to a certain extent [20]. Friction experiments are initiated at different locations of the hardened layer with variable grinding depths. Figure 5 depicts the curve of COF in relation to the passage of time. It should be noted that the COF value is the average result of 5 friction experiments. By observing from the COF curves, the friction processes of the hardened layers with different experimental parameters can be divided into two stages, namely running-in and stable friction. Among them, the running-in stage consists of two sub-stages: (1) The initial running-in stage. Since the hardened layer has been polished, the roughness of the friction contact surface is small; the COF is in a low level at this stage. However, it increases rapidly due to the gradually expanding contact area and roughness with the occurrence of wear. (2) The second running-in stage. After a slight decrease, the COF continues to increase at a relatively slow rate. In the stable friction stage, the friction coefficient is relatively stable as the friction pairs have gone through a certain period of running-in but fluctuate within a small range. It can also be seen from Figure 5 that the COF is the largest at location A of the hardened layer, while it is the smallest at location C. Combined with the previous analysis, the occurrence of this phenomenon is closely related to the inhomogeneous hardness distribution of the hardened layer. With different grinding depths, the trend of the hardness distribution that gradually increases from location A to C leads to the cut-in area being more prone to wear compared with the cut-out area.

2.3.2. Wear Morphology

Ultra plus field emission scanning electron microscope (Zeiss, Shanghai, China) is applied for measuring wear morphologies at different locations of the hardened layer on No.1 workpiece, as shown in Figure 6. Wearing morphologies at different locations of the hardened layer of No.1 workpiece are detected, as shown in Figure 6. By comparison, it is found that the wear surface at location A of the hardened layer exhibits a strong phenomenon of attachment accumulation, accompanied by many granular wear debris. Moreover, the degree of oxidative wear is particularly severe, and the depth of the plowing grooves is quite remarkable (Figure 6a). Although the depth of the plowing grooves at location B is relatively large and there is a certain attachment layer, both the volume and quantity of the wear debris are significantly reduced compared with those at location A (Figure 6b). There are no obvious traces of the attachment layer at location C. The wear surface appears relatively smooth, with only a small number of fine particulate wear debris visible and a certain degree of fatigue-spalling phenomenon. The differences in the wear morphologies at different locations can be attributed to the improvement of the wear resistance resulting from the gradual increase in the hardness of the hardened layer along the locations from A to C. The increase in hardness enhances the wear resistance of material, leading to a reduction in the generation of wear debris. As a result, there is a trend of wear gradually decreasing from the cut-in to cut-out area.

2.3.3. Wear Profile and Amount

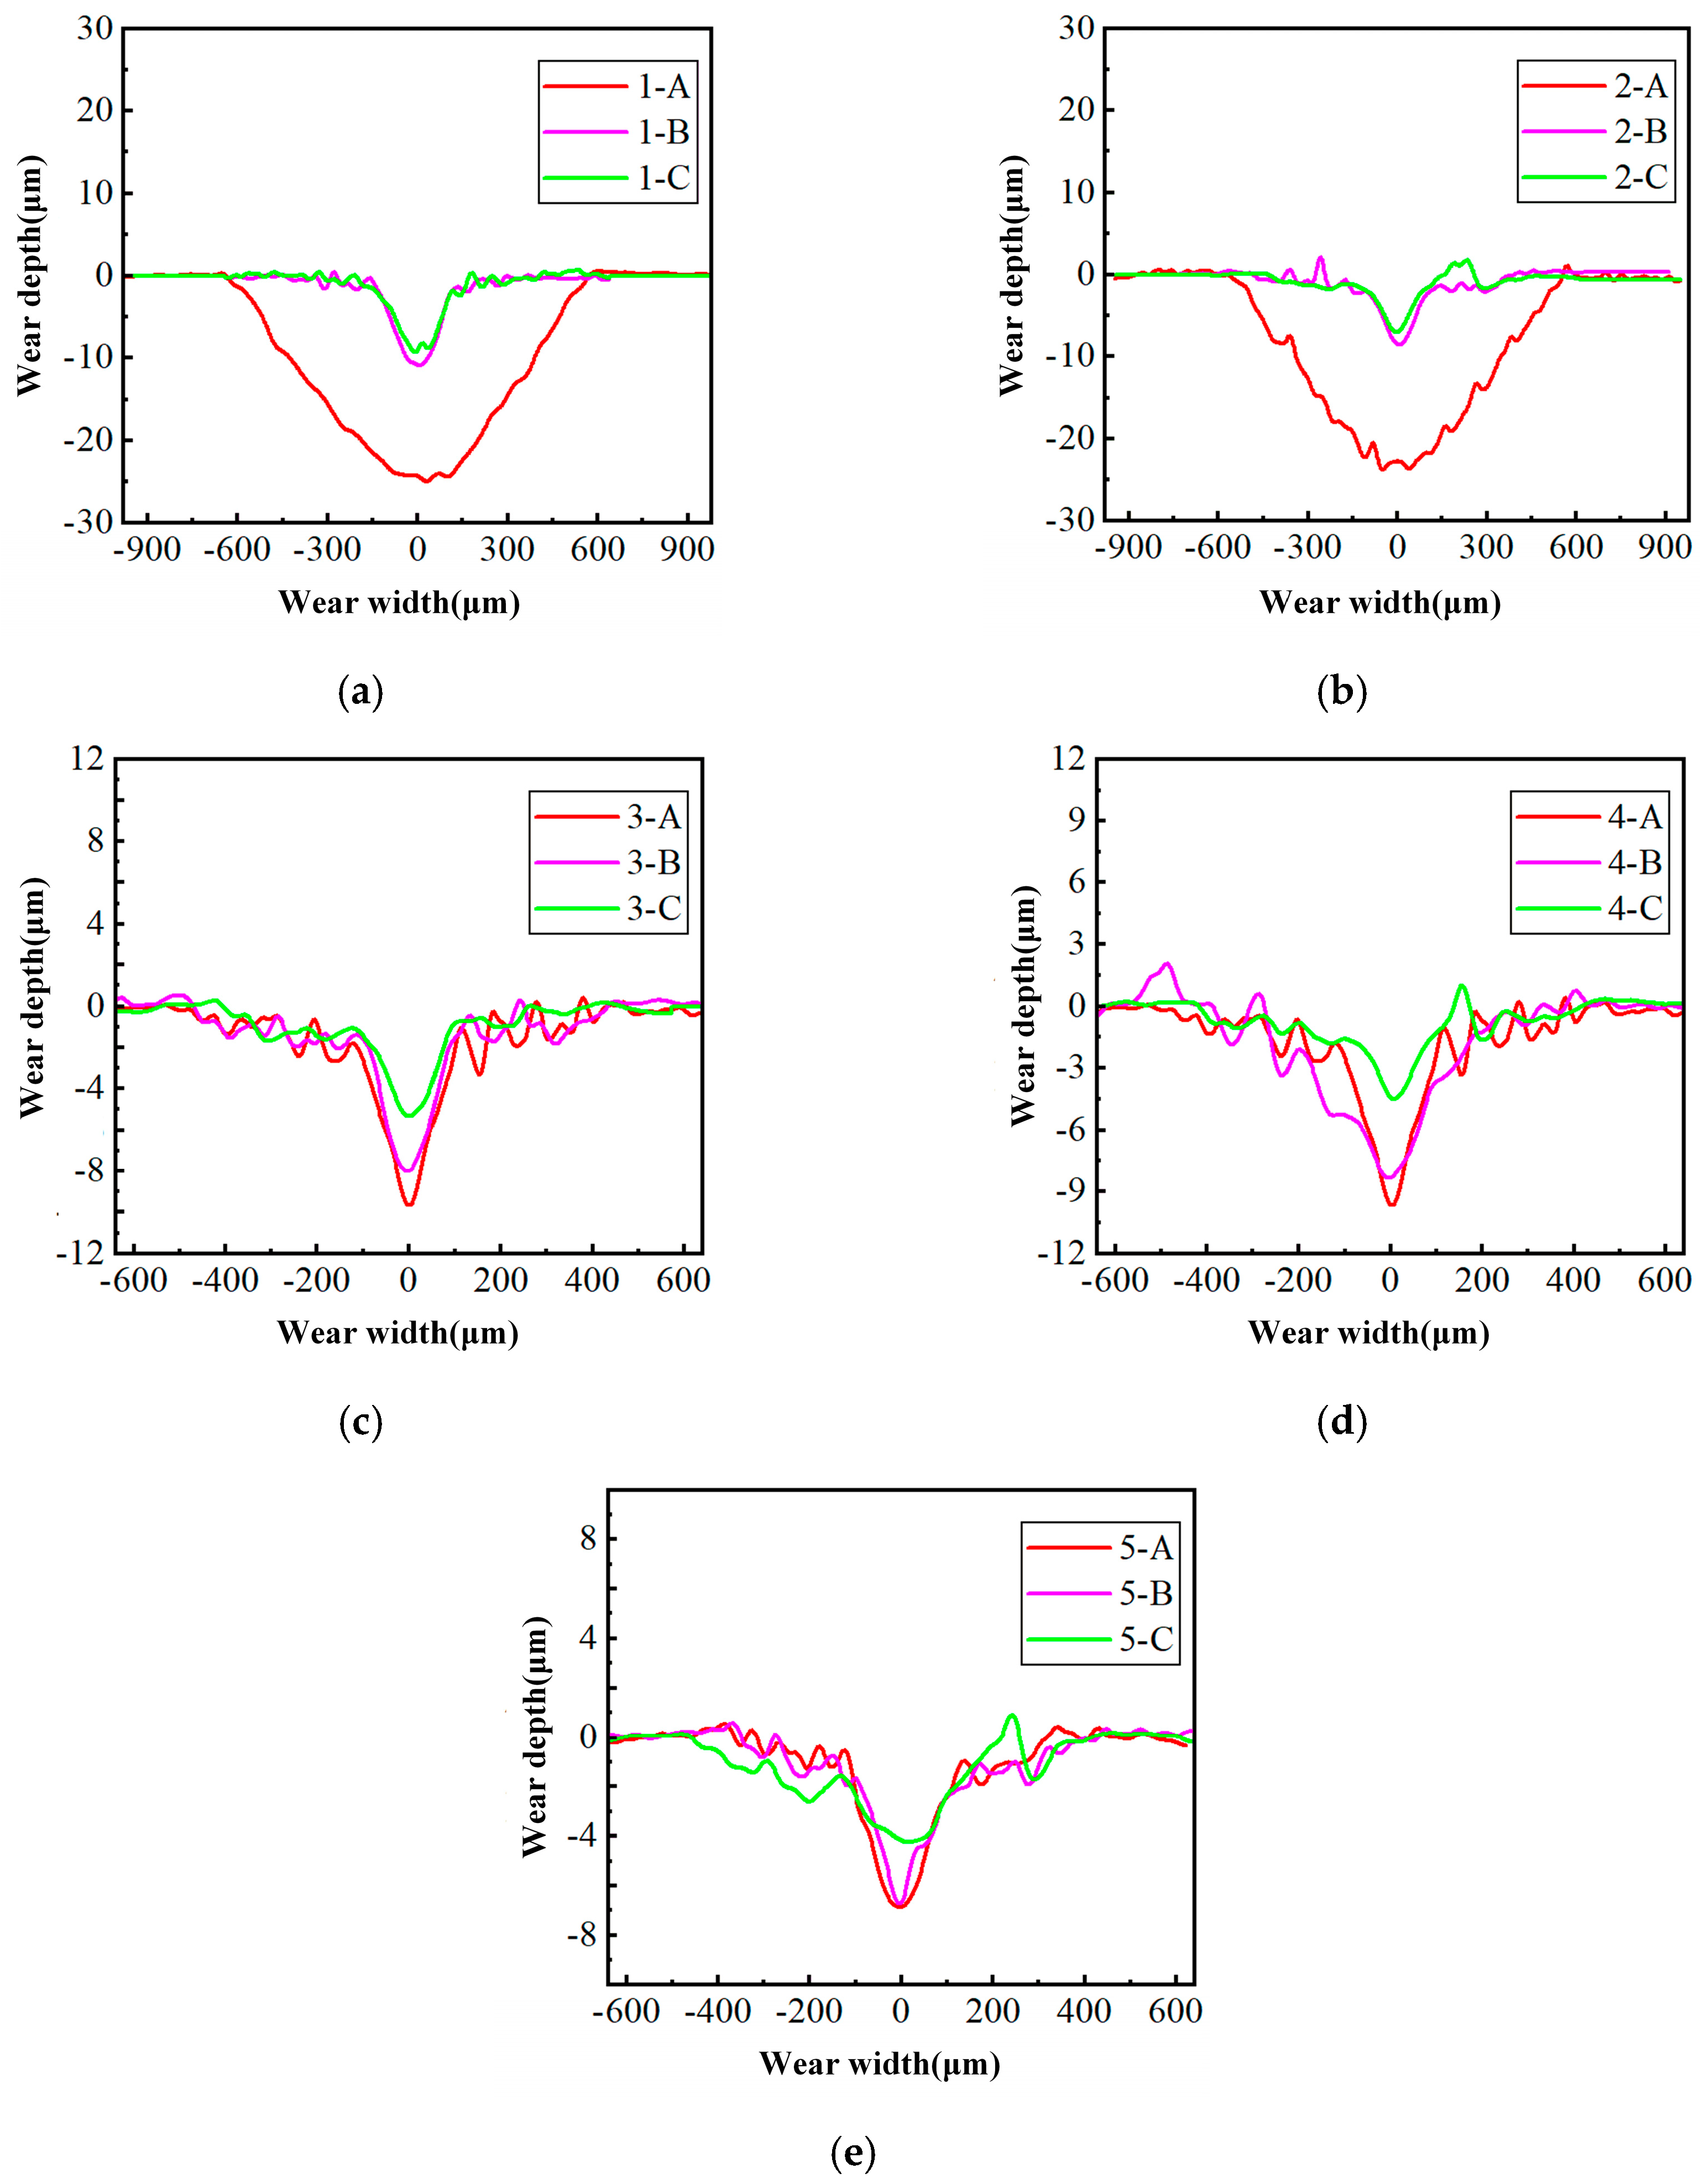
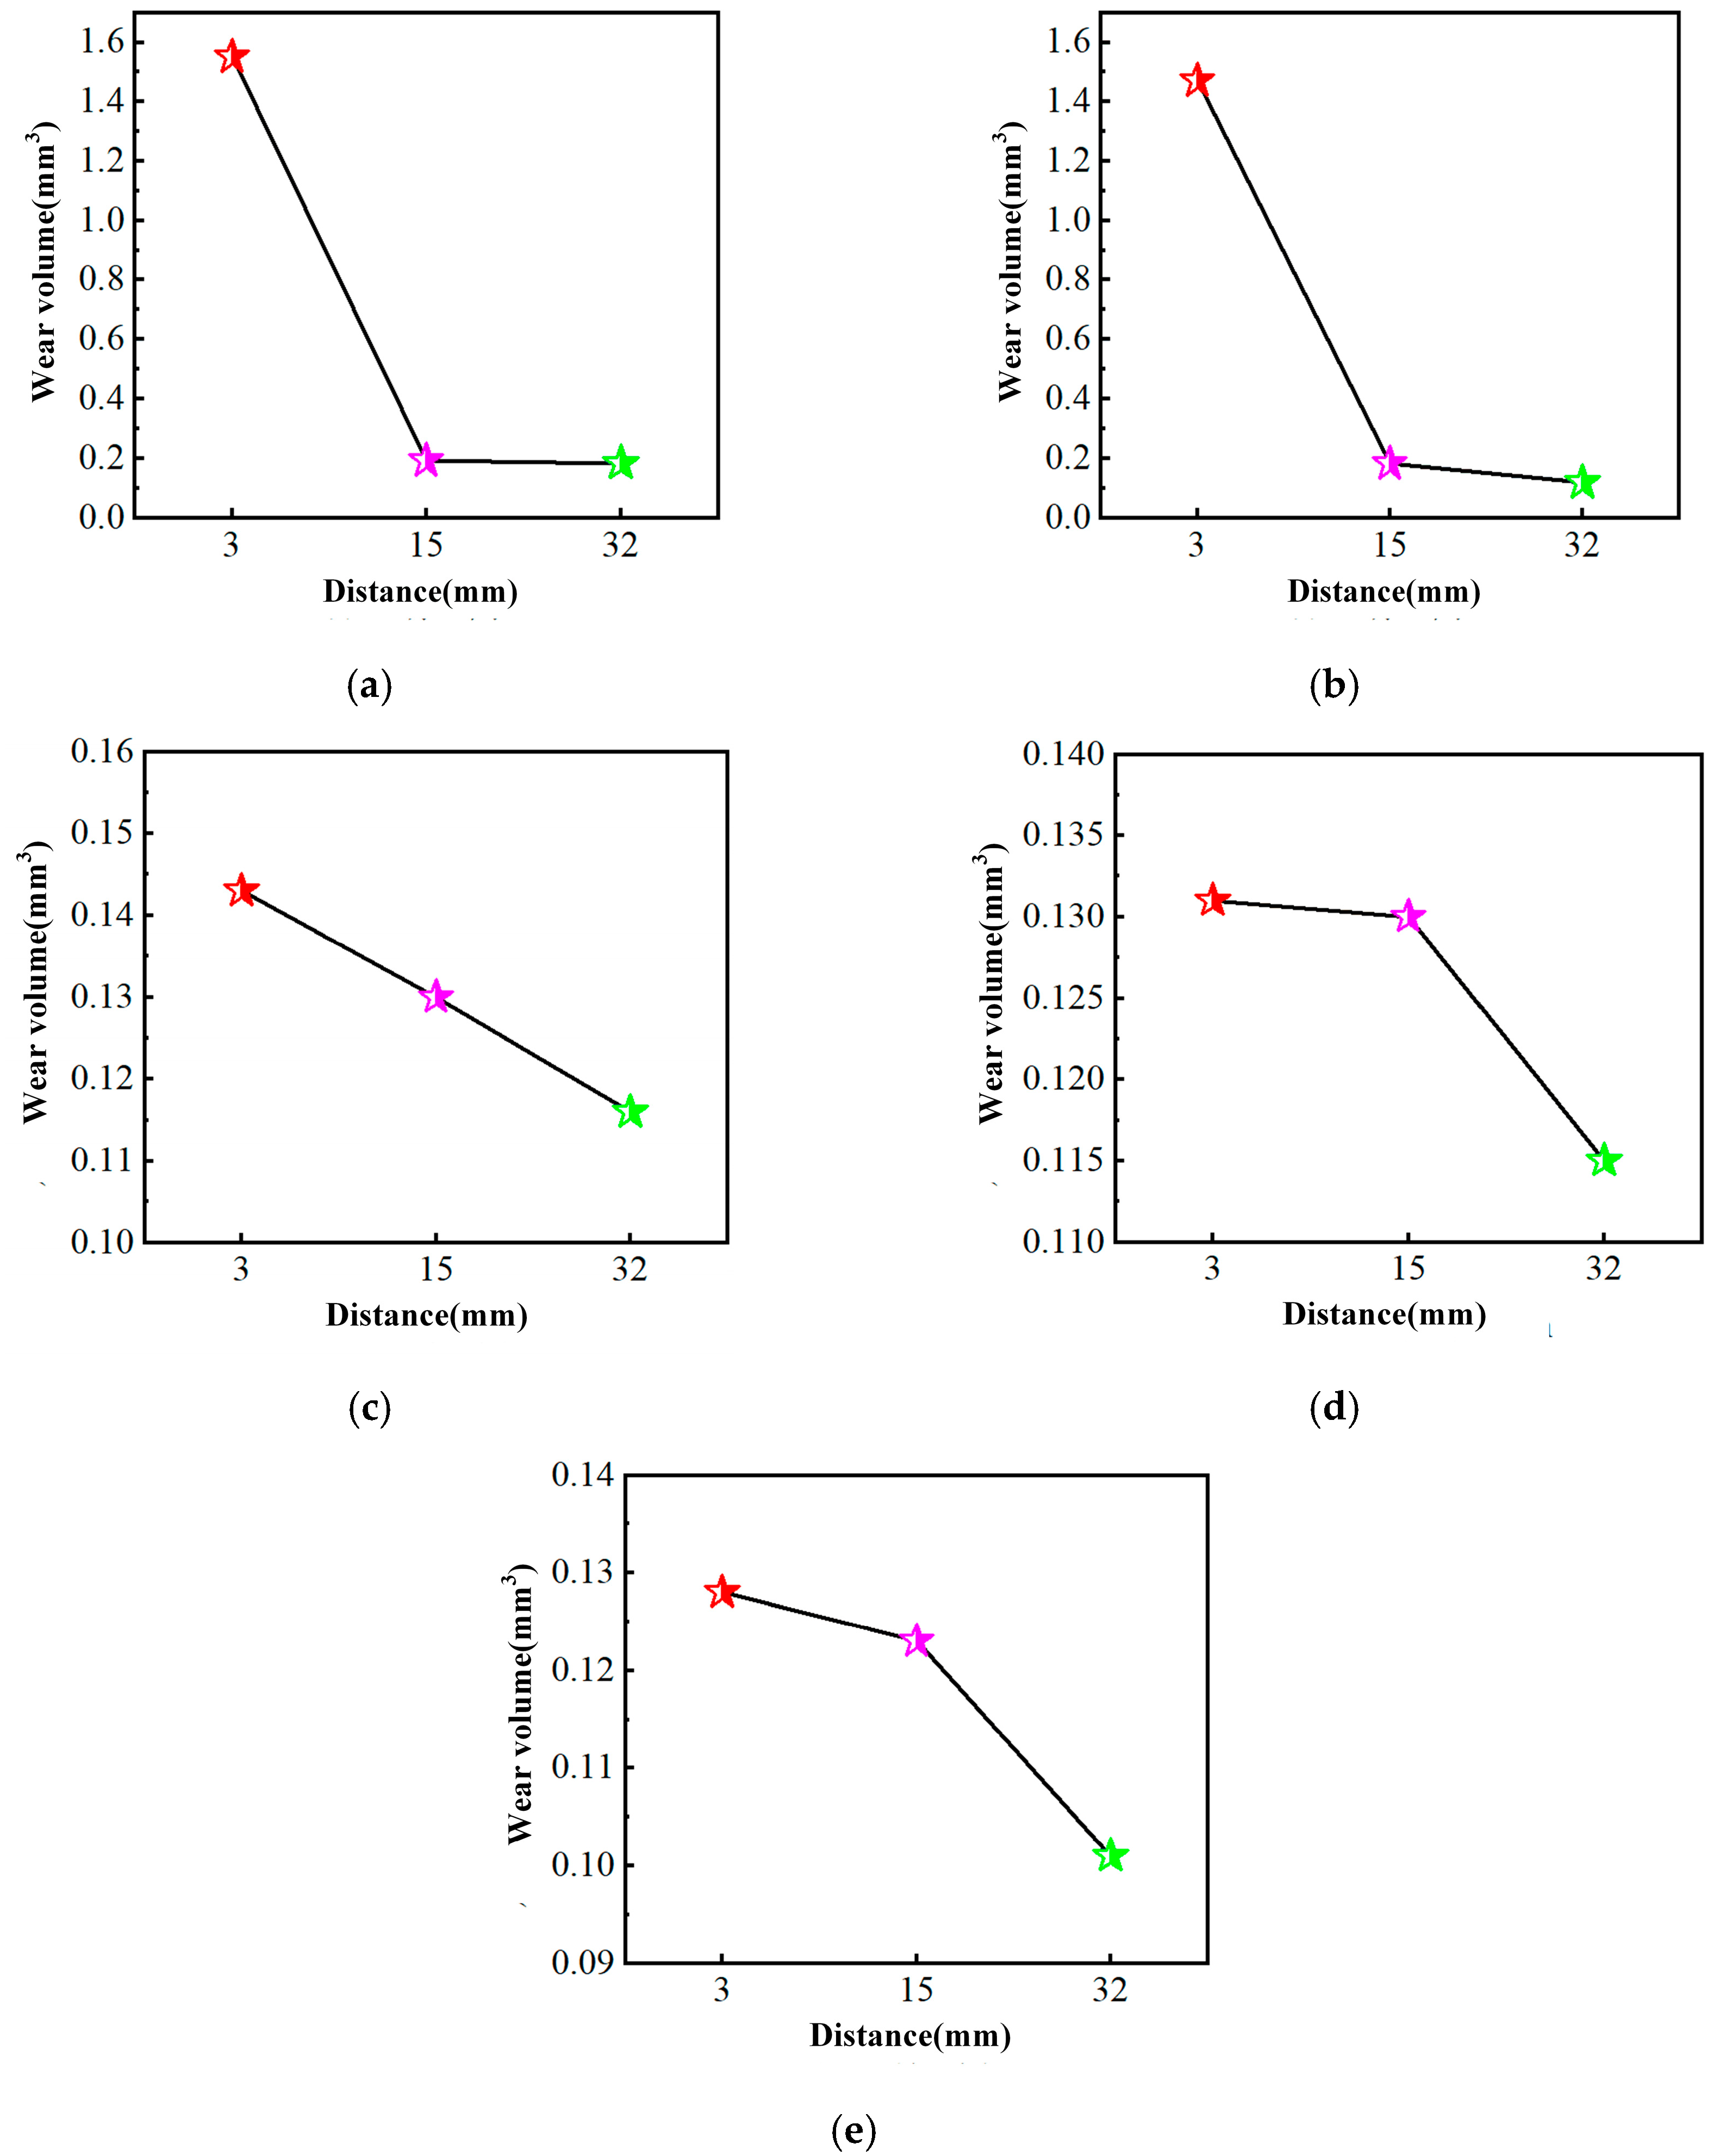
The wear profiles and amounts of the hardened layer with different experimental parameters are detected by OLS4100 confocal laser scanning microscope (Olympus, Shanghai, China), whose results are shown in Figure 7 and Figure 8. It can be seen from the figure that when the grinding depths are 0.10 mm and 0.15 mm, the wear profile at location A presents a U-shape. Its wear depth and width are significantly larger than those at locations B and C. Moreover, the corresponding wear amount is also much higher than that of the latter. When the grinding depth exceeds 0.20 mm, the shapes of the wear cross-sections at locations A, B and C gradually tend to be the same, all of which are structured with a deep groove in the middle and gentle slopes on both sides. At the same time, the wear depth and wear amount follow a decreasing trend of location A > location B > location C. The trend is consistent with the test results of the COF and wear morphology. Combined with Figure 4, when the grinding depth is small, martensite fails to form at location A on the workpiece surface. The hardness at location A is approximately 190 Hv, which is much lower than the hardness of over 600 Hv achieved at locations B and C with the same conditions due to the formation of a large amount of martensite. Therefore, the wear amount at location A is significantly much larger than that at locations B and C. When the grinding depth is increased to more than 0.20 mm, a hardened layer mainly composed of martensite is formed on the workpiece surface. However, due to the influence of hardness homogeneity, the wear profiles at different locations tend to be the same, but the differences in wear depth, width and wear amount reflect the gradual improvement of the wear resistance from the cut-in to cut-out area.

3. Simulation and Results

3.1. Wear Model and Simulation Procedure

Currently, Archard’s wear equation is the most commonly used for solving wear problems in the field of mechanical engineering. Many studies have shown that Archard’s wear equation is applicable to the calculation of adhesive wear, abrasive wear and other forms of wear [21,22]. The general form of the Archard’s wear equation is described by [23]
V = K F N L H
where V represents the wear volume; L is the sliding distance; FN is the normal load; H represents the hardness of the softer material; K is wear coefficient, which is generally a material constant acquired by experiments. The method for obtaining the wear coefficient K is as follows: After the friction experiment, instruments such as an electronic balance or a laser confocal microscope are applied to measure the wear volume of the hardened layer. Subsequently, the normal load, sliding distance, material hardness and wear volume are substituted into Equation (1) for calculation, and the wear coefficient can thus be acquired. From the equation, the wear volume is directly proportional to the normal load and the sliding distance but inversely proportional to the material hardness. Meanwhile, by taking the first derivative with respect to time on both sides in Equation (1), the following equation can be obtained.
d V = K H F N d l
where dV is the volume wear rate; dl is the relative sliding rate of the contact surface. Since the wear depth is an important indicator for evaluating the wear state of materials, the wear depth per unit area can be calculated by Equation (3):
d h = k P d l
where dh and dl are the increments of the wear depth and the sliding distance at adjacent moments, respectively, and dh = dVA; k is the dimensionless wear coefficient and k = K/H; P is the contact load and P = FNA; ΔA is the contact area between the friction pairs.
The research on the wear behavior between friction pairs needs to combine Archard’s wear equation with FEM. In the simulation, Archard’s wear equation is programmed into the UMESHMOTION subroutine through the Fortran language to ensure that the calculation results of the wear depth are embedded in the finite element software. The simulation procedure is to calculate the contact stress between the contact surfaces and its distribution range after establishing the finite element model of the friction pair as well as loading it and setting the boundary conditions according to the friction conditions. Thereafter, the wear depth of each node in the contact area is solved by extracting the calculation results of the contact stress at different moments and combining with Archard’s wear equation. The above process is iterated until the wear process is completed, which enables the simulation of the wear process and the acquisition of the final wear depth. It should be noted that in order to adapt to the material loss state during the wear process, the mesh of the contact area needs to be updated in real time, and the node displacements within the adaptive mesh area are adjusted based on the calculation results of the wear depth at adjacent moments with the help of the Arbitrary Lagrangian–Eulerian (ALE) technique. The adoption of this technique enables the friction pairs to be in a real-time contact state with the action of radial load. At the same time, it also improves the calculation accuracy and efficiency of the wear depth at the next moment. The change in wear depth of a certain node on the contact surface at adjacent moments is described as follows.
Δ h i = k P i Δ l
h i = h i 1 + k P i Δ l
where Pi is the contact pressure of the node; Δl is the increment of the sliding distance; hi-1 and hi represent the wear depths at the (i−1)-th and i-th time steps, respectively.

3.2. Results and Discussion

Based on Archard’s wear equation and FEM, the wear process of the hardened layer is simulated. Figure 9, Figure 10, Figure 11 and Figure 12 show the contact stress distribution and wear cross-sections at different locations of No.1 workpiece over time. It should be noted that the hardness at locations A, B and C of the hardened layer are 190.3 Hv, 610.3 Hv and 621.3 Hv, respectively, from Figure 4. From this, the hardness at locations B and C are very similar. Therefore, simulations are only carried out for locations A and B.
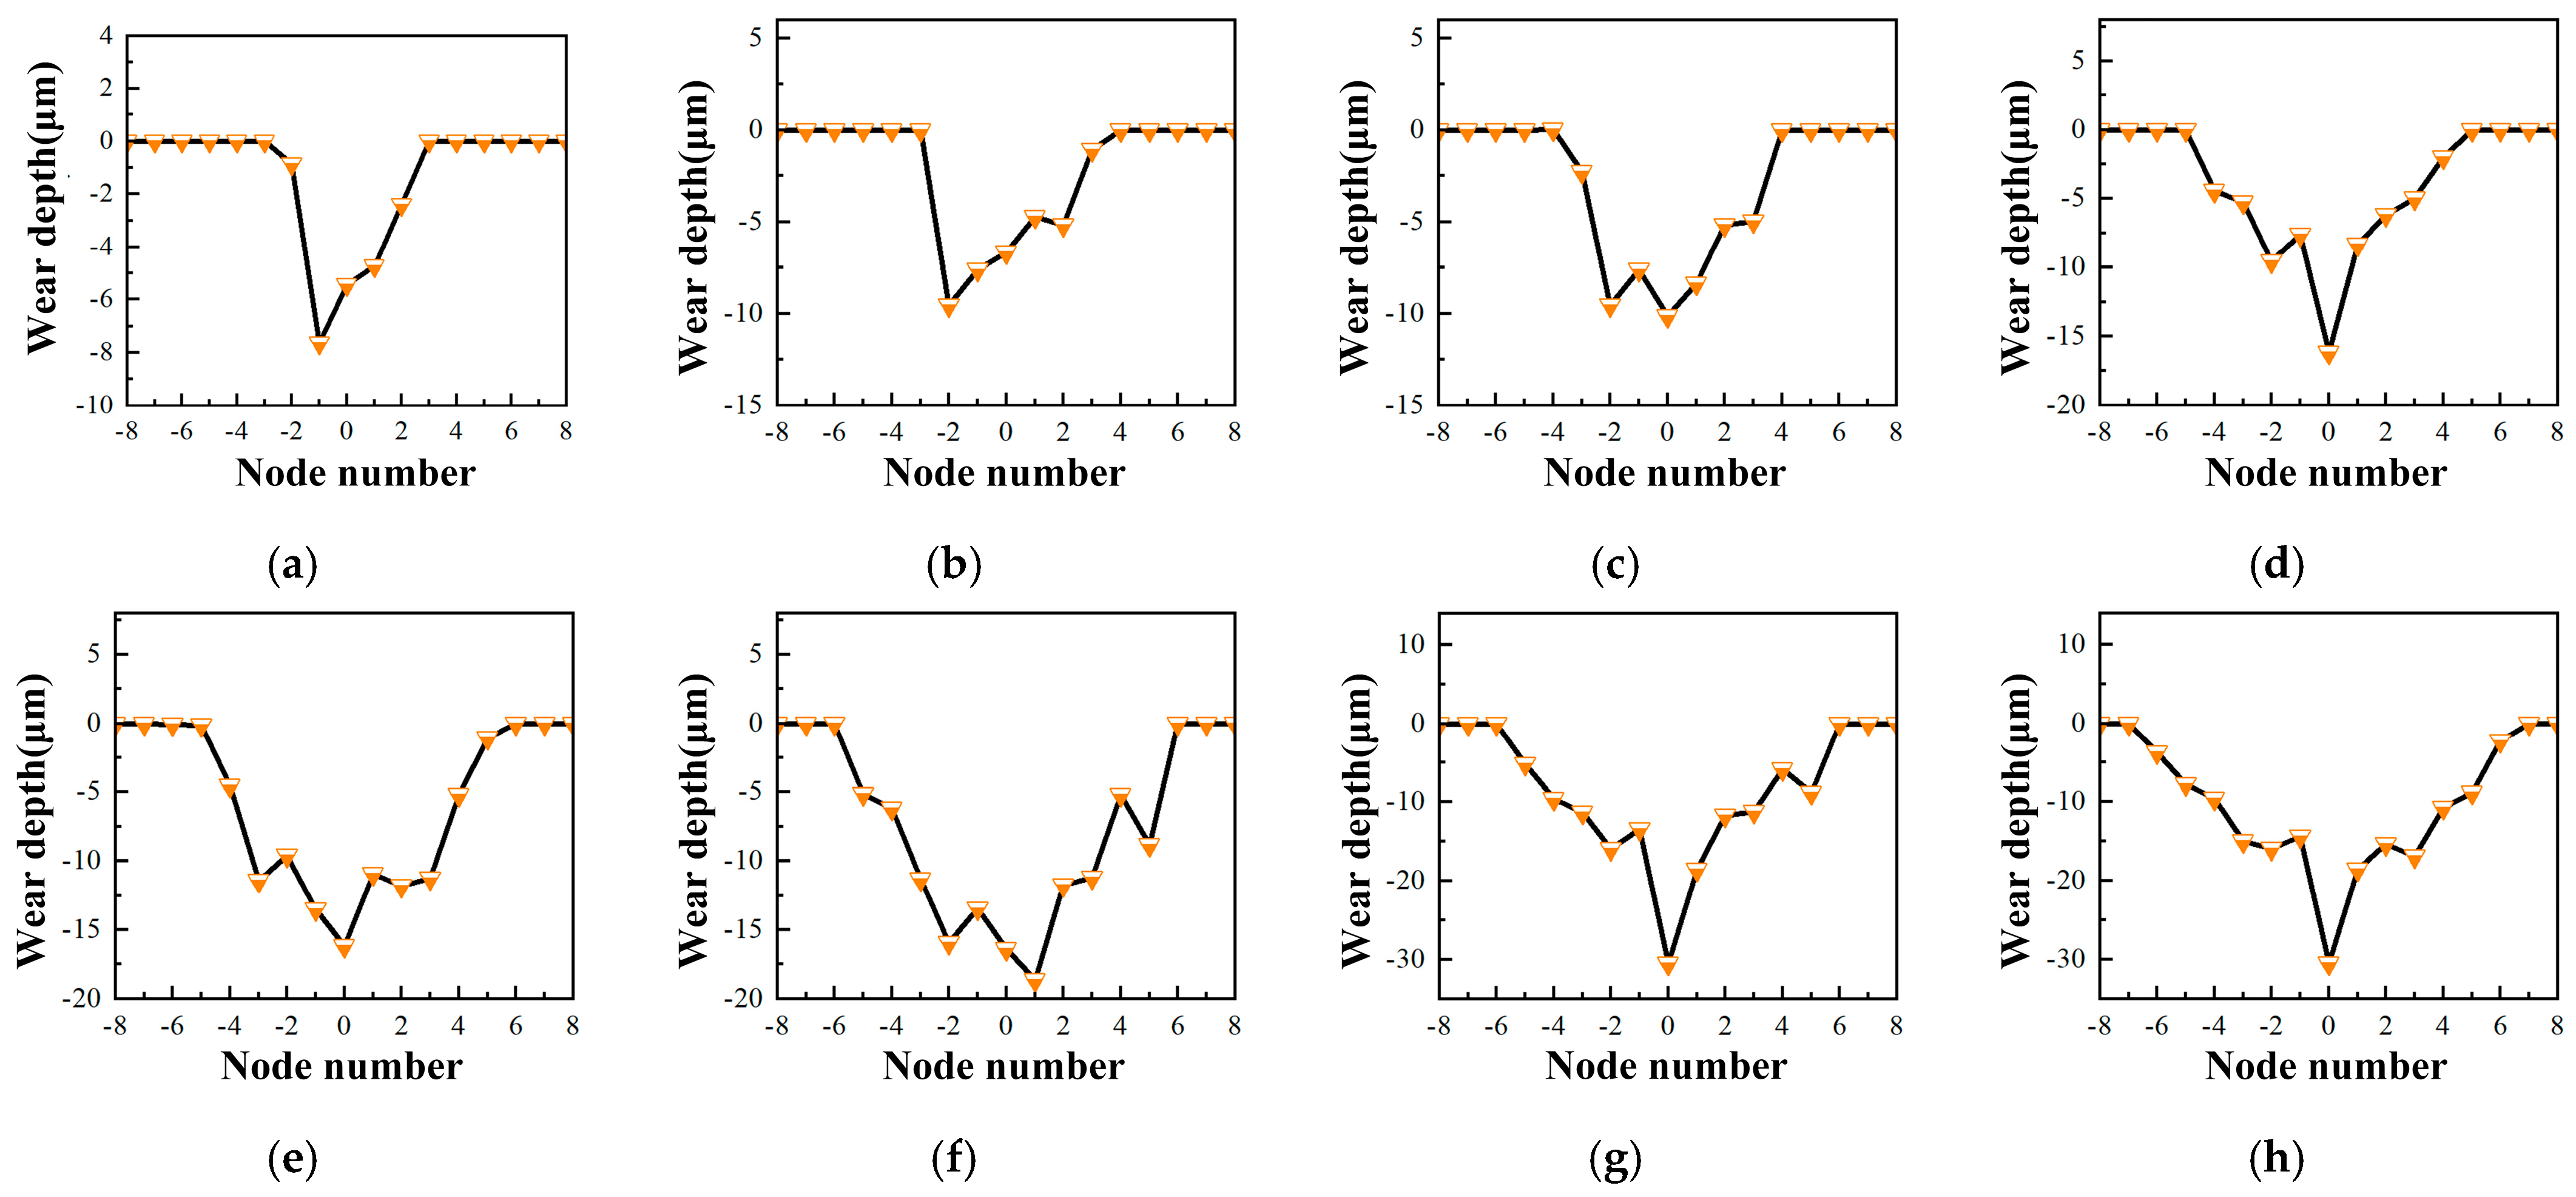
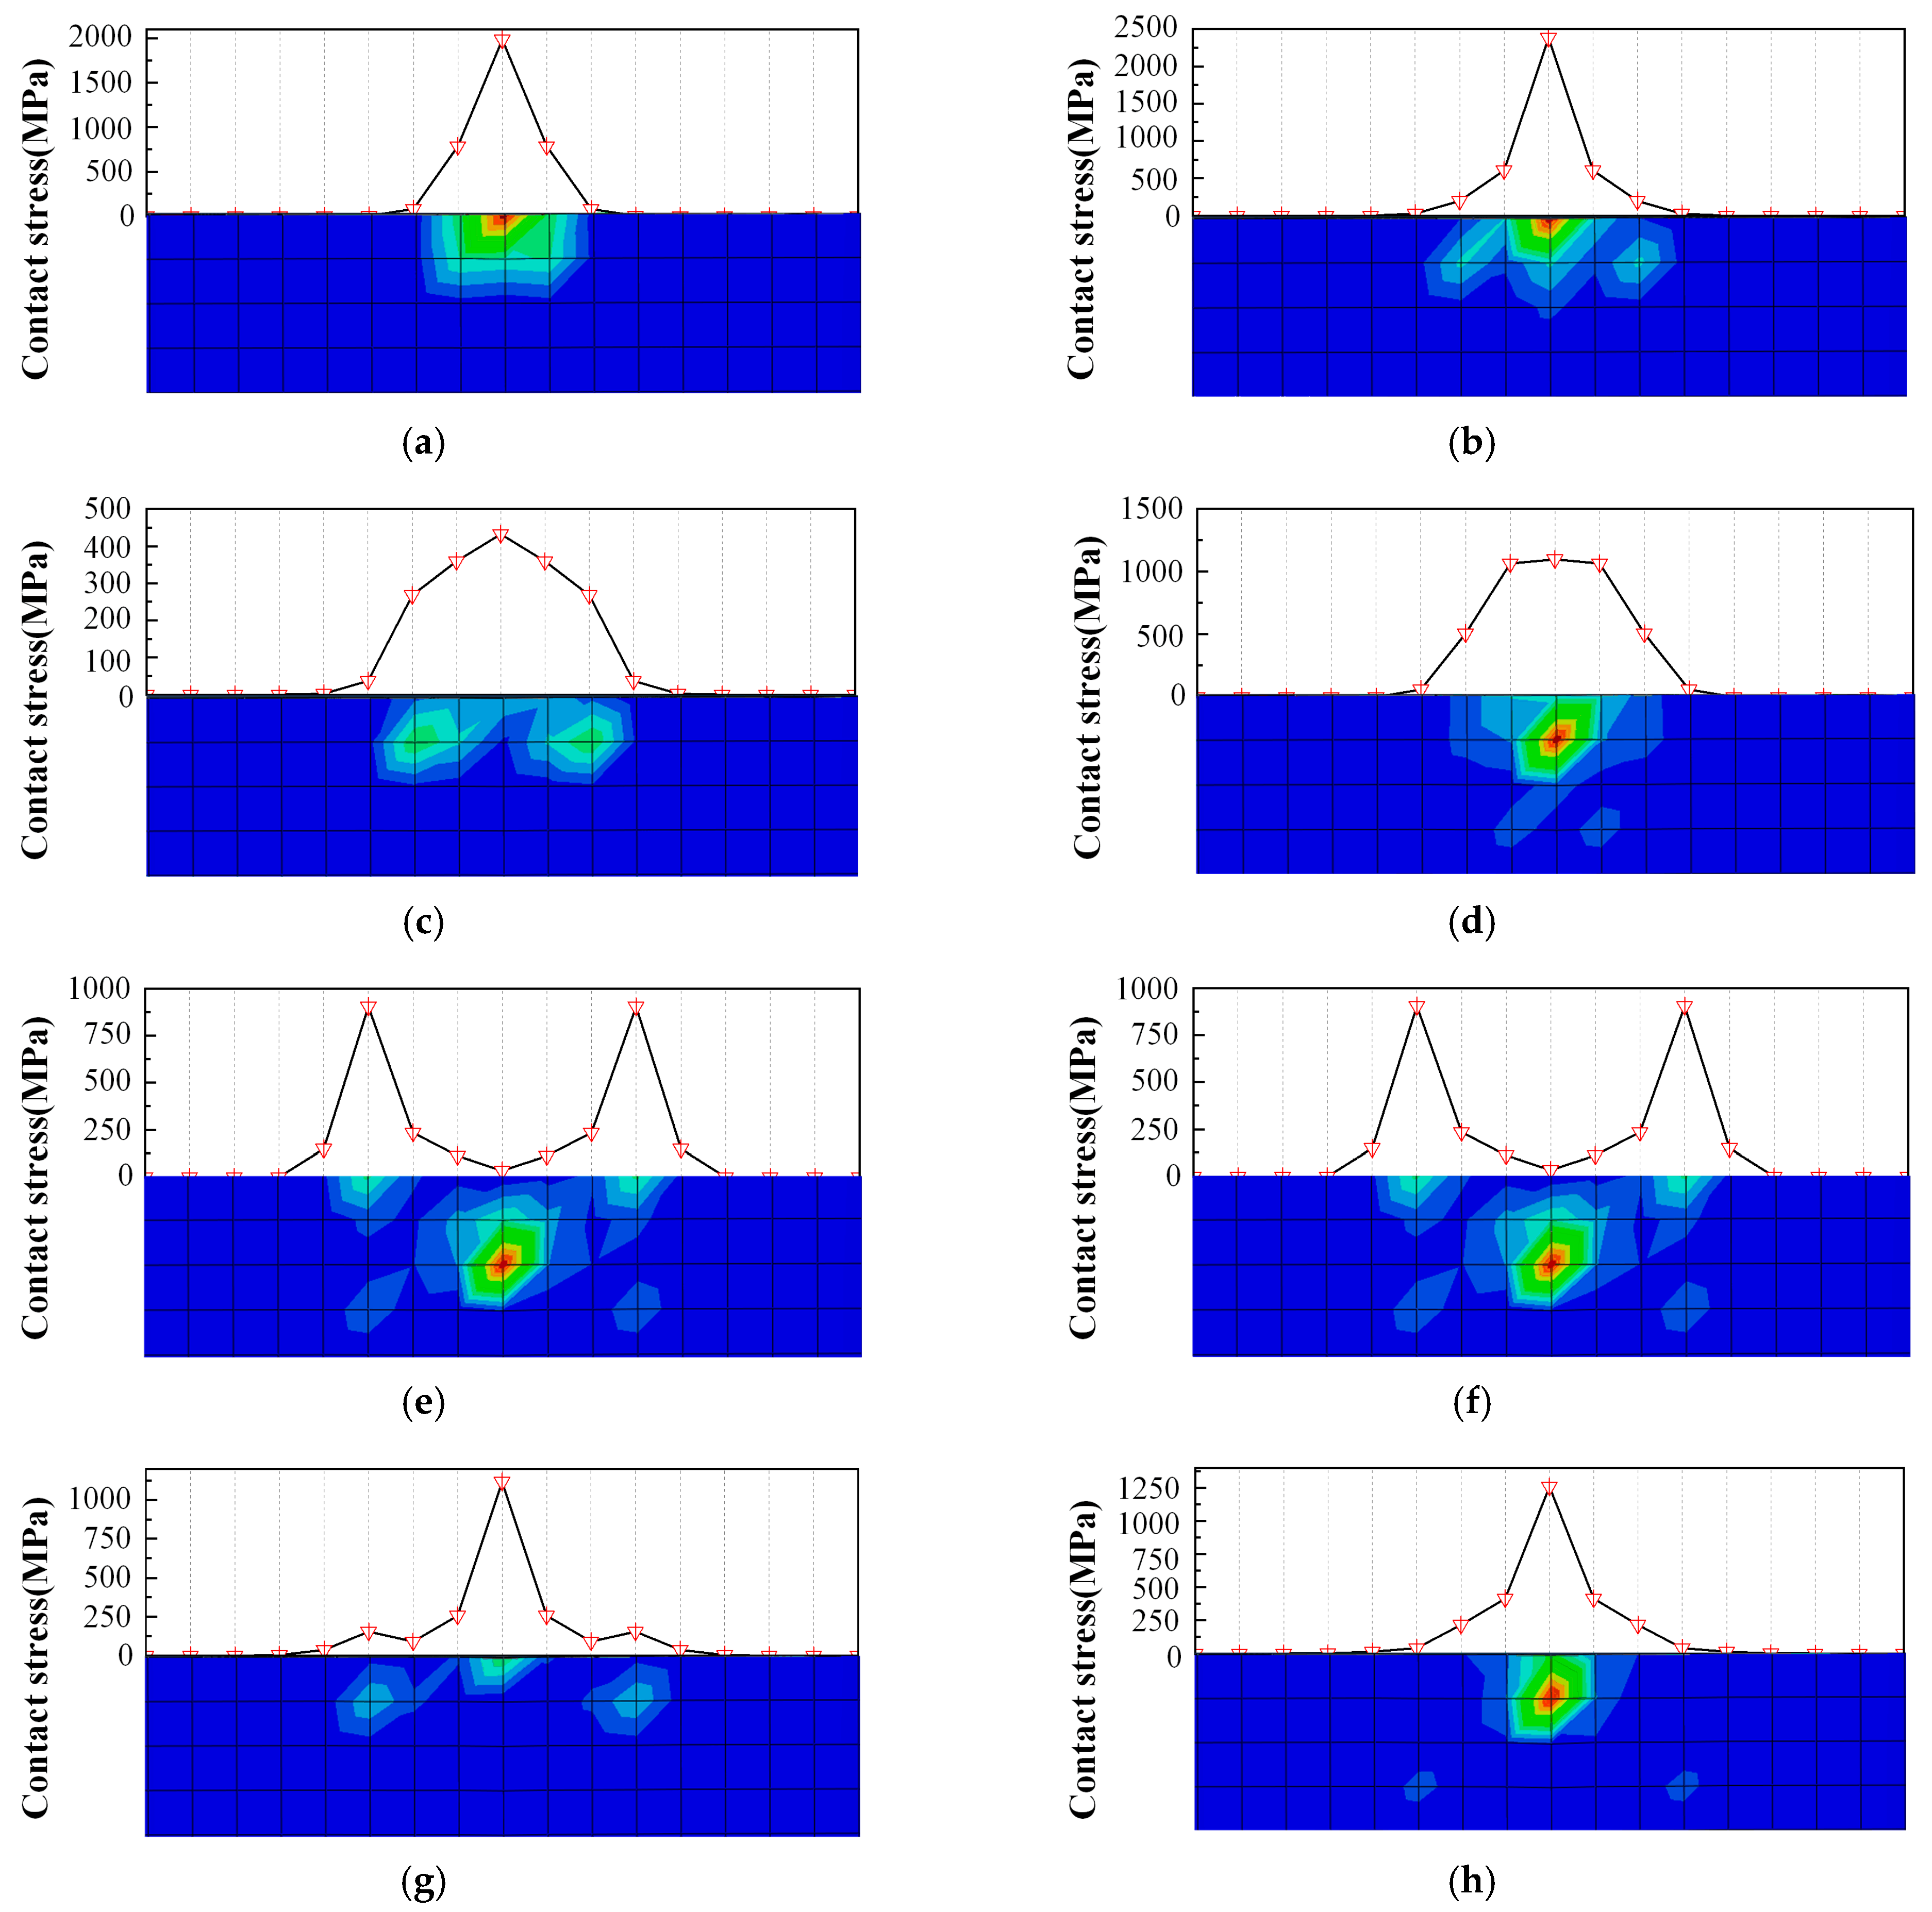
As can be seen from Figure 9, in the initial stage of friction when t = 66 s, the contact between the ceramic ball and the hardened layer changes rapidly from point contact to surface contact due to the relatively low hardness of location A in the hardened layer. However, the contact stress is still concentrated in the middle area of wear. This pressure distribution directly results in the wear depth in this area being more prominent than that on the edges, thereby forming a V-shaped profile similar to the one in Figure 9a and Figure 10a. When t = 133 s, the distribution of the contact stress increases with further expansion of the contact area between the friction pairs accordingly. At this time, both the wear depth and width have grown (shown as Figure 9b and Figure 10b). As can be seen from Figure 9c and Figure 10c, with the progress of friction, the wear depth in the middle area continues to increase, whereas due to the relatively small wear depth in the two sides, the contact effect between the ceramic ball and the middle area of the hardened layer is restricted. As a result, the contact pressure accumulates and increases on both edges. Therefore, the growth rate of the wear width at this moment is more prominent compared with the wear depth. When the wear width develops to a certain extent, the maximum contact pressure appears again in the middle area which is clearly demonstrated in Figure 9d. It directly leads to a rapid increase in the wear depth at this location. Meanwhile, the wear area presents a V-shaped groove in the middle area, while the contours on both sides are relatively gentle (Figure 10d). During the subsequent friction process (Figure 9e–h and Figure 10e–h), the stress distribution in the contact area still shows that the maximum value reciprocates between the middle and the edge of wear, which increases the contact area continuously and further expands the wear depth and width. Eventually, the wear profile exhibits a U-shaped characteristic.
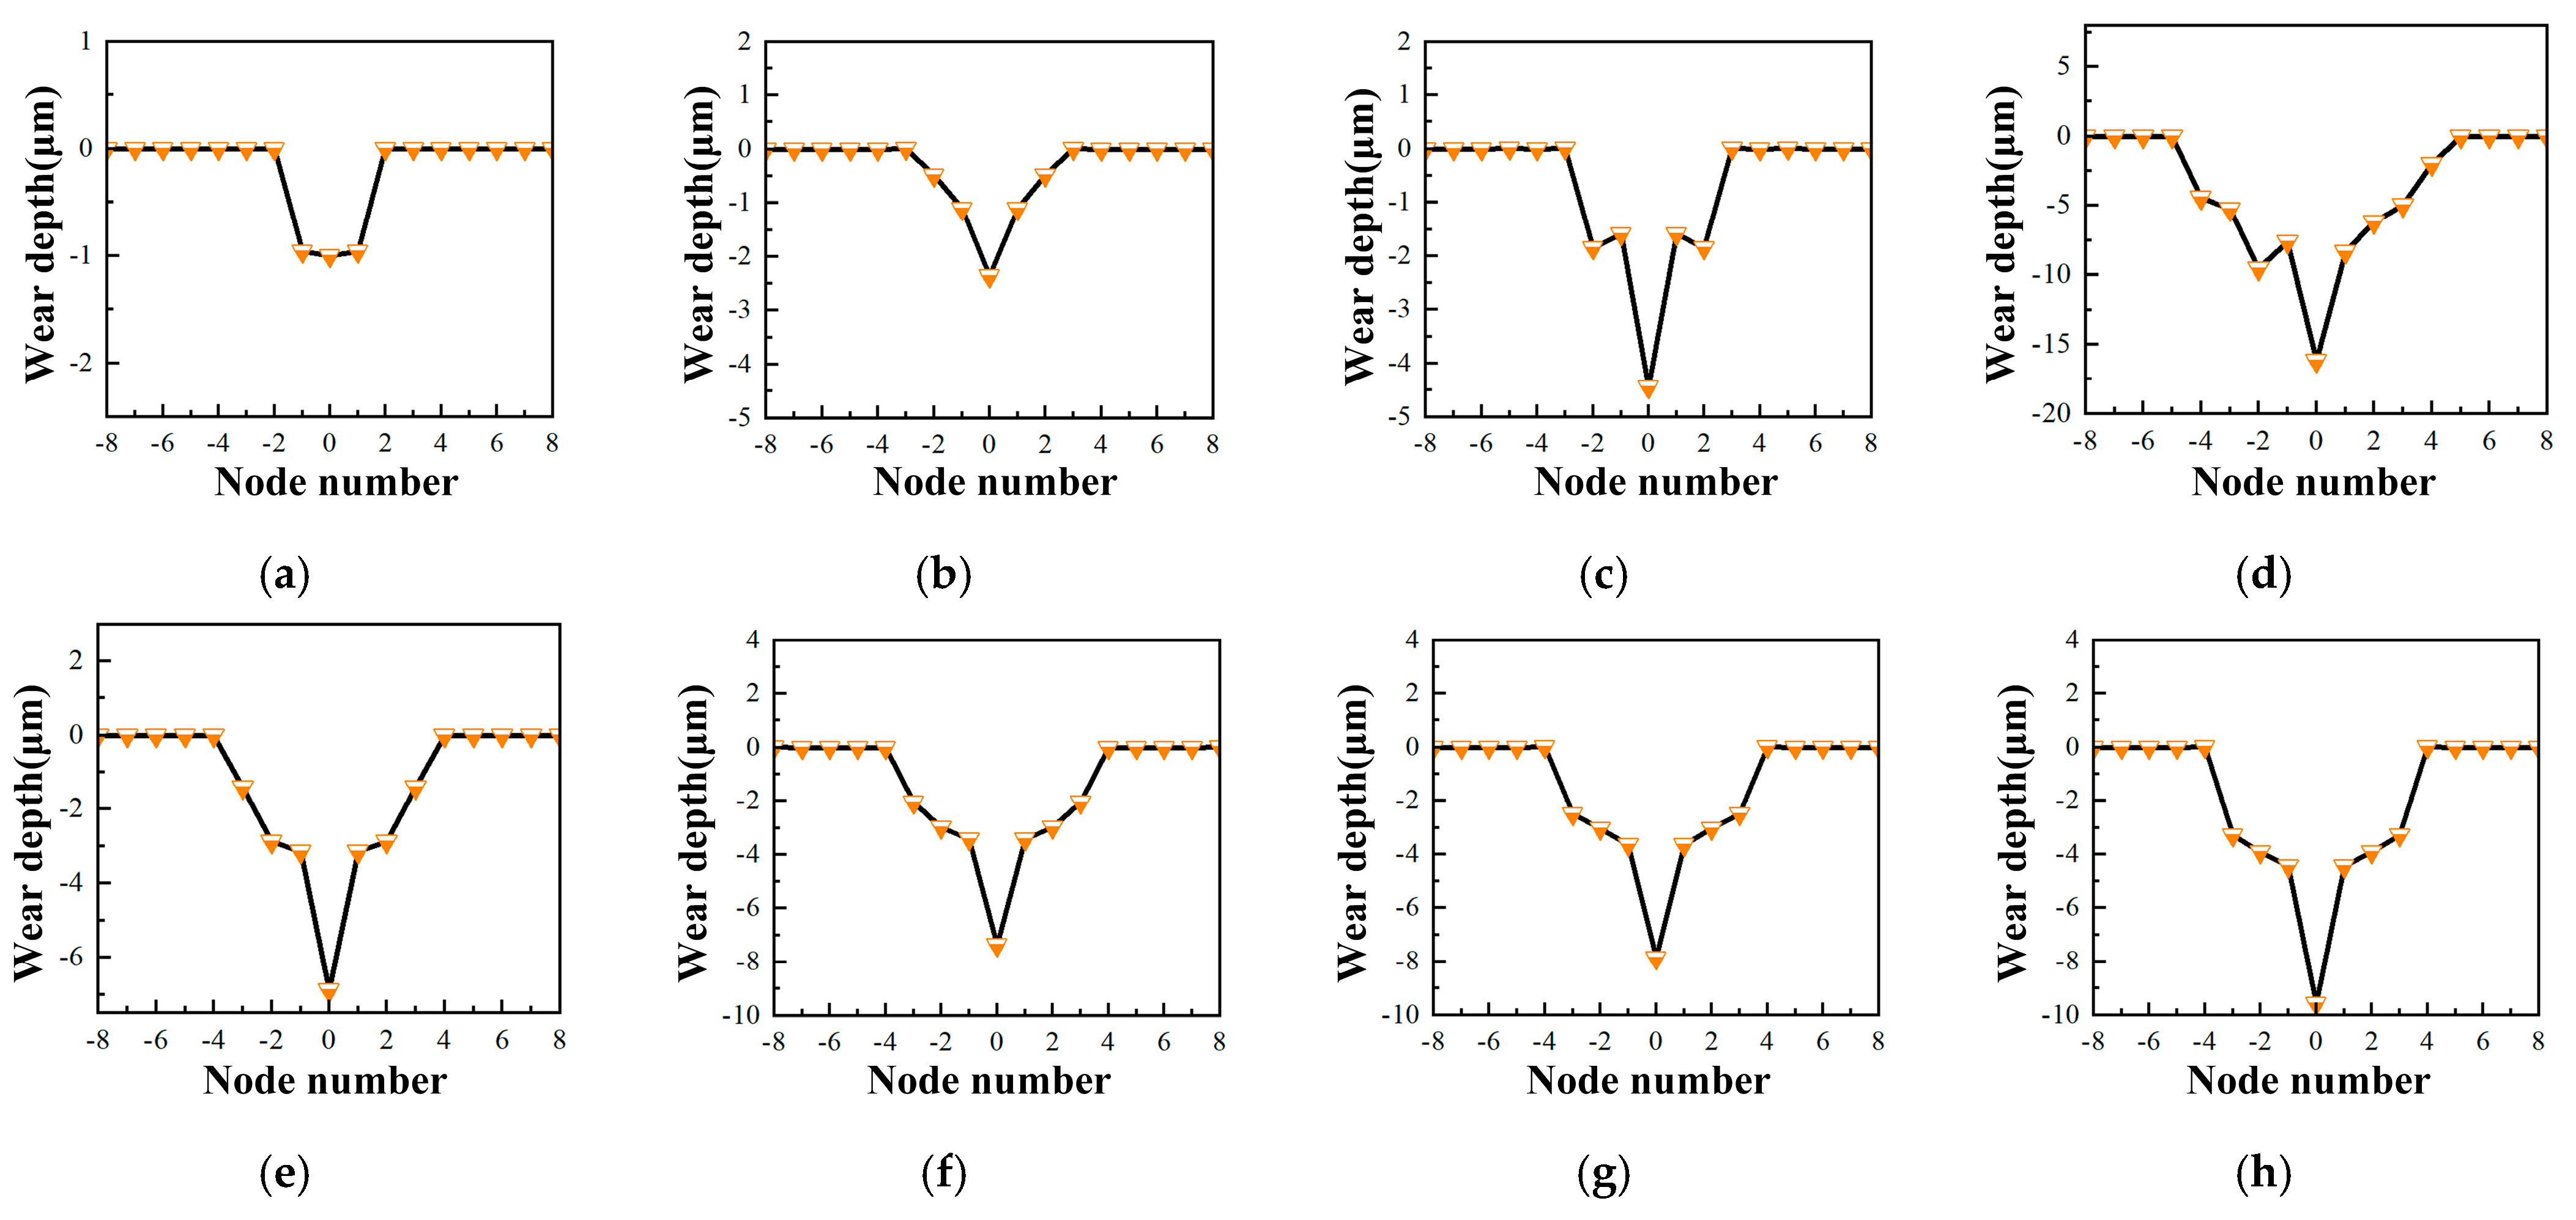
Figure 11 and Figure 12 show the contact stress and wear profile on location B of No.1 workpiece at different moments. From Figure 11a–d and Figure 12a–d, the hardness on location B of the hardened layer is higher than location A. Therefore, the hardness difference between ceramic ball and hardened layer is reduced, which causes the friction pair to make point contact when t = 0–332 s. The maximum contact stress is concentrated in the middle area, with no obvious increase in the distribution range. Therefore, within this period, the wear profile shows a V-shaped characteristic, and the wear depth is significantly greater than the wear width. When t = 332~865 s, the contact form between the friction pairs has been changed into surface contact because of the increase in wear. While the distribution of the contact stress expands significantly, the location of the maximum stress within the wear area also alters constantly with the progress of the friction. The main reason for this phenomenon is that the effect of stress concentration makes the contact stress at the edge of wear always greater than that inside. It leads to the accelerated loss of the edge material, and in turn causes the location of the maximum contact stress to shift within the wear area. Apparently, the maximum value of stress may affect the wear rate at different locations, thereby leading to a change in the wear profile at different friction moments. Still, the final wear profile at this location exhibits the characteristics of a V-shape.
By comparing Figure 9, Figure 10, Figure 11 and Figure 12, wear processes at different locations of the hardened layer are similar. That is, the contact surfaces are all affected by the stress distribution and its action range. The wear depth and width increase with the material loss caused by friction continuously. Moreover, the wear profile changes accordingly. In addition, since the final wear depth and width at location B are significantly smaller than those at location A, it can be determined that the wear resistance of the stable grinding area and the cut-out area is significantly better than that of the cut-in area. Simultaneously, combined with Figure 7 and Figure 8, the simulated wear profiles at different locations are consistent with the experimental results. The results verify the effectiveness of the above simulation study on the wear process. Only the hardness is set in a differentiated manner among the simulation parameters. Therefore, it can be considered that the fundamental reason for the obvious differences in the wear resistance at different locations is hardness inhomogeneity. On this basis, inhomogeneity distribution will lead to the premature failure of the parts in engineering applications. Therefore, it is necessary to formulate reasonable grinding parameters to improve the hardness homogeneity.
The wear processes at different locations of the hardened layers from No.1 to No.5 are simulated. The final wear depth results are extracted and compared with the experimental values, as shown in Table 3. From the comparison results, the errors of the wear depth with different experimental parameters are between 3.6% and 11.3%. The main reason for the generation of errors is that the wear coefficient is set as a constant in the simulation, k in different locations of the hardened layer is shown in Table 4. Meanwhile, the influences of wear mechanisms such as fatigue and oxidation, frictional temperature and transverse shear stress on wear are ignored.

4. Conclusions

This research aims to investigate the influence of hardness homogeneity on wear resistance of the hardened layer. Based on the grind-hardening and the friction experiment, the wear process of the hardened layer with different experimental parameters is simulated combined with the Archard wear model and FEM. Then, the material loss mechanism in the wear area with the influence of hardness homogeneity is analyzed. Further, the wear depth is predicted effectively. The following conclusions are drawn from the study:
(1)
An experimental study on grind-hardening of AISI 1045 steel is carried out. The results show that the instantaneous grinding force appears to be a nonlinear change during the grinding process. According to the variation characteristics of the grinding force over time, the workpiece surface can be divided into the cut-in area, the stable area and the cut-out area. Combined with microstructure observation, the change in grinding force is the fundamental reason for inhomogeneous hardness distribution of hardened layer.
(2)
The friction experiment on the hardened layer has found that the COF with different experimental parameters all show the variation law of continuously decreasing from the cut-in area to the cut-out area. In addition, although the wear profiles at different locations tend to be the same as the given experimental parameters, the test results of the wear depth, width and volume wear amount still reflect the influence of the hardness homogeneity on the overall wear resistance of the hardened layer.
(3)
A simulation study is carried out on the wear process of the hardened layer. The results show that the wear processes at different locations of the hardened layer are all affected by stress concentration, thereby causing the maximum value of the contact stress to move cyclically between the middle and the edge of wear area. It leads to a continuous increase in the wear depth and width as the contact stress and its distribution change. Eventually, the wear profile also varies accordingly. Meanwhile, by comparing the simulated values of the wear depth with different experimental parameters with the experimental values, the error is between 3.6% and 11.3%. It proves the effectiveness of the theoretical research on the simulation of the wear process of the hardened layer considering the influence of hardness homogeneity and the prediction of its depth.
In current studies, although it has been proven that the formation of hardened layer in the grind-hardening process can improve the application performance of parts greatly, these studies usually overlook the impact of the inhomogeneous hardness distribution on its wear resistance. It will reduce the service life of hardened parts significantly in engineering applications. Therefore, by combining theoretical simulation and physical experiments, in-depth research has been conducted on the influence mechanism of the hardness homogeneity of hardened layer on its wear resistance. The innovations of this study lie in the following aspects: (1) The instantaneous grinding force, microstructure, hardness distribution, friction coefficient, wear morphology and profile are systematically tested and analyzed through grind-hardening and friction experiments of AISI 1045 steel. On this basis, the hardness homogeneity of the hardened layer with different experimental parameters and its influence mechanism on wear resistance are explored comprehensively. (2) Based on the experiment data and combined with the FEM, the friction process of hardened layer is simulated while considering the hardness homogeneity. The wear behavior is analyzed from the perspective of the variation and action range of the maximum contact stress. This research can provide support for enriching and developing the fundamental theories and key technologies of the grind-hardening process and further propose a process optimization approach for the hardness homogeneity of hardened layer. What is more, it expands the engineering application of the grind-hardening process.

Author Contributions

Conceptualization, Y.G.; methodology, Y.G. and M.L.; software, Y.G. and Y.Z.; validation, Y.G. and Y.Z.; formal analysis, Y.G. and M.L.; investigation, Y.G., M.L. and Y.Z.; resources, Y.G. and M.L.; data curation, M.L.; writing—original draft preparation, Y.G.; writing—review and editing, Y.G. and M.L.; visualization, Y.G. and M.L.; supervision, M.L.; project administration, Y.G. and M.L.; funding acquisition, Y.G. and M.L.; All authors have read and agreed to the published version of the manuscript.

Funding

This work was supported by the National Natural Science Foundation of China (Grant number 52205451), the Fundamental Research Funds for the Central Universities of China (Grant number N2303022), Liaoning Provincial Natural Science Fund Joint Fund of China (Grant number 2023-MSBA-027) and Scientific Research Funding of Educational Department of Liaoning Province, China (Grant number LJ212410153066).

Institutional Review Board Statement

Not applicable.

Informed Consent Statement

Not applicable.

Data Availability Statement

The data presented in this study are available on request from the corresponding authors.

Conflicts of Interest

The authors declare no conflicts of interest.

References

  1. Yang, Z.C.; Zhu, L.D.; Zhang, G.X.; Ni, C.B.; Lin, B. Review of ultrasonic vibration-assisted machining in advanced materials. Int. J. Mach. Tool. Manuf. 2020, 156, 103594. [Google Scholar] [CrossRef]
  2. Liu, M.H.; Zhang, K.; Xiu, S.C. Mechanism investigation of hardening layer hardness uniformity based on grind-hardening process. Int. J. Adv. Manuf. Technol. 2017, 88, 3185–3194. [Google Scholar] [CrossRef]
  3. Nguyen, T.; Zhang, L.C.; Sun, D.L.; Wu, Q. Characterizing the Mechanical Properties of the Hardened Layer Induced by Grinding-Hardening. Mach. Sci. Technol. 2014, 18, 277–298. [Google Scholar] [CrossRef]
  4. Liu, S.Y.; Yang, G.; Zheng, J.Q.; Liu, X.H. Numerical and experimental studies on grind-hardening cylindrical surface. Int. J. Adv. Manuf. Technol. 2015, 76, 487–499. [Google Scholar]
  5. Wang, Y.S.; Xiu, S.C.; Dong, L.; Sun, C. Study on strengthened layer of workpiece in prestress dry grinding. Int. J. Adv. Manuf. Technol. 2017, 90, 1225–1233. [Google Scholar]
  6. Brockhoff, T. Grind-hardening: A comprehensive view. CIRP Ann. Manuf. Technol. 1999, 48, 255–260. [Google Scholar] [CrossRef]
  7. Zarudi, I.; Zhang, L.C. Mechanical property improvement of quenchable steel by grinding. J. Mater. Sci. 2002, 37, 3935–3943. [Google Scholar] [CrossRef]
  8. Alonso, U.; Ortega, N.; Sanchez, J.A.; Pombo, I.; Plaza, S.; Izquierdo, B. In-process prediction of the hardened layer in cylindrical traverse grind-hardening. Int. J. Adv. Manuf. Technol. 2014, 71, 101–108. [Google Scholar] [CrossRef]
  9. Sölter, J.; Eckebrecht, J.; Kolkwitz, B.; Heinzel, C. Analysis of the distortion and compensation potential in grind-hardening of linear guides. Materialwiss. Werkstofftech. 2016, 47, 726–734. [Google Scholar] [CrossRef]
  10. Fazli Shahri, H.R.; Akbari, A.A.; Mahdavinejad, R.; Solati, A. Surface hardness improvement in surface grinding process using combined Taguchi method and regression analysis. J. Adv. Mech. Des. Syst. Manuf. 2018, 12, 1–14. [Google Scholar] [CrossRef]
  11. Shi, X.L.; Zhang, X.M.; Xiu, S.C. A research on the mechanism and model of surface micro-damage in grinding hardening. Adv. Mech. Eng. 2021, 13, 1–14. [Google Scholar] [CrossRef]
  12. Shi, X.L.; Xiu, S.C.; Liu, X. Experiment study on the corrosion resistance of the surface metamorphic layer of grinding. Sci. Rep. 2021, 11, 23926. [Google Scholar] [CrossRef]
  13. Foeckerer, T.; Zaeh, M.F.; Zhang, O.B. A three-dimensional analytical model to predict the thermo-metallurgical effects within the surface layer during grinding and grind-hardening. Int. J. Heat Mass Transf. 2013, 56, 223–237. [Google Scholar] [CrossRef]
  14. Nguyen, T.; Liu, M.; Zhang, L.C.; Wu, Q.; Sun, D.L. An Investigation of the Grinding-Hardening Induced by Traverse Cylindrical Grinding. J. Manuf. Sci. Eng.-Trans. ASME 2014, 136, 051008. [Google Scholar] [CrossRef]
  15. Zhang, Y.; Ge, P.Q.; Be, W.B. Plane grind-hardening distortion analysis and the effect to grind-hardening layer. Int. J. Adv. Manuf. Technol. 2015, 78, 431–438. [Google Scholar] [CrossRef]
  16. Xiu, S.C.; Sun, C.; Duan, J.C.; Lan, D.X.; Li, Q.L. Study on the surface topography in consideration of the dynamic grinding hardening process. Int. J. Adv. Manuf. Technol. 2019, 100, 209–233. [Google Scholar] [CrossRef]
  17. Gao, S.X.; Liu, J.D.; Huang, S.W.; Lin, R.C. Effects of Heat Generated during Grind Hardening on Hardness and Microstructure of Alloy Metal: Optimal Process to Improve Efficiency. Sens. Mater. 2020, 32, 3383–3397. [Google Scholar] [CrossRef]
  18. Lerra, F.; Ascari, A.; Fortunato, A. Hardness Penetration Depth Prediction in the Grind-Hardening Process through a Combined FEM model. Procedia CIRP 2022, 108, 194–198. [Google Scholar] [CrossRef]
  19. Guo, Y.; Liu, M.H.; Yin, M.A.; Yan, Y.T. Modeling of the Evolution of the Microstructure and the Hardness Penetration Depth for a Hypoeutectoid Steel Processed by Grind-Hardening. Metals 2020, 10, 1182. [Google Scholar] [CrossRef]
  20. Reichelt, M.; Cappella, B. Large scale multi-parameter analysis of wear of self-mated 100Cr6 steel-A study of the validity of Archard’s law. Tribol. Int. 2021, 159, 106945. [Google Scholar] [CrossRef]
  21. Zheng, M.L.; Wang, B.; Zhang, W.; Cui, Y.Z.; Zhang, L.; Zhao, S.H. Analysis and prediction of surface wear resistance of ball-end milling topography. Surf. Topogr. Metrol. Prop. 2020, 8, 025032. [Google Scholar] [CrossRef]
  22. Feyzi, M.; Fallahnezhad, K.; Taylor, M.; Hashemi, R. A review on the finite element simulation of fretting wear and corrosion in the taper junction of hip replacement implants. Comput. Biol. Med. 2021, 130, 104196. [Google Scholar] [CrossRef]
  23. Lu, C.; Jin, J.B.; Mo, J.L.; Wang, J.Y. Accumulated wear degradation prediction of railway friction block considering the evolution of contact status. Wear 2022, 494–495, 204251. [Google Scholar] [CrossRef]
Figure 1. Experiment conditions.
Coatings 15 01196 g001
Figure 2. Curves of instantaneous grinding force and its direction: (a), grinding force curve; (b), grinding force direction.
Coatings 15 01196 g002
Figure 3. Distribution of microstructures at different locations on the workpiece surface: (a), Location A; (b), Location B; (c), Location C.
Coatings 15 01196 g003
Figure 4. The hardness distribution of the hardened layer with different grinding depths: (a), the whole curve; (b), local magnified curve.
Coatings 15 01196 g004
Figure 5. The COF at different locations of the hardened layer with variable grinding depths.
Coatings 15 01196 g005
Figure 6. Wear morphology at different locations of hardened layer: (a), Location A; (b), Location B; (c), Location C.
Coatings 15 01196 g006
Figure 7. Wear cross-sections of the hardened layer with different experimental parameters: (a), ap = 0.1 mm; (b), ap = 0.15 mm; (c), ap = 0.2 mm; (d), ap = 0.25 mm; (e), ap = 0.3 mm.
Coatings 15 01196 g007
Figure 8. Wear amounts of the hardened layer with different experimental parameters: (a), ap = 0.1 mm; (b), ap = 0.15 mm; (c), ap = 0.2 mm; (d), ap = 0.25 mm; (e), ap = 0.3 mm.
Coatings 15 01196 g008
Figure 9. Contact stress on location A of the hardened layer at different moments: (a), t = 66 s; (b), t = 133 s; (c), t = 266 s; (d), t = 332 s; (e), t = 532 s; (f), t = 599 s; (g), t = 665 s; (h), t = 865 s.
Coatings 15 01196 g009
Figure 10. The wear profile on location A of the hardened layer at different moments: (a), t = 66 s; (b), t = 133 s; (c), t = 266 s; (d), t = 332 s; (e), t = 532 s; (f), t = 599 s; (g), t = 665 s; (h), t = 865 s.
Coatings 15 01196 g010
Figure 11. The contact stress on location B of the hardened layer at different moments: (a), t = 66 s; (b), t = 133 s; (c), t = 266 s; (d), t = 332 s; (e), t = 532 s; (f), t = 599 s; (g), t = 665 s; (h), t = 865 s.
Coatings 15 01196 g011
Figure 12. The wear profile on location B of the hardened layer at different moments: (a), t = 66 s; (b), t = 133 s; (c), t = 266 s; (d), t = 332 s; (e), t = 532 s; (f), t = 599 s; (g), t = 665 s; (h), t = 865 s.
Coatings 15 01196 g012
Table 1. Chemical composition of AISI 1045 steel (mass %).
CSiMnPSCrNiMoCu
0.450.250.560.020.010.020.010.020.01
Table 2. Experimental parameters.
No.Grinding ParametersFriction Condition
Grinding Depth
ap (mm)
Feed Speed
vw (m/s)
LocationLoad
FN (N)
Frequency
f (Hz)
Sliding Distance
(mm)
Time
t (min)
10.100.020A—3 mm
B—15 mm
C—32 mm
503.01015
20.15
30.20
40.25
50.30
Table 3. Comparison between the simulated and experimental values of the wear depth at different locations.
No.Location ALocation BLocation C
Simulated/μmExperimental/μmErrorSimulated/μmExperimental/μmErrorSimulated/μmExperimental/μmError
122.4924.287.3%9.9310.868.6%8.439.036.6%
221.5822.765.5%7.678.509.8%6.317.0110.0%
39.049.676.5%7.418.3611.3%5.125.313.6%
48.849.658.4%7.348.028.4%4.174.425.7%
56.396.856.7%6.156.677.8%3.984.174.6%
Table 4. The value of k at different locations on hardened layer in simulation.
No.K × 10−8
Location ALocation BLocation C
19.6390.8320.815
29.1420.8000.526
30.7410.6790.491
40.6800.6300.487
50.6760.5260.472
Disclaimer/Publisher’s Note: The statements, opinions and data contained in all publications are solely those of the individual author(s) and contributor(s) and not of MDPI and/or the editor(s). MDPI and/or the editor(s) disclaim responsibility for any injury to people or property resulting from any ideas, methods, instructions or products referred to in the content.