Article

Investigation on the Interfacial Behavior of Thiols on Silver Surface by DFT Study and MD Simulation

School of Chemical Engineering, Ocean and Life Sciences, Dalian University of Technology, Panjin 124221, China
*
Author to whom correspondence should be addressed.
Coatings 2025, 15(10), 1134; https://doi.org/10.3390/coatings15101134
Submission received: 12 August 2025 / Revised: 24 August 2025 / Accepted: 2 September 2025 / Published: 1 October 2025
(This article belongs to the Section Corrosion, Wear and Erosion)

Abstract

The adsorption of organic substances on the surface of silver is a crucial method for the anti-tarnish treatment of silver, and thiol organic substances have a significant protective effect on silver. Through quantum chemical calculations and molecular dynamics simulations, the adsorption performance of thiol compounds on silver surfaces was investigated as the research object. Thiol compounds are classified into five categories, including short-chain saturated fat thiols and long-chain saturated fat thiols, and their adsorption properties are compared. After screening, thiol compounds with better adsorption performance on the surface of Ag were obtained. Long-chain saturated aliphatic thiols have the best protective effect for silver anti-tarnish treatment, followed by aromatic thiols, while short-chain saturated aliphatic thiols give the worst effect.

1. Introduction

In recent years, silver nanoparticles, as important research objects, have been widely applied in fields such as heat conduction, electrical conduction, and catalysis [1,2,3,4]. However, silver is prone to corrosion in the air, especially in the presence of sulfides such as hydrogen sulfide (H2S) and carbonyl sulfide (OCS) [5,6]. The sulfation of silver is accompanied by the formation of Ag2S, also known as tarnishing [7,8,9]. Problems such as reduced thermal and electrical conductivity caused by sulfidation have limited the various applications of silver. Accordingly, the anti-corrosion and anti-tarnish research of Ag-based material has been highly valued [10].
To get rid of the influence of this problem, scientists have come up with the idea of protecting silver through physical barriers to separate it from corrosive substances, such as organic polymer films, self-assembling films, precious metal films, etc. [11,12,13,14,15]. However, various types of films have obvious drawbacks: the cost of metal coatings is high, they are prone to galvanic corrosion and affect conductivity; inorganic coatings are brittle and prone to cracking, and have poor protective stability.
Over years of research, people have turned their attention to the adsorption of organic substances on the surface of silver. Some studies have shown that thiol compounds have a protective effect on silver. Mercaptans have significant advantages in preventing silver corrosion [16,17]. They can not only quickly form a dense and stable chemical adsorption film on the silver surface, but also effectively isolate corrosive media such as sulfides and oxygen [18]. Moreover, the film layer is thin and has little impact on the conductivity and appearance of silver, making it suitable for various scenarios such as electronic components and jewelry [19]. Since thiol compounds have an unpleasant odor in the air, when applied to jewelry, they can be dissolved at lower concentrations in other organic compounds (such as n-hexane or ethanol) for coating. At the same time, it has good weather resistance and a long-lasting protective effect.
In the past, when studying the corrosion resistance of Ag, methods such as infrared spectroscopy, electrochemical impedance spectroscopy (EIS), and Tafel curve analysis were commonly used [20,21,22]. Infrared spectroscopy can qualitatively analyze the chemical structure of corrosion products on the surface of silver by detecting characteristic absorption peaks generated by molecular vibrational energy level transitions, thereby inferring the type and path of corrosion reactions [23,24,25]. EIS is an electrochemical method that analyzes the dynamic behaviors of the interface during corrosion, such as charge transfer, diffusion, and film formation, by applying a small alternating signal and measuring the impedance response of the silver electrode at different frequencies [26,27,28]. Tafel curves directly calculate the corrosion rate by measuring the corrosion current density of the silver electrode at different potentials [29,30,31]. Combining these three methods in experiments enables a comprehensive evaluation of the corrosion resistance of silver. However, these methods are characterized by excessive workload and low efficiency. Quantum chemistry, based on the Schrödinger equation, can directly reveal the atomic-level sites where corrosion occurs through calculations. Moreover, when predicting surface anti-corrosion mechanisms, it can pre-screen efficient surface modification strategies without the need for a large number of experimental trials and errors. It can obtain the energy of the highest occupied molecular orbitals and the lowest unoccupied molecular orbitals, thereby researching the interaction mechanisms of molecules on the Ag surface [32,33,34,35,36,37,38,39,40,41]. Molecular dynamics (MD) simulation, by solving Newton’s equations of motion, models the movement trajectories of many atoms and molecules over time and space. This approach can reproduce the dynamic processes of silver in corrosive environments, making it a strong complement to theoretical calculations and experiments. Its innovation lies in overcoming the limitations of “static observation” found in the traditional method [42,43,44,45,46,47,48,49]. These two methods have gradually become efficient approaches for studying chemical reactions at the molecular level in recent decades. Silver is a precious metal. When coating the surface of silver, there are problems such as reagent waste and a large amount of work. We can screen out organic substances with good adsorption through quantum chemical calculations and molecular dynamics simulations, and then verify them through experiments to reduce workload and improve efficiency [50,51,52].
In this work, the adsorption performance between thiol compounds and the Ag surface was taken as the research subject. Thiol compounds were classified into short-chain saturated aliphatic thiols, long-chain saturated aliphatic thiols, aromatic thiols, binary thiols, and unsaturated aliphatic thiols for the comparison of adsorption performance. Firstly, the adsorption behavior of thiol compounds on the silver surface is estimated based on the orbital and electronic information obtained from quantum chemical calculations. Then, the adsorption mechanism is studied through molecular dynamics simulation, thereby screening out thiol compounds with better adsorption performance with the Ag surface.

2. Details of the Theoretical Calculation

In this study, quantum chemical calculations of thiol compounds were conducted based on density functional theory (DFT). Through the Dmol3 module in Materials Studio, with the maximum number of iterations set to 1000, the orbital and electronic properties of thiol compounds were investigated using the DFT method of generalized gradient approximation (GGA), and the exchange correlation functional was the Lee-Yang-Parr (BLYP) functional [53,54,55,56,57,58,59]. Firstly, perform geometric optimization on the molecule using Dmol3. Select ‘use symmetry’, ‘core treatment’ as ‘all electron’, ‘key point set’ as 1 × 1 × 1, the dispersion correction method as ‘DFT-D’, the basis set as ‘DND’, and the basis files as ‘3.5’. Secondly, the energy of the optimized molecules is calculated. By selecting orbitals in properties, the energy values of the highest occupied molecular orbital(HOMO) and lowest unoccupied molecular orbital(LUMO) can be obtained. In the analysis of Dmol3, the distribution of HOMO and LUMO orbitals of the molecule can be displayed.
Charge density difference is a key analytical tool used to describe the changes in the electronic distribution of a system [60,61]. It visually reflects the laws of electron transfer, aggregation, or consumption in processes such as chemical reactions, doping, adsorption, and interface formation by comparing the differences in charge density between two related systems. We selected one molecule with excellent performance from each group of thiols to obtain the electron transfer between the molecule and silver.
MD simulation can obtain the interfacial interaction and the adsorption energy of thiol compounds. First, use silver as the base and cut it in a (1 1 1) plane pattern. Then, use it to build a supercell, whose dimensions are as follows: a = 20.23 Å, b = 20.23 Å, and c = 9.44 Å. Using the build layer tool, combine the box containing thiol molecules with the Ag substrate and add a vacuum layer with a height of 15 Å between them to simulate the adsorption between the two in the gas phase. In the calculation of forcite, the force field used for dynamic calculation is the COMPASS III (Condensed-Phase Optimized Molecular potential for Atomistic Simulation Studies). Using the NVT ensemble at 298 K (room temperature), the total simulation time is 500 ps, and the time step is 1 fs. The adsorption energies ( E a d s o r p t i o n ) of thiol compounds on the Ag surface were calculated by the following Equation (1):
E a d s o r p t i o n =   E t o t a l     E m o l e c u l e     E s u r f a c e

3. Results and Discussion

3.1. Short-Chain Saturated Aliphatic Thiols

Four short-chain saturated aliphatic mercaptans were selected as the research objects, namely methanethiol, ethanethiol, propanethiol, and cyclohexanethiol. The optimized structures of the investigated thiols with atom label symbols are shown in Figure 1.
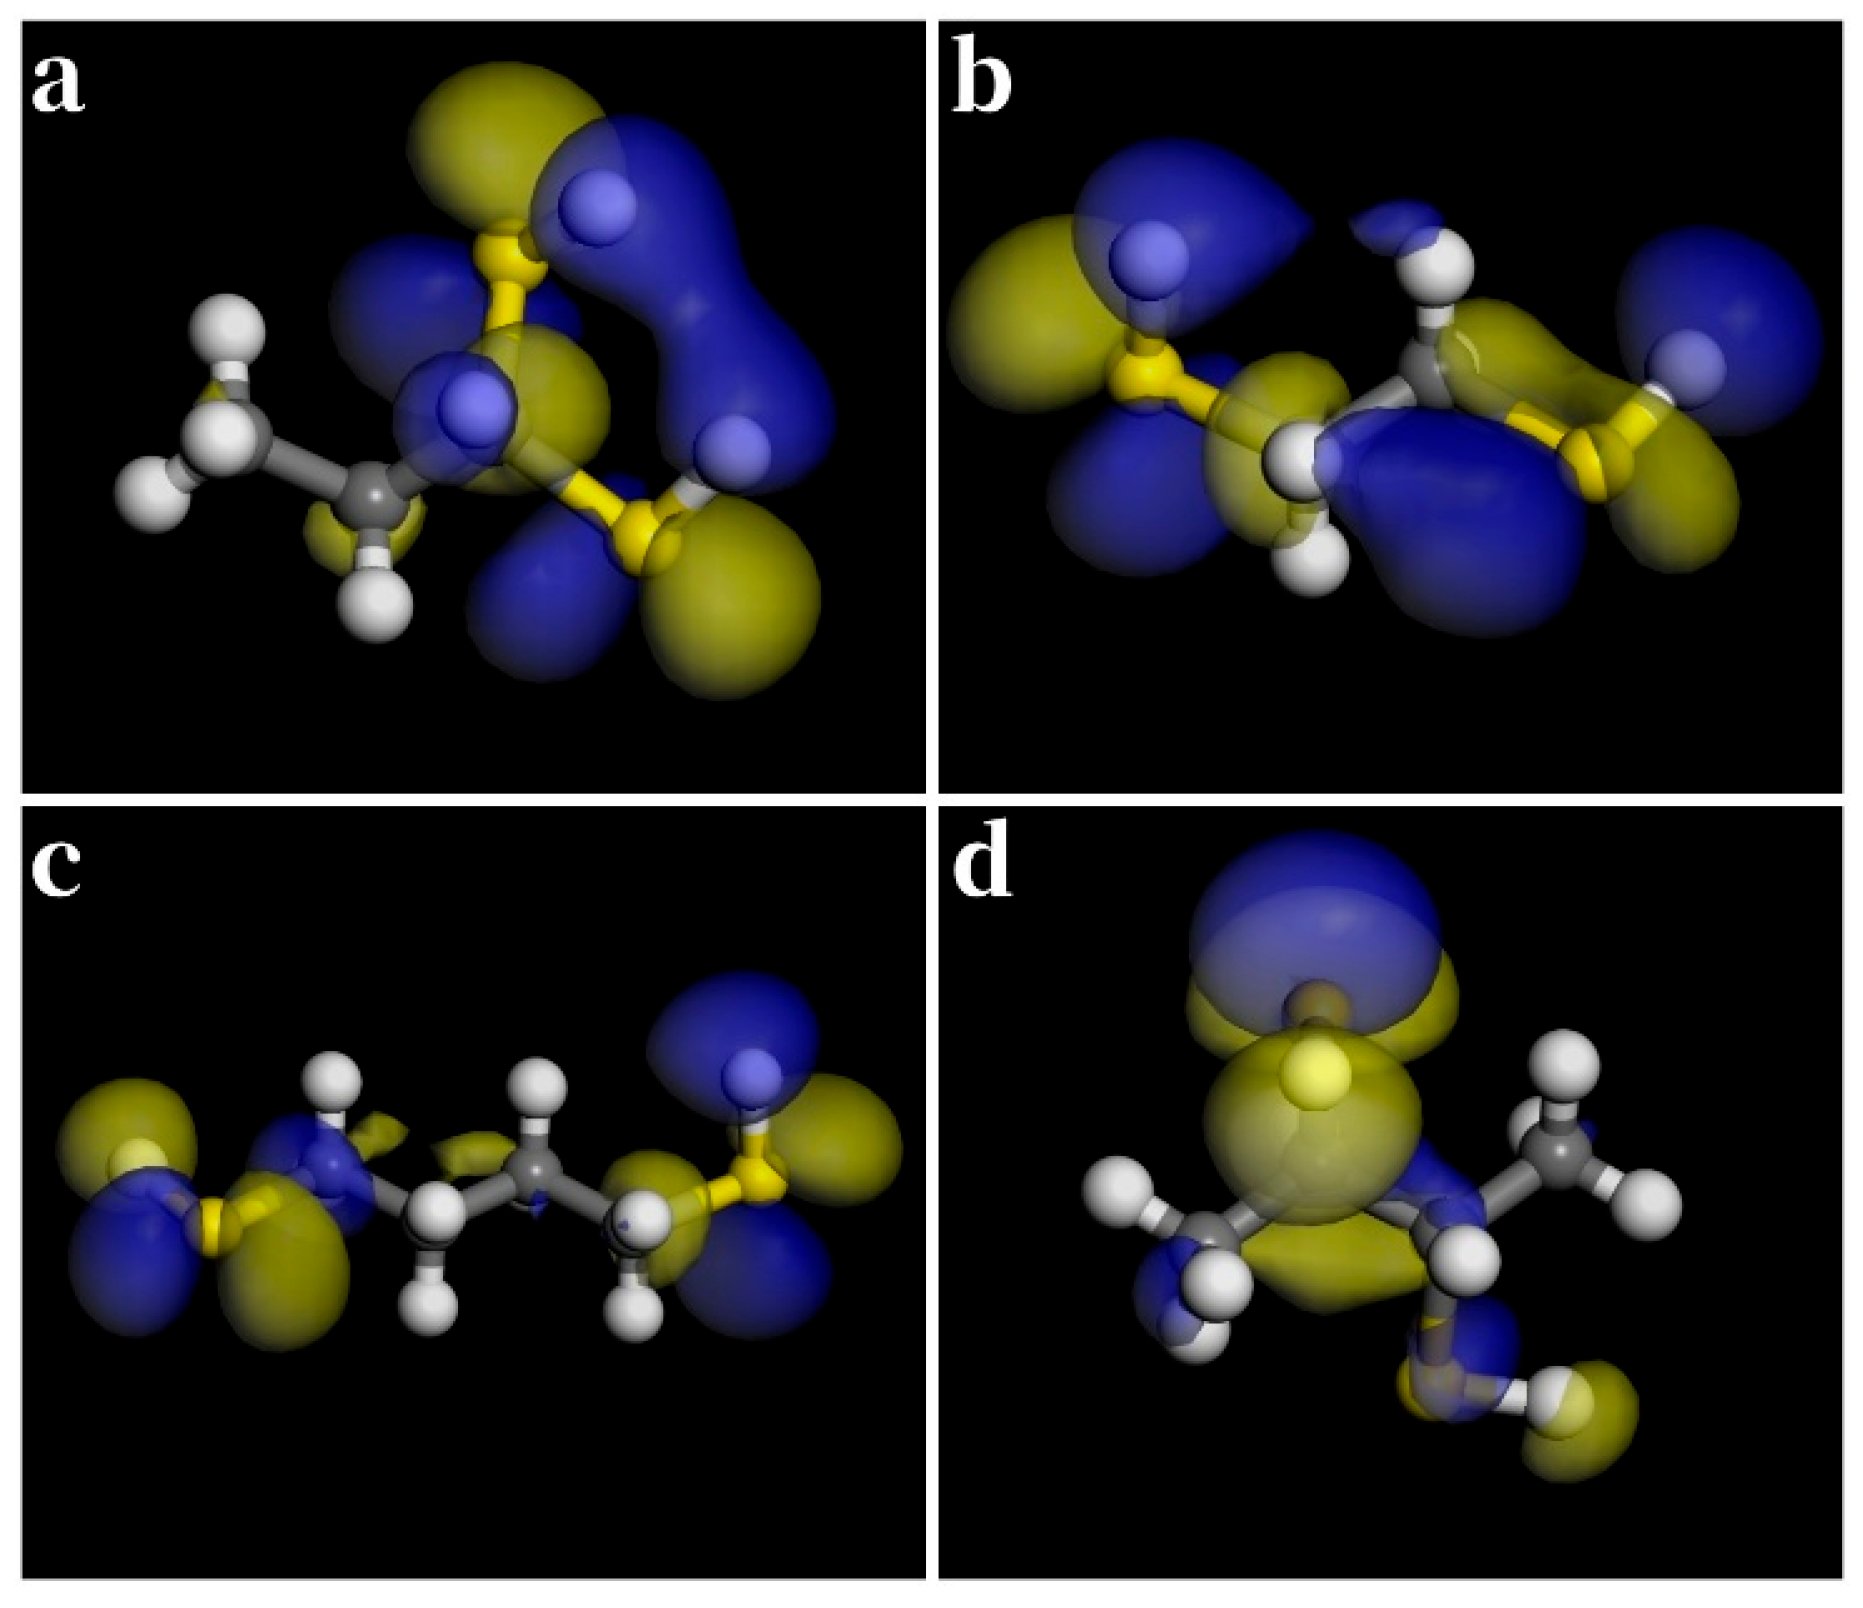
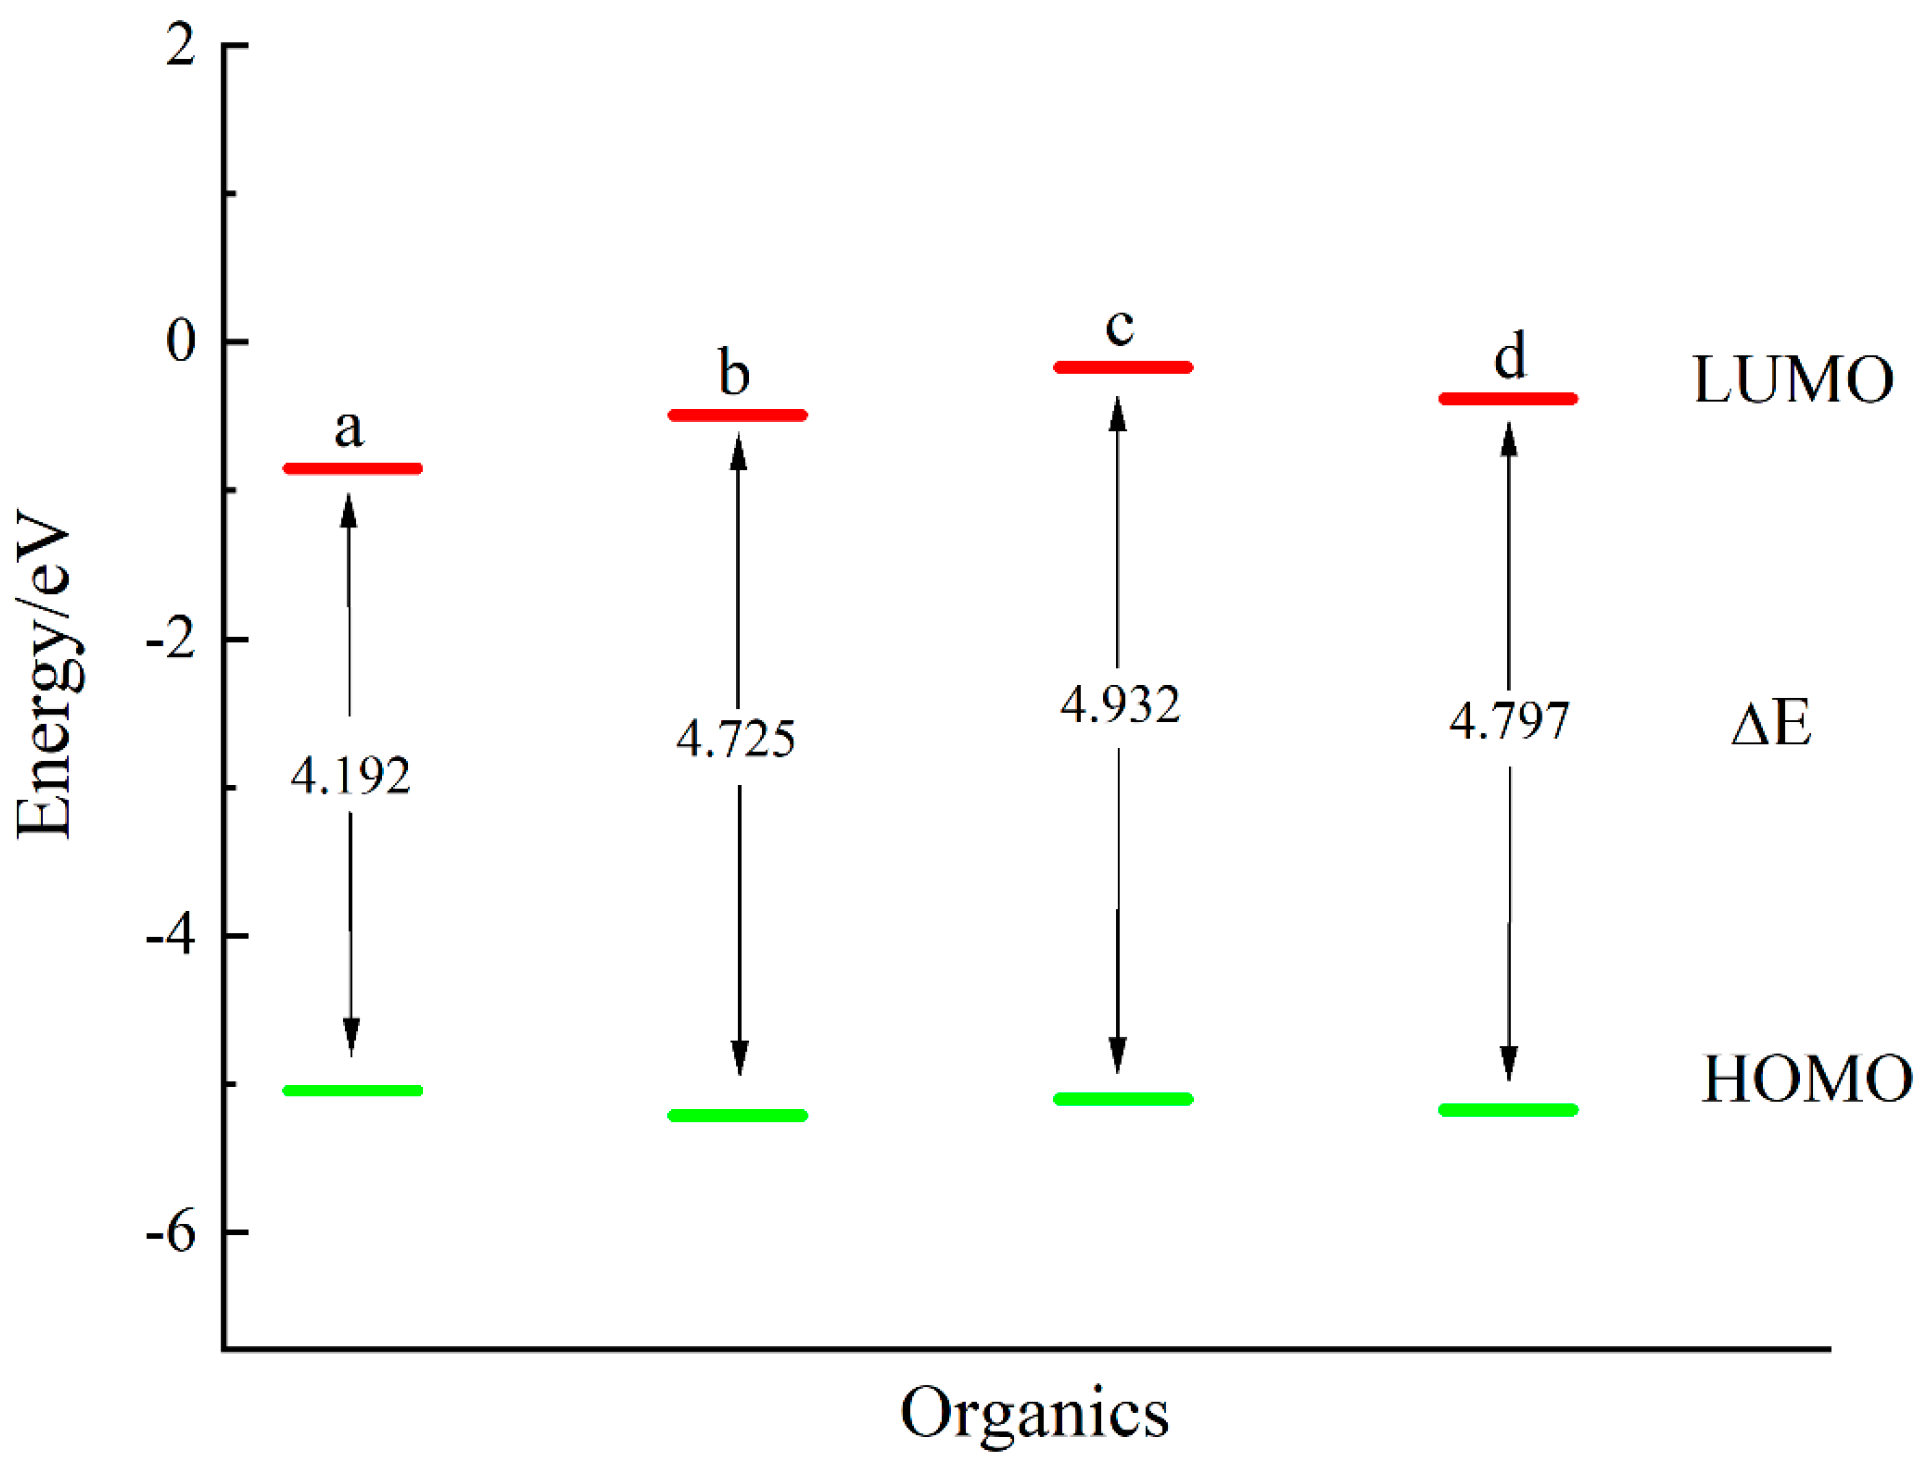
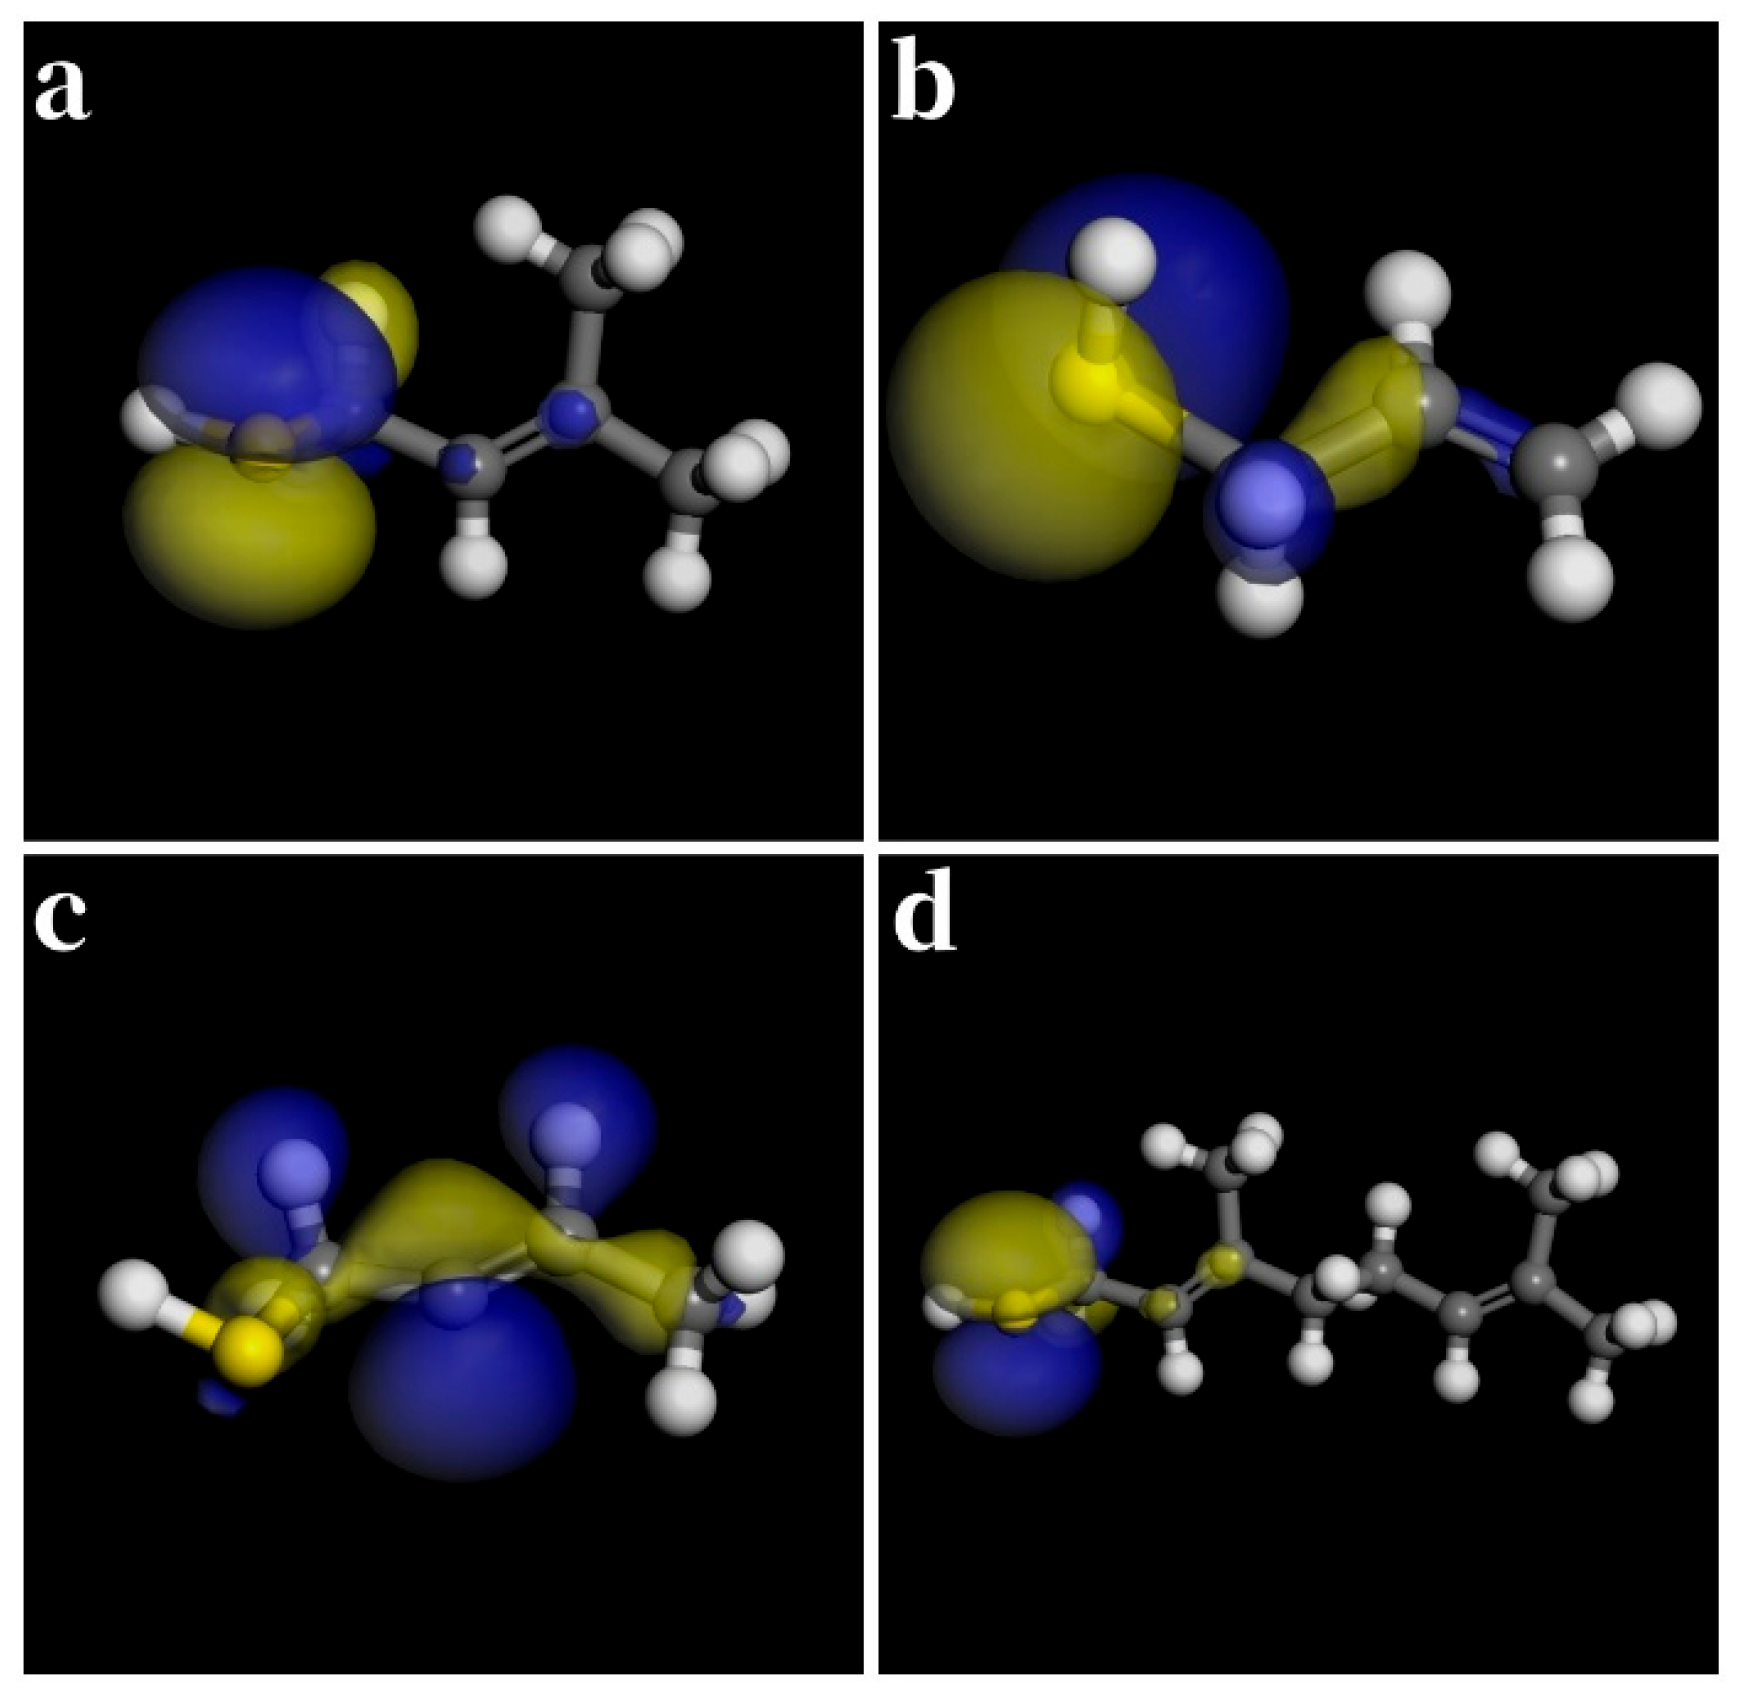
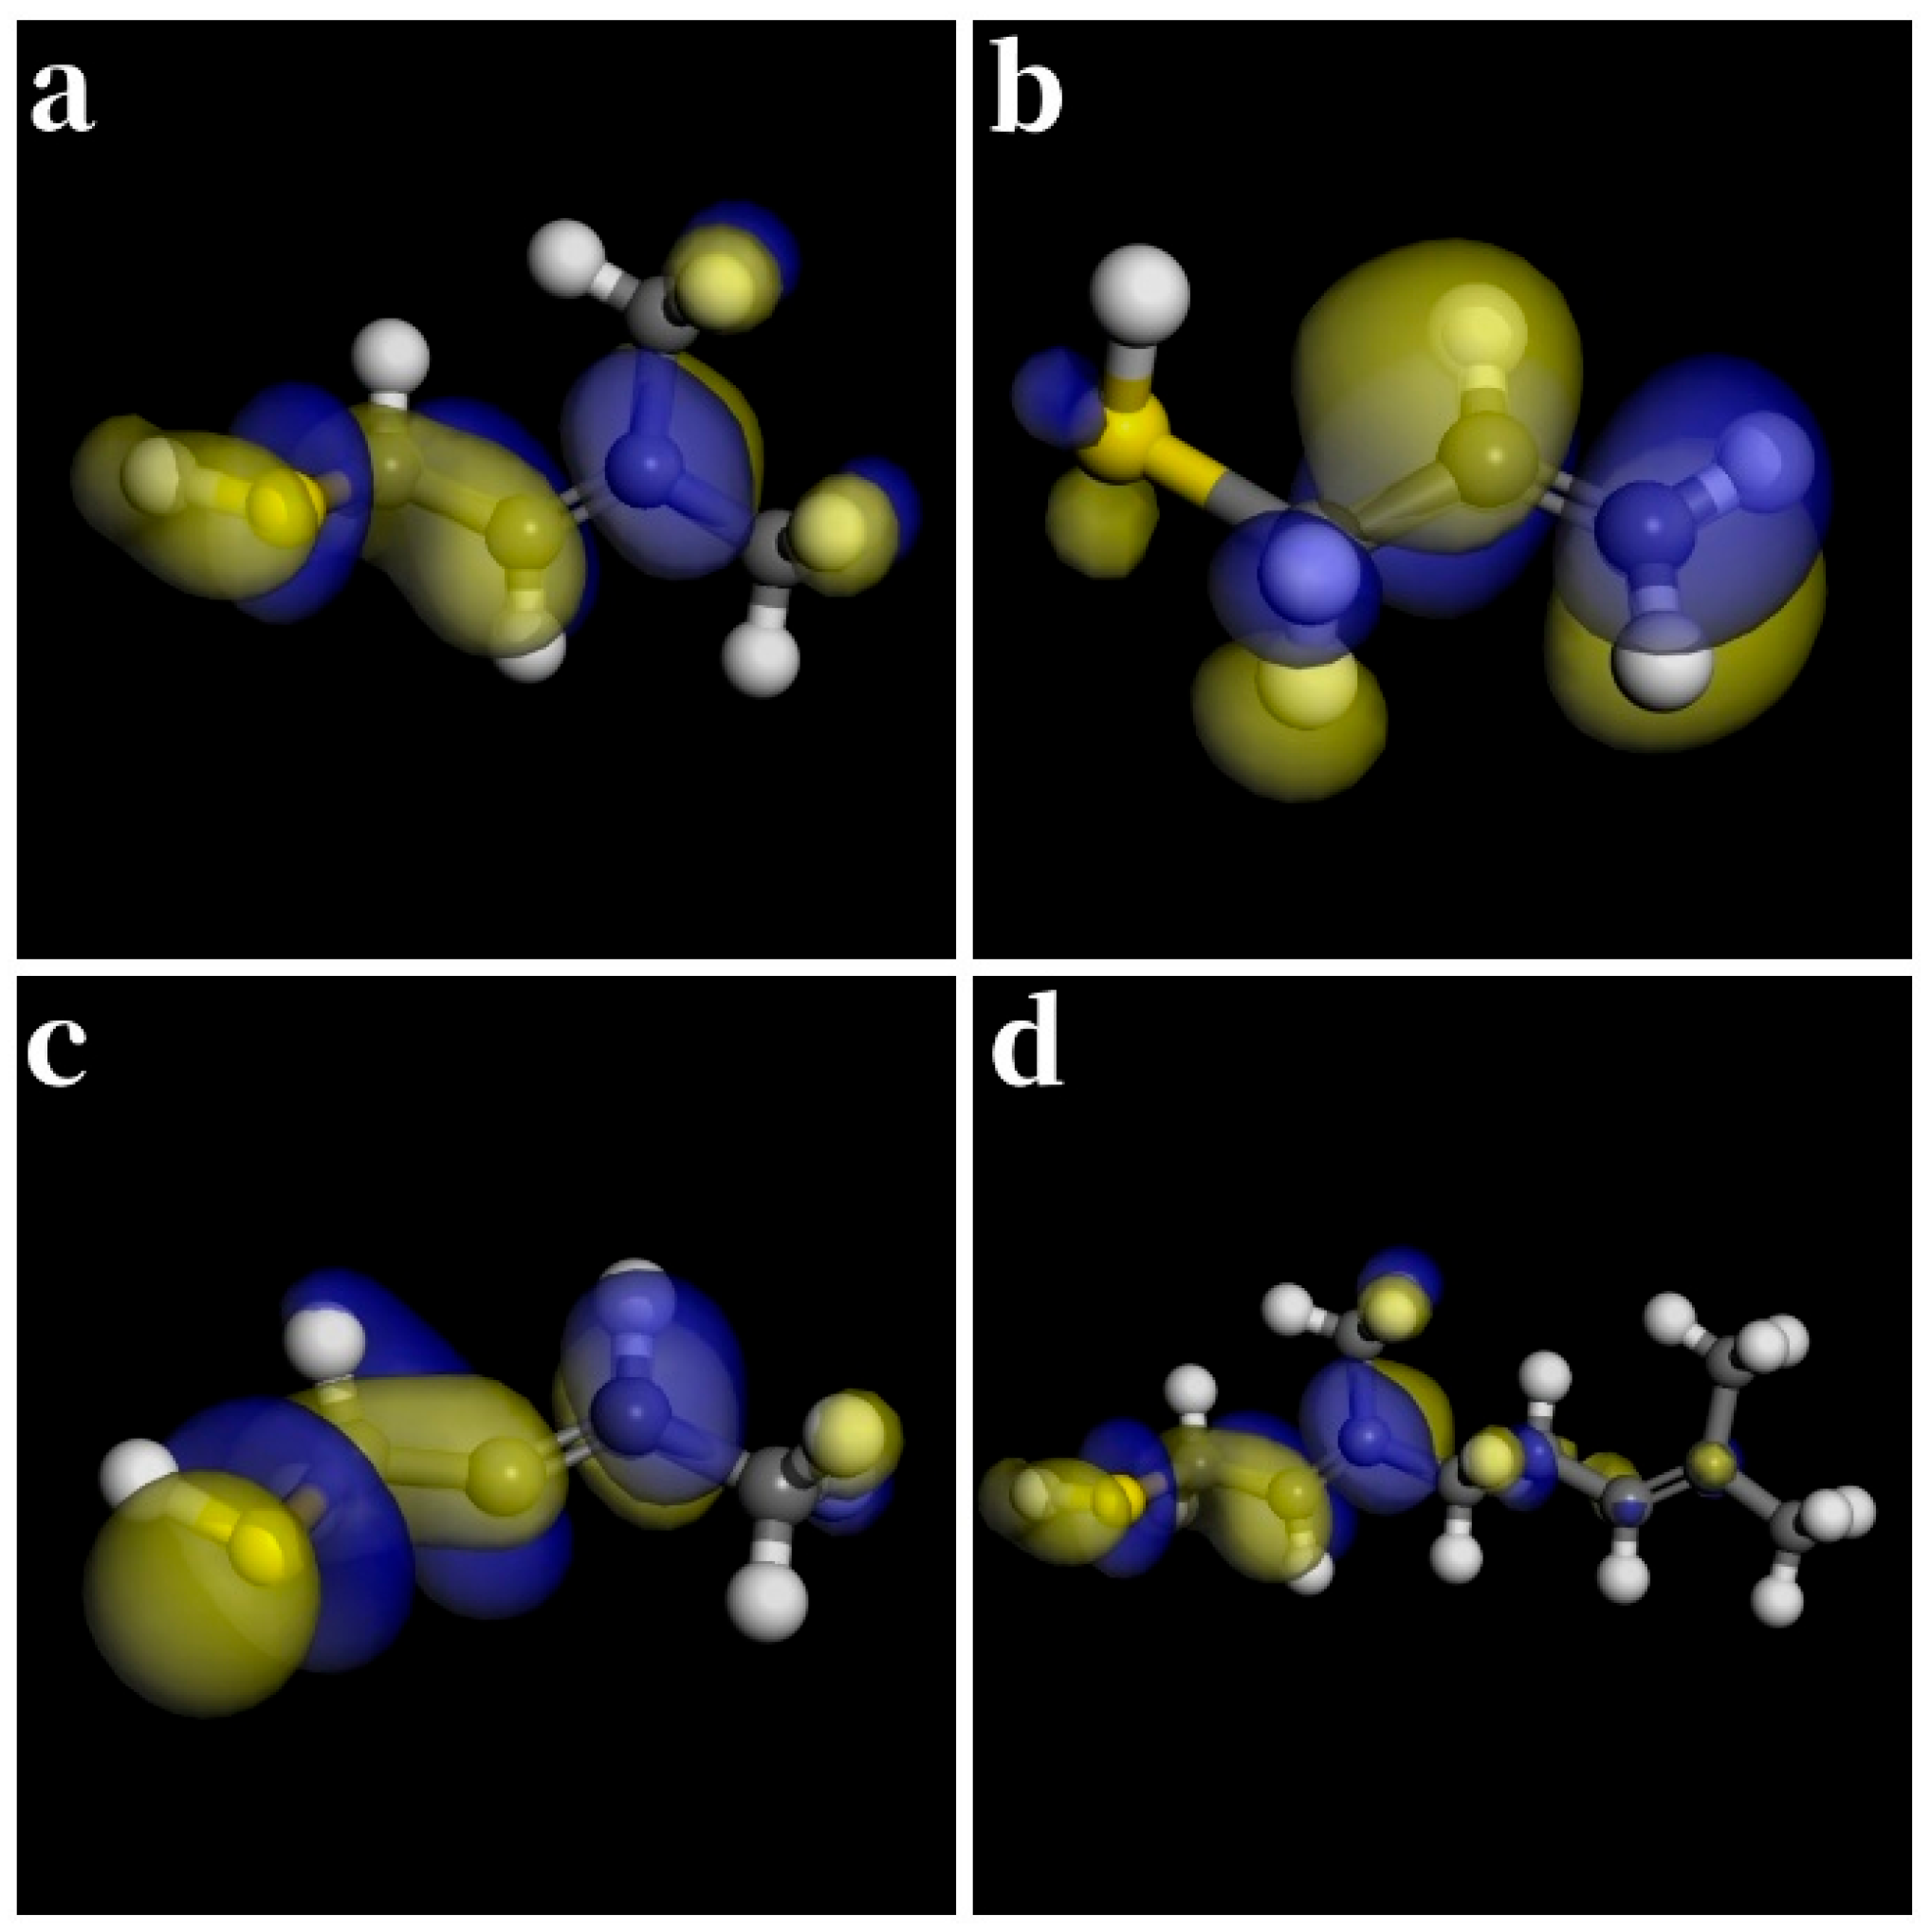
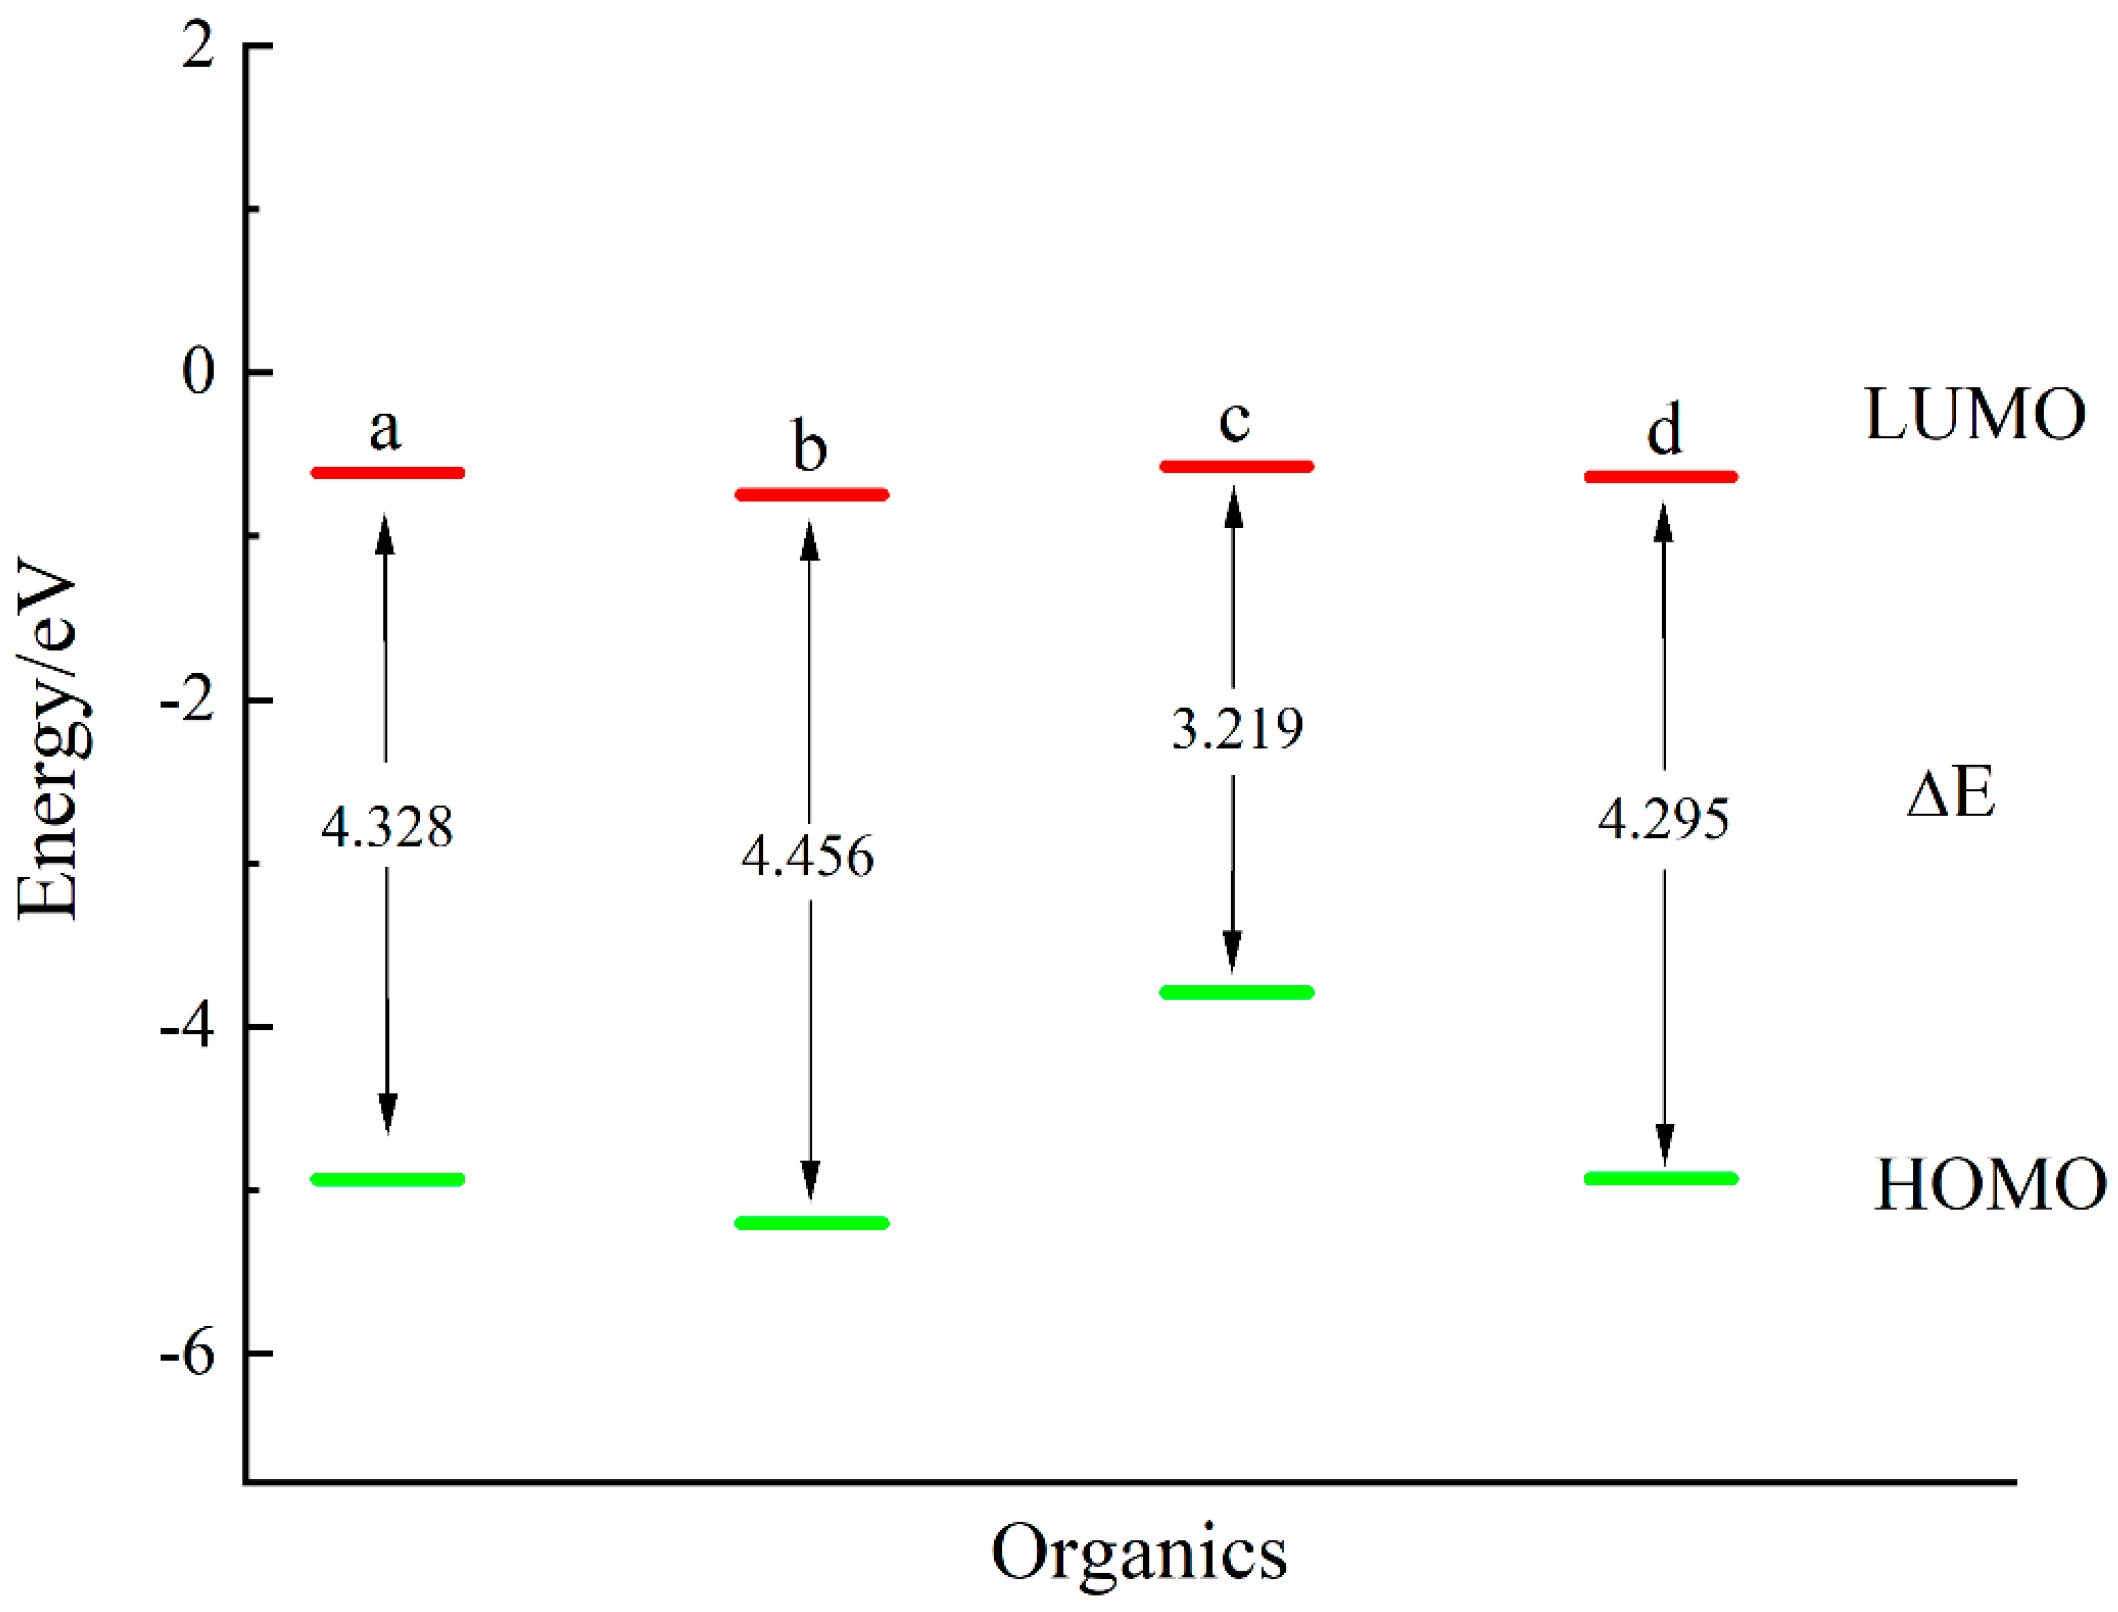
Based on DFT of quantum chemical calculations, the orbital and electronic properties of the selected thiols were studied after geometric optimization. The energy and distribution of the highest occupied molecular orbital (HOMO), the lowest unoccupied molecular orbital (LUMO), and the energy gap ( E =   E L U M O     E H O M O ) of four molecules are illustrated in Table S1 (Supplementary Materials) and Figure 2, Figure 3 and Figure 4.
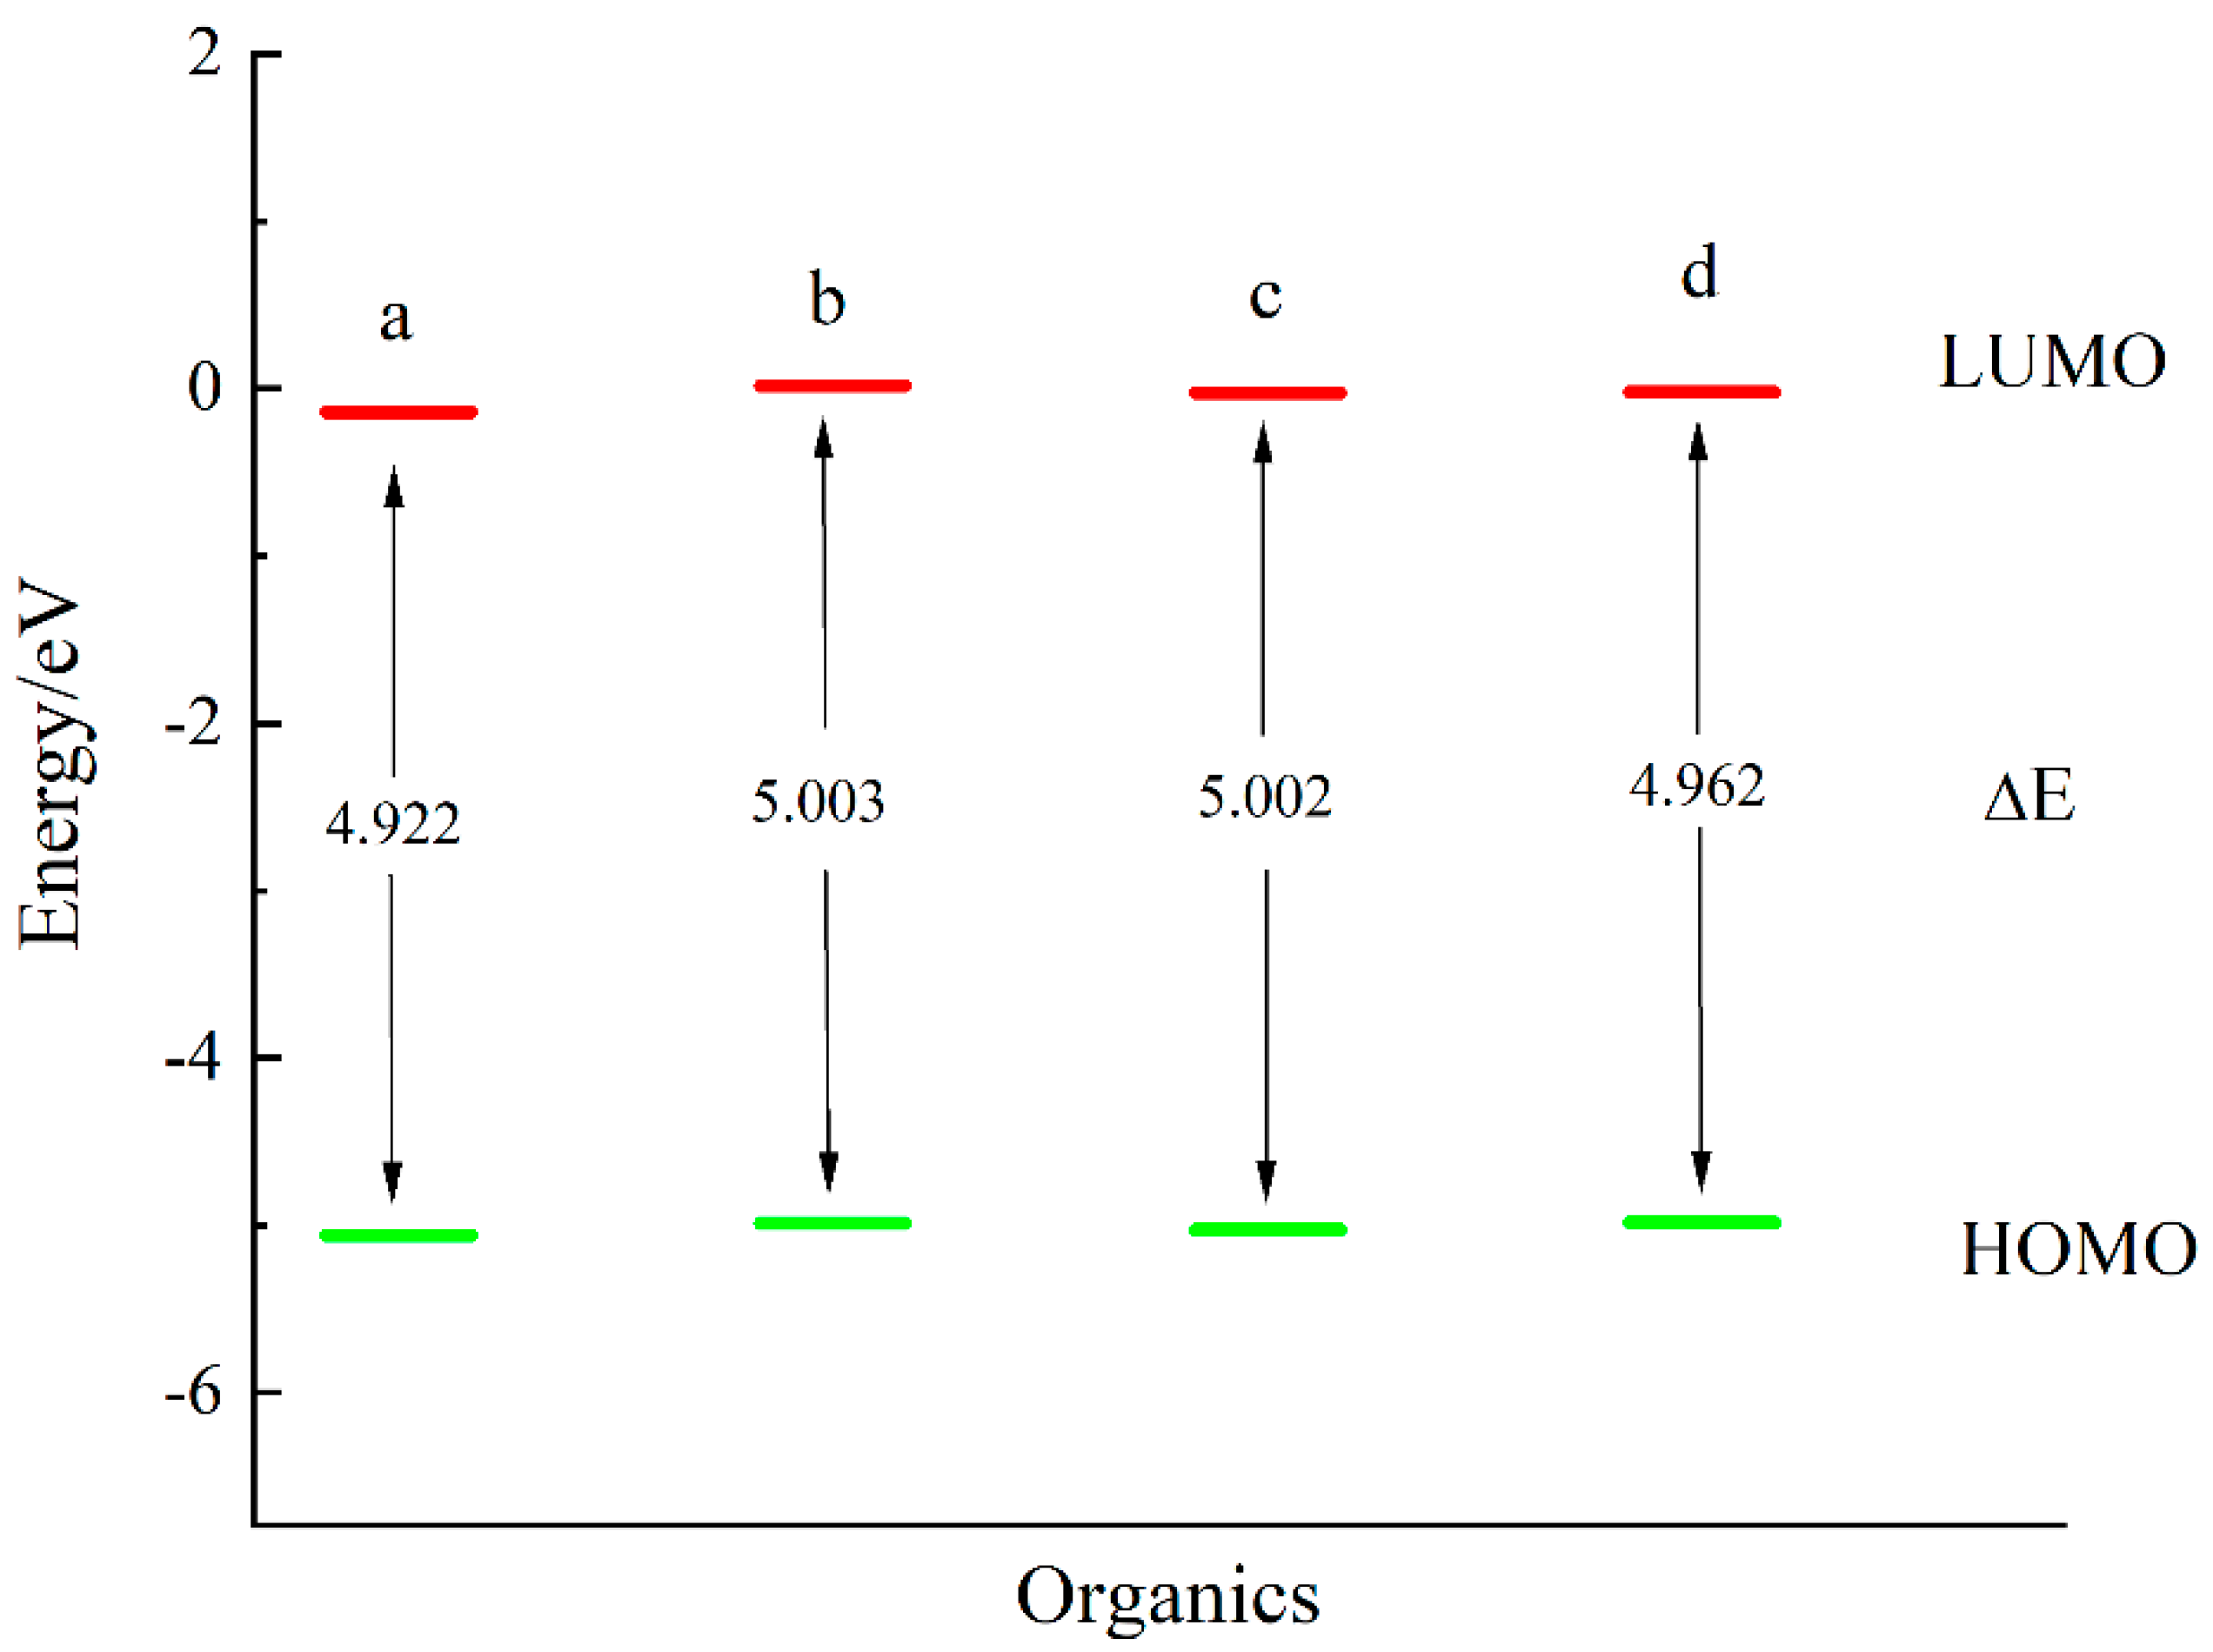
In Figure 2 and Figure 3, the distribution of the HOMO and LUMO of the four molecules can be seen. In the figure, yellow represents the positive phase of the orbital wave function, and blue represents the negative phase. During orbital interaction, the overlap of regions with the same phase leads to the formation of bonding orbitals, while the overlap of regions with opposite phases results in the formation of antibonding orbitals. The degree of phase matching between the HOMO and LUMO affects the possibility of electron transfer between molecules. In Figure 4, the energy and energy gap of HOMO and LUMO can be observed. The size of the E reflects the strength of a molecule’s adsorption capacity. The smaller the E , the stronger the molecule’s adsorption capacity. Therefore, it can be observed that the four short-chain saturated aliphatic thiol molecules exhibit comparable adsorption capabilities, all of which are relatively low.
Detailed numerical data are compiled in Table S1.
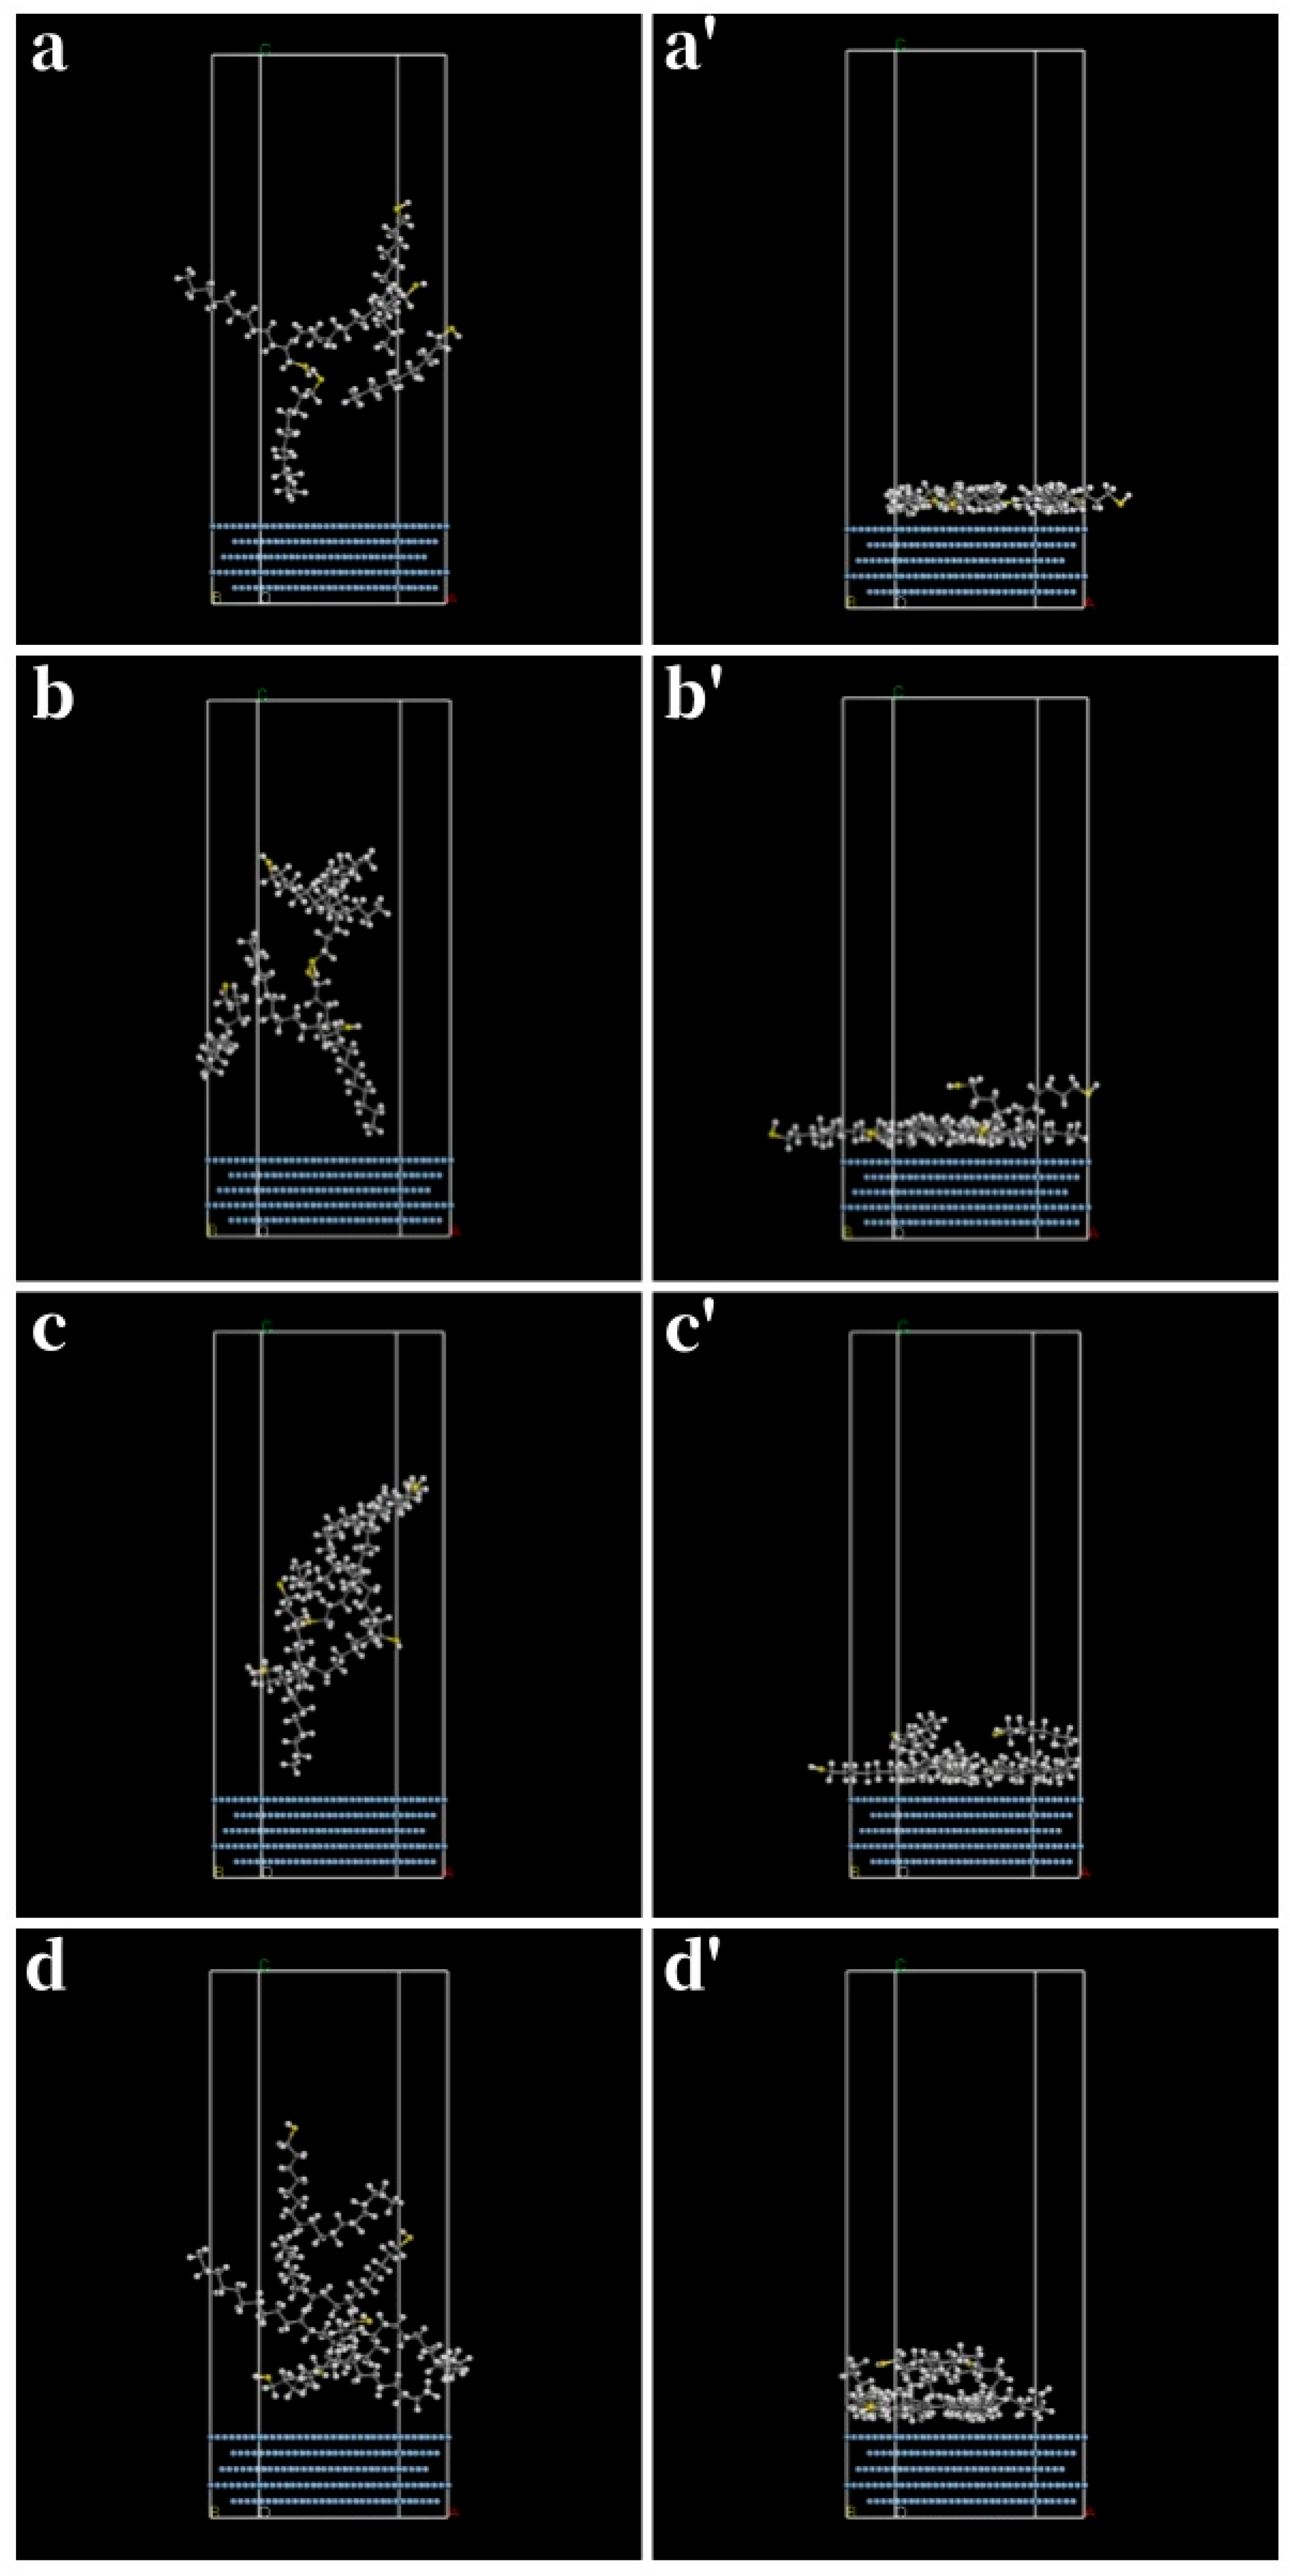
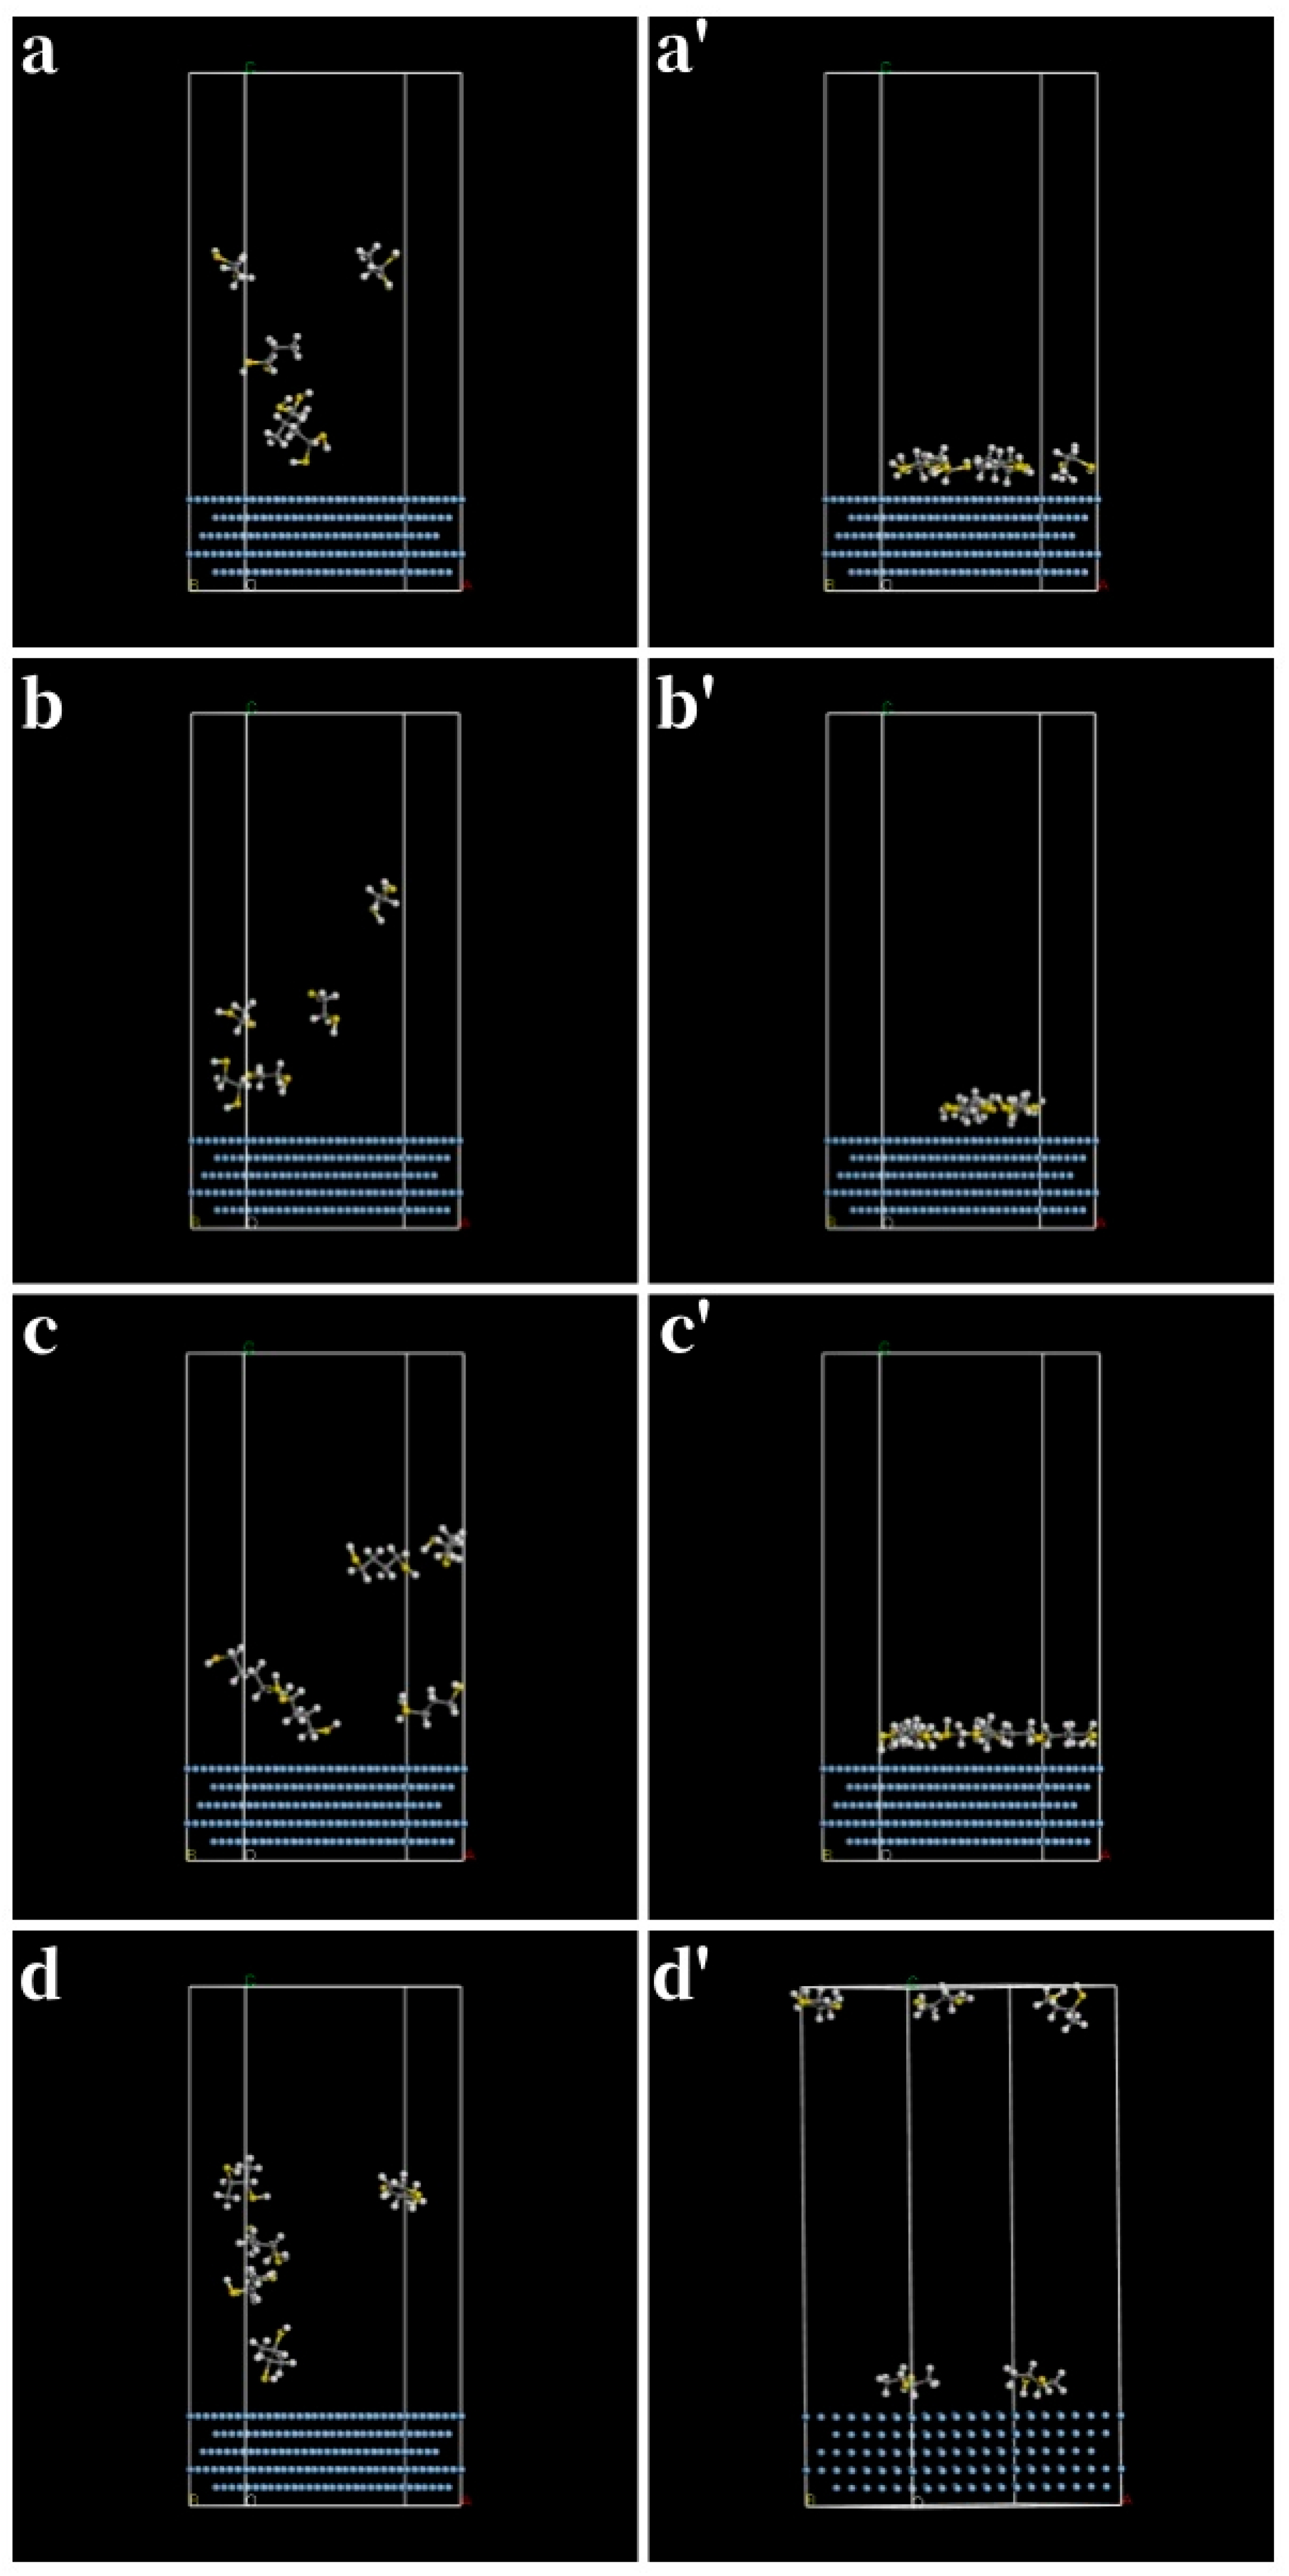
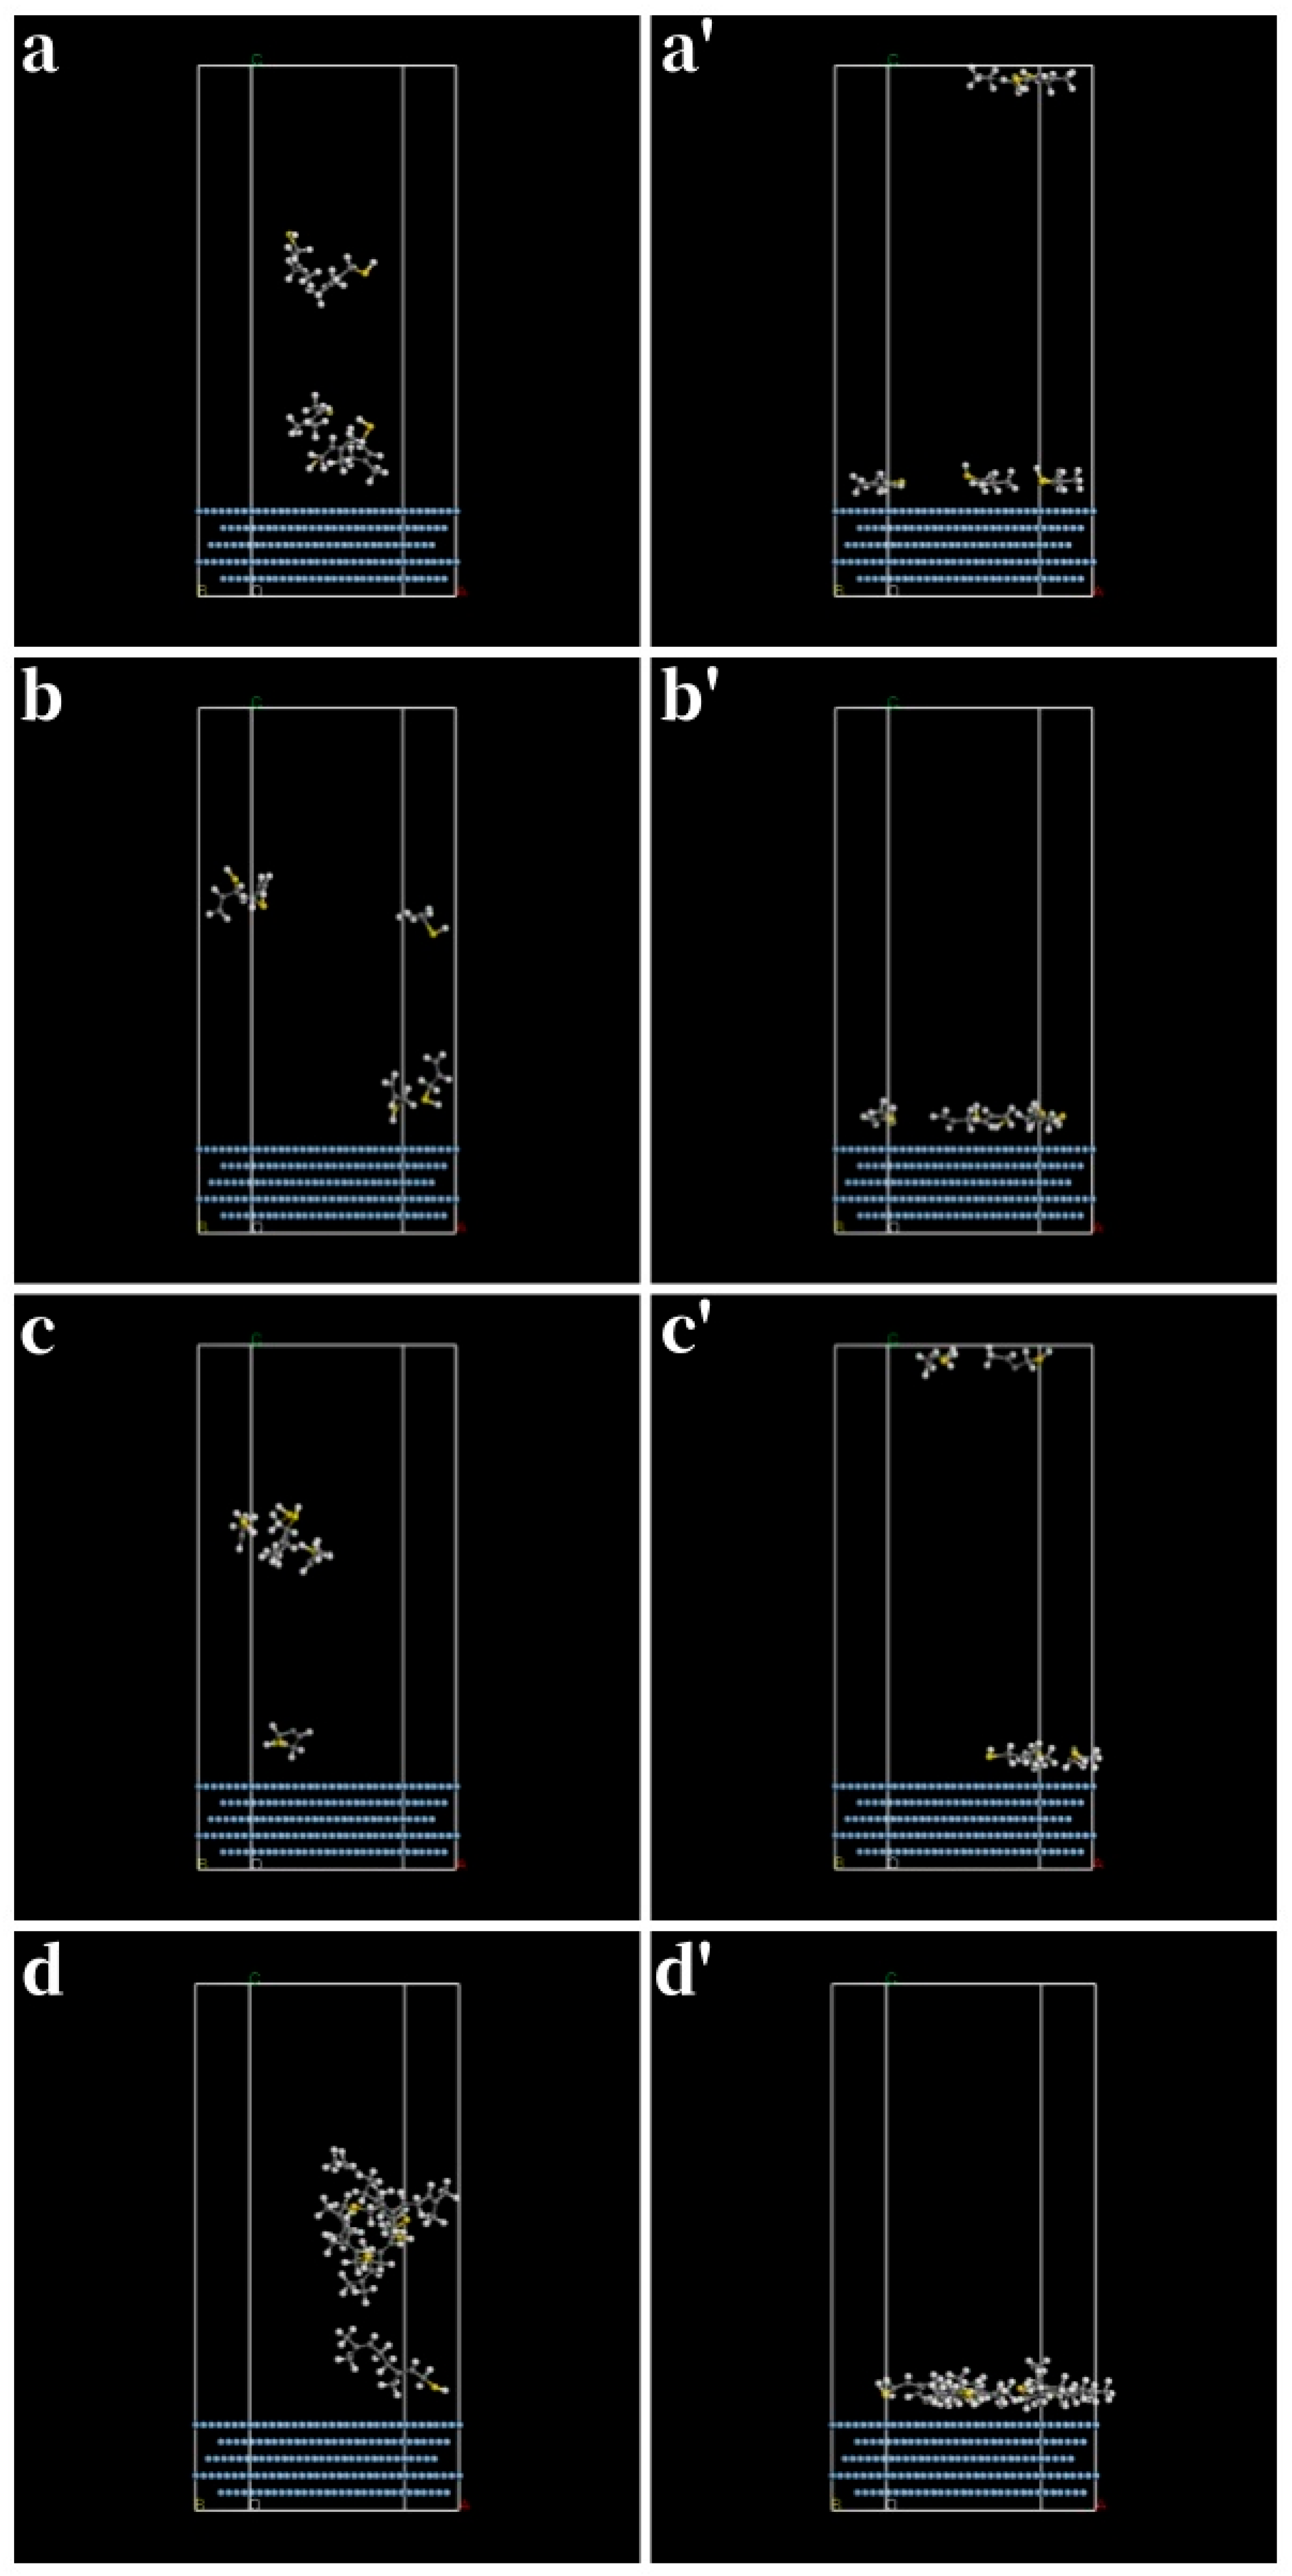
MD simulation can effectively characterize the physical adsorption mechanism of thiols on the Ag (1 1 1) surface under equilibrium conditions. Since the protection of silver is generally carried out in the air, all MD simulations in this paper are conducted in the gas phase. Therefore, the variation in the deviations of temperature and energy are larger than those in the liquid phase. As shown in Figure S1, although the fluctuation range of the studied system is relatively large, it can be stabilized within a reasonable range. The structural comparison before and after adsorption in Figure 5 can prove that thiols can spontaneously adsorb on the silver surface. Through calculation, E t o t a l , E m o l e c u l e , and E s u r f a c e were obtained, and then the E a d s o r p t i o n was obtained as shown in Table 1. It can be observed from Table 1 that the E a d s o r p t i o n of the four thiols are all negative, indicating that the adsorption process is thermodynamically spontaneous. A comparative analysis reveals that cyclohexanethiol exhibits the highest absolute E a d s o r p t i o n (−179.813 kJ/mol), suggesting a stronger adsorption capacity compared to the other compounds. The essence of E a d s o r p t i o n is the interaction between molecules and metals, while E is merely a characteristic of the molecules themselves. Therefore, when evaluating the adsorption performance of molecules, the weight of E a d s o r p t i o n is even more significant. As illustrated in Figure S6, among the short-chain saturated aliphatic thiols studied, the adsorption performance ranking is as follows: cyclohexanethiol > propanethiol > methanethiol > ethanethiol. However, the adsorption performance of short-chain saturated aliphatic mercaptans is generally low.

3.2. Long-Chain Saturated Aliphatic Thiols

For long-chain saturated aliphatic mercaptans, we have selected the following four mercaptans: 1-dodecanethiol, 1-tetradecanethiol, 1-hexadecanethiol and 1-octadecanethiol. Their optimized structure is shown in Figure 6.
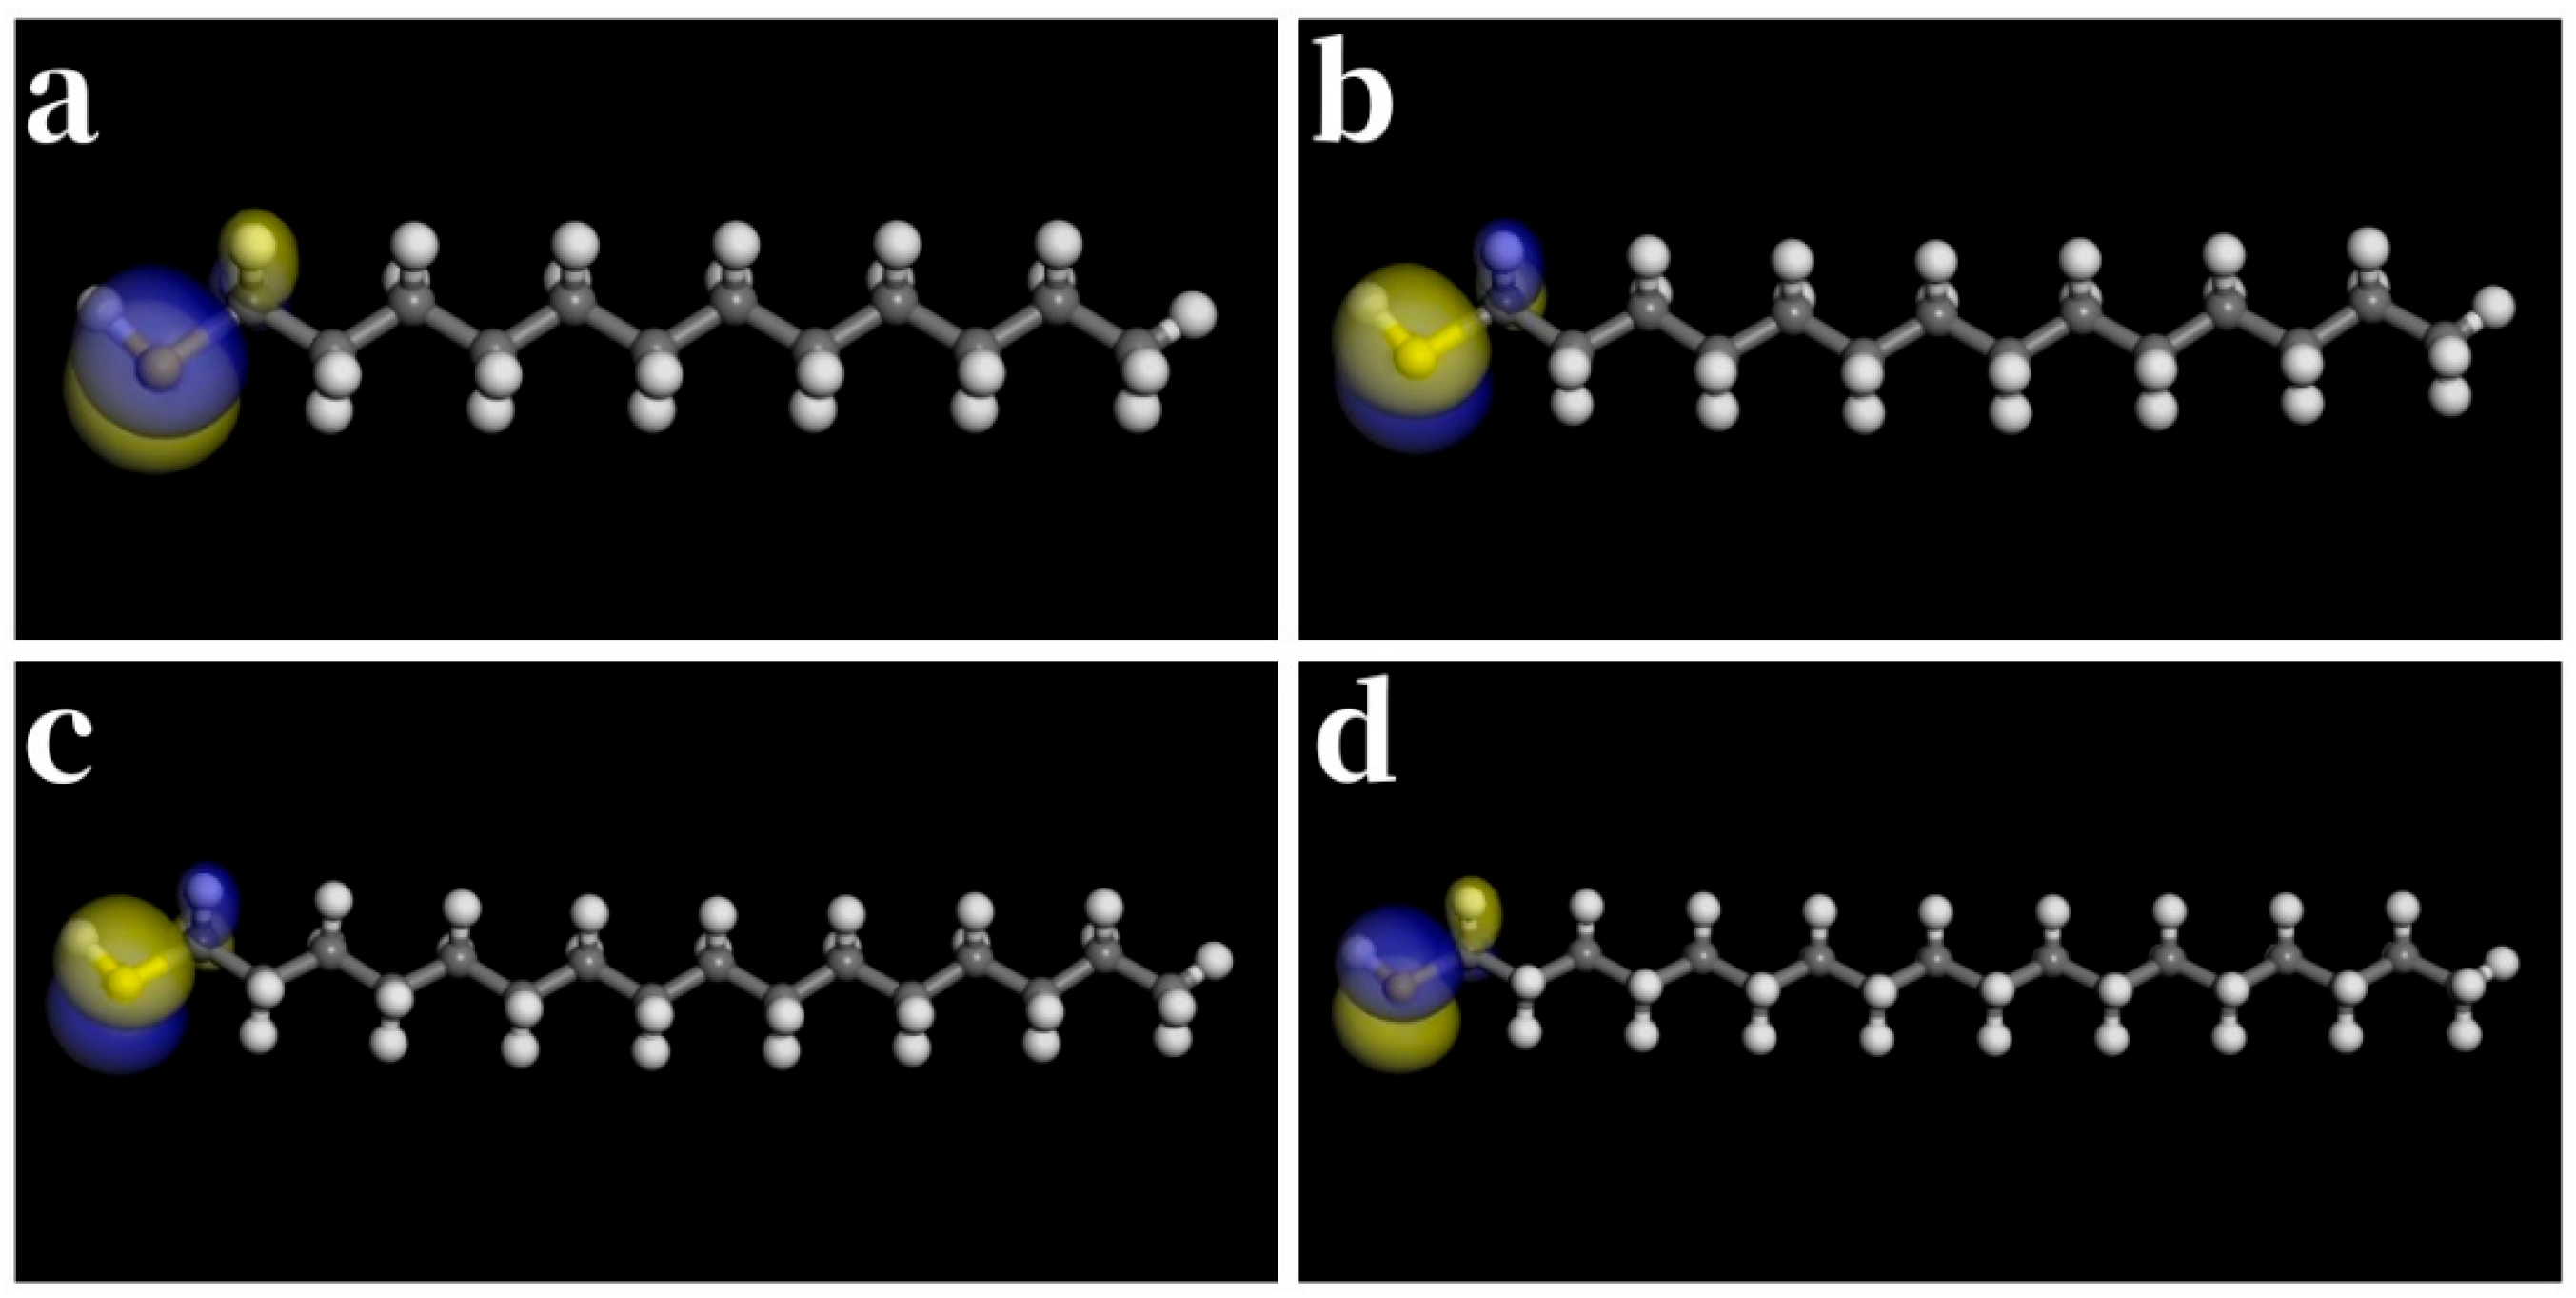
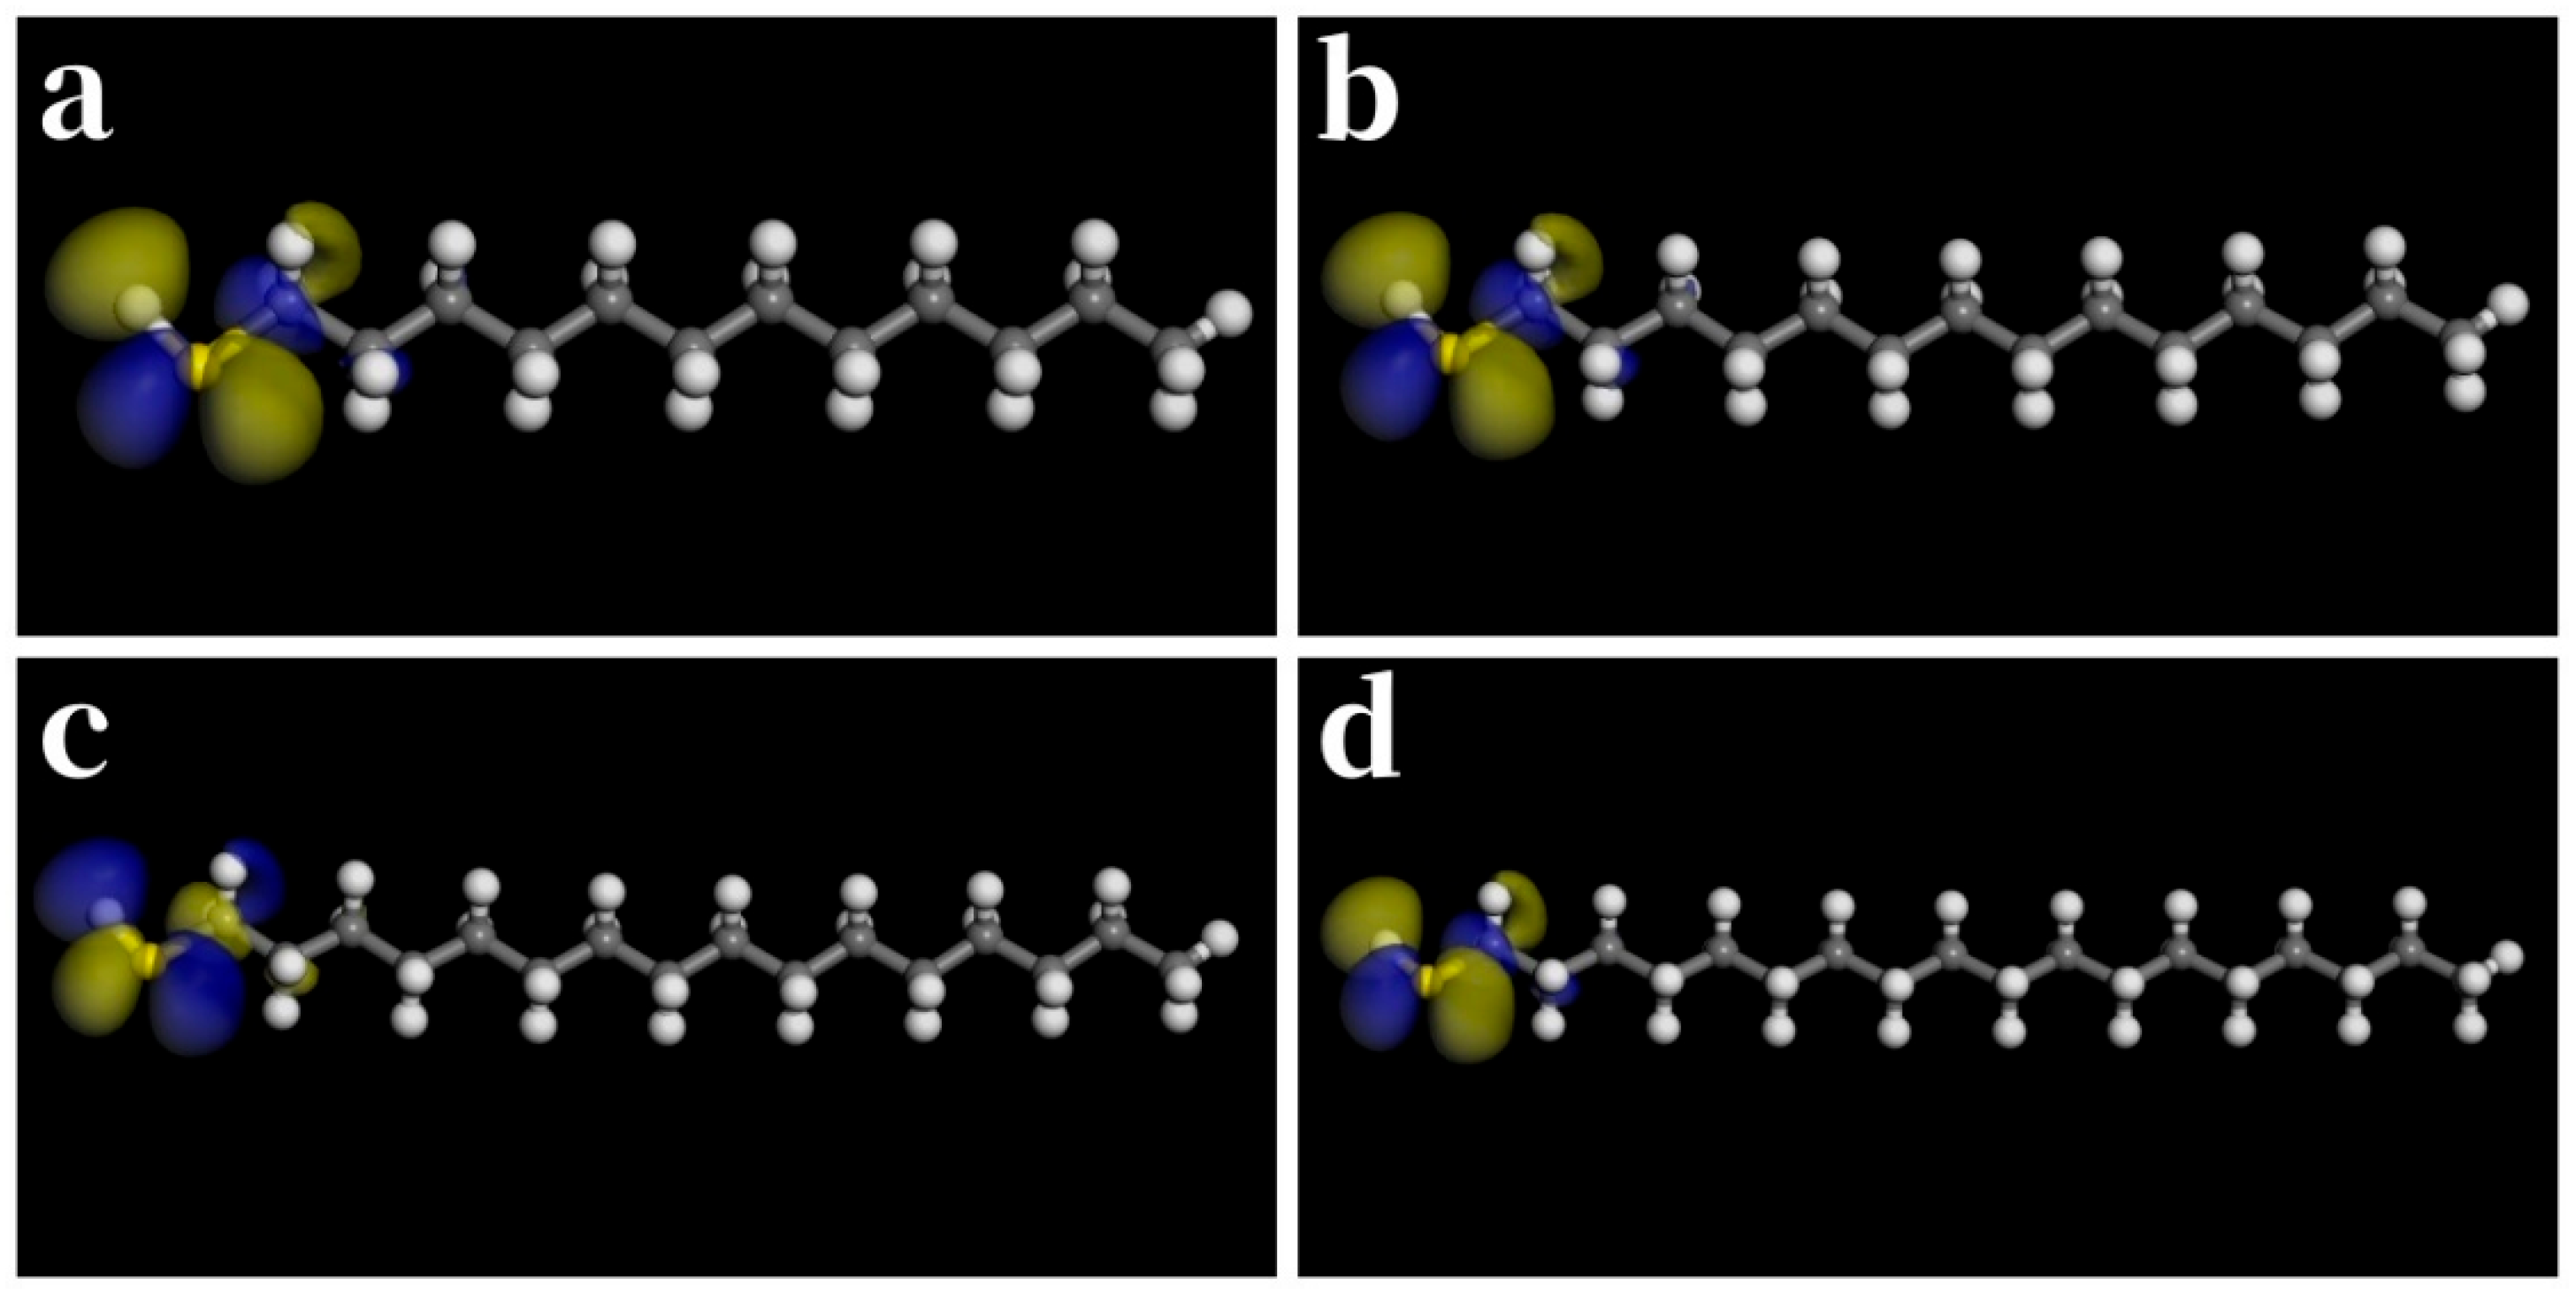
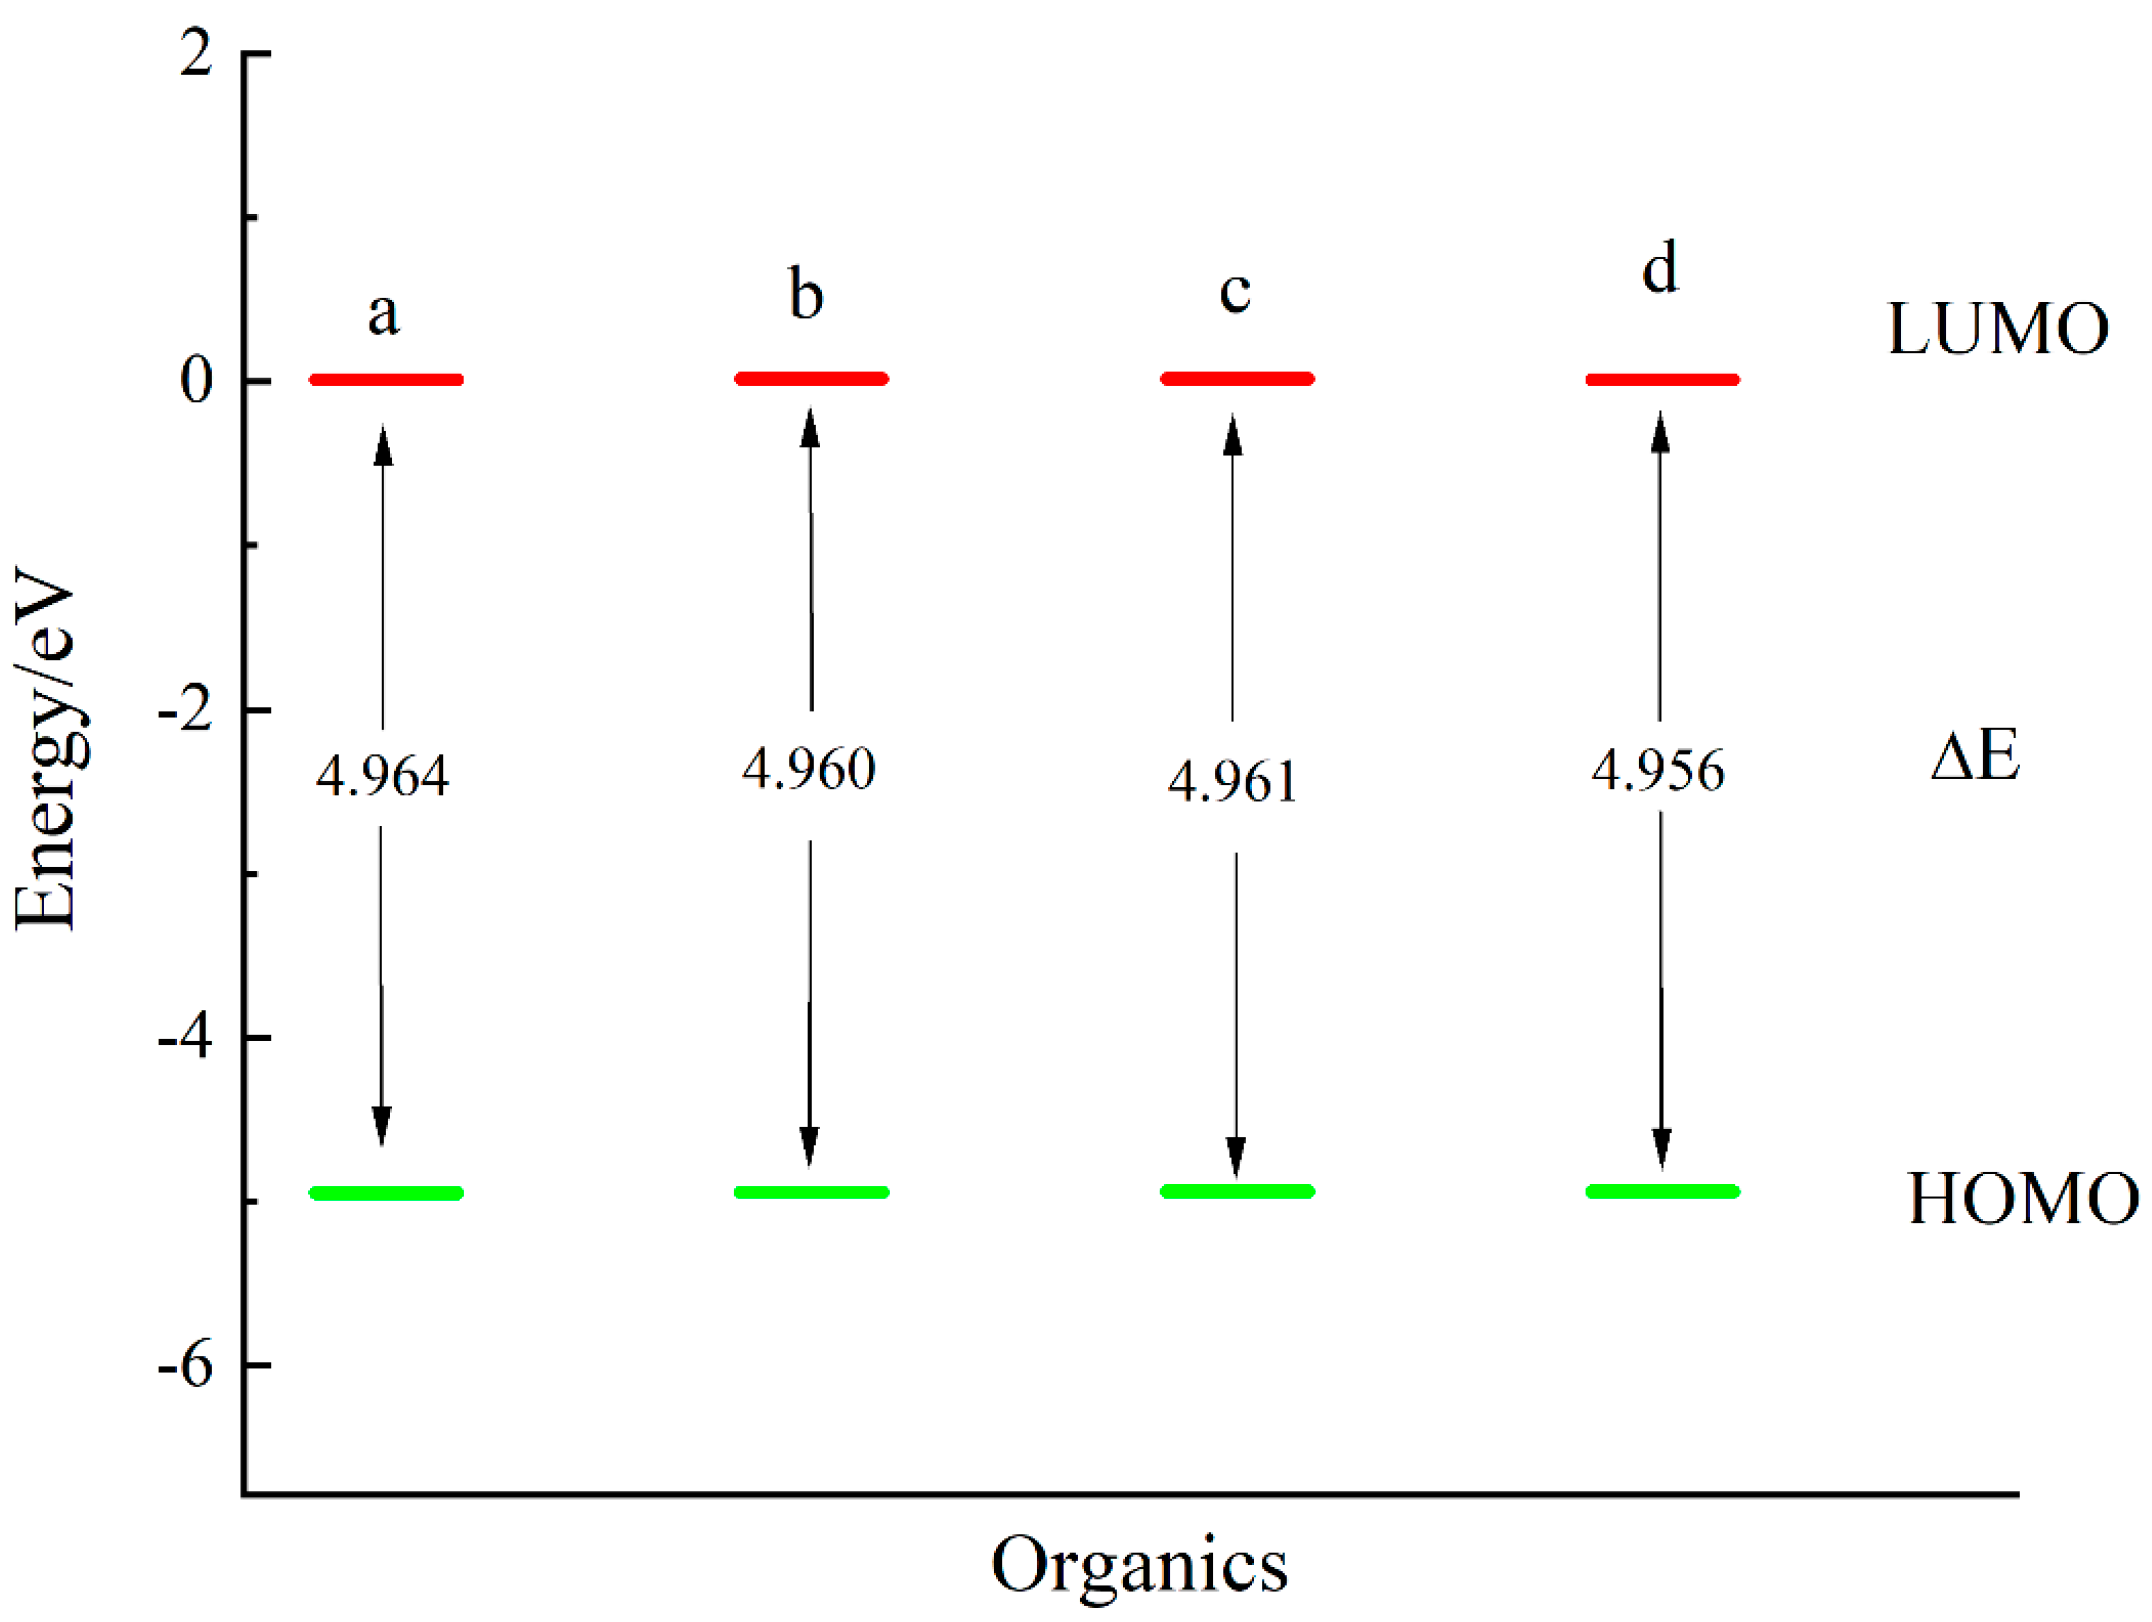
After the quantum chemical calculation of DFT, the energy, distribution, and E of the HOMO and LUMO orbitals of four long-chain saturated aliphatic thiol molecules were obtained. Among them, Table S2 details the orbital energy data of four molecules, Figure 7 and Figure 8 show the distribution of HOMO and LUMO orbitals of the four molecules, yellow and blue represent the positive and negative phase orbital wave functions, respectively, which are related to the electron transfer of molecules. Figure 9 makes a more intuitive comparison of the strength of adsorption capacity among the four molecules. As can be observed, the E values of the four molecules are quite close, and all exhibit favorable adsorption performance.
The equilibrium of temperature and energy of long-chain saturated aliphatic thiols is shown in Figure S2. The structure in Figure 10 indicates that thiols can adsorb spontaneously on the silver surface. The detailed data are shown in Table 2. It reveals the spontaneous adsorption of four molecules; moreover, their adsorption energies are lower compared to short-chain saturated aliphatic thiols, suggesting stronger adsorption capacity. Figure S7 indicates that the adsorption capacities of the four molecules derived from both quantum chemical calculations and MD simulations are comparable; it can be known by ranking them that 1-dodecanethiol > 1-octadecanethiol > 1-hexadecanethiol > 1-tetradecanethiol. Furthermore, due to the relatively low values of E and E a d s o r p t i o n , all four molecules in this group exhibit extremely strong adsorption capacity, which also reflects the mutual validation between DFT and MD calculations.

3.3. Aromatic Thiols

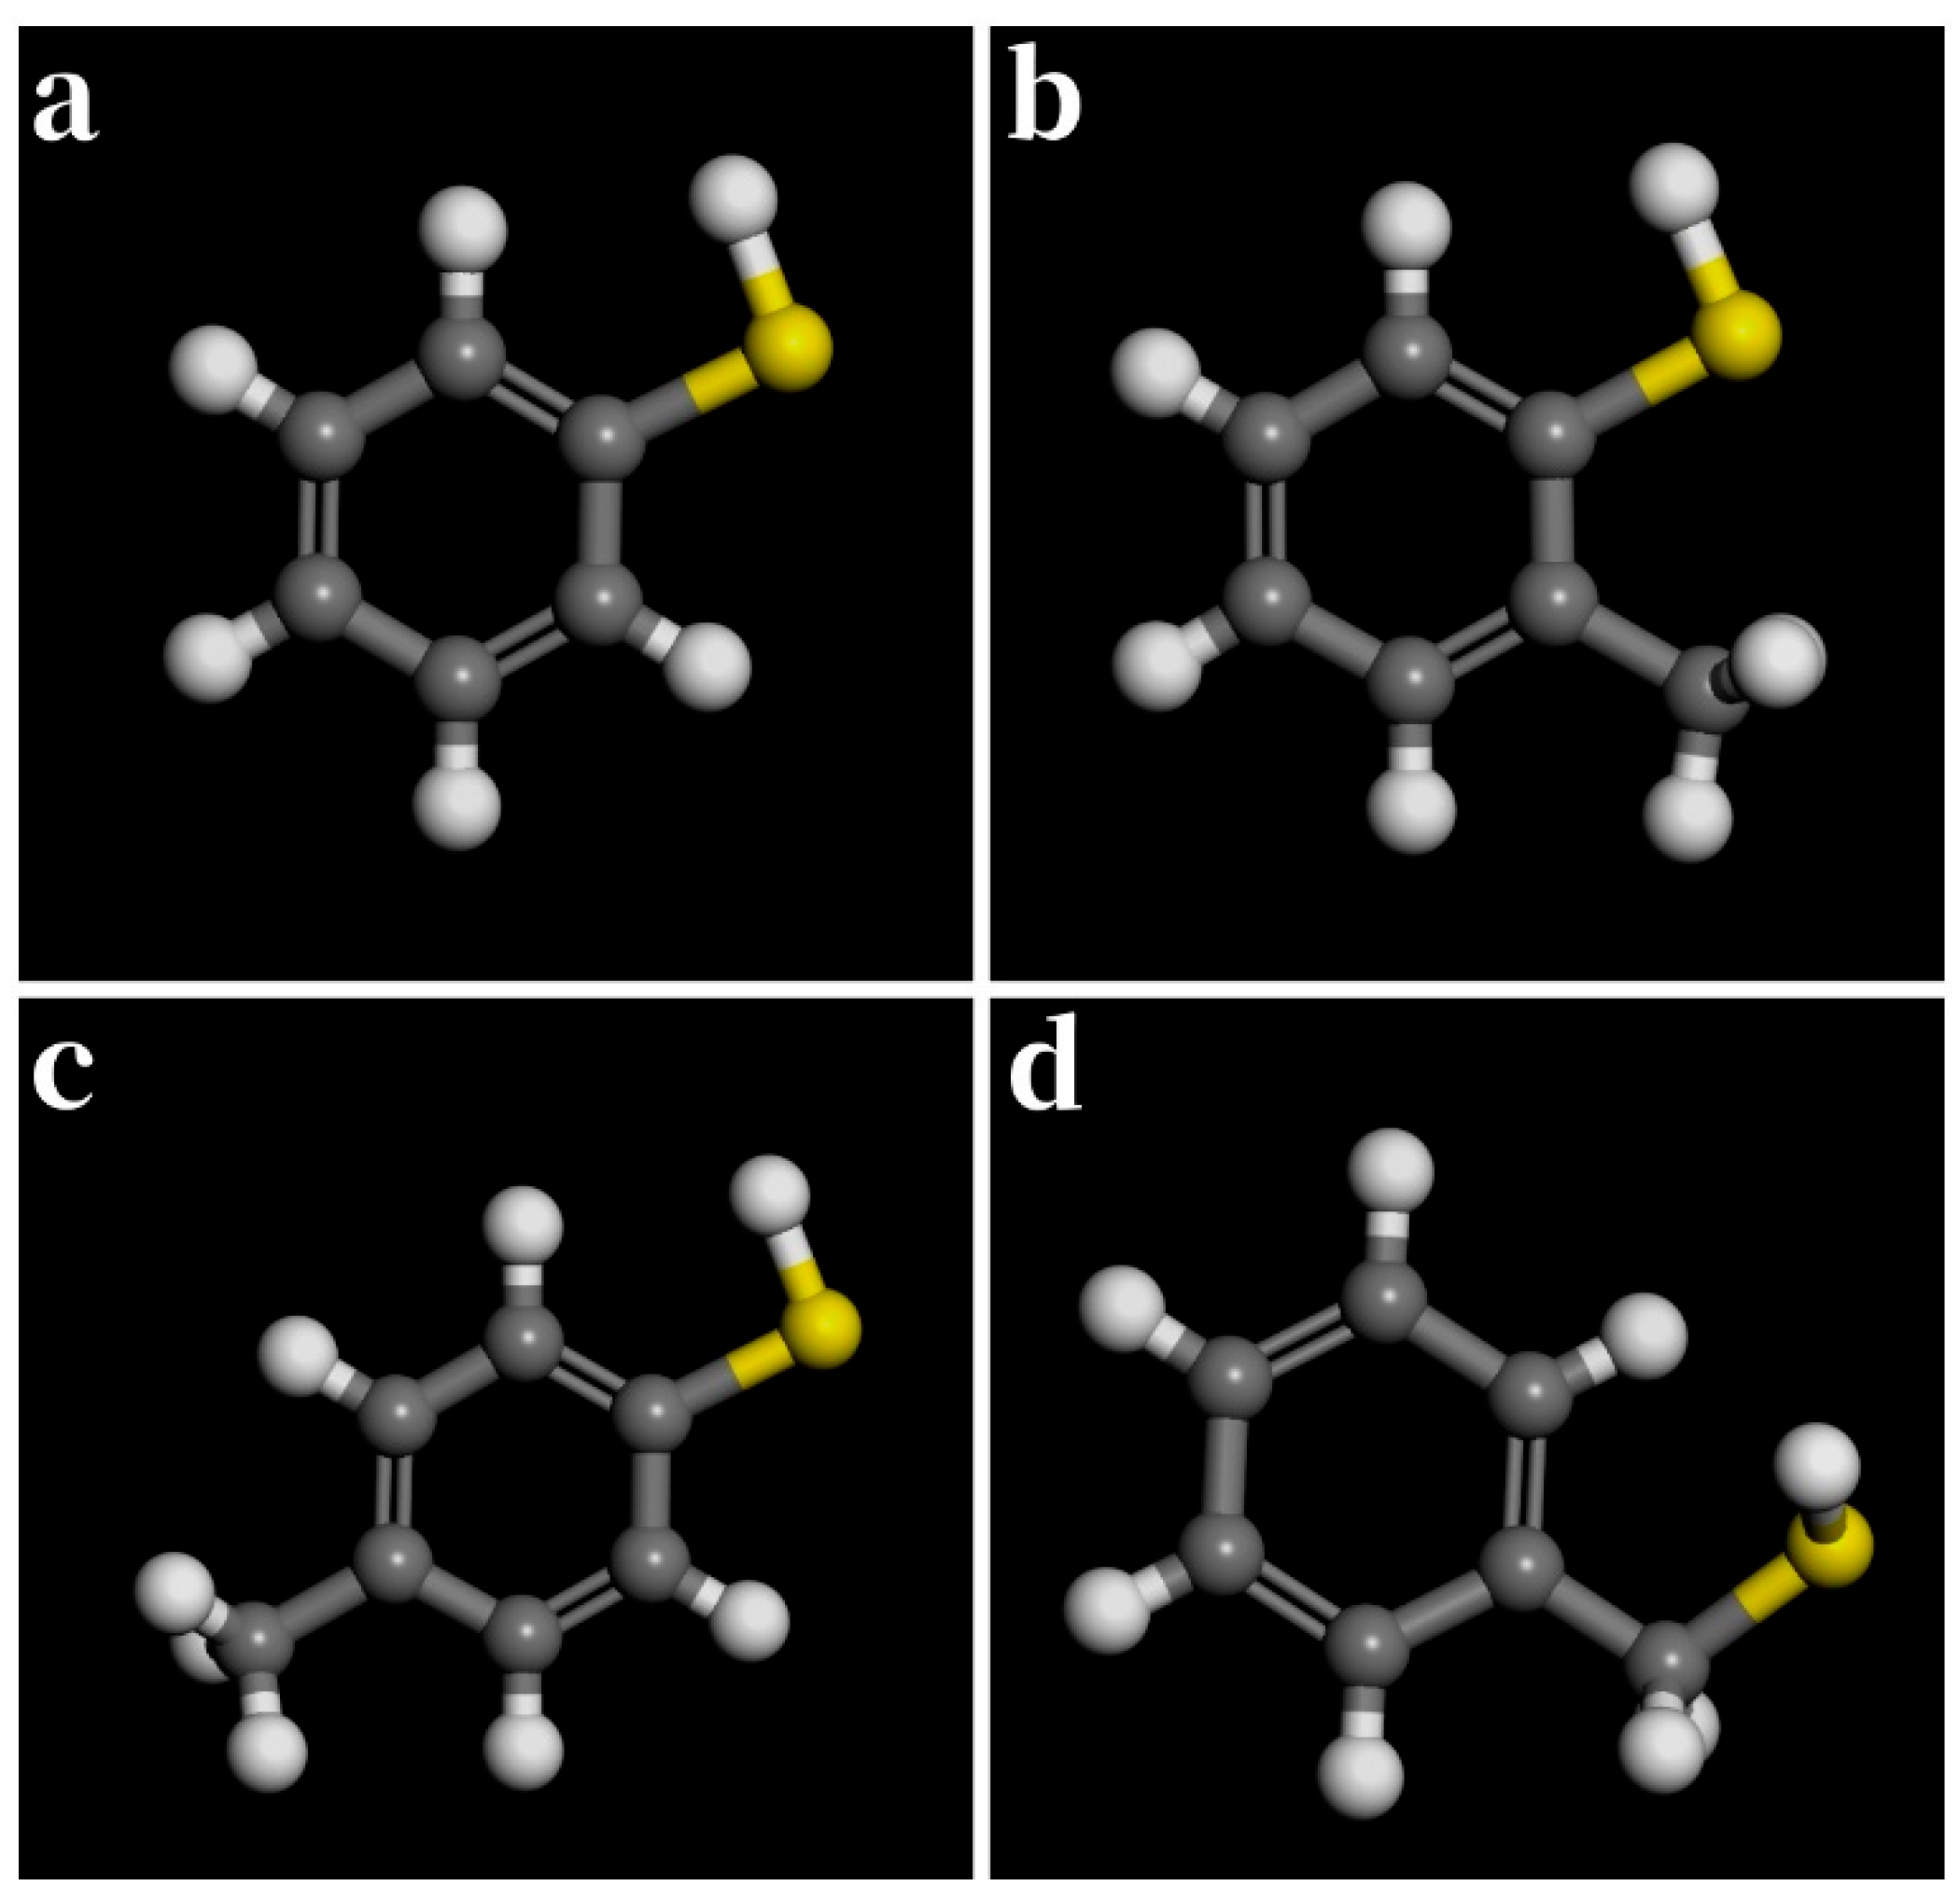
For aromatic thiols benzenethiol, 2-methylthiophenol, 4-methylthiophenol, and phenylmethanethiol, we conducted the following analysis on their optimized structures, as shown in Figure 11.
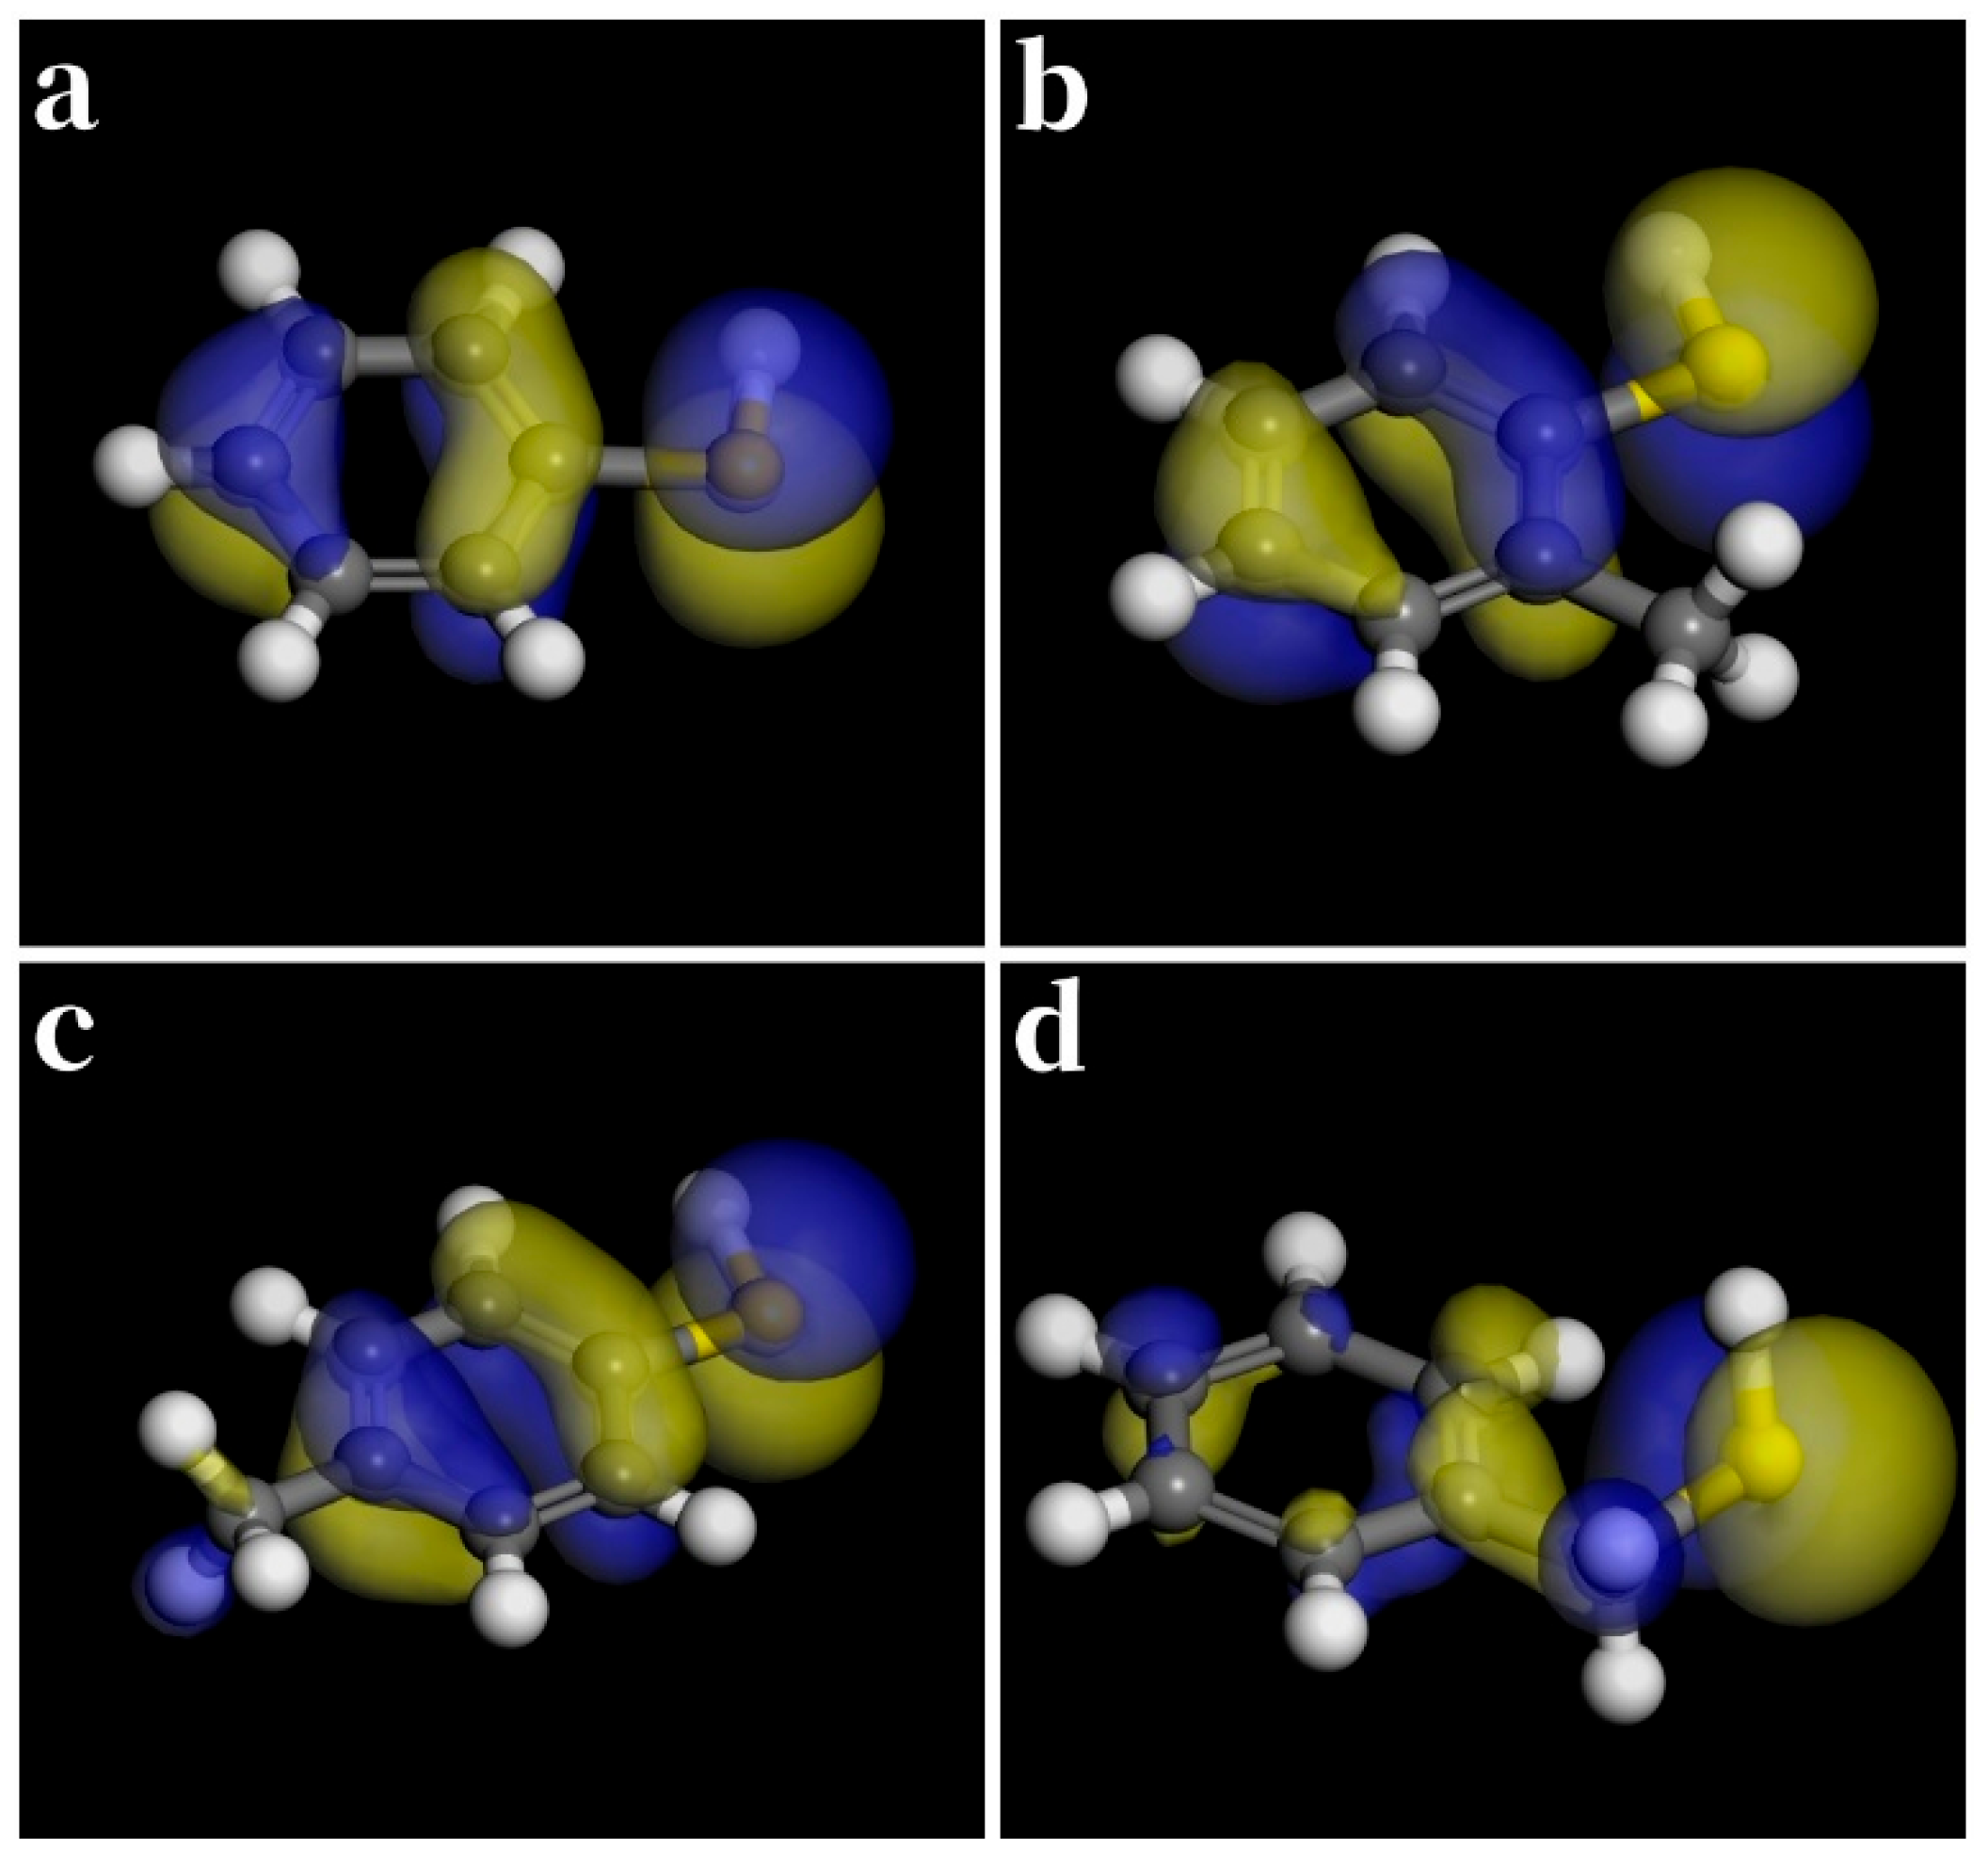
Figure 12 and Figure 13 show the distribution of HOMO and LUMO orbitals of aromatic thiols. Table S3 contains the energy and E of the HOMO and LUMO orbitals of the molecules. Figure 14 provides a more intuitive comparison of the strength of adsorption capacity among the four molecules.
Figure S3 shows the equilibrium of aromatic thiols in MD simulation. As can be seen from Figure 15, thiols are adsorbed on the surface of silver metal after 500 ps. Table 3 presents detailed data on the E a d s o r p t i o n of the four molecules. The adsorption performance ranking of aromatic thiols is as follows: 4-methylthiophenol > 2-methylthiophenol > phenylmethanethiol > benzenethiol.
Based on the comprehensive quantum chemical calculation and MD simulation, it can be seen from Figure S8 that the adsorption performance of phenylmethanethiol is the most favorable.

3.4. Binary Thiols

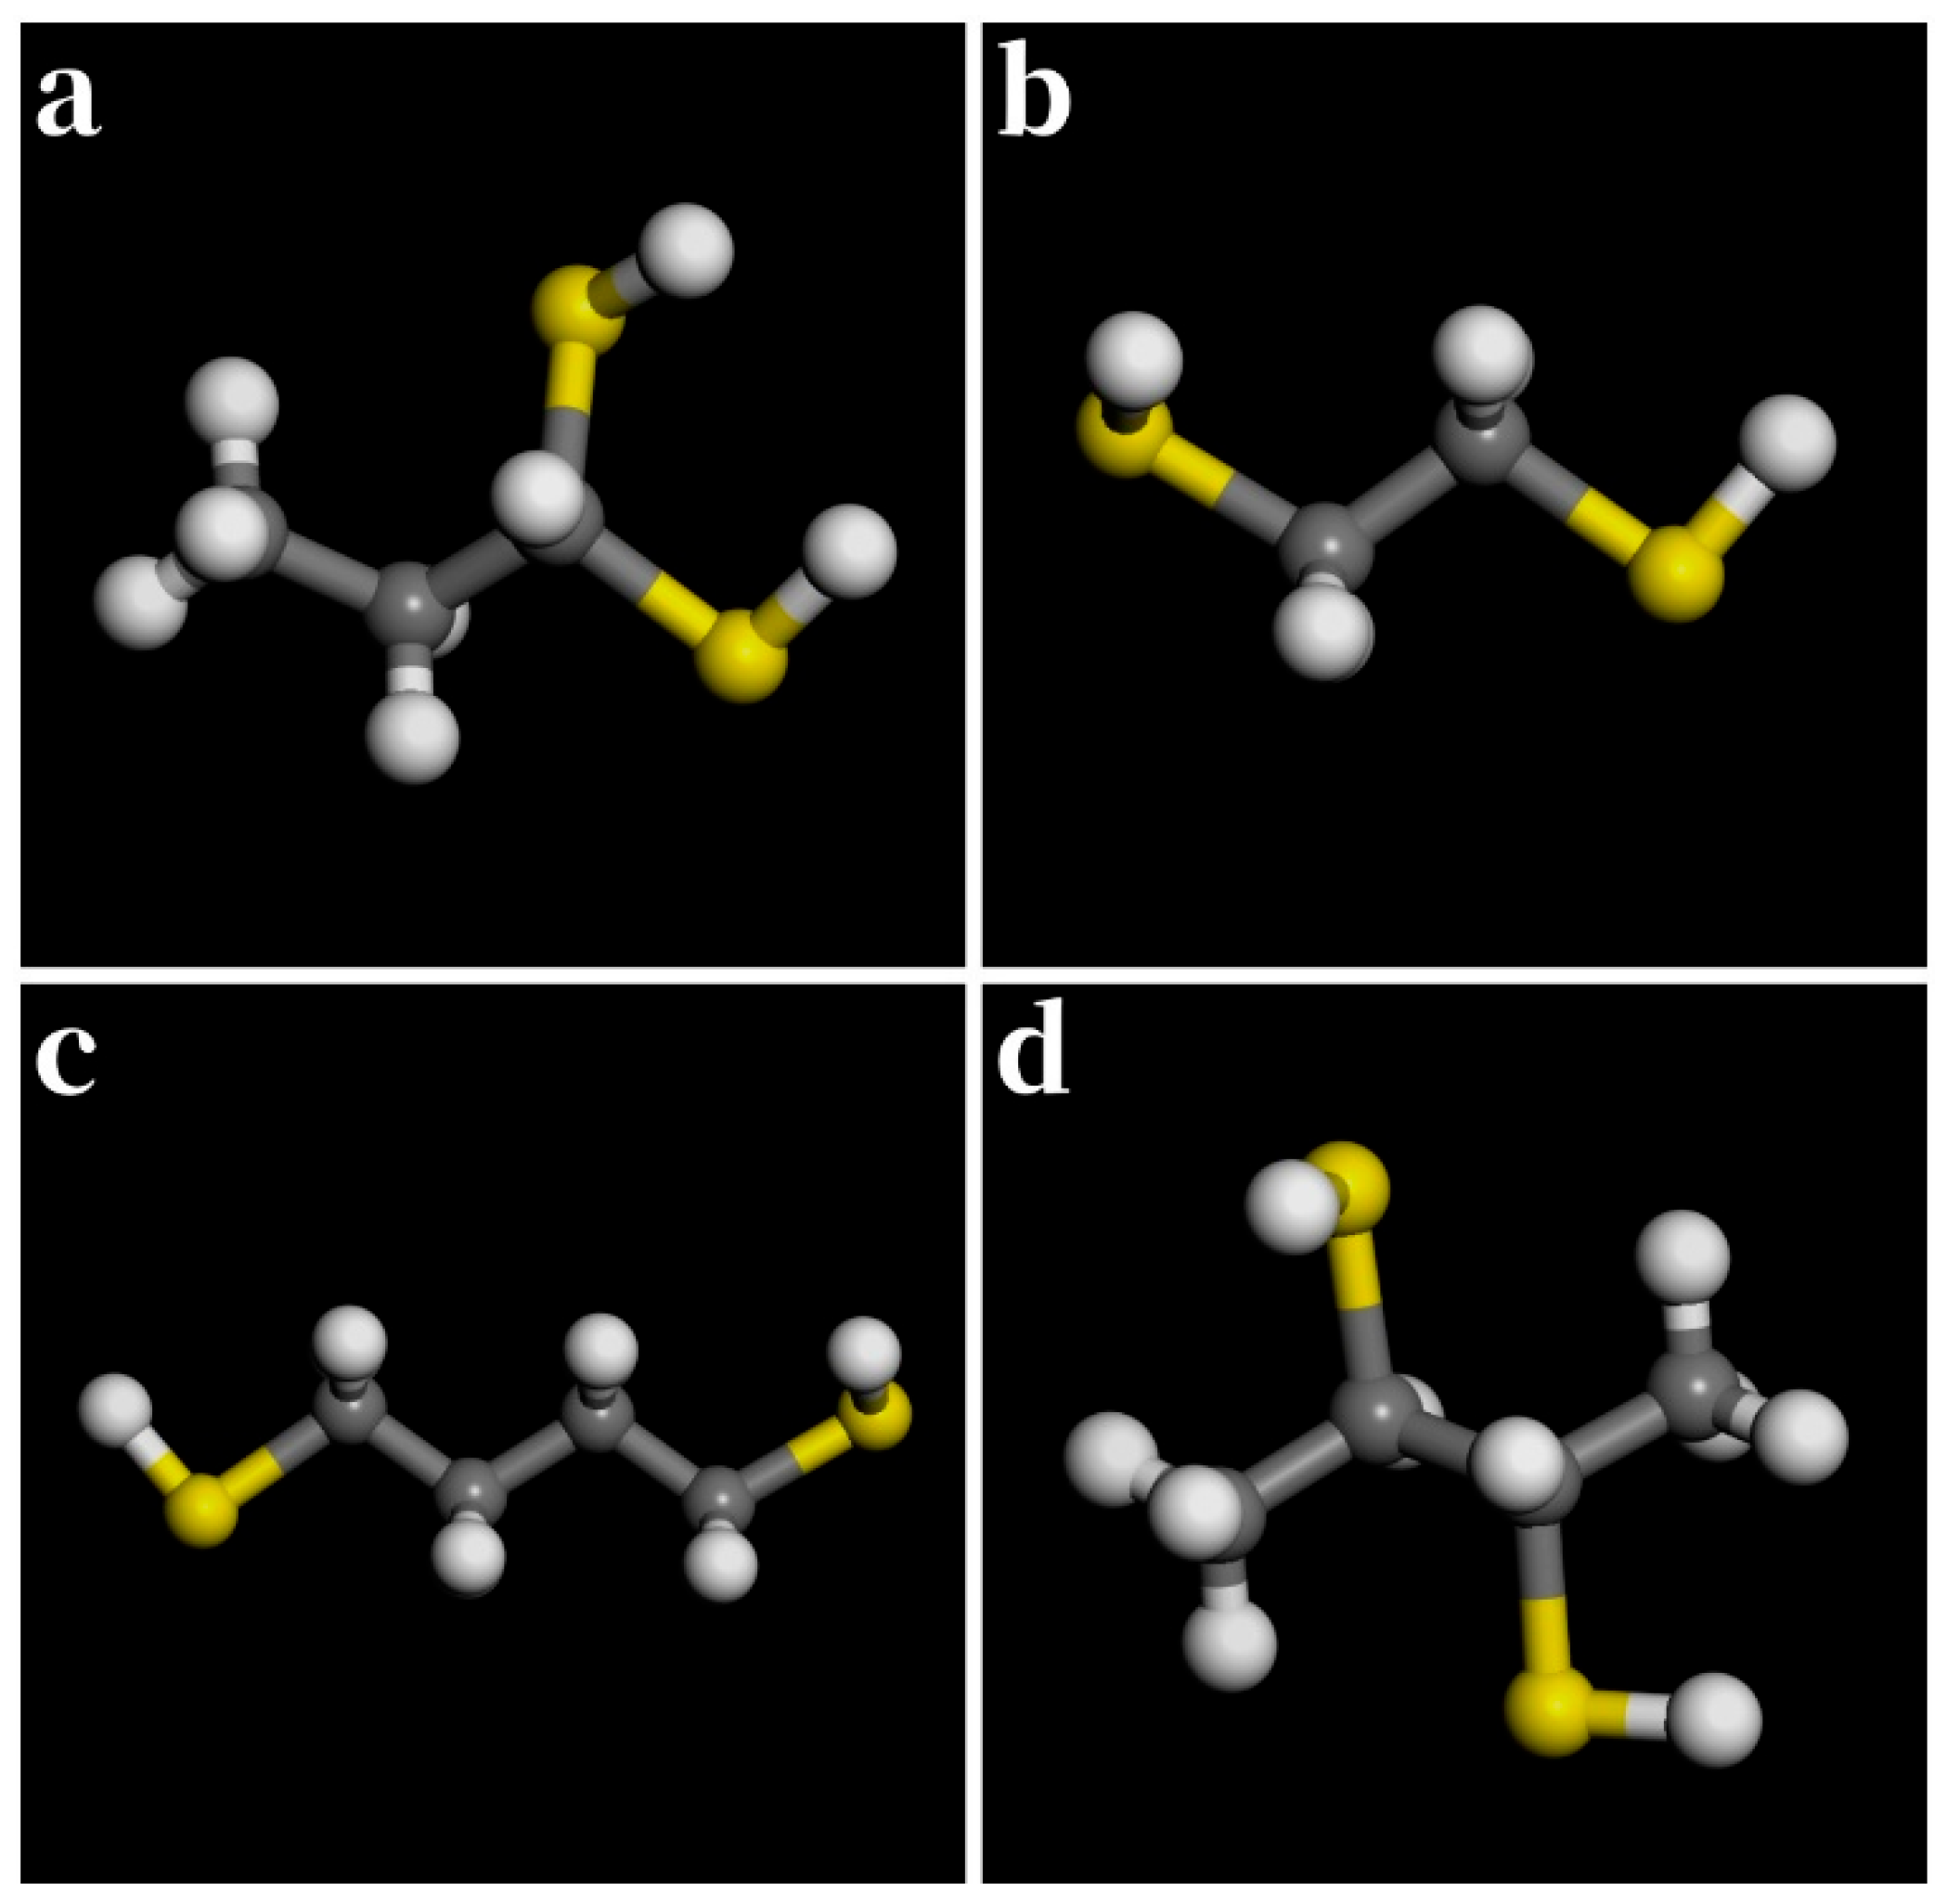
Binary thiol can participate in cross-linking, catalysis, or be used as ligands through thiol reactions. In this study, we selected four binary thiols, namely 1,1-propanedithiol, ethanedithiol, 1,4-butanedithiol, and 2,3-butanedithiol, as the research objects, and their optimized structures are shown in Figure 16.
Through the quantum chemical calculation of DFT, we obtained the energy, distribution and E of the HOMO and LUMO orbitals of four molecules. Table S4 details the orbital energy data of four molecules. Figure 17 and Figure 18 show the distribution of HOMO and LUMO orbitals of the four molecules. Among them, Figure 19 makes a clearer comparison of the strength of adsorption capacity among the four molecules.
Figure S4 shows the equilibrium of binary thiols in MD simulation. It can be seen from Figure 20 that thiols adsorbed on the surface of silver metal before and after the simulation. Table 4 presents detailed data on the adsorption energies of the four molecules. Combined with Figure S9, the adsorption performance ranking of thiols in this group can be obtained: 1,4-butanedithiol > 2,3-butanedithiol > 1,1-propanedithiol > ethanedithiol.

3.5. Unsaturated Aliphatic Thiols

In unsaturated aliphatic thiols, we studied four thiol compounds, namely 3-methyl-2-buten-1-thiol, 2-propene-1-thiol, 2-butene-1-thiol, and thiogeraniol. Figure 21 shows the optimized structures of these thiols.
Figure 22 and Figure 23 show the distribution of HOMO and LUMO orbitals of the unsaturated aliphatic thiols. Table S5 records the energies and E of the HOMO and LUMO orbitals of four molecules, and Figure 24 describes the E of the molecule.
Figure S5 shows the equilibrium of unsaturated aliphatic thiols in MD simulation. As can be seen from Figure 25, thiol molecules have a certain adsorption tendency with the silver surface during the MD simulation process. Table 5 presents detailed data on the adsorption energies of four molecules. Combined with Figure S10, the adsorption performance ranking of thiols in this group can be obtained: thiogeraniol > 3-methyl-2-buten-1-thiol > 2-butene-1-thiol > 2-propene-1-thiol.

3.6. Charge Density Difference

In this section, one molecule with excellent performance was selected from the five types of thiols for differential charge density treatment, namely cyclohexanethiol, 1-dodecanethiol, phenylmethanethiol, 1,1-propanedithiol, and 2-butene-1-thiol. The obtained results are shown in Figure 26. The analysis of differential charge density falls within the scope of quantum chemistry. In principle, the molecule with the lowest E among various thiols should be selected for analysis. However, the molecular E of long-chain saturated aliphatic thiols differs minimally, essentially being at the same level. Therefore, for the convenience of observation, we chose 1-dodecanethiol, the smallest in molecular structure, for the operation.
The charge density difference is represented by a blue-white-red legend, where red represents the maximum charge density and blue represents the minimum charge density [61]. Due to the higher electronegativity of S compared to Ag, electrons are biased toward S during the adsorption and bonding process, resulting in an increased negative charge density on S. After adsorption, the thiol molecule as a whole carries a negative charge, while the internal C-C bonds carry a positive charge, and the charge density on the Ag surface decreases. This is consistent with the results in Figure 26 where the red area around the molecule is darker, the internal area appears blue, and the red area around Ag is lighter. Therefore, performing charge density difference calculations on representative thiol molecules can verify their adsorption behavior and reveal the adsorption mechanism, The detailed data are shown in Table S6.

4. Conclusions

In this study, the adsorption properties of five types of thiol compounds (short-chain saturated aliphatic thiols, long-chain saturated aliphatic thiols, aromatic thiols, binary thiols, and unsaturated aliphatic thiols) on the surface of silver were systematically investigated through DFT and MD simulations. The results show that there are significant differences in the adsorption capacity of different types of thiols. The long-chain saturated aliphatic thiols (such as dodecanethiol, octadecanethiol, etc.) show the best protective effect, their E is smaller and the absolute value of E a d s o r p t i o n is the largest, and they have a tendency for monomolecular adsorption on the surface of silver. Aromatic thiols followed, among which 4-methylthiophenol had the most outstanding adsorption performance. Short-chain saturated aliphatic thiols have the poorest adsorption capacity, and only cyclohexanethiol performs relatively well in this category. The results of quantum chemical calculations and molecular dynamics simulations corroborate each other, confirming the strong adsorption characteristics of long-chain saturated aliphatic thiols on the surface of silver. This provides a theoretical basis for the anti-corrosion protection of silver-based materials and also offers a reliable computational method reference for screening efficient thiol protective agents.

Supplementary Materials

The following supporting information can be downloaded at: https://www.mdpi.com/article/10.3390/coatings15101134/s1, Figure S1: The equilibrium of temperature (a) and energy (b) of methanethiol; Figure S2: The equilibrium of temperature (a) and energy (b) of dodecylthiol; Figure S3: The equilibrium of temperature (a) and energy (b) of benzenethiol; Figure S4: The equilibrium of temperature (a) and energy (b) of propanedithiol; Figure S5: The equilibrium of temperature (a) and energy (b) of 3-methyl-2-buten-1-thiol; Figure S6: Comparison diagram of ΔE and adsorption energy of short-chain saturated aliphatic thiols; Figure S7: Comparison diagram of ΔE and adsorption energy of long-chain saturated aliphatic thiols; Figure S8: Comparison diagram of ΔE and adsorption energy of aromatic thiols; Figure S9: Comparison diagram of ΔE and adsorption energy of binary thiols; Figure S10: Comparison diagram of ΔE and adsorption energy of unsaturated aliphatic thiols; Table S1: HOMO and LUMO data of four short-chain saturated aliphatic thiol molecules; Table S2: HOMO and LUMO data of four long-chain saturated aliphatic thiol molecules; Table S3: HOMO and LUMO data of four aromatic thiol molecules; Table S4: HOMO and LUMO data of four binary thiol molecules; Table S5: HOMO and LUMO data of four unsaturated aliphatic thiol molecules; Table S6: Adsorption energy data of thiol molecules on a metal monolayer Ag (1 1 1).

Author Contributions

Conceptualization: W.G.; investigation: Y.A.; writing—original draft: A.L.; writing—review and editing, H.Z. and B.G. All authors have read and agreed to the published version of the manuscript.

Funding

This research received no external funding.

Institutional Review Board Statement

Not applicable.

Informed Consent Statement

Not applicable.

Data Availability Statement

Data is contained within the article and Supplementary Information.

Conflicts of Interest

The authors declare no conflicts of interest.

References

  1. Hao, N.V.; Tung, D.H.; Thao, T.T.; Hoa, V.X.; Thoan, N.H.; Tan, P.T.; Minh, P.N.; Fal, J.; Żyła, G.; Van Trinh, P.; et al. High thermal conductivity of green nanofluid containing Ag nanoparticles prepared by using solution plasma process with Paramignya trimera extract. J. Therm. Anal. Calorim. 2023, 148, 7579–7590. [Google Scholar] [CrossRef]
  2. Long, X.; Yu, D.; Han, J.; Huang, Z.; Xiao, J.; Feng, G.; Zhu, J.; Yang, K. High-performance Ag-TiO2 nanoparticle composite catalyst synthesized by pulsed laser ablation in liquid: Properties, mechanism and preparation studies. Opt. Express 2024, 32, 21304. [Google Scholar] [CrossRef]
  3. Wang, K.; Li, X.; Fan, H.; Xiong, S.; Liu, B.; Shuai, C. Preparation of Conductive Silver Paste with Mixed Nanostructured Silver Powders. J. Mater. Eng. Perform. 2025, 34, 9645–9653. [Google Scholar] [CrossRef]
  4. Wang, Z.; Zhou, M.; Lu, B.; Zhang, D.; He, H. Synthesis of Silver Nanoparticle/Multi-Walled Carbon Nanotube Composites and Their Application in Electronic Pastes. Nanomaterials 2025, 15, 152. [Google Scholar] [CrossRef] [PubMed]
  5. Ayhan, M.E.; Kalita, G.; Sharma, S.; Tanemura, M. Chemical vapor deposition of graphene on silver foil as a tarnish-resistant coating. Phys. Status Solidi (RRL) Rapid Res. Lett. 2013, 7, 1076–1079. [Google Scholar] [CrossRef]
  6. Elechiguerra, J.L.; Larios-Lopez, L.; Liu, C.; Garcia-Gutierrez, D.; Camacho-Bragado, A.; Yacaman, M.J. Corrosion at the Nanoscale:  The Case of Silver Nanowires and Nanoparticles. Chem. Mater. 2005, 17, 6042–6052. [Google Scholar] [CrossRef]
  7. Reed, J.C.; Zhu, H.; Zhu, A.Y.; Li, C.; Cubukcu, E. Graphene-Enabled Silver Nanoantenna Sensors. Nano Lett. 2012, 12, 4090–4094. [Google Scholar] [CrossRef]
  8. Bahmani, E.; Zakeri, A.; Sabour Rouh Aghdam, A. Protection of silver electrodeposit surfaces against accelerated and natural atmospheric corrosion by Ge incorporation in Ag structure; a microstructural investigation. Surf. Interfaces 2021, 26, 101288. [Google Scholar] [CrossRef]
  9. Alderete, B.; Mücklich, F.; Suarez, S. Tarnishing (Ag2S) Layer on Silver-Plated Electrical Contacts: Its Influence on Electrical Contact Resistance. IEEE Trans. Compon. Packag. Manuf. Technol. 2023, 13, 45–58. [Google Scholar] [CrossRef]
  10. Zhang, H.; Xue, X. The research progress on corrosion and protection of silver layer. SN Appl. Sci. 2019, 1, 464. [Google Scholar] [CrossRef]
  11. Wu, M.; Yu, X.; Huang, J. Nano-TiO2 film enables silver artefacts to regenerate. Bull. Mater. Sci. 2022, 45, 115. [Google Scholar] [CrossRef]
  12. Fratoddi, I.; Marghella, G.; Venditti, I.; Ferro, D.; Russo, M.V. Organometallic Pt(II) containing polymer as silver protection against sulfide tarnishing. J. Appl. Polym. Sci. 2013, 128, 304–309. [Google Scholar] [CrossRef]
  13. Paussa, L.; Guzman, L.; Marin, E.; Isomaki, N.; Fedrizzi, L. Protection of silver surfaces against tarnishing by means of alumina/titania-nanolayers. Surf. Coat. Technol. 2011, 206, 976–980. [Google Scholar] [CrossRef]
  14. Tyurina, S.A.; Chavushyan, S.L.; Makarova, A.V.; Khvostov, R.E.; Yudin, G.A. Research and Analysis of Methods for Preventing Silver Alloys from Tarnishing. Inorg. Mater. Appl. Res. 2021, 12, 1615–1622. [Google Scholar] [CrossRef]
  15. Sasaki, T.; Kawamura, M.; Abe, Y.; Kim, K.H. Suppression of property changes in Ag thin films by introducing organic monolayers. Vacuum 2015, 121, 317–319. [Google Scholar] [CrossRef]
  16. Wei, H.; Huang, Z.; Qin, Z. Anti-corrosion effect of thiol self-assembled monolayers on Ag plate. In Proceedings of the 2013 IEEE 15th Electronics Packaging Technology Conference (EPTC 2013), Singapore, 11–13 December 2013; pp. 555–559. [Google Scholar] [CrossRef]
  17. Burleigh, T.D.; Shi, C.; Kilic, S.; Kovacik, S.; Thompson, T.; Enick, R.M. Self-Assembled Monolayers of Perfluoroalkyl Amideethanethiols, Fluoroalkylthiols, and Alkylthiols for the Prevention of Silver Tarnish. Corrosion 2002, 58, 49–56. [Google Scholar] [CrossRef]
  18. Liang, C.; Yang, C.; Huang, N. Tarnish protection of silver by octadecanethiol self-assembled monolayers prepared in aqueous micellar solution. Surf. Coat. Technol. 2009, 203, 1034–1044. [Google Scholar] [CrossRef]
  19. Evesque, M.; Keddam, M.; Takenouti, H. The formation of self-assembling membrane of hexadecane-thiol on silver to prevent the tarnishing. Electrochim. Acta 2004, 49, 2937–2943. [Google Scholar] [CrossRef]
  20. Wang, N.-N.; Li, Q.-Z.; Yu, Z.-W. Hydrogen Bonding Interactions in Three 2-Mercaptoethanol Systems: An Excess Infrared Spectroscopic Study. Appl. Spectrosc. 2009, 63, 1356–1362. [Google Scholar] [CrossRef]
  21. Shwetha, K.M.; Praveen, B.M.; Devendra, B.K.; Saleh, D.I.; Rathod, M.R. Investigations of a new derivative as an effective mild steel corrosion inhibitor in acidic medium using experimental, electrochemical and DFT simulation methods. Inorg. Chem. Commun. 2025, 177, 114289. [Google Scholar] [CrossRef]
  22. Fadhil, A.A.; Khadom, A.A.; Liu, H.; Fu, C.; Wang, J.; Fadhil, N.A.; Mahood, H.B. (S)-6-Phenyl-2,3,5,6-tetrahydroimidazo[2,1-b] thiazole hydrochloride as corrosion inhibitor of steel in acidic solution: Gravimetrical, electrochemical, surface morphology and theoretical simulation. J. Mol. Liq. 2019, 276, 503–518. [Google Scholar] [CrossRef]
  23. Li, X.; Wu, D.; Luo, Q.; Yin, R.; An, J.; Liu, S.; Wang, D. Fabrication of CPAN/Ag/AgCl composites and their efficient visible-light photocatalytic activity. J. Alloys Compd. 2017, 702, 585–593. [Google Scholar] [CrossRef]
  24. Liu, R.; Li, S.; Yu, X.; Zhang, G.; Ma, Y.; Yao, J. Facile synthesis of a Ag nanoparticle/polyoxometalate/carbon nanotube tri-component hybrid and its activity in the electrocatalysis of oxygen reduction. J. Mater. Chem. 2011, 21, 14917–14924. [Google Scholar] [CrossRef]
  25. Choudhury, A. Polyaniline/silver nanocomposites: Dielectric properties and ethanol vapour sensitivity. Sens. Actuators B Chem. 2009, 138, 318–325. [Google Scholar] [CrossRef]
  26. Wu, X.; Wang, Z.; Chen, L.; Huang, X. Ag-enhanced SEI formation on Si particles for lithium batteries. Electrochem. Commun. 2003, 5, 935–939. [Google Scholar] [CrossRef]
  27. Zhou, N.; Yang, T.; Jiao, K.; Song, C.-X. Electrochemical Deoxyribonucleic Acid Biosensor Based on Multiwalled Carbon Nanotubes/Ag-TiO2 Composite Film for Label-Free Phosphinothricin Acetyltransferase Gene Detection by Electrochemical Impedance Spectroscopy. Chin. J. Anal. Chem. 2010, 38, 301–306. [Google Scholar] [CrossRef]
  28. Chung, D.; Khosla, A.; Gray, B.L.; Parameswaran, A.M.; Ramaseshan, R.; Kohli, K. Investigations of Flexible Ag/AgCl Nanocomposite Polymer Electrodes for Suitability in Tissue Electrical Impedance Scanning (EIS). J. Electrochem. Soc. 2014, 161, B3071–B3076. [Google Scholar] [CrossRef]
  29. Yang, H.; Liu, H.R.; Guo, Z.C.; Chen, B.M.; Zhang, Y.C.; Xu, R.D. Electrochemical behaviors of Pb-0.3%Ag-0.06%Ca rolled alloy anode during and after zinc electrowinning—Tafel investigations. In Frontiers of Manufacturing Science and Measuring Technology Iii, Pts 1–3; Sung, W.P., Kao, J.C.M., Chen, R., Eds.; Trans Tech Publications Ltd.: Zurich, Switzerland, 2013; Volume 401, p. 779. [Google Scholar]
  30. Kaya, Ş.; Çağlar, A.; Akdemir, M.; Kivrak, H.D.; Horoz, S.; Kaya, M. Exploring the Triple Applications of Ag/PMAc-g-CNT Nanocomposites in Enhancing HER, OER and Supercapacitor Performance. Waste Biomass Valorization 2024, 15, 2781–2792. [Google Scholar] [CrossRef]
  31. Eberhardt, D.; Santos, E.; Schmickler, W. Hydrogen evolution on silver single crystal electrodes—First results. J. Electroanal. Chem. 1999, 461, 76–79. [Google Scholar] [CrossRef]
  32. Neumaier, M.; Weigend, F.; Hampe, O.; Kappes, M.M. Binding energy and preferred adsorption sites of CO on gold and silver–gold cluster cations: Adsorption kinetics and quantum chemical calculations. Faraday Discuss. 2008, 138, 393–406. [Google Scholar] [CrossRef]
  33. Al-Saadi, A.A. Computational study of SERS effects in some aliphatic and cyclic carboxylic acids with silver nanomaterials. J. Phys. Conf. Ser. 2020, 1564, 012008. [Google Scholar] [CrossRef]
  34. Zhang, G.; Li, Q.; Sun, D.; Ye, X.; Yi, X.; Fang, W.; Luo, Z. Effect of pulse electroplating parameters on the morphology and corrosion resistance of Ag plating coating. Surf. Topogr. Metrol. Prop. 2024, 12, 025030. [Google Scholar] [CrossRef]
  35. Morovati, H.; Noorbala, M.R.; Namazian, M.; Zare, H.R.; Dehghani-Firouzabadi, A.A. Experimental and theoretical investigation of two thioether-based Schiff bases as anti-corrosion agents for carbon steel in HCl electrolyte. Anti-Corros. Methods Mater. 2024, 71, 81–91. [Google Scholar] [CrossRef]
  36. Ajagekar, A.; You, F. New frontiers of quantum computing in chemical engineering. Korean J. Chem. Eng. 2022, 39, 811–820. [Google Scholar] [CrossRef]
  37. Bernal, D.E.; Ajagekar, A.; Harwood, S.M.; Stober, S.T.; Trenev, D.; You, F. Perspectives of quantum computing for chemical engineering. AIChE J. 2022, 68, e17651. [Google Scholar] [CrossRef]
  38. Korniy, S.A. Quantum-Chemical Calculations of the Stability of Zeolite–Phosphate Complexes as Pigments of Paint Coatings. Mater. Sci. 2022, 58, 12–19. [Google Scholar] [CrossRef]
  39. Garrido, C.; Diaz-Fleming, G.; Campos-Vallette, M.M. SERS spectrum of gallic acid obtained from a modified silver colloid. Spectrochim. Acta Part A Mol. Biomol. Spectrosc. 2016, 163, 68–72. [Google Scholar] [CrossRef]
  40. Gece, G. The use of quantum chemical methods in corrosion inhibitor studies. Corros. Sci. 2008, 50, 2981–2992. [Google Scholar] [CrossRef]
  41. Chaudhuri, R.K.; Chattopadhyay, S. Theoretical investigations of electronic spectra of silver atom using all-electron scalar relativistic basis. AIP Adv. 2022, 12, 125019. [Google Scholar] [CrossRef]
  42. Chen, Y.-J.; Sundaram, M. A study on the gas film formation in electrochemical discharging processes by molecular dynamics simulation. Manuf. Lett. 2024, 41, 351–356. [Google Scholar] [CrossRef]
  43. Taghavi Kalajahi, S.; Mofradnia, S.R.; Yazdian, F.; Rasekh, B.; Neshati, J.; Taghavi, L. Computational evaluation of multifunctional nanostructured inhibitors to control microbiologically influenced corrosion: DFT calculations and MD simulations. J. Appl. Electrochem. 2023, 53, 2359–2373. [Google Scholar] [CrossRef]
  44. Karaseov, P.A.; Karabeshkin, K.; Mongo, E.; Titov, A.; Ullah, M.; Kuronen, A.; Djurabekova, F.; Nordlund, K. Experimental study and MD simulation of damage formation in GaN under atomic and molecular ion irradiation. Vacuum 2016, 129, 166–169. [Google Scholar] [CrossRef]
  45. Wang, L.; Wang, H.; Zou, Q.; Li, Y.; Lei, M.; Wang, W.; Li, Y. Experimental study and molecular dynamics simulation of Ag/Ti diffusion bonding. Surf. Interfaces 2024, 55, 105296. [Google Scholar] [CrossRef]
  46. Zhao, Y.; Shibahara, M.; Fan, X.; Liu, C.; Li, J. Molecular dynamics study of high temperature Ag-Cu-Sn liquid metal infiltration between Ag-Cu alloys: Influences of adsorption and dissolution. Mater. Today Commun. 2024, 40, 110167. [Google Scholar] [CrossRef]
  47. Anjum, Q.; Nasir, N.; Cheema, S.A.; Imran, M.; Rahman, A.R.; Tanveer, Z.; Amin, N.; Anjam, Y.N. Multiscale modeling investigation into the thermal conductivity dynamics of graphene-silver nano-composites: A molecular dynamic study. Dig. J. Nanomater. Biostruct. 2022, 17, 557–568. [Google Scholar] [CrossRef]
  48. Shi, D.W.; He, L.M.; Kong, L.G.; Lin, H.; Hong, L. Superheating of Ag nanowires studied by molecular dynamics simulations. Model. Simul. Mater. Sci. Eng. 2008, 16, 025009. [Google Scholar] [CrossRef]
  49. Nourmohamadi, H.; Esrafili, M.D.; Aghazadeh, V.; Rezai, B. The influence of Ag+ cation on elemental sulfur passive layer and adsorption behavior of chalcopyrite toward Fe3+ and Fe2+ ions: Insights from DFT calculations and molecular dynamics simulations. Phys. B Condens. Matter 2022, 627, 413611. [Google Scholar] [CrossRef]
  50. Huang, H.; Bu, F. Correlations between the inhibition performances and the inhibitor structures of some azoles on the galvanic corrosion of copper coupled with silver in artificial seawater. Corros. Sci. 2020, 165, 108413. [Google Scholar] [CrossRef]
  51. Pergolese, B.; Muniz-Miranda, M.; Bigotto, A. Surface enhanced Raman spectroscopic studies on 1H-1,2,4-triazole adsorbed on silver colloidal nanoparticles. Vib. Spectrosc. 2008, 48, 202–205. [Google Scholar] [CrossRef]
  52. Liu, A.; Ren, X.; Yang, Q.; Sokolowski, J.; Guo, J.; Li, Y.; Gao, L.; An, M.; Wu, G. Theoretical and Experimental Studies of the Prevention Mechanism of Organic Inhibitors on Silver Anti-Tarnish. J. Electrochem. Soc. 2018, 165, H725. [Google Scholar] [CrossRef]
  53. Aeberhard, P.C.; Arey, J.S.; Lin, I.-C.; Rothlisberger, U. Accurate DFT Descriptions for Weak Interactions of Molecules Containing Sulfur. J. Chem. Theory Comput. 2009, 5, 23–28. [Google Scholar] [CrossRef] [PubMed]
  54. Kim, B.G.; Li, X.; Blowers, P. Adsorption Energies of Mercury-Containing Species on CaO and Temperature Effects on Equilibrium Constants Predicted by Density Functional Theory Calculations. Langmuir 2009, 25, 2781–2789. [Google Scholar] [CrossRef] [PubMed]
  55. Gu, F.; Dong, H.; Li, Y.; Si, Z.; Yan, F. Highly Stable N3-Substituted Imidazolium-Based Alkaline Anion Exchange Membranes: Experimental Studies and Theoretical Calculations. Macromolecules 2014, 47, 208–216. [Google Scholar] [CrossRef]
  56. Stoyanov, S.R.; Král, P. Metallopyrrole-Capped Carbon Nanocones. J. Phys. Chem. B 2006, 110, 21480–21486. [Google Scholar] [CrossRef]
  57. Mahammedi, N.A.; Ferhat, M.; Belkada, R. Prediction of indirect to direct band gap transition under tensile biaxial strain in type-I guest-free silicon clathrate Si46: A first-principles approach. Superlattices Microstruct. 2016, 100, 296–305. [Google Scholar] [CrossRef]
  58. Jabłońska, A.; Ponikiewski, Ł.; Ejsmont, K.; Herman, A.; Dołęga, A. Syntheses, spectroscopic and structural properties of phenoxysilyl compounds: X-ray structures, FT-IR and DFT calculations. J. Mol. Struct. 2013, 1054–1055, 359–366. [Google Scholar] [CrossRef]
  59. Pan, J.; Sun, Z.; Zhu, H.; Cao, H.; Wang, B.; Zhao, J.; Yan, F. Synthesis and characterization of main-chain type polyimidazolium-based alkaline anion exchange membranes. J. Membr. Sci. 2020, 610, 118283. [Google Scholar]
  60. Zhang, Z.; Deng, L.; Zhou, X. Adsorption behavior of fluorides on Ag(111) and its doped surfaces: A first-principles calculation. Chem. Eng. Sci. 2023, 280, 119071. [Google Scholar] [CrossRef]
  61. Wang, X.; Zhang, L. Implications for electronic structures of S-doped graphene nanoribbons from a DFTB algorithm at atomic scale. Mater. Today Commun. 2024, 41, 110382. [Google Scholar] [CrossRef]
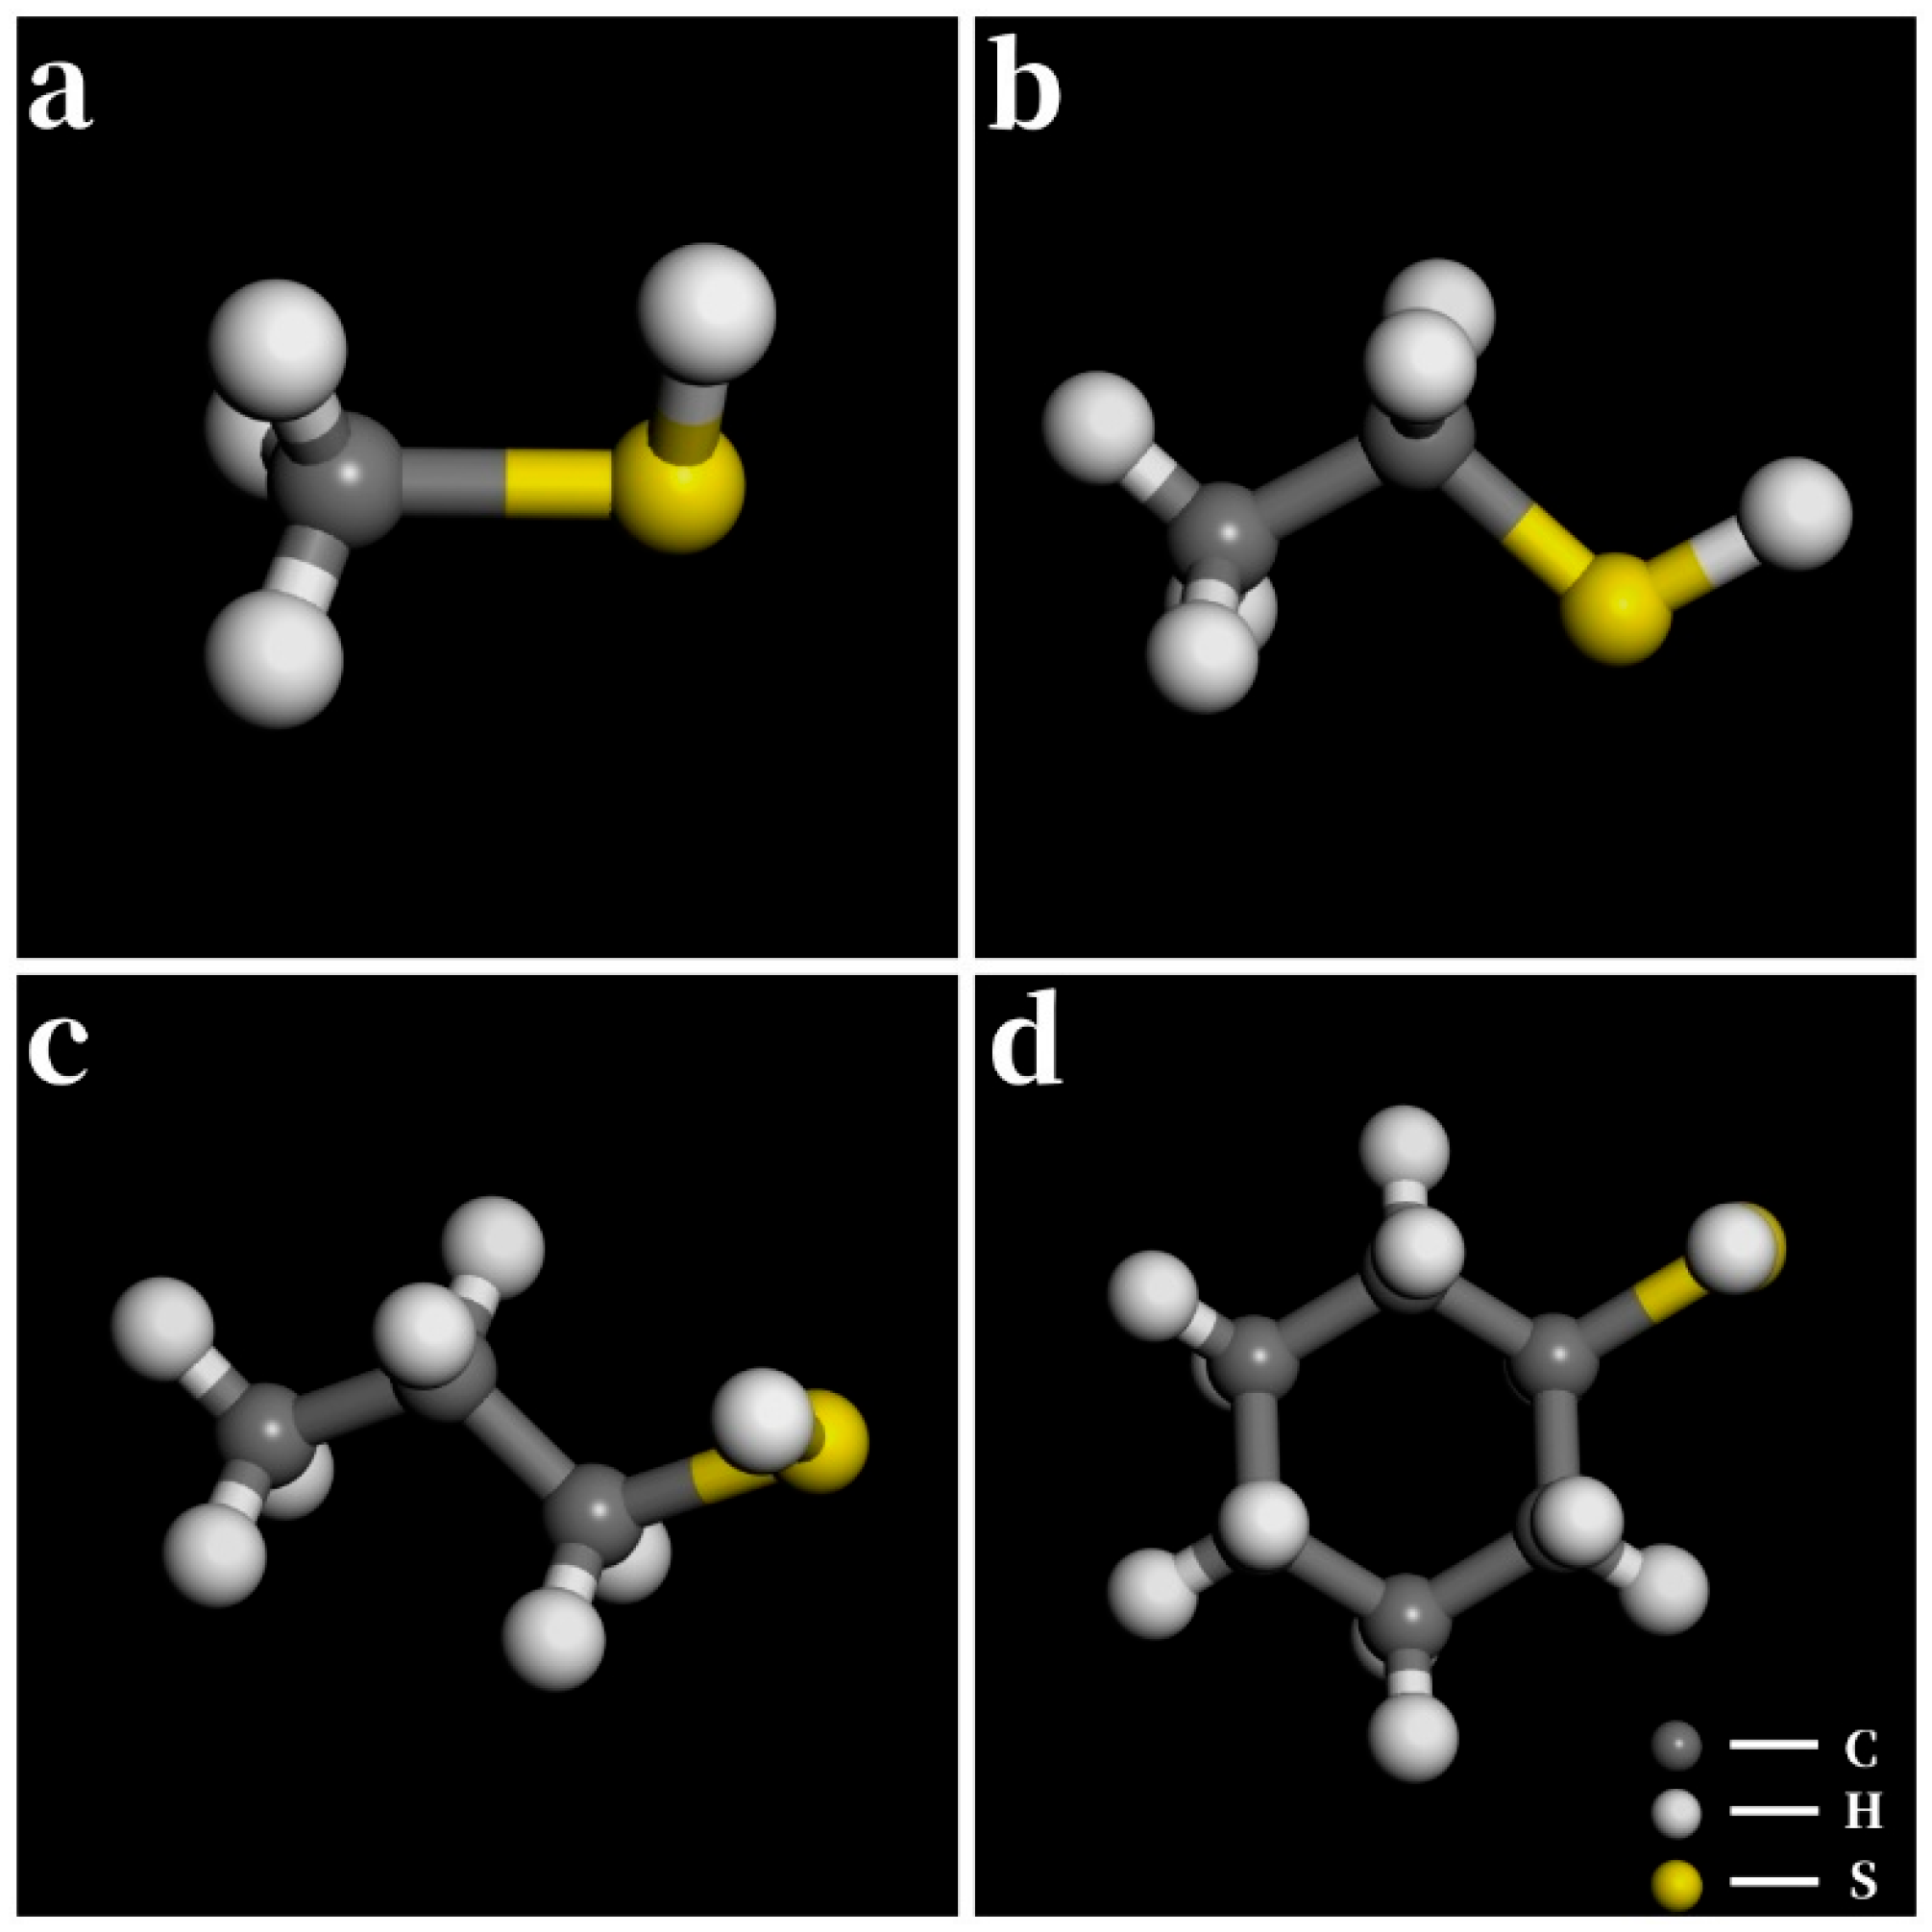
Figure 1. Optimized structure of investigated inhibitors with atom label symbols: (a) methanethiol, (b) ethanethiol, (c) propanethiol, and (d) cyclohexanethiol.
Coatings 15 01134 g001
Figure 2. The HOMO energy density distribution of four kinds of thiol molecules: (a) methanethiol, (b) ethanethiol, (c) propanethiol, and (d) cyclohexanethiol.
Coatings 15 01134 g002
Figure 3. The LUMO energy density distribution of four kinds of thiol molecules: (a) methanethiol, (b) ethanethiol, (c) propanethiol, and (d) cyclohexanethiol.
Coatings 15 01134 g003
Figure 4. The diagram E of thiol molecules: (a) methanethiol, (b) ethanethiol, (c) propanethiol, and (d) cyclohexanethiol (The red lines represent the energy of the LUMO, and the green lines represent the energy of the HOMO).
Coatings 15 01134 g004
Figure 5. Configuration diagrams of thiols before and after MD simulation; (ad) refer to methanethiol, ethanethiol, propanethiol, and cyclohexanethiol before the simulation and (a′d′) refer to methanethiol, ethanethiol, propanethiol, and cyclohexanethiol after the simulation.
Coatings 15 01134 g005
Figure 6. Optimized structure of investigated inhibitors with atom label symbols: (a) 1-dodecanethiol, (b) 1-tetradecanethiol, (c) 1-hexadecanethiol, and (d) 1-octadecanethiol.
Coatings 15 01134 g006
Figure 7. The HOMO energy density distribution of four kinds of thiol molecules: (a) 1-dodecanethiol, (b) 1-tetradecanethiol, (c) 1-hexadecanethiol, and (d) 1-octadecanethiol.
Coatings 15 01134 g007
Figure 8. The LUMO energy density distribution of four kinds of thiol molecules, (a) 1-dodecanethiol, (b) 1-tetradecanethiol, (c) 1-hexadecanethiol, and (d) 1-octadecanethiol.
Coatings 15 01134 g008
Figure 9. The diagram E of thiol molecules: (a) 1-dodecanethiol, (b) 1-tetradecanethiol, (c) 1-hexadecanethiol, and (d) 1-octadecanethiol (The red lines represent the energy of the LUMO, and the green lines represent the energy of the HOMO).
Coatings 15 01134 g009
Figure 10. Configuration diagrams of thiols before and after MD simulation; (ad) refer to 1-dodecanethiol, 1-tetradecanethiol, 1-hexadecanethiol, and 1-octadecanethiol before the simulation, and (a′d′) refer to 1-dodecanethiol, 1-tetradecanethiol, 1-hexadecanethiol, and 1-octadecanethiol after the simulation.
Coatings 15 01134 g010
Figure 11. Optimized structure of investigated inhibitors with atom label symbols: (a) benzenethiol, (b) 2-methylthiophenol, (c) 4-methylthiophenol, and (d) phenylmethanethiol.
Coatings 15 01134 g011
Figure 12. The HOMO energy density distribution of four kinds of thiol molecules: (a) benzenethiol, (b) 2-methylthiophenol, (c) 4-methylthiophenol, and (d) phenylmethanethiol.
Coatings 15 01134 g012
Figure 13. The LUMO energy density distribution of four kinds of thiol molecules: (a) benzenethiol, (b) 2-methylthiophenol, (c) 4-methylthiophenol, and (d) phenylmethanethiol.
Coatings 15 01134 g013
Figure 14. The diagram E of thiol molecules (a) benzenethiol, (b) 2-methylthiophenol, (c) 4-methylthiophenol, and (d) phenylmethanethiol (The red lines represent the energy of the LUMO, and the green lines represent the energy of the HOMO).
Coatings 15 01134 g014
Figure 15. Configuration diagrams of thiols before and after MD simulation; (ad) refer to benzenethiol, 2-methylthiophenol, 4-methylthiophenol, and phenylmethanethiol before the simulation, (a′d′) refer to benzenethiol, 2-methylthiophenol, 4-methylthiophenol, and phenylmethanethiol after the simulation.
Coatings 15 01134 g015
Figure 16. Optimized structure of investigated inhibitors with atom label symbols: (a) 1,1-propanedithiol, (b) ethanedithiol, (c) 1,4-butanedithiol, and (d) 2,3-butanedithiol.
Coatings 15 01134 g016
Figure 17. The HOMO energy density distribution of four kinds of thiol molecules: (a) 1,1-propanedithiol, (b) ethanedithiol, (c) 1,4-butanedithiol, and (d) 2,3-butanedithiol.
Coatings 15 01134 g017
Figure 18. The LUMO energy density distribution of four kinds of thiol molecules: (a) 1,1-propanedithiol, (b) ethanedithiol, (c) 1,4-butanedithiol, and (d) 2,3-butanedithiol.
Coatings 15 01134 g018
Figure 19. The diagram E of thiol molecules: (a) 1,1-propanedithiol, (b) ethanedithiol, (c) 1,4-butanedithiol, and (d) 2,3-butanedithiol (The red lines represent the energy of the LUMO, and the green lines represent the energy of the HOMO).
Coatings 15 01134 g019
Figure 20. Configuration diagrams of thiols before and after MD simulation; (ad) refer to 1,1-propanedithiol, ethanedithiol, 1,4-butanedithiol, and 2,3-butanedithiol before the simulation, (a′d′) refer to 1,1-propanedithiol, ethanedithiol, 1,4-butanedithiol, and 2,3-butanedithiol after the simulation.
Coatings 15 01134 g020
Figure 21. Optimized structure of investigated inhibitors with atom label symbols: (a) 3-methyl-2-buten-1-thiol, (b) 2-propene-1-thiol, (c) 2-butene-1-thiol, and (d) thiogeraniol.
Coatings 15 01134 g021
Figure 22. The HOMO energy density distribution of four kinds of thiol molecules: (a) 3-methyl-2-buten-1-thiol, (b) 2-propene-1-thiol, (c) 2-butene-1-thiol, and (d) thiogeraniol.
Coatings 15 01134 g022
Figure 23. The LUMO energy density distribution of four kinds of thiol molecules: (a) 3-methyl-2-buten-1-thiol, (b) 2-propene-1-thiol, (c) 2-butene-1-thiol, and (d) thiogeraniol.
Coatings 15 01134 g023
Figure 24. The diagram E of thiol molecules (a) 3-methyl-2-buten-1-thiol, (b) 2-propene-1-thiol, (c) 2-butene-1-thiol, and (d) thiogeraniol (The red lines represent the energy of the LUMO, and the green lines represent the energy of the HOMO).
Coatings 15 01134 g024
Figure 25. Configuration diagrams of thiols before and after MD simulation; (ad) refer to 3-methyl-2-buten-1-thiol, 2-propene-1-thiol, 2-butene-1-thiol, and thiogeraniol before the simulation, (a′d′) refer to 3-methyl-2-buten-1-thiol, 2-propene-1-thiol, 2-butene-1-thiol, and thiogeraniol after the simulation.
Coatings 15 01134 g025
Figure 26. Charge density difference of thiol molecules adsorbed on a Ag surface: (a) cyclohexanethiol, (b) 1-dodecanethiol, (c) phenylmethanethiol, (d) 1,1-propanedithiol, and (e) 2-butene-1-thiol.
Coatings 15 01134 g026
Table 1. The adsorption energy data of the four short-chain saturated aliphatic thiol molecules.
Thiol E t o t a l
(kJ/mol)
E s u r f a c e
(kJ/mol)
E m o l e c u l e
(kJ/mol)
E a d s o r p t i o n
(kJ/mol)
Methanethiol1092.0591202.212−3.916−106.236
Ethanethiol2064.1272164.6564.608−105.138
Propanethiol1082.4341196.98120.959−135.506
Cyclohexanethiol976.3031199.927−43.810−179.813
Table 2. The adsorption energy data of the four long-chain saturated aliphatic thiol molecules.
Thiol E t o t a l
(kJ/mol)
E s u r f a c e
(kJ/mol)
E m o l e c u l e
(kJ/mol)
E a d s o r p t i o n
(kJ/mol)
1-dodecanethiol1525.8751865.7242.601−342.450
1-tetradecanethiol3275.3093628.980−17.562−336.109
1-hexadecanethiol823.0261206.617−46.832−336.759
1-octadecanethiol824.2031205.771−44.534−337.035
Table 3. The adsorption energy data of the four aromatic thiol molecules.
Thiol E t o t a l
(kJ/mol)
E s u r f a c e
(kJ/mol)
E m o l e c u l e
(kJ/mol)
E a d s o r p t i o n
(kJ/mol)
Benzenethiol1581.7951712.71352.569−183.488
2-methylthiophenol2025.6252158.36577.864−210.603
4-methylthiophenol1968.0592160.37419.712−212.027
Phenylmethanethiol2057.9432158.380102.544−202.982
Table 4. The adsorption energy data of the four binary thiol molecules.
Thiol E t o t a l
(kJ/mol)
E s u r f a c e
(kJ/mol)
E m o l e c u l e
(kJ/mol)
E a d s o r p t i o n
(kJ/mol)
1,1-propanedithiol1294.4101482.010−21.534−166.065
Ethanedithiol2207.4312318.61432.025−143.208
1,4-butanedithiol1733.3931943.528−10.408−199.727
2,3-butanedithiol1777.0181947.29613.088−183.366
Table 5. The adsorption energy data of the four unsaturated aliphatic thiol molecules.
Thiol E t o t a l
(kJ/mol)
E s u r f a c e
(kJ/mol)
E m o l e c u l e
(kJ/mol)
E a d s o r p t i o n
(kJ/mol)
3-methyl-2-buten-1-thiol1818.8921997.1822.392−180.682
2-propene-1-thiol2407.4432484.68742.869−120.113
2-butene-1-thiol2789.6942870.31667.257−147.880
Thiogeraniol2285.6262552.26914.764−281.407
Disclaimer/Publisher’s Note: The statements, opinions and data contained in all publications are solely those of the individual author(s) and contributor(s) and not of MDPI and/or the editor(s). MDPI and/or the editor(s) disclaim responsibility for any injury to people or property resulting from any ideas, methods, instructions or products referred to in the content.