Article

Comparative Study of the Effects of Different Surface States During the Laser Sealing of 304 Steel/High-Alumina Glass

1
Laser Processing Research Center, School of Mechanical and Electric Engineering, Soochow University, Suzhou 215131, China
2
State Key Laboratory of Advanced Welding and Joining, Harbin Institute of Technology, Harbin 150001, China
3
Qingdao Branch, Naval Aviation University, Qingdao 266041, China
*
Authors to whom correspondence should be addressed.
Coatings 2025, 15(1), 101; https://doi.org/10.3390/coatings15010101
Submission received: 18 December 2024 / Revised: 9 January 2025 / Accepted: 12 January 2025 / Published: 17 January 2025

Abstract

:
Laser welding (sealing) is a promising technology for joining metal to glass, but it shows poor joint strength in existing studies. This study conducted the laser sealing of a 304 stainless steel alloy to high-alumina glass using pre-oxidation and laser surface melting as an interlayer. The present investigation aimed to determine the influence of this surface modification strategy on the mechanical behavior of glass-to-metal sealing joints made via laser welding. An experimental campaign was conducted on 304 stainless steel and high-alumina glass. Pre-oxidation and laser surface melting treatment were performed on the 304 steel alloy surface before joining to improve the mechanical interlock and chemical bonding between the substrates. The microstructures of the 304 steel alloy/glass interface were investigated by using scanning electron microscopy (SEM) and an energy-dispersive spectrometer (EDS), and the interface evolution mechanism and the correlation between the steel/glass joining strength and the interface morphology were discussed. Finite element analysis software simulated the temperature field and stress field in the welding process, and the reasons for the differences in the welding strengths of different surface treatment samples were analyzed in depth. The results showed that the laser surface melting strategy used significantly influenced the mechanical behavior of the joints and the failure mode. Adopting a higher number of scans improved the mechanical interlock and, consequently, the mechanical behavior of the joints.

1. Introduction

Glass-to-metal seals are widely used in various fields such as sensors, medical and semiconductor devices, vacuum-based connectors, photovoltaic elements, microelectronic devices, etc., typically when electrical connections are needed through metal components (for example, passing wire into and out of a pacemaker). Glass-to-metal seals are also important when components need to be sealed and withstand high temperatures and pressures, such as in oil and gas rigs [1,2]. Good seals must have some degree of strength and mechanical integrity and usually need to be hermetic (leak-tight). The degree to which the different qualities are required varies with the intended use. Consequently, it is vital to meticulously determine the appropriate bonding method for metal-to-glass applications.
Laser welding (or sealing) technology has the advantages of being cost effective, highly efficient, and easy to automate [3]. Dissimilar laser welds between NiTi and Ti6Al4V exhibiting NiTi superelasticity and sustaining stress and elongation up to 520 MPa and 5.6% were achieved using a Pd interlayer in [4]. Dissimilar laser welding between an as-rolled CoCrFeMnNi high-entropy alloy (HEA) and an Inconel 718 Ni-base superalloy was successfully performed, allowing for the deployment of this dissimilar material pair for structural applications, in [5]. In addition, laser welding can heat the metal/glass interface directly or heat only the metal (alloy) part instead of heating the entire metal workpiece, unlike other welding methods. Therefore, laser welding (sealing) minimizes the influence of high temperatures on the base metal. Many scholars have investigated the laser welding (sealing) of glass to metal [6,7,8,9,10].
At present, the main methods used to improve the bonding between metals and glass include enhancing mechanical interlocking and chemical bonding capability [11,12,13]. Metal surface structuring, modification, or introducing an interlayer, including sandblasting, laser texturing, or anodizing, can effectively enhance the mechanical properties of the metal/glass joints by enlarging the contact area and enhancing mechanical interlocking [12,13].
An experimental study on the laser transmission welding of a transparent glass and aluminum alloy via a millisecond pulsed laser is reported for hermetically sealing glass to metal by Zhang et al. [6]. Prior to the laser sealing process, an oxide coating was prepared on the aluminum alloy surfaces using the micro-arc-oxidation process. The results show that the micro-arc-oxidation coating effectively acts as a laser energy-absorbing layer and buffer layer for weldments. In addition, the main reason for realizing the connection between these two materials is related to the mixed mosaic structure formed within welds [6].
Laser surface treatment of the titanium alloy was locally oxidized on the metal surface to improve the joint strength of the laser transmission welding of high borosilicate glass with titanium alloy in [14]. The results show that the welding strength increased five times. Element-line scanning analysis revealed that elemental diffusion occurred in the two materials, largely explaining the high welding strength. Surface free-energy analysis showed that laser surface treatment improved the surface free energy of the titanium alloy, promoted the wettability and compatibility, and increased the welding strength of the titanium alloy with glass.
Precision welded joints, produced between fused silica glass and aluminum via a newly developed picosecond-pulse laser technique, were analyzed for the first time, using a full range of electron microscopy methods, by Octav et al. [12]. Despite the extremely short interaction time, an extensive reaction was observed in the weld zone, which involved the formation of nanocrystalline silicon and at least two transitional alumina phases, γ- and δ-Al2O3. The weld formation process was complex and involved, in the formation of a constrained plasma cavity at the joint interface, non-linear absorption in the glass and the creation of multiple secondary keyholes in the metal substrate via beam scattering. The reasons for the appearance of nanocrystalline Si and transitional alumina reaction products within the welds were discussed.
In Elrefaey’s study [15], an intermediate layer of tin-based solder was used to anodically bond materials with different CTEs. The tin solder was anodically bonded to glass and, at the same time, soldered to metal. This method allowed for the bonding of materials with different CTEs because tin has an intermediate CTE and a low Young modulus, which decreased the residual stresses. The microstructural characterization of the glass/solder/titanium and glass/solder/steel joints formed from Ni-coated metal substrates indicated that Ni3Sn4 was formed for both types of joints but with a different morphology and location depending on the type of metal substrate. The average shear strength of the joints was 24 MPa for glass–titanium and 21 MPa for glass–steel joints. For both types of joints, the fracture crack propagated along the glass/solder interface.
In Hu‘s work, a new coupling technique for glass/metal joining was presented [13]. The glass was metallized by bonding Al foil on the glass surface via an anodic bonding process and then soldered to Cu with the assistance of a Sn-9Zn eutectic solder. During the soldering process, the whole interface evolution was divided into four stages and analyzed explicitly. Shear tests indicated that the fracture mainly occurred at the solder/Cu interface and a small amount of Al foil was torn off the glass substrate when the soldering time exceeded 5 min. The shear strength increased at first and then reduced with the prolongation of the soldering time, and the maximum strength was 12.7 MPa when the joint was achieved at 240 °C for 5 min.
Based on current research, the thermal expansion coefficient of high aluminum glass is significantly different to that of 304 stainless steel. Good sealing between glass and metal is difficult to achieve, and the sealing usually has poor mechanical properties. Thus, an interface layer or named buffer layer is always added as an auxiliary sealing. More work needs to be conducted on the exact welding mechanism between glass and metal. In the present study, there are two different oxide scales formed on steel surface. Then, the oxide scale used as an interface layer is used as an auxiliary sealing material to achieve glass-to-metal sealing. Previous oxide and wetting experiments proved that laser surface oxidation treatment performs better than treatment via high-temperature pre-oxidation. A laser sealing experiment was carried out on the steel surface using non-treatment, laser surface oxidation treatment and high-temperature pre-oxidation treatment. Through the above method, a joint with relatively high tensile/shear strength can be obtained without a complex surface structuring process when compared to the traditional pre-oxidation method. In this study, the effects of different surface states during the laser sealing of 304 steel/high-alumina glass were comparatively studied. This comprehensive comparative analysis aims to advance the development and application of laser technology for bonding glass to metals.

2. Experimental Procedure

2.1. Materials

The experimental materials used in the present work were high-alumina glass with a composition of 54.08% SiO2; 22.02% Al2O3; 19.09% Na2O; and 4.81% CaO, MgO, and SnO (in wt.%). Moreover, the thickness of the glass was 0.5 mm, making it an ultra-thin glass. The composition (in wt.%) of AISI 304 stainless steel used in this study was C, 0.08; Cr, 18.65; Mn, 1.72; Ni, 8.76; and Si, 1.00, and the balance was Fe. In the present study, the high-alumina glass and 304 stainless steel were cut into 20 mm × 20 mm × 0.5 mm and 20 mm × 20 mm × 2.5 mm pieces, respectively.

2.2. Surface Treatment of 304 Stainless Steel

The 304 stainless steel underwent two different surface treatments, i.e., pre-oxidation and laser surface melting (LSM). The samples were ground using 280-grit and 1200-grit silicon carbide abrasive papers. Subsequently, the samples were ultrasonically cleaned using ethanol. The pre-oxidation of the samples was conducted in a horizontal tube furnace at 700 °C and held for 20 min at an normal atmosphere. That is, no protective gas was maintained during the pre-oxidation process. Then, the samples were cooled to room temperature after pre-oxidation. After sealing and the metallographic process, each sample was mirror-polished and analyzed via a scanning electron microscope (SEM). The pre-oxidation procedure and experimental details were described in a previous report [6,14,16,17].
A set of glass/metal micro-welds was produced at Soochow University using a pulsed Nd/YAG 300 W laser, Jiangsu Jinyan Laser Group Limited Company, Wuxi, China.
Gaussian mode was the output beam profile. Laser surface melting (LSM) was achieved in air at room temperature using a maximum laser energy of 0.2 mJ. The translation stage was computer-controlled in the X-Y-Z axes to move the sample in the x direction at a 14,000 mm/s scanning speed. The sample was moved by a distance of 20 μm after each scan in the y direction to obtain a beam overlap of 10%. Throughout the LSM, no protective gas was applied to the sample surface to introduce the molten zone to oxidation.

2.3. Laser Sealing of Glass/Metal

The laser sealing experiments were performed with a Nd/YAG pulsed laser, of which the maximum average power was 300 W, the maximum frequency was 500 Hz, the pulse width was 0.1–20 ms, and the laser wavelength was 1064 nm. The beam diameter was 0.2 mm. The laser beam was focused on the interface between glass and 304 stainless steel. After primary tests, the selected laser parameters were defined as listed in Table 1, and the welding schematical diagram was defined as shown in Figure 1a. When reaching the interface between glass and 304 stainless steel, the laser energy was linearly absorbed by the metal surface (pre-oxidation layer or LSM layer) through the free electrons. Then, a larger molten pool was formed by the absorbed laser energy and significant thermal accumulation of multiple-pulsed lasers. The molten materials and the formed plasma were ejected, and, then, they melted the adjacent glass and filled the gaps between the glass and the metal, forming welds.

2.4. Characterization

The selected samples were cut, mounted, and polished with SiC papers in a regime from 200 grit up to 1200 grit, and, then, they were polished with 1 μm of diamond polishing spray. Next, they were etched for microscopic evaluation. A light optical microscope and scanning electron microscope (SEM, Zesis 1550 VP, Jena, Germany), equipped for energy-dispersive X-ray spectroscopic analysis (EDS, Oxford Instruments), were used to carry out a metallographic examination of the cross-section. Samples were coated with ≅4 nm of Au for SEM analysis. EDS analysis and mapping were performed with an acceleration voltage of 20 kV.
The tensile/shear force was measured using a universal testing machine with a cross-head speed of 0.5 mm/min, and the schematic diagrams of the shear test are shown in Figure 1b. Three samples for each parameter were produced for mechanical testing. The results were averaged, and the standard deviation was calculated. The tensile/shear strength was calculated based on the coating area. After the shear test, the fracture surfaces were analyzed via SEM and EDS analyses.

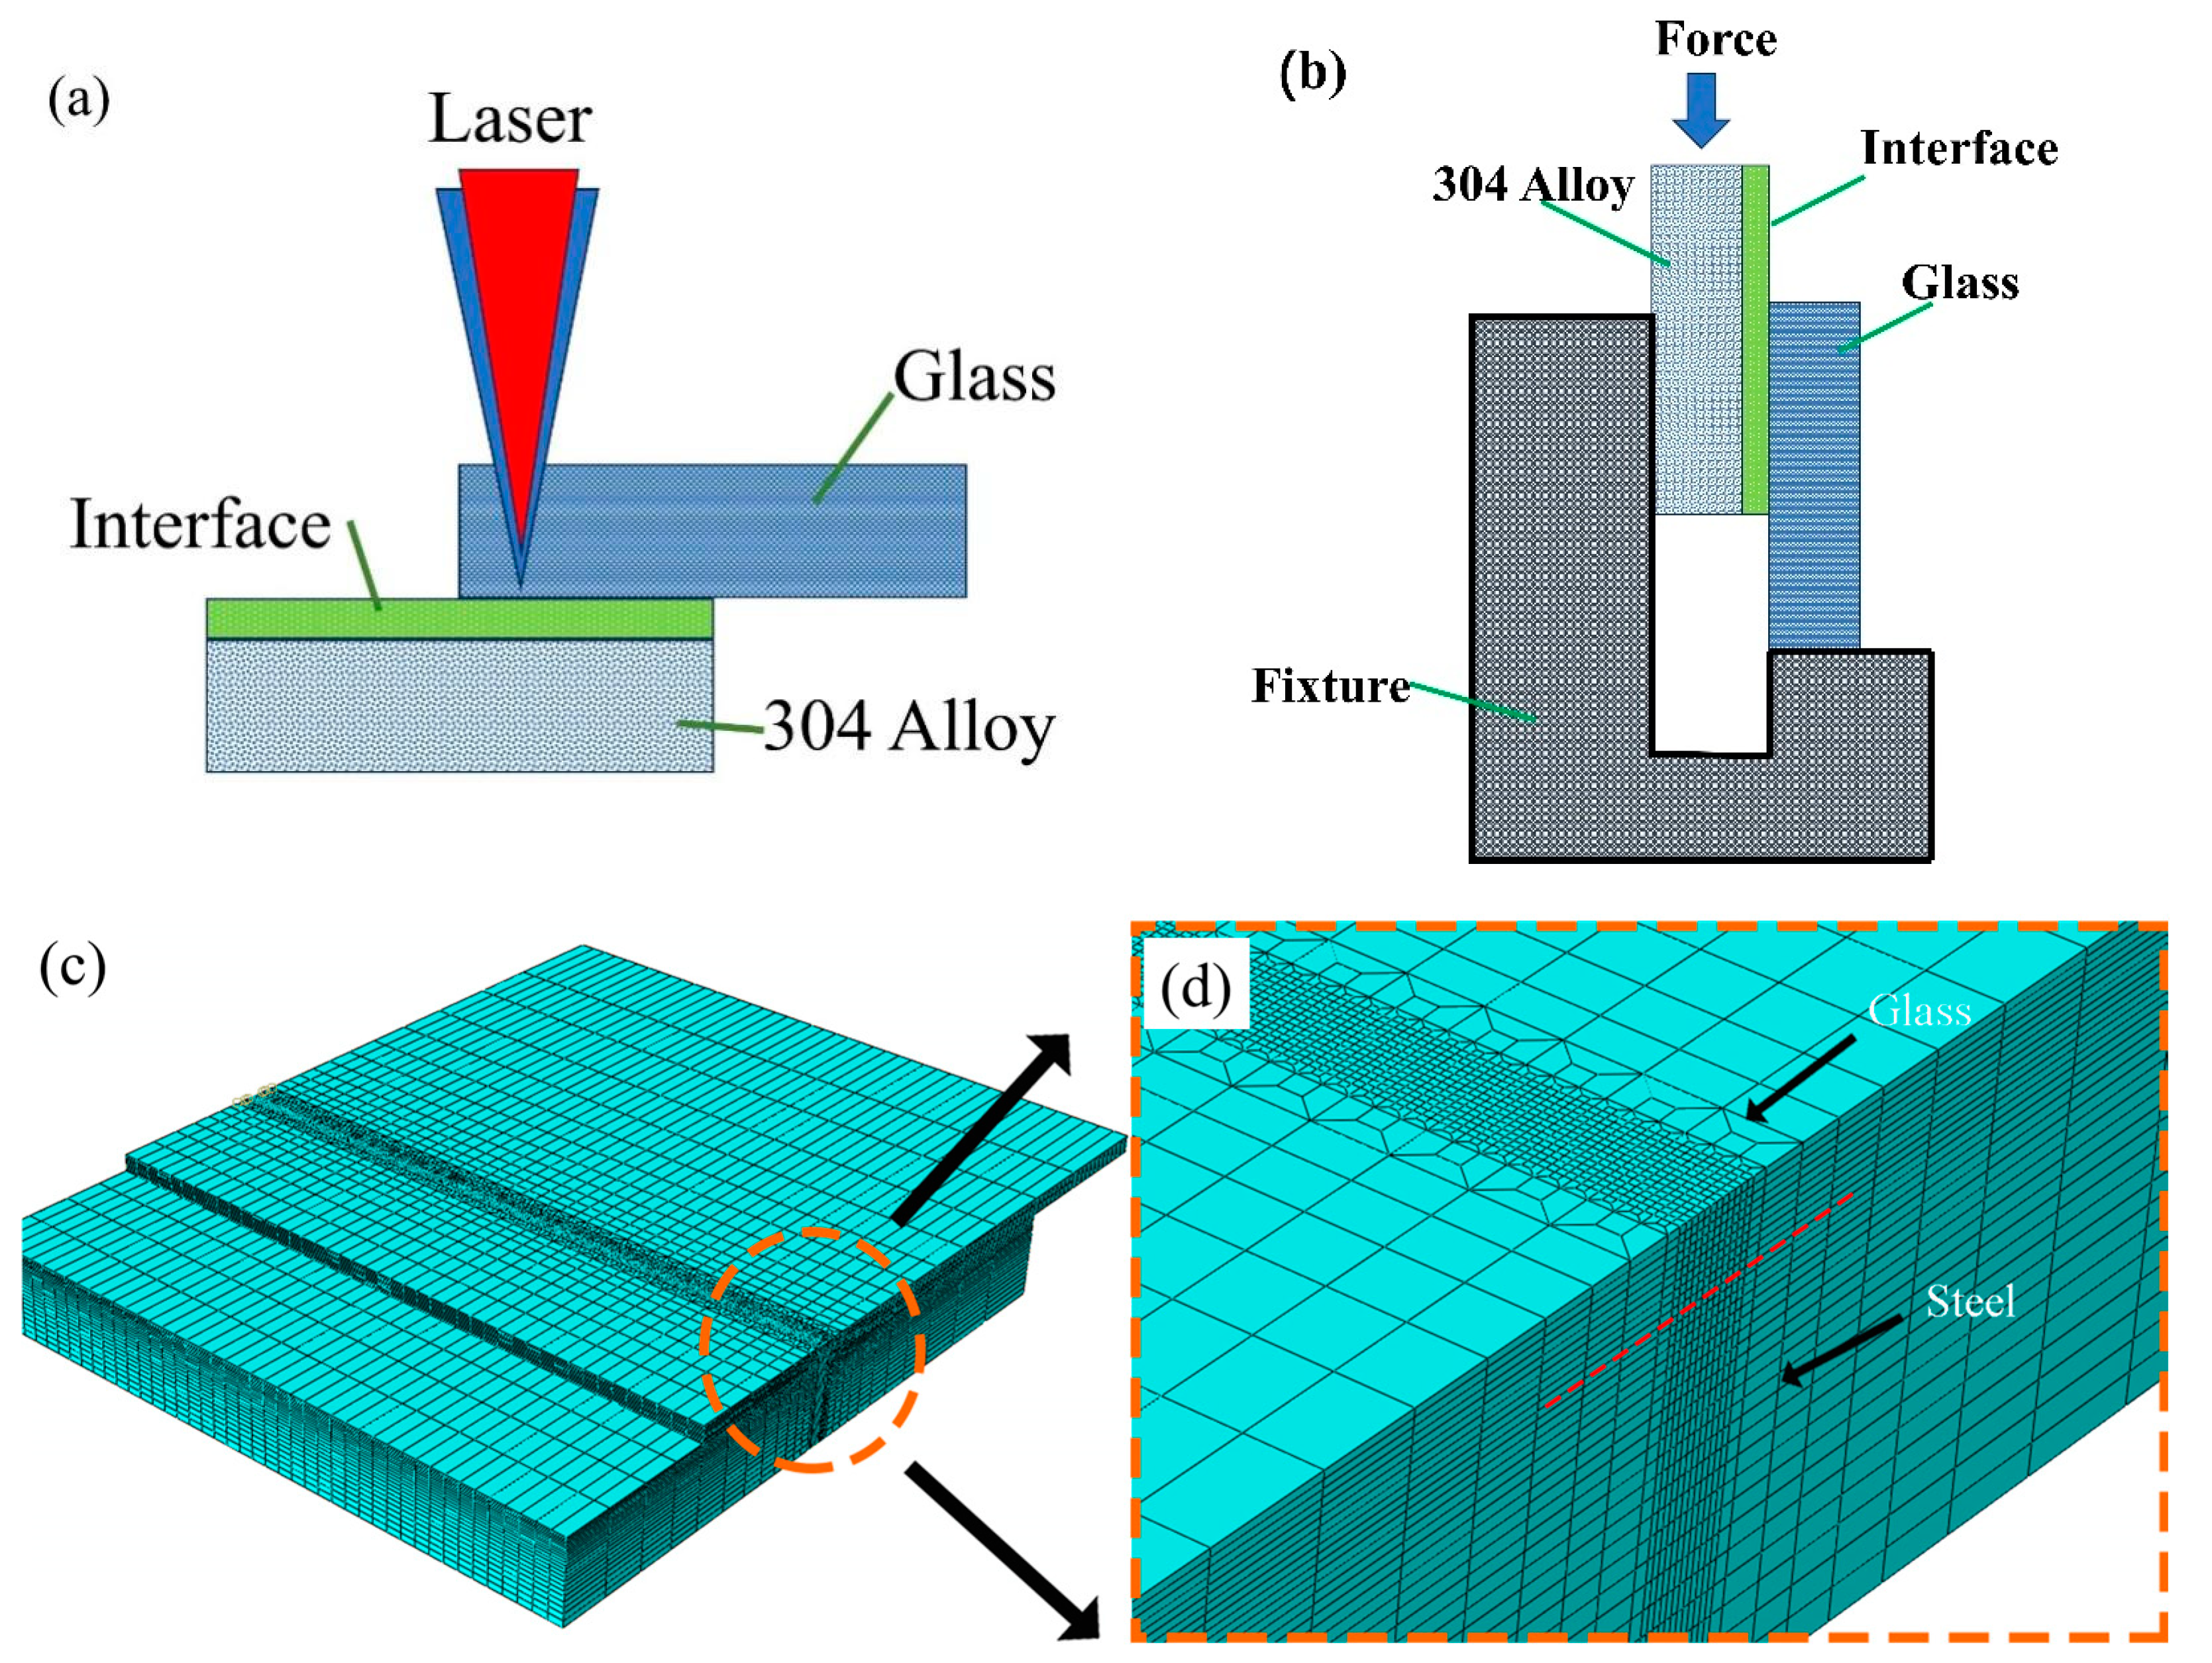
2.5. Numerical Modeling

Based on the fundamental physical principles governing heat transfer and thermal stress generated between the glass and alloy, a three-dimensional time-dependent numerical model was developed to simulate the temperature and thermal stress generated during laser welding. Numerical simulation was performed using the Abaqus platform.
Laser welding is a process of multi-physical field coupling, including complex thermodynamic problems. The visual characteristics of the molten pool cannot explain the dynamic behavior of the molten pool from the mechanism, and important temperature information is lost. The effects of temperature field and stress field on welding strength were investigated. The Gaussian heat source function was written in the Fortran language and loaded into the model via a DFLUX subroutine to realize the numerical simulation of glass and metal laser welding. A three-in-one meshing method refined the mesh of the weld area and simplified the mesh of the non-main action area, conducive to improving the running speed of the finite element analysis software. The three-dimensional finite element model after meshing is shown in Figure 1c. The grid type of the temperature field was heat transfer, the grid shape was a hexahedral grid, and the number of grids was 238,502. The stress field mesh was consistent with the temperature field mesh, and only the mesh type was changed to 3D stress. The finite element model is shown in Figure 1c. Due to the large difference between the action time and the cooling time of the millisecond pulse laser, the same incremental step could not be used, greatly affecting the calculation speed. To improve the calculation speed, the incremental step when the laser was applied was fixed at 0.0001, and the incremental step when the laser was closed was fixed at 0.01.

3. Results and Discussion

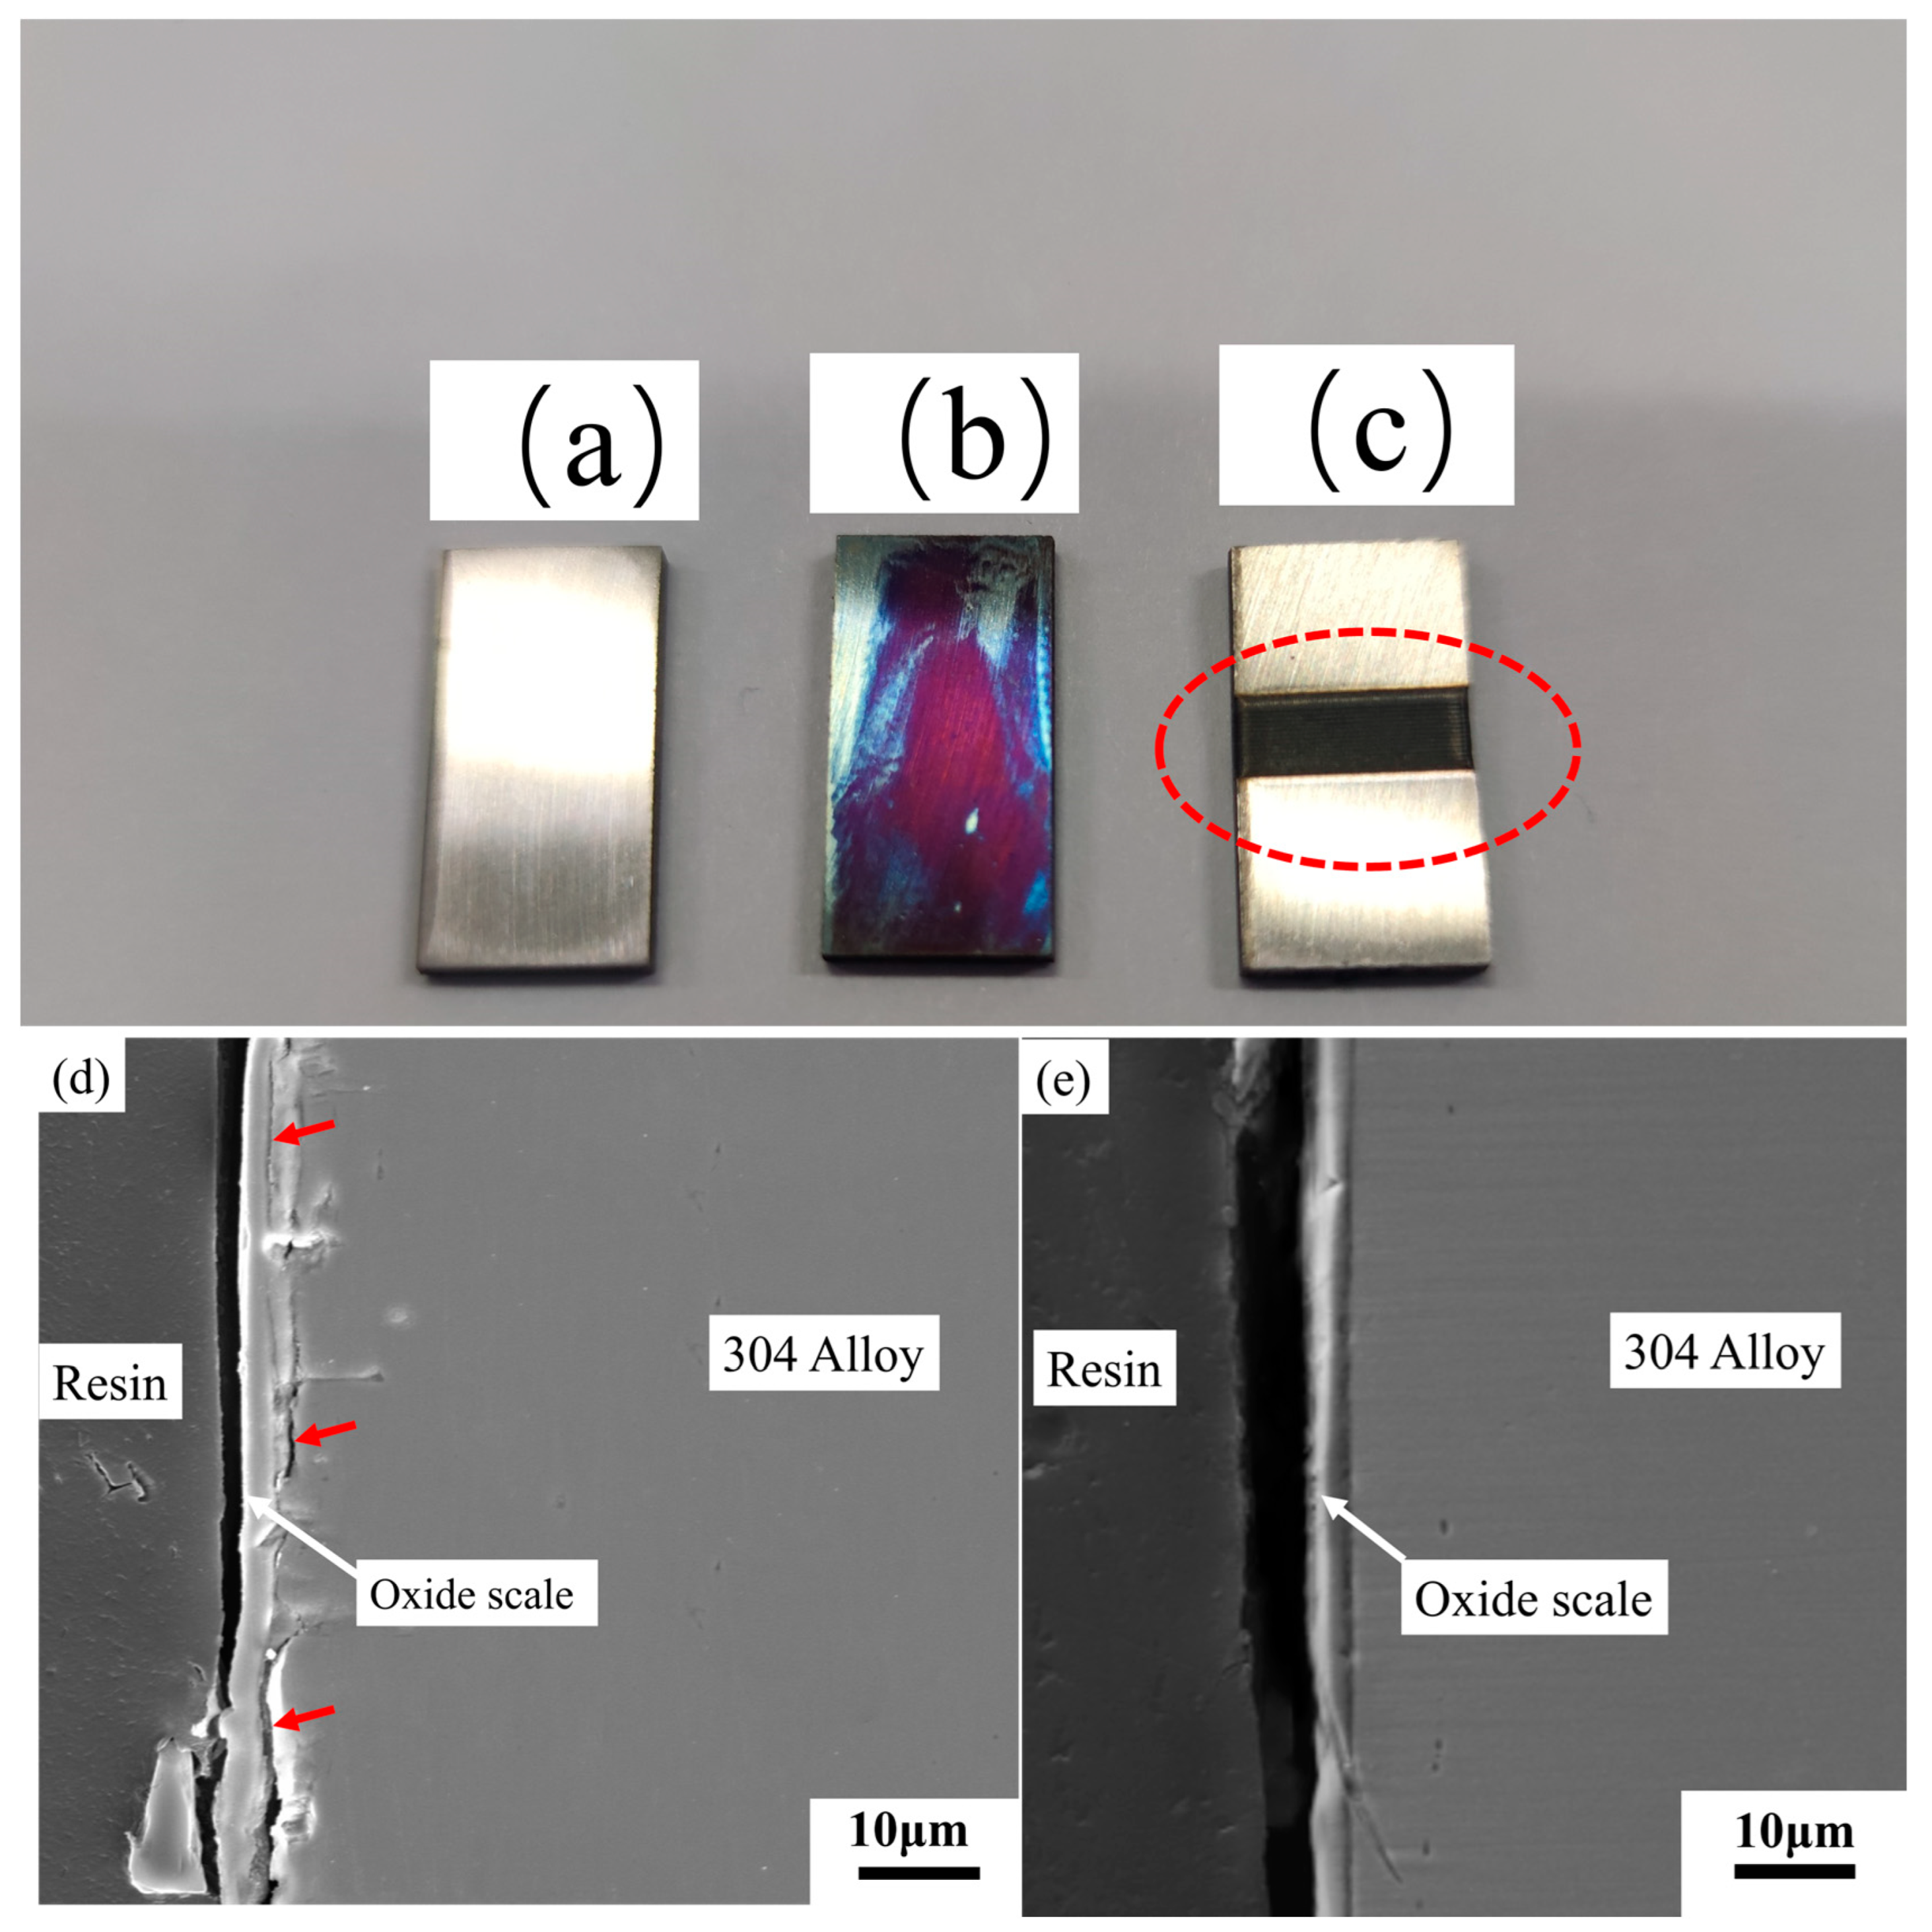
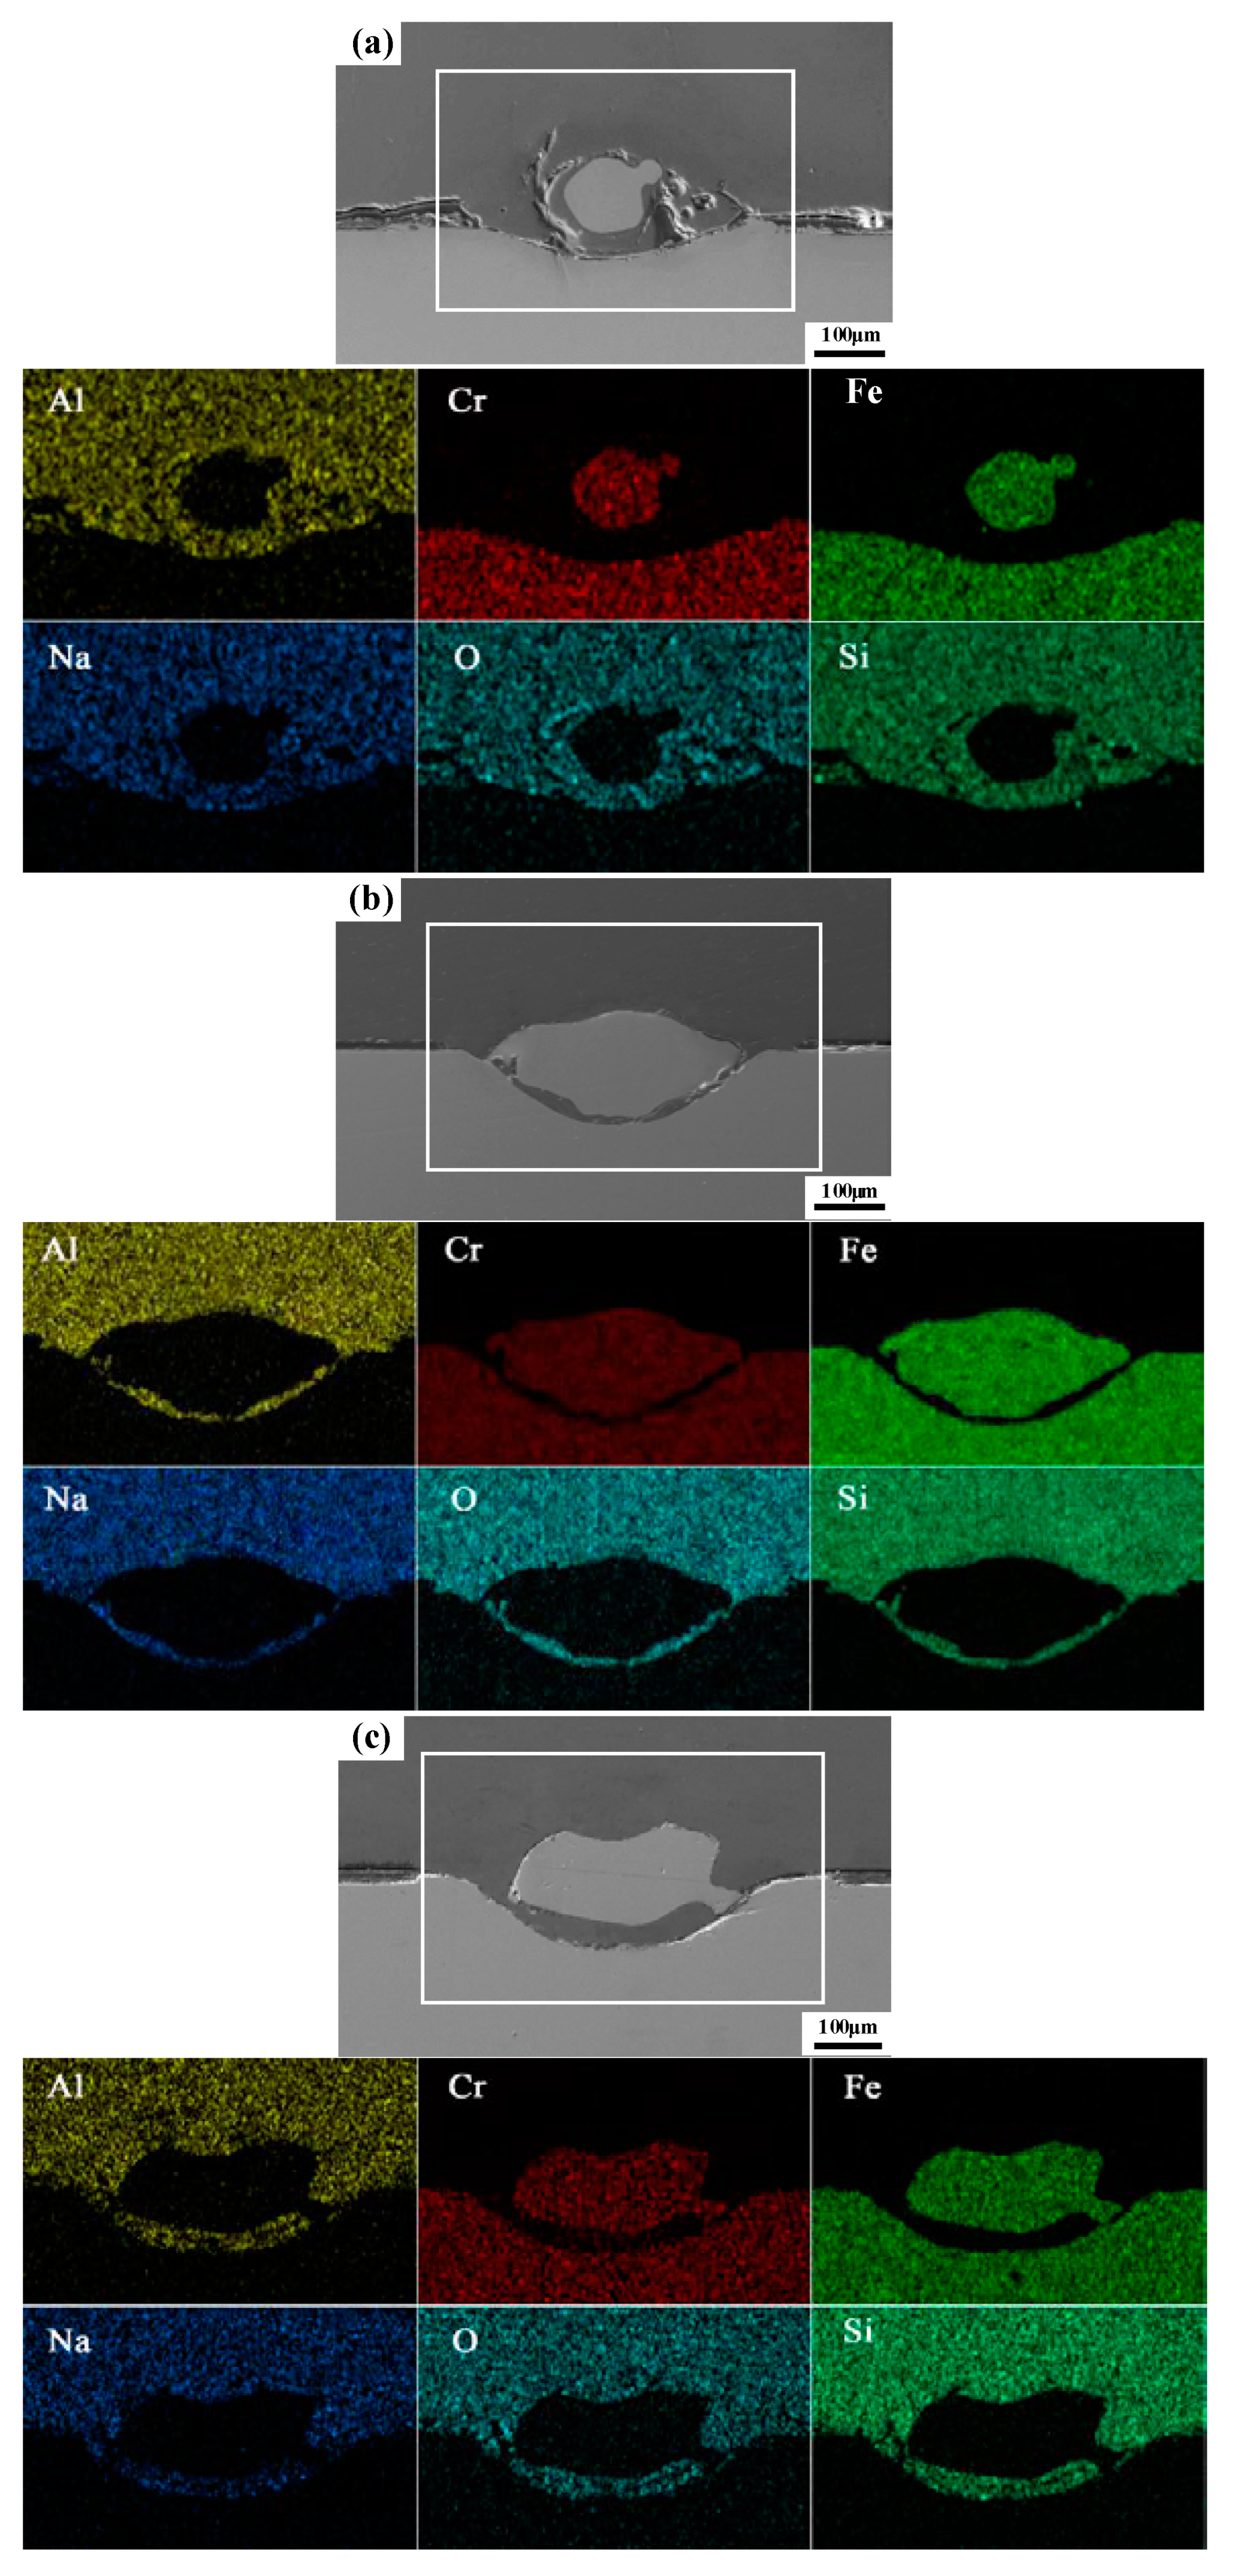
3.1. Cross-Section of Oxide Scale

The cross-sections of the oxide scale for the pre-oxidation-treated sample and laser surface melted sample are shown in Figure 2. In Figure 2a, the oxide scale is not dense, and some cracks can be clearly seen. These cracks are caused by the different thermal expansions between the metal and oxide scale. In Figure 2, some cracks are present between the oxidation layer and the substrate, as indicated by red arrows. This phenomenon further confirms that the oxidation layer formed during pre-oxidation treatment can lead to low density and some cracks. Moreover, the oxide scale thickness is unevenly distributed. In contrast, the laser surface melted sample is dense and distributed evenly (Figure 2b). Moreover, no obvious crack can be seen via the magnification. The crack not formed during laser surface melted treatment may generate good results for the following laser sealing process.

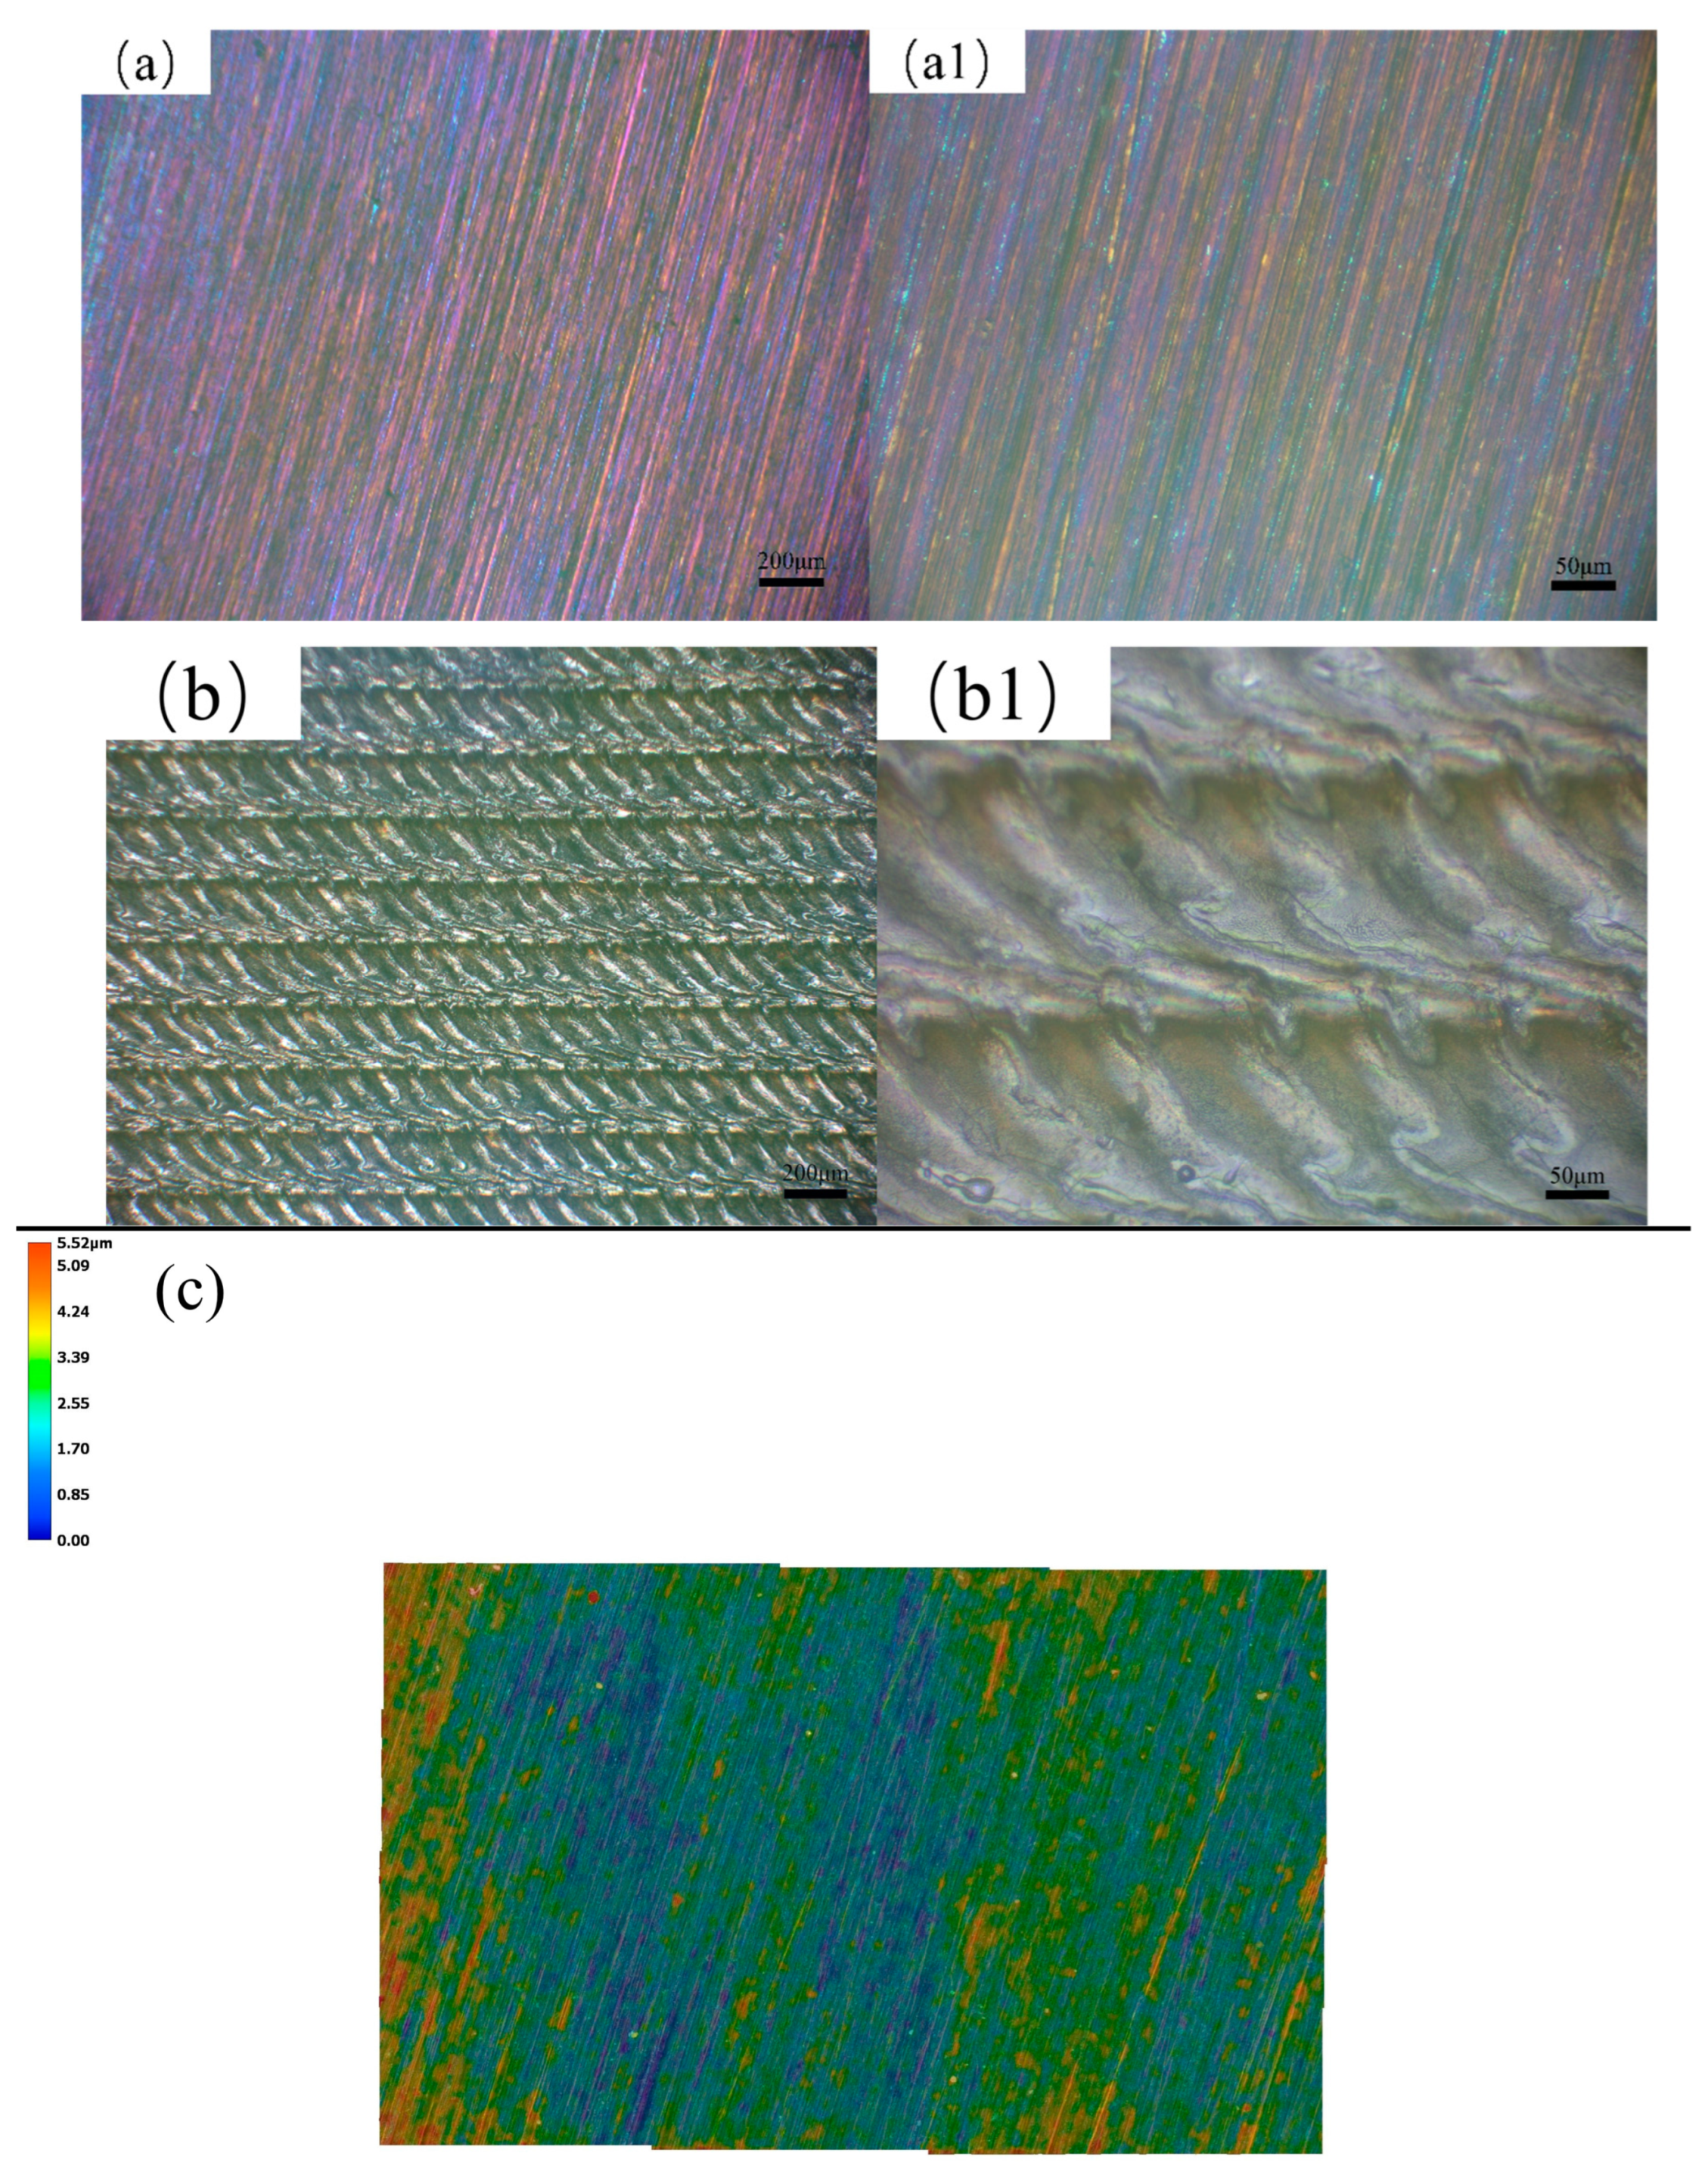
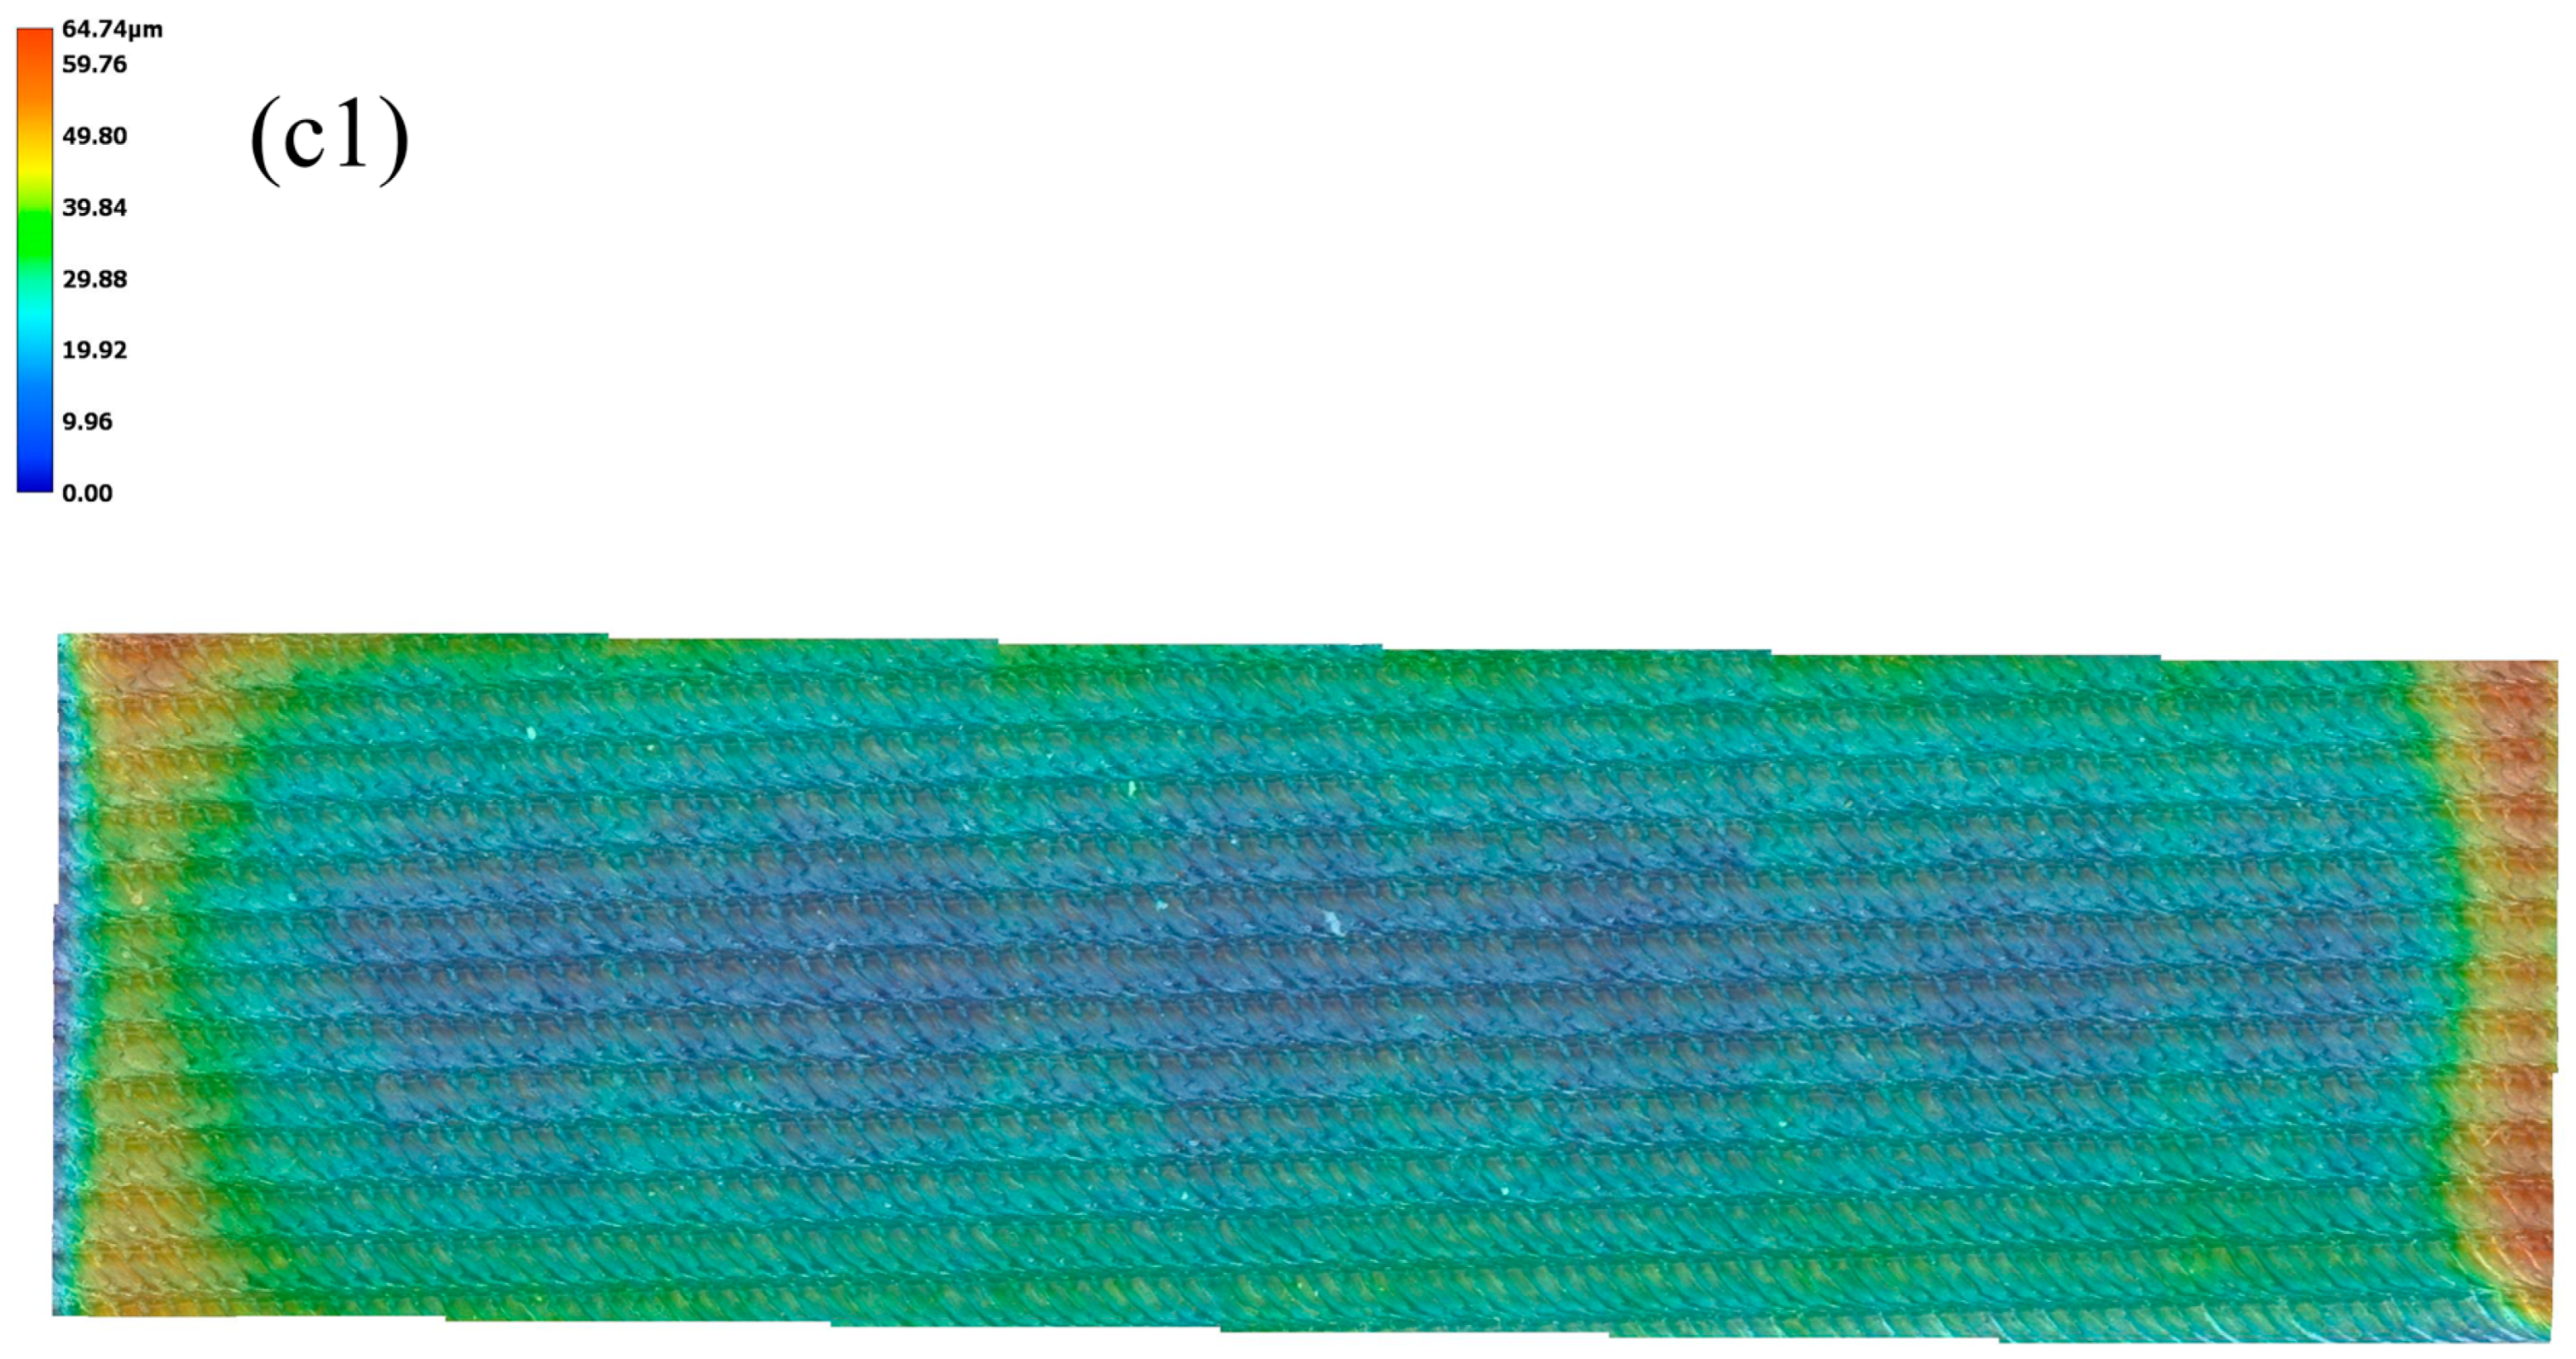
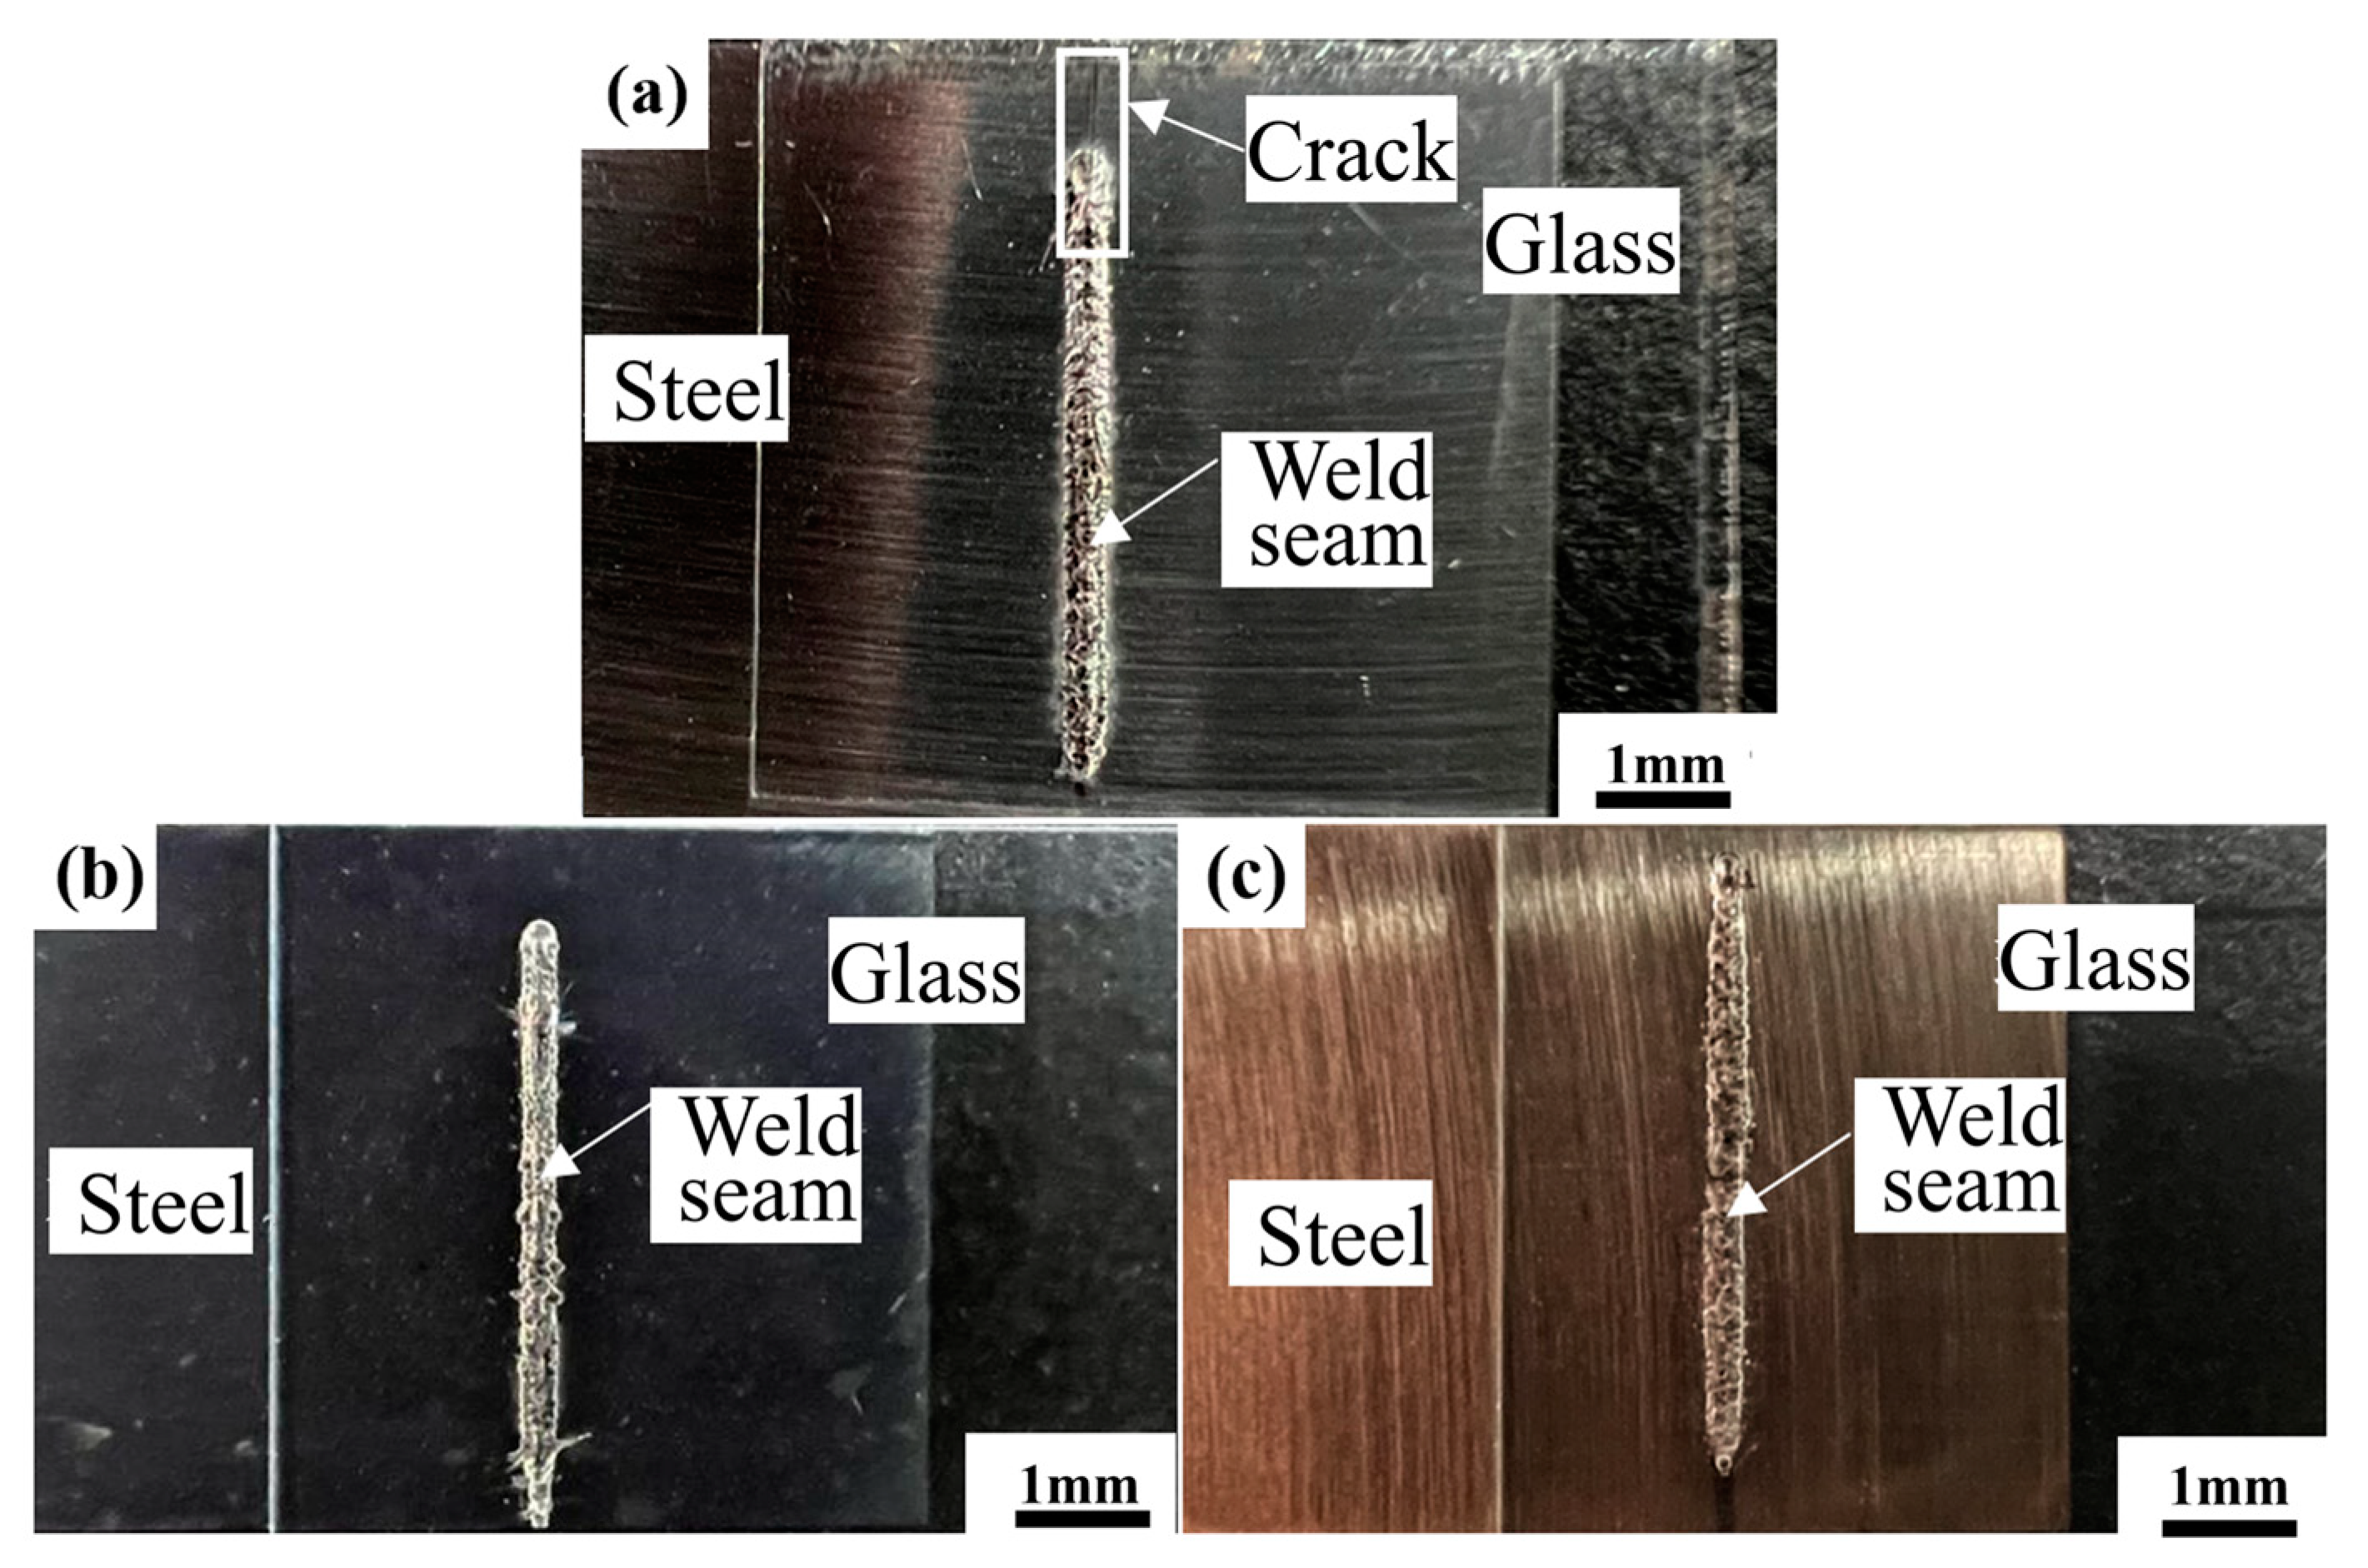
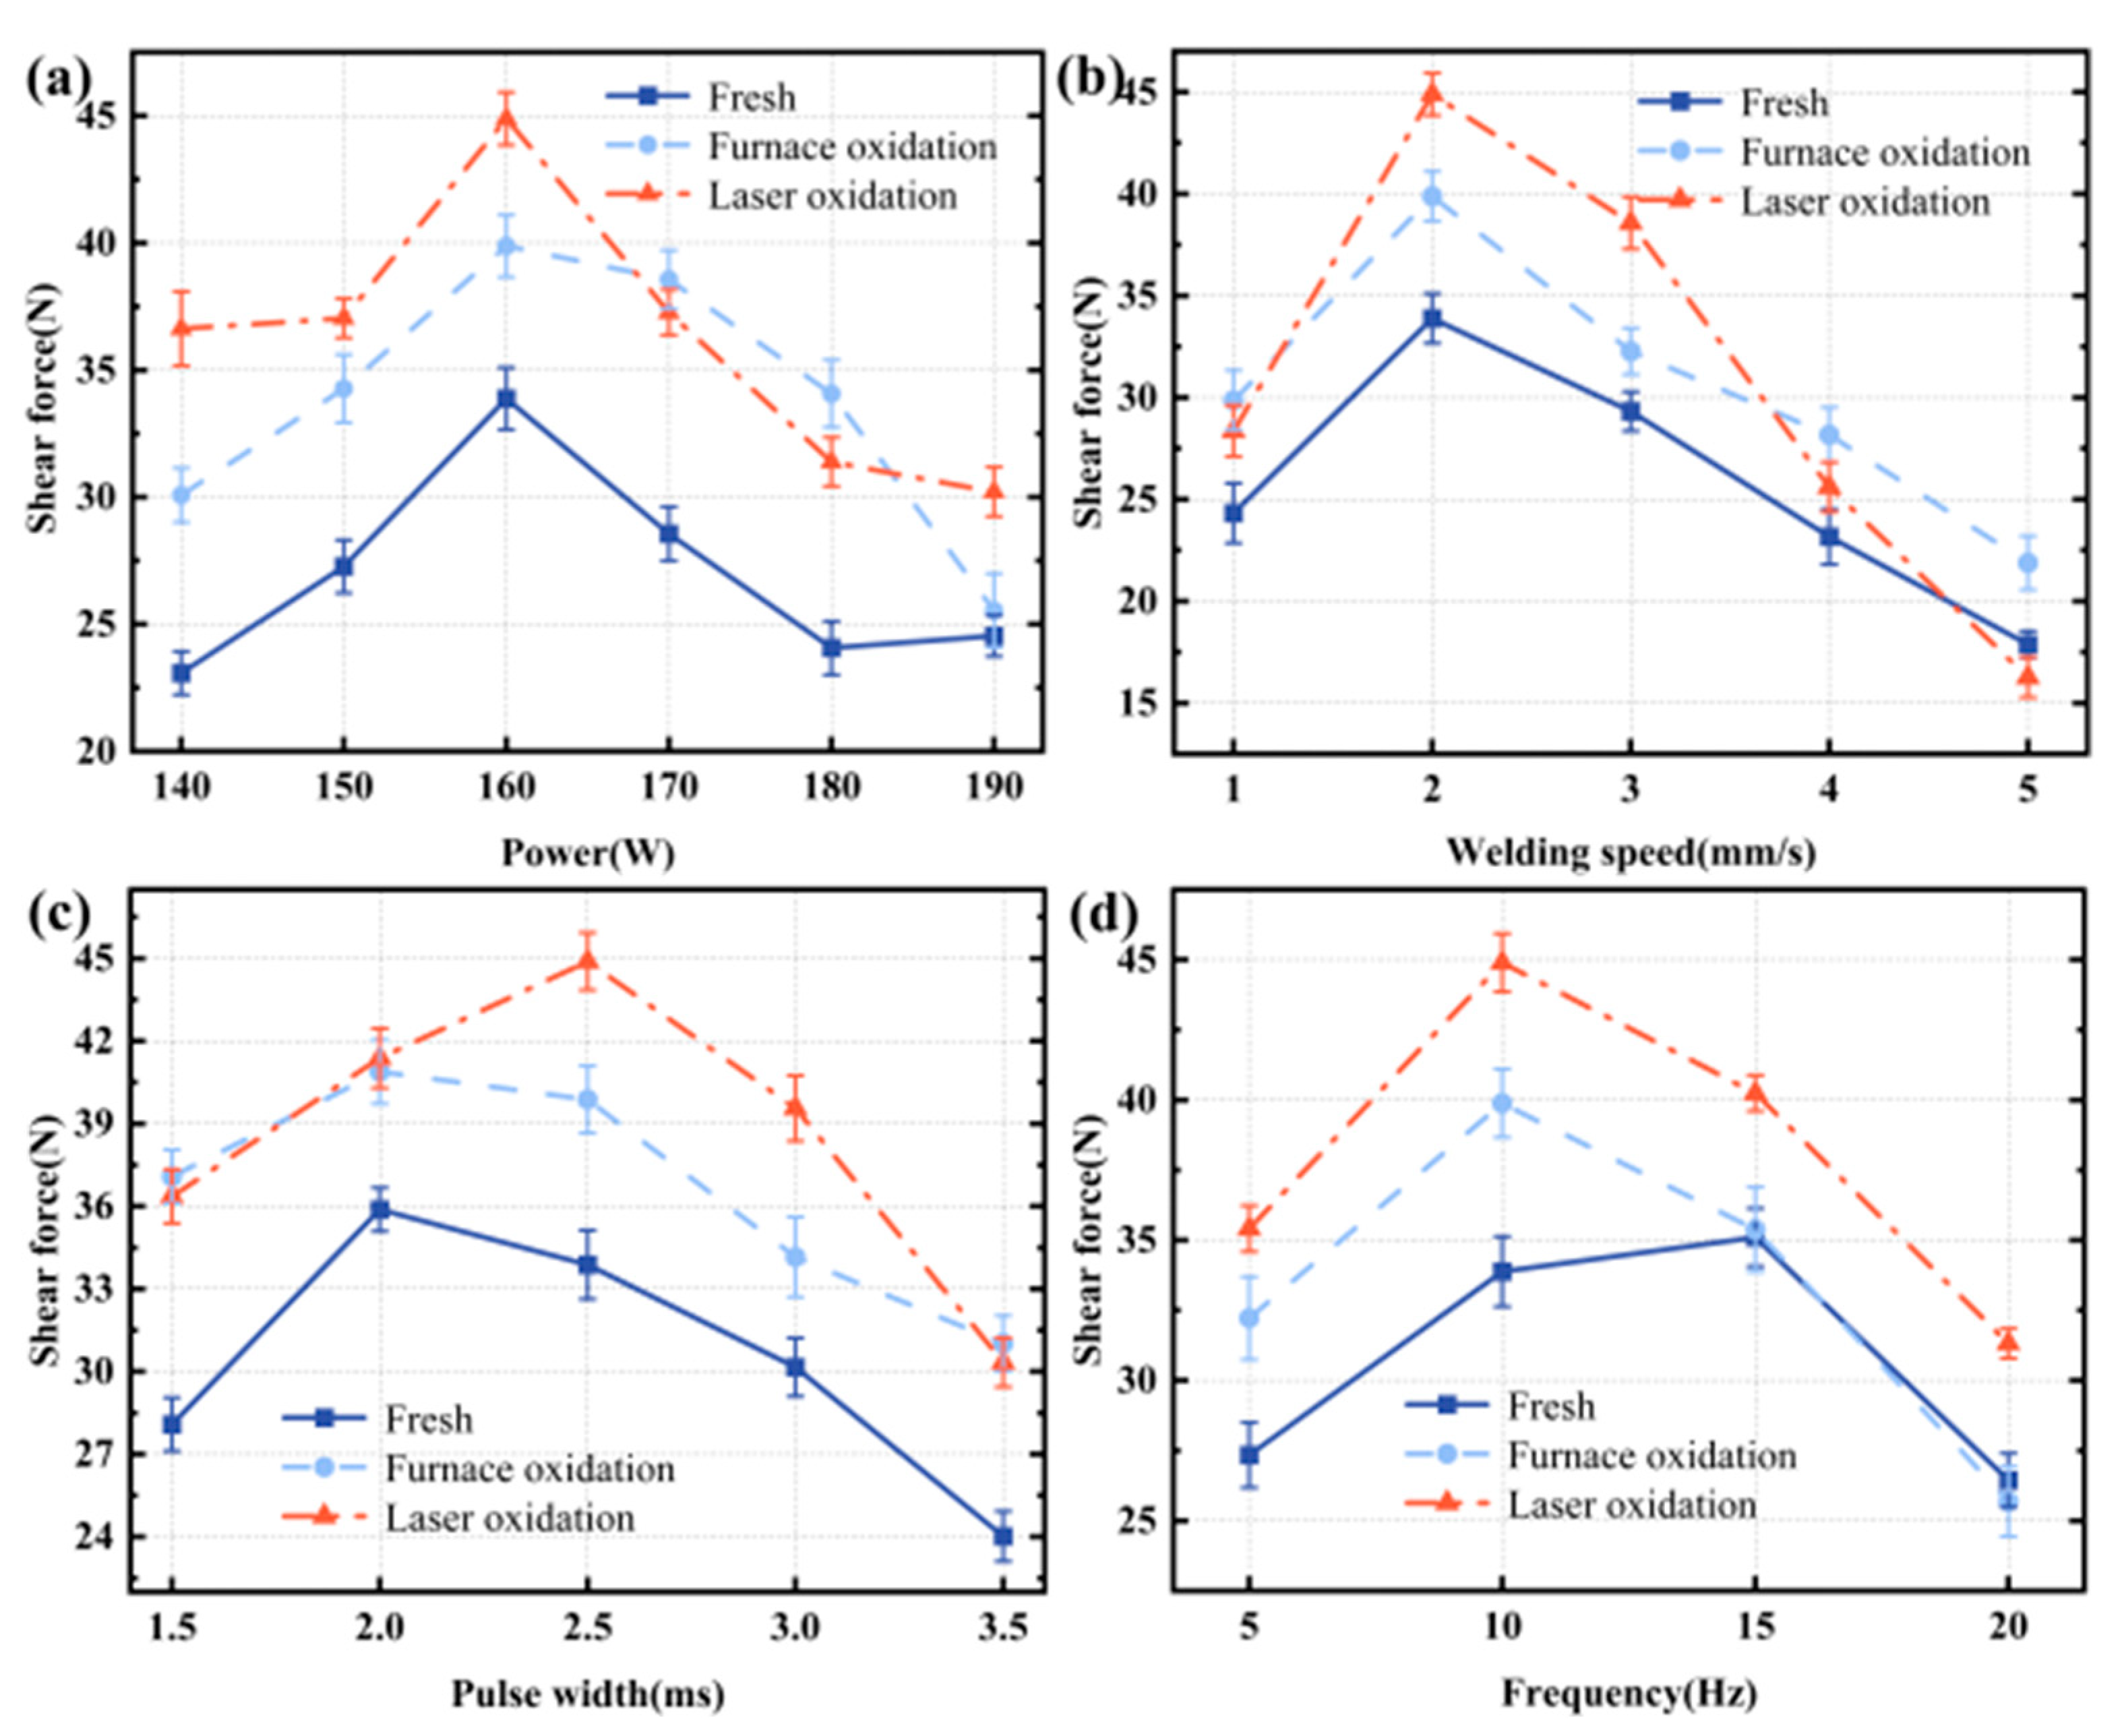
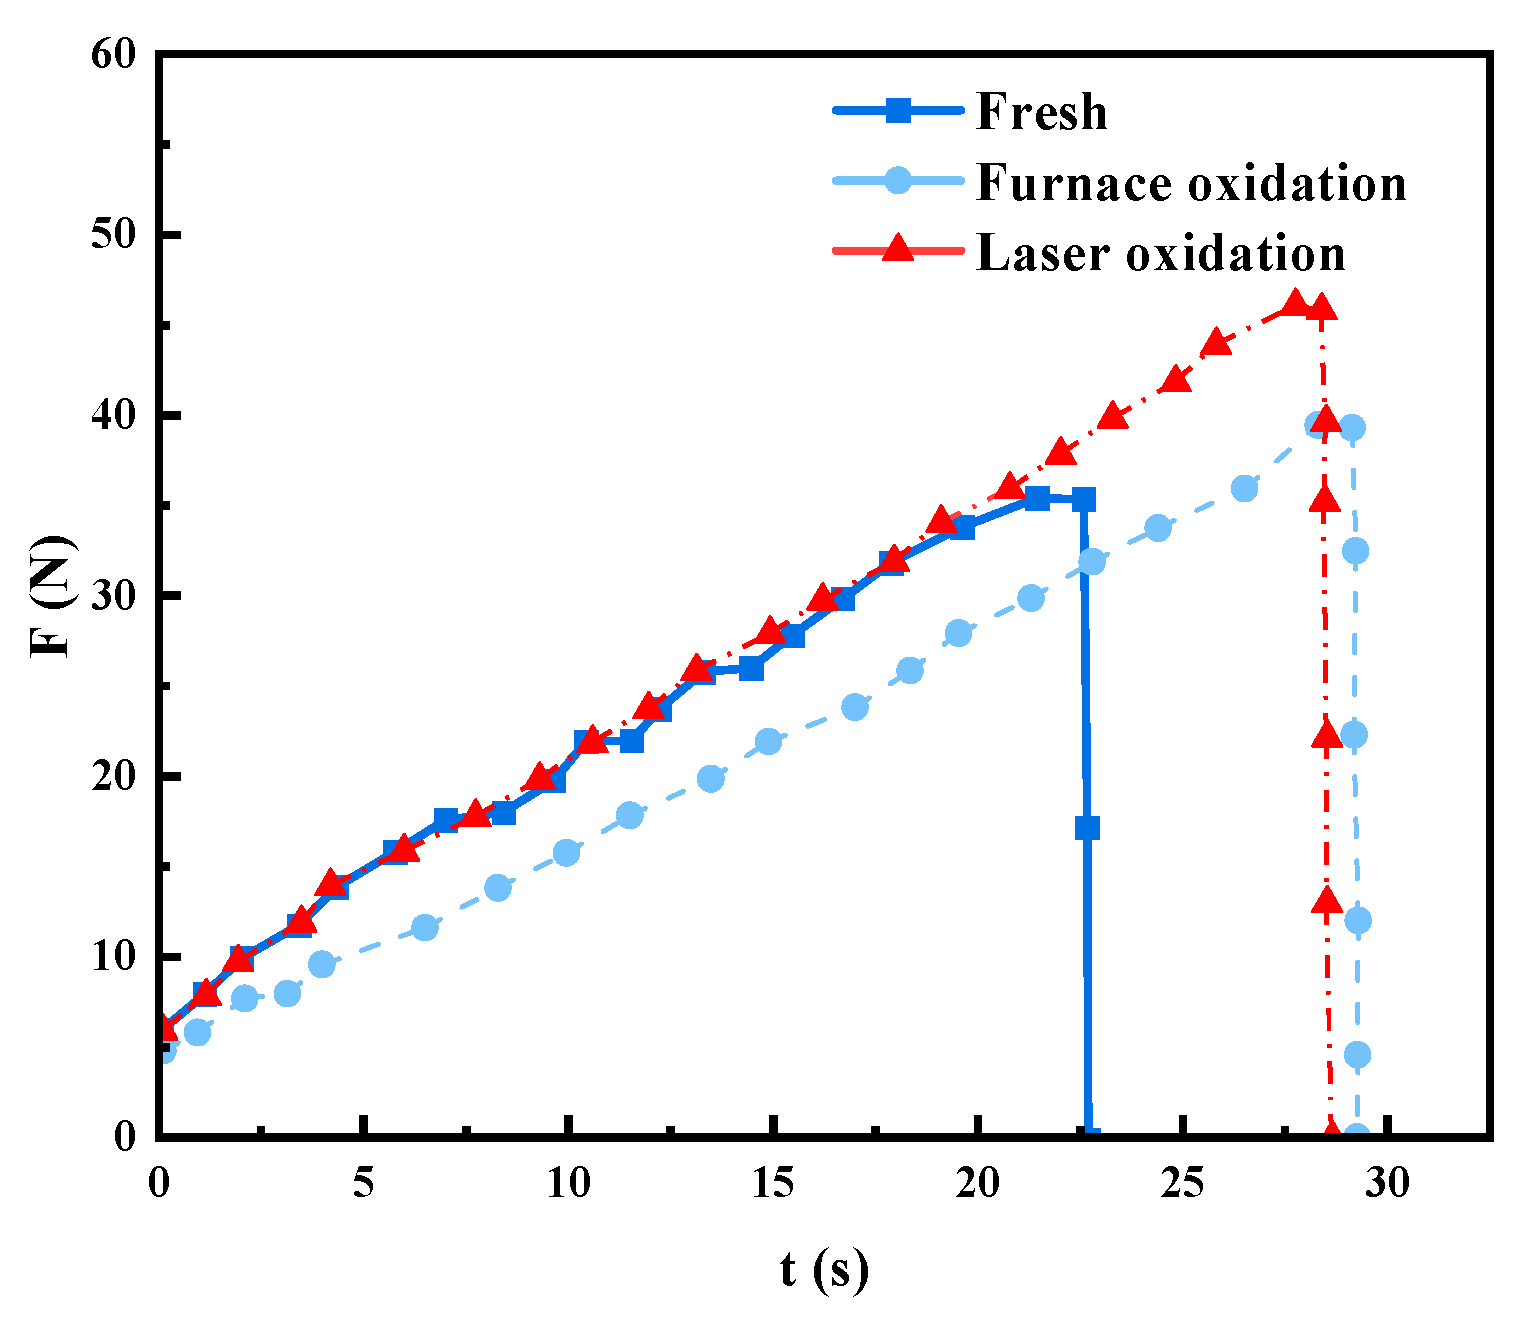
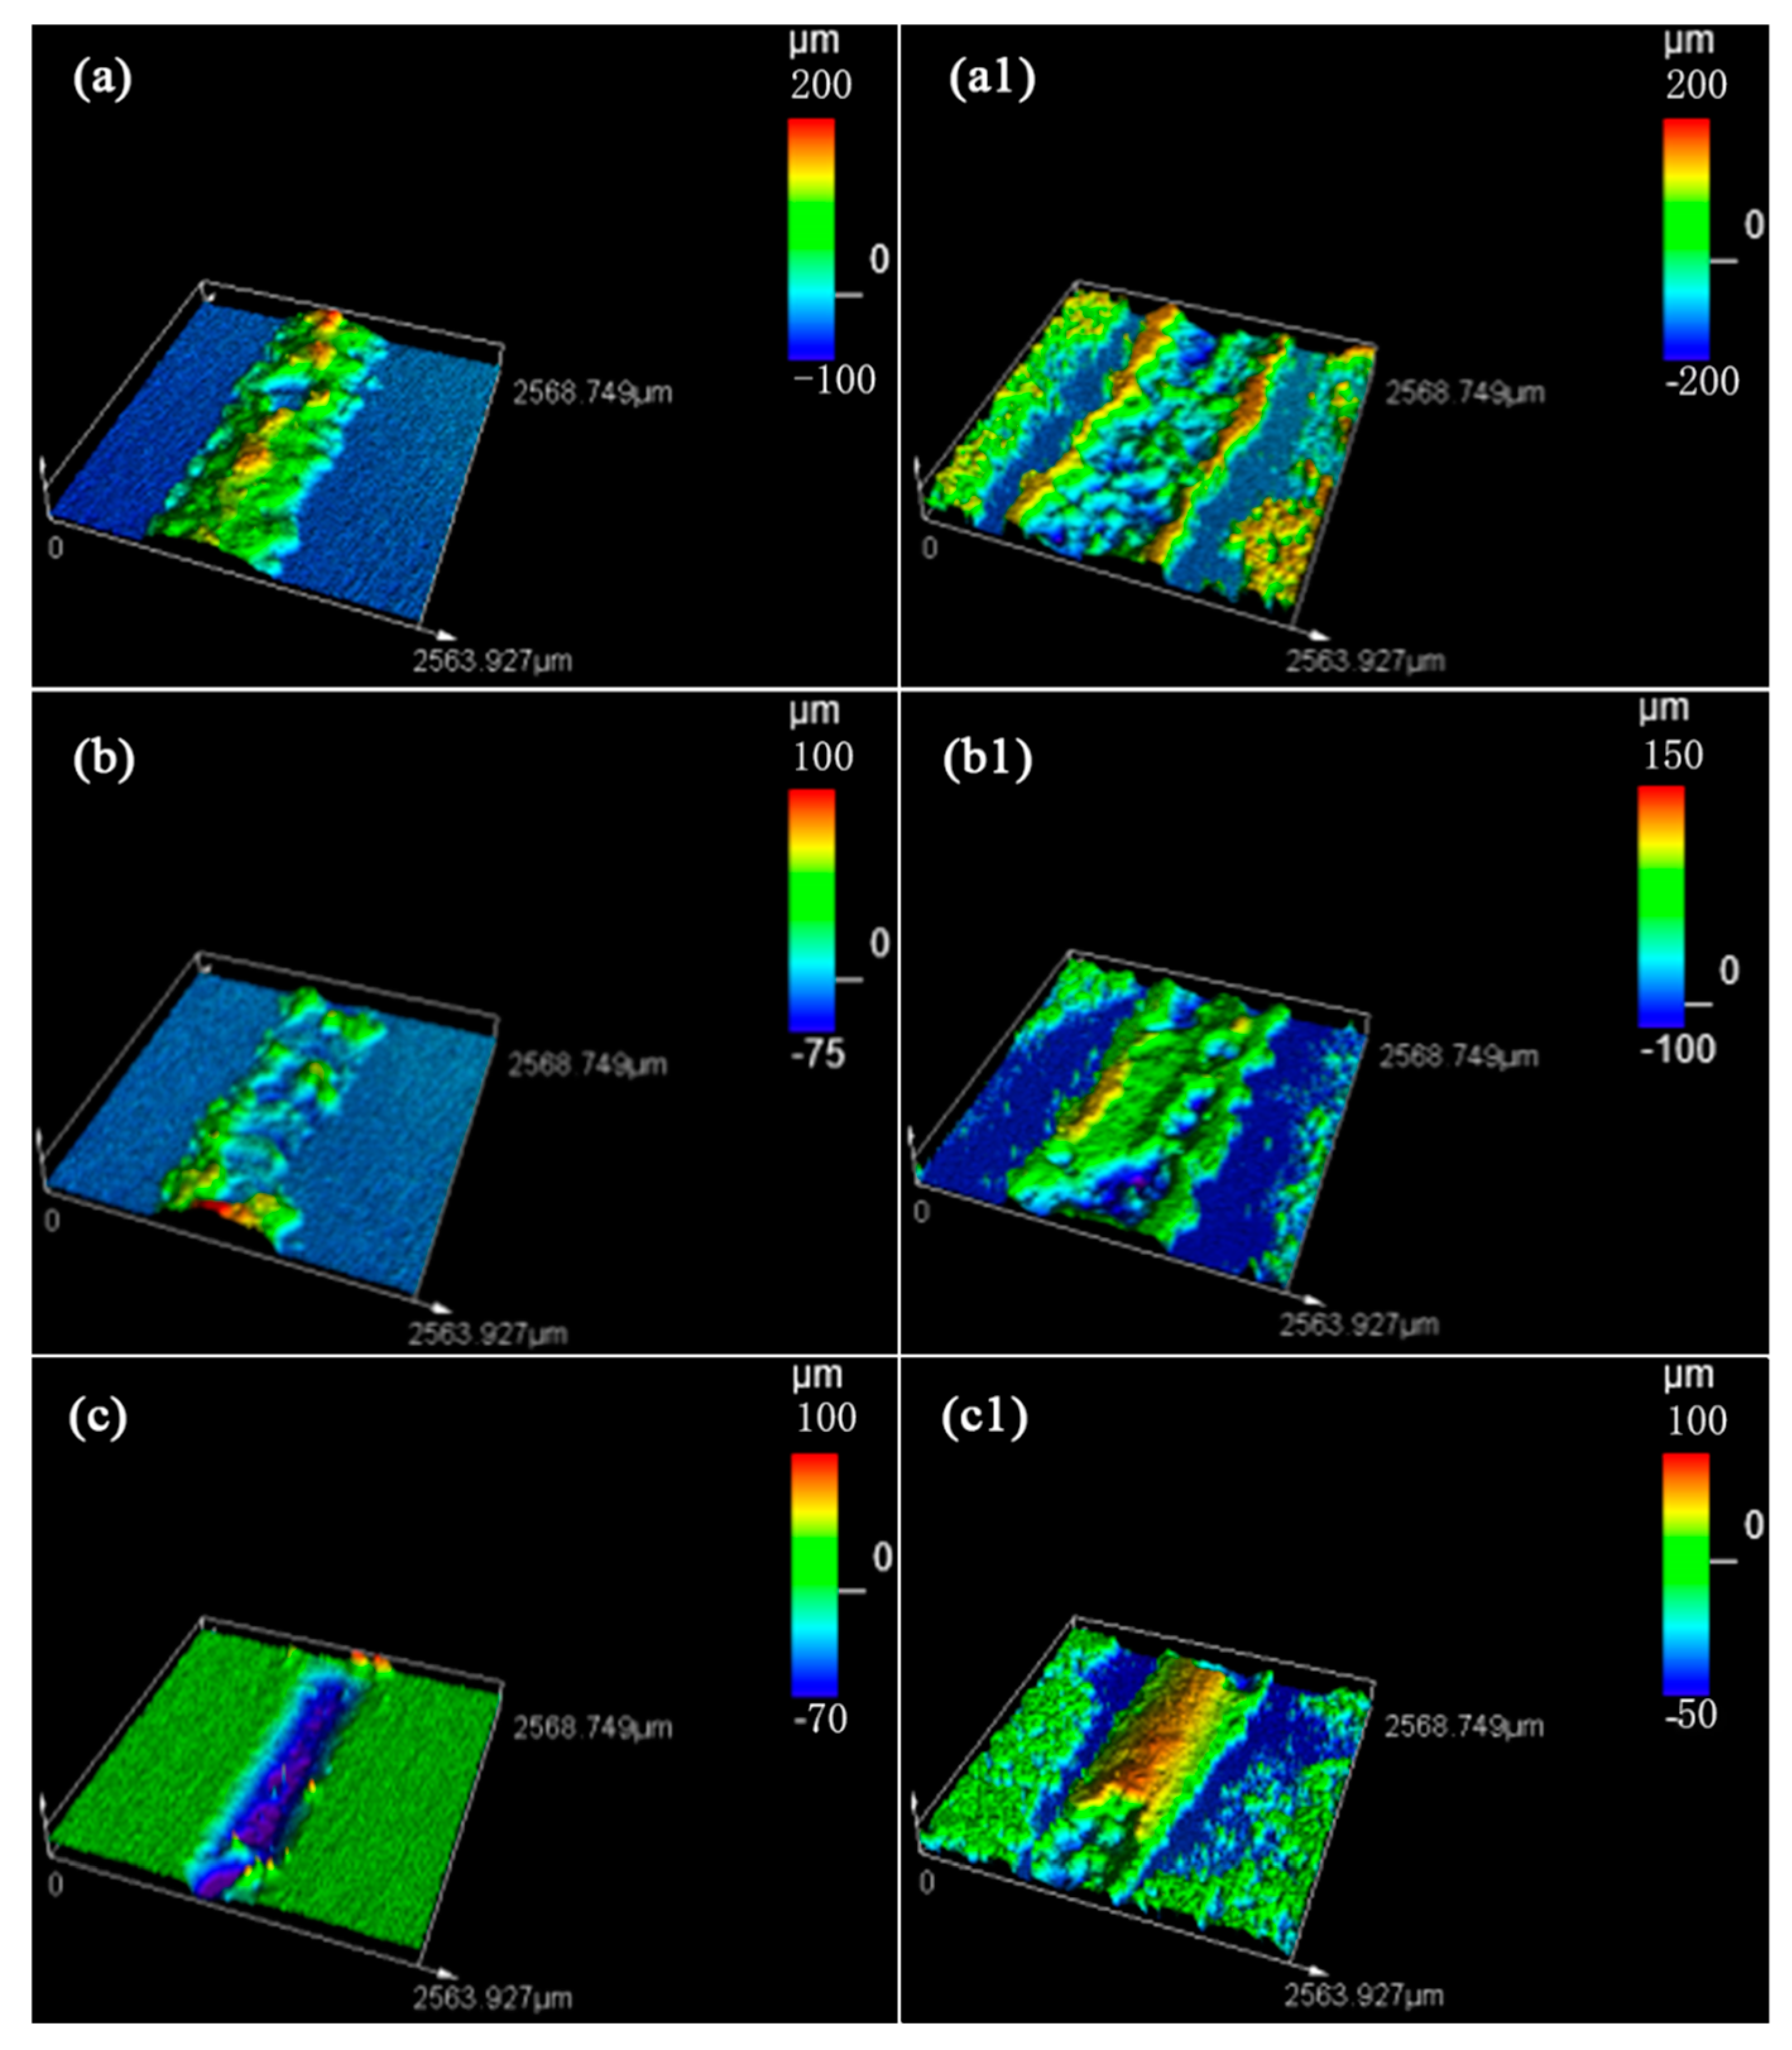
3.2. Effect of Different Alloy Surface Conditions

Figure 3 demonstrates the surface appearance of the sample under different surface conditions. After milling and polishing, the sample surface shows brightly colored parallel and shallow scratches. As shown in Figure 3a,a1 under different magnifications after surface pre-oxidation, there are still parallel and shallow scratches, with tinged yellow color on the sample surface. This is formed by the reaction with oxygen during pre-oxidation treatment. After laser surface melting, the surface illustrates quite different surface characteristics compared with Figure 3a,a1. Here, it shows periodic craters and bulges. Moreover, the bulges are almost connected to parallel lines, as shown in Figure 3b,b1 under different magnification. When revealed via 3D surface morphology, the surface roughness values are 2.55 and 64.74 μm for the pre-oxidation and laser surface melted samples, as shown in Figure 3c,c1.
Previous papers reported the surface treatment of Kovar through the wetting and spreading of glass on metal [6,14]. The results demonstrated that wetting properties formed via laser surface-induced oxidation were better than those from surface pre-oxidation in a high-temperature furnace. After laser surface-induced oxidation, the layer had a dense scale without peeling off. Moreover, the laser surface-treated layer has fine grains, which are in turn favorable to diffusion. After laser surface treatment, the layer has a smaller wetting angle and thicker interfacial reaction layer. Thus, better glass-to-metal sealings can be obtained after laser surface treatment. Laser sealing experiments are performed for different surface treatment stainless steel samples, and we measure the sealing strength to observe the surface morphology. The surface sealing seam morphology after laser sealing is shown in Figure 3. In Figure 3, it can be seen that there are almost no obvious differences. However, the sealing seam surface contains a crack. The crack is very fine and cannot be seen clearly. The sealing strengths under different surface treatments are shown in Figure 4.
Figure 4 shows the weld seam surface under different alloy surface-treated conditions. Moreover, there are no obvious differences in surface morphologies. However, there is a crack on the weld seam surface for the unoxidized alloy. The crack is fine and not easily observed. Figure 5 shows the sealing force under different alloy surface treatments.
In Figure 5, it can be seen that, after laser surface treatment, the sealing force is higher than for that treated under furnace pre-oxidation treatment. The shear force achieves a maximum value when laser processing parameters are kept at P = 160 W, v = 2 mm/s, and f = 10 Hz. Moreover, the maximum shear force for pre-oxidation treatment samples is achieved with a laser pulse width of pw = 2 ms. Moreover, both situations have similar change trends for the shear force variation. Further, the shear force results are consistent with previous studies’ wetting results [6,14]. When the laser processing parameters are P = 160 W, v = 2 mm/s, and f = 10 Hz, the shear force between laser surface treatment, pre-oxidation treatment, and untreated samples varies with time, as shown in Figure 6.
After sealing strength tests, the maximum sealing strength can be achieved for steel treated via laser surface oxidation treatment, while the minimum strength is obtained for nontreated steel. Surface fracture morphology and a cross-section microscope were used, and the results are shown in Figure 7 and Figure 8.
After the sealing test, the fracture surface is observed (the samples are fabricated under laser parameters of P = 160 W, f = 10 Hz, pw = 2.5 ms, and v = 2 mm/s). Figure 7a shows that the fracture surfaces of the sealings after the shear strength test for the nontreated steel have adhesion on only one side. Adhesion will peel off from the glass side to the steel side. This situation occurs due to the larger differences in the thermal expansion coefficients of high-alumina glass and 304 stainless steel, which cannot form a stable mosaic structure. After polishing, the steel has a mirror-like surface and has high reflectivity to light. Moreover, when laser acts on the steel surface, glass and steel cannot absorb enough laser energy to melt enough materials. In contrast, after surface oxidation, an oxidation scale is formed on the steel surface, and this surface oxidation scale can easily absorb laser light. It also has a higher reflectivity than untreated steel. There is adhesion on both the glass side and the steel side for glass-to-metal sealing subjected to high-temperature pre-oxidation and laser surface oxidation treatment, as shown in Figure 7b,c. Moreover, the adhesions did not break on the steel side. This means that the fracture position is located in the middle of the mosaic structure. The results are consistent with those of the previous sealing strength test. The sealing strength is very low for glass-to-metal sealing subjected to nontreatment.
To further study the effect of the surface oxide scale on glass-to-metal sealing, the cross-section of glass-to-metal sealing is illustrated in Figure 8. The metal particles undergo relatively smaller levels of surface oxidation treatment than that received by the untreated steel surface. Moreover, there is a fissure on the glass surface. This phenomenon is caused by the fact that there is not a tight bond in the glass-to-metal sealing in this situation. During polishing, a crack forms, so a stable sealing can be formed. The sealing seam depth is only about 40 μm for glass-to-steel sealing with a nontreated steel surface, as demonstrated in Figure 8a. It is well below the value of glass-to metal-sealing with surface oxidation treatment. The sealing seam depth is about 95 μm for glass-to-metal sealing with high-temperature pre-oxidation treatment, as illustrated in Figure 8b. The sealing seam depth is about 100 μm for glass-to-metal sealing for laser surface oxidation steel, as shown in Figure 8c. The cross-section of the glass-to-metal sealing seam shows no damage, and glass-to-metal sealing has a stable mosaic structure. At the same condition, laser surface oxidation-treated steel surface has a wider cooling solidification zone compared to the high-temperature pre-oxidation treatment sample. During laser sealing, molten glass is mixed intensively with molten steel, leading to a better sealing performance.

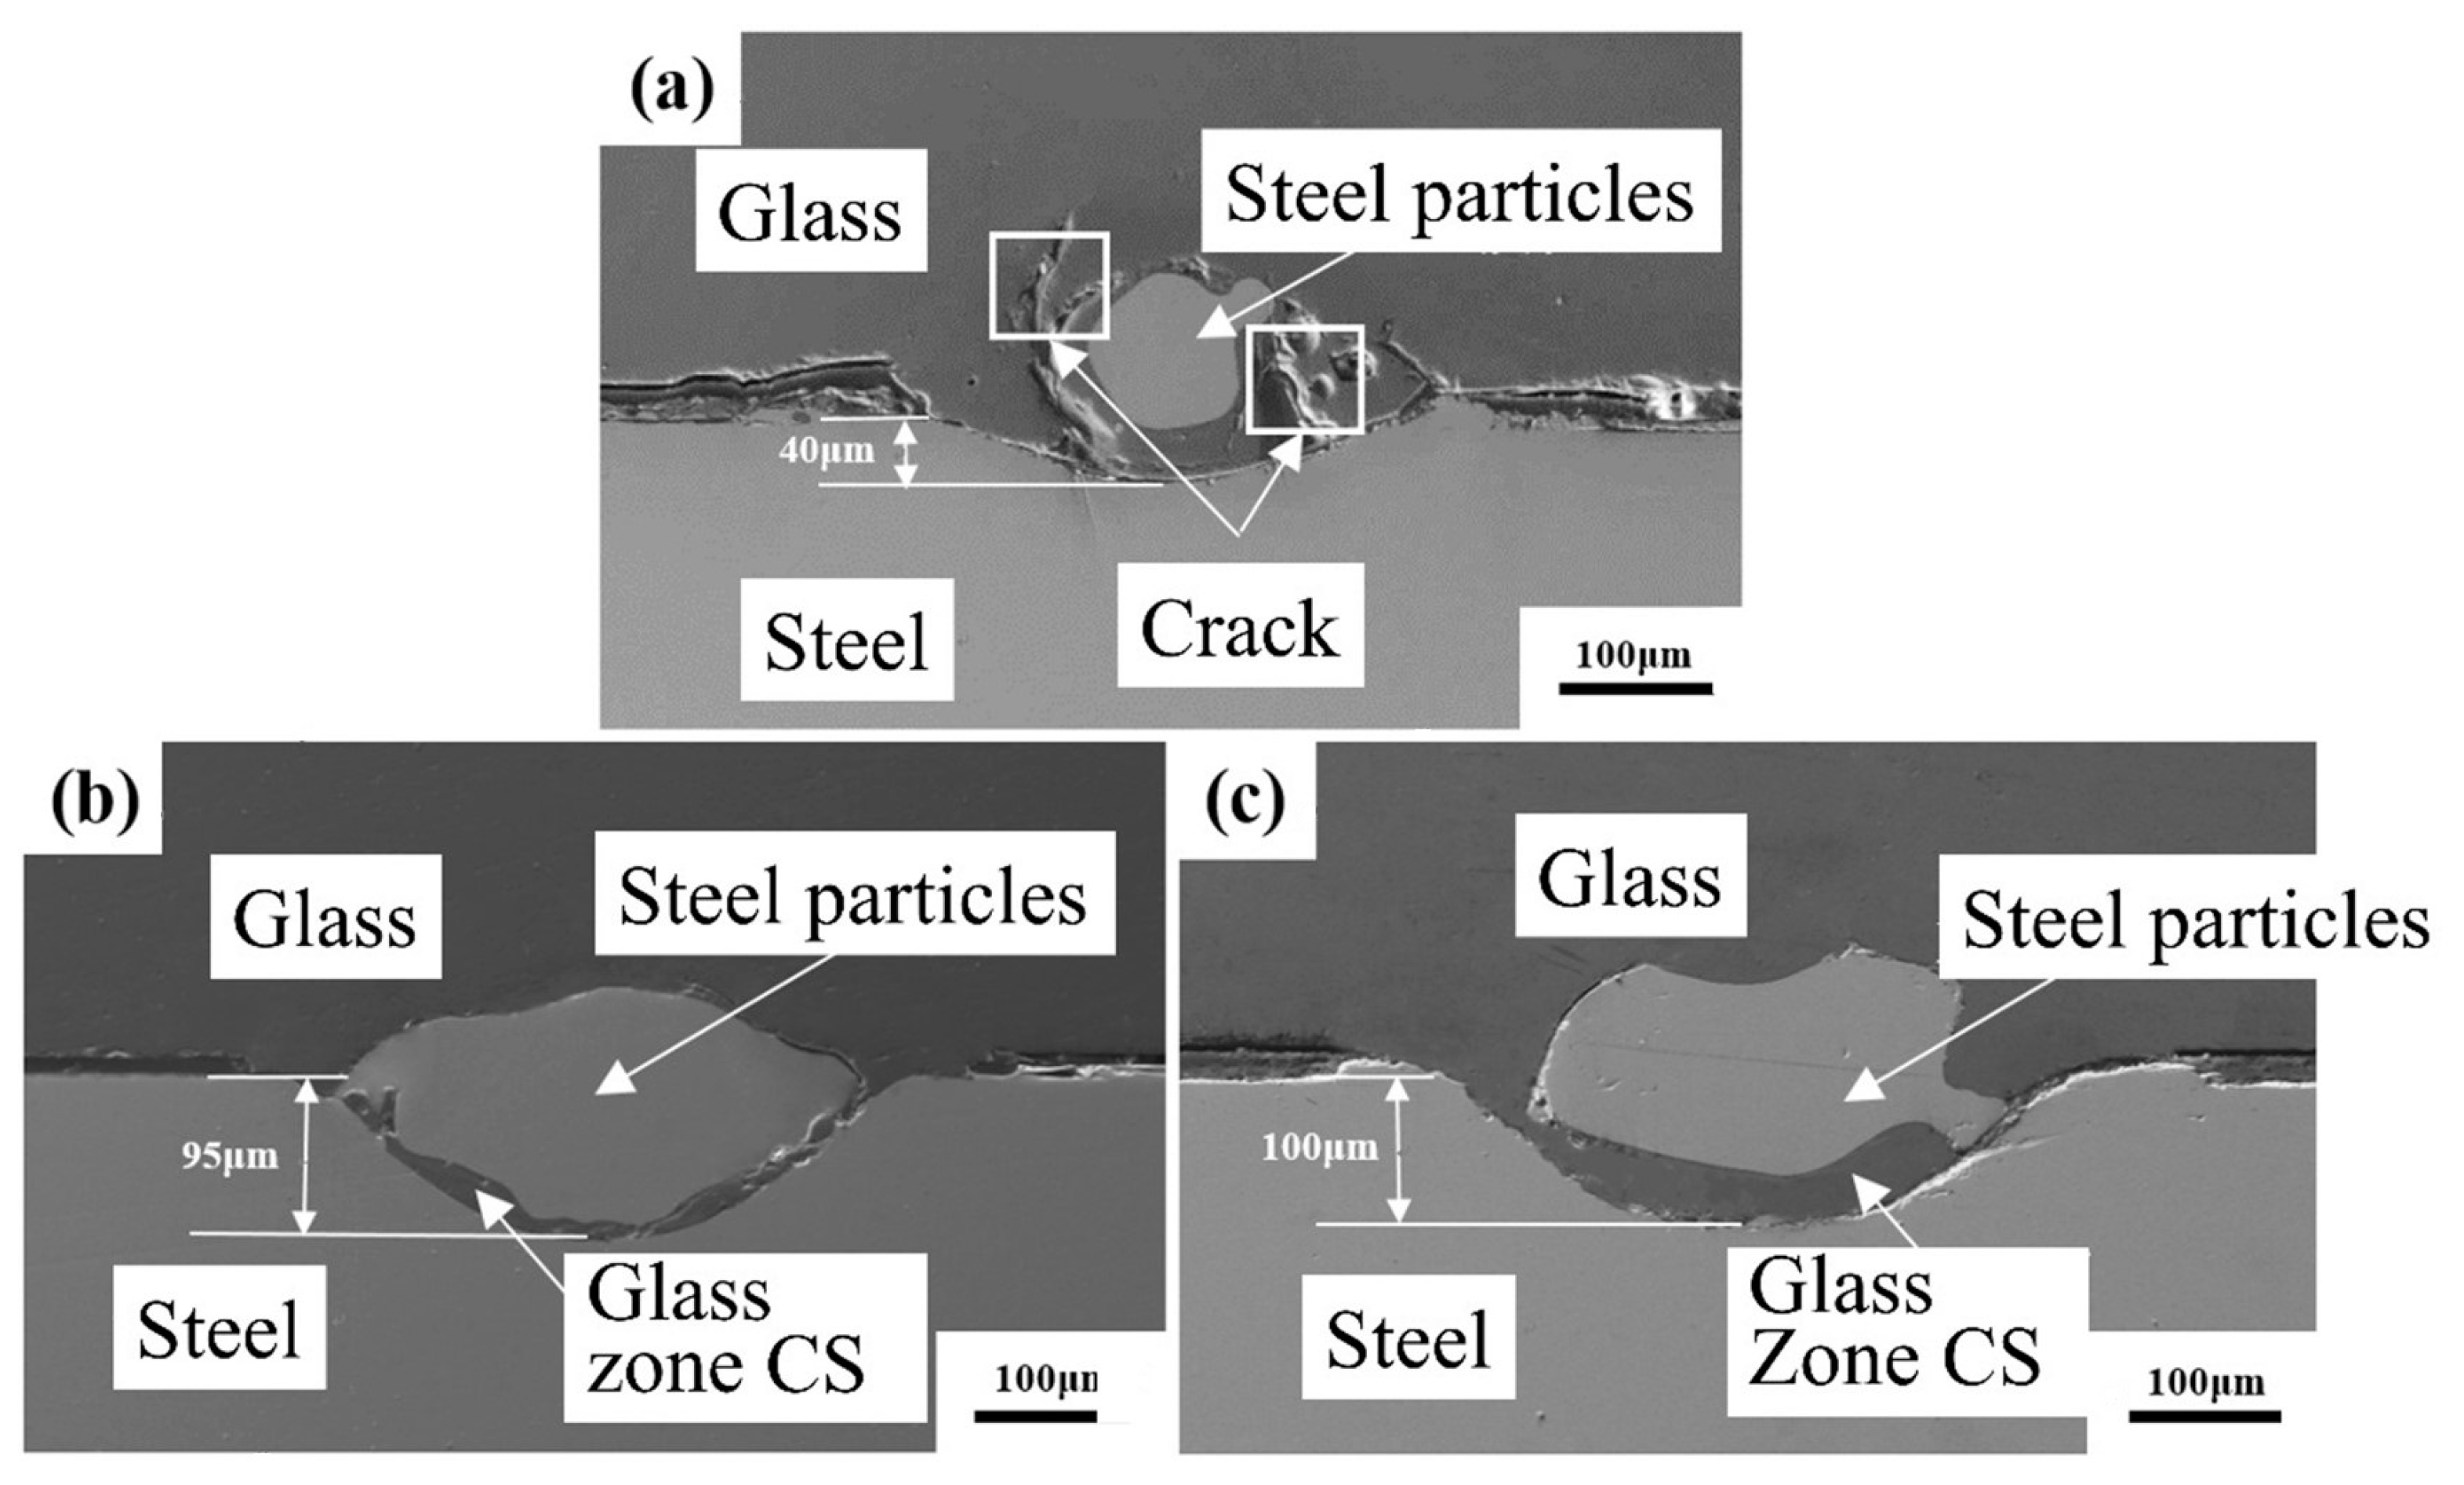
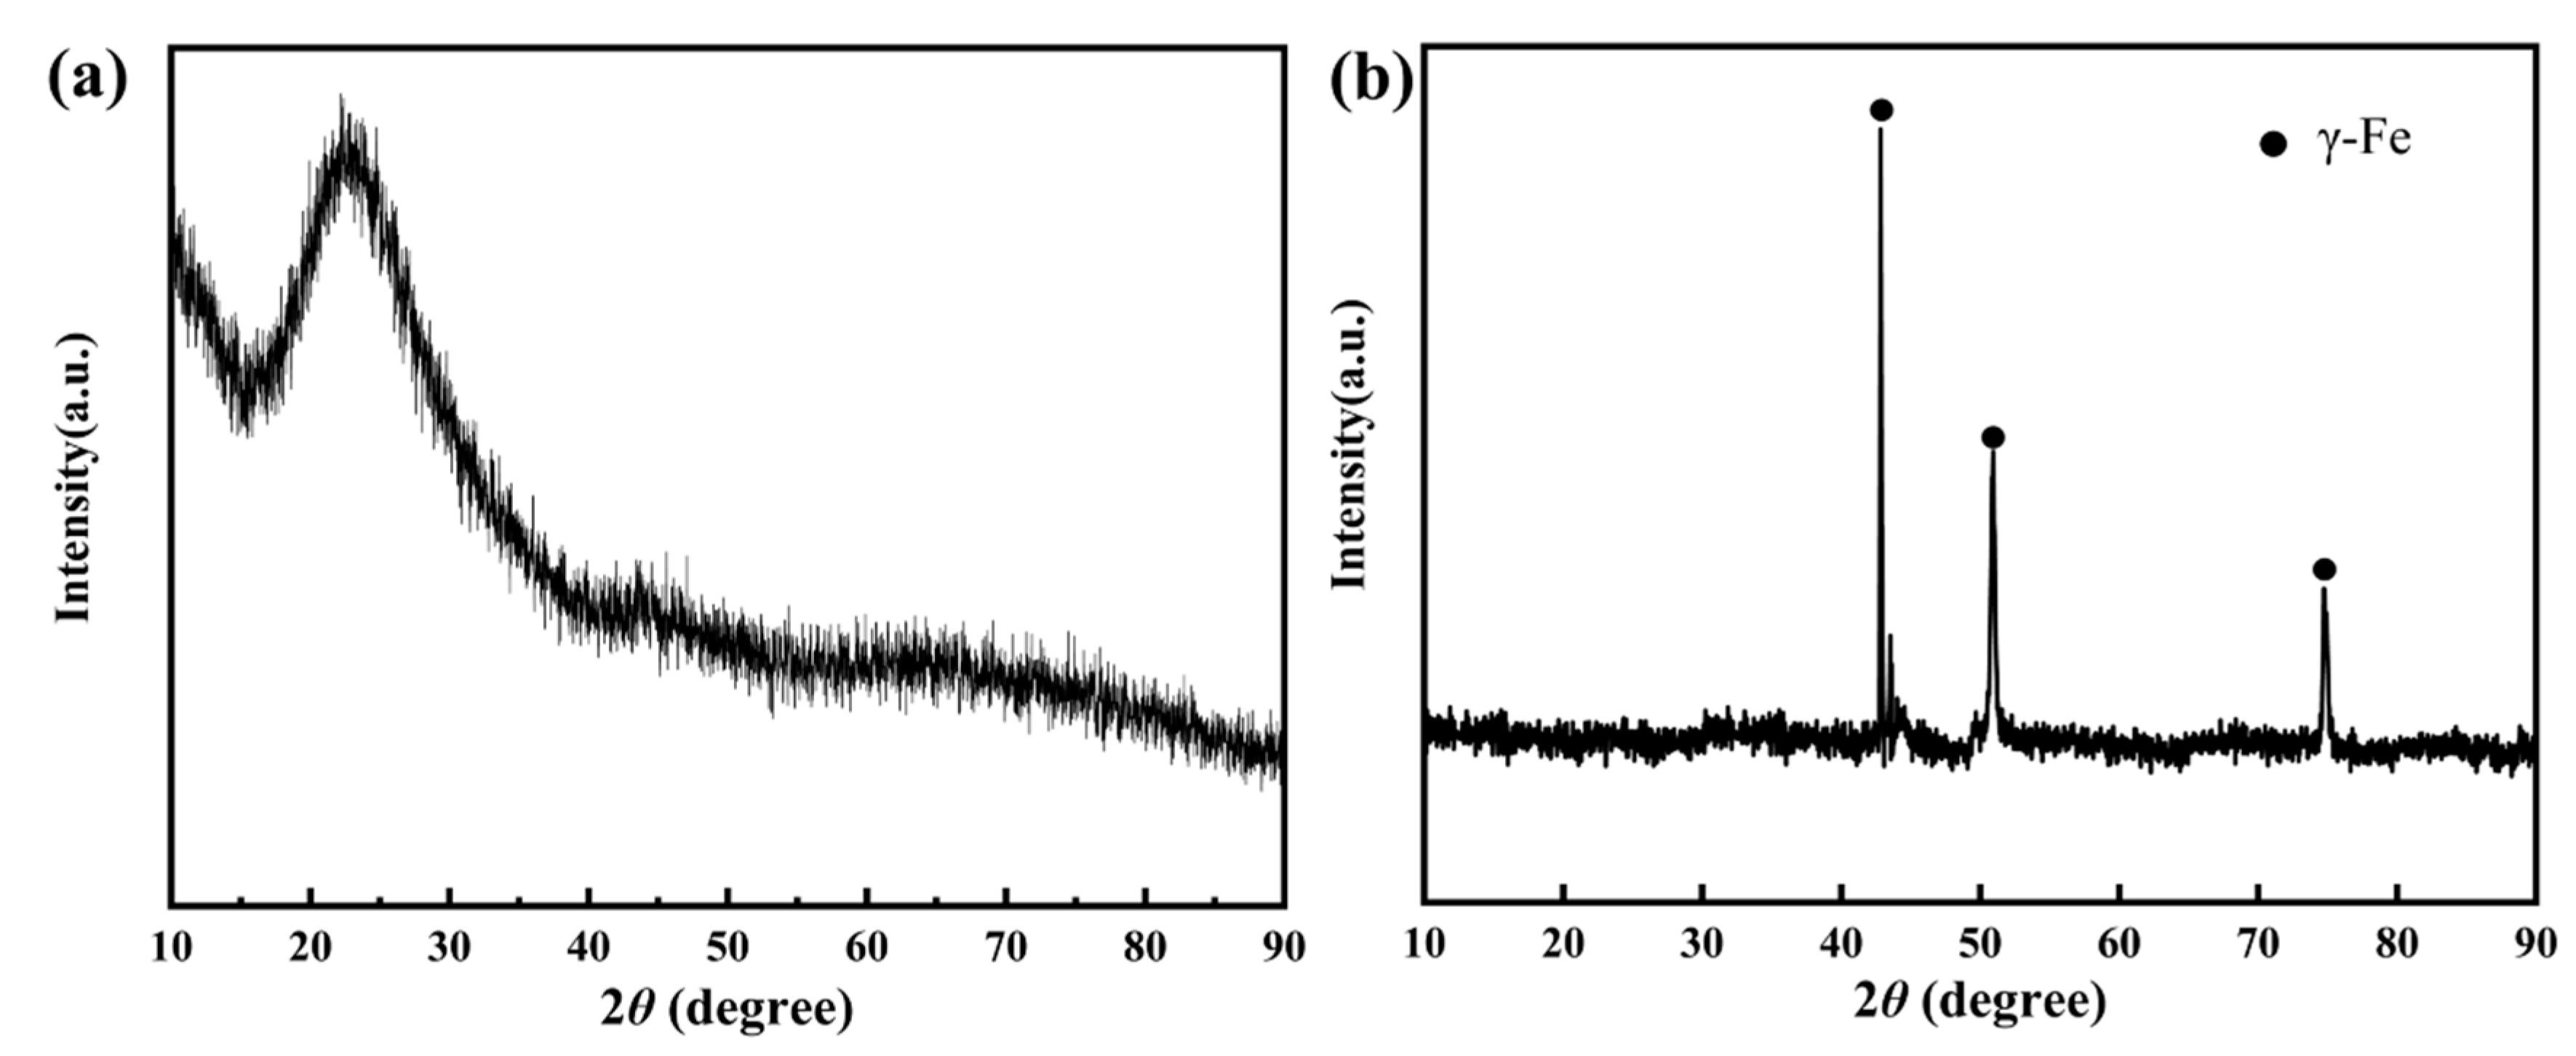
3.3. Cross-Section and XRD Results

EDS line map analysis is performed to analyze element distribution for three different surface treatment methods. Figure 9 shows that Fe and Cr are mainly distributed in the steel substrate, while Si, O, Al, and Na are mainly distributed in the glass substrate. It should be noted that Fe and Cr are present in the mixtures after solidification. It is known that the brighter the color, the higher the concentration of elements. This means that Fe and Cr diffuse into glass. Moreover, molten glass and molten steel are mutually mixed. The present results are similar to EDS results during wetting experiments [13,14,15]. After surface oxidation, steel is easy to bond with glass to form a stable mosaic structure. There are no cracks on the cross-section of the sealing seam.
The XRD results for high aluminum glass and stainless steel are shown in Figure 10. Glass is noncrystal, so the XRD results of the glass substrate are presented as amorphous diffraction peaks, and steel has a γ-Fe phase. Moreover, glass mainly contains amorphous complex phases of SiO2, Na2O, MgO, and Al2O3.
After laser sealing, the XRD results of phases for the glass side and steel side are detected, as shown in Figure 11. Fractures usually occur in three positions, i.e., the glass side, steel side, and middle of the mosaic structure. As shown in Figure 11b, XRD results from the fracture on steel have phases of γ-Fe and α-Fe in the above-mentioned three positions. When a fracture occurs on the steel side and in the middle of the mosaic structure, adhesion occurs, proving the existence of the Cr2O3 phase.
The EDS map analysis results in Figure 9 prove the present results. Cr is located on the glass side, which contains only phases γ-Fe and α-Fe from the steel substrate, and no other phases can be detected. In Figure 11a, when fracture occurs on the steel side and in the middle of the mosaic structure due to the existence of adhesion on both sides, it can be detected as phases of γ-Fe and α-Fe on the glass side. When fracture occurs on the glass side, it is similar to that of original glass. This proves that adhesion is completely detached. Moreover, no new phases can be detected at this time. In previous wetting experiments [6,14,16,17], it was found that a new phase was generated. This is formed due to high temperature used for the wetting test. However, during the laser sealing process, there are no new phases formed, as the bonding in the glass-to-steel sealing is a form of mechanical bonding.

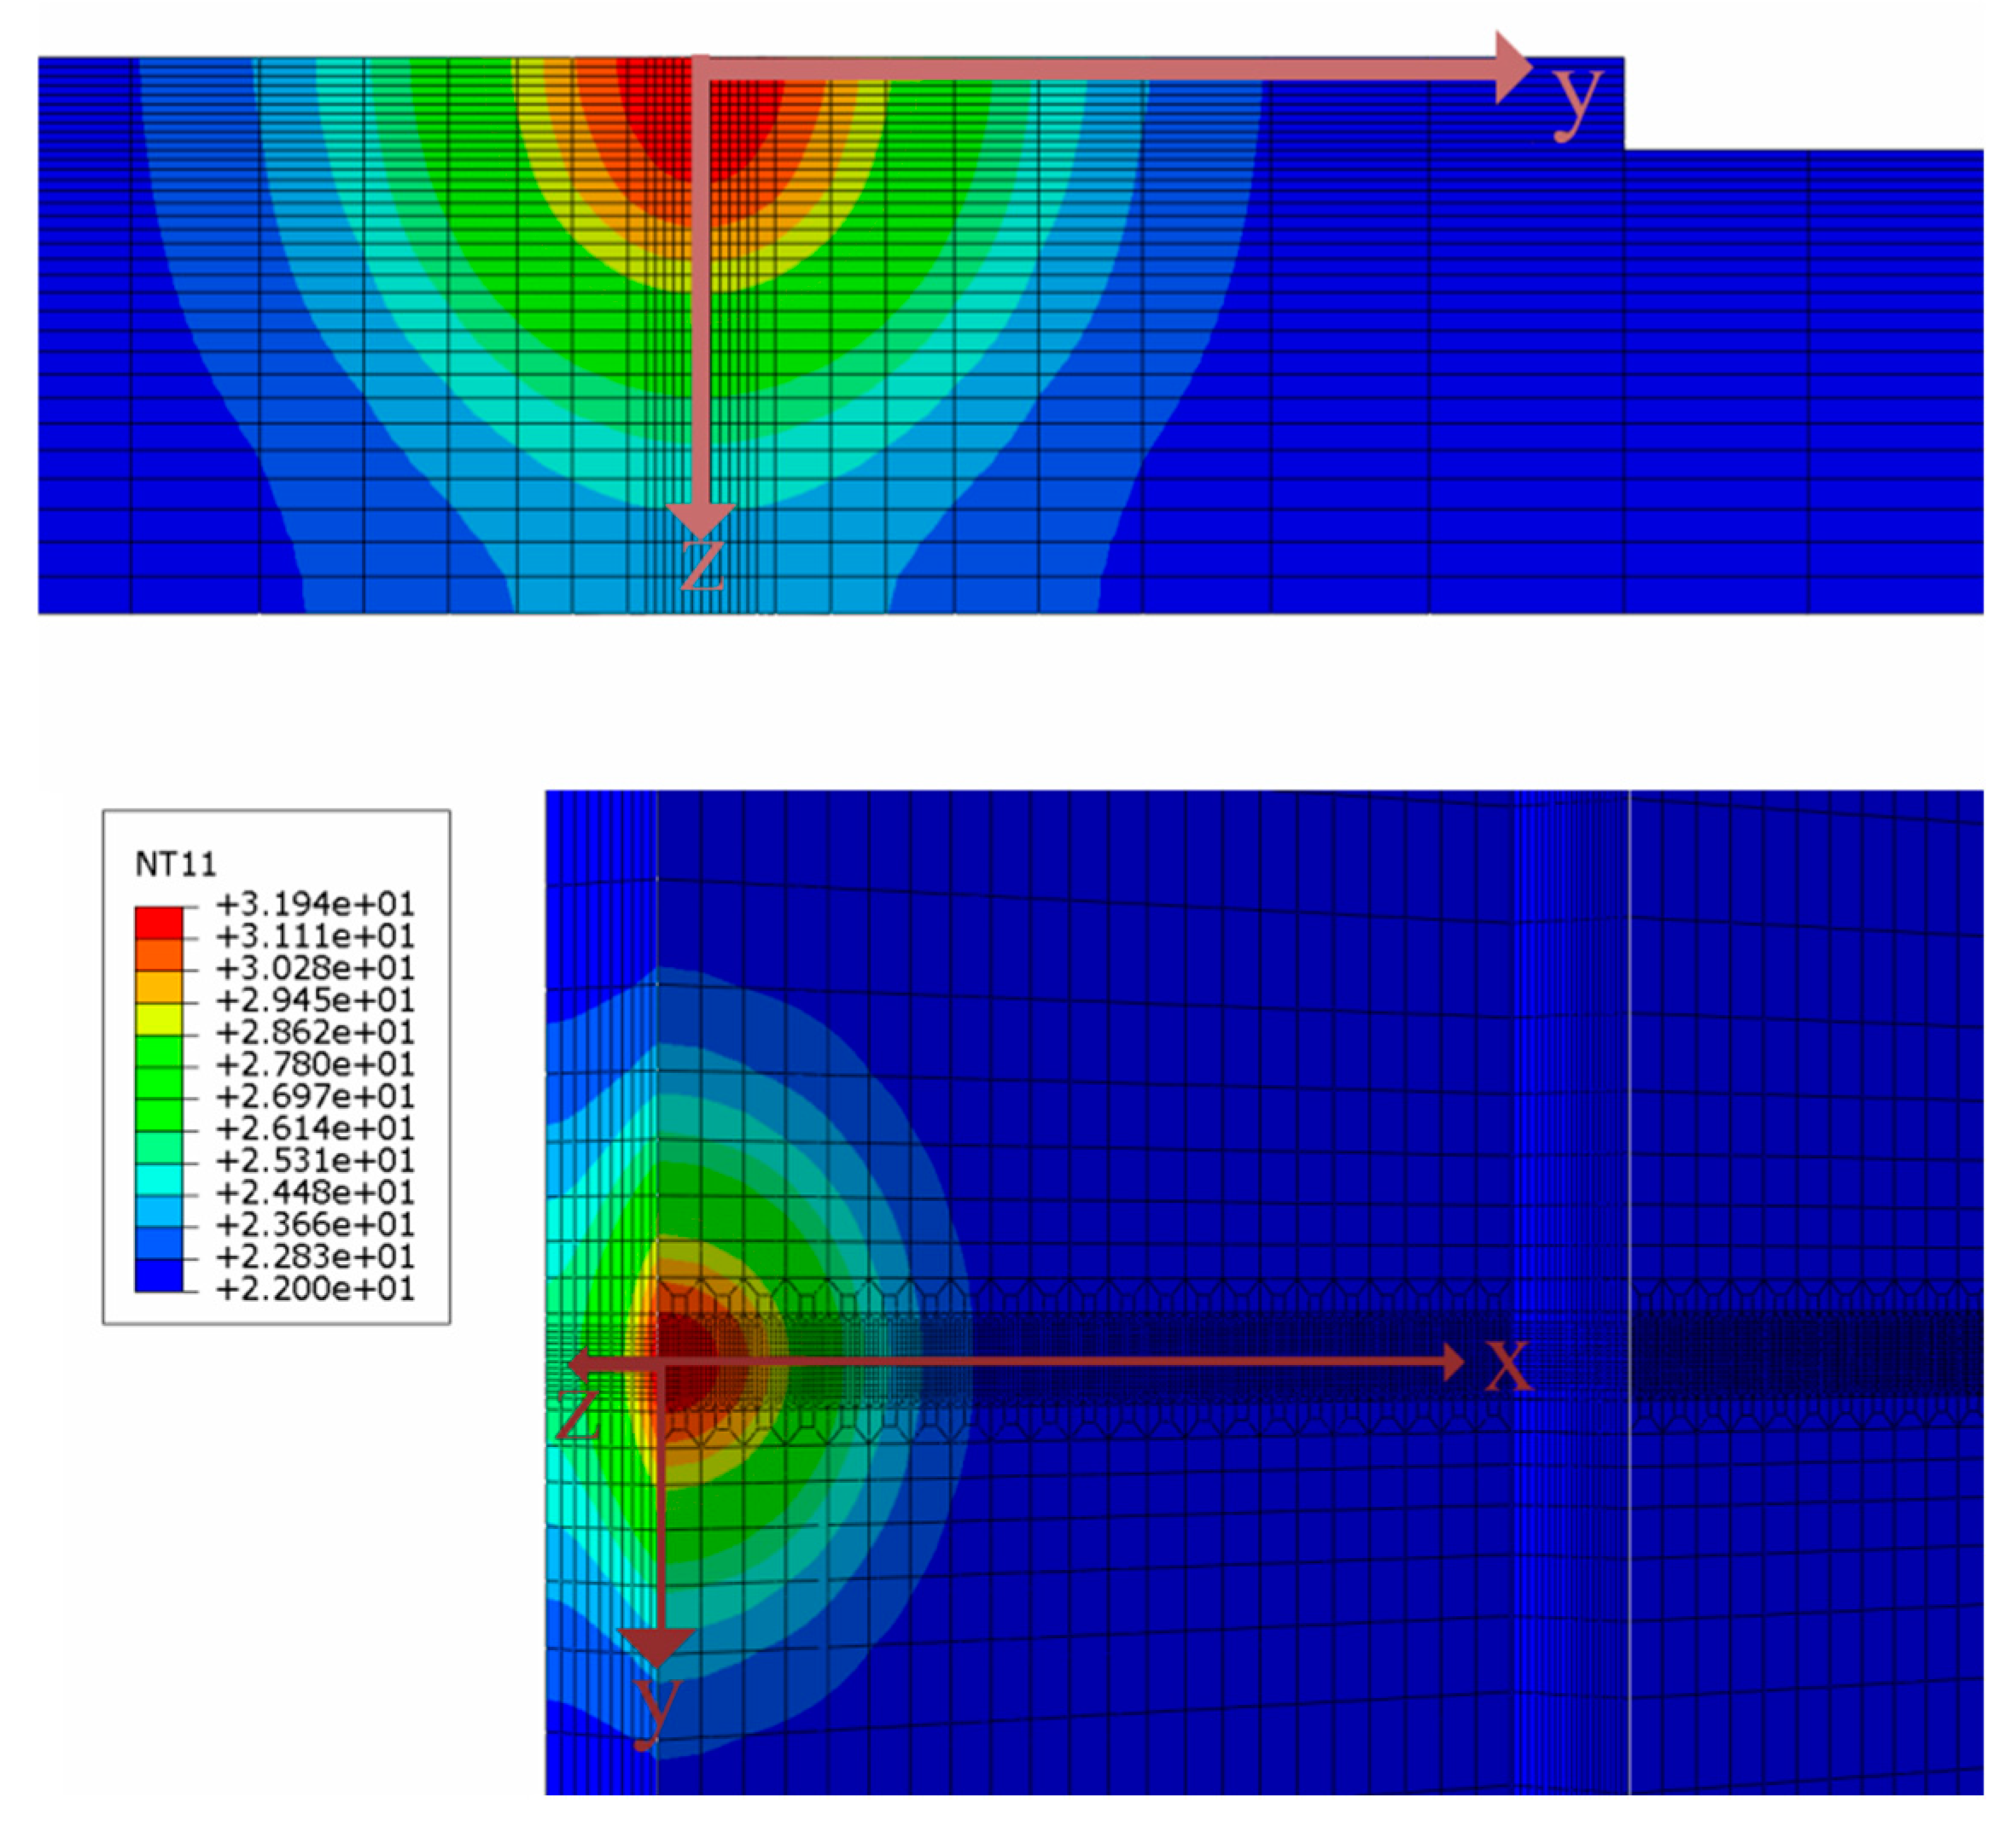
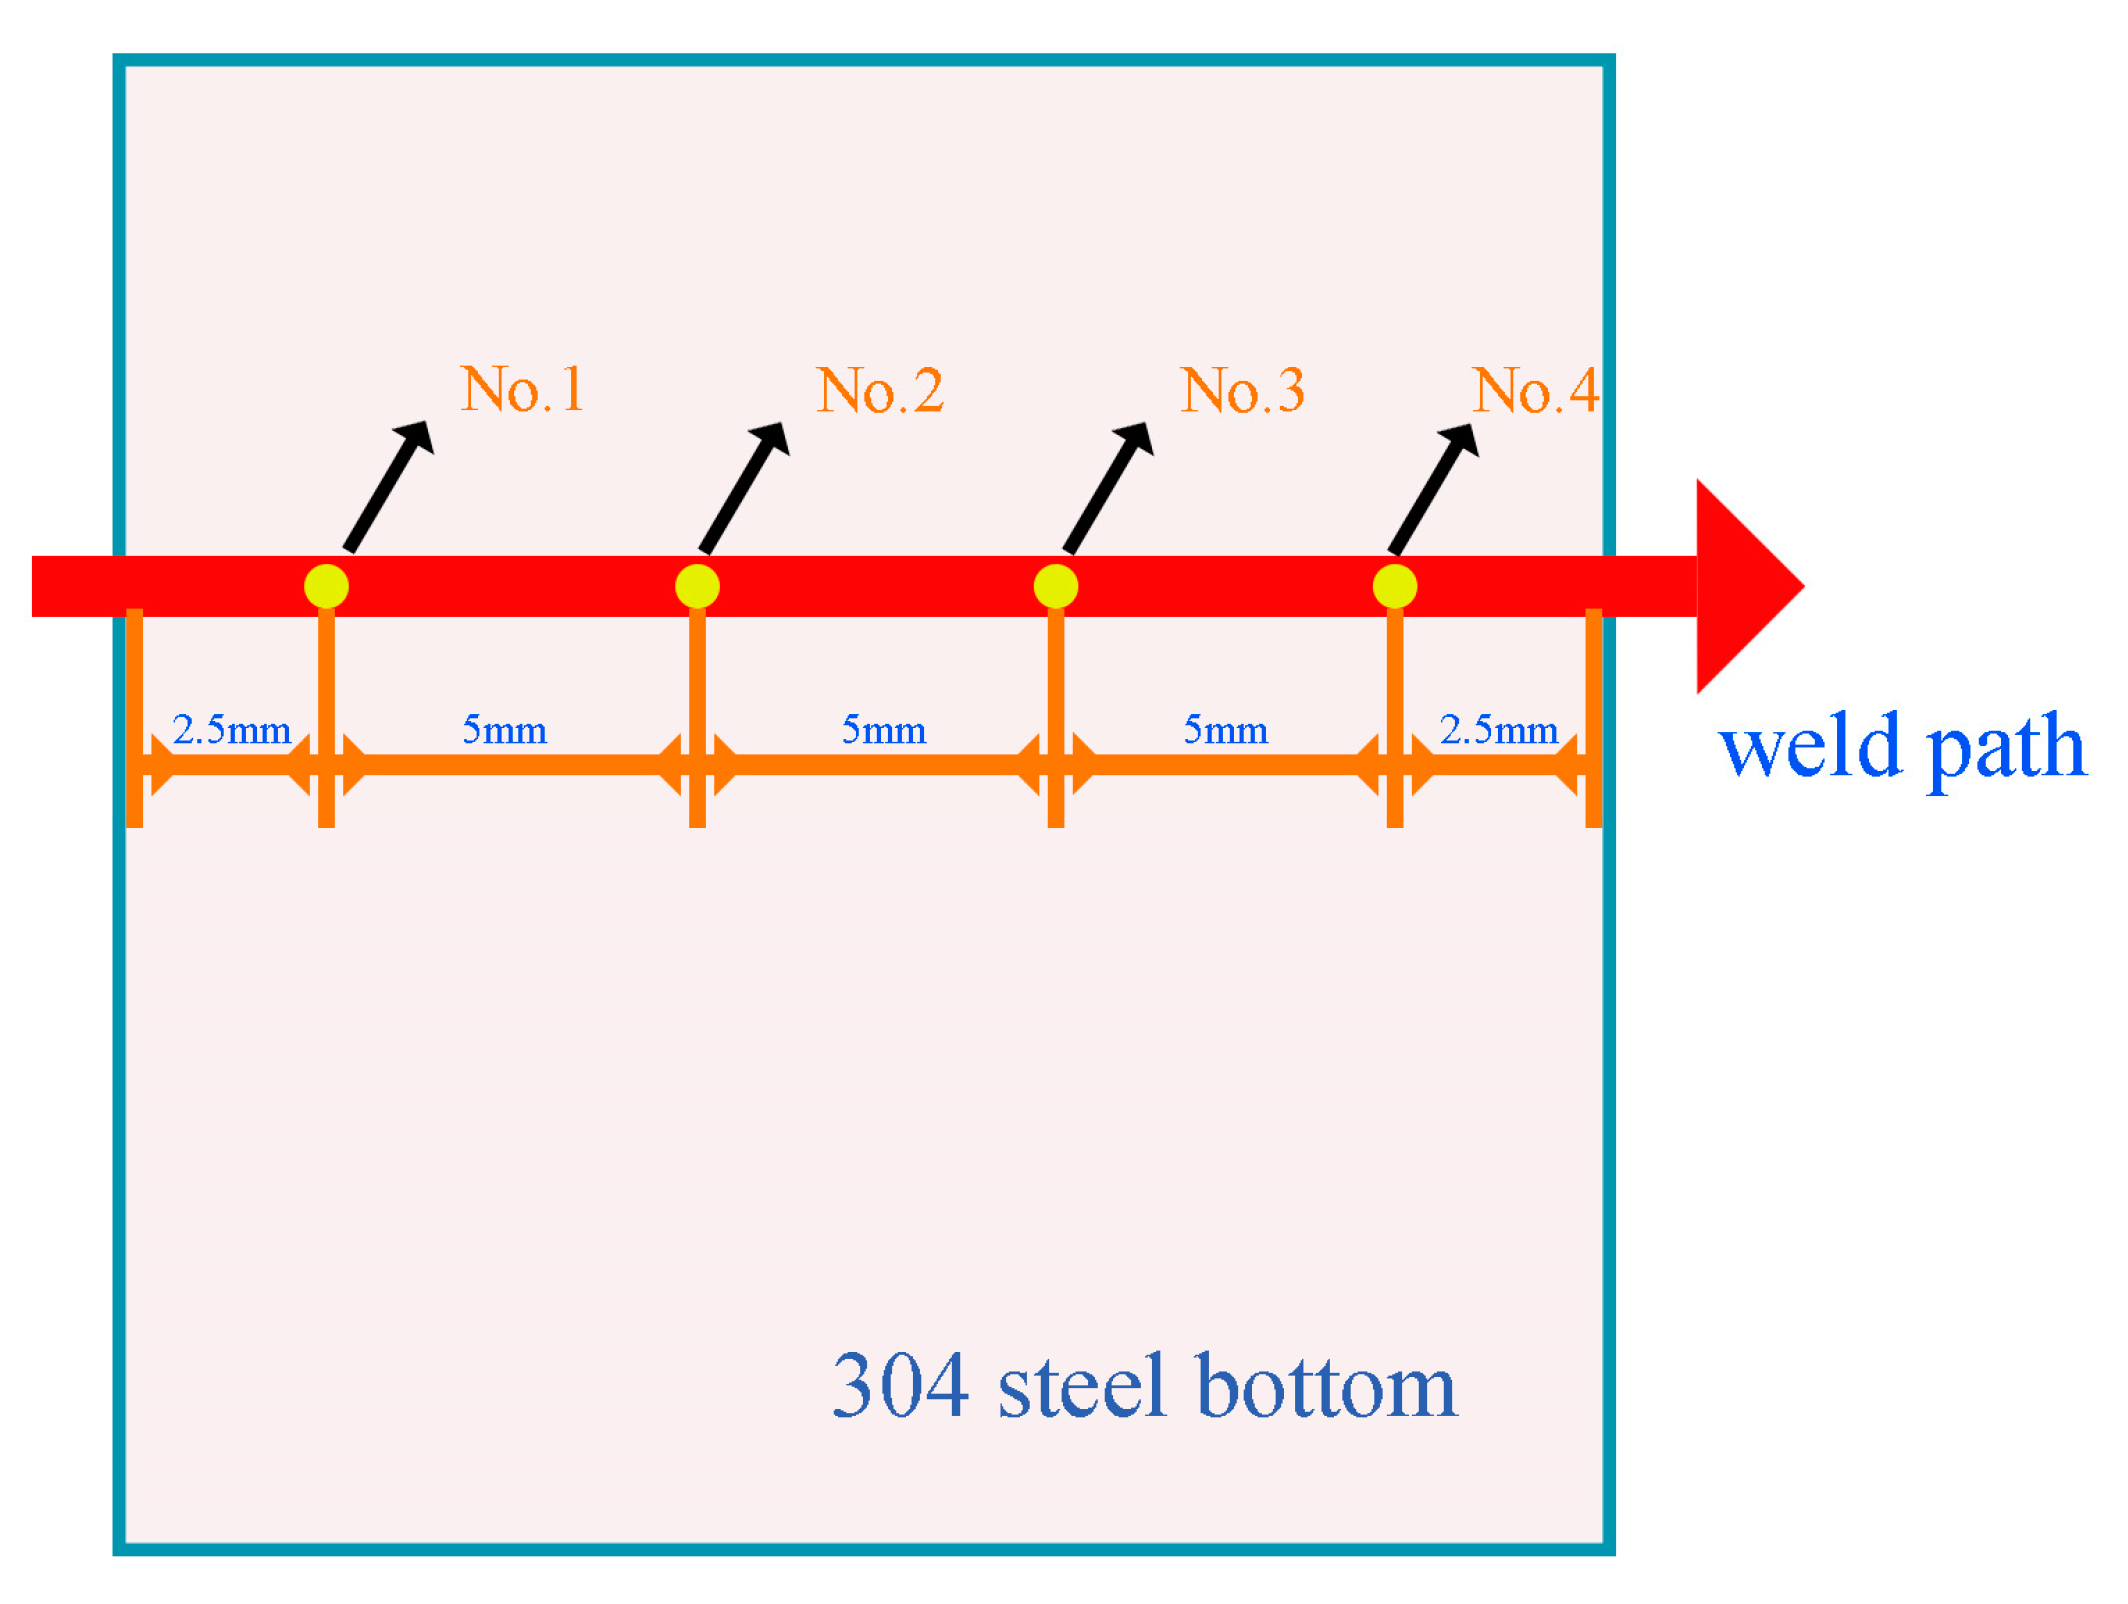
3.4. Numerical Simulation of Welding Process

The previous study involved taking SEM photos and EDS element scans of the samples, and, through the shear force experiment, it was concluded that the surface of 304 steel treated via laser surface oxidation had the best bonding performance with glass. However, based on these experiments alone, the reasons for the differences in the bonding properties between the three surfaces and the glass cannot be studied in depth. At this point, finite element analysis software (Abaqus, Version number 6.14) is needed to construct the temperature field and stress field during the welding process, allowing the temperature and stress of the weld to be studied in depth. Firstly, a three-dimensional model of glass and 304 stainless steel is established, as shown in Figure 15. The glass material parameters are shown in Table 1. The parameters of high-alumina glass and 304 stainless steel are shown in Table 2 and Table 3, respectively. The laser parameters are P = 160 W, f = 10 Hz, pw = 2.5 ms, and v = 2 mm/s. The absorption rates Ab of the three surfaces for the laser with a wavelength of 1064 nm are 0.432 (untreated sample), 0.615 (high-temperature pre-oxidation treatment), and 0.557 (laser oxidation treatment), respectively. The glass transmittance T is 0.91, and the Gaussian heat source formula is shown in (1) and (2) as follows:
P a = P A b T
q x , y = 2 P a π r 2 exp 2 x 2 + y 2 r 2

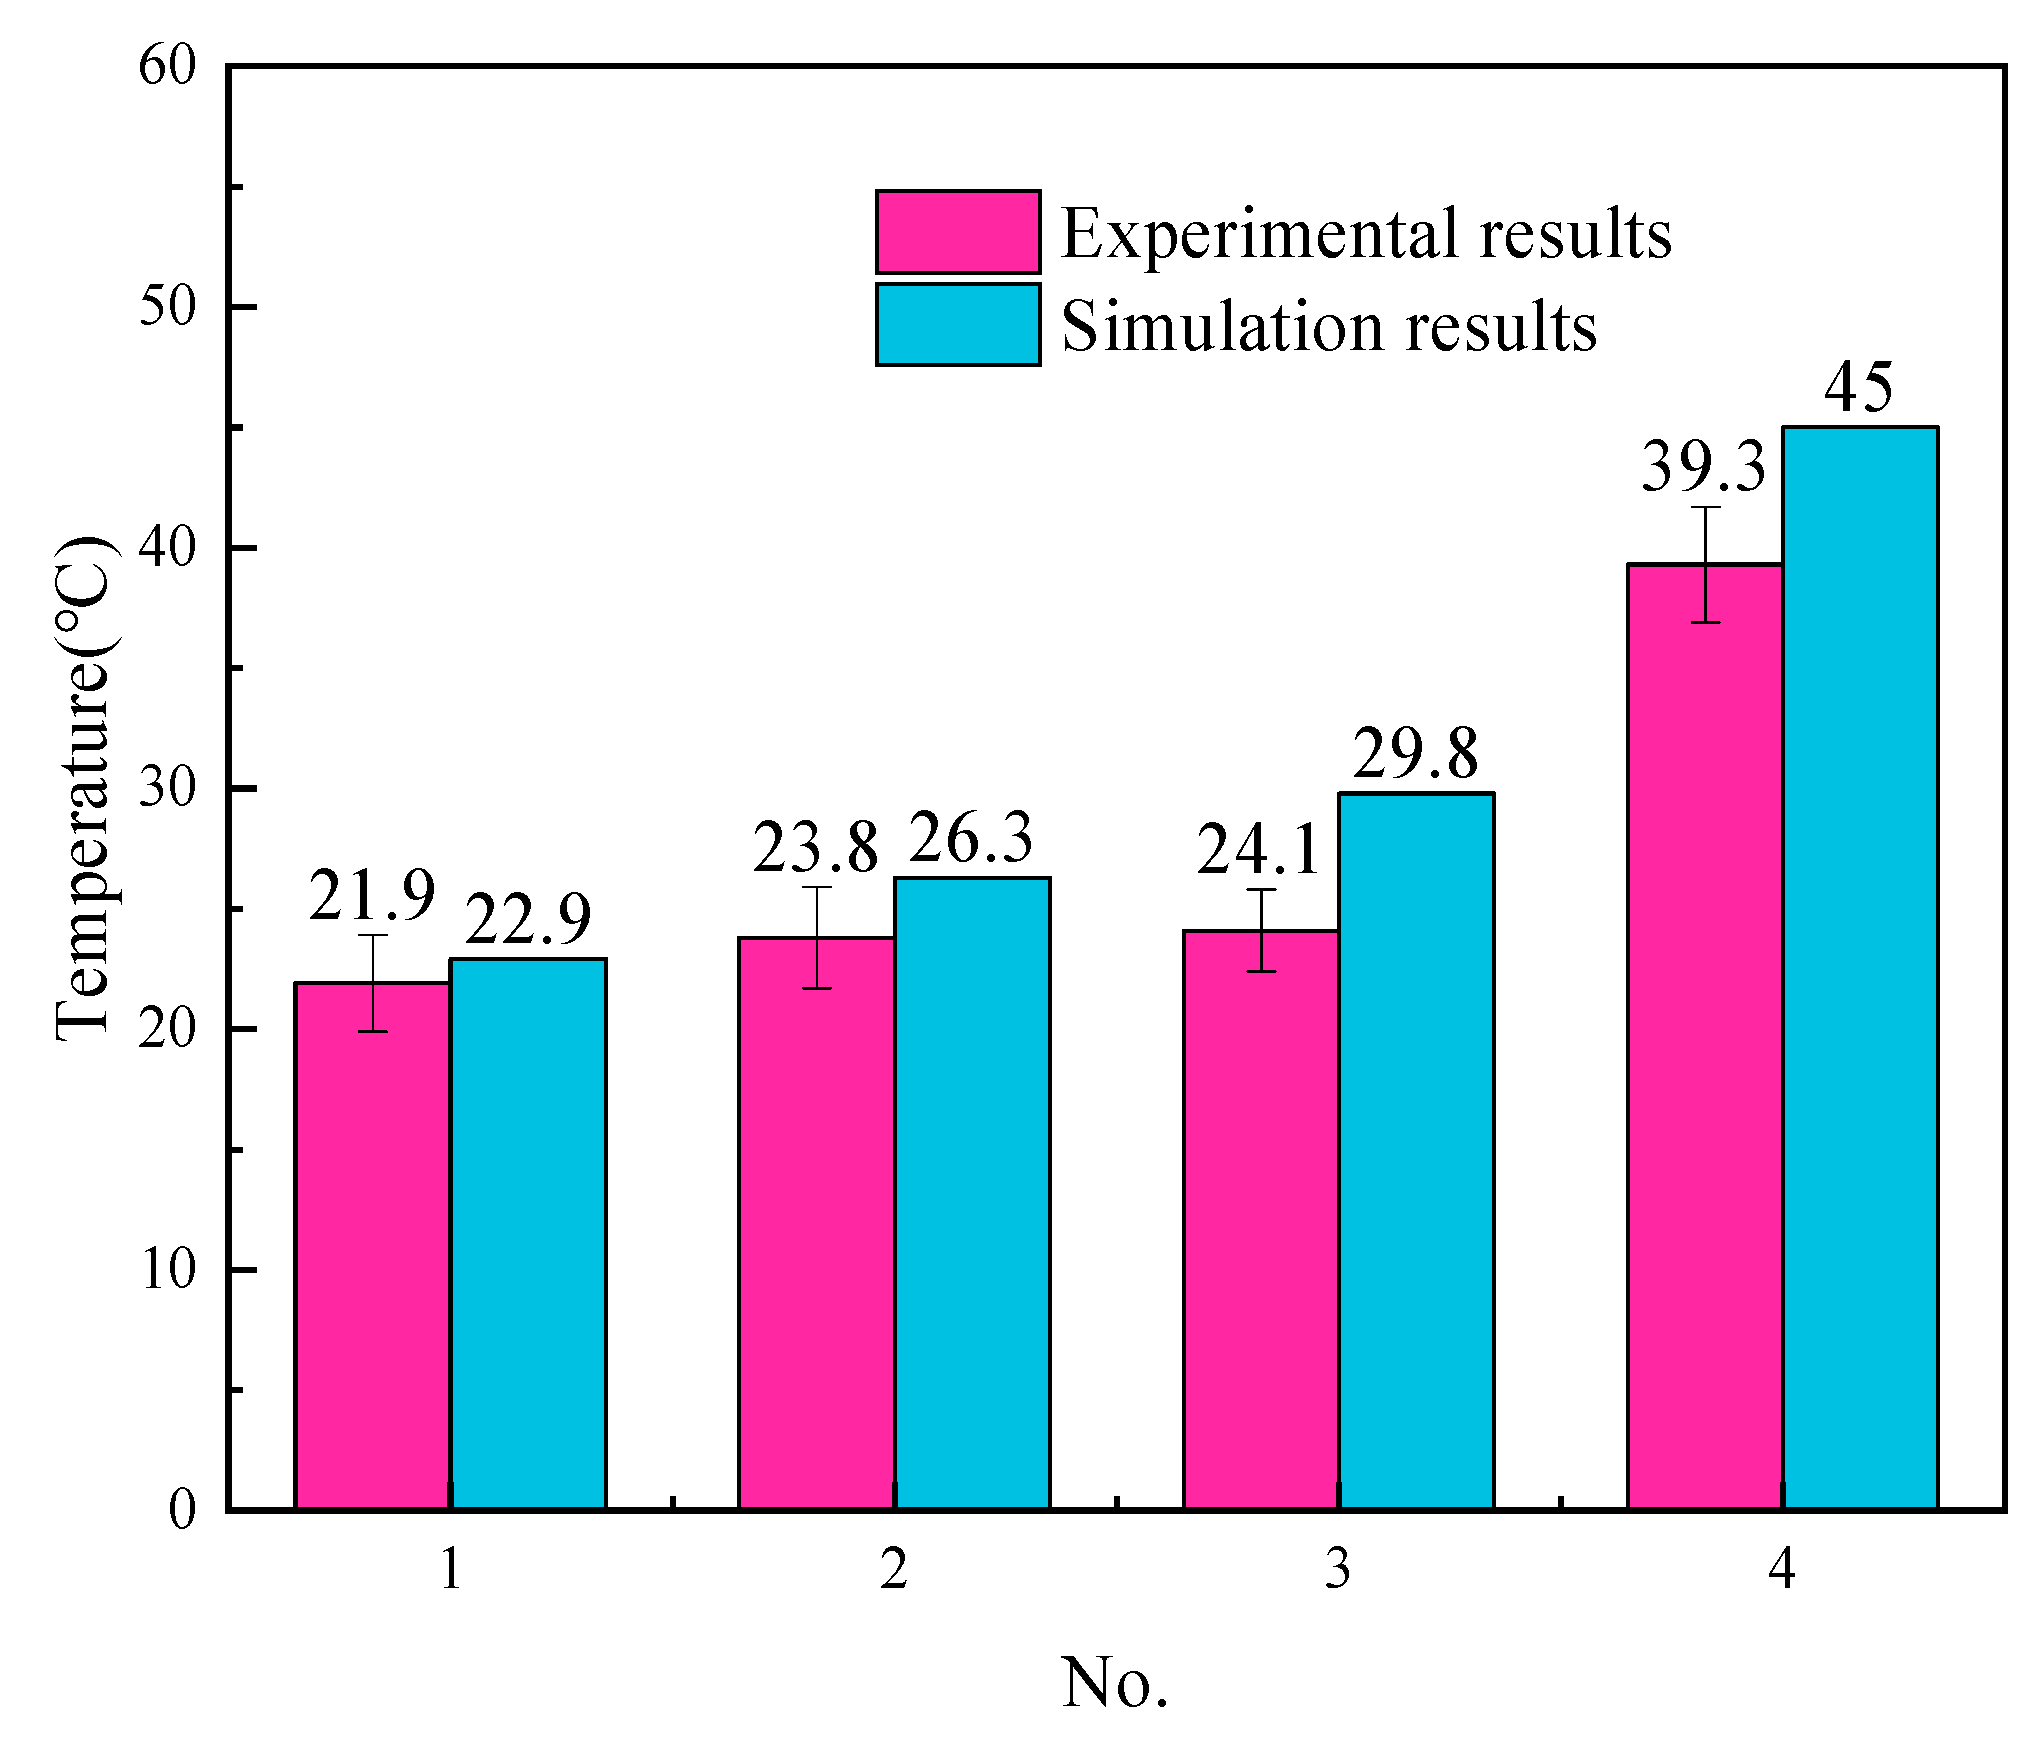
3.4.1. Temperature Field Results

The action path of the pulsed laser is a continuous point. In this study, an action point is selected as the observation point, and the temperature change in the observation point is recorded after the laser heat source center leaves the observation point, as shown in Figure 12. The different absorption rates make the laser observation points show different temperatures. When the heat source center coincides with the observation, all three samples have the highest temperature, of which the temperature of the untreated sample is the lowest, the temperature of the sample after laser oxidation treatment is the medium value, and the temperature of the sample after high-temperature pre-oxidation treatment is the highest. Before and after 0.1 s, the temperature of the observation point shows another small peak. This is because the second action of the laser on the sample is located 0.2 mm after the first action point, so the temperature rises again. Comparing the highest temperature of each sample observed during the second laser action in Figure 12, the untreated surface group is 841.76 °C, the laser oxidation group is 1189.71 °C, and the high-temperature pre-oxidation treatment group is 1065.92 °C. The softening point of high-alumina glass is 880–900 °C. When the temperature reaches the softening point of glass, the glass material softens, and molecular activity is enhanced. The molecules of the welding material and the welded glass components can diffuse and penetrate each other. This diffusion and penetration between molecules gradually blurs the interface between them, forming a continuous whole. The highest temperature of the untreated surface group is less than 880 °C, below the glass softening point. Therefore, the laser oxidation treatment and high-temperature pre-oxidation treatment groups are better than the untreated surface group.
The results of temperature derivation from the center point of the heat source in the three directions shown in Figure 13 are shown in Figure 14. The temperature changes in the three groups of samples along the x-axis are shown in Figure 14a. At a distance of 0–0.15 mm, the temperature of the untreated sample is much lower than that of the other two groups. The higher the temperature, the greater the molten part of the metal and the glass, the closer the mechanical mixing and chemical mixing by the two, and, thus, the more likely the experiment is to achieve good welding. This shows that the combination effect of the untreated group is not as good as those of the other two groups. The variation along the y-axis is similar to that along the x-axis because the laser acting on the surface of 304 steel covers a circular area. The temperature decreases faster along the y-axis than along the x-axis because heat accumulation occurs on the surface of the sample along the x-axis. The temperature along the z-axis decreases rapidly because the laser acts on the surface and struggles to penetrate into the sample, indicating that the laser welding has less effect on the 304 steel substrate.
To verify the validity of the finite element model, we measure the temperature at four points at the bottom of 304 steel. One dataset is derived from the temperature field, and the other dataset is derived from the actual experimental measurement. Conventional non-contact infrared temperature measurement cannot meet the measurement requirements. We choose the K-type thermocouple to contact the bottom of 304 steel, indirectly measure the temperature, and record the maximum temperature measured at each point. The schematic diagram of the point position is shown in Figure 15, as are the temperature measurement results. In general, the experimental results are not that different from the simulation results, and the temperature difference between the two is less than 6 °C. The simulated temperature has always been higher than the experimental temperature for two reasons. First, the air convection in the numerical simulation cannot be consistent with the real environment, resulting in slower heat loss in the simulation than in the real environment. Second, the material parameters added in this simulation are based on solid-state parameters; liquid material parameters have not been added. The temperature change trend of the experiment and the simulation is consistent, and the difference is not large, showing that the results of the numerical simulation have certain reference significance. The schematic picture is shown in Figure 15. Moreover, Figure 16 demonstrates the actual experimental measurement temperature results and simulated temperature results of four temperature measurement points.

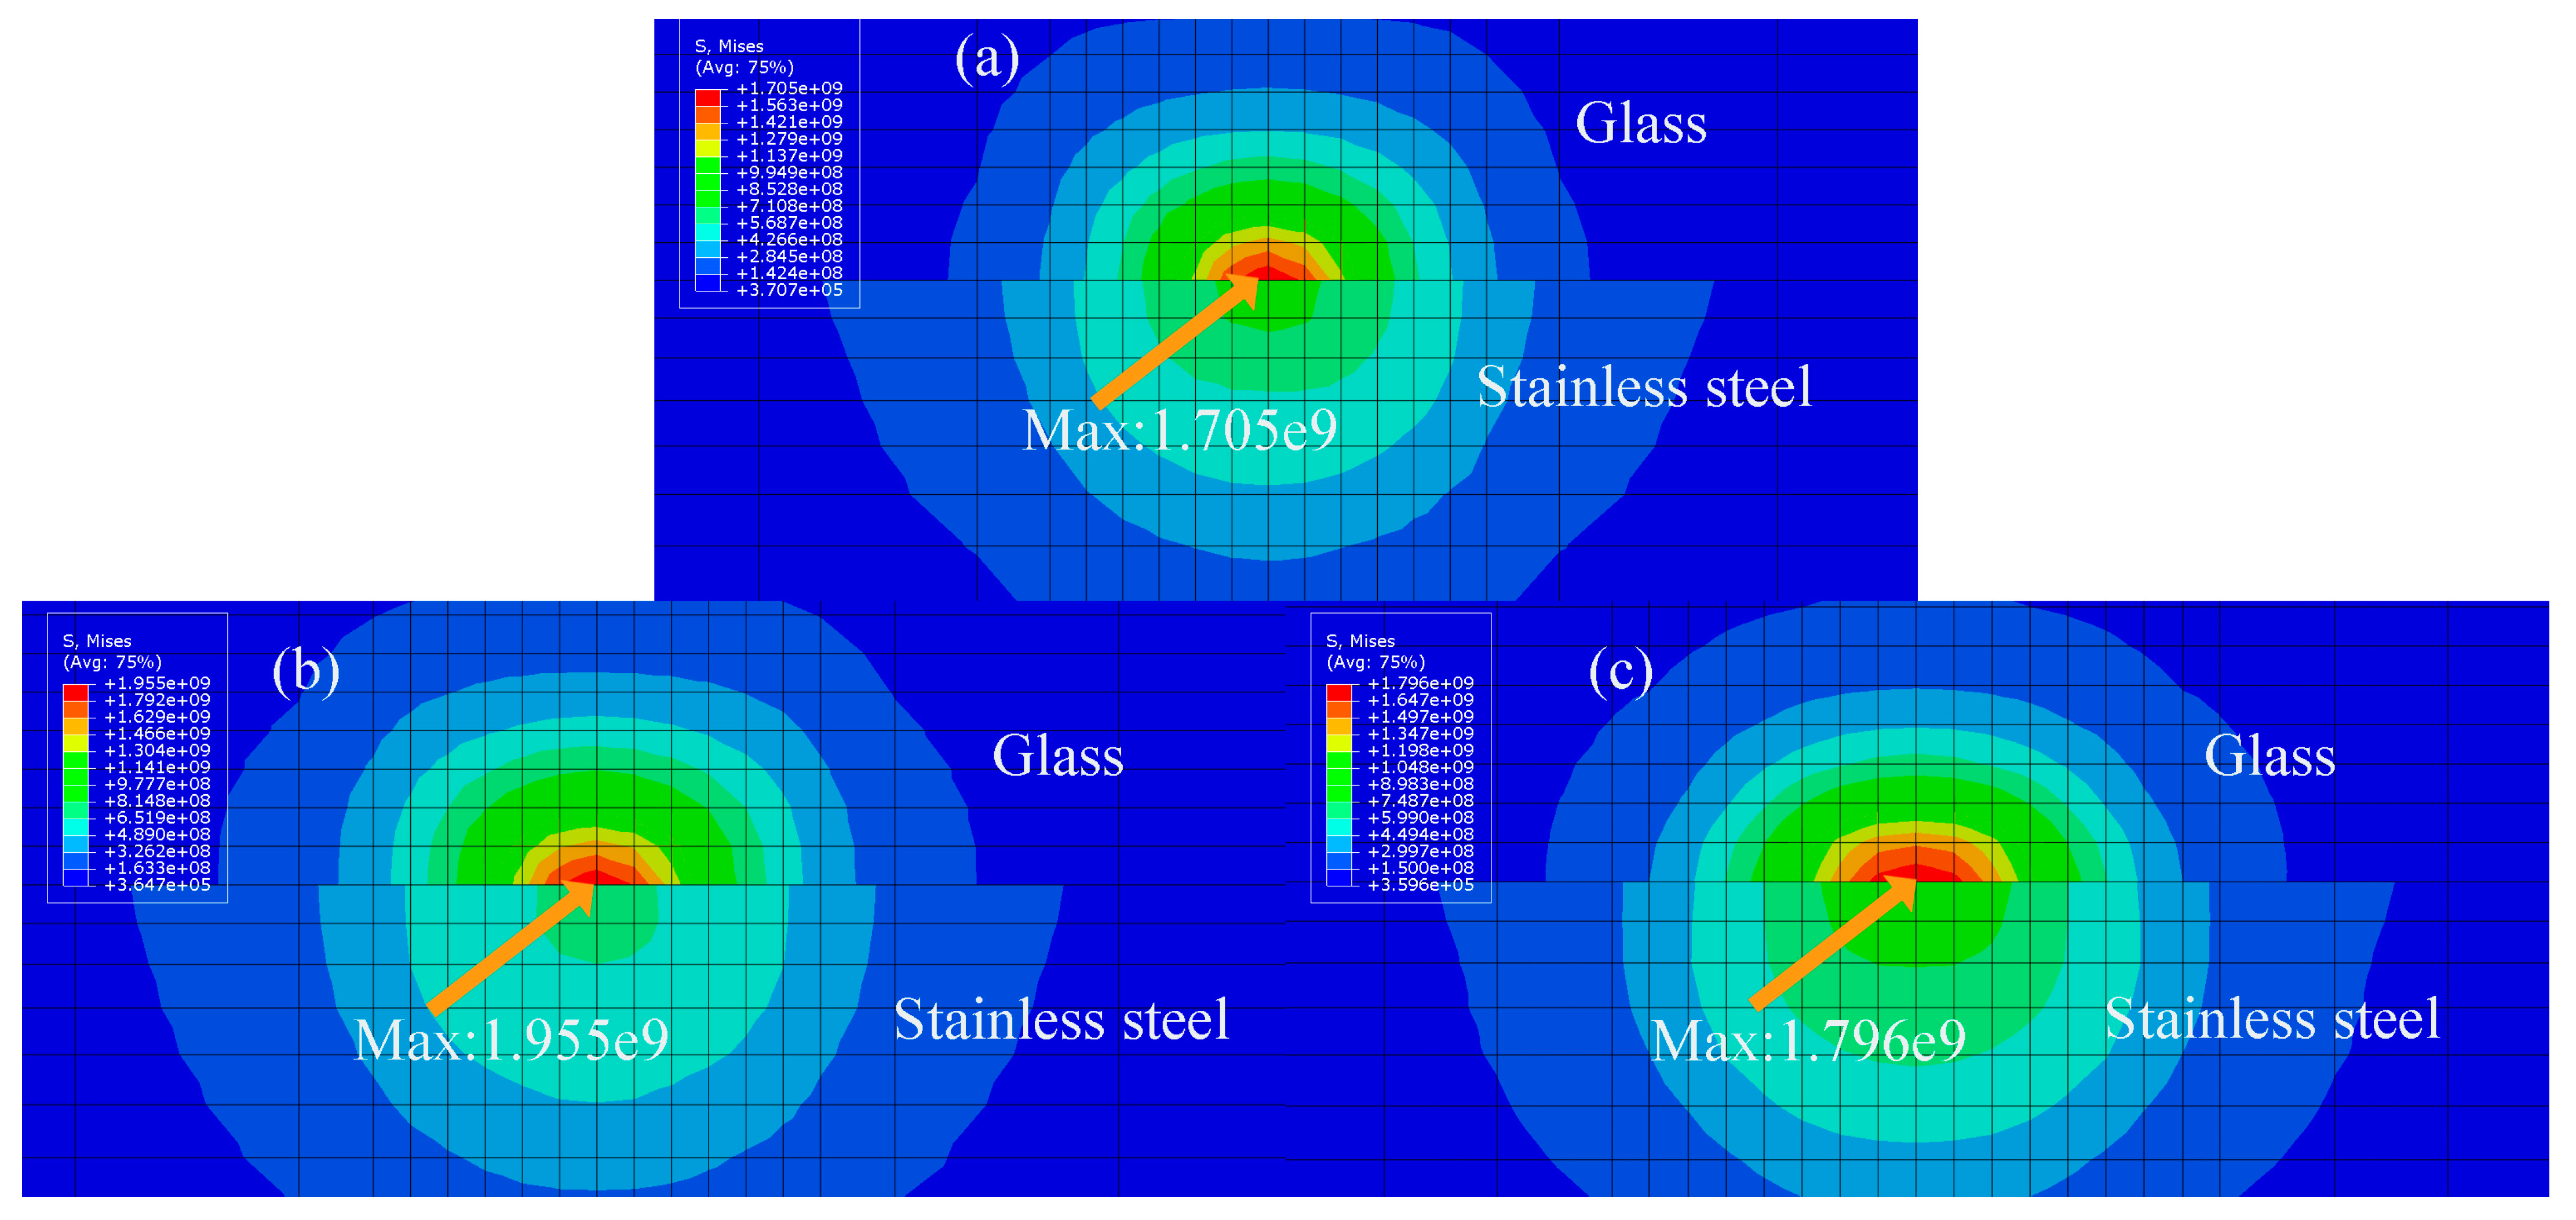
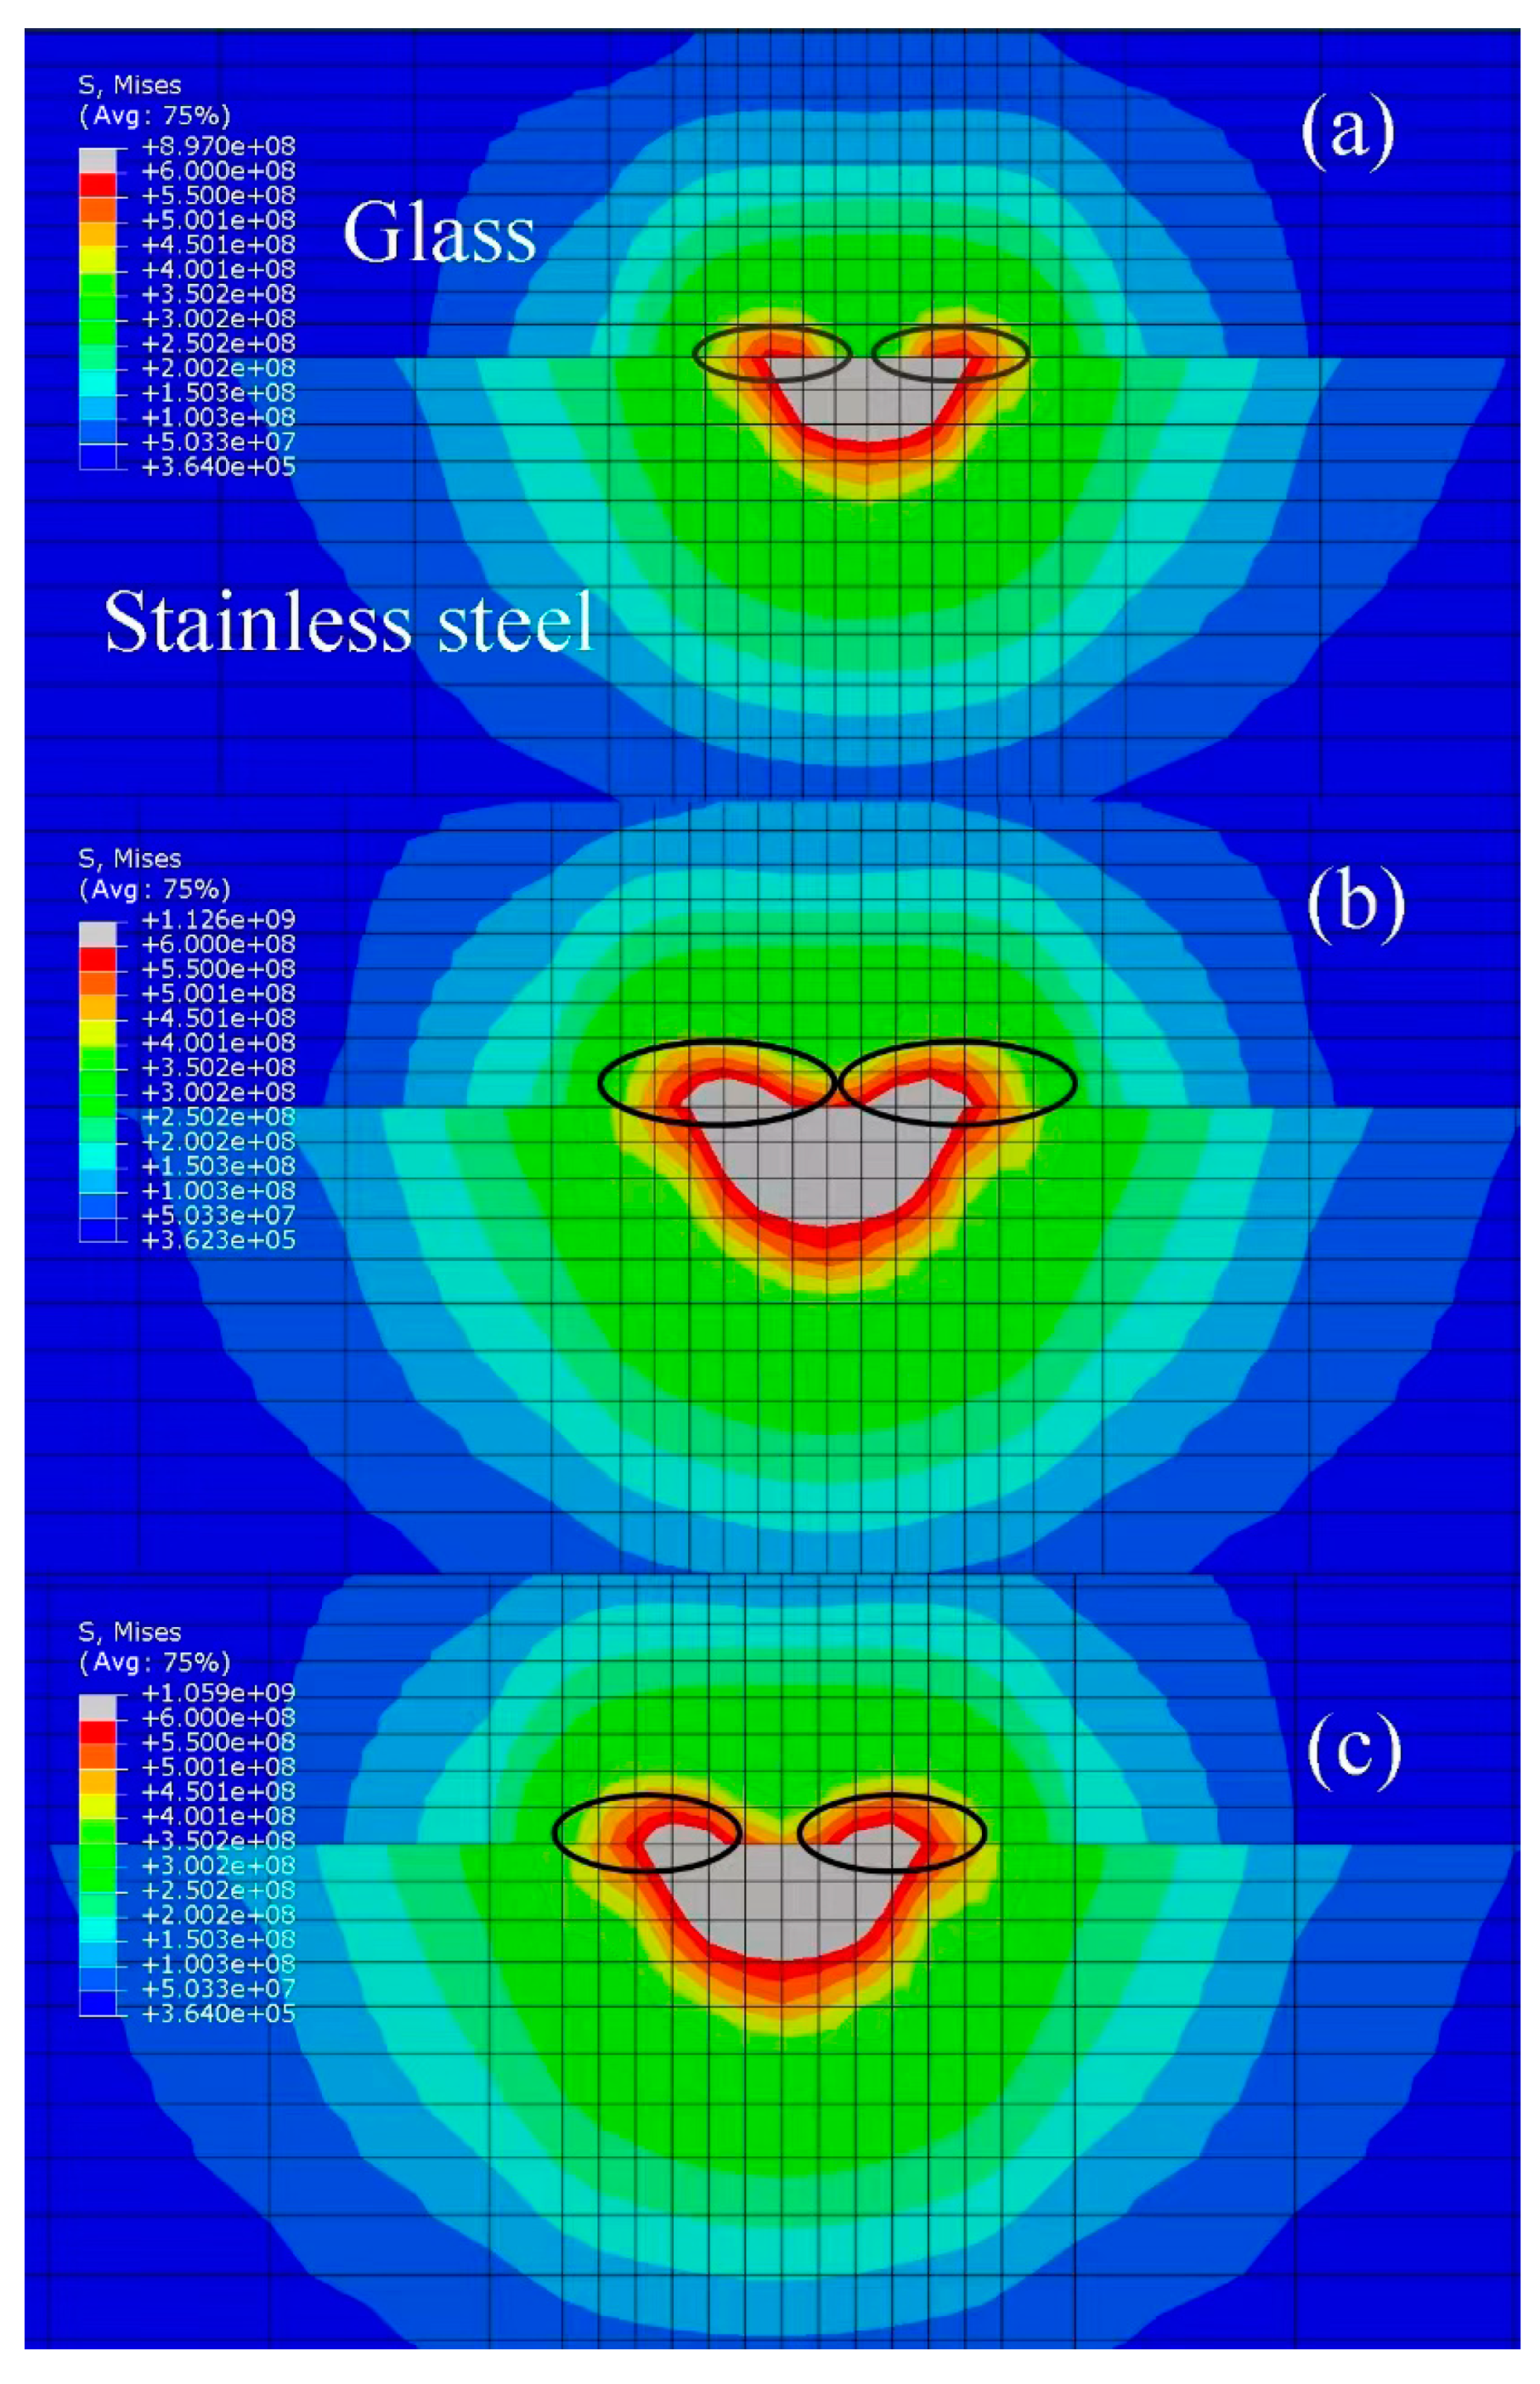
3.4.2. Stress Field Results

The cross-sectional stress is shown in Figure 17b,c. The cross-sections of three different absorptivity rates are shown below. Stress concentration occurs on the glass side of all samples. This is due to the different thermal expansion coefficients of glass and metal, causing the metal to squeeze into the glass side, explaining the metal infiltration into the glass side shown in Figure 6. The thermal stress in the welding process of the sample after high-temperature pre-oxidation treatment is the largest, followed by laser oxidation treatment, and the thermal stress of the untreated sample is the smallest. The greater the thermal stress means, the more metal enters the glass side and, thus, the larger and firmer the joint formed. This is because the bonding effect of the sample after high-temperature pre-oxidation treatment and laser oxidation treatment is better than that of the untreated sample. However, excessive thermal stress squeezes the glass and metal, causing cracks, so the bonding effect of the sample after high-temperature pre-oxidation treatment does not exceed that of the sample after laser oxidation treatment.
For the high-alumina glass, when the thermal stress is greater than 600 MPa, cracks easily appear. The stress levels of the three treated samples during laser action are shown in Figure 18. The middle gray area is the area where the stress exceeds 600 MPa. The area where the glass side stress for the high-temperature pre-oxidation treatment group exceeds 600 MPa is the largest; in this area, cracks are easily produced, and weld quality is reduced. There is almost no area where the stress exceeds 600 MPa in the glass part for the untreated group, while the area where the stress exceeds 600 MPa after laser oxidation treatment is moderate in size, and the cracks generated are within an acceptable range. By analyzing the temperature field results, we find that the second laser action may soften the glass at the previous action point, and the laser oxidation treatment and high-temperature pre-oxidation treatment groups results are satisfactory. By analyzing the results of the stress field, the samples of the high-temperature pre-oxidation treatment group are prone to cracks, and the welding effect is not as good as that for the samples after laser oxidation treatment, which is consistent with the actual experimental results.

3.5. Sealing Mechanism

In the present study, high aluminum glass was provided by a corning company named GG3 glass, and the laser sealing of glass to metal was carried out via laser transmission welding. Moreover, some part of the laser beam was absorbed, and some part of the laser beam was reflected. In [23], it is stated that GG3 has a transmittance of 92%. Thus, during the laser sealing process, about 8% of total light is reflected, and other light passes through glass to reach the steel surface. Then, steel absorbs laser energy and is melted, and energy is transferred through high-temperature steel and molten steel to the glass surface, which makes glass melt, and they mutually mix and form a mosaic structure.
The fracture occurs at three positions for glass-to-steel sealing: the glass side, the steel side, and the middle of the mosaic structure. The typical surface 3D morphology of the fracture surface is shown in Figure 19. In Figure 19a,a1, the fracture position is located on the glass side. In contrast, in Figure 19b,b1, adhesion occurs on both the glass side and the steel side. Moreover, the fracture, in this situation, is located in the middle of the mosaic structure, and some adhesion peeled off during the facture in a previous report. Thus, the 3D surface morphology is not complete. In Figure 19c,c1, most adhesions are located on the glass side, which means that the fracture is located on the steel side.
During the laser sealing of high aluminum glass to 304 stainless steel, laser action is applied on the glass surface and steel surface, part of the laser energy is absorbed by the surface oxide scale on steel, and part of the laser energy is absorbed by the bottom of steel through the surface oxide layer. A schematic diagram of the formation of the laser sealing seam is shown in Figure 20. With the laser energy’s input, heat accumulation makes 304 steel and glass melt, and, then, the materials mutually mix. Then, they are cooled and form a mosaic structure, namely, the sealing seam.
Figure 21 shows a schematic diagram of the sealing seam for glass-to-metal sealing. When the interface absorbs a small amount of laser energy, only small amounts of glass and metal can be melted, so they form a narrower sealing seam. Thus, the cross-section of the mosaic structure is also smaller, as shown in Figure 21a. When absorbed laser energy is further increased, melted materials from both glass and steel are also increased. Moreover, adhesion is increased on both the glass side and steel side during fracture. Melted glass and melted steel are mixed in a certain way and form a mosaic structure at the interface. Moreover, the cross-section of the sealing seam is shown in Figure 21b. When laser energy is increased continuously, the amounts of melted materials increase. Melted glass content is significantly increased. The motion of the melt pool leads to the mutual mixing of molten glass and steel, and, then, they form a stable mosaic structure. Finally, they form metal particles at the interface after cooling and solidification. The cross-section of the sealing seam is shown in Figure 21c. When laser energy is high enough, glass will absorb excessive energy, which leads to heat accumulation. This makes the glass surface temperature high enough and sustain damage from cracks.
Figure 22 shows a schematic fracture diagram of the change from laser sealing glass to 304 stainless steel sealings. During shear strength tests, sealings are subjected to horizontal force. In Figure 22, when laser energy is low, the amounts of melted glass and melted steel are also low. Thus, the fracture occurs on the glass side. In Figure 22a, the fracture is adjacent to the glass side on the cross-section of the sealing seam, and the sealing seam is small. Figure 22b shows another mode of fracture; here, the fracture is located on the steel side. Thus, when laser energy is low, the fracture position is located on the glass side and steel side, extending in a straight line. Moreover, the sealing strength is comparatively lower. When the laser energy is increased continuously, melted glass and melted steel increase accordingly, and the sealing seam grows. Here, the glass particles and steel particles in the sealing seam mix evenly and finally form a stable mosaic structure. Thus, the fracture occurs in the middle of the mosaic structure due to the bore horizontal force, as shown in Figure 22c. As the strength of glass-to-metal sealing is lower than that of steel, the fracture is located on the glass side. When laser energy is increased further, heat accumulation is overloaded, which damages glass and forms cracks. Due to the existence of cracks, the fracture is located near the glass side, so the sealing strength is very low. Glass and metal that absorb moderate energy form a good mosaic structure. Sealing has maximum strength to resist external damage.

4. Conclusions

A laser was used to weld two dissimilar materials, namely, borosilicate glass and 304 stainless steel, based on three different 304 steel surface conditions, i.e., a polished surface, a pre-oxidation-treated surface, and a laser surface modification surface. Based on the experimental results and data analyses, several important conclusions are summarized as follows:
(1)
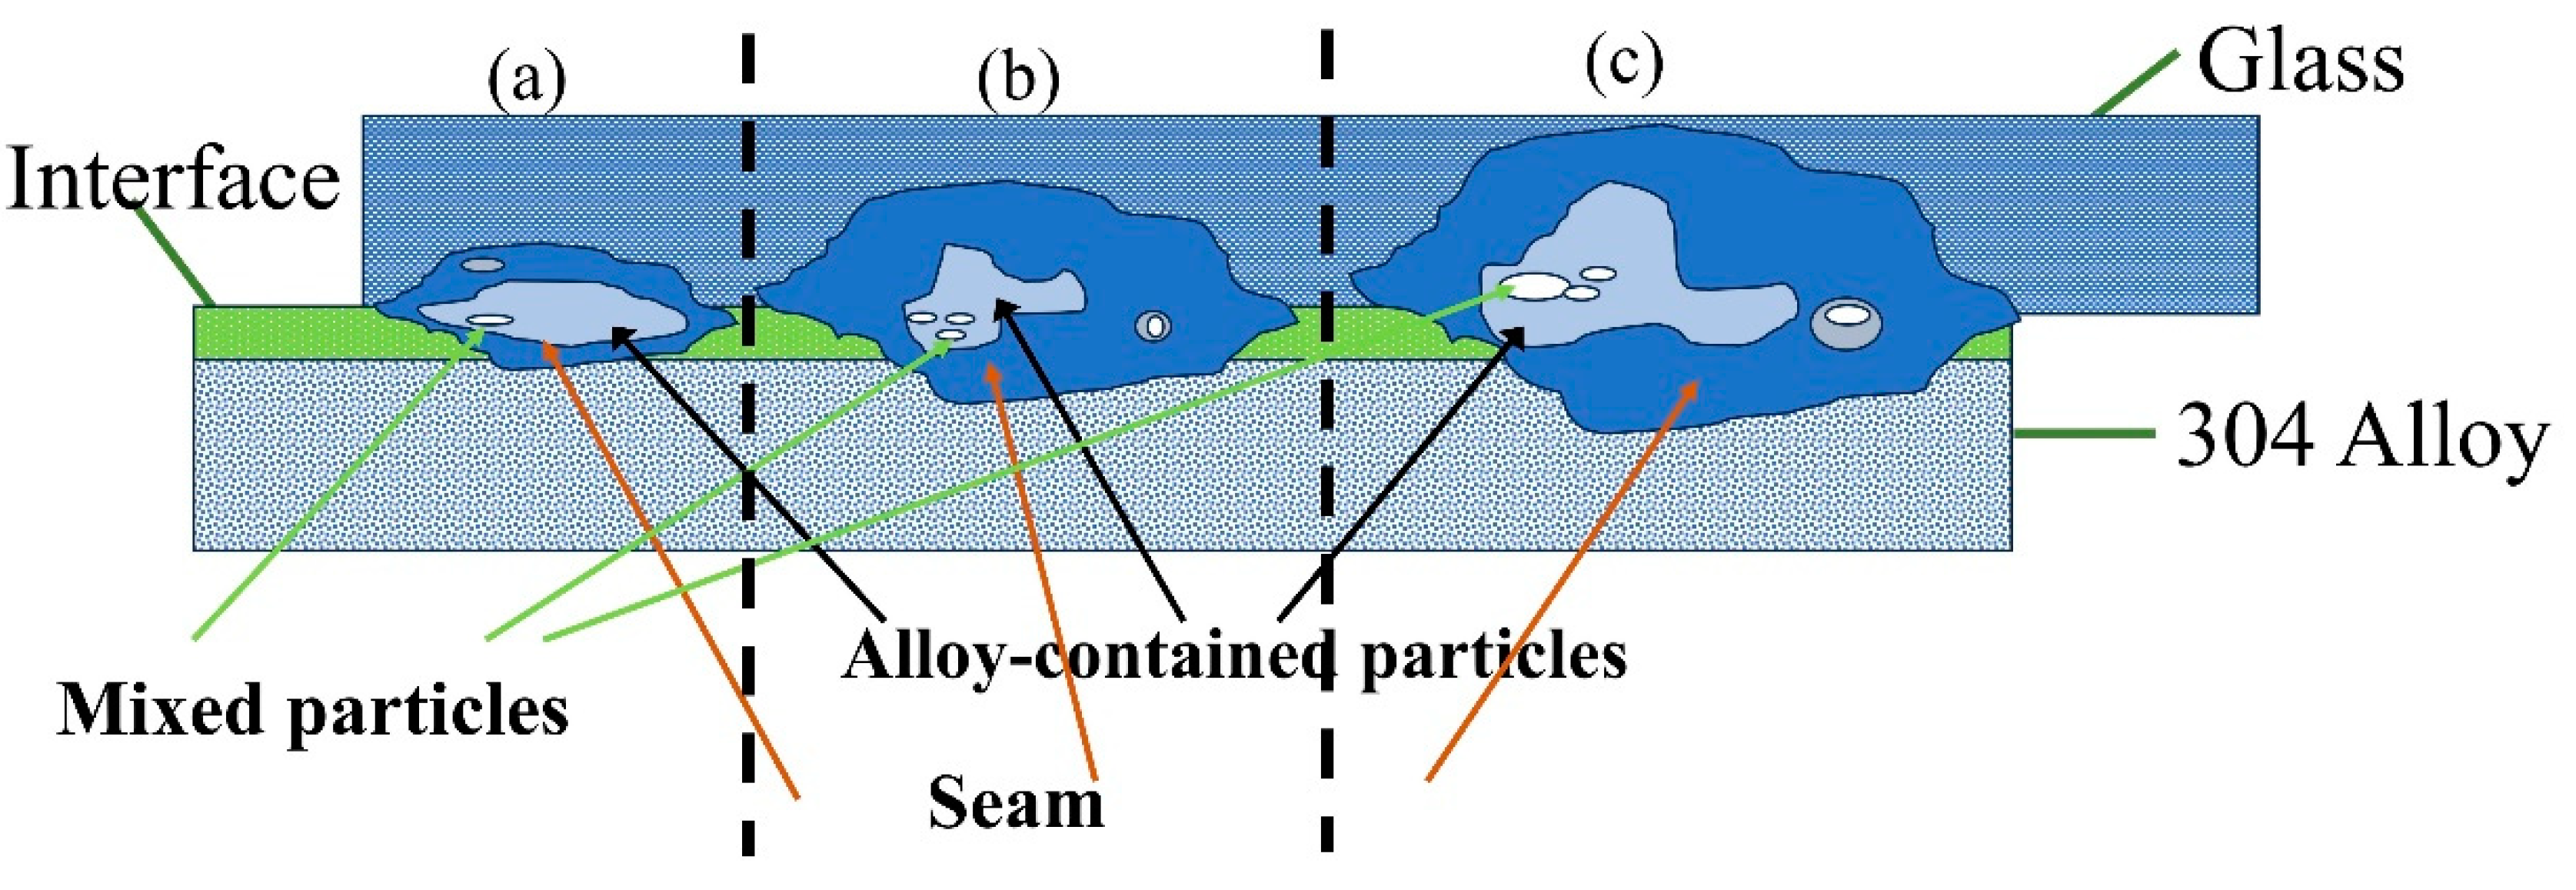
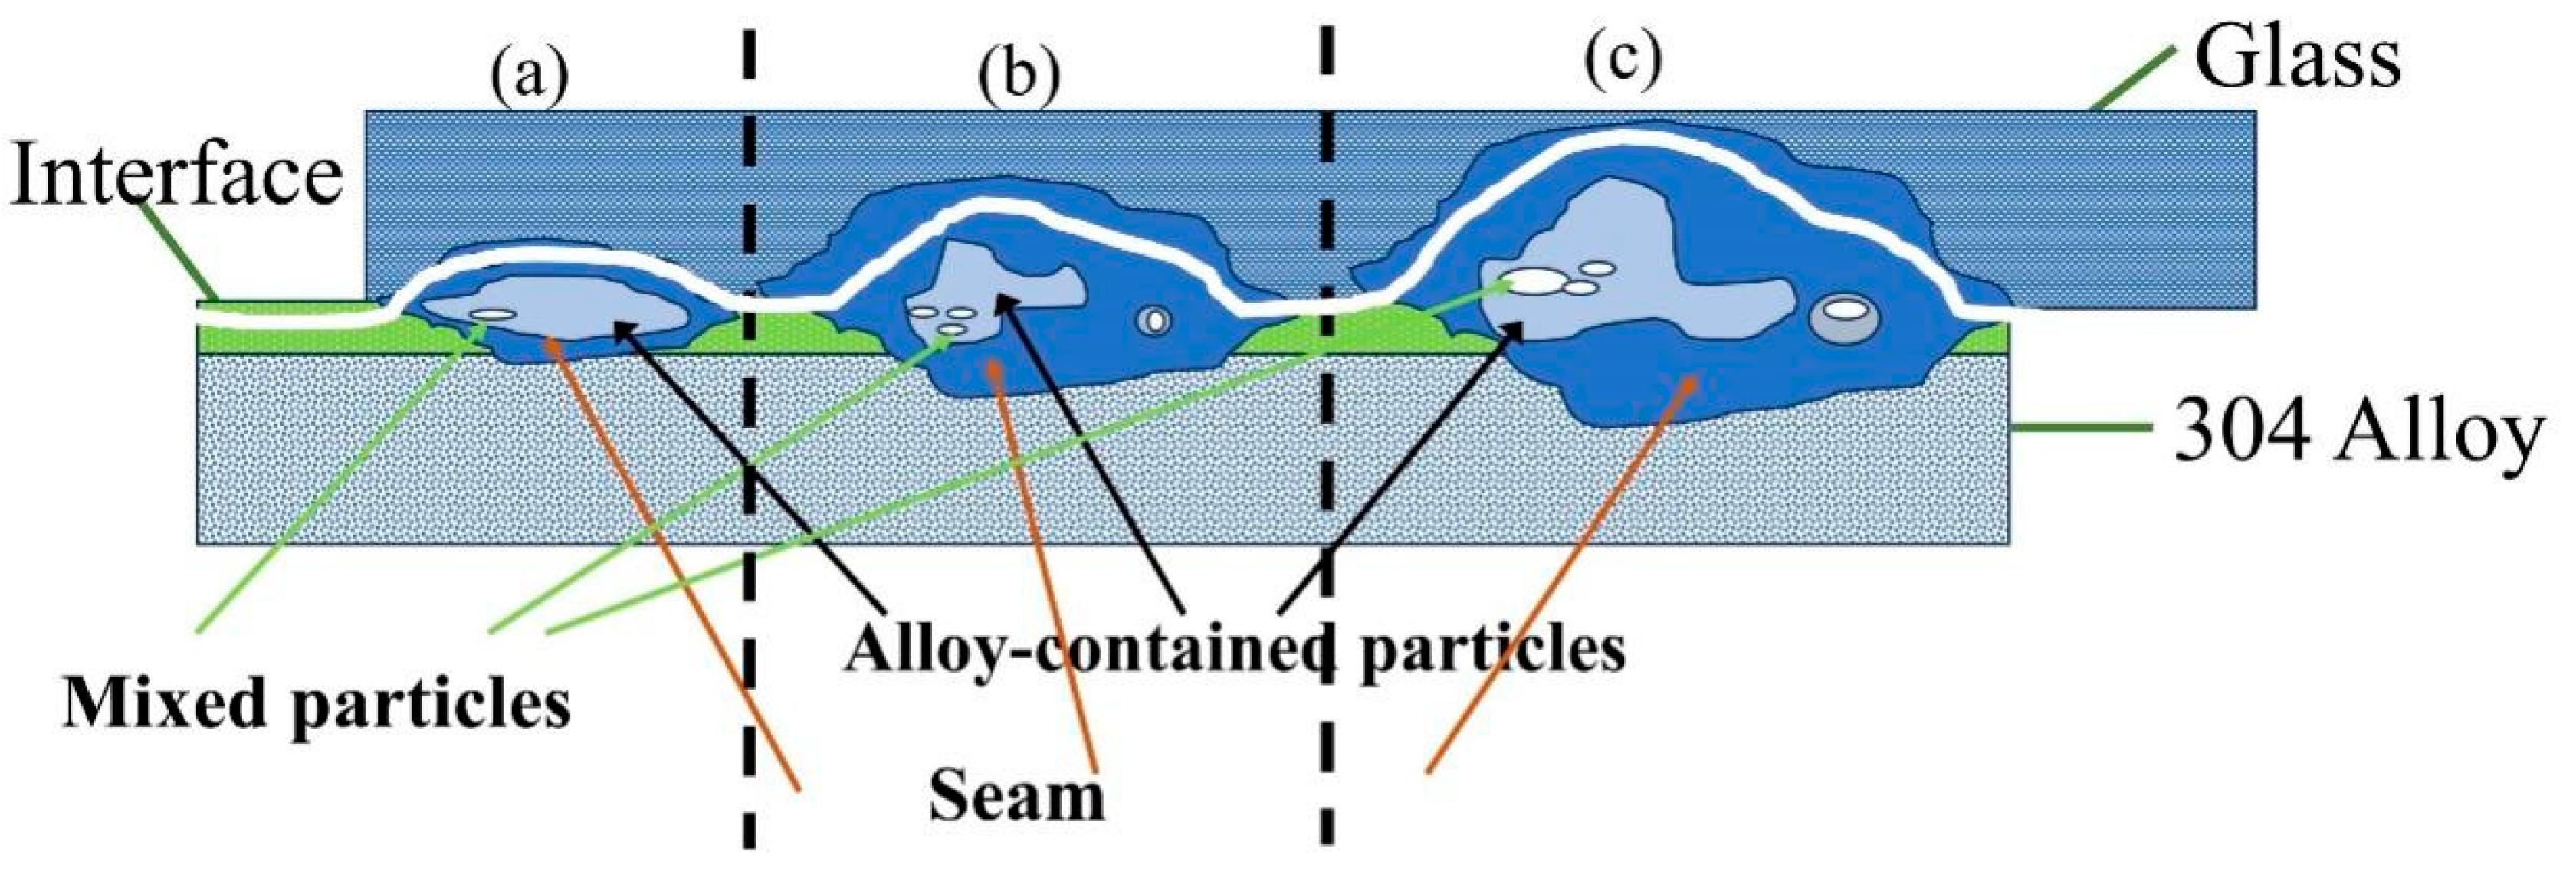
Compared with the unoxidized stainless steel samples, the fracture of the stainless steel and the glass sealing part after the surface oxidation treatment is located in the middle part of the middle structure, and the fracture separation of the unoxidized stainless steel and the glass sealing part is located on the glass substrate side and the stainless steel side. The sealing performance of the stainless steel after the surface oxidation is better, which confirms the role of the oxidation film.
(2)
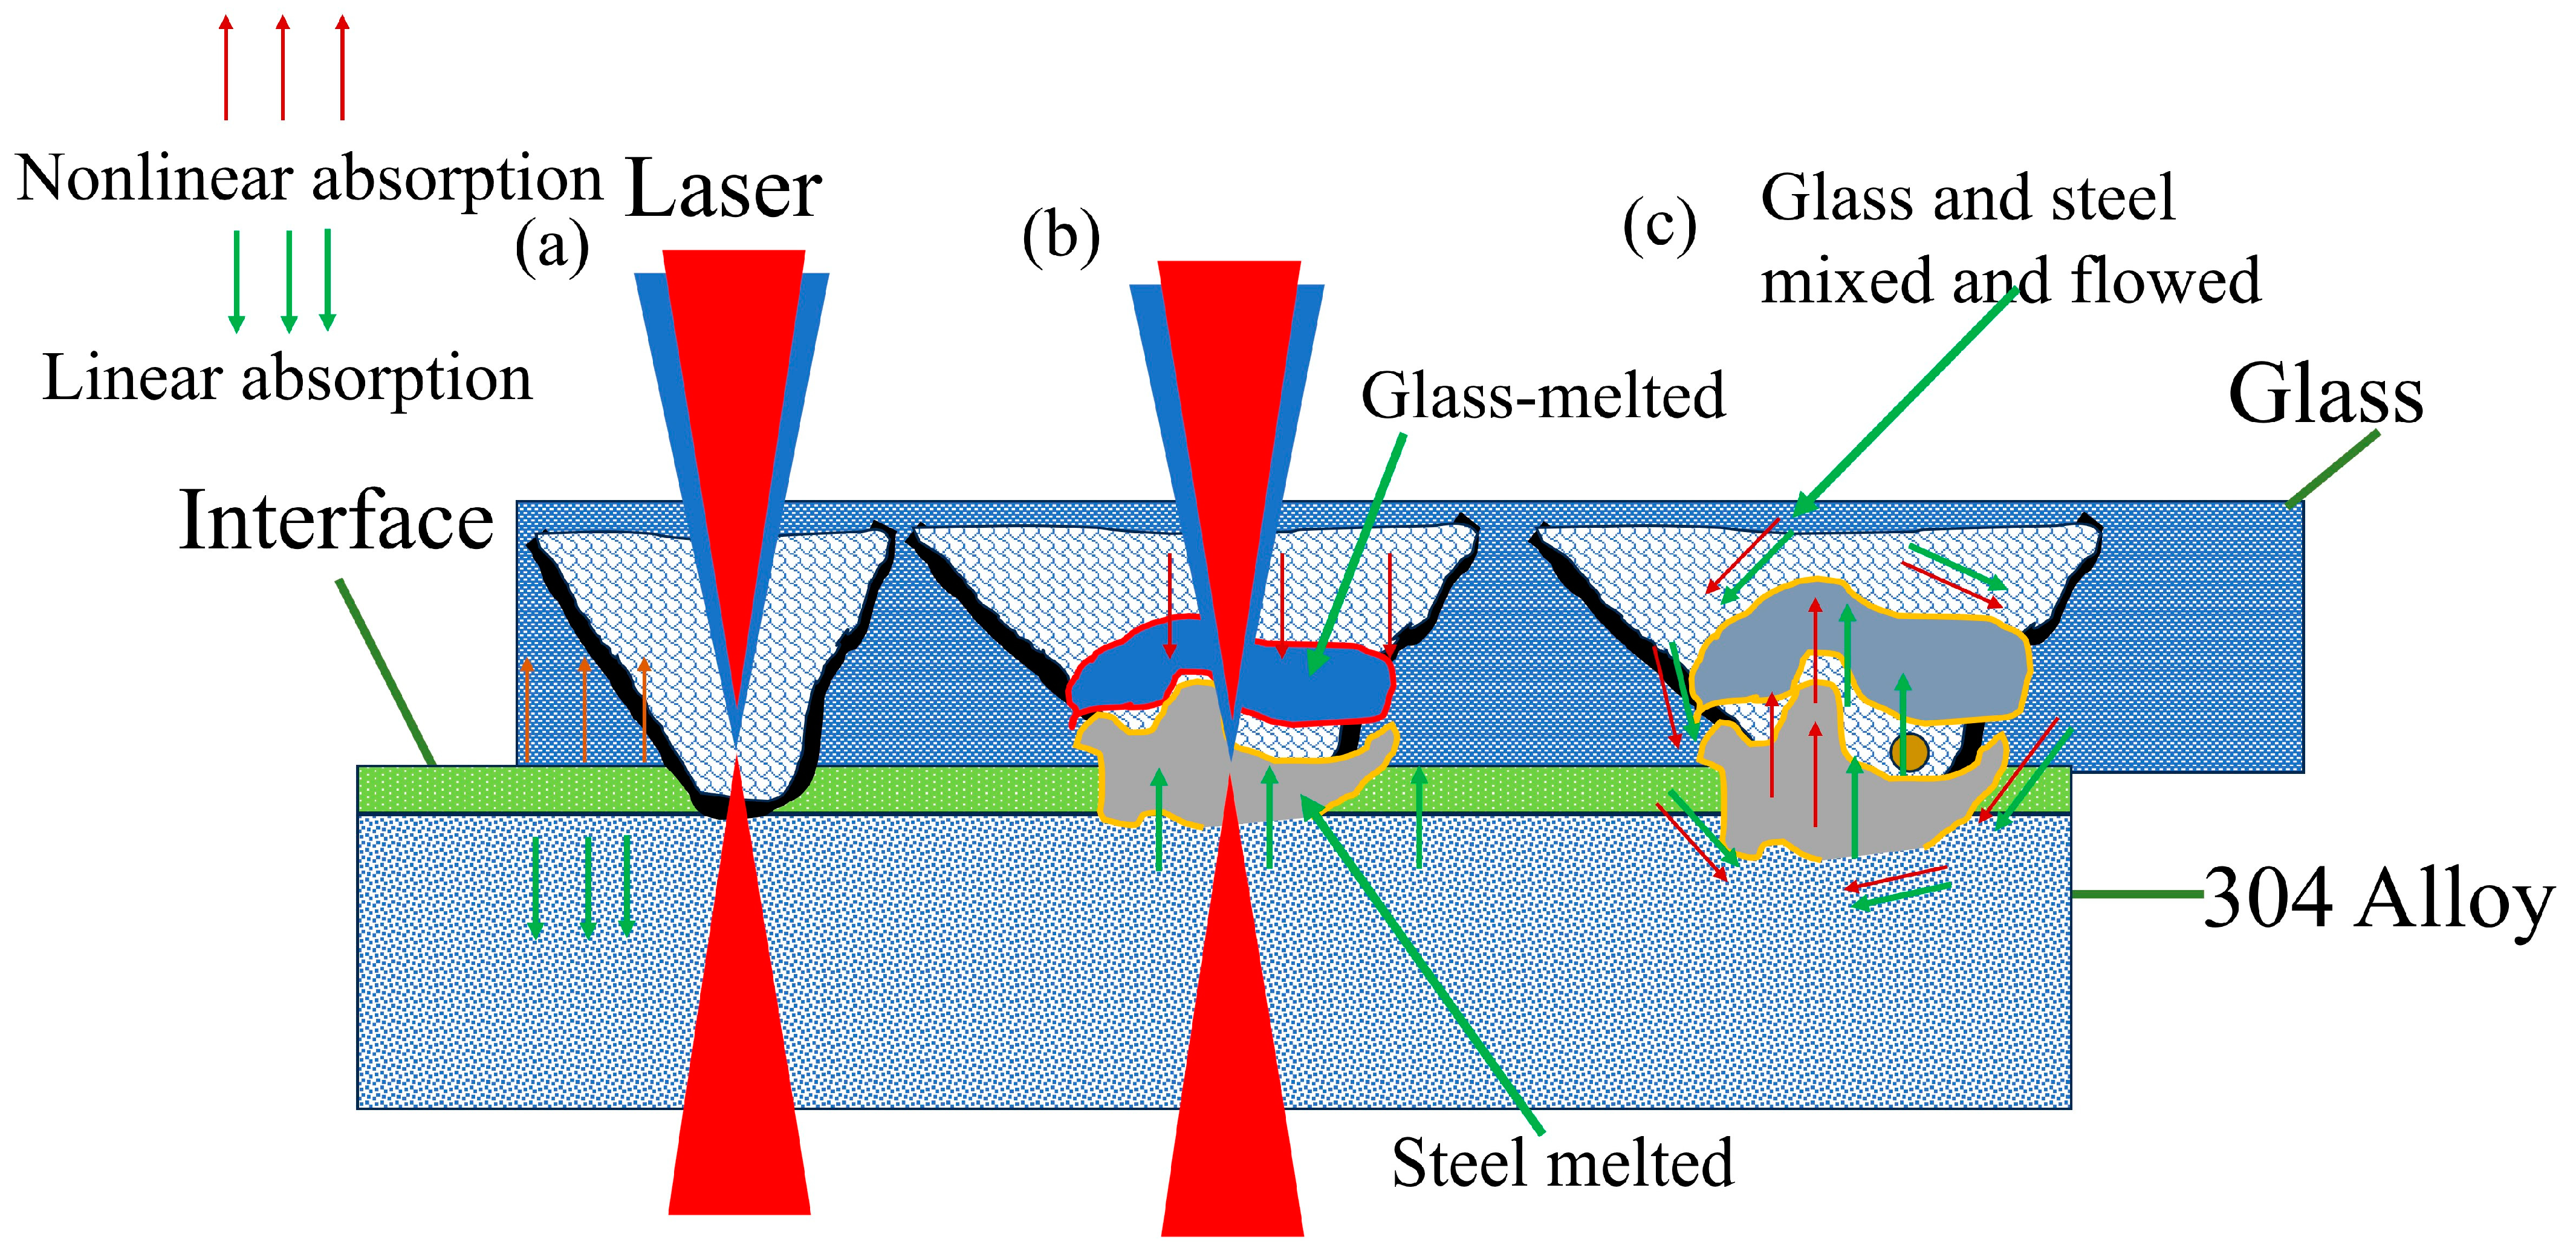
The laser sealing process of ultra-thin glass and 304 stainless steel is divided into three stages: the energy absorption stage, the material melting stage, and the mixed cooling stage. The more energy absorbed, the larger the weld size, and, when less energy is absorbed, the fracture occurs in the glass substrate and the stainless steel substrate. Moreover, the fracture occurs in the middle of the inlaid structure near the glass because its bonding strength is lower than on the lower metal side, while the ability to block the fracture is strongest here; the fracture location of the glass surface is damaged and cracked in the glass substrate when the energy is large.
As traditional sealing methods usually have critical drawbacks, the proposed laser welding methods could meet the ever-increasing demand for efficiency, miniaturization, and environment effectiveness, as they can be used in the welding, mechanical, and optoelectronic industries.

Author Contributions

All authors contributed to this study’s conception and design. Material preparation, data collection, and analysis were performed by B.B., J.S., H.L., C.C. and M.Z. The first draft of this manuscript was written by B.B. and J.S. and all the authors commented on previous versions of the manuscript. All authors have read and agreed to the published version of the manuscript.

Funding

This research was funded by the Jiangsu Province Key Research and Development Program (Grant No. BE2021049), the Open Fund for the State Key Laboratory of Advanced Welding and Joining, the Harbin Institute of Technology [Grant No. AWJ-23Z01], and the Open Fund for the National Key Laboratory for Remanufacturing [Grant No. xxx].

Institutional Review Board Statement

Not applicable.

Informed Consent Statement

Not applicable.

Data Availability Statement

Data are contained within the article.

Conflicts of Interest

The authors declare that they have no known competing financial interests or personal relationships that could have appeared to influence the work reported in this study. The authors declare no conflicts of interest.

References

  1. Liu, Z.; Li, Y.; Liu, W.; Zhou, H.; Aoa, S.; Luo, Z. Enhancing the ultrasonic plastic welding strength of Al/CFRTP joint via coated metal surface and structured composite surface. J. Manuf. Process. 2023, 108, 227–237. [Google Scholar] [CrossRef]
  2. Zhang, M.; Chan, Y.; Chen, C.; Qiu, Z. A new sealing technology for ultra-thin glass to aluminum alloy by laser transmission welding method. Int. J. Adv. Manuf. Technol. 2021, 115, 2017–2035. [Google Scholar] [CrossRef]
  3. Huo, J.; Yuan, J.; Chen, Q.; Luo, M.; Lu, J.; Xu, J.; Li, C.; Luo, A.; Li, J.; Zhang, Q. Welding reinforcement between silica glass and stainless steel using nanosecond fiber laser with chromium interlayer. Opt. Laser Eng. 2024, 172, 107877. [Google Scholar] [CrossRef]
  4. Teshome, F.B.; Peng, B.; Oliveira, J.P.; Shen, J.; Ao, S.; Li, H.; Chen, L.; Tan, C.; Song, X.; Zhou, N.; et al. Role of Pd interlayer on NiTi to Ti6Al4V laser welded joints: Microstructural evolutionand strengthening mechanisms. Mater. Des. 2023, 228, 111845. [Google Scholar] [CrossRef]
  5. Afonso, D.; Lopes, J.G.; Choi, Y.T.; Kim, R.E.; Schell, N.; Zhou, N.; Kim, H.S.; Oliveira, J.P. Dissimilar laser welding of an as-rolled CoCrFeMnNi high entropy alloy to Inconel 718 superalloy. Opt Laser Eng. 2025, 180, 111427. [Google Scholar] [CrossRef]
  6. Zhang, L.; Wu, H.; Wen, J.; Li, M.; Shao, X.; Ma, X. Glass to aluminum joining by forming a mechanical pin structure using femtosecond laser. J. Mater. Process. Tech. 2022, 302, 117504. [Google Scholar] [CrossRef]
  7. Hang, L.; Zhu, Z.; Xu, T.; Wu, H.; Ma, X. Enhanced joint through significant diffusion and molten pool regions in fused silica to aluminum alloy welding by femtosecond mJ-pulses. Int. J. Adv. Manuf. Technol. 2023, 129, 601–610. [Google Scholar] [CrossRef]
  8. Lipat’eva, T.O.; Fedotov, S.S.; Lipat’ev, A.S.; Lotarev, S.V.; Shakhgil’dyan, G.Y.; Ryabov, K.V.; Sigaev, V.N. Precision Laser Welding of Silica Glass with Iron-Nickel Alloy. Glass Ceram 2021, 77, 435–437. [Google Scholar] [CrossRef]
  9. Hu, K.; Li, S.; Fan, Z.; Yan, H.; Liang, X.; Cai, Y.; Zhu, Q.; Zhang, Y. Contributions of mechanical bonding and chemical bonding to high-temperature hermeticity of glass-to-metal compression seals. Mater. Des. 2021, 202, 109579. [Google Scholar] [CrossRef]
  10. Donald, I.W. Preparation, properties and chemistry of glass- and glass-ceramic-to-metal seals and coatings. J. Mater. Sci. 1993, 28, 2841–2886. [Google Scholar] [CrossRef]
  11. Li, P.; Xu, X.; Tan, W.; Liu, H.; Wang, X. Improvement of Laser Transmission Welding of Glass with Titanium Alloy by Laser Surface Treatment. Materials 2018, 11, 2060. [Google Scholar] [CrossRef] [PubMed]
  12. Ciuca, O.P.; Carter, R.M.; Prangnell, P.B.; Hand, D.P. Characterisation of weld zone reactions in dissimilar glass-to-aluminium pulsed picosecond laser welds. Mater. Charact. 2016, 120, 53–62. [Google Scholar] [CrossRef]
  13. Elrefaey, A.; Janczak-Rusch, J.; Koebel, M.M. Direct glass-to-metal joining by simultaneous anodic bonding and soldering with activated liquid tin solder. J. Mater. Process. Tech. 2014, 214, 2716–2722. [Google Scholar] [CrossRef]
  14. Hu, L.; Xue, Y.; Wang, H. Glass-Cu joining by anodic bonding and soldering with eutectic Sn-9Zn solder. J. Alloys Compd. 2019, 789, 558–566. [Google Scholar] [CrossRef]
  15. Xia, H.; Yang, B.; Su, J.; Liu, Y.; Su, X.; Wang, C.; Qiang, X.; Wu, T.; Tan, C. Improvement of laser welded TC4/CFRTP joint strength by combination of surface modification of MAO and laser texturing. Thin-Walled Struct. 2024, 196, 111409. [Google Scholar] [CrossRef]
  16. Xu, M.; Chen, C.; Shao, J.; Zhang, M. Effect of High-Temperature Oxidation on Laser Transmission Welding of High Borosilicate Glass and TC4 Titanium Alloy. J. Mater. Eng. Perform. 2024, 33, 1–11. [Google Scholar] [CrossRef]
  17. Shen, J.; Chen, C.; Zhang, M. Microscopic Analysis of the Wetting Morphology and Interfacial Bonding Mechanism of Preoxidised Kovar Alloys with Borosilicate Glass. Materials 2023, 16, 4628. [Google Scholar] [CrossRef]
  18. Ready, J.F. Industrial Applications of Lasers, 2nd ed.; Academic Press Limited: Cambridge, MA, USA, 1997. [Google Scholar]
  19. Gong, K.; Liu, Z.; Cai, Y.; Song, Z.; Zhou, C.; Liu, J.; Zhao, Y.; Zhang, Y. Revealing the effect of alumina addition on the residual stress in glass-to-metal seals via photoluminescence spectroscopy. J. Alloys Compd. 2024, 1009, 176878. [Google Scholar] [CrossRef]
  20. Li, N.; Li, Z.; Kang, M.; Zhang, J. Numerical simulation and experimental study on laser micromachining of 304L stainless steel in ambient air. Int. J. Heat Mass. Transf. 2019, 140, 978–991. [Google Scholar] [CrossRef]
  21. Xu, J.; Zou, P.; Wang, W.; Kang, D. Study on the mechanism of surface topography evolution in melting and transition regimes of laser polishing. Opt. Laser Technol. 2021, 139, 106947. [Google Scholar] [CrossRef]
  22. Xu, J.; Zou, P.; Kang, D.; Wang, W. Theoretical and experimental study of bulge formation in laser polishing of 304 stainless steel. J. Manuf. Process. 2021, 66, 39–52. [Google Scholar] [CrossRef]
  23. Sui, L.; Chen, C.; Zhang, M. Wetting and Sealing of the Interface Between High-Alumina Glass and 304 Stainless Steel. J. Mater. Eng. Perform. 2023, 19, 9047–9058. [Google Scholar] [CrossRef]
Figure 1. The laser welding (sealing) of a glass and 304 stainless steel alloy: (a) a schematic diagram of the shear test, (b) a schematic diagram of the fixture used for the measurement of the shear strength, (c) a three-dimensional finite element model of glass and 304 stainless steel, and (d) the weld mesh refinement area.
Coatings 15 00101 g001
Figure 2. Laser-welded specimens under different steel surface conditions: (a) untreated steel surface, (b) pre-oxidation steel surface, (c) laser surface melted steel surface (the red circle is the laser surface melting zone), and (d,e) the cross-section of the oxide scale for the pre-oxidation-treated sample (d) and laser surface melted sample (e).
Coatings 15 00101 g002
Figure 3. The surface morphology and its corresponding 3D surface morphology: (a,a1) sample surface after pre-oxidation; (b,b1) laser surface melting under different magnifications; and (c,c1) 3D surface morphology.
Coatings 15 00101 g003aCoatings 15 00101 g003b
Figure 4. Surface sealing seam morphology after different surface treatments: (a) without surface treatment (unoxidized alloy); (b) surface pre-oxidation in high-temperature furnace; and (c) laser surface-induced surface oxidation.
Coatings 15 00101 g004
Figure 5. The effects of laser parameters on the sealing strength under different surface treatments: (a) laser power; (b) laser scan speed; (c) pulse width; and (d) laser frequency.
Coatings 15 00101 g005
Figure 6. Shear force changes over time.
Coatings 15 00101 g006
Figure 7. Surface fracture morphology for glass-to-metal sealing subjected to different surface treatments: (a,a1) nontreated (unoxidized) steel surface; (b,b1) high-temperature pre-oxidation; (c,c1) laser surface oxidation treatment; (ac) fracture surface on glass side; and (a1c1) fracture surface on steel side.
Coatings 15 00101 g007
Figure 8. Cross-section morphology for glass-to-metal sealing seam under different surface treatments for steel: (a) nontreated (unoxidized) steel samples; (b) high-temperature pre-oxidation treatment; and (c) laser surface oxidation treatment (glass zone CS after cooling and solidification).
Coatings 15 00101 g008
Figure 9. EDS map analysis for sealing under different surface treatments: (a) nontreated (unoxidized) steel surface; (b) high-temperature pre-oxidation; and (c) laser surface oxidation treatment.
Coatings 15 00101 g009
Figure 10. XRD results for glass and steel substrates: (a) glass substrate; and (b) steel substrate.
Coatings 15 00101 g010
Figure 11. XRD results of the fracture surface: (a) glass side; and (b) steel alloy side.
Coatings 15 00101 g011
Figure 12. Observation point temperature change diagram: (a) untreated; (b) high-temperature pre-oxidation treatment; and (c) laser oxidation treatment.
Coatings 15 00101 g012
Figure 13. X-axis, y-axis, and z-axis directions of temperature-derived path.
Coatings 15 00101 g013
Figure 14. (a) X-axis, (b) y-axis, and (c) z-axis directions of the temperature-derived results.
Coatings 15 00101 g014
Figure 15. The position diagram of the temperature measurement point at the bottom of 304 steel.
Coatings 15 00101 g015
Figure 16. The actual experimental measurement temperature results and simulated temperature results of four temperature measurement points.
Coatings 15 00101 g016
Figure 17. Three-dimensional finite element model of glass and 304 stainless steel, with a stress diagram depicting different surface treatment methods: (a) untreated sample; (b) sample after high-temperature pre-oxidation treatment; and (c) sample after laser oxidation treatment.
Coatings 15 00101 g017
Figure 18. Thermal stress: (a) untreated; (b) high-temperature pre-oxidation treatment; and (c) laser oxidation treatment.
Coatings 15 00101 g018
Figure 19. Three-dimensional surface morphology for fracture position of sealing seam: (a,a1) glass side; (b,b1) middle part of mosaic structure; (c,c1) steel side; (ac) fracture on glass side; and (a1c1) fracture on steel side.
Coatings 15 00101 g019
Figure 20. Schematic diagram of formation of laser welding seam for glass-to-metal sealing: (a) laser action; (b) melted stage; (c) glass and steel mutually mixing and flowing.
Coatings 15 00101 g020
Figure 21. Schematic diagram of sealing seam formation under different laser energies: (a) low laser energy; (b) moderate energy; (c) high laser energy.
Coatings 15 00101 g021
Figure 22. Schematic diagram of fracture for glass and steel sealing: (a) fracture mode 1; and (b) fracture mode 2. (c) fracture mode 3.
Coatings 15 00101 g022
Table 1. Selected laser processing parameters used in the present experiments.
No.P (W)V (mm/s)pw (ms)f (Hz)
114022.510
215022.510
316022.510
417022.510
518022.510
619022.510
714021.510
815021.510
916021.510
1017021.510
1118021.510
1219021.510
131402210
141502210
151602210
161702210
171802210
181902210
191402310
201502310
211602310
221702310
231802310
241902310
2514012.510
2614032.510
2714042.510
2814052.510
2916012.510
3016032.510
3116042.510
3216052.510
3319012.510
3419032.510
3519042.510
3619052.510
3714022.55
3814022.515
3914022.520
4016022.55
4116022.515
4216022.520
4319022.55
4419022.515
4519022.520
Table 2. Physical parameters of high-alumina glass [18,19].
MaterialsDensity
g/cm3
Melting Point
°C
Conductivity
W·m−1K−1
Expansion
10−6K−1
Cp
J/(kg°C)
Elastic Modulus
GPa
High-alumina glass2.398901.27.5883070
Table 3. Physical parameters of 304 stainless steel [20,21,22].
MaterialsDensity
g/cm3
Melting Point
°C
Conductivity
W·m−1K−1
Expansion
10−6K−1
Cp
J/(kg°C)
Elastic Modulus
GPa
304 stainless steel7.93145416.317.3500200
Disclaimer/Publisher’s Note: The statements, opinions and data contained in all publications are solely those of the individual author(s) and contributor(s) and not of MDPI and/or the editor(s). MDPI and/or the editor(s) disclaim responsibility for any injury to people or property resulting from any ideas, methods, instructions or products referred to in the content.

