Article

Aluminum Co-Deposition via DC Magnetron Sputtering for Enhanced Pitting Resistance of Copper–Nickel Alloys

1
Department of Mechanical System Engineering, Gyeongsang National University, 2 Tongyeonghaean-daero, Tongyeong 53064, Republic of Korea
2
Division of Marine Mechatronics, Mokpo National Maritime University, 91 Haeyangdaehak-ro, Mokpo-si 58628, Republic of Korea
3
Department of Energy & Mechanical Engineering and Institute of Marine Industry, Gyeongsang National University, 2 Tongyeonghaean-daero, Tongyeong 53064, Republic of Korea
*
Author to whom correspondence should be addressed.
Coatings 2024, 14(1), 132; https://doi.org/10.3390/coatings14010132
Submission received: 28 November 2023 / Revised: 25 December 2023 / Accepted: 16 January 2024 / Published: 19 January 2024
(This article belongs to the Section Corrosion, Wear and Erosion)

Abstract

:
To investigate the improvements in the resistance of Cu–Ni alloys to surface pitting corrosion, Cu–Ni thin films containing Al were fabricated via DC magnetron sputtering. The morphologies of the fabricated samples were obtained using a scanning electron microscopy, which yielded information on the crystal size and sample surface before and after corrosion tests. X-ray diffraction was employed for the structural characterization of the as-deposited films, and vibrational spectroscopy was used to verify the corrosion products. The corrosion behaviors of the Cu–Ni and Cu–Ni–Al samples were examined using electrochemical polarization and cyclic corrosion tests. The Al co-deposited samples showed a refined crystal size as compared to the Cu–Ni sample, suggesting that they are more susceptible to the formation of a passivation film. The corrosion current density of the Cu–Ni–Al was reduced, and the corrosion potential was lower than that without Al content. The negative shift in the corrosion potential of the Al-containing samples indicates that the Al2O3 film suppressed the cathodic reaction, resulting in a decrease in the corrosion rate. These results are consistent with the cyclic corrosion test results, in which no pitting corrosion is observed in the Cu–Ni–Al sample.

1. Introduction

The Cu-Ni alloy is highly versatile, owing to its impressive corrosion resistance, suitable mechanical properties, and excellent thermal and electrical conductivity [1,2]. Its outstanding characteristics have made it a prevalent choice for applications in marine environments [3,4]. Initially developed for military applications, this alloy has found extensive use in diverse sectors, including heat exchangers, seawater piping on ships, and marine plants [5,6,7]. The excellent corrosion resistance of the Cu–Ni alloy is mainly because of the rapid formation of CuxO corrosion products in the initial stages of the corrosion reaction; in particular, the passivating Cu2O film protects the copper matrix [8,9]. Moreover, replacing Cu+ ions with Ni+ ions in porous Cu2O films increases the electrical resistance, thereby improving the corrosion resistance and the thermodynamic stability of the Cu itself. [10].
However, despite the excellent performance of the alloy, failure occurs in marine environments wherein Cl ions are present [11,12]. Materials used in modern industries, such as wind power generators and offshore plants, require high corrosion resistance and need to be used for a long duration in severe environments [13,14]. Therefore, highly corrosion-resistant materials that can withstand harsh environmental conditions must be developed.
Aluminum is a light and strong metal that quickly forms a passive Al2O3 layer when exposed to external environments [15]. Al2O3-based melt-grown ceramics also have attracted great attention due to their excellent high-temperature performance, inherent thermochemical stability, and excellent oxidation resistance at temperatures near the melting point in oxidizing environments [16,17]. In addition, Waku et al. [18] found that Al2O3/GdAlO3 maintained its unique performance even after heat treatment at 1700 °C for 500 h in an atmospheric environment. Consequently, it is widely used in various other fields, such as in aerospace applications and as an alloy element [19]. Typically, the Zn–Mg–Al alloy produced by adding Al to the Zn–Mg alloy exhibits a corrosion resistance five times better than that obtained via hot-dip galvanizing [20,21]. Furthermore, as several prior studies have demonstrated that aluminum-based alloys have greater corrosion resistance in the presence of chloride ions than do non-aluminum alloys [22], the addition of Al to Cu–Ni alloys is expected to improve their corrosion resistance. Upon exposure to oxygen in the air, aluminum and copper form oxide films (Al2O3 and Cu2O, respectively) on their surfaces. These oxide films serve as protective layers, providing corrosion resistance and contributing to the passivation of the material surface. In this context, the oxide films on aluminum and copper act as barriers, which not only inhibit corrosion but also limit the penetration of corrosive agents, including hydrogen, into the Ni-Cu-Al coating. The protective attributes of these oxide films play a crucial role in reducing the risk of hydrogen embrittlement by minimizing the coating’s exposure to corrosive environments [23,24].
Coating techniques that can improve corrosion resistance or provide the desired properties at reduced costs have been extensively studied over the past several years [25,26,27]. In particular, physical vapor deposition (PVD) is a method for manufacturing thin films by evaporating a solid material using heat or kinetic energy in a vacuum. Because the method is performed in a vacuum, it can yield a high-quality thin film with low pollution. Sputtering, a PVD process, has been used in many studies because of the ease of adjustment of the composition and thickness of the deposited thin film in accordance with user requirements. In particular, the properties of materials can be improved by adding other elements to the existing alloys or by realizing a multilayer structure [28,29,30].
In this study, Cu–Ni and Cu–Ni–Al thin alloy films were deposited using a direct-current (DC) magnetron sputtering system. The changes in the thin film upon Al addition to the alloy were examined through material analysis. Further, the corrosion resistance was evaluated via cyclic corrosion and electrochemical tests.

2. Materials and Method

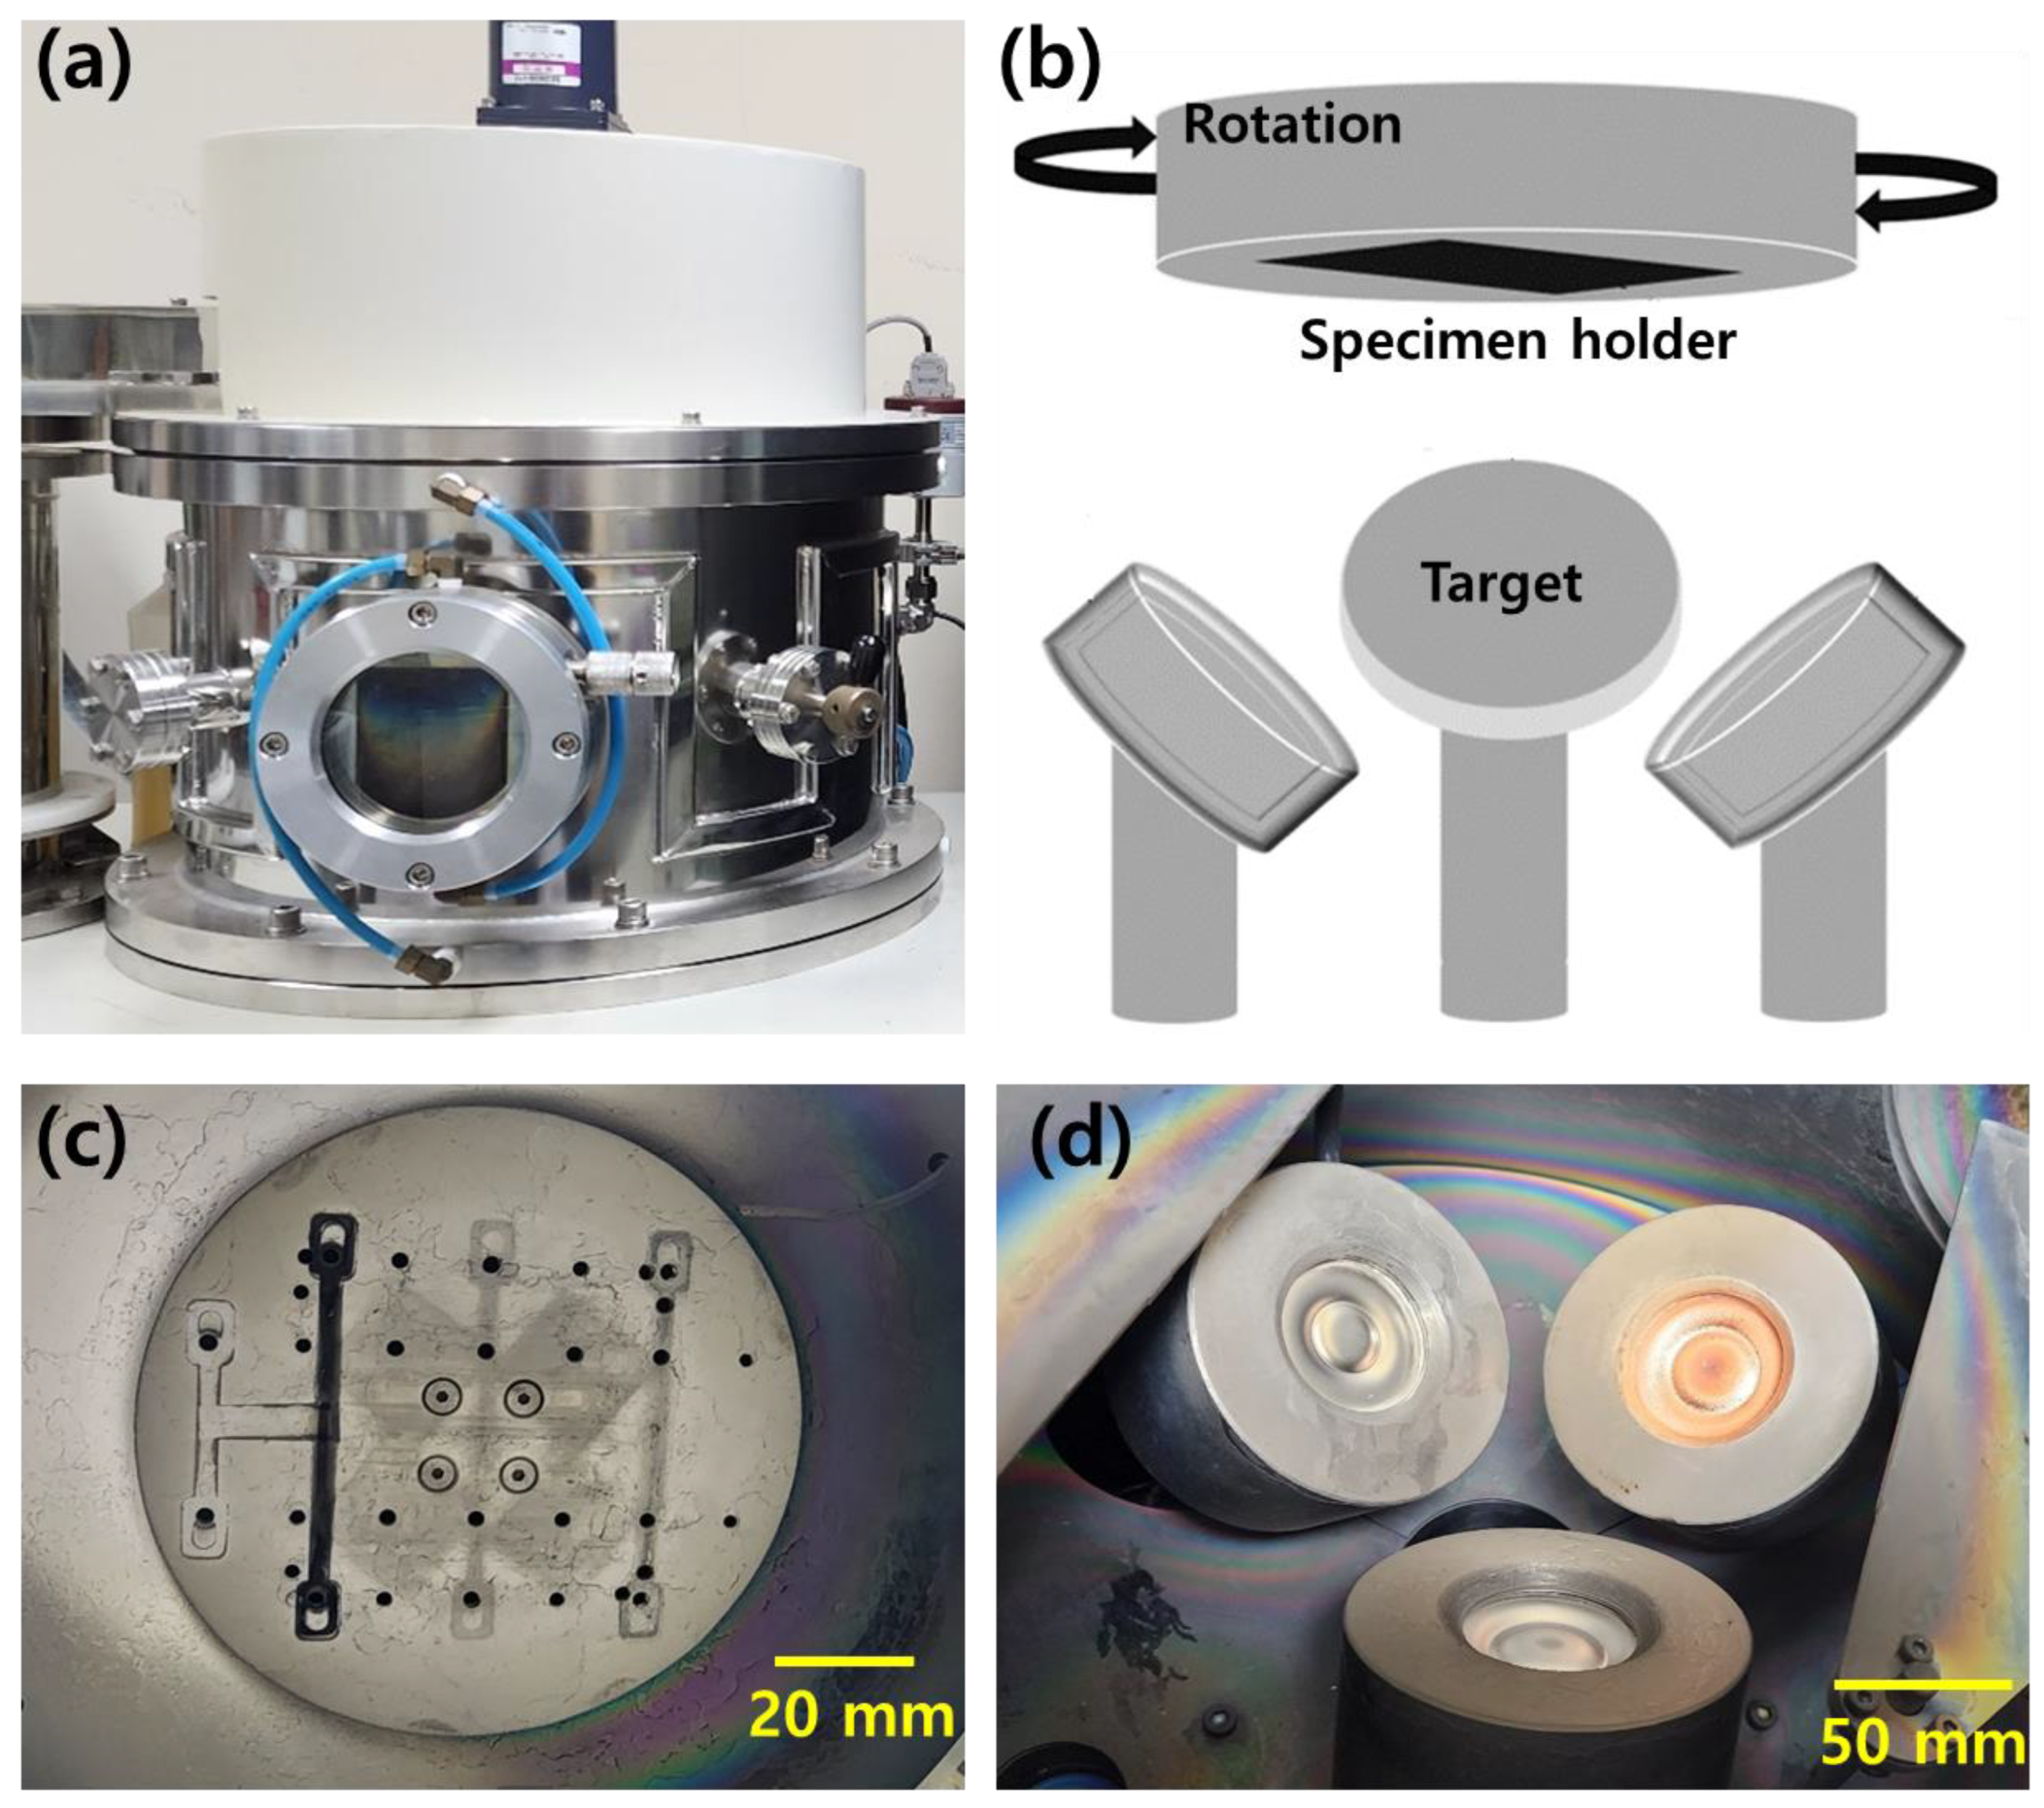
2.1. Preparation of Cu–Ni and Cu–Ni–Al Thin Films

Cu–Ni and Cu–Ni–Al thin films were deposited via DC magnetron sputtering using pure Cu (99.99%), Ni (99.99%), and Al (99.99%) targets on stainless-steel (STS) plates. Figure 1 shows a schematic of the sputtering equipment used for deposition. The polished STS plate used as the substrate was 80ⅹ80 mm in size, and it was ultrasonically washed with acetone and ethyl alcohol to remove contamination before deposition. The chamber base pressure, working pressure, and Ar gas flow were set at 5.0 × 10⁻⁶ torr, 2.0 × 10⁻³ torr, and 20 sccm, respectively. Each target was pre-sputtered for 15 min to remove contaminants from the surface prior to deposition. The deposition conditions were as follows: the temperature was set at 360 °C, the deposition time was 2 h, the power of the Cu target was fixed at 160 W, and the powers of the Ni and Al targets were changed to adjust the composition of each specimen. Our experiments were conducted with a coating thickness of approximately 1 µm.

2.2. Materials Characterization

The morphology and composition of the specimens before and after the corrosion experiment were observed using field-emission scanning electron microscopy (FE-SEM; Mira3 LM, TESCAN, Brno, Czech Republic) and energy-dispersive spectrometry (EDS, Ultim@MAX, Oxford Instruments, Abingdon, UK) at an acceleration voltage of 15 kV. Before and after the corrosion experiment, the crystal structures of the specimens were measured using an X-ray diffractometer (XRD; Ultima IV, Rigaku, Tokyo, Japan) with CuKα radiation. After the corrosion experiment, a Raman spectrometer (RAMANtouch, Nonophoton, Tokyo, Japan) with a 785 nm laser was used to observe the oxidation state of Cu. Spectral measurements from 100 to 1200 cm−1 were recorded for each specimen.

2.3. Corrosion Evaluation

To evaluate the corrosion resistance of the specimens, cyclic corrosion tests (CCTs) were performed according to the ISO 14993 standard (equipment: Q-FOG, CCT-600). The ISO 14993 standard conditions are presented in Table 1. The test proceeded for up to 10 cycles, and a specimen surface image was obtained for each cycle to observe the change in the surface as the CCT progressed. A polarization test was performed to determine the corrosion potential and corrosion current density of the specimen using a workstation (VSP Potentiostat, Biological) with an Ag/AgCl reference electrode and a platinum counter electrode in the range −0.2 V to 1.2 V at a scan rate of 1 mV/s in 3.5% NaCl solution.

3. Results and Discussion

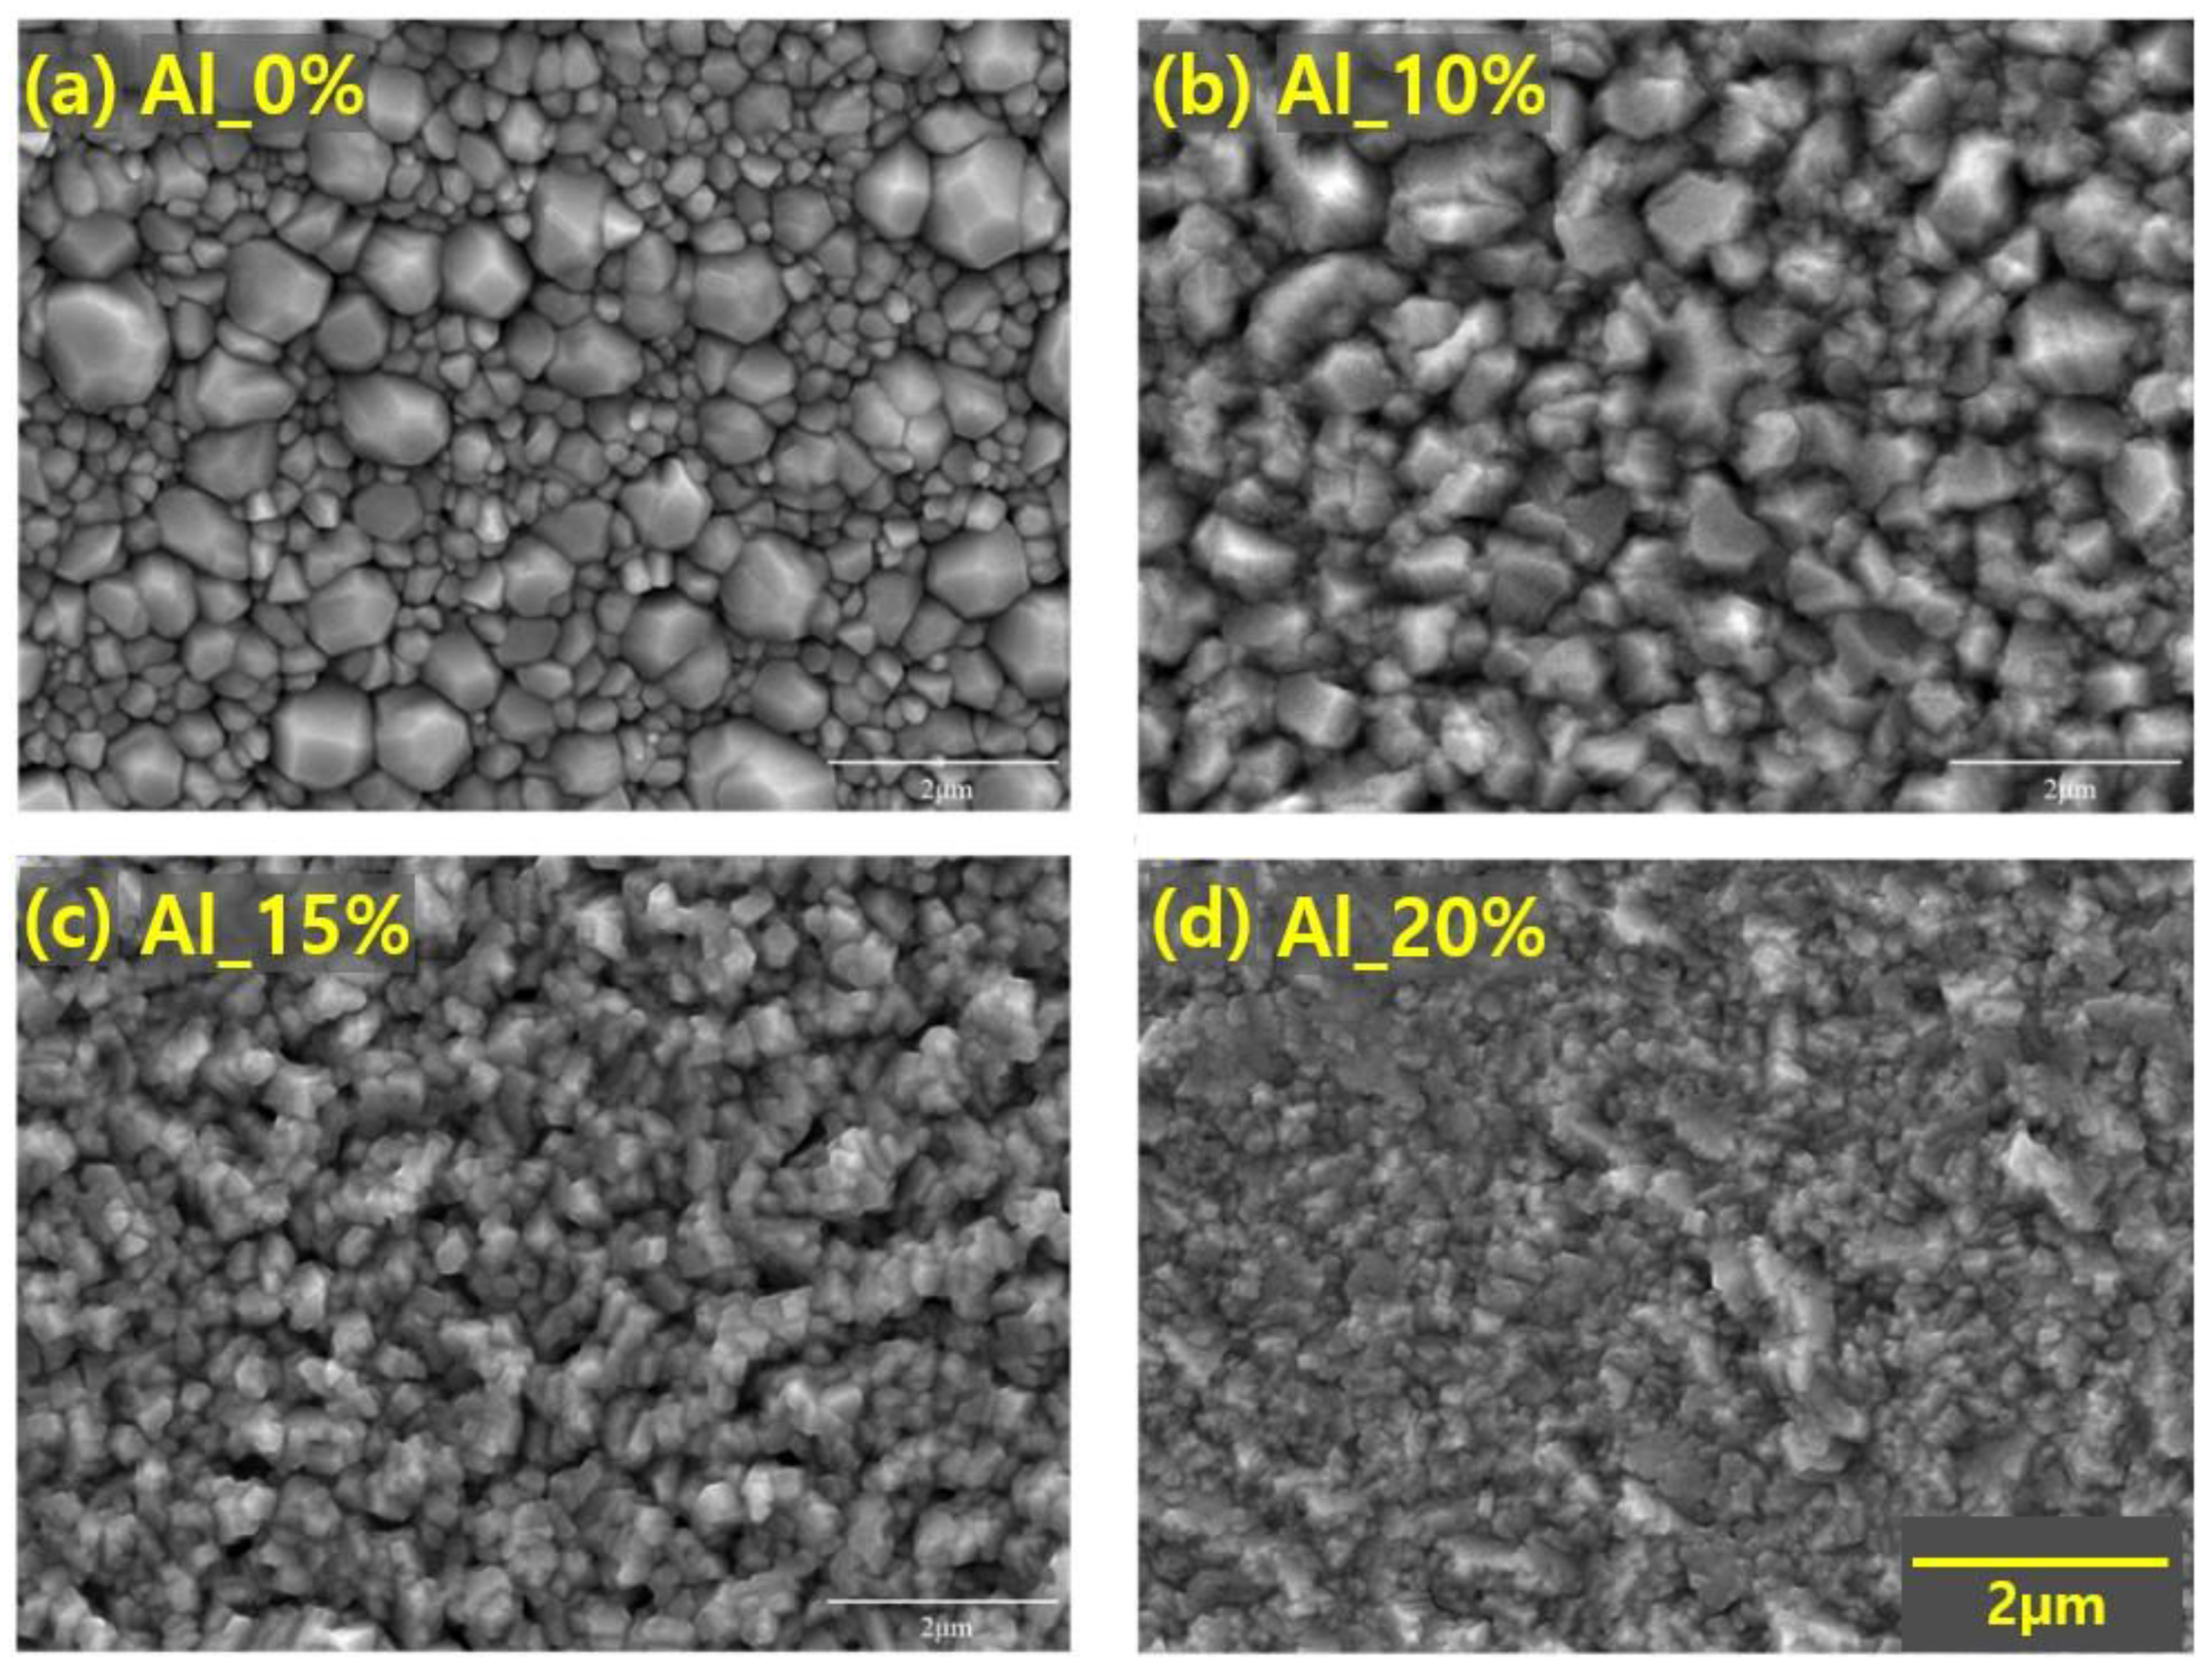
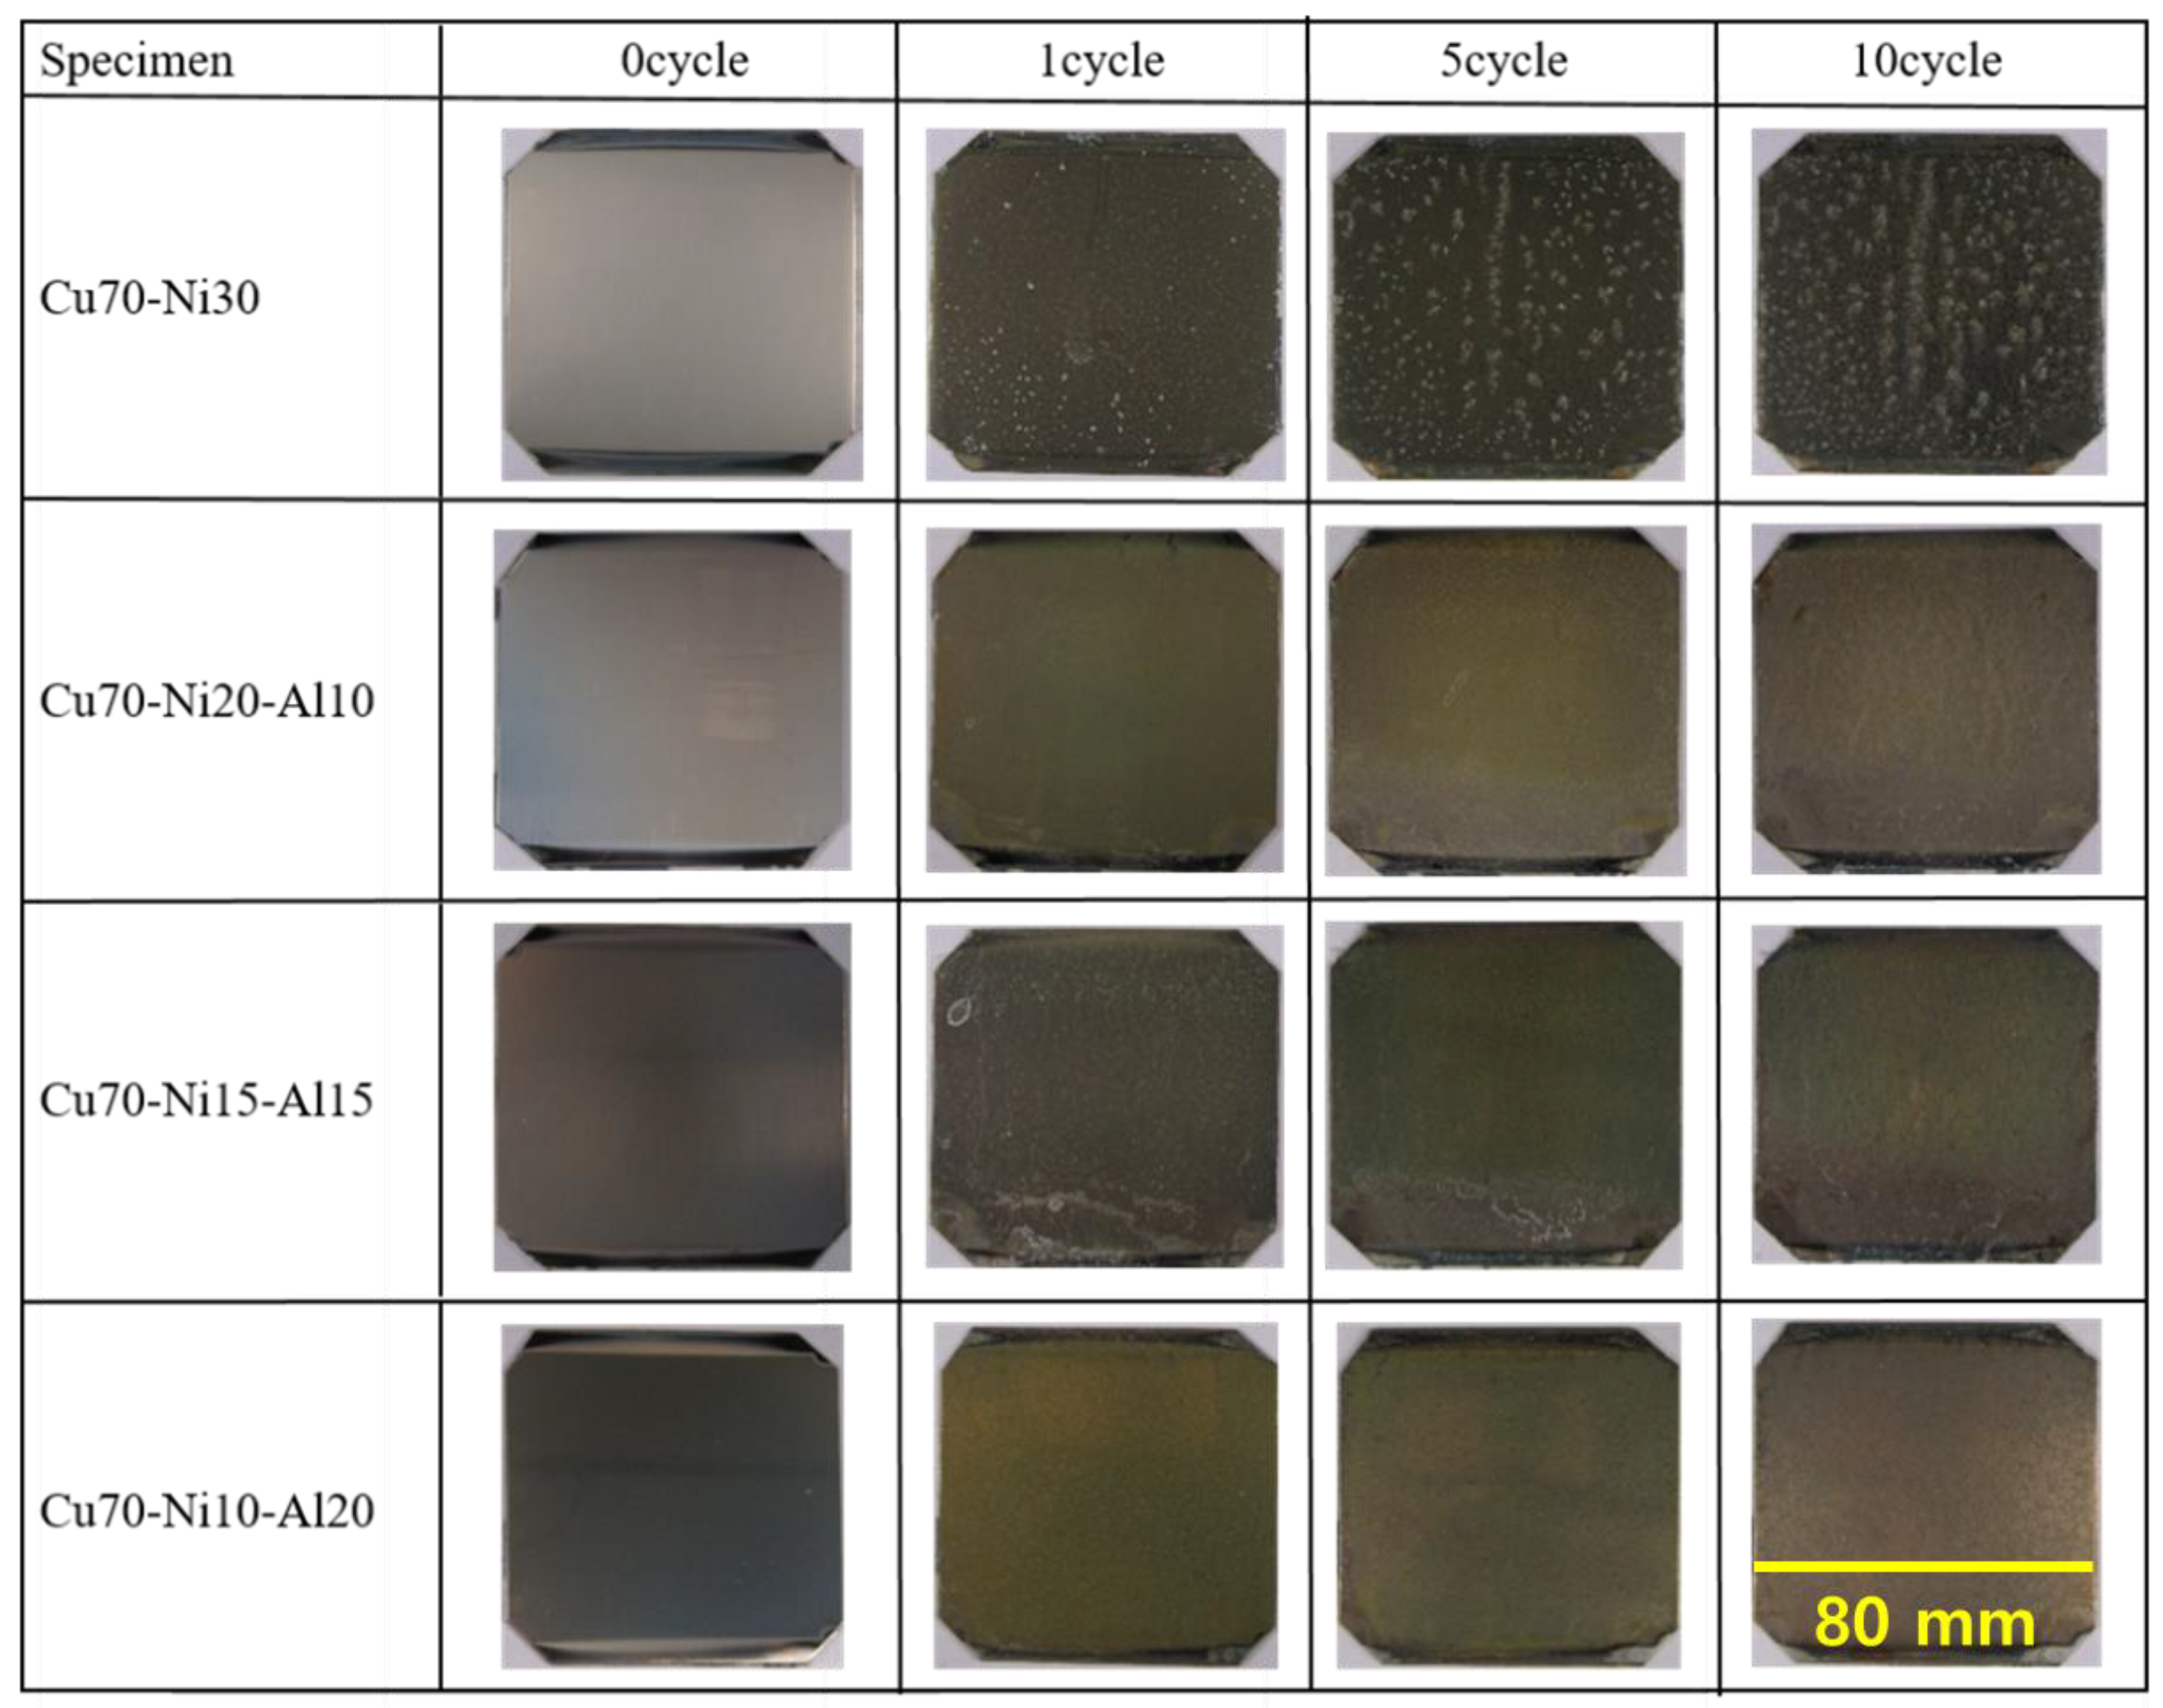
3.1. Surface Analysis

Table 2 lists the composition of each deposited specimen, as identified via EDS. A specimen deposited with Cu and Ni targets was manufactured at a Cu:Ni ratio of 70:30, which is currently commercialized. A Cu–Ni–Al alloy deposited with Cu, Ni, and Al targets was produced by gradually increasing the Al content in Cu70–Ni30. Figure 2 shows FE-SEM images of each specimen surface. Figure 2a shows the surface of Cu70–Ni30 fabricated via sputtering. Large and small crystals were observed to be evenly distributed. Figure 2b–d depict surface FE-SEM images of the Cu–Ni–Al alloys. Figure 2b indicates that the maximum crystal size was similar to that of the Cu–Ni alloy without a low Al content. While the crystal size of the Al-free sample shown in Figure 2a was not uniform, the Al-added sample shown in Figure 2b showed a uniform distribution of grains. The FE-SEM images in Figure 2c,d show that the crystal size was significantly smaller and the surface became denser, indicating that the crystal size tended to decrease with increasing Al content. For the same average grain size, a broader grain size distribution is more corrosion-resistant than a narrow one in a non-passivating environment [31,32]. Additionally, many previous studies have suggested that as the grain size decreases, corrosion resistance improves. The improved resistance is generally attributed to the ability of high-grain boundary density surfaces to passivate more readily or to the physical breakdown of second-phase intermetallic particles [33,34,35,36].

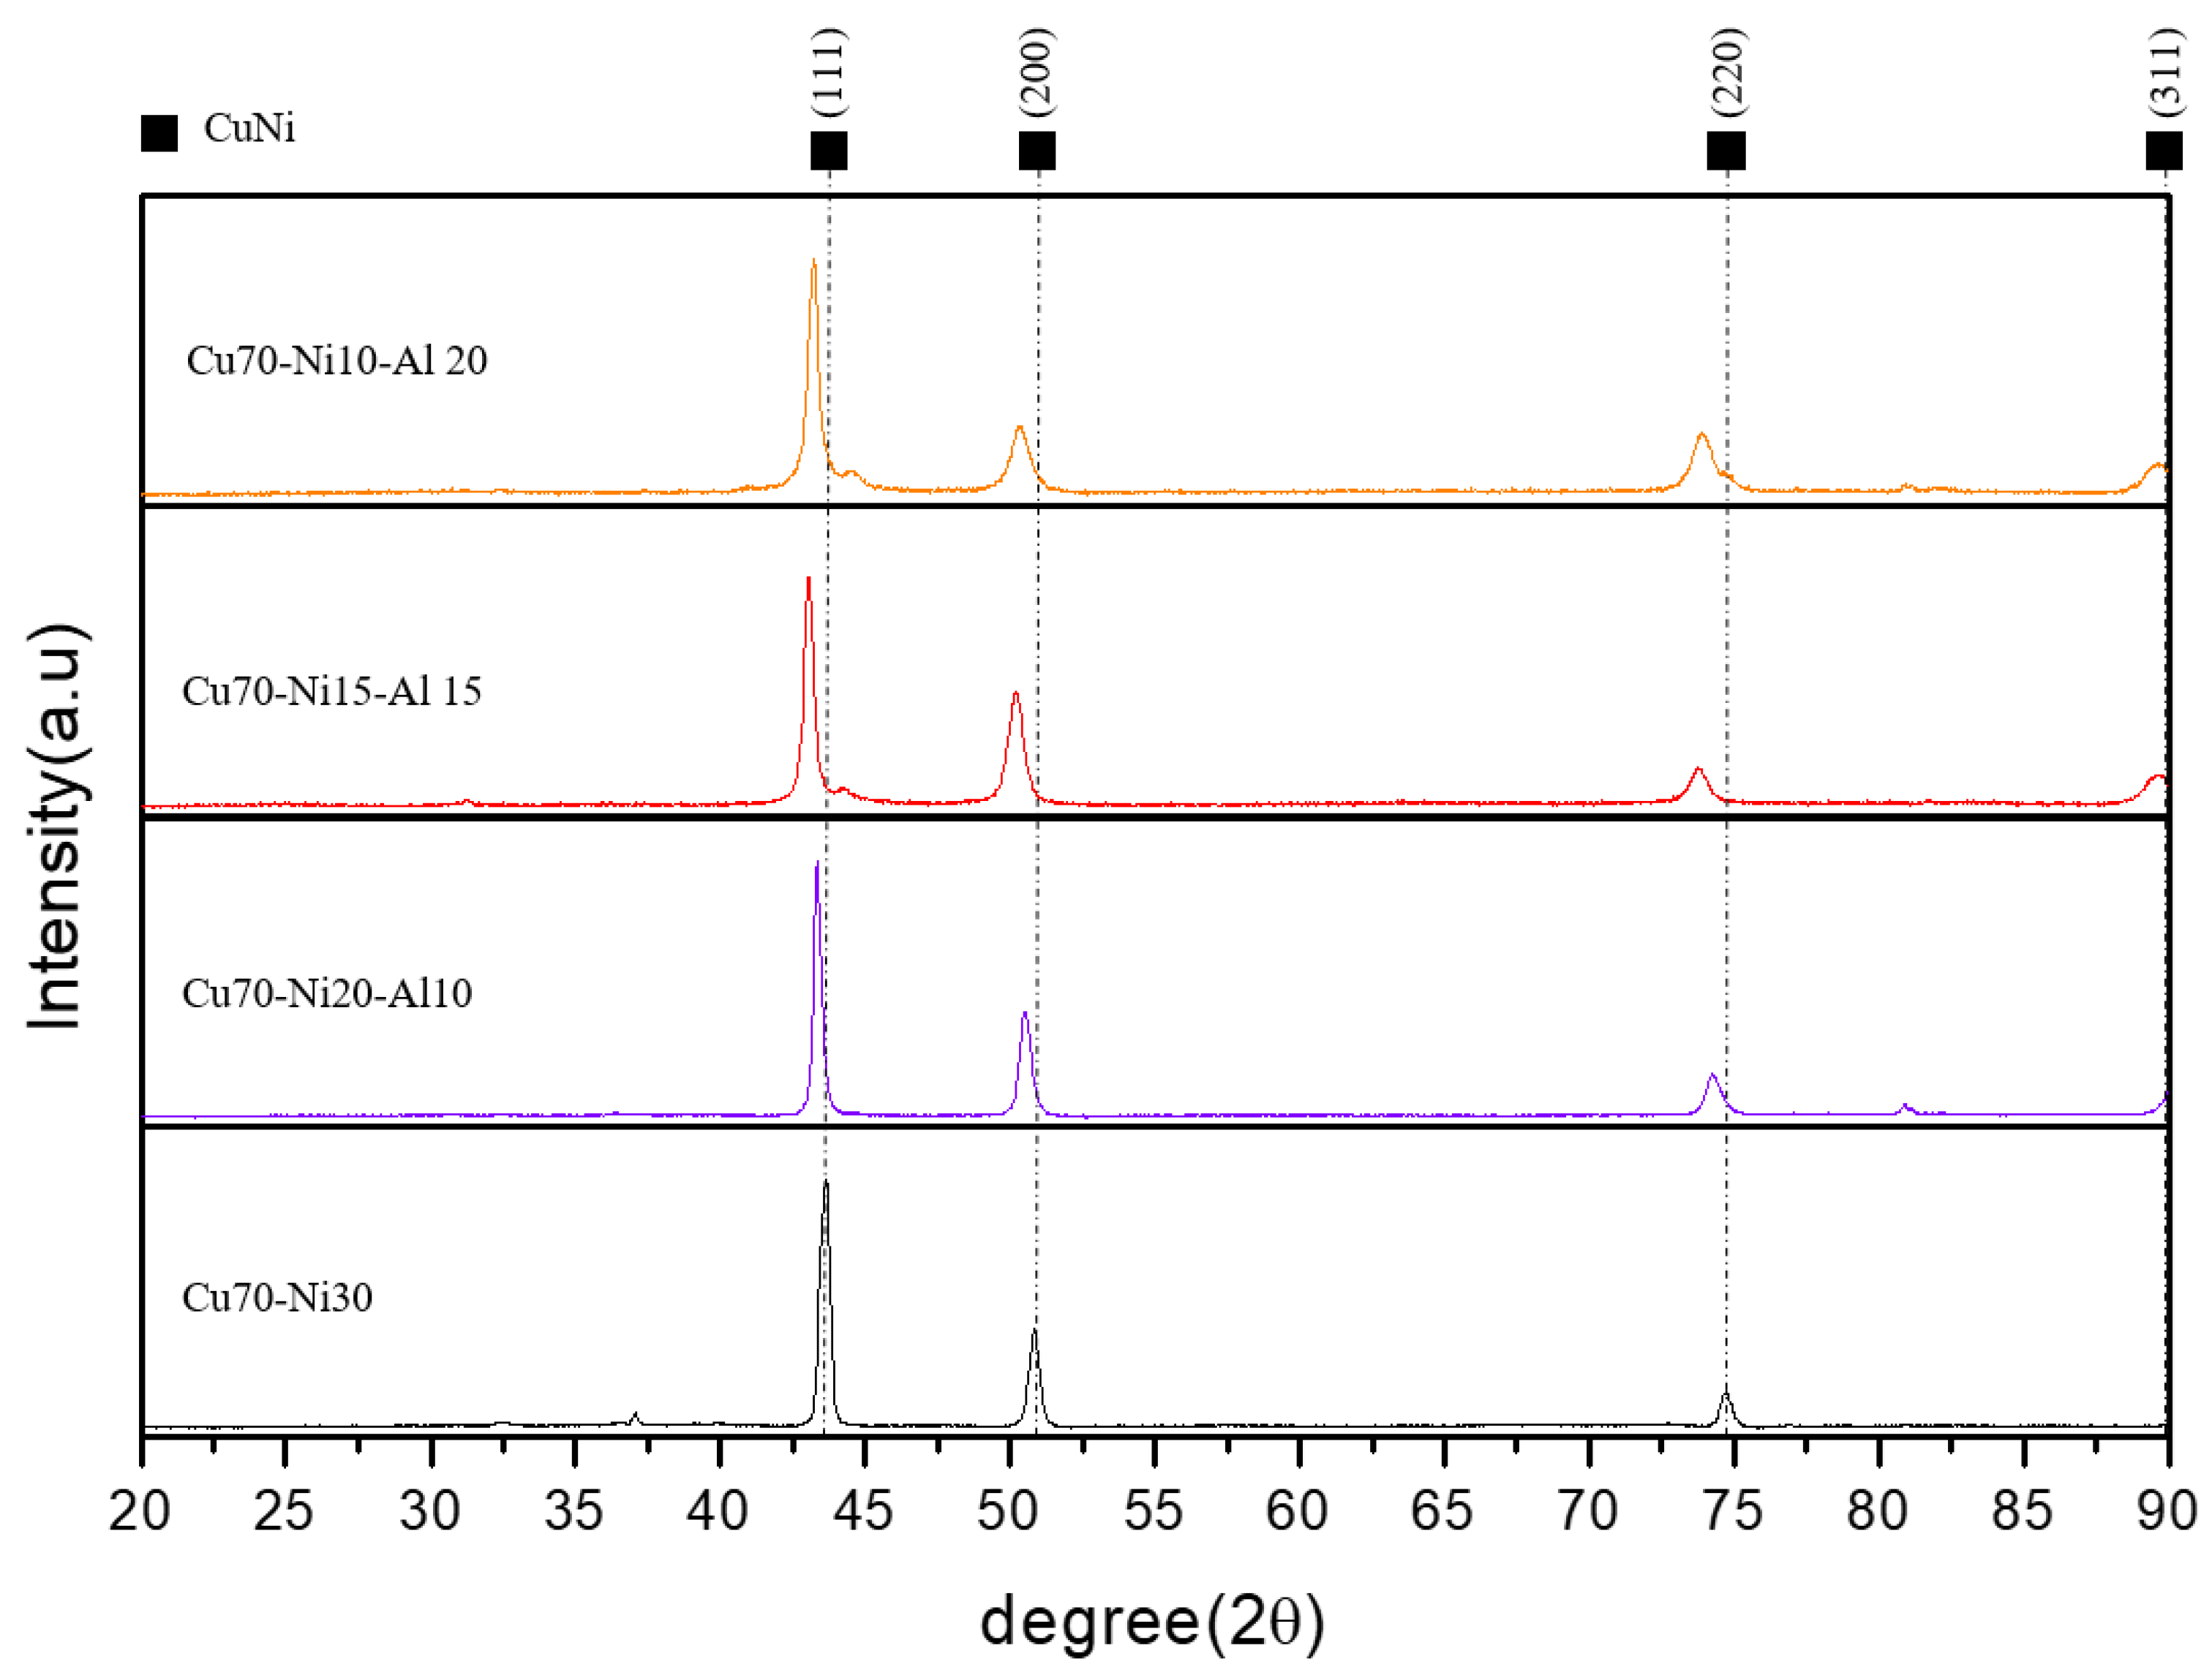
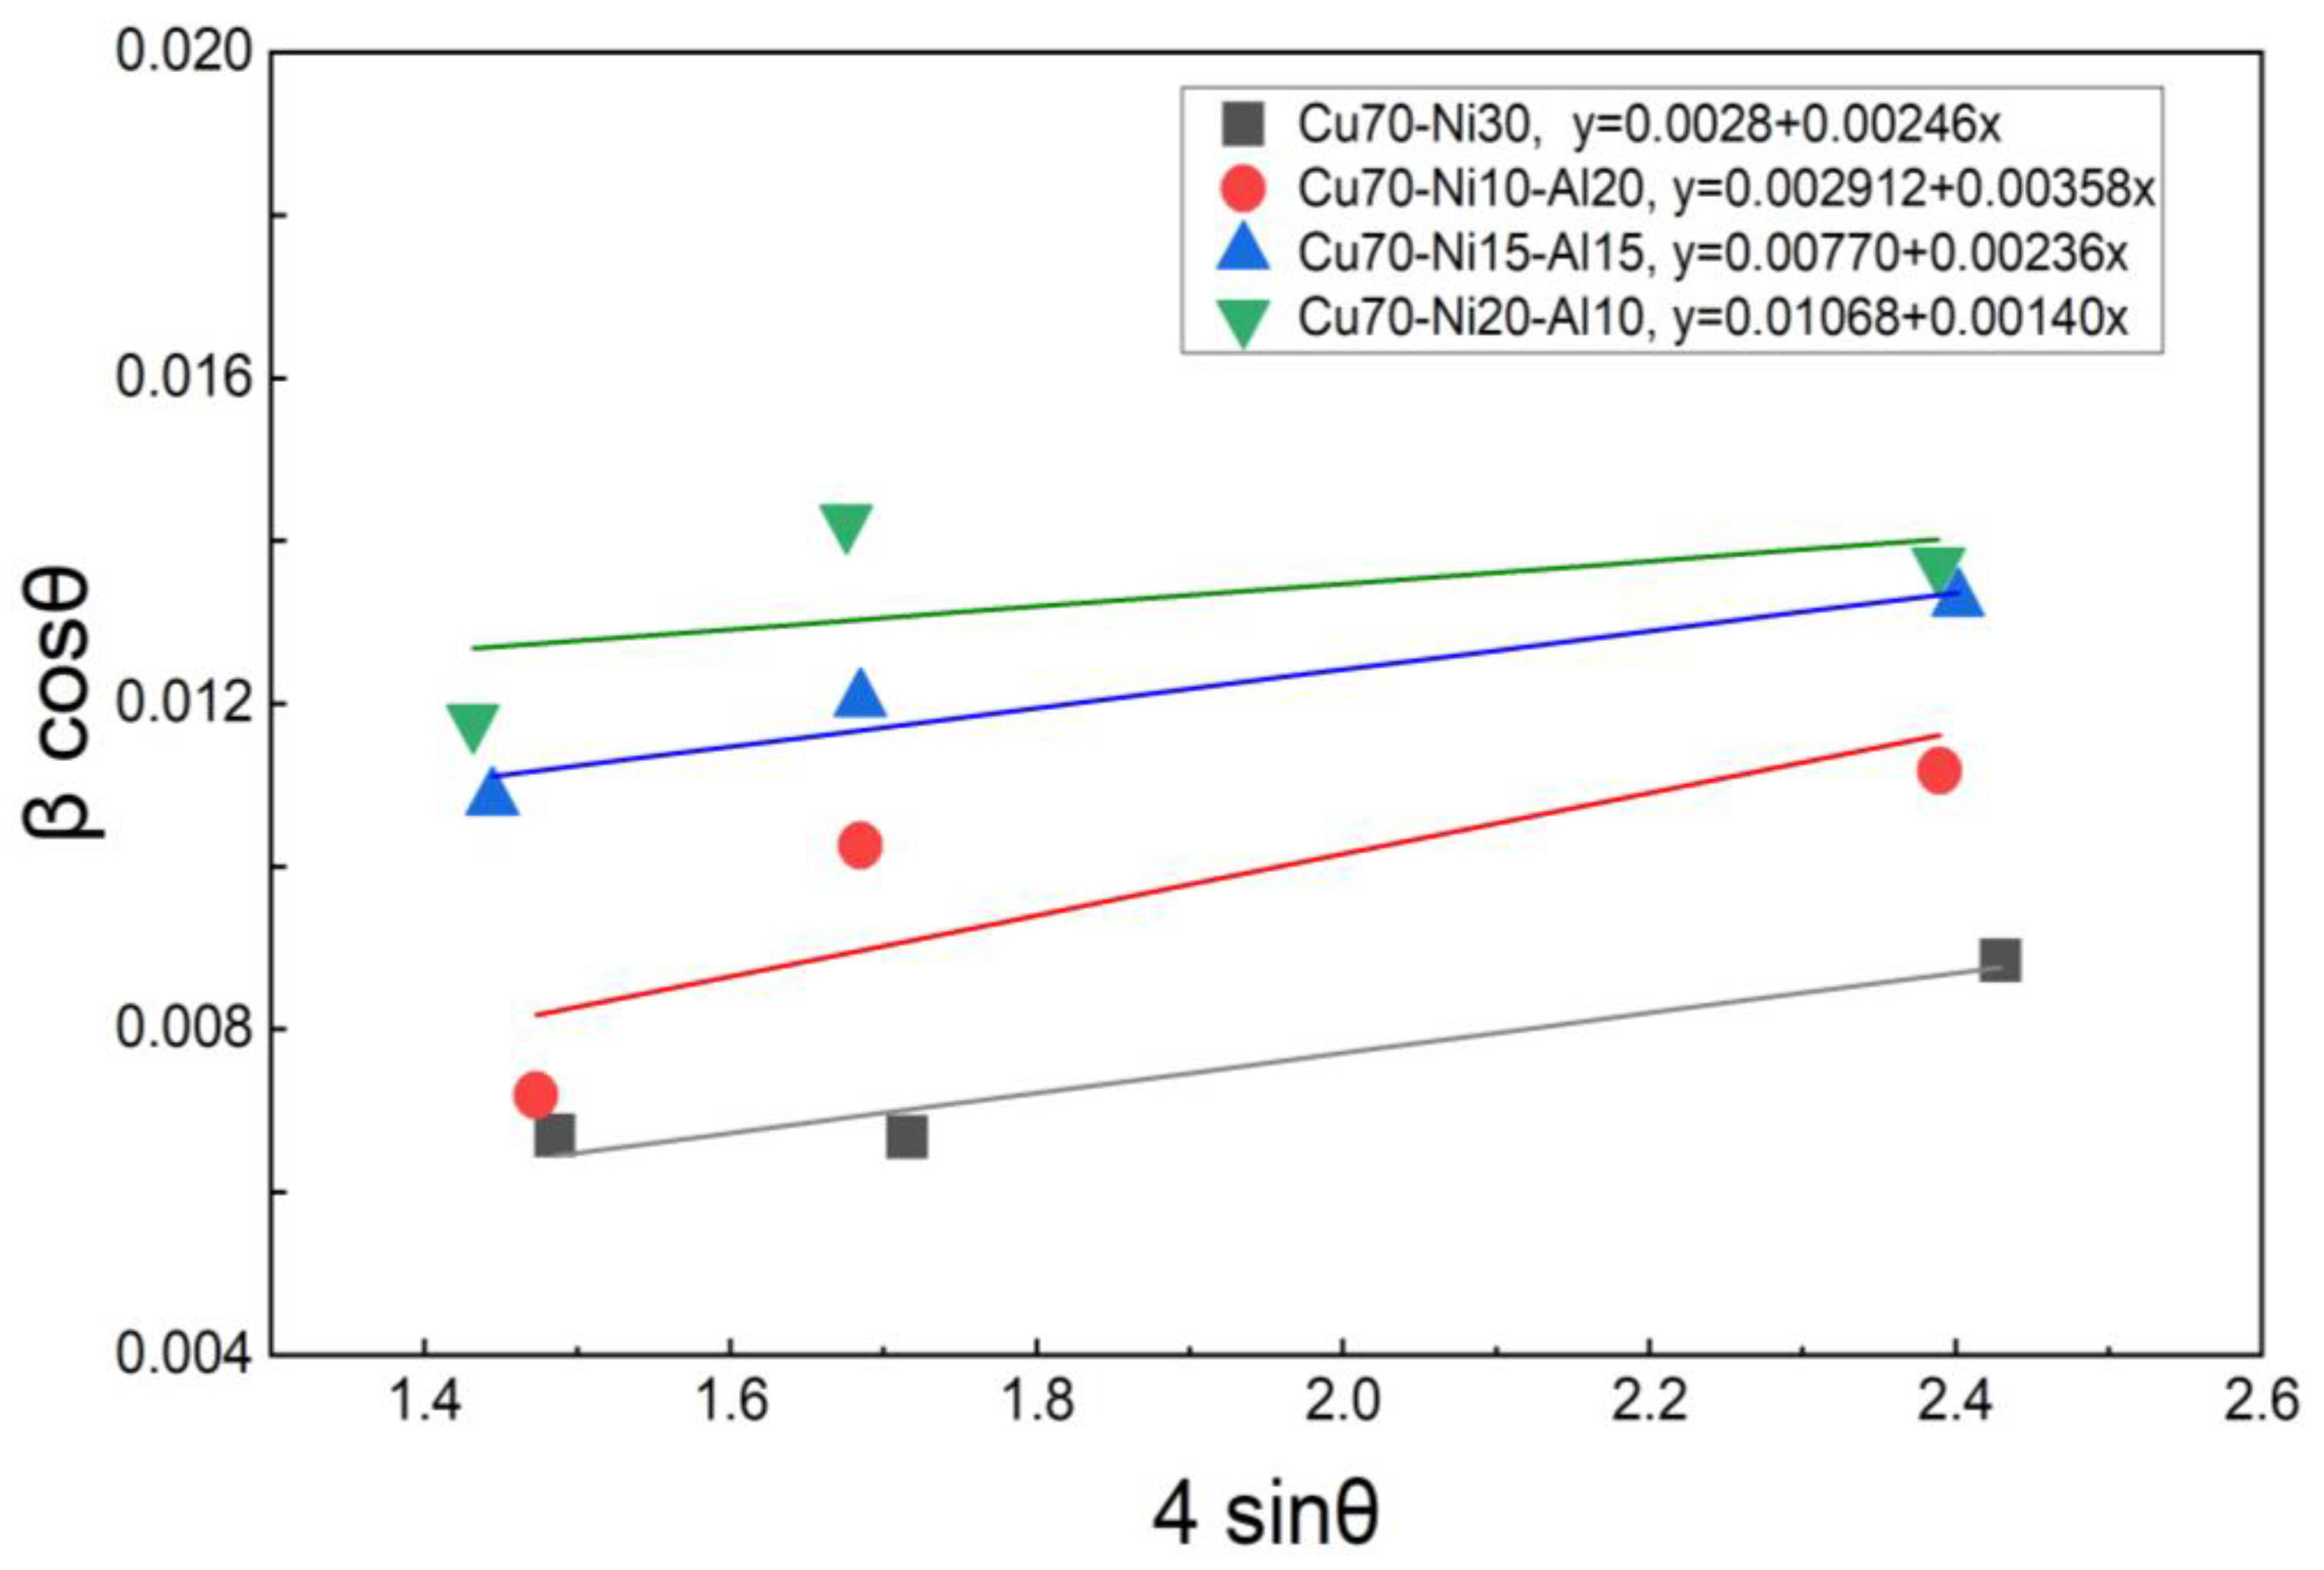
3.2. Crystal Structure and Cathodic and Anodic Reaction

Figure 3 shows the results of the XRD analyses of the crystal structures of the deposited Cu70-Ni30 and Cu–Ni–Al specimens. Diffraction peaks at 44°, 51.2°, and 75.4° were detected for the Cu70–Ni30 specimen, corresponding to the (110), (200), and (220) planes of cubic Cu–Ni, respectively (JCPDS#657246). XRD analysis of the Cu–Ni–Al specimen showed peak shifting to a lower scattering angle (2θ) value, indicating a decrease in the crystalline size. Aluminum likely did not form a new compound or crystalline phase during the deposition process, and the Al atoms substituted the Ni atoms in the cubic structure of Cu–Ni.
We employed the Williamson–Hall model rather than the Scherrer model to determine crystallite size because the Scherrer model does not consider the peak broadening caused by crystalline defects and distortions, leading to lattice strain. In this context, Williamson and Hall (WH) proposed a model where they suppose that the contributions of crystallite size and local lattice strain to line broadening are independent. They express the observed broadening as the sum of these two components: β = β D + β ε . Wilson’s formula defines the strain-induced broadening β ε as: β ε = 4 ε tan θ . Consequently, the WH equation is commonly expressed as β cos θ = ε ( 4 sin θ ) + K λ D . Here, microstrain (ε) can be estimated from the slope of the graph β cos θ vs. 4 sin θ and the average crystallite size is determined from the intersection of the linear fit with the vertical axis, as shown in Figure 4. The average grain size of the Cu70-Ni30 specimen obtained using WH equation was 49.48 nm, and those of Cu70–Ni20–Al10, Cu70–Ni15–Al15, and Cu70–Ni10–Al20 were 47.61, 18.01, and 12.98 nm, respectively. These are in good agreement with the observation results of the FE-SEM images.
Figure 5 shows the surface images of the Cu–Ni and Cu–Ni–Al specimens after the CCT cycles. In the Cu70–Ni30 specimen, pitting began to occur on the surface after one cycle and gradually increased during 5–10 cycles. The first pitting appeared blue-green, similar to the color of copper hydroxide. As the cycles progressed and corrosion intensified, the color of the pitting area changed to red-brown, resembling the color of copper oxide. The surface of the Cu–Ni–Al specimens was slightly brighter than the Cu70–Ni30 specimen observed in the first cycle. As the cycle progressed, the color of the surface became brighter owing to the influence of the Al corrosion products, and pitting was not observed in the Cu–Ni–Al specimen. Additionally, in the Cu70-Ni15-Al15 sample, a white fuzzy pattern was at the bottom of the test specimen after one cycle, but subsequent verification revealed that this was dried salt residue with no noticeable effect on localized corrosion such as pitting. Other than a slight color difference, no other surface differences attributable to the Al content were observed. In a solution containing chloride, the Cu–Ni–Al alloy underwent the following anodic reaction:
Cu + Cl → CuCl + e
CuCl + Cl → CuCl2
Al → Al3+ + 3e
Ni → Ni2+ + 2e
The metal ions and chloride generated are hydrolyzed to form an oxide.
CuCl2 + 2OH → Cu2O + H2O + 4Cl
Cu2O + O2 + H2O → 2CuO + H2O2
CuCl2 + 2H2O → Cu(OH)2 + 2HCl + e
CuCl + O2 + H2O → Cu2(OH)3Cl + HCl + e
Al3+ + 3H2O → Al(OH)3 + 3H+
2Al(OH)3 → Al2O3 + 3H2O
Ni2+ + 2H2O → Ni(OH)2 + 2H+
The good corrosion resistance of the Cu–Ni alloy is attributed to the strongly adherent Cu2O film produced in accordance with Equation (5), which serves as a protective film. Further, Ni+ is integrated into the porous film to improve the ion conductivity. However, when Ni escapes owing to denickelification, reactive pores are formed, and pitting occurs [37]. The addition of Al improved the corrosion resistance of Cu–Ni alloys because the Al2O3 corrosion product condensed the porous layer of Cu2O and produced a protective oxide film, which decreased the electrochemical reaction rate and hindered denickelification [38].

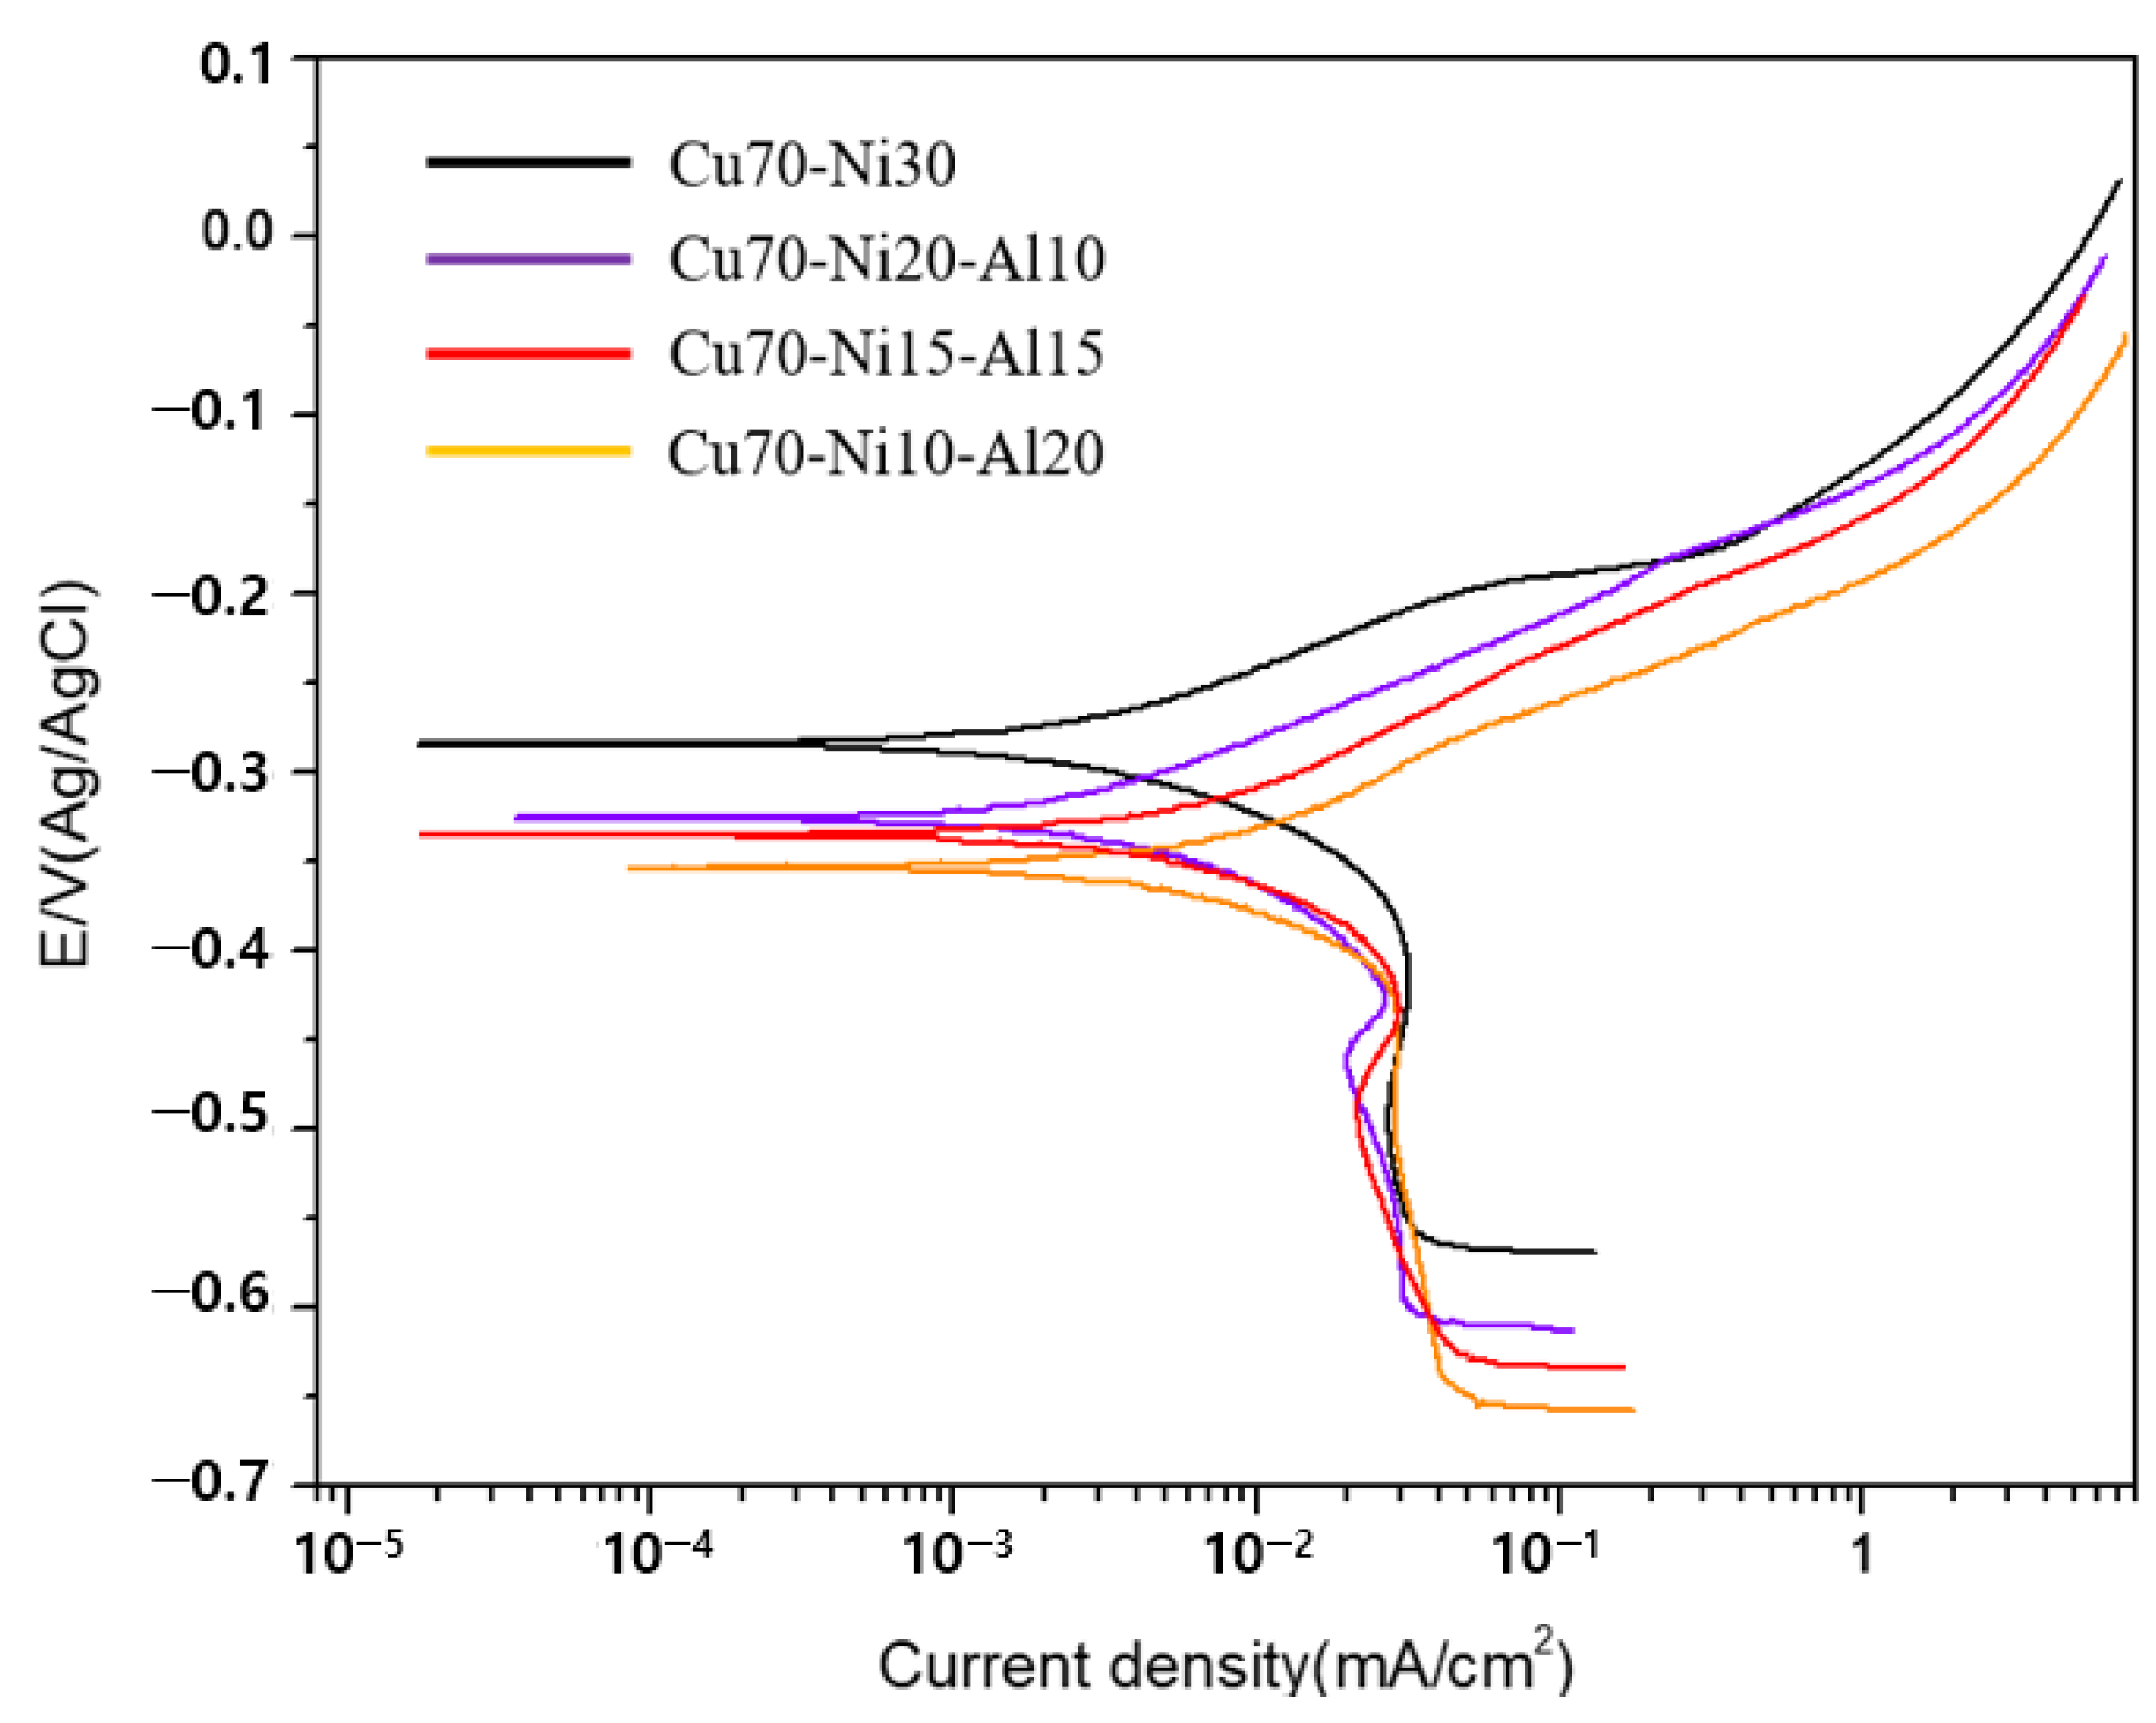
3.3. Evaluation of Corrosion Resistance

Table 3 shows the EDS analysis results for the Cu–Ni and Cu–Ni–Al thin films after CCT. Cu70–Ni30 possessed a higher oxygen content than the Cu–Ni–Al specimens, indicating a higher extent of oxidation on its surface. Figure 6 shows the SEM images of the central part of the specimen surfaces after CCT. As regards the Cu70–Ni30 film, the widely spaced corrosion products are located on many pores, as shown in Figure 6a. The image shown in Figure 6b confirms that the corrosion products on the surface were heterogeneous and that large crystals were gathered. Figure 6c,d show that the corrosion products on the surface were small and uniformly formed. Dense products were formed on the surface of the Cu70–Ni10–Al20 specimen with the highest Al content.
Raman spectroscopy was performed to confirm the presence of corrosion products on the specimen after CCT because the peaks of oxides and chlorides were not detected in the XRD analysis. Figure 7 shows the Raman spectra of each specimen after the CCT. The peaks corresponding to CuO (500 cm−1), Cu2O (151,411 cm−1), and Cu2(OH)3Cl (292 cm−1) were detected in each specimen. Higher peak intensities of Cu2(OH)3Cl and Cu2O were observed in the Cu–Ni–Al specimens than in Cu70–Ni30. These results indicate that the Cu2O passivation film of Cu70–Ni30 was hydrolyzed to CuO, resulting in susceptibility to pitting corrosion. Furthermore, a peak (353 cm−1) corresponding to Cr2O5 was detected in the Cu70–Ni30 sample. This is attributable to the exposure of the internal substrate material caused by damage to the deposited layer. These results agree well with the component ratios in Table 3 and the CCT image in Figure 5.
Figure 8 shows the corrosion polarization results for each specimen. The corrosion potential of the Cu70–Ni30 specimen was the highest at −283.154 mV, while that of Cu70–Ni20–Al10, Cu70–Ni15–Al15, and Cu70–Ni10–Al20 were −319.674 mV, −331.062 mV, and −340.428 mV, respectively. The corrosion potential obtained for the Cu–Ni–Al specimens was negatively shifted with increasing Al content. The corrosion current densities, which refer to corrosion rate, decreased with increasing Al content, as listed in Table 4. This indicates that the Al played an important role in hindering the cathodic reaction (O2 + 2H2O + 4e → 4OH). It is believed that Al2O3 passivation by partially blocking the surface of the metal causes a delay in the oxygen reduction reaction and acts as a barrier against O2 migration to the cathodic areas on the Cu–Ni–Al surface. Al2O3 films may also block partial anodic reactions, leading to a reduction in the corrosion current density. The Al2O3 films on the Cu–Ni–Al surface have a high electrical insolation property; hence, anodic reactions rarely occur on the surface.
The compositional and structural analysis of Cu–Ni and Cu–Ni–Al alloys, as outlined in Table 2, provides essential insights into the impact of aluminum addition on alloy properties. The commercially established Cu70–Ni30 specimen serves as a baseline for comparison with progressively alloyed counterparts. FE-SEM images (Figure 2) illustrate the evolution of microstructure with increasing aluminum content, displaying a noticeable decrease in crystal size and a more uniform grain distribution. The observed correlation between crystal size distribution and corrosion resistance aligns with established literature, highlighting the importance of these findings in practical applications. This relationship is further supported by XRD analyses (Figure 3), where peak shifting in the Cu–Ni–Al specimen indicates a reduction in crystalline size, confirming aluminum’s role in modifying the cubic structure of Cu–Ni. The use of the Williamson–Hall model for crystallite size determination (Figure 4) is considered, given its ability to address crystalline distortions. The resultant average crystallite sizes correlate well with FE-SEM observations, reinforcing the strength of the analytical approach.
Figure 5, depicting surface images after CCT cycles, emphasizes the dynamic corrosion behavior. The distinct color changes in the Cu70–Ni30 specimen and the absence of noticeable pitting in Cu–Ni–Al alloys highlight aluminum’s role in enhancing corrosion resistance. The anodic reaction in chloride-containing solutions explains the mechanisms at work, with Al2O3 corrosion products forming protective oxide films that hinder denickelification, thereby reducing the electrochemical reaction rate. Quantitative EDS results (Table 3) post–CCT align with SEM images (Figure 6), offering a comprehensive overview of corrosion-induced changes. Raman spectroscopy (Figure 7) supports these findings, confirming the presence of corrosion products and indicating the protective role of aluminum in preventing hydrolysis of the Cu2O passivation film. The corrosion polarization results (Figure 8) provide quantitative insights into corrosion potential and current density. The negatively shifted corrosion potentials and decreased current densities with increasing Al content emphasize the efficacy of Al2O3 films in hindering cathodic reactions and reducing corrosion rates.
In summary, the integrated analysis emphasizes the significant impact of aluminum on Cu–Ni alloy properties. The observed modifications in crystal structure, inhibition of denickelification, formation of protective oxide films, and influence on corrosion-related reactions collectively position Cu–Ni–Al alloys as promising candidates for corrosion-resistant applications. These findings are crucial in materials science and engineering, offering a direction for the development of alloys tailored for enhanced performance in corrosive environments.

4. Conclusions

To determine the effect of Al on the pitting resistance of the Cu–Ni alloy, Cu–Ni–Al alloy films were deposited on STS plates via DC magnetron sputtering with a varying Al content. The corrosion product film mainly consisted of Cu2O, CuO, CuCl, and Cu2(OH)3Cl. The pitting resistance of the designed alloy increased with the increasing Al content because of the densification and thickening of the corrosion product film. The designed alloy exhibited excellent corrosion resistance because the porous Cu2O layer was densified by the formation of the Al2O3 corrosion product, which decreased the electrochemical reaction rate and hindered densification. The corrosion potential obtained for the Cu–Ni–Al specimens was negatively shifted with increasing Al content. The corrosion current densities are reduced with an increase in Al, suggesting that Al2O3 passivation by partially blocking the surface of the metal causes a delay in the oxygen reduction reaction and acts as a barrier against O2 migration to the cathodic areas on the Cu–Ni–Al surface. The findings of this study confirm that Al co-deposition is an effective method for developing highly corrosion-resistant Ni–Cu alloy coatings.

Author Contributions

Each author played an essential role in the development of this research. Conceptualization, J.-H.Y.; formal analysis, J.-H.Y. and S.-D.Y.; funding acquisition, J.-H.Y. and Y.K.; investigation, J.-P.N., B.-S.K., J.-S.K., J.-S.L. and S.-W.C.; resource, J.-P.N., B.-S.K., J.-S.K., J.-S.L. and S.-W.C. methodology, J.-H.Y. and Y.K.; software, S.-D.Y.; validation, J.-H.Y. and Y.K.; visualization, S.-D.Y.; writing—original draft preparation, S.-D.Y.; writing—review and editing, Y.K. and J.-H.Y. All authors have read and agreed to the published version of the manuscript.

Funding

This research was supported by “Regional Innovation Strategy (RIS)” through the National Research Foundation of Korea(NRF) funded by the Ministry of Education(MOE)(2021RIS-002).

Institutional Review Board Statement

Not applicable.

Informed Consent Statement

Not applicable.

Data Availability Statement

Data are contained within the article.

Conflicts of Interest

The authors declare no conflict of interest.

References

  1. Parvizi, M.S.; Aladjem, A.; Castle, J.E. Behaviour of 90–10 cupronickel in sea water. Int. Mater. Rev. 1988, 33, 169–200. [Google Scholar] [CrossRef]
  2. Jin, T.; Zhang, W.; Li, N.; Liu, X.; Han, L.; Dai, W. Surface Characterization and Corrosion Behavior of 90/10 Copper-Nickel Alloy in Marine Environment. Materials 2019, 12, 1869. [Google Scholar] [CrossRef] [PubMed]
  3. Yuan, S.; Choong, A.M.; Pehkonen, S. The influence of the marine aerobic Pseudomonas strain on the corrosion of 70/30 Cu–Ni alloy. Corros. Sci. 2007, 49, 4352–4385. [Google Scholar] [CrossRef]
  4. Yuan, S.; Pehkonen, S. Surface characterization and corrosion behavior of 70/30 Cu–Ni alloy in pristine and sulfide-containing simulated seawater. Corros. Sci. 2007, 49, 1276–1304. [Google Scholar] [CrossRef]
  5. Glover, T.J. Copper-nickel alloy for the construction of ship and boat hulls. Br. Corros. J. 1982, 17, 155–158. [Google Scholar] [CrossRef]
  6. Rao, B.A.; Kumar, K.C. Kumar, 5-(3-Aminophenyl) tetrazole—A new corrosion inhibitor for Cu–Ni (90/10) alloy in seawater and sulphide containing seawater. Arab. J. Chem. 2017, 10, S2245–S2259. [Google Scholar] [CrossRef]
  7. Mousavi, M.; Baghgoli, T. Application of interaction energy in quantitative structure-inhibition relationship study of some benzenethiol derivatives on copper corrosion. Corros. Sci. 2016, 105, 170–176. [Google Scholar] [CrossRef]
  8. Kong, D.; Dong, C.; Zheng, Z.; Mao, F.; Xu, A.; Ni, X.; Man, C.; Yao, J.; Xiao, K.; Li, X. Surface monitoring for pitting evolution into uniform corrosion on Cu-Ni-Zn ternary alloy in alkaline chloride solution: Ex-situ LCM and in-situ SECM. Appl. Surf. Sci. 2018, 440, 245–257. [Google Scholar] [CrossRef]
  9. Metikoš-Huković, M.; Babić, R.; Škugor, I.; Grubač, Z. Copper–nickel alloys modified with thin surface films: Corrosion behaviour in the presence of chloride ions. Corros. Sci. 2011, 53, 347–352. [Google Scholar] [CrossRef]
  10. North, R.; Pryor, M. The influence of corrosion product structure on the corrosion rate of Cu-Ni alloys. Corros. Sci. 1970, 10, 297–311. [Google Scholar] [CrossRef]
  11. Chandra, K.; Mahanti, A.; Singh, A.; Kain, V.; Gujar, H. Microbiologically influenced corrosion of 70/30 cupronickel tubes of a heat-exchanger. Eng. Fail. Anal. 2019, 105, 1328–1339. [Google Scholar] [CrossRef]
  12. Abouswa, K.; Elshawesh, F.; Elragei, O.; Elhood, A. Corrosion investigation of Cu–Ni tube desalination plant. Desalination 2007, 205, 140–146. [Google Scholar] [CrossRef]
  13. Asrar, N.; Malik, A.U.; Ahmad, S.; Al-Sheikh, A.H.H.; Al-Ghamdi, F.; Al-Thobiety, M.A. Early failure of cupro-nickel condenser tubes in thermal desalination plant. Desalination 1998, 116, 135–143. [Google Scholar] [CrossRef]
  14. Ezuber, H.M.; Al Shater, A. Influence of environmental parameters on the corrosion behavior of 90/10 cupronickel tubes in 3.5% NaCl. Desalination Water Treat. 2016, 57, 6670–6679. [Google Scholar] [CrossRef]
  15. Zhang, J.; Klasky, M.; Letellier, B.C. The aluminum chemistry and corrosion in alkaline solutions. J. Nucl. Mater. 2009, 384, 175–189. [Google Scholar] [CrossRef]
  16. Nakagawa, N.; Ohtsubo, H.; Mitani, A.; Shimizu, K.; Waku, Y. High temperature strength and thermal stability for melt growth composite. J. Eur. Ceram. Soc. 2005, 25, 1251–1257. [Google Scholar] [CrossRef]
  17. Hirano, K. Application of eutectic composites to gas turbine system and fundamental fracture properties up to 1700 °C. J. Eur. Ceram. Soc. 2005, 25, 1191–1199. [Google Scholar] [CrossRef]
  18. Waku, Y.; Sakata, S.; Mitani, A.; Shimizu, K.; Hasebe, M. Temperature dependence of flexural strength and microstructure of Al2O3/Y3Al5O12/ZrO2 ternary melt growth composites. J. Mater. Sci. 2002, 37, 2975–2982. [Google Scholar] [CrossRef]
  19. Barron, L.W.; Neidrich, J.; Kurinec, S.K. Optical, electrical, and structural properties of sputtered aluminum alloy thin films with copper, titanium and chromium additions. Thin Solid Films 2007, 515, 3363–3372. [Google Scholar] [CrossRef]
  20. Diler, E.; Rouvellou, B.; Rioual, S.; Lescop, B.; Vien, G.N.; Thierry, D. Characterization of corrosion products of Zn and Zn–Mg–Al coated steel in a marine atmosphere. Corros. Sci. 2014, 87, 111–117. [Google Scholar] [CrossRef]
  21. Schürz, S.; Luckeneder, G.; Fleischanderl, M.; Mack, P.; Gsaller, H.; Kneissl, A.; Mori, G. Chemistry of corrosion products on Zn–Al–Mg alloy coated steel. Corros. Sci. 2010, 52, 3271–3279. [Google Scholar] [CrossRef]
  22. Feng, X.; Wang, H.; Liu, X.; Wang, C.; Cui, H.; Song, Q.; Huang, K.; Li, N.; Jiang, X. Effect of Al content on wear and corrosion resistance of Ni-based alloy coatings by laser cladding. Surf. Coat. Technol. 2021, 412, 126976. [Google Scholar] [CrossRef]
  23. Somjit, V.; Yildiz, B. Doping α-Al2O3 to reduce its hydrogen permeability: Thermodynamic assessment of hydrogen defects and solubility from first principles. Acta Mater. 2019, 169, 172–183. [Google Scholar] [CrossRef]
  24. Roberts, R.M.; Elleman, T.S.; Iii, H.P.; Verghese, K. Hydrogen Permeability of Sintered Aluminum Oxide. J. Am. Ceram. Soc. 1979, 62, 495–499. [Google Scholar] [CrossRef]
  25. Wang, G.; Zhu, L.; Liu, H.; Li, W. Galvanic corrosion of Ni–Cu–Al composite coating and its anti-fouling property for metal pipeline in simulated geothermal water. Surf. Coat. Technol. 2012, 206, 3728–3732. [Google Scholar] [CrossRef]
  26. Abdallah, B.; Kakhia, M.; Alssadat, W.; Zetoun, W. Study of Power Effect on Structural, Mechanical Properties and Corrosion Behavior of CrN thin Films Deposited by Magnetron Sputtering. Prot. Met. Phys. Chem. Surfaces 2021, 57, 80–87. [Google Scholar] [CrossRef]
  27. Huang, B.; Zhang, C.; Zhang, G.; Liao, H. Wear and corrosion resistant performance of thermal-sprayed Fe-based amorphous coatings: A review. Surf. Coat. Technol. 2019, 377, 124896. [Google Scholar] [CrossRef]
  28. Kozlovskiy, A.; Shlimas, I.; Dukenbayev, K.; Zdorovets, M. Structure and corrosion properties of thin TiO2 films obtained by magnetron sputtering. Vacuum 2019, 164, 224–232. [Google Scholar] [CrossRef]
  29. Ariza, E.; Rocha, L.A.; Vaz, F.; Cunha, L.; Ferreira, S.C.; Carvalho, P.; Rebouta, L.; Alves, E.; Goudeau, P.; Rivière, J.P. Corrosion resistance of ZrNxOy thin films obtained by rf reactive magnetron sputtering. Thin Solid Films 2004, 469, 274–281. [Google Scholar] [CrossRef]
  30. Taweesup, K.; Visuttipitukul, P.; Yongvanich, N.; Lothongkum, G. Corrosion behavior of Ti-Cr-N coatings on tool steel substrates prepared using DC magnetron sputtering at low growth temperatures. Surf. Coat. Technol. 2018, 358, 732–740. [Google Scholar] [CrossRef]
  31. Gollapudi, S. Grain size distribution effects on the corrosion behaviour of materials. Corros. Sci. 2012, 62, 90–94. [Google Scholar] [CrossRef]
  32. Tan, Z.J.; Da Ma, T.; Zhang, L.M.; Zhang, W.M.; Jia, R.G.; Cao, D.D.; Ji, H. Relationship between Corrosion Resistance and Microstructure of Copper-Nickel Alloy Pipes in Marine Engineering. Mater. Sci. Forum 2018, 944, 389–397. [Google Scholar] [CrossRef]
  33. Chung, M.-K.; Choi, Y.-S.; Kim, J.-G.; Kim, Y.-M.; Lee, J.-C. Effect of the number of ECAP pass time on the electrochemical properties of 1050 Al alloys. Mater. Sci. Eng. A 2004, 366, 282–291. [Google Scholar] [CrossRef]
  34. Kus, E.; Lee, Z.; Nutt, S.; Mansfeld, F. A Comparison of the Corrosion Behavior of Nanocrystalline and Conventional Al 5083 Samples. Corrosion 2006, 62, 152–161. [Google Scholar] [CrossRef]
  35. Sikora, E.; Wei, X.J.; Shaw, B.A. Corrosion Behavior of Nanocrystalline Bulk Al-Mg-Based Alloys. Corrosion 2004, 60, 387–398. [Google Scholar] [CrossRef]
  36. Tsai, T.; Chuang, T. Role of grain size on the stress corrosion cracking of 7475 aluminum alloys. Mater. Sci. Eng. A 1997, 225, 135–144. [Google Scholar] [CrossRef]
  37. Suhadi, A.; Febriyanti, E.; Sari, L.N. Analysis of denickelification phenomenon on heat exchanger tube. Maj. Ilm. Pengkaj. Ind. 2018, 12, 57–66. [Google Scholar] [CrossRef]
  38. Schüssler, A.; Exner, H. The corrosion of nickel-aluminium bronzes in seawater—II. The corrosion mechanism in the presence of sulphide pollution. Corros. Sci. 1993, 34, 1803–1815. [Google Scholar] [CrossRef]
Figure 1. Images of experimental setup of (a) sputtering chamber, (b) configuration of the target and specimen holder, (c) actual specimen holder, and (d) actual target.
Coatings 14 00132 g001
Figure 2. FE-SEM surface images of (a) Cu70–Ni30, (b) Cu70–Ni20–Al10, (c) Cu70–Ni15–Al15, and (d) Cu70–Ni10–Al20 before corrosion.
Coatings 14 00132 g002
Figure 3. X-ray diffraction patterns of Cu–Ni and Cu–Ni–Al specimens before corrosion.
Coatings 14 00132 g003
Figure 4. The WH plot of the Cu-Ni-Al films.
Coatings 14 00132 g004
Figure 5. Surface image of Cu–Ni and Cu–Ni–Al specimen with CCT cycles.
Coatings 14 00132 g005
Figure 6. FE-SEM surface images of (a) Cu70–Ni30, (b) Cu70–Ni20–Al10, (c) Cu70–Ni15–Al15 and (d) Cu70–Ni10–Al20 after corrosion.
Coatings 14 00132 g006
Figure 7. Raman spectra of Cu–Ni and Cu–Ni–Al specimens after corrosion.
Coatings 14 00132 g007
Figure 8. Polarization curve of Cu–Ni and Cu–Ni–Al specimens.
Coatings 14 00132 g008
Table 1. ISO 14993 standard condition.
TemperatureSalt SolutionsHumidityRun Time
Salt mist conditions35 °C ± 1 °CpH6.5 to 7.2
salt concentration 50 g/L ±5 g/L
2 h
Dry conditions60 °C ± 1 °C <30%4 h
Wet conditions50 °C ± 1 °C >95%2 h
Table 2. EDS analysis of each specimen composition (at.%)
Specimen NameCuNiAl
Cu70-Ni30Rem.29–31
Cu70-Ni20-Al10Rem.20–255–10
Cu70-Ni15-Al15Rem.14–1614–16
Cu70-Ni10-Al20Rem.9–1119–21
Table 3. EDS analysis of each specimen composition after CCT (at%).
Specimen NameCuNiAlClO
Cu70-Ni3045−4614−15 1−239−40
Cu70-Ni20-Al1048−4915−164−51−229−30
Cu70-Ni15-Al1543−4412−1310−112−331−32
Cu70-Ni10-Al2045−468−914−151−229−30
Table 4. Corrosion parameters for each specimen.
Specimen NameEcorr (mV)Icorr (μA)βaβb
Cu70-Ni30−283.15410.86878.7250.5
Cu70-Ni20-Al10−320.5304.45175.6103.3
Cu70-Ni15-Al15−330.0485.19575.098.9
Cu70-Ni10-Al20−340.9944.21370.284.1
Disclaimer/Publisher’s Note: The statements, opinions and data contained in all publications are solely those of the individual author(s) and contributor(s) and not of MDPI and/or the editor(s). MDPI and/or the editor(s) disclaim responsibility for any injury to people or property resulting from any ideas, methods, instructions or products referred to in the content.

