Abstract
Inductively coupled plasma with an argon/hydrogen (Ar/H2) mixture is a potential solution to many surface treatment problems, especially when encountering carbon contamination in optical X-ray and extreme ultraviolet instruments. Removing carbon contamination on multilayer thin films with Ar/H2 plasma extends the lifetime of the above devices. To further investigate the reaction between plasma and carbon, both optical emission spectroscopy and finite element method with multiphysics fields were employed. The results demonstrated that the intensities of the Balmer lines were in good agreement with the densities of the radical hydrogen atoms from the simulation model, showing a dependence on the mixing ratio. At an electrical input power of 165 W and a total pressure of 5 Pa, an optimum mixing ratio of about 35 ± 5 % hydrogen produced the highest density of hydrogen radicals, coinciding with the highest carbon removal rate. This shows that the carbon removal with Ar/H2 plasma was mainly controlled by the density of hydrogen radicals, and the mixing ratio showed a significant impact on the removal rates.
1. Introduction
Inductively coupled plasma (ICP) is used in many fields due to its ability to generate high plasma densities [1]. ICP with Ar/H2 component mixture is widely used in industry as well as in laboratory. For example, Ar/H2 local thermal equilibrium plasma is used for spray coating processes, and the spray coating process utilizes the latent heat of high-pressure thermal plasma. In Ar/H2 plasma, argon is considered as the primary gas to generate heat, and hydrogen is added as a secondary gas to change the thermal and electrical properties of the gas stream [2]. A spray coating process with around 5% hydrogen component reaches sufficient efficiency [3,4]. Under low-pressure conditions, Ar/H2 non-equilibrium plasma is widely used as a source for surface processing in applications for coating deposition and modification, such as diamond film deposition, carbon film deposition, graphene hydrogenation, and removal of contaminants on surfaces, etc. [5,6]. Generation of excited species in the mixed plasma is considered to be the key to surface treatment. Due to the chemical inertness of argon, hydrogen radicals play an important role in the reactions. Although mixing argon with hydrogen in a discharge has been found to decrease the degree of ionization [5], the mutual effects of hydrogen and argon in the plasma are not well understood.
In extreme ultraviolet (EUV) lithography systems [7,8] or synchrotron radiation facilities [9], it is impossible to achieve an absolute vacuum, and residual organic compounds still exist in the chamber. Under EUV or X-ray radiation, the compounds split into carbon atoms, and a carbon film would be deposited onto the surface of multilayer thin films [10,11,12]. Non-equilibrium Ar/H2 ICP can be used to remove the carbon film and extend the lifetime of the optics [13]. In our previous studies [14], carbon removal rates were increased by Ar/H2 mixed plasma compared with pure hydrogen or argon plasma. The reactions between Ar/H2 plasma and carbon contamination resulted from the fact that hydrogen radicals can reduce carbon atoms into volatile hydrocarbon molecules, such as ethane, methane etc. [13]. It is not clear but necessary to clarify the role of argon in the Ar/H2 mixed plasma carbon removal process and to further indicate the optimum mixing ratio.
This study aims to investigate both experimentally and theoretically the effects of mixing ratios on Ar/H2 plasma using the optical emission spectroscopy (OES) method and finite element method (FEM). An analysis of Balmer lines was performed to determine how densities of hydrogen radicals change with mixing ratios. A simulation model with multiphysics fields was built for Ar/H2 plasma using COMSOL Multiphysics [15]. The results of the spectral measurements were compared with the simulation to confirm validity. Both spectral measurement and simulation were performed to investigate the effects of mixing ratio on densities of hydrogen radicals. In addition, OES measurement was performed on plasma with a carbon rod in the chamber to confirm the reactions between hydrogen radicals and carbon atoms. Finally, the carbon removal rates were compared with the densities of hydrogen radicals from the simulation and the intensities of the Balmer lines from the measurement.
2. Experimental Setup
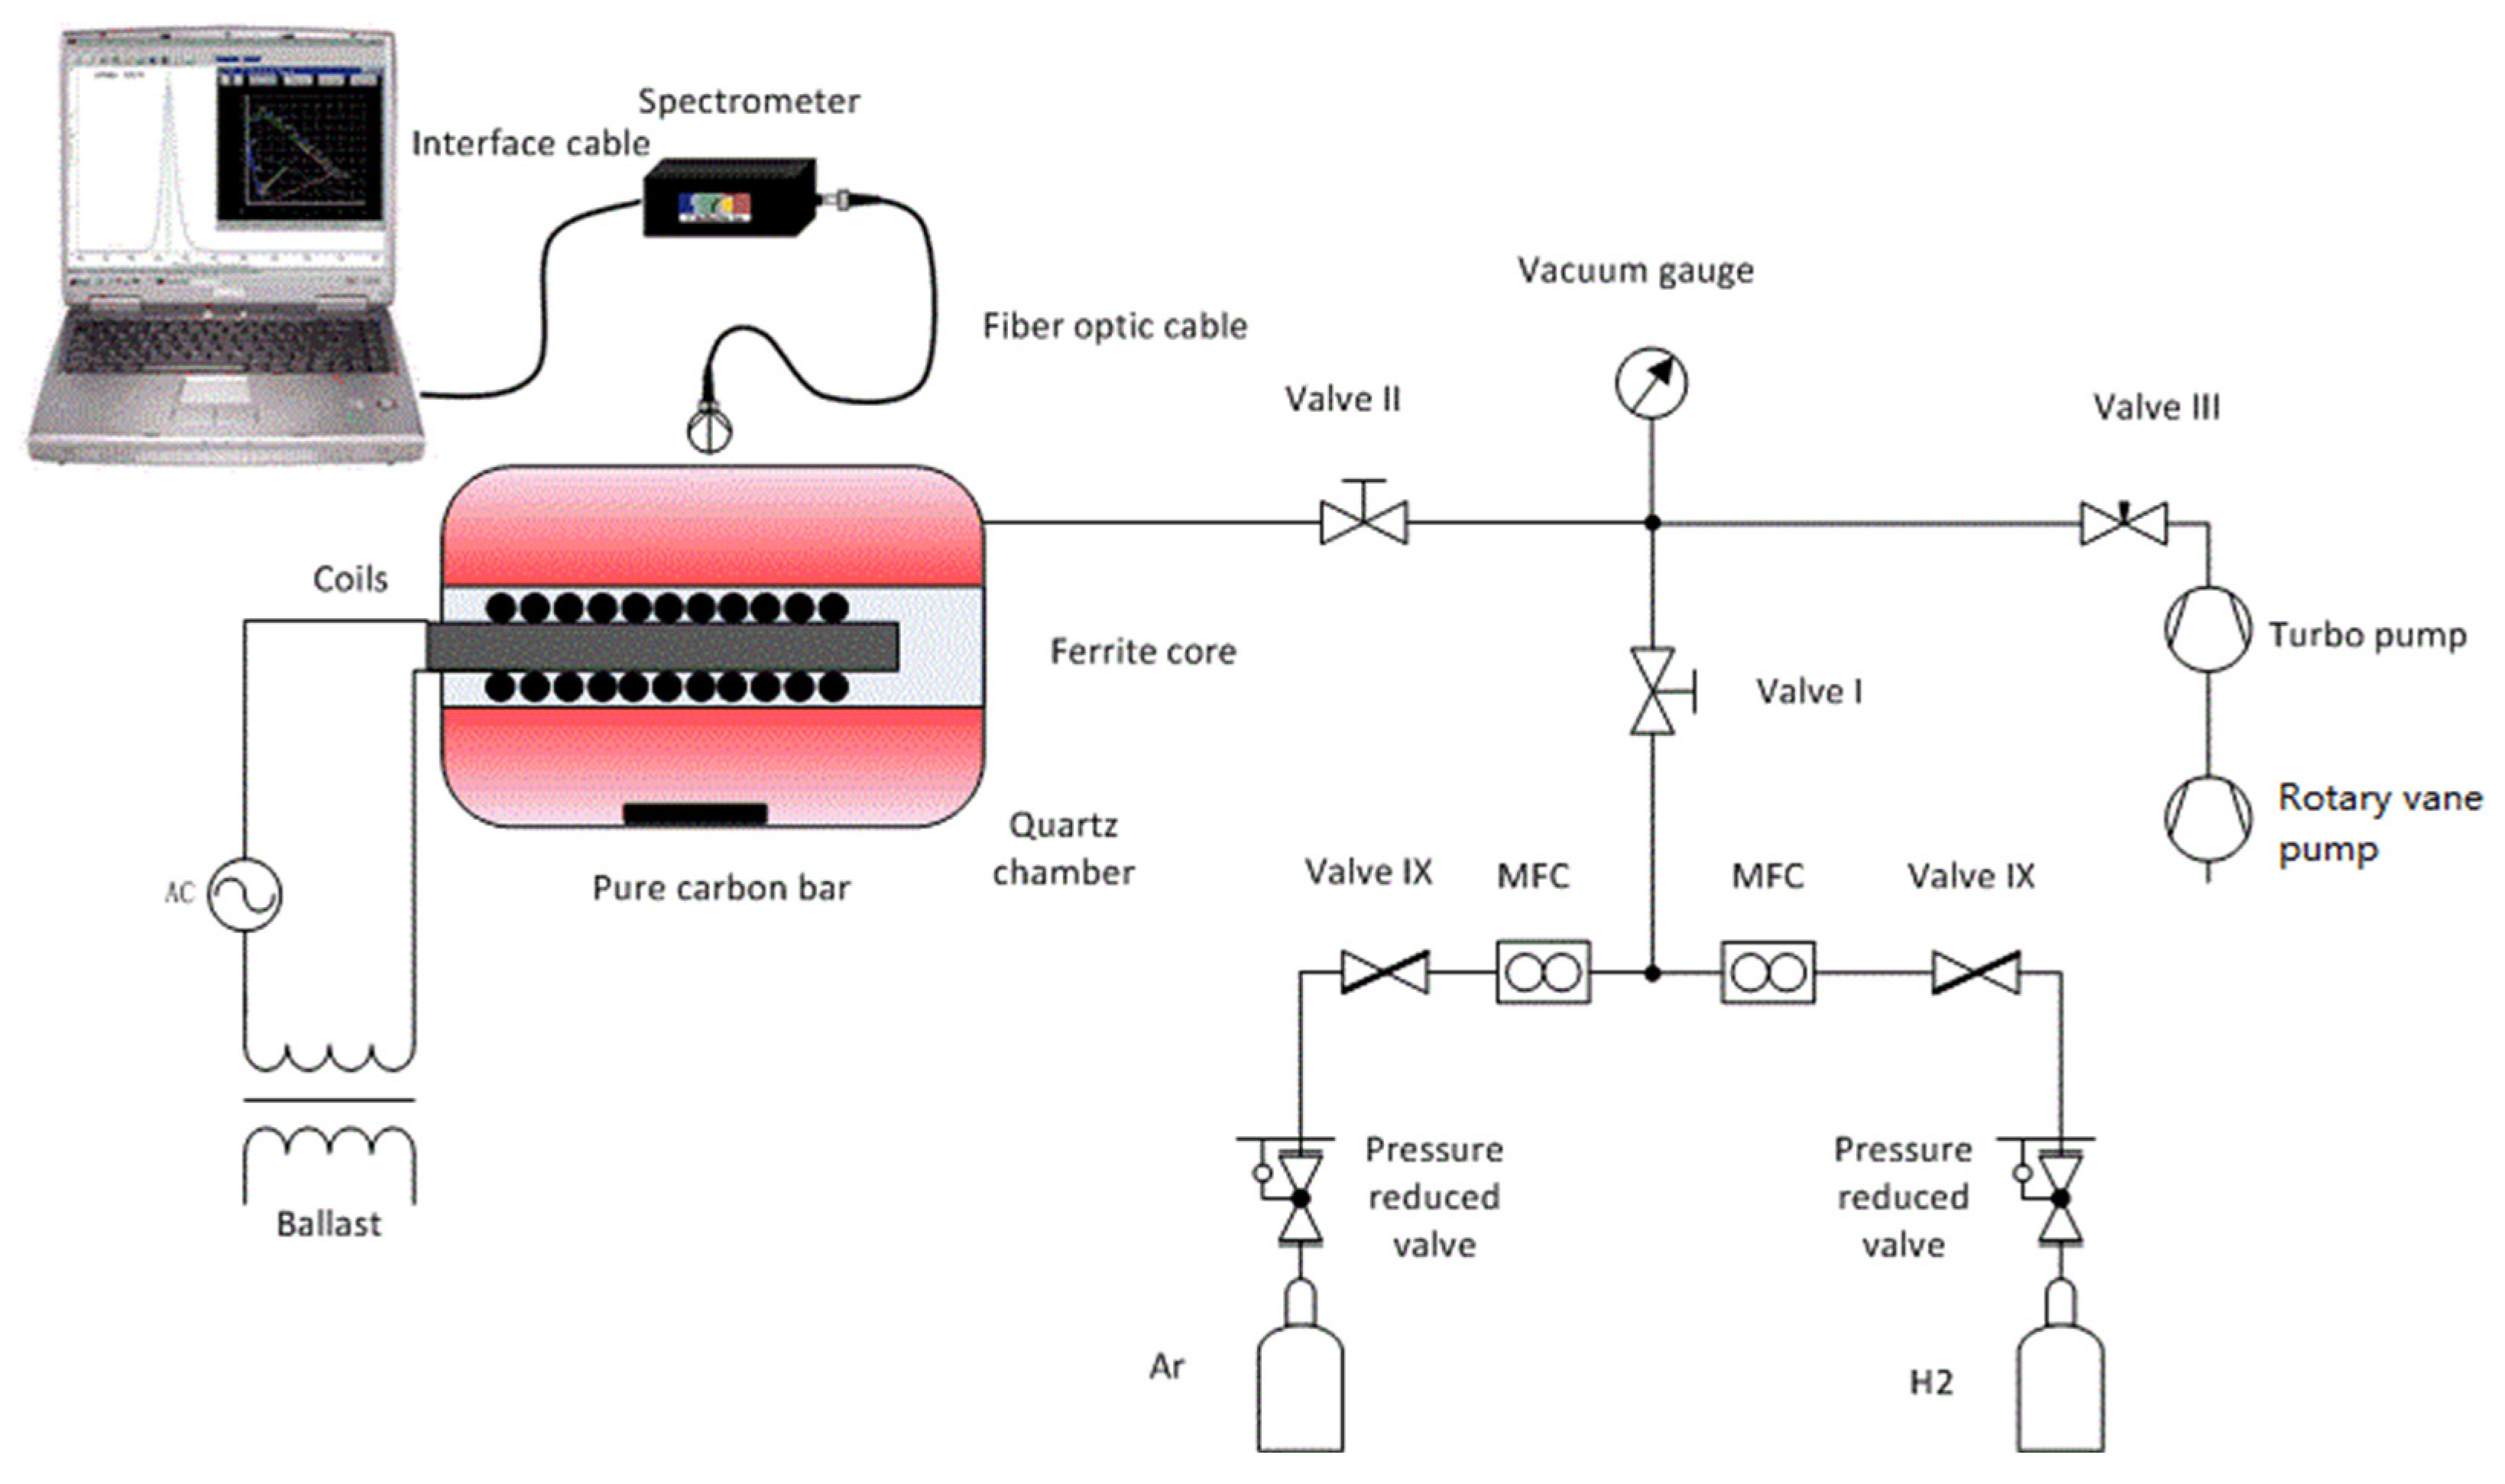
The experimental setup is shown in Figure 1, including an ICP source, an OES spectrometer, a gas delivery system, and a high vacuum system. The mixing ratio is controlled by mass flow controllers (MFC) using GSC-A (Vögtlin, Muttenz, Switzerland). The vacuum system consists of a hollow torus-shaped quartz chamber, a turbomolecular pump, a rotary vane pump, a vacuum gauge, and several valves. A vacuum of about 10−5 Pa in the chamber is achieved with the pumps, and the pressure is adjusted by valve III. The vacuum gauge monitors the pressure. When the pressures reach the intended values, both valve I and valve II are closed. Afterward, the power supply is switched on, and the plasma in the quartz chamber is ignited.

Figure 1.
Schematic of the experimental setup.
ICP is ignited and maintained by alternating electric and magnetic fields. The electric field provides the energy for the free electrons in the gas, and the accelerated electrons with high dynamic energy collide with neutral particles, such as molecules and atoms. The discharge in the plasma is formed in this way. Compared to capacitively coupled plasma (CCP), ICP discharges can produce much higher electron densities because of high fractional ionization. In addition, the time-varying magnetic fields are generated by coils instead of electrodes in the chamber, avoiding contamination from the electrodes. As shown in Figure 1, an ICP source consists of a quartz chamber, a ferrite core, coils, a ballast, and an AC source. A hollow torus-shaped quartz chamber is used as a plasma vessel. The volume of the chamber is about 2 L, and the chamber is filled with an argon and hydrogen mixture at a pressure of 5 Pa. Coils with a ferrite core are inserted in the center of the chamber. The used core consists of ferrite, whose properties of high magnetic permeability in combination with low electrical conductivity are an advantage in the field guidance of the magnetic field. The ICP source is ignited by high-frequency current through the coils at a frequency of 2.85 MHz and an electrical power of 165 W, which is the maximum value for the ICP source in the experimental setup. The specific parameters of the ICP source are listed in Table 1.

Table 1.
Parameters of the ICP source.
Compared with other plasma diagnostic methods, measurements in OES diagnosis are performed without interference. Inherent accuracy and rapid delivery of results make OES widely used in plasma research [16]. Emission spectra are measured in a wavelength range from λ = 200 to 1000 nm using a double monochromator spectrometer (Spectro 320D, Instrument Systems, Munich, Germany). The highest wavelength resolution provided by the spectrometer is 0.2 nm. The plasma radiation is detected directly by the sensor of the spectrometer near the chamber. The plasma is characterized based on spectral distribution and the intensities with variation in gas mixing ratios.
Typically, hydrogenated carbon films are caused by EUV or X-rays, and it was experimentally observed that amorphous carbon is the main form [17]. Amorphous carbon is free, reactive carbon that has no crystalline structure and primarily characterized through the ratio of sp2 to sp3 hybridized bonds. The sp2 hybridized bonds hold a very high ratio in the EUV or X-ray-induced carbon [17], and graphite consists purely of sp2 hybridized bonds. The reaction between carbon atoms and Ar/H2 mixture plasma is the core of the carbon removal process. First, the reaction was diagnosed with the OES method, and, to avoid the influence of uncertain factors, a pure graphite (99.99%) rod was chosen as the sample to investigate the dependence of this reaction on different mixing ratios. The geometry of the carbon rod is 1 mm in diameter and 10 mm in length. Spectra were measured with and without the rod in the chamber.
In addition, magnetron-sputtered carbon is similar to EUV or X-ray-induced carbon, which is frequently used as a model in related studies [13,14,17,18]. Magnetron deposited carbon film sample was produced in the form of amorphous to characterize the chemical reaction rates. Carbon removal rates were monitored with a quartz crystal microbalance (QCM) using SQM-160 (INFICON, New York, NY, USA), which has thickness and rate resolution as high as ±0.037 nm. Gold-coated crystals with a resonating frequency of 6 MHz were selected as sensors. The sensors coated with magnetron-sputtered carbon were prepared, and measurements were conducted in another vacuum chamber with identical parameters. Compared to the plasma source chamber in Figure 1, the vacuum chamber is even larger and has a volume of about 10 L. The QCM sensors are installed by vacuum feedthroughs, and pumps and vacuum gauges are used to control and monitor the pressure.
3. Simulation Model
A simulation model was created using the finite element software COMSOL Multiphysics (COMSOL AB, Stockholm, Sweden) [15]. In COMSOL, non-equilibrium plasma includes many aspects, such as fluid dynamics, electromagnetics, heat transfer, and molecular dynamic [19]. As mentioned earlier, ICP is driven by radio frequency currents cycling in coils, resulting in induction currents and electromagnetic fields. The model can be built and solved in the frequency domain.
3.1. Plasma Module
The plasma model is mainly created using the plasma module [20] in COMSOL, and, in this module, a set of partial differential Equations (1)–(4) are included in this interface to describe the main physical properties of the plasma. By solving drift–diffusion equations, electron density () is calculated by Equations (1) and (2) following electron conservation, and mean electron energy density () is computed by Equations (3) and (4) following energy conservation, respectively. As mentioned above, the ICP is excited by induction currents, and the induction currents are calculated using Equation (5).
Table 2 lists the involved variables, their description, and SI unit. The above equations combine drift–diffusion, heavy species, and electrostatic interfaces.
Table 2.
Nomenclature used in equations in ICP interface.
This is only a brief explanation of the equations underlying the simulation method; for more details, see [15].
3.2. Reactions in Ar/H2 Plasma
Many reactions occur in Ar/H2 mixed plasma, including dissociation, elastic collision, excitation, etc. Therefore, it is necessary to introduce some simplifications. The primary atomic reactions in the model for Ar/H2 plasma are listed in Table 3 and Table 4, respectively. To correlate the simulation with OES measurement results, the simulation was implemented based on the listed reactions. The set of reactions used aims to reproduce the relaxations of different energy states of hydrogen and argon, and the line radiation from these reactions can be measured by OES. All these reactions are used to simulate the behavior of the plasma in the model.
The reactions from 1 to 6 in Table 3 mainly describe collision-induced dissociation of the hydrogen molecule (reactions 1 and 2), energy transfer by elastic collisions of electrons and hydrogen atoms (reactions 3 and 4), and electron collisions resulting in ionization of the hydrogen atoms in the 1s and 2s energy state (reactions 5 and 6). Hydrogen atoms at lower energy levels can be excited to higher energy levels from reaction 7 to 10, and the energy will be radiated, which can be measured by the OES method. The relaxation of the hydrogen states H(3s), H(4s), and H(5s) to H(2s) (reactions 11–13) releases the specified radiation, Hα at λ = 656.279 nm, Hβ at λ = 486.135 nm, and Hγ at λ = 434.047 nm, which are referred to as the Balmer lines [21,22,23,24]. The intensities of the lines are closely related to the densities of the particles. For example, when reaction 11 occurs, the Hα line is emitted at λ = 656.279 nm, and the intensity of this line is an indicator of the density of H(3s) atoms. In order to obtain a closed system of reactions, recombination reactions (reactions 15–17) are also implemented.
Table 3.
Reactions in hydrogen plasma.
Table 3.
Reactions in hydrogen plasma.
| No. | Reaction Type | Reaction | Energy Δε (eV) | Wavelength λ(nm)/ Einstein Coefficient A(1/s) | Source |
|---|---|---|---|---|---|
| 1 | Dissociation | e + H2 → e + H(1s) + H(1s) | 4.52 | / | [25] |
| 2 | Dissociation | e + H2 → e + H(1s) + H(2s) | 4.52 | / | [25] |
| 3 | Elastic | e + H2 → e + H2 | / | / | [25] |
| 4 | Elastic | e + H(1s) → e + H(1s) | / | / | [26] |
| 5 | Ionization | e + H(1s) → 2e + H+ | 13.6 | / | [25] |
| 6 | Ionization | e + H(2s) → 2e + H+ | 3.4 | / | [25] |
| 7 | Excitation | e + H(1s) → e + H(2s) | 10.2 | / | [25] |
| 8 | Excitation | e + H(1s) → e + H(3s) | 12.09 | / | [25] |
| 9 | Excitation | e + H(1s) → e + H(4s) | 12.75 | / | [25] |
| 10 | Excitation | e + H(1s) → e + H(5s) | 13.5 | / | [27] |
| 11 | Relaxation | H(3s) → H(2s) | / | 656.279/2.2e7 | [28] |
| 12 | Relaxation | H(4s) → H(2s) | / | 486.135/9.7e6 | [28] |
| 13 | Relaxation | H(5s) → H(2s) | / | 434.047/4.9e6 | [28] |
| 14 | Relaxation | H(2s) → H(1s) | / | / | / |
| 15 | Recombination | e + H+ → H(1s) | / | / | / |
| 16 | Recombination | H(1s) + H(1s) → H2 | / | / | / |
| 17 | Recombination | H(1s) + H(2s) → H2 | / | / | / |
Table 4.
Reactions in argon plasma.
Table 4.
Reactions in argon plasma.
| No. | Reaction Type | Reaction | Energy Δε (eV) | Wavelength λ(nm)/ Einstein Coefficient A(1/s) | Source |
|---|---|---|---|---|---|
| 1 | Elastic | e + Ar → e + Ar | / | / | [25] |
| 2 | Ionization | e + Ar → 2e + Ar+ | 15.76 | / | [25] |
| 3 | Ionization | e + Ar(1s5) → 2e + Ar+ | 4.427 | / | [26] |
| 4 | Excitation | e + Ar → e + Ar(1s5) | 11.55 | / | [25] |
| 5 | Excitation | e + Ar → e + Ar(2p1) | 13.48 | / | [25] |
| 6 | Excitation | e + Ar → e + Ar(2p9) | 13.08 | / | [25] |
| 7 | Excitation | e + Ar(1s5) → e + Ar(2p9) | 1.527 | / | [27] |
| 8 | Excitation | e + Ar(1s2) → e + Ar(2p1) 1 | 1.652 | / | [27] |
| 9 | Relaxation | Ar(2p1) → Ar(1s2) 1 | / | 750.38/4.5e7 | [31] |
| 10 | Relaxation | Ar(2p9) → Ar(1s5) | / | 811.53/3.3e7 | [31] |
| 11 | Recombination | e + Ar+ → Ar | / | / | / |
| 12 | Relaxation | Ar(1s5) → Ar | / | / | / |
1 Simplification of the model to use the (1s5) state as lower state for reactions 8 and 9.
Unlike hydrogen molecules, argon consists of a single atom, and a dissociation reaction cannot occur in argon. Compared with the hydrogen atom, the energy level structure of argon is much more complicated. Spectral scans of argon non-equilibrium discharges showed that two typical emission lines for wavelengths between λ = 250 and 850 nm were at λ = 750.38 and 811.53 nm [29], which are hereinafter referred to as Ar I-750 and Ar I-811. Reactions involved with these two lines are listed in Table 4. Elastic collision and ionization (from reaction 1 to 3) also occur in argon plasma. The excitation reactions (from reaction 4 to 8) describe the excitation of the argon atoms into energy states Ar(1s5), Ar(2p1), and Ar(2p9). The mentioned two lines were used in the simulation model, and the corresponding reactions (reactions 9 and 10) are listed in Table 4. For example, the line at λ = 750.38 nm results from atomic line transitions between 2p1 and 1s2 levels. The energy state of 2p1 is from reaction 5. The upper state of the line at λ = 750.38 nm, 2p1, has a radiative lifetime of about 22 ns, calculated by the Einstein coefficient A (1/A from reaction 9). This level is excited by electrons from the ground state (reaction 5) and 1s5 (reaction 8), and the state is intensely relaxed to 1s5 [30]. Similarly, the emission line at λ = 811.53 nm originates from the upper level of 2p9, which has a lifetime of about 30 ns (1/A from reaction 10). The level of 2p9 is from reactions 6 and 7. These transitions are often used as a diagnostic tool to test different models [29].
Cross-sections can be regarded as a measure of the probability that specific processes occur [24], and, in COMSOL, the cross-section is used to calculate the rate coefficients of reactions according to the following equation [20],
where q is the charge, is the mass of the electron, is the dependence of the cross-section on energy, and is the distribution function of energy.
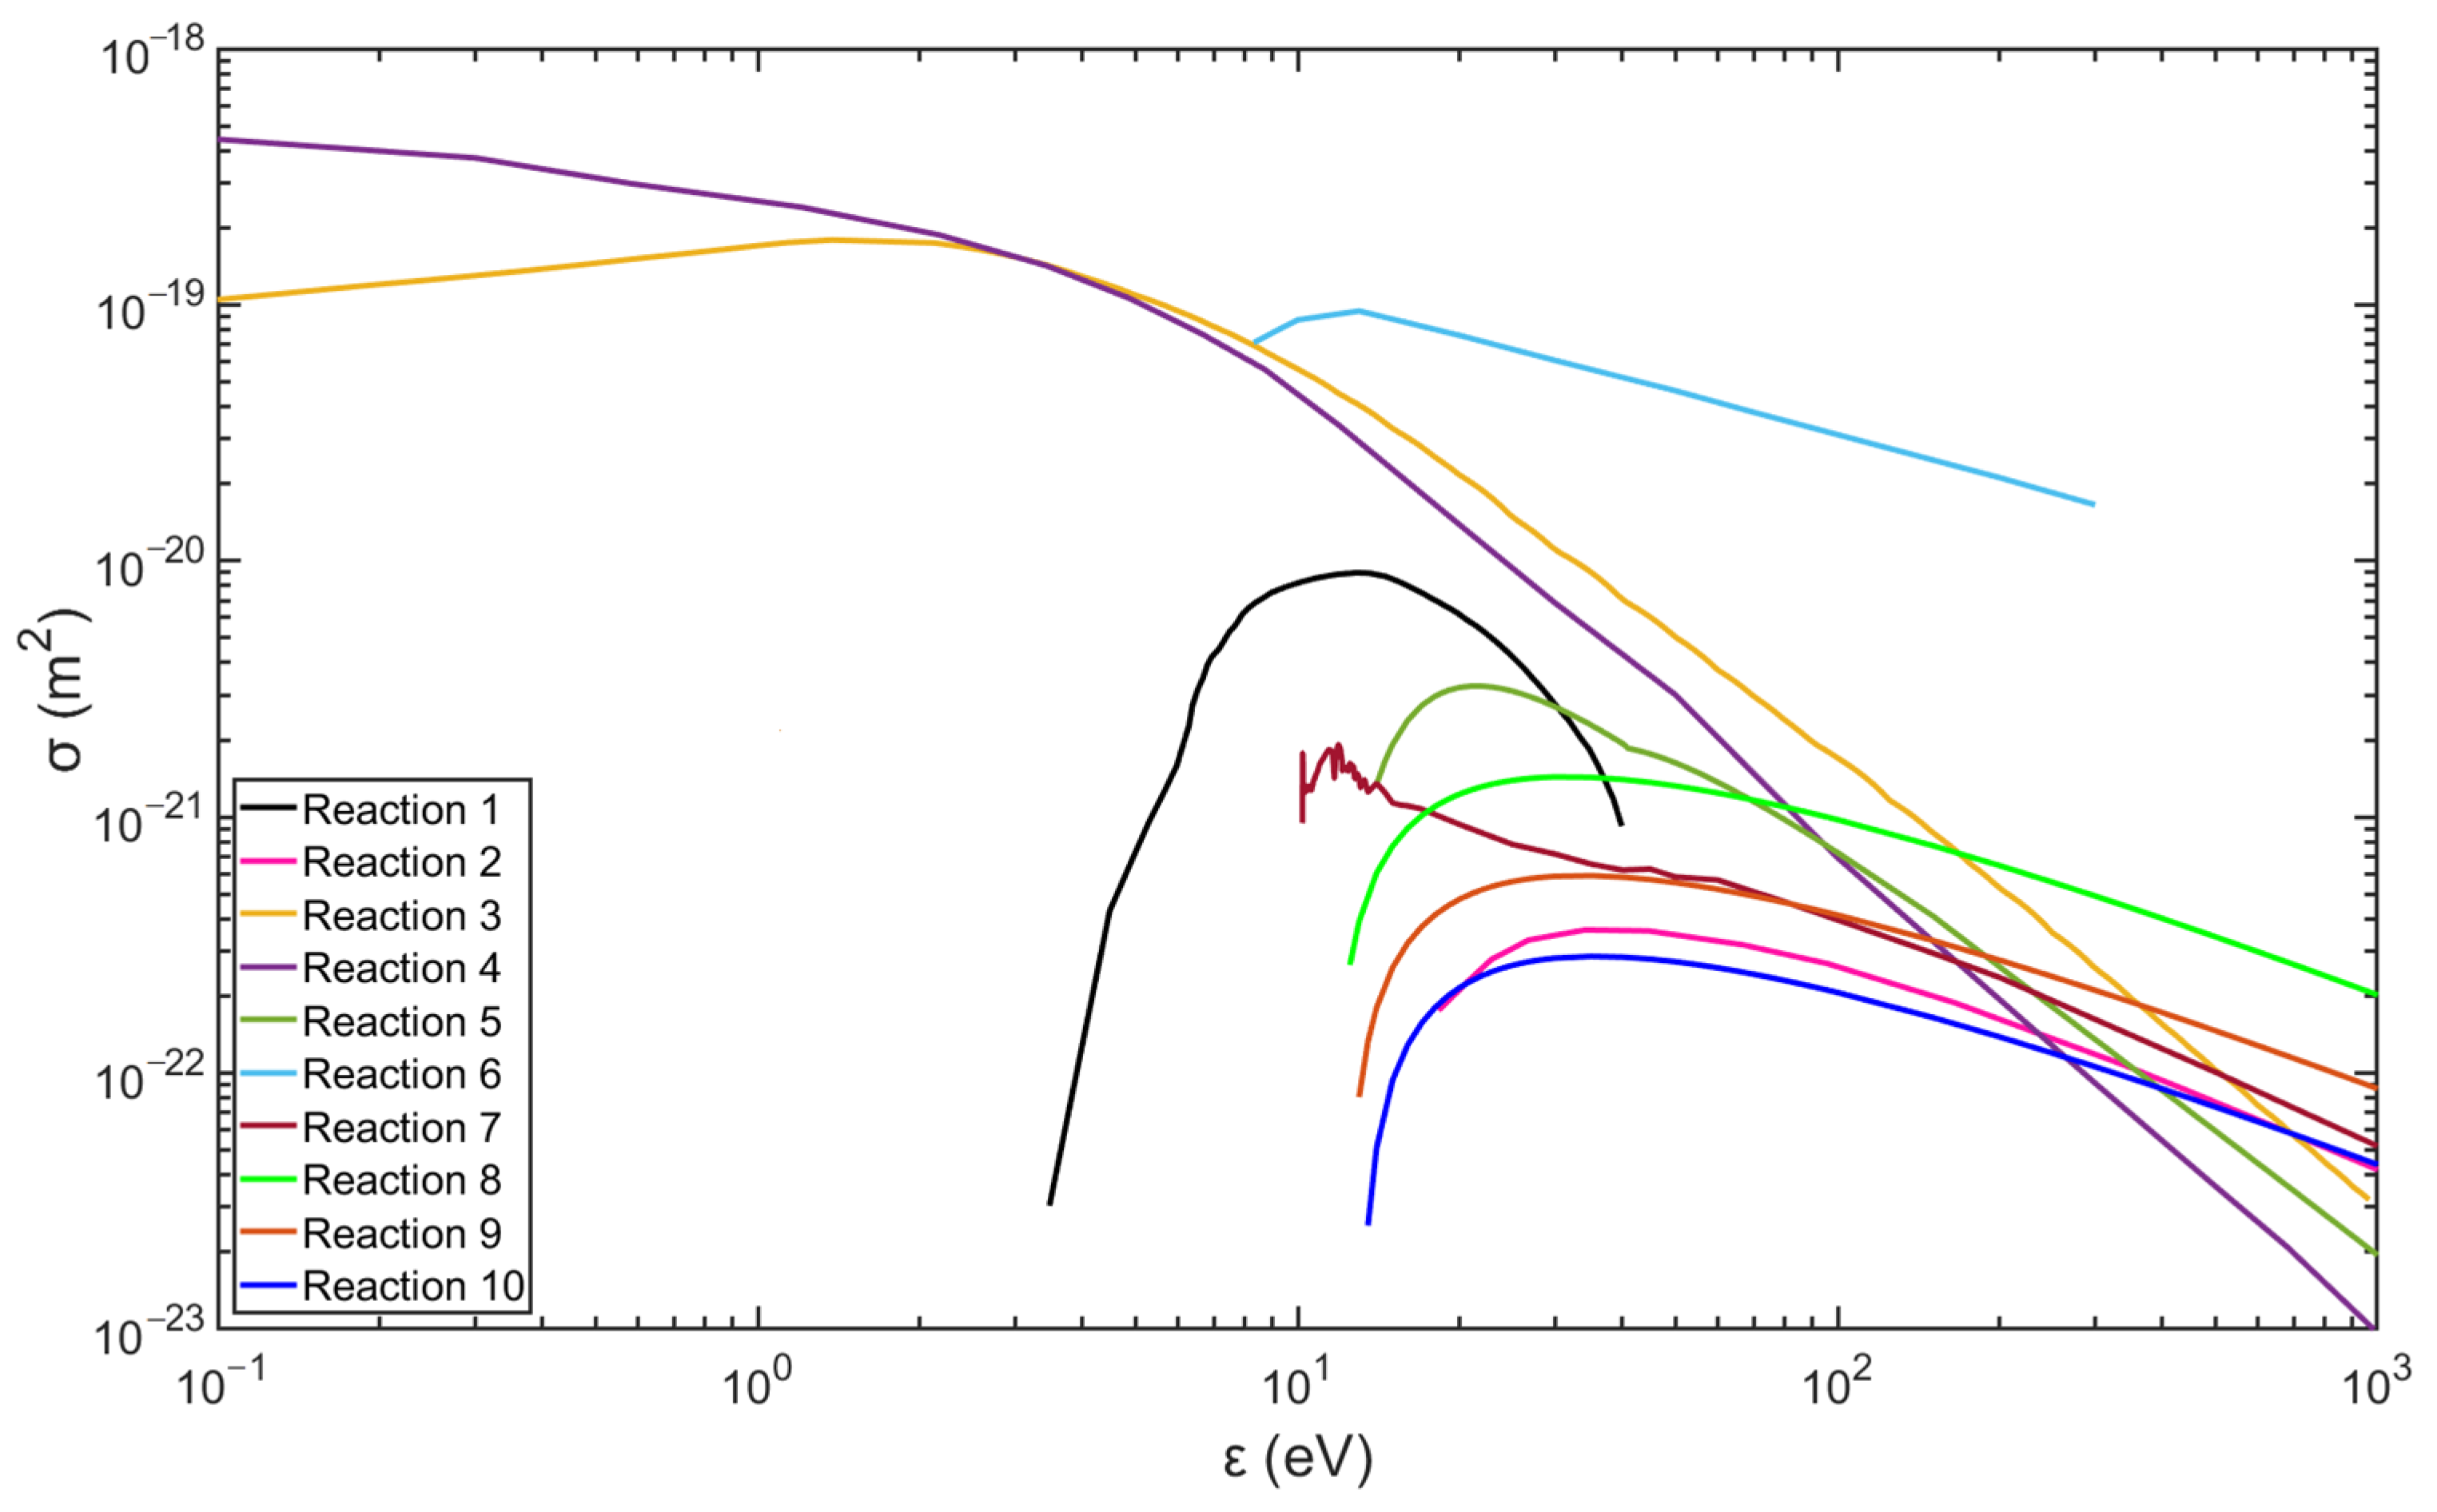
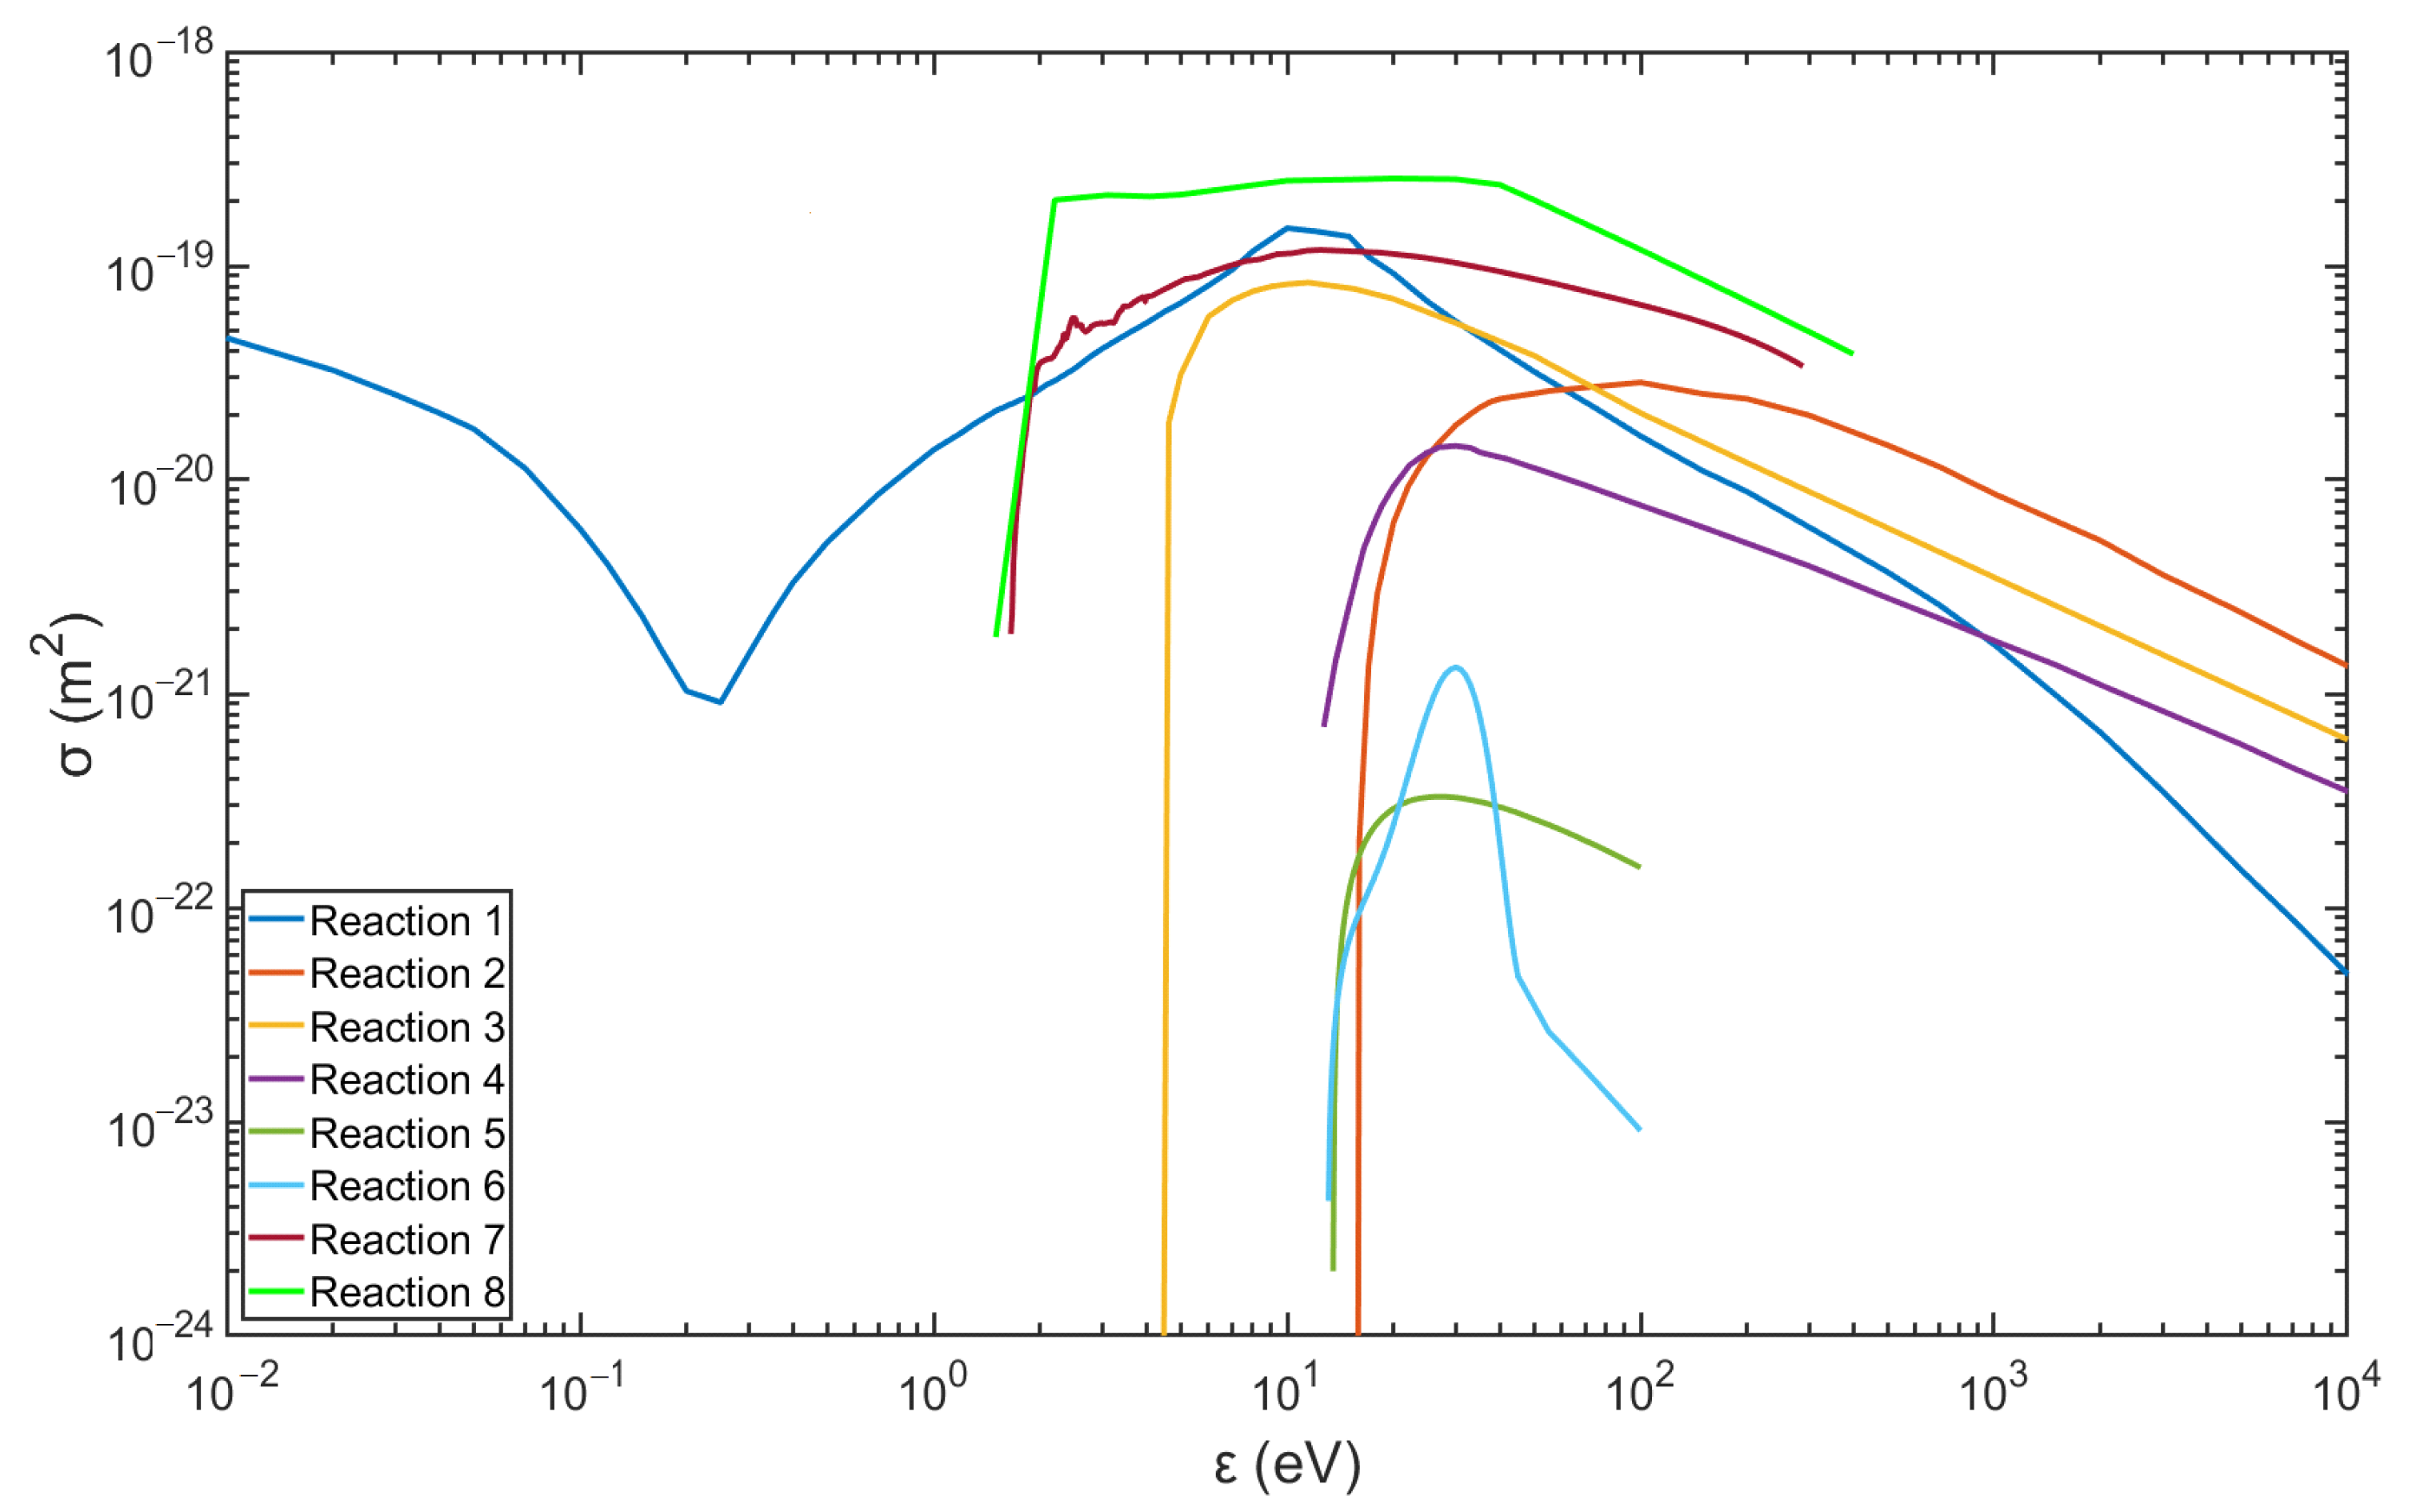
Figure 2 and Figure 3 show the data of the collision cross-sections of the reactions in Table 3 and Table 4, and the relevant data are from the databases listed, including databases of Biagi, TRINITI, NGFSRDW, IST-Lisbon, and NIST [25,26,27,28,31].
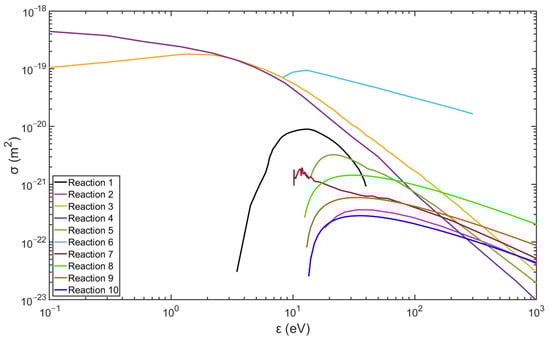
Figure 2.
Collision cross-section of hydrogen plasma reactions (data are from the databases listed in Table 3).
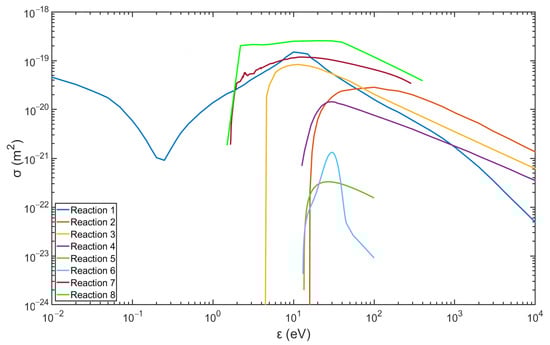
Figure 3.
Collision cross-section of argon plasma reactions (data are from the databases listed in Table 4).
4. Results and Discussion
4.1. Characterization of Ar/H2 Plasma with OES
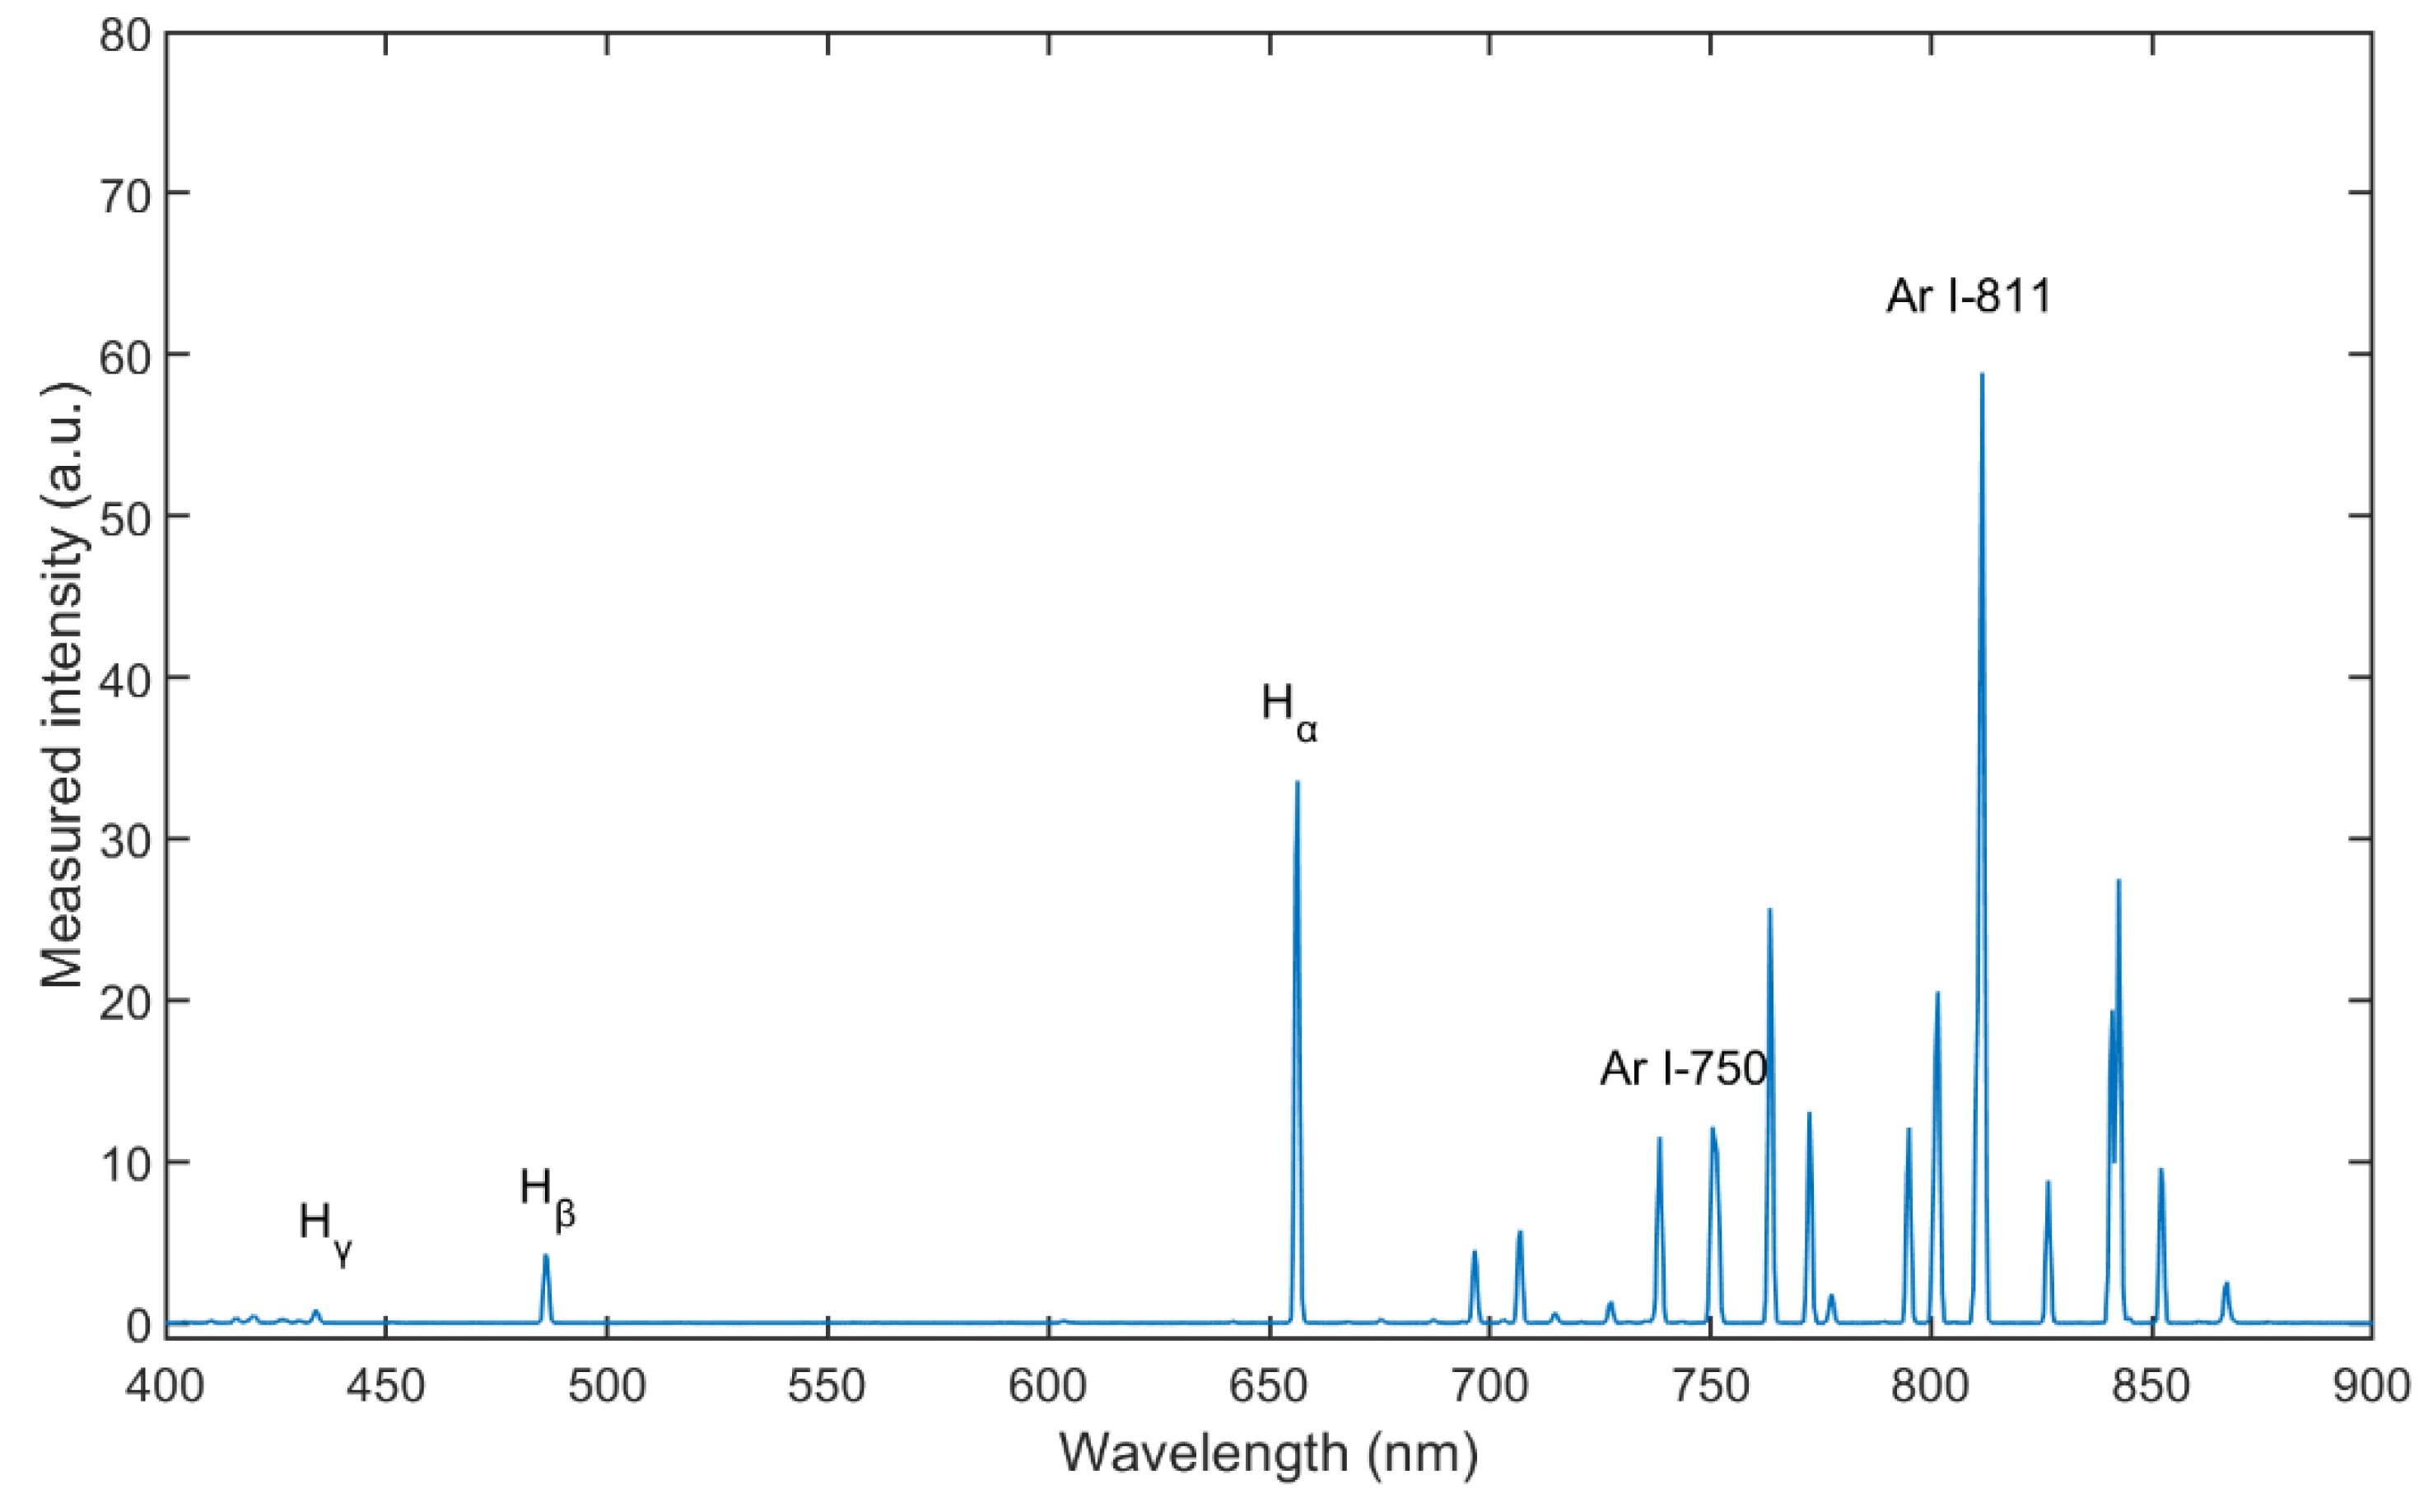
Figure 4 shows the spectrum for wavelengths between λ = 400 and 900 nm of Ar/H2 plasma, mixing with 35% hydrogen (volume flow under standard conditions) at an input of electrical power of 165 W and a pressure of 5 Pa. The Balmer lines are distinct enough to be evaluated. From the measurement result, the intensity of Hα is much stronger than that of the other two lines, which means that reaction 11 in Table 3 is the most prone transition [32].
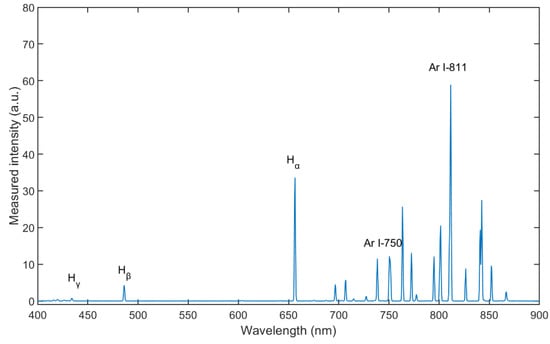
Figure 4.
Optical emission spectra of Ar/H2 ICP (with 35% hydrogen, at pressure of 5 Pa and power of 165 W).
The mixing ratio of Ar/H2 is important for the properties of the plasma. The Ar/H2 mixture was controlled by the MFCs, and the spectra were measured after the plasma was ignited. As Figure 5 shows, the intensities of the Balmer lines are sensitive to changes in the mixing ratio, while the intensities of the two typical argon lines do not change in the same way. The intensities of the Ar I-811 line change almost linearly with the mixing ratios, which is due to the lower density of Ar atoms in the chamber. The intensities of Hα change drastically with the mixing ratios, and the highest intensity occurs at a mixing ratio of about 40% hydrogen. The intensity results from the energy transitions of the atoms radiating at different wavelengths, and the intensity of Hα line signifies the highest density of the H(3s) species. Before the Ar/H2 mixture was filled into the chamber, the vacuum reached as high as the order of 10−5 Pa, and some residual molecules remained in the chamber or on the inner surfaces, e.g., water vapor. This is why, even when the chamber was filled with pure argon, low intensities of the Balmer lines were still detected.
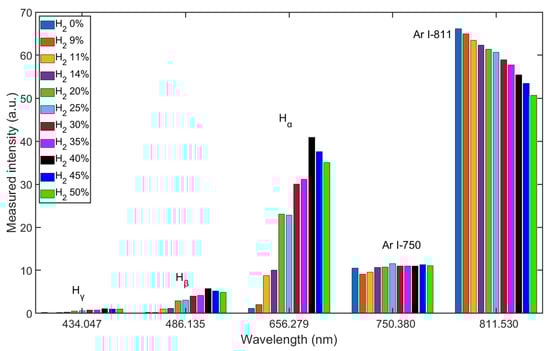
Figure 5.
Measured intensity shift of Ar/H2 plasma with different mixing ratios.
The increased intensity of Hα in the Ar/H2 ICP can be explained by stepwise ionization, which is one of the most important maintenance mechanisms [1]. Molecules are decomposed into excited atoms by elastic collisions with electrons, and the energy is transferred to several atoms. These atoms are ionized by the subsequent electron collision. Argon plasma is easily ignited due to the atomic structure and low excitation threshold energy. Plenty of electrons are provided for hydrogen reactions listed in Table 3, and the excitation efficiency of hydrogen can be enhanced in this stepwise ionization.
In particular, excited argon mainly exists in the metastable form in non-equilibrium plasma. Due to the capacities of long lifetime, extremely low excitation threshold energy, and large ionization cross-sections (see Figure 2 and Figure 3), the metastable argon atoms can become an important source of ionization and contribute to the ionization balance [1,33]. Consequently, the argon metastable atoms ()should be helpful in excitation of hydrogen by the reaction described below.
4.2. Comparison between Spectra and Simulation Results
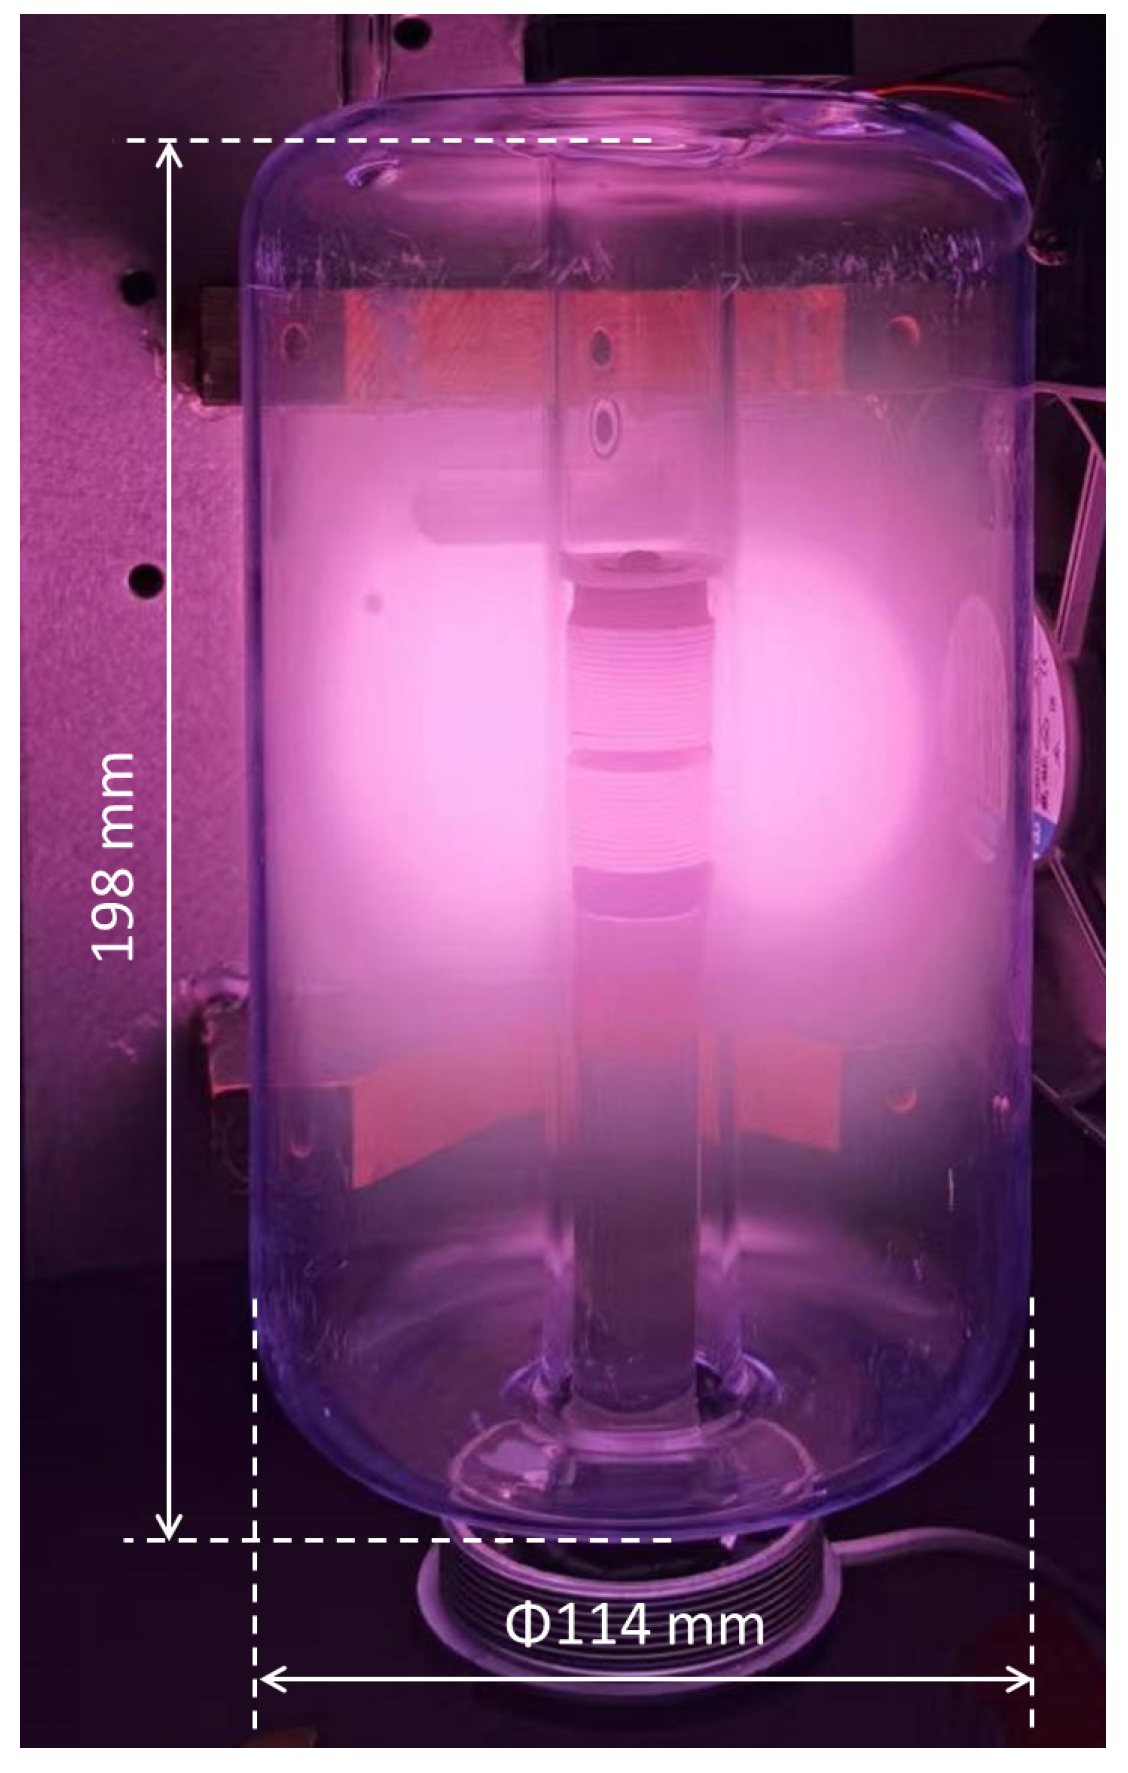
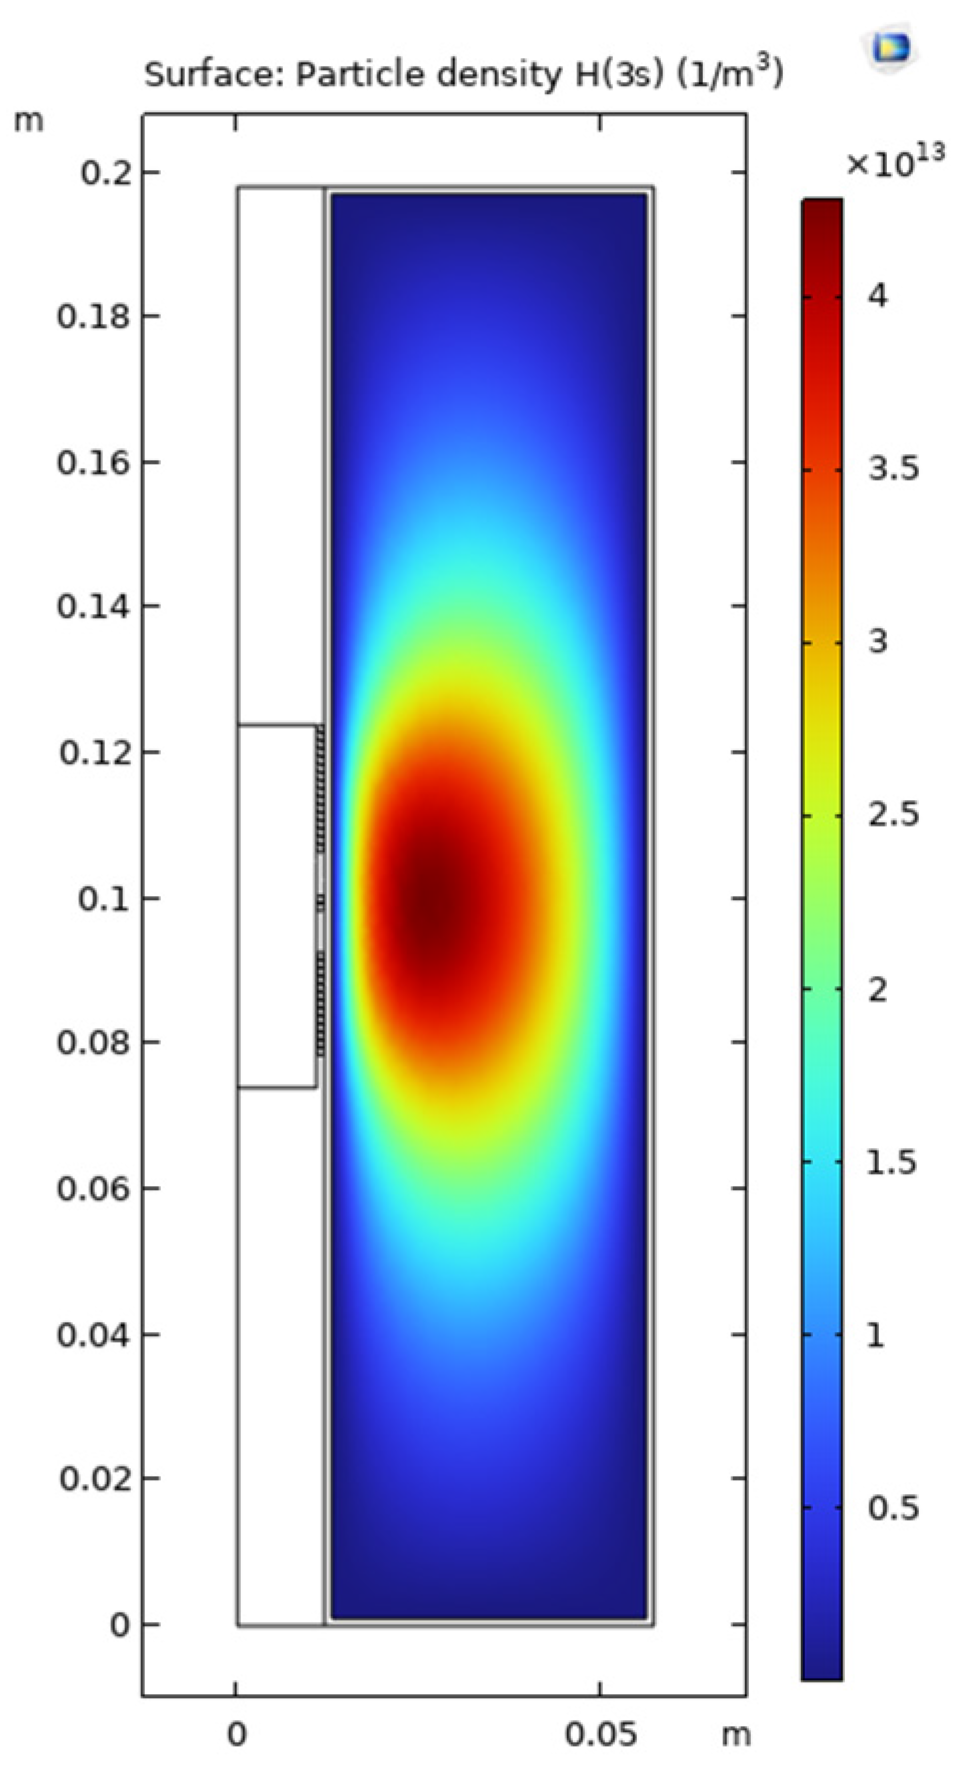
In this section, the results of measurements and simulations are presented and compared. Figure 6 and Figure 7 show an image of the stabilized plasma in the glass vessel and simulated H(3s) particle density distribution, respectively. From the structure of the coil and chamber, the discharge is symmetrical, and only half the cross-section was used to build the simulation model, as shown in Figure 7. As discussed above, ICP is generated by alternating electric and magnetic fields [34]. The higher the intensity of the electric field, the more energy can be transferred to the free electrons, resulting in higher intensity of the discharge. In the space near the coils, the intensity of the electric field is higher than in the other areas of the chamber. This is why both the plasma (Figure 6) and the simulation (Figure 7) show that ICP is mainly distributed in the center of the chamber.
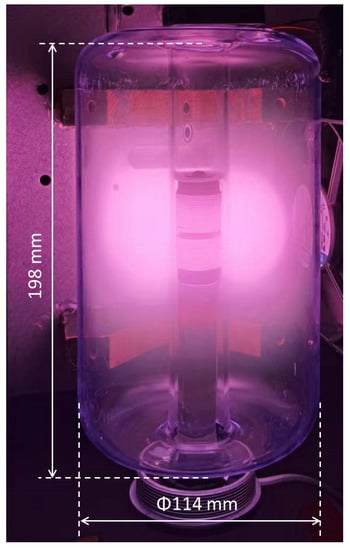
Figure 6.
Photograph of Ar/H2 ICP (with 35% H2, at pressure of 5 Pa and power of 165 W).

Figure 7.
Simulated H(3s) density distribution (with 35% H2, at pressure of 5 Pa and power of 165 W).
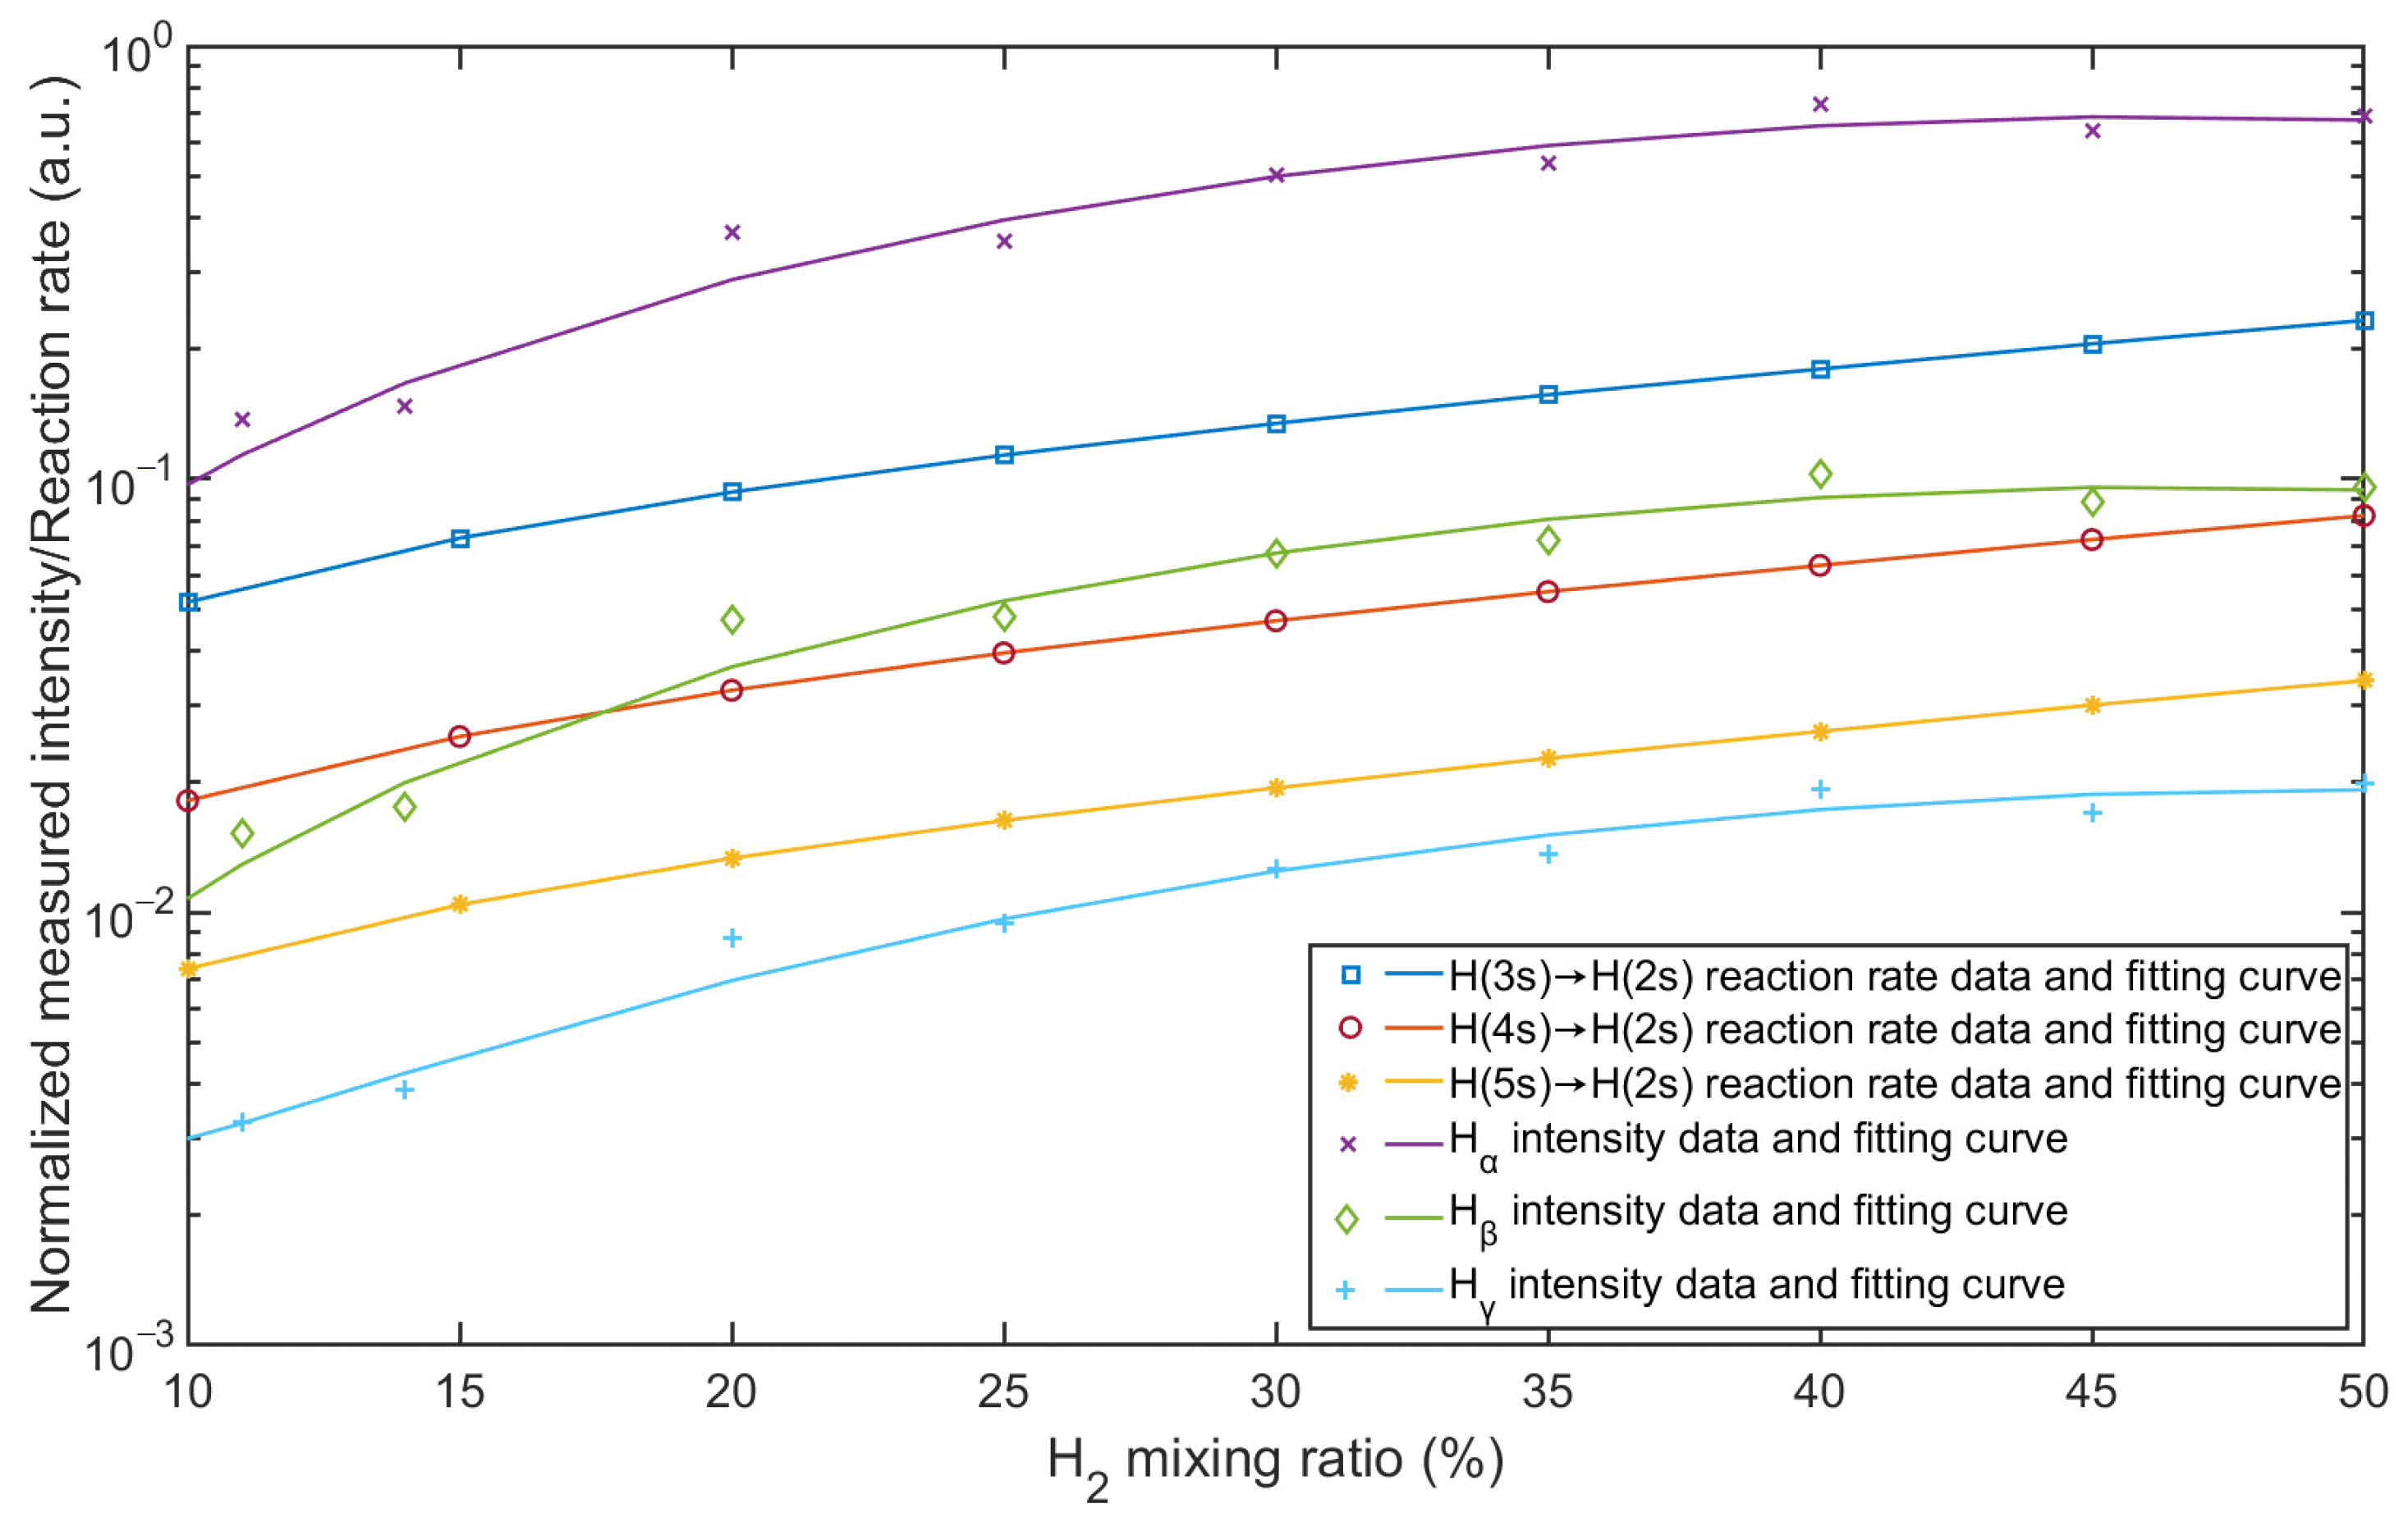
The mixing ratio has a large effect on the spectral distribution and reaction rates in the plasma, and the intensities of the lines result from the reaction rates. A comparison of the general behavior between the reaction rates and the intensities of the Balmer lines is shown in Figure 8. The intensities of the Balmer lines are normalized. Ar I-750 is chosen as the reference for normalization, and the normalized distribution is calculated by the intensities of Hα, Hβ, and Hγ divided by the intensity of argon line at λ = 750.38 nm. In the simulation model, the rates of reactions 11, 12, and 13 in Table 3 represent the frequencies at which the reactions occur and were calculated with cross-sections. As shown in Figure 8, both the normalized intensities and reaction rates increase with increasing hydrogen content. All three hydrogen lines show the same trend, and the reaction rates from the simulation results behave in a similar way. Compared to the individual emission lines and reaction rates, the simulation result agrees with the measurement result, which confirms the validation of the simulation model in terms of quantity.
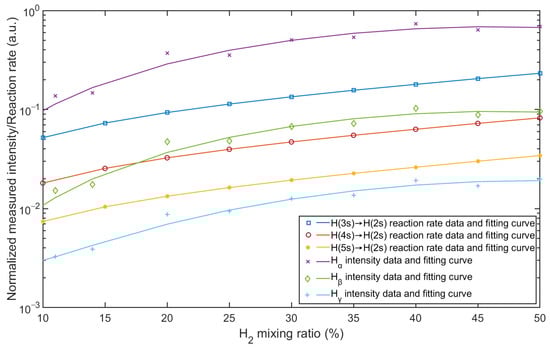
Figure 8.
Comparison between normalized measured intensity and simulated reaction rate as a function of Ar/H2 mixing ratio.
4.3. Characterization of Reactions between Carbon and Ar/H2 Plasma
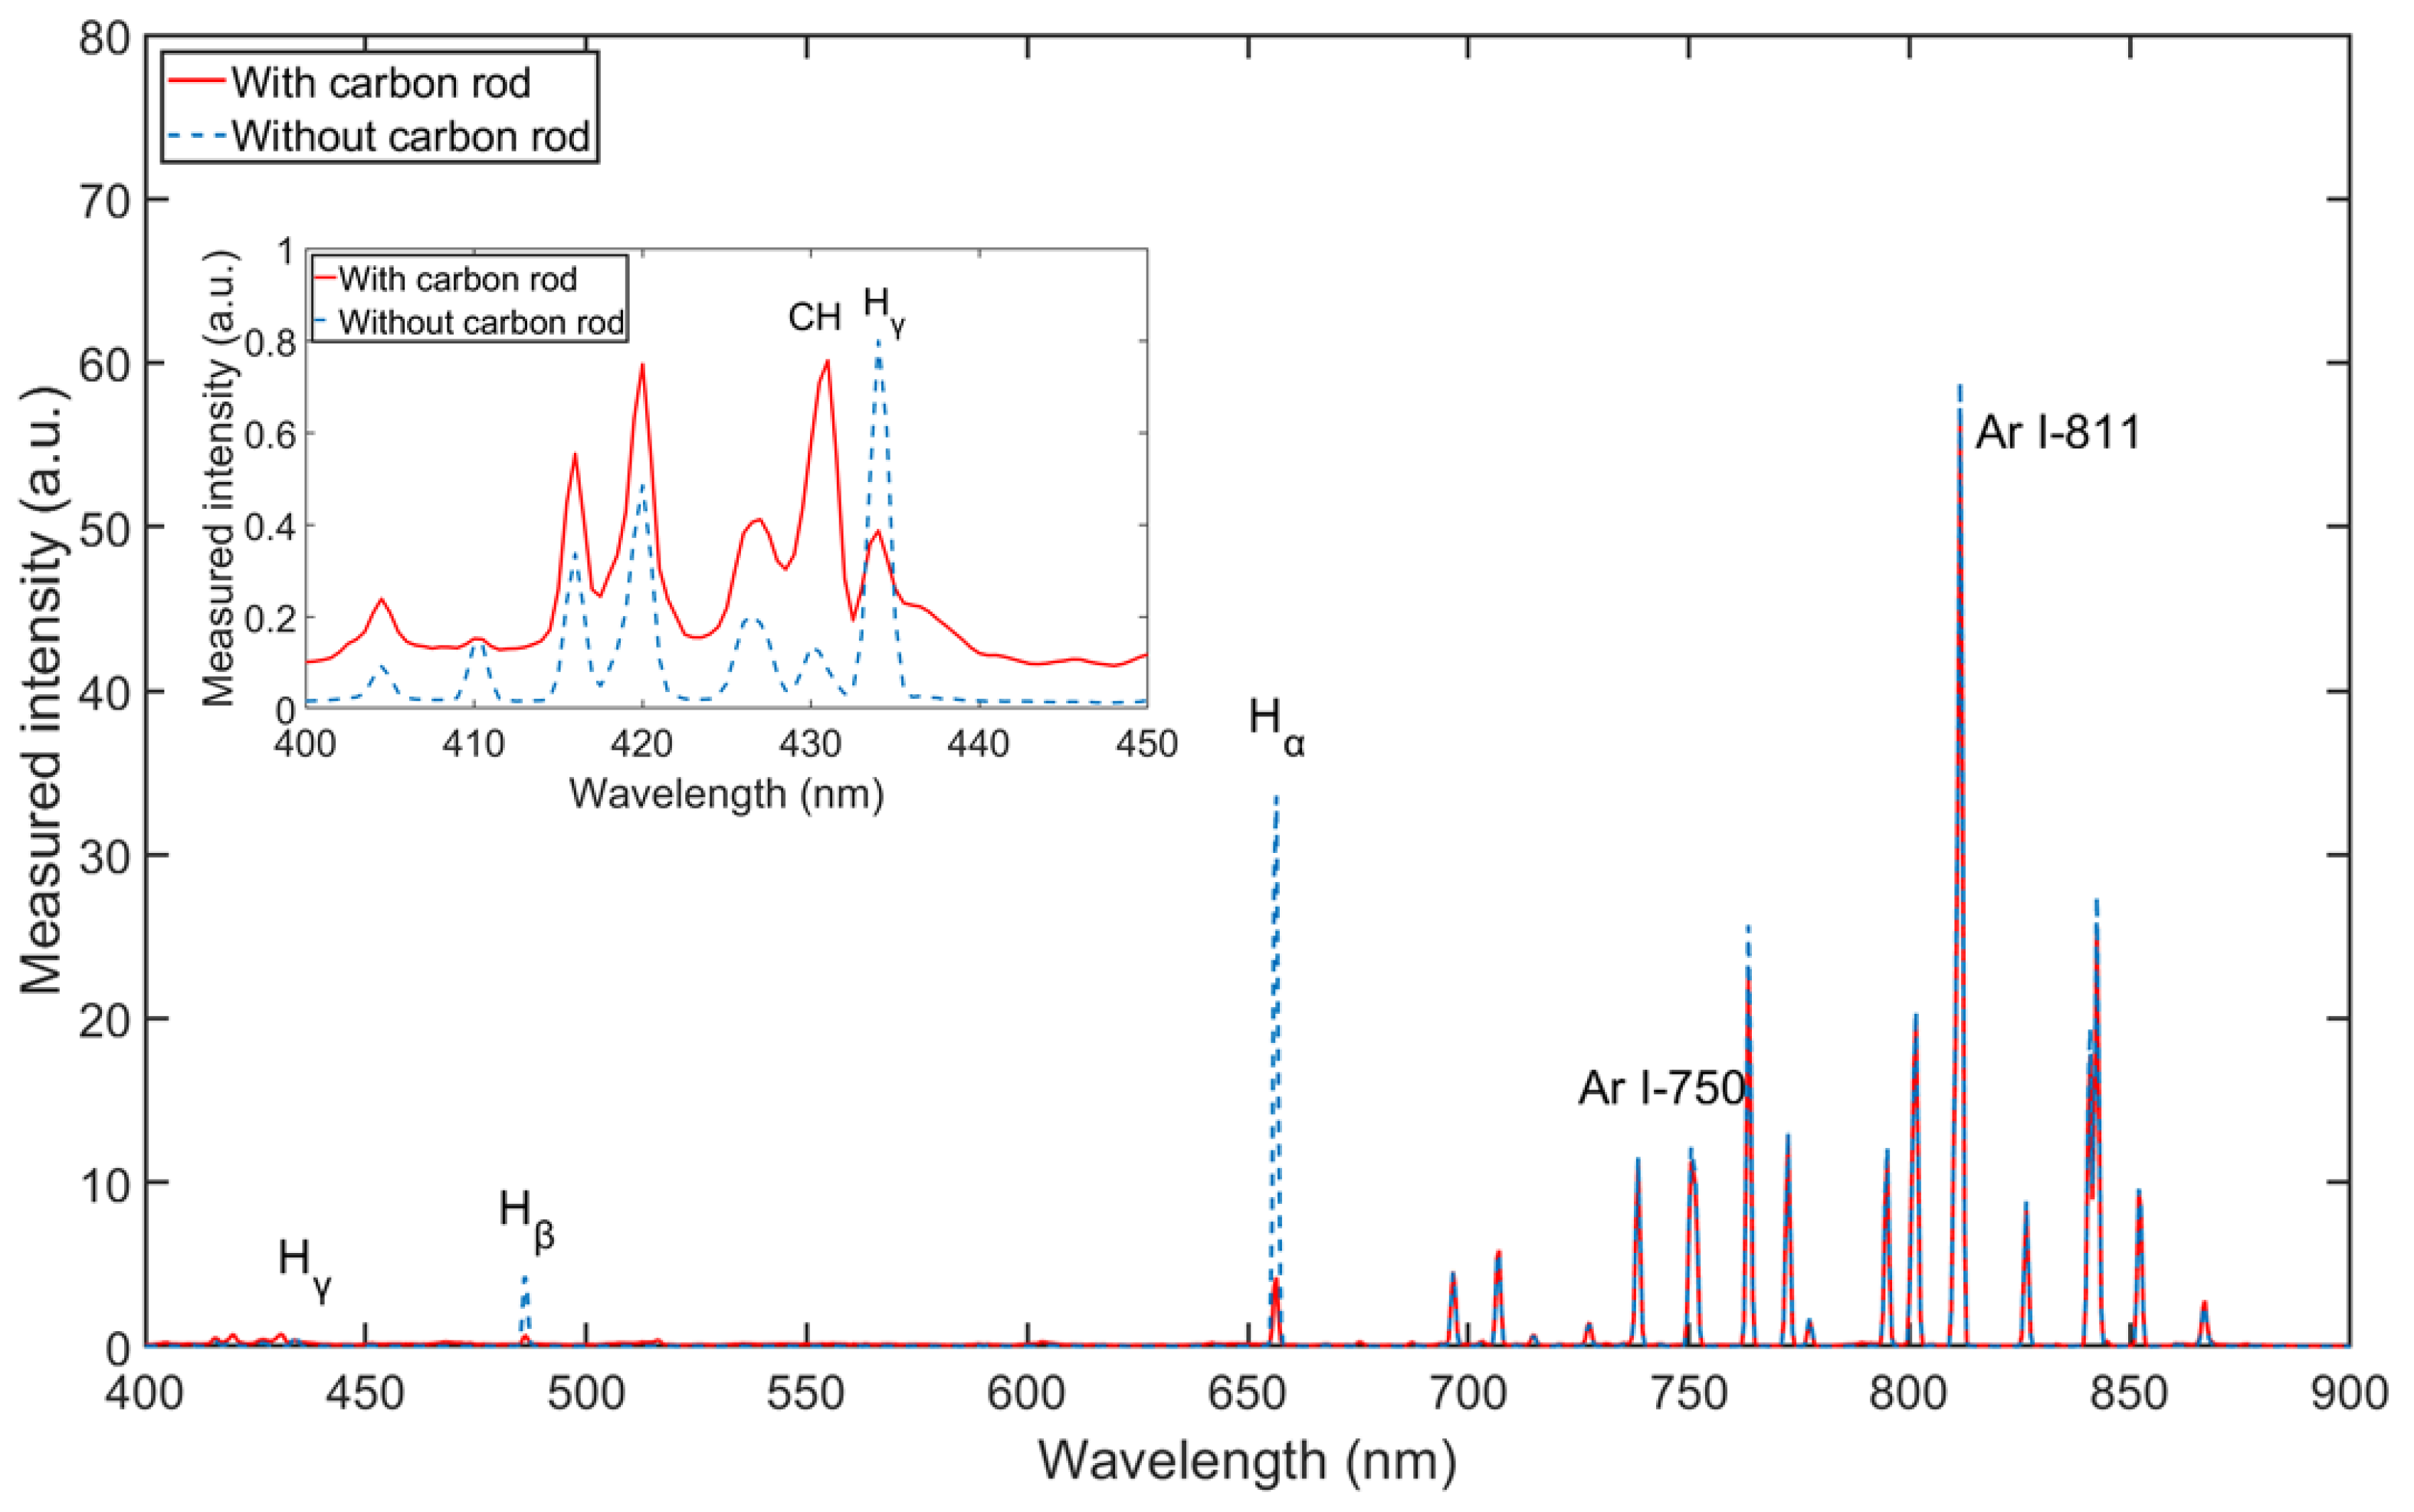
In this study, Ar/H2 non-equilibrium plasma is applied for a reaction with carbon. The above spectra measurements and simulations are based on the Ar/H2 plasma source. It is necessary to measure the spectra for the reaction between carbon and Ar/H2 plasma. As shown in Figure 1, after OES measurement of pure Ar/H2 plasma, a carbon rod made of pure graphite is introduced into the chamber. The OES measurement is performed on the Ar/H2 plasma with the carbon rod inside. The spectra are compared in Figure 9 with and without carbon under the same parameters. The intensities of the argon lines remain almost the same, while the intensities of the hydrogen lines change significantly. After the carbon rod was introduced into the plasma, all intensities of the hydrogen lines decreased. This phenomenon can be explained by the fact that the radical hydrogen atoms are almost absorbed by the carbon rod, and chemical reactions occur between the hydrogen atoms and the carbon atoms. After zooming in the figure from 400 to 450 nm, the intensity at 431.42 nm has definitely increased because of the introduction of carbon. The line at 431.42 nm is one of the typical wavelengths of CH [35]. CH is the main band in volatile hydrocarbon molecules, such as CH4, C2H6, etc. The increase in CH intensity provides evidence for reaction products. In the Ar/H2 mixed plasma, hydrogen is designated as the primary gas to provide the source of the radical atoms, and argon is added as a secondary gas to change the density of the radicals in the plasma [24].
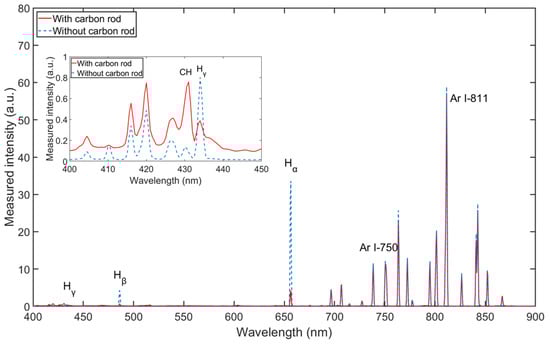
Figure 9.
Spectral comparison with and without carbon rod (with 35% H2, at pressure of 5 Pa and power of 165 W).
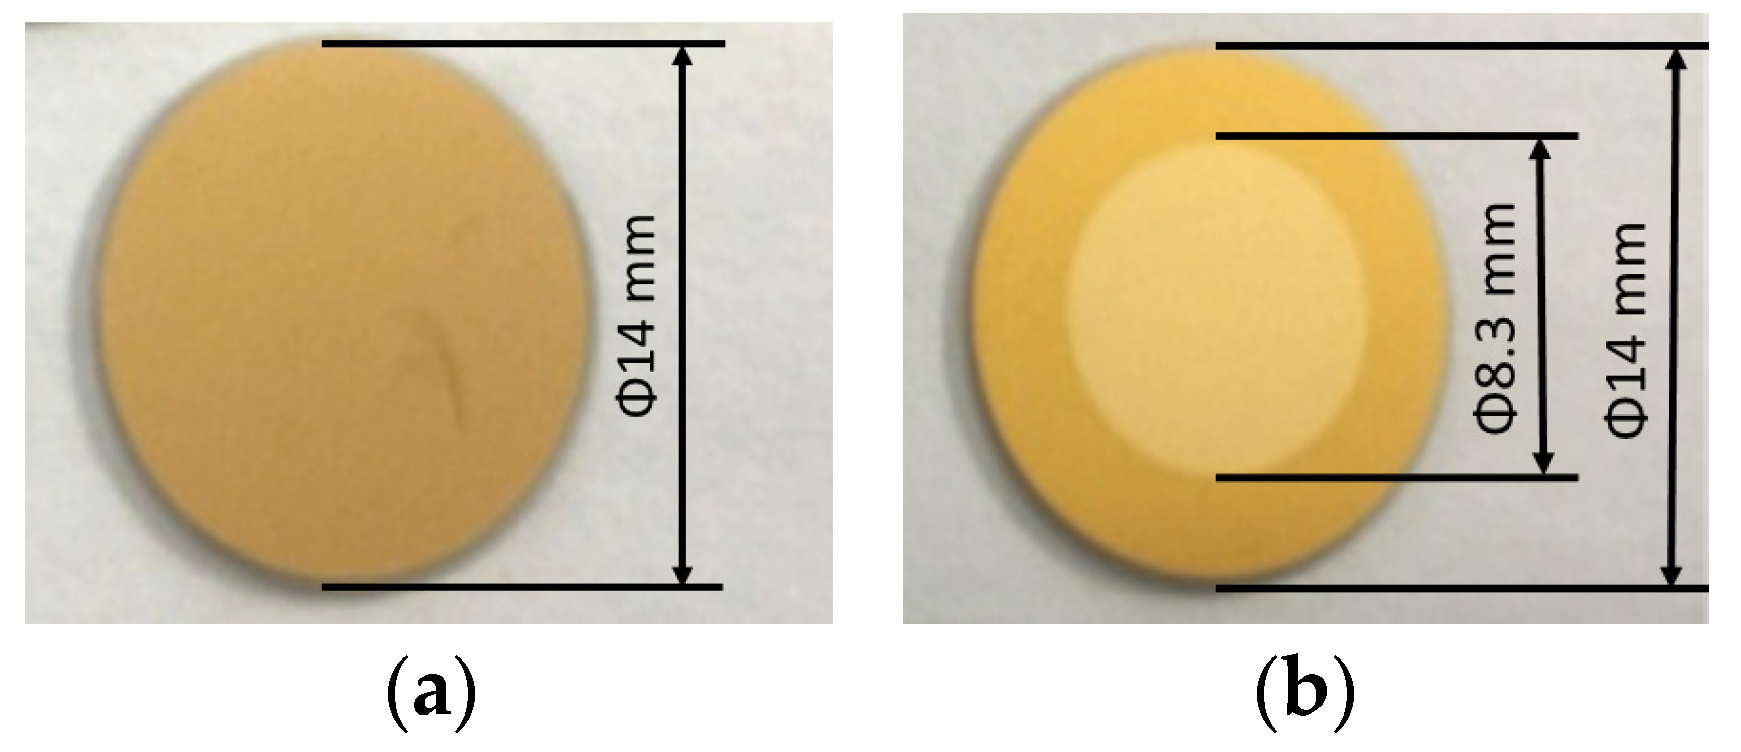
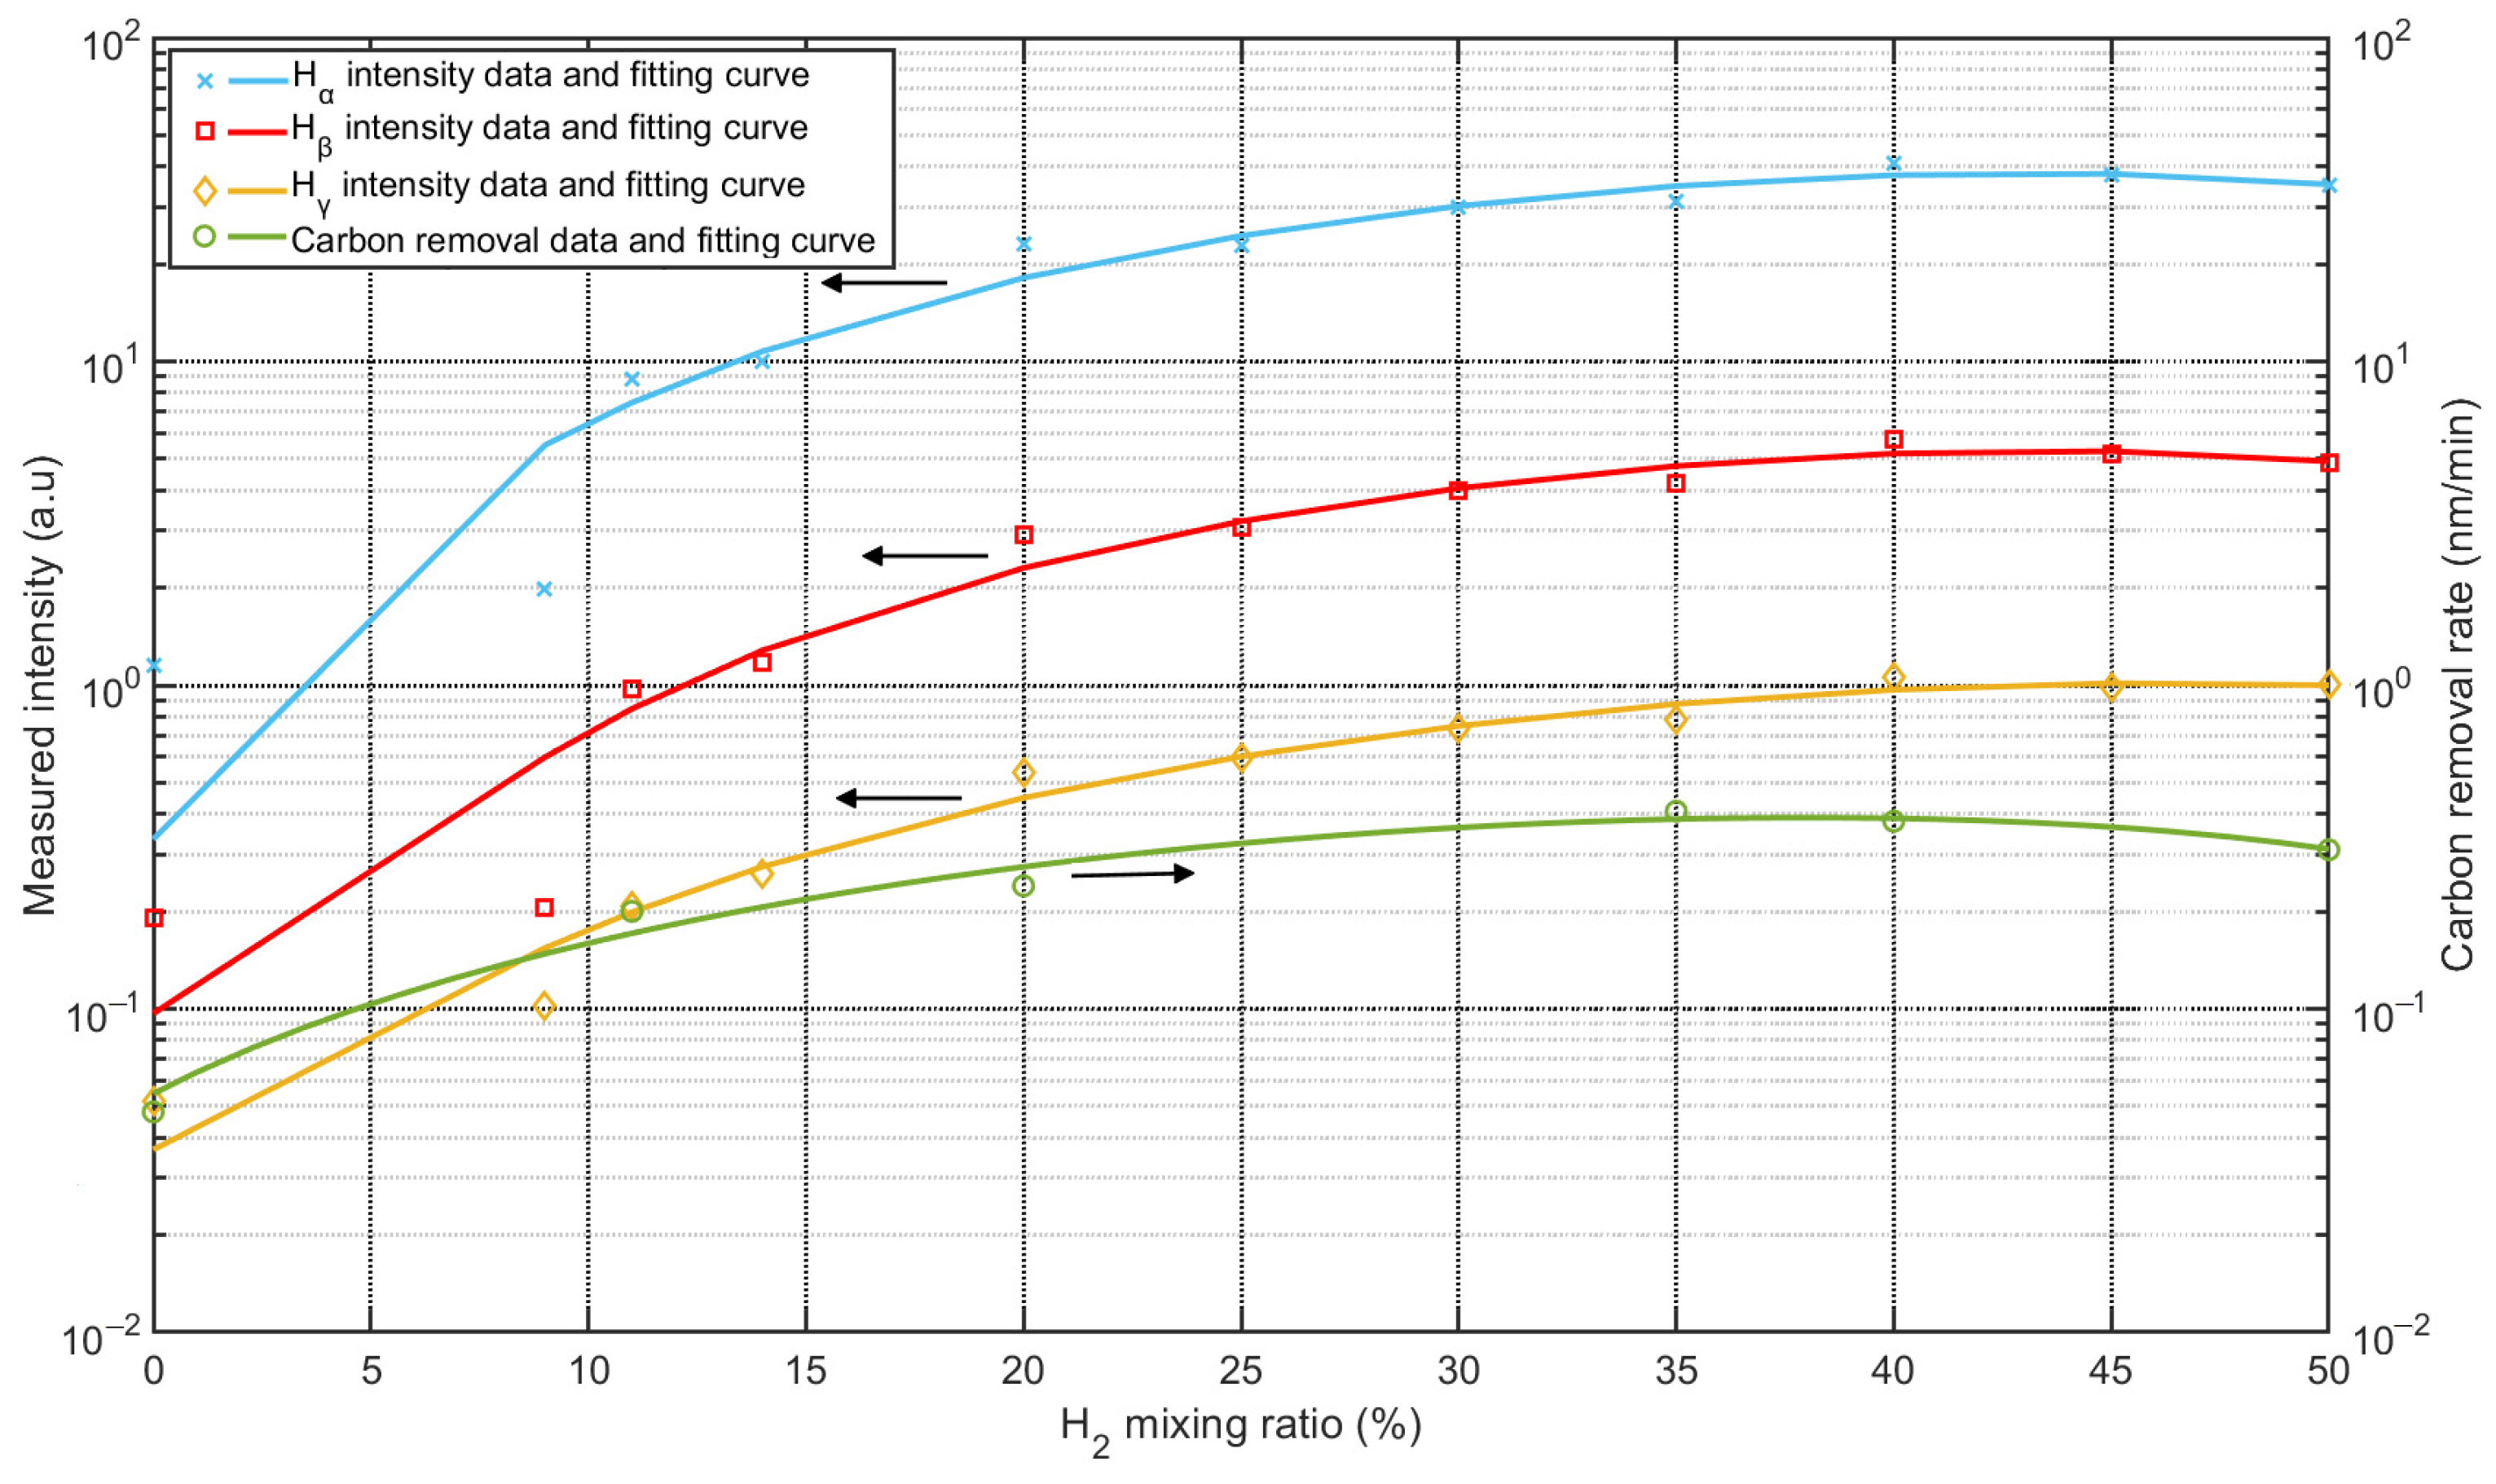
As mentioned in the introduction, carbon contamination is deposited on optical surfaces. The original properties of the optics can be restored by removing the carbon contamination, and carbon removal rates are important in this process. To investigate the reaction rates between carbon and Ar/H2 mixed plasma, samples were prepared using QCM sensors, i.e., gold-coated crystals. The sensors were coated with carbon layers about 50 nm thick (see Figure 10a), and the carbon layers were deposited using a magnetron sputtering source. Experiments were performed in a separate vacuum chamber with identical process parameters, only changing the mixing ratios. Figure 10b showed the QCM sensor after carbon removal, the torus around the sensor was covered by the sensor holder, and only the central part was treated with plasma. Carbon removal rates were monitored using the QCM, which can be used to measure changes in the removed carbon thickness. As shown in Figure 11, the intensities of the Balmer lines are compared with the carbon removal rates. All three Balmer lines observed changed with the mixing ratio at the same rate, while the carbon removal rates followed nearly at the same rate. The strongest intensities of the lines and the highest rate of carbon removal coincided with the proportion of 35%~40% hydrogen.

Figure 10.
QCM sensors for measurement: (a) QCM sensor coated with carbon films; (b) QCM sensor after carbon removal in the center.
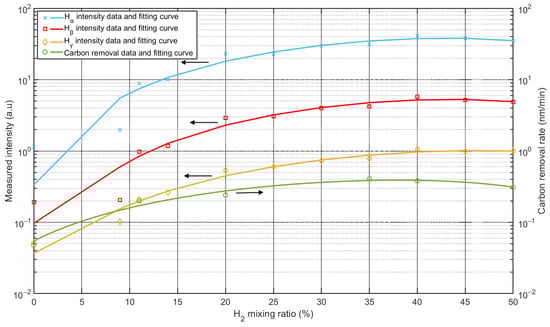
Figure 11.
Comparison between intensities of Balmer lines and carbon removal rate as a function of Ar/H2 mixing ratio.
The intensity of the Hα line was much stronger than that of the other two Balmer lines, and Hα was selected for comparison with carbon removal rates. Figure 12 shows the normalized comparison between the intensity of Hα and the carbon removal rate with different mixing ratios. The curves were generated using a quadratic polynomial fit based on the spectral data from the measurement of OES and the carbon removal rates from the QCM measurement. As shown in Figure 12, both the normalized intensity of the Hα lines from the OES measurement and the carbon removal rates peaked at a mixing ratio of about 35% hydrogen. The highest intensity almost coincides with the highest rate of carbon removal. The intensity of the Hα indicates the density of the H(3s) particle, while the density of H(3s) reached the maximum value with about 30% hydrogen from the simulation result. Considering simplifications in the simulation model and contributions from other hydrogen radicals, neglecting the slight difference and combining the curves in Figure 12, the role of the mixing ratio becomes clear. The mixing ratio changes the density of hydrogen radicals, which determines the reaction rates between Ar/H2 plasma and carbon films. Further speculation suggests that carbon removal rate is closely related to density of hydrogen radicals. As Hα predominates in the OES measurement, the higher density of H(3s) may lead to a higher removal rate.
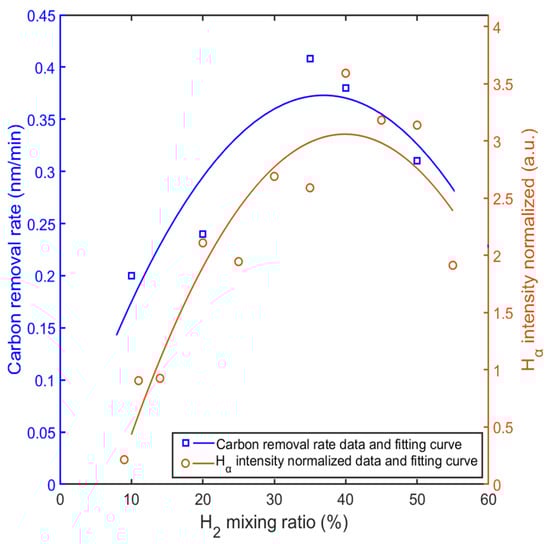
Figure 12.
Comparison between normalized intensity of Hα and carbon removal rate with different mixing ratios.
In the Ar/H2 mixed plasma, argon serves as the electron source for excitation or dissociation of the hydrogen molecule [36]. Under a low hydrogen fraction, i.e., with more argon atoms in the mixture, the possibility of excitation for hydrogen is higher, but the density of hydrogen atoms is lower. As proportion of hydrogen in the mixture increases, initial density of hydrogen molecules increases in the chamber with the same pressure. However, as density of hydrogen increases, density of argon decreases and less electrons are provided for excitation or dissociation of the hydrogen molecule. The degree of excitation of the hydrogen molecule gradually decreases, but the density of the excited atoms increases at the beginning and then decreases after a certain point. This is the explanation for the existence of an optimal mixing ratio.
5. Conclusions
In summary, measurement of optical emission spectroscopy enabled study of Ar/H2 non-equilibrium inductively coupled plasma, and a simulation model was established in conjunction with multiphysics fields to characterize the plasma. Both the measurement and simulation results showed an optimal mixing ratio of about 35 ± 5% hydrogen in Ar/H2 to produce the highest density of hydrogen radical atoms at the parameters used. This mixing ratio coincides with the optimal carbon removal rates from the quartz crystal microbalance measurement. Therefore, the reaction between Ar/H2 plasma and carbon is controlled by the density of hydrogen radical atoms, and the mixing ratio plays an important role in carbon removal rate. Ar/H2 mixed plasma is a promising method to solve the carbon contamination problem.
Author Contributions
Conceptualization, Y.W. and T.G.; writing—original draft preparation, Y.W.; writing—review and editing, Y.W., T.G, Q.J., J.D. and R.K.; funding acquisition, Y.W. All authors have read and agreed to the published version of the manuscript.
Funding
This work is partially funded by National Natural Science Foundation of China, grant number 61905239.
Institutional Review Board Statement
Not applicable.
Informed Consent Statement
Not applicable.
Data Availability Statement
Not applicable.
Acknowledgments
Yi Wang acknowledges the financial support from the China Scholarship Council (Grant No. 202004910183). We acknowledge support by the KIT Publication Fund of the Karlsruhe Institute of Technology.
Conflicts of Interest
The authors declare no conflict of interest.
References
- Lee, Y.-K.; Chung, C.-W. Ionization in inductively coupled argon plasmas studied by optical emission spectroscopy. J. Appl. Phys. 2011, 109, 013306. [Google Scholar] [CrossRef]
- Meillot, E.; Vincent, S.; Bot, C.-L.; Sarret, F.; Caltagirone, J.P.; Bianchi, L. Numerical simulation of unsteady ArH2 plasma spray impact on a moving substrate. Surf. Coat. Technol. 2015, 268, 257–265. [Google Scholar] [CrossRef]
- Zhang, T.; Mariaux, G.; Vardelle, A.; Li, C.-J. Numerical Simulation of Plasma Jet Characteristics under Very Low-Pressure Plasma Spray Conditions. Coatings 2021, 11, 726. [Google Scholar] [CrossRef]
- Sode, M.; Schwarz-Selinger, T.; Jacob, W. Ion chemistry in H2-Ar low temperature plasmas. J. Appl. Phys. 2013, 114, 063302. [Google Scholar] [CrossRef]
- Espinho, S.; Felizardo, E.; Tatarova, E.; Dias, F.M.; Ferreira, C.M. Vacuum ultraviolet emission from microwave Ar-H2 plasmas. Appl. Phys. Lett. 2013, 102, 114101. [Google Scholar] [CrossRef]
- Monna, V.; Ricard, A. Emission spectroscopy of Ar–H2 plasma. Vacuum 2001, 61, 409. [Google Scholar] [CrossRef]
- Fan, L.-S.; Constantin, L.; Li, D.-W.; Liu, L.; Keramatnejad, K.; Azina, C.; Huang, X.; Golgir, H.R.; Lu, Y.; Ahmadi, Z.; et al. Ultraviolet laser photolysis of hydrocarbons for nondiamond carbon suppression in chemical vapor deposition of diamond films. Light Sci. Appl. 2018, 7, 17177. [Google Scholar] [CrossRef] [PubMed]
- Edwards, C.; Arbabi, A.; Popescu, G.; Goddard, L.L. Optically monitoring and controlling nanoscale topography during semiconductor etching. Light Sci. Appl. 2012, 1, e30. [Google Scholar] [CrossRef]
- Bajt, S.; Prasciolu, M.; Fleckenstein, H.; Domaracký, M.; Chapman, H.N.; Morgan, A.J.; Yefanov, O.; Messerschmidt, M.; Du, Y.; Murray, T.; et al. X-ray focusing with efficient high-NA multilayer Laue lenses. Light Sci. Appl. 2018, 7, 17162. [Google Scholar] [CrossRef]
- Chen, J.; Louis, E.; Lee, C.-J.; Wormeester, H.; Kunze, R.; Schmidt, H.; Schneider, D.; Moors, R.; Van Schaik, W.; Lubomska, M.; et al. Detection and characterization of carbon contamination on EUV multilayer mirrors. Opt. Express 2009, 17, 16969–16979. [Google Scholar] [CrossRef]
- Kerkhof, M.; Liu, F.; Meeuwissen, M.; Zhang, X.; de Kruif, R.; Davydova, N.; Schiffelers, G.; Wählisch, F.; van Setten, E.; Varenkamp, W.; et al. Spectral purity performance of high-power EUV systems. In Proceedings of the Advanced Lithography, San Jose, CA, USA, 23–27 March 2020. [Google Scholar]
- Comini, N.; Huthwelker, T.; Diulus, J.-T.; Osterwalder, J.; Novotny, Z. Factors influencing surface carbon contamination in ambient-pressure X-ray photoelectron spectroscopy experiments. J. Vac. Sci. Technol. 2021, 39, 043203. [Google Scholar] [CrossRef]
- Pellegrin, E.; Sics, I.; Reyes-Herrera, J.; Sempere, C.P.; Alcolea, J.J.L.; Langlois, M.; Rodriguez, J.F.; Carlino, V. Characterization, optimization and surface physics aspects of in situ plasma mirror cleaning. J. Synchrotron Radiat. 2014, 21, 300–314. [Google Scholar] [CrossRef]
- Wang, Y.; Lu, Q.-P.; Gao, Y.-G.; Gong, X.-P.; Song, Y. Enhanced removal of X-ray-induced carbon contamination using radio-frequency Ar/H2 plasma. Nucl. Sci. Technol. 2019, 30, 26. [Google Scholar] [CrossRef]
- COMSOL. AB Stockholm Sweden. 2019. Available online: www.comsol.com (accessed on 5 August 2022).
- Tsumaki, M.; Ito, T. Optical emission spectroscopy of atmospheric-pressure non-equilibrium plasma with mist injection. AIP Adv. 2017, 7, 125211. [Google Scholar] [CrossRef]
- Dolgov, A.; Lopaev, D.; Lee, C.J.; Zoethout, E.; Medvedev, V.; Yakushev, O.; Bijkerk, F. Characterization of carbon contamination under ion and hot atom bombardment in a tin-plasma extreme ultraviolet light source. Appl. Surf. Sci. 2015, 353, 708. [Google Scholar] [CrossRef]
- Malykhin, E.M.; Lopaev, D.V.; Rakhimov, A.T.; Rakhimova, T.V.; Braginskii, O.V.; Kovalev, A.S.; Vasil’Eva, A.N.; Zyryanov, S.M. Plasma cleaning of multilayer mirrors in EUV lithography from amorphous carbon contaminations. Mosc. Univ. Phys. 2011, 66, 184–189. [Google Scholar] [CrossRef]
- Cabrera, S.E.; Gehring, T.; Denk, F.; Jin, Q.; Dycke, J.; Renschler, M.; Hiller, M.; Lemmer, U.; Kling, R. SiC-Based Resonant Converters with ZVS Operated in MHz Range Driving Rapidly Variable Loads: Inductively Coupled Plasmas as a Case of Study. IEEE Trans. Power Electron. 2022, 37, 7775. [Google Scholar] [CrossRef]
- COMSOL Plasma Module User’s Guide. Available online: https://doc.comsol.com/5.3/doc/com.comsol.help.plasma/PlasmaModuleUsersGuide.pdf (accessed on 5 August 2022).
- Das, S.; Das, D.-P.; Sarangi, C.-K.; Bhoi, B.; Mishra, B.K.; Ghosh, J. Optical Emission Spectroscopy Study of Ar–H2 Plasma at Atmospheric Pressure. IEEE Trans. Plasma Sci. 2018, 46, 2909. [Google Scholar] [CrossRef]
- Mao, P.; Liu, C.; Li, X.; Liu, M.; Chen, Q.; Han, M.; Maier, S.A.; Sargent, E.H.; Zhang, S. Single-step-fabricated disordered metasurfaces for enhanced light extraction from LEDs. Light Sci. Appl. 2021, 10, 180. [Google Scholar] [CrossRef]
- Iordanova, S.; Koleva, I.; Pauska, T. Hydrogen Degree of Dissociation in a low-pressure tandem plasma source. Spectrosc. Lett. 2011, 44, 8. [Google Scholar] [CrossRef]
- Mauer, G. How Hydrogen Admixture Changes Plasma Jet Characteristics in Spray Processes at Low Pressure. Plasma Chem. Plasma Process 2021, 41, 109. [Google Scholar] [CrossRef]
- Biagi Database. Available online: www.lxcat.net/Biagi (accessed on 22 August 2022).
- TRINITI Database. Available online: www.lxcat.net/TRINITI (accessed on 22 August 2022).
- NGFSRDW Database. Available online: www.lxcat.net/NGFSRDW (accessed on 22 August 2022).
- IST-Lisbon Database. Available online: www.lxcat.net/IST-Lisbon (accessed on 22 August 2022).
- Jelenak, Z.M.; Velikić, Z.B.; Božin, J.V.; Petrović, Z.L.; Jelenković, B.M. Electronic excitation of the 750- and 811-nm lines of argon. Phys. Rev. E 1993, 47, 3566. [Google Scholar] [CrossRef] [PubMed]
- Clarenbach, B.; Lorenz, B.; Krämer, M.; Sadeghi, N. Time-dependent gas density and temperature measurements in pulsed helicon discharges in argon. Plasma Sources Sci. Technol. 2003, 12, 345. [Google Scholar] [CrossRef]
- NIST Database. Available online: www.physics.nist.gov (accessed on 22 August 2022).
- Krasnov, A.E.; Ryzhkova, D.Y.; Vagin, V.A. Methodology for identifying gaseous constituents of the atmosphere. J. Phys. Conf. Ser. 2021, 2091, 012015. [Google Scholar] [CrossRef]
- Gordillo-Vázquez, F.J.; Camero, M.; Gómez-Aleixandre, C. Spectroscopic measurements of the electron temperature in low pressure radiofrequency Ar/H2/C2H2 and Ar/H2/CH4 plasmas used for the synthesis of nanocarbon structures. Plasma Sources Sci. Technol. 2006, 15, 42. [Google Scholar] [CrossRef]
- Yang, W.; Gao, F.; Wang, Y. Conductivity effects during the transition from collisionless to collisional regimes in cylindrical inductively coupled plasmas. Plasma Sci. Technol. 2022, 24, 055401. [Google Scholar] [CrossRef]
- Hamann, S.; Rond, C.; Pipa, A.V.; Warte, M.; Lombardi, G.; Gicquel, A.; Röpcke, J. Spectroscopic study of H2 microwave plasmas with small admixtures of CH4 and B2H6 used for doped diamond deposition. Plasma Sources Sci. Technol. 2014, 23, 045015. [Google Scholar] [CrossRef]
- Fiebrandt, M.; Oberberg, M.; Awakowicz, P. Comparison of Langmuir probe and multipole resonance probe measurements in argon, hydrogen, nitrogen, and oxygen mixtures in a double ICP discharge. J. App. Phys. 2017, 122, 013302. [Google Scholar] [CrossRef]


Disclaimer/Publisher’s Note: The statements, opinions and data contained in all publications are solely those of the individual author(s) and contributor(s) and not of MDPI and/or the editor(s). MDPI and/or the editor(s) disclaim responsibility for any injury to people or property resulting from any ideas, methods, instructions or products referred to in the content. |
© 2023 by the authors. Licensee MDPI, Basel, Switzerland. This article is an open access article distributed under the terms and conditions of the Creative Commons Attribution (CC BY) license (https://creativecommons.org/licenses/by/4.0/).