Abstract
Thermal barrier coatings (TBCs) have been seriously threatened by calcium-magnesium-alumina-silicate (CMAS) corrosion. The search for novel ceramic coatings for TBCs with excellent resistance to CMAS corrosion is ongoing. Herein, CMAS corrosion resistance behavior and the mechanism of a promising Hf6Ta2O17 ceramic coating for TBCs are investigated. The results show that temperature is the most important factor affecting the CMAS behavior and mechanism. At 1250 °C, the corrosion products are composed of dense reaction products (HfSiO4, CaXHf6−xTa2O17−x) and CMAS self-crystallization products. At 1300 and 1400 °C, the corrosion products are mainly dense CaTa2O6 and HfO2, which prevent further CMAS infiltration.
1. Introduction
Thermal barrier coatings (TBCs) can effectively protect hot components in high temperature environments, and improve gas thermal efficiency and engine service lifetime [1,2,3]. 7–8 wt.% Y2O3 partially stabilized ZrO2 (8YSZ) is extensively used as a top ceramic coating in TBCs. However, erosion, sintering, oxidation and calcium-magnesium-alumina-silicate (CMAS) corrosion are the main failure factors of TBCs in high- temperature service environments. As the service temperature increases, CMAS corrosion becomes the most dangerous factor in spallation of the top ceramic coating [4,5,6]. On the one hand, the molten CMAS permeates into the pores and microcracks of the 8YSZ coating, leading to the degradation of the thermal-mechanical properties of the coating [7,8]. On the other hand, Y2O3 in 8YSZ dissolves in the molten CMAS through thermal-chemical reaction, which induces a phase transition of 8YSZ. This destroys the structural integrity and leads to coating failure [9,10]. Hence, it is significant to seek novel ceramic coatings for TBCs with excellent resistance to CMAS corrosion.
Recently, many studies have been conducted on the promising CMAS-resistant TBCs, such as RE2Zr2O7, RETaO4, REPO4 (RE = rare earth elements), Ti2AlC, LaTi2Al9O19 and rare-earth-doped zirconia [11,12,13,14,15,16]. These new ceramic materials show different corrosion behaviors and mechanisms. For LaTi2Al9O19 ceramics, Ca and Si elements in CMAS are consumed effectively to form CaAl2Si2O8 and (Ca,La0.7)(Ti,Al)O3, which prevent CMAS from further infiltration [14]. The corrosion mechanism the changing of the composition of molten CMAS and generating self-crystallization products that prevent the CMAS infiltration. For RETaO4 and RE2Zr2O7 ceramics, YbTaO4 reacts with CMAS to form Ca2Ta2O7 [12], and La2(Zr0.7Ce0.3)2O7 reacts with CMAS to precipitate apatite phase (La,Ca)4(La, Ce)6(SiO4)6O2 and fluorite ZrO2 [17]. The corrosion mechanism is that the ceramic material reacts with molten CMAS to form a dense product layer, inhibiting further CMAS infiltration. These new ceramic materials possess outstanding CMAS corrosion resistance. However, they still cannot replace the traditional 8YSZ TBCs due to their mismatched thermal expansion coefficients [18] and insufficient comprehensive performance of thermal and mechanical properties [19,20]. Hf6Ta2O17 ceramic material with A6B2O17 (A = Hf, Zr, B = Ta, Nb) superstructure crystal can solve the above problems effectively [21,22]. Hf6Ta2O17 ceramic has a sufficiently large synthesis range, superior phase stability and excellent thermal properties [23,24,25]. Furthermore, Hf6Ta2O17 ceramic shows excellent mechanical properties, with hardness of 18.45 GPa and fracture toughness of 2.6~3.1 MPa m1/2 at room temperature [26]. The comprehensive properties of Hf6Ta2O17 ceramic are excellent, but there is a lack of systematic in-depth study on the CMAS corrosion resistance behavior and mechanism of a potential Hf6Ta2O17 ceramic for TBCs.
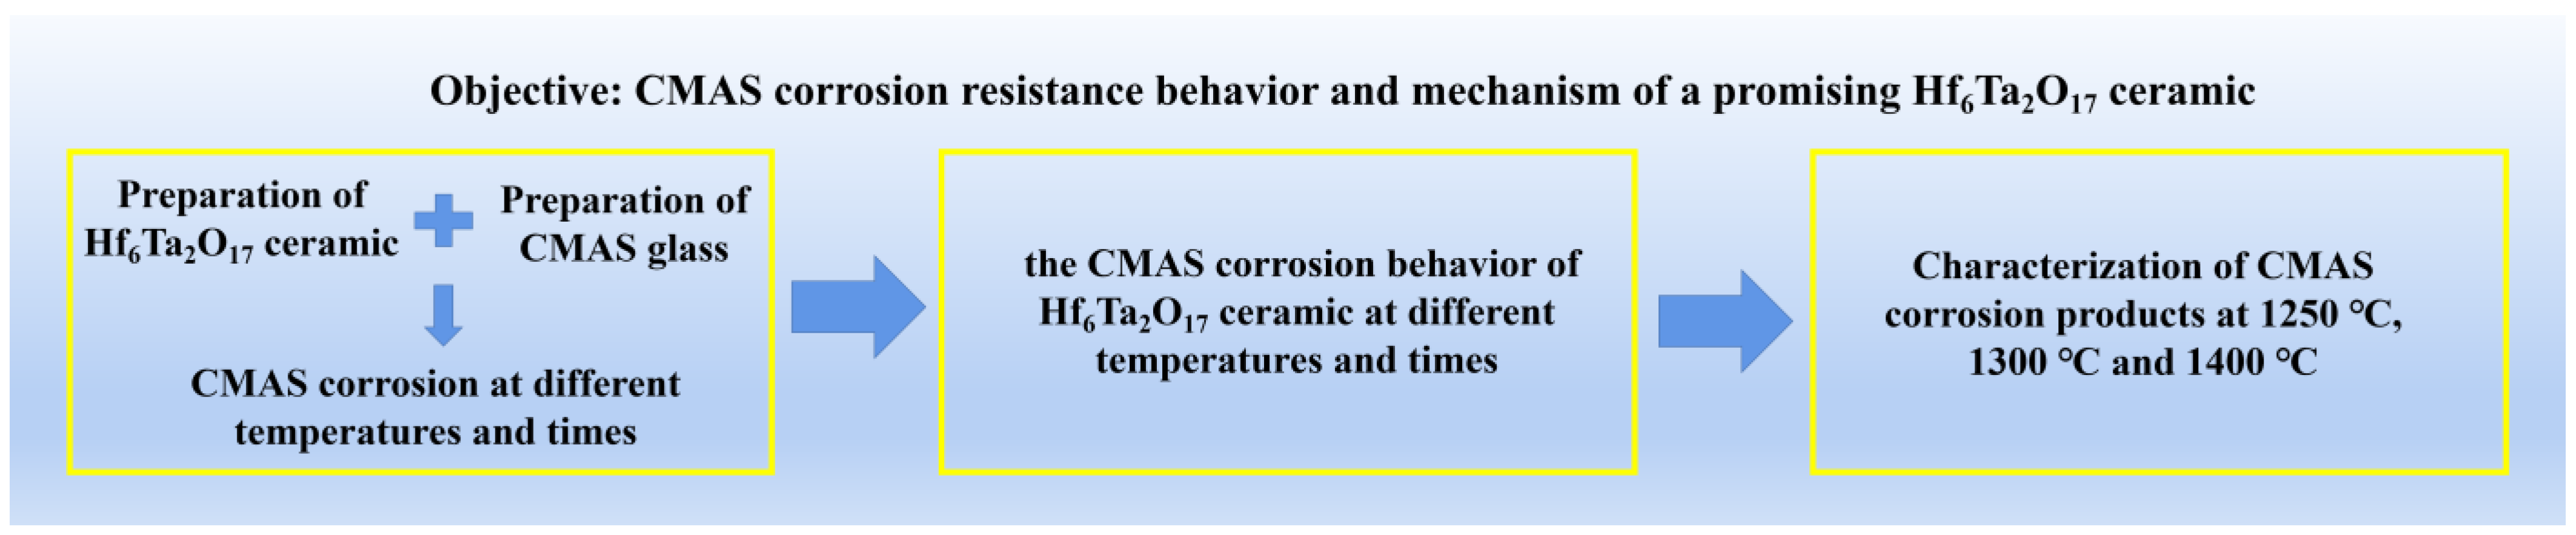
In this paper, Hf6Ta2O17 ceramic is prepared by a solid reaction method, and the Hf6Ta2O17 ceramic is subjected to CMAS corrosion at 1250, 1300 and 1400 °C for 4, 16, 50 and 100 h each. The corrosion behavior is investigated and the effects of temperature and time on CMAS corrosion resistance of the Hf6Ta2O17 ceramic are discussed. The research plan is shown in Figure 1.

Figure 1.
Schematic flowchart showing research plan.
2. Experimental Procedure
HfO2 (purity > 99.99%) and Ta2O5 (purity > 99.99%) were selected as the starting materials (both oxides were purchased from China New Metal Materials Technology Co., Ltd., Bejing, China). The powders were weighted in a stoichiometric ratio of 85.71 mol% HfO2–14.29 mol% Ta2O5 and then mixed with ethanol by a planetary ball mill for 8 h. After drying the slurries at 80 °C for 12 h, the mixed powders were reacted at 1600 °C for 20 h to obtain Hf6Ta2O17 powder. The chemical reaction equation is presented as follows:
Finally, the Hf6Ta2O17 powders were sieved with 500-mesh screen, and subsequently uniaxially cold compacted into pellets (φ = 10 mm) under a pressure of 200 MPa. The Hf6Ta2O17 ceramic was obtained by sintering the pellets at 1600 °C for 20 h. Based on CMAS coated on vane blades in a real service environment, the CMAS composition of 33 mol% CaO–9 mol% MgO–13 mol%–Al2O3–45 mol% SiO2 was determined, whose melting point is about 1235 °C [27,28]. The oxide powders were weighed and mixed in the planetary ball mill in these proportions. After drying, CMAS glass was synthesized by heat treating at 1300 °C for 4 h, then ground to get fine CMAS powder.
Before the CMAS corrosion test, the Hf6Ta2O17 ceramic was ground, polished and ultrasonically cleaned. According to the surface area of the prepared ceramic pellets, an appropriate amount of CMAS powder was weighed with an analytical balance. To evenly coat the Hf6Ta2O17 ceramic surface, the CMAS powder was mixed with absolute alcohol to create a pasty, viscous liquid. After drying at 80 °C, the coated CMAS amount was kept at 10 ± 1 mg/cm2. Then, samples of the CMAS-covered ceramics were heat treated at 1250, 1300 and 1400 °C, with a ramping rate of 10 °C/min for both heating and cooling, in a muffle furnace for 4, 16, 50 and 100 h each. Three samples were put into the furnace for comparison in each test. Finally, the corroded ceramics were cut through the middle with a cutting machine to obtain the cross section.
The phase structures of the Hf6Ta2O17 ceramic and corrosion products were detected by X-ray diffractometry (XRD, Ultimate IV, RIGAKU, Tokyo, Japan) with CuKα radiation at a scanning rate of 4°/min and scanning range of 10~90°. The microstructure and composition of the specimens were measured by scanning electron microscope (SEM, TESCAN MIRA3 LMH, Brno, Czech Republic), energy dispersive spectroscopy (EDS, X MAX20, Oxford Instruments, Oxford, UK) and transmission electron microscopy (TEM, JEM-2100, JEOL Ltd., Tokyo, Japan). Image J software (1.51 23) was used for image analysis, and the infiltration depth was measured by cross-sectional backscattered electron (BSE) image after corrosion. Five different cross-sectional BSE images were taken, with each image taking five depth measurements. Finally, the average value was taken to obtain the infiltration depth.
3. Results
3.1. Characterization of Hf6Ta2O17 Ceramic
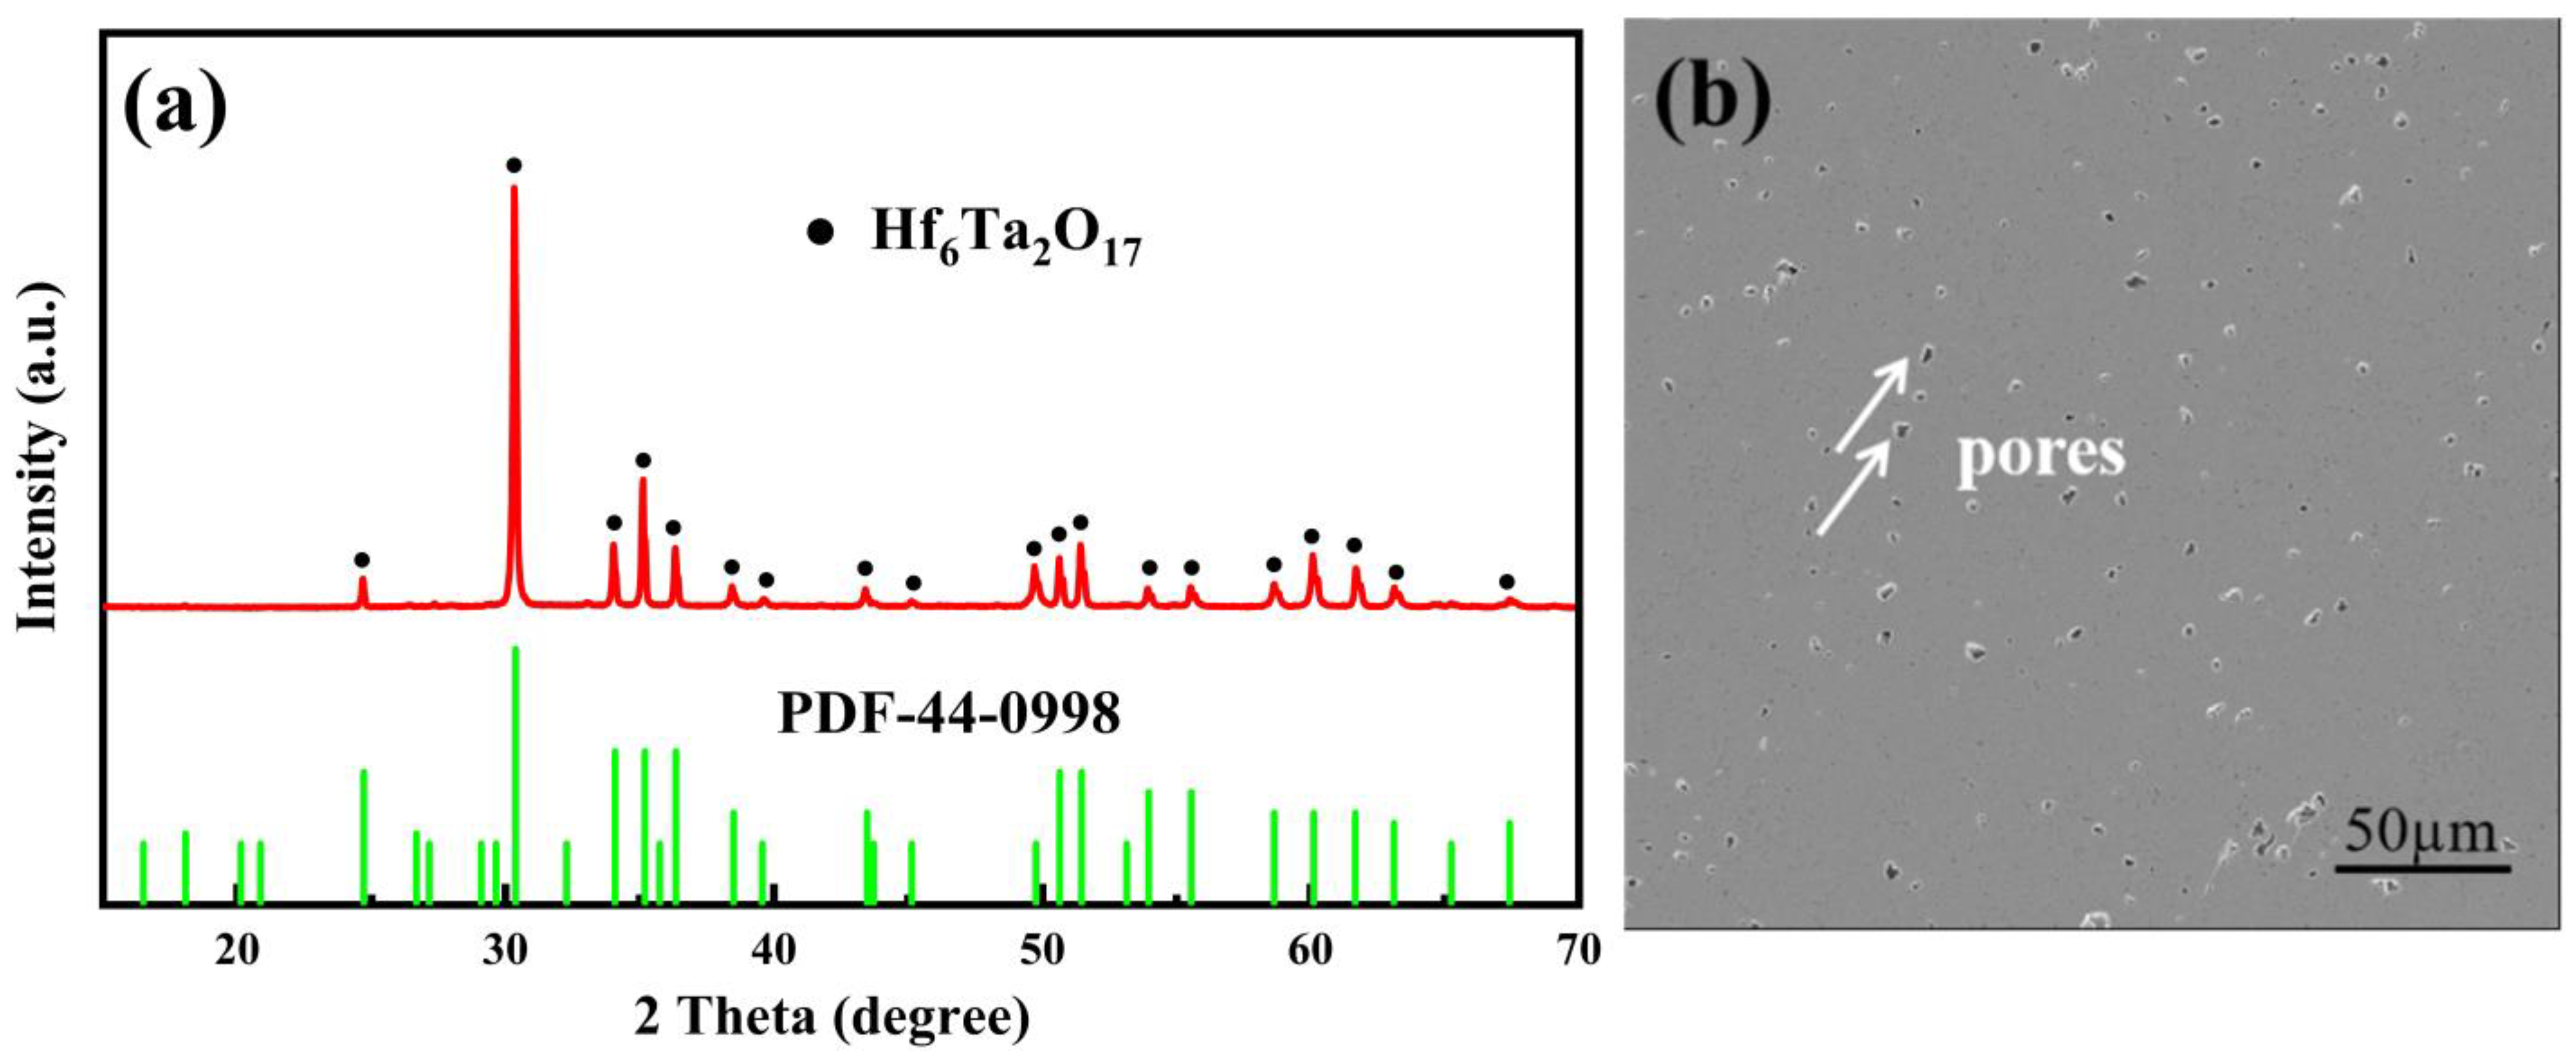
Figure 2 shows the XRD pattern and SEM image of the surface of Hf6Ta2O17 ceramic. The characteristic peak is a pure structure of orthorhombic Hf6Ta2O17 phase, and no diffraction peaks of HfO2 or Ta2O5 phase are detected. The Hf6Ta2O17 ceramic has a dense microstructure (with porosity below 15%), and no obvious compositional contrast appears, which implies that no possible component segregation occurs.

Figure 2.
(a) XRD patterns of as-sintered Hf6Ta2O17 ceramic; (b) surface morphology of Hf6Ta2O17 ceramic.
3.2. Microstructure Characterization of Hf6Ta2O17 Ceramic after CMAS Corrosion
3.2.1. Surface Morphology of Hf6Ta2O17 Ceramic after CMAS Corrosion
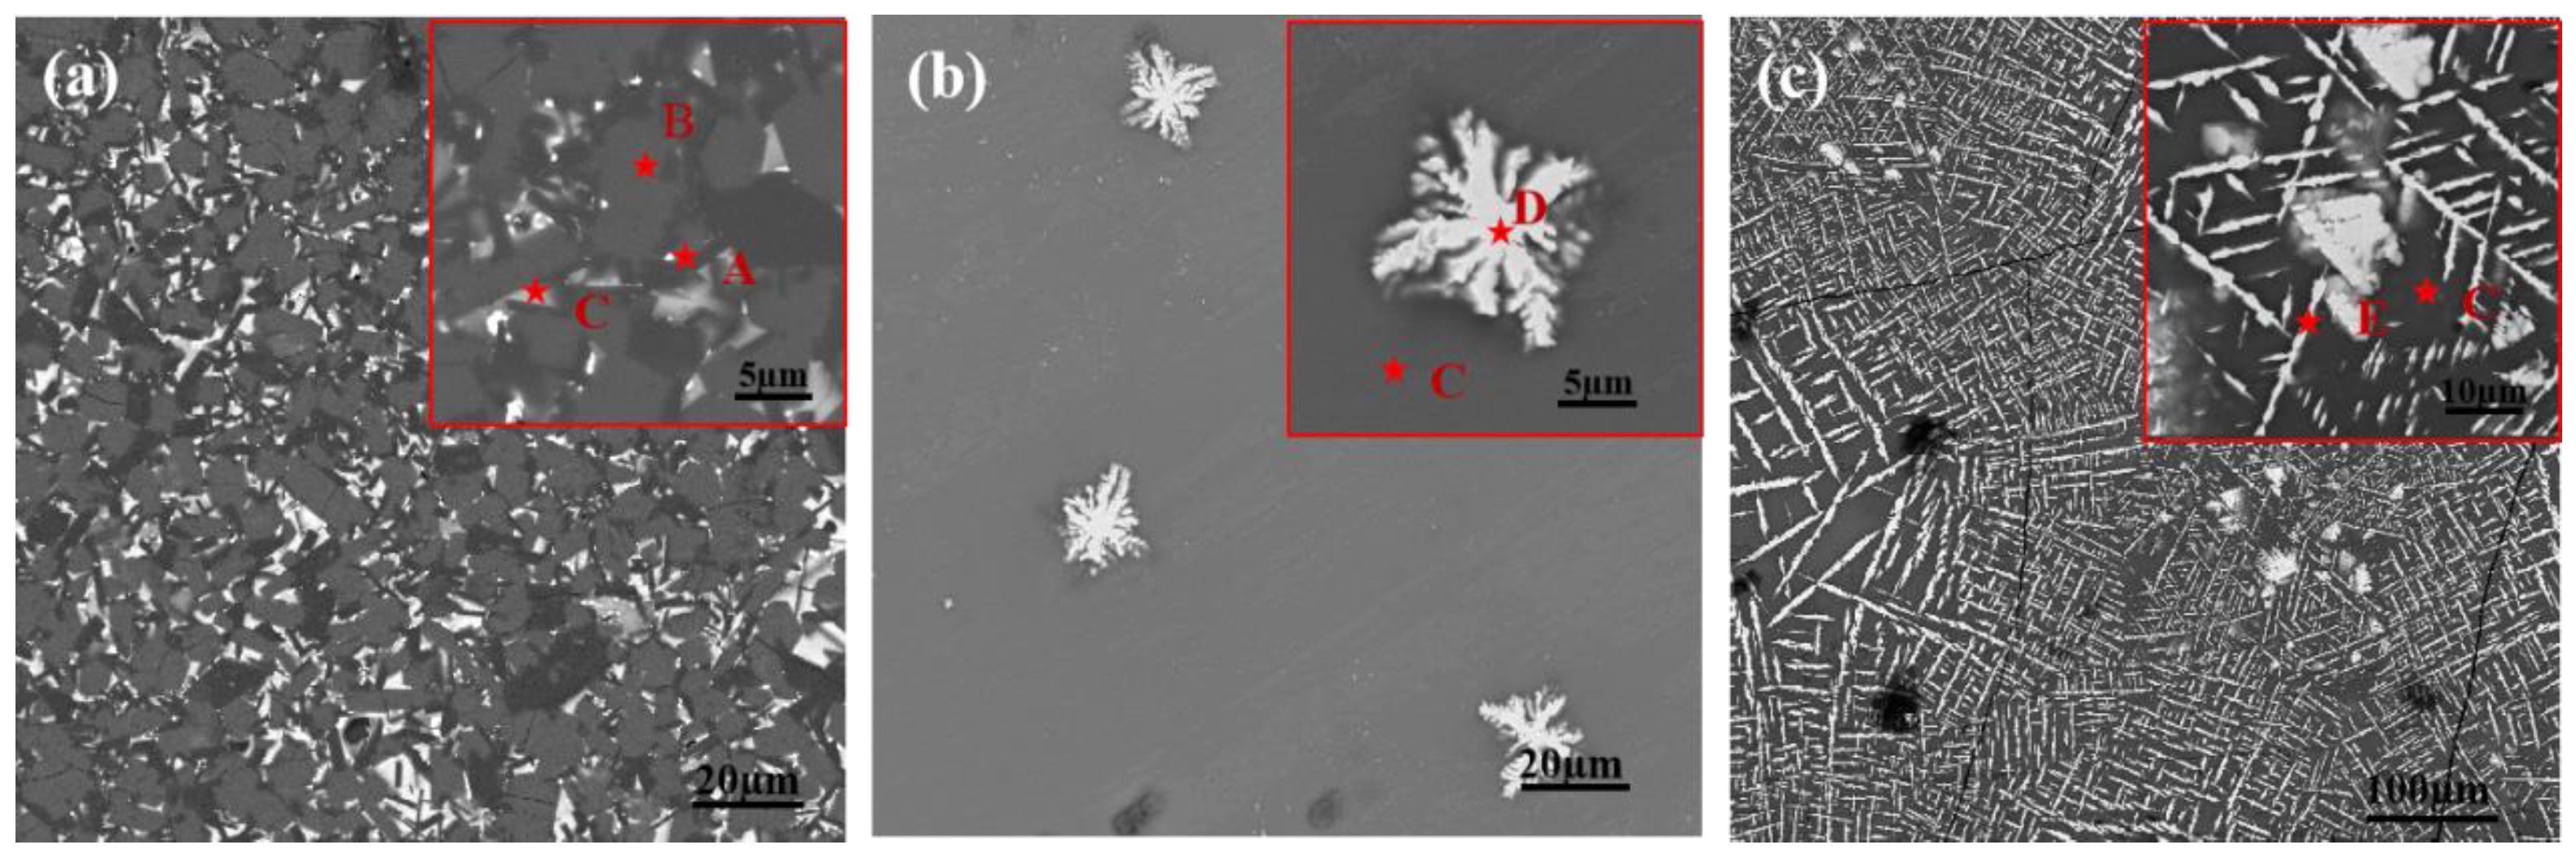
The surface morphology of Hf6Ta2O17 ceramic after CMAS corrosion is shown in Figure 3. At the corrosion temperature of 1250 °C, there is a black strip phase (A) and a gray bulk phase (B), in addition to residual CMAS melt (C). The elemental composition of the marked areas is listed in Table 1. A is anorthite phase (CaAl2Si2O8) and B is wollastonite phase (CaSiO3), both of which are self-crystallization products of molten CMAS [29]. As the corrosion temperature elevates to 1300 °C, the specimen surface is mainly composed of residual CMAS (C) and a little white snowflake phase (D) that is rich in Ca, Hf and Ta elements. The corrosion results at 1400 °C reveal that a large amount of white dendritic phase (E) appears on the specimen surface. The composition of the white dendritic phase (E) is similar to that of D, which is rich in Ca, Hf and Ta elements, but the Ta content is significantly higher than that of D. The corrosion results indicate that the corrosion products and corrosion phenomena of Hf6Ta2O17 ceramic are obviously different at different corrosion temperatures.
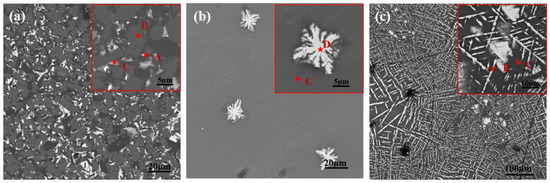
Figure 3.
BSE images of the surface of Hf6Ta2O17 ceramic after CMAS corrosion: (a) at 1250 °C for 8 h; (b) at 1300 °C for 16 h; (c) at 1400 °C for 16 h. The inset figures present high-magnification images of the surface.

Table 1.
Chemical compositions of the marked regions in Figure 3.
3.2.2. Cross-Sectional Morphology of Hf6Ta2O17 Ceramic after CMAS Corrosion
Figure 4 shows the cross-sectional morphology of Hf6Ta2O17 ceramic attacked by CMAS at different temperatures and times. The cross section is obviously stratified into a residual CMAS layer, reaction layer, dense layer and ceramic layer. The corrosion behavior of Hf6Ta2O17 ceramic at three temperatures is dramatically distinctive. At 1250 °C, when the corrosion time is short (<100 h), the infiltration depth of molten CMAS is very shallow (Figure 4a–d), and the thickness of the reaction layer is in the range of 3.3~15.2 µm. After 100 h, an obvious dense layer with a thickness of 22.2 μm appears below the reaction layer (Figure 4d). At 1300 °C for 4 h, the reaction products are similar to those at 1250 °C, but a new phase structure begins to precipitate (Figure 4e), which is analyzed in detail in Section 3.3.2. When the corrosion time increases to 16 h, the morphology of the reaction product changes dramatically, and CMAS infiltration depth increases to 34.1 μm (Figure 4f). Furthermore, the thickness of the reaction layer increases slowly with time, ranging from 17.8 to 27.9 μm, but the dense layer keeps thickening, increasing from 16.3 to 125.1 μm (Figure 4f–h). The corrosion phenomenon at 1400 °C is similar to that at 1300 °C (Figure 4j–l). At the initial stage of corrosion, a thick reaction layer with a thickness of 83.3 μm is generated, while the dense layer is extremely thin (~20.6 μm). With the increase in corrosion time from 4 h to 100 h, the thickness of the reaction layer is basically stable, increasing by only about 10 μm. The dense layer also becomes thicker, increasing from 20.6 to 86.6 μm.
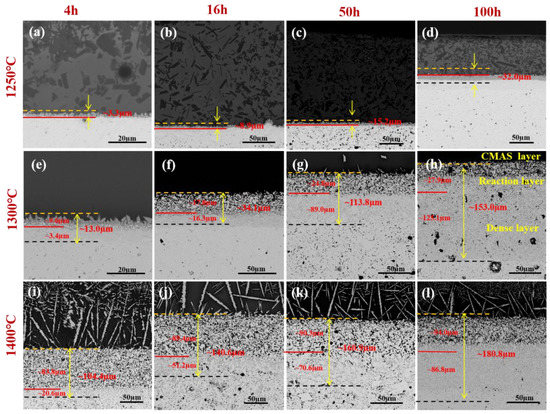
Figure 4.
Cross-sectional BSE images of Hf6Ta2O17 ceramic after CMAS corrosion: (a) at 1250 °C for 4 h; (b) at 1250 °C for 16 h; (c) at 1250 °C for 50 h; (d) at 1250 °C for 100 h; (e) at 1300 °C for 4 h; (f) at 1300 °C for 16 h; (g) at 1300 °C for 50 h; (h) at 1300 °C for 100 h; (i) at 1400 °C for 4 h; (j) at 1400 °C for 16 h; (k) at 1400 °C for 50 h; (l) at 1400 °C for 100 h. The CMAS infiltration depth is measured from the initial specimen surface (yellow dash lines) to the infiltration front (black dash lines).
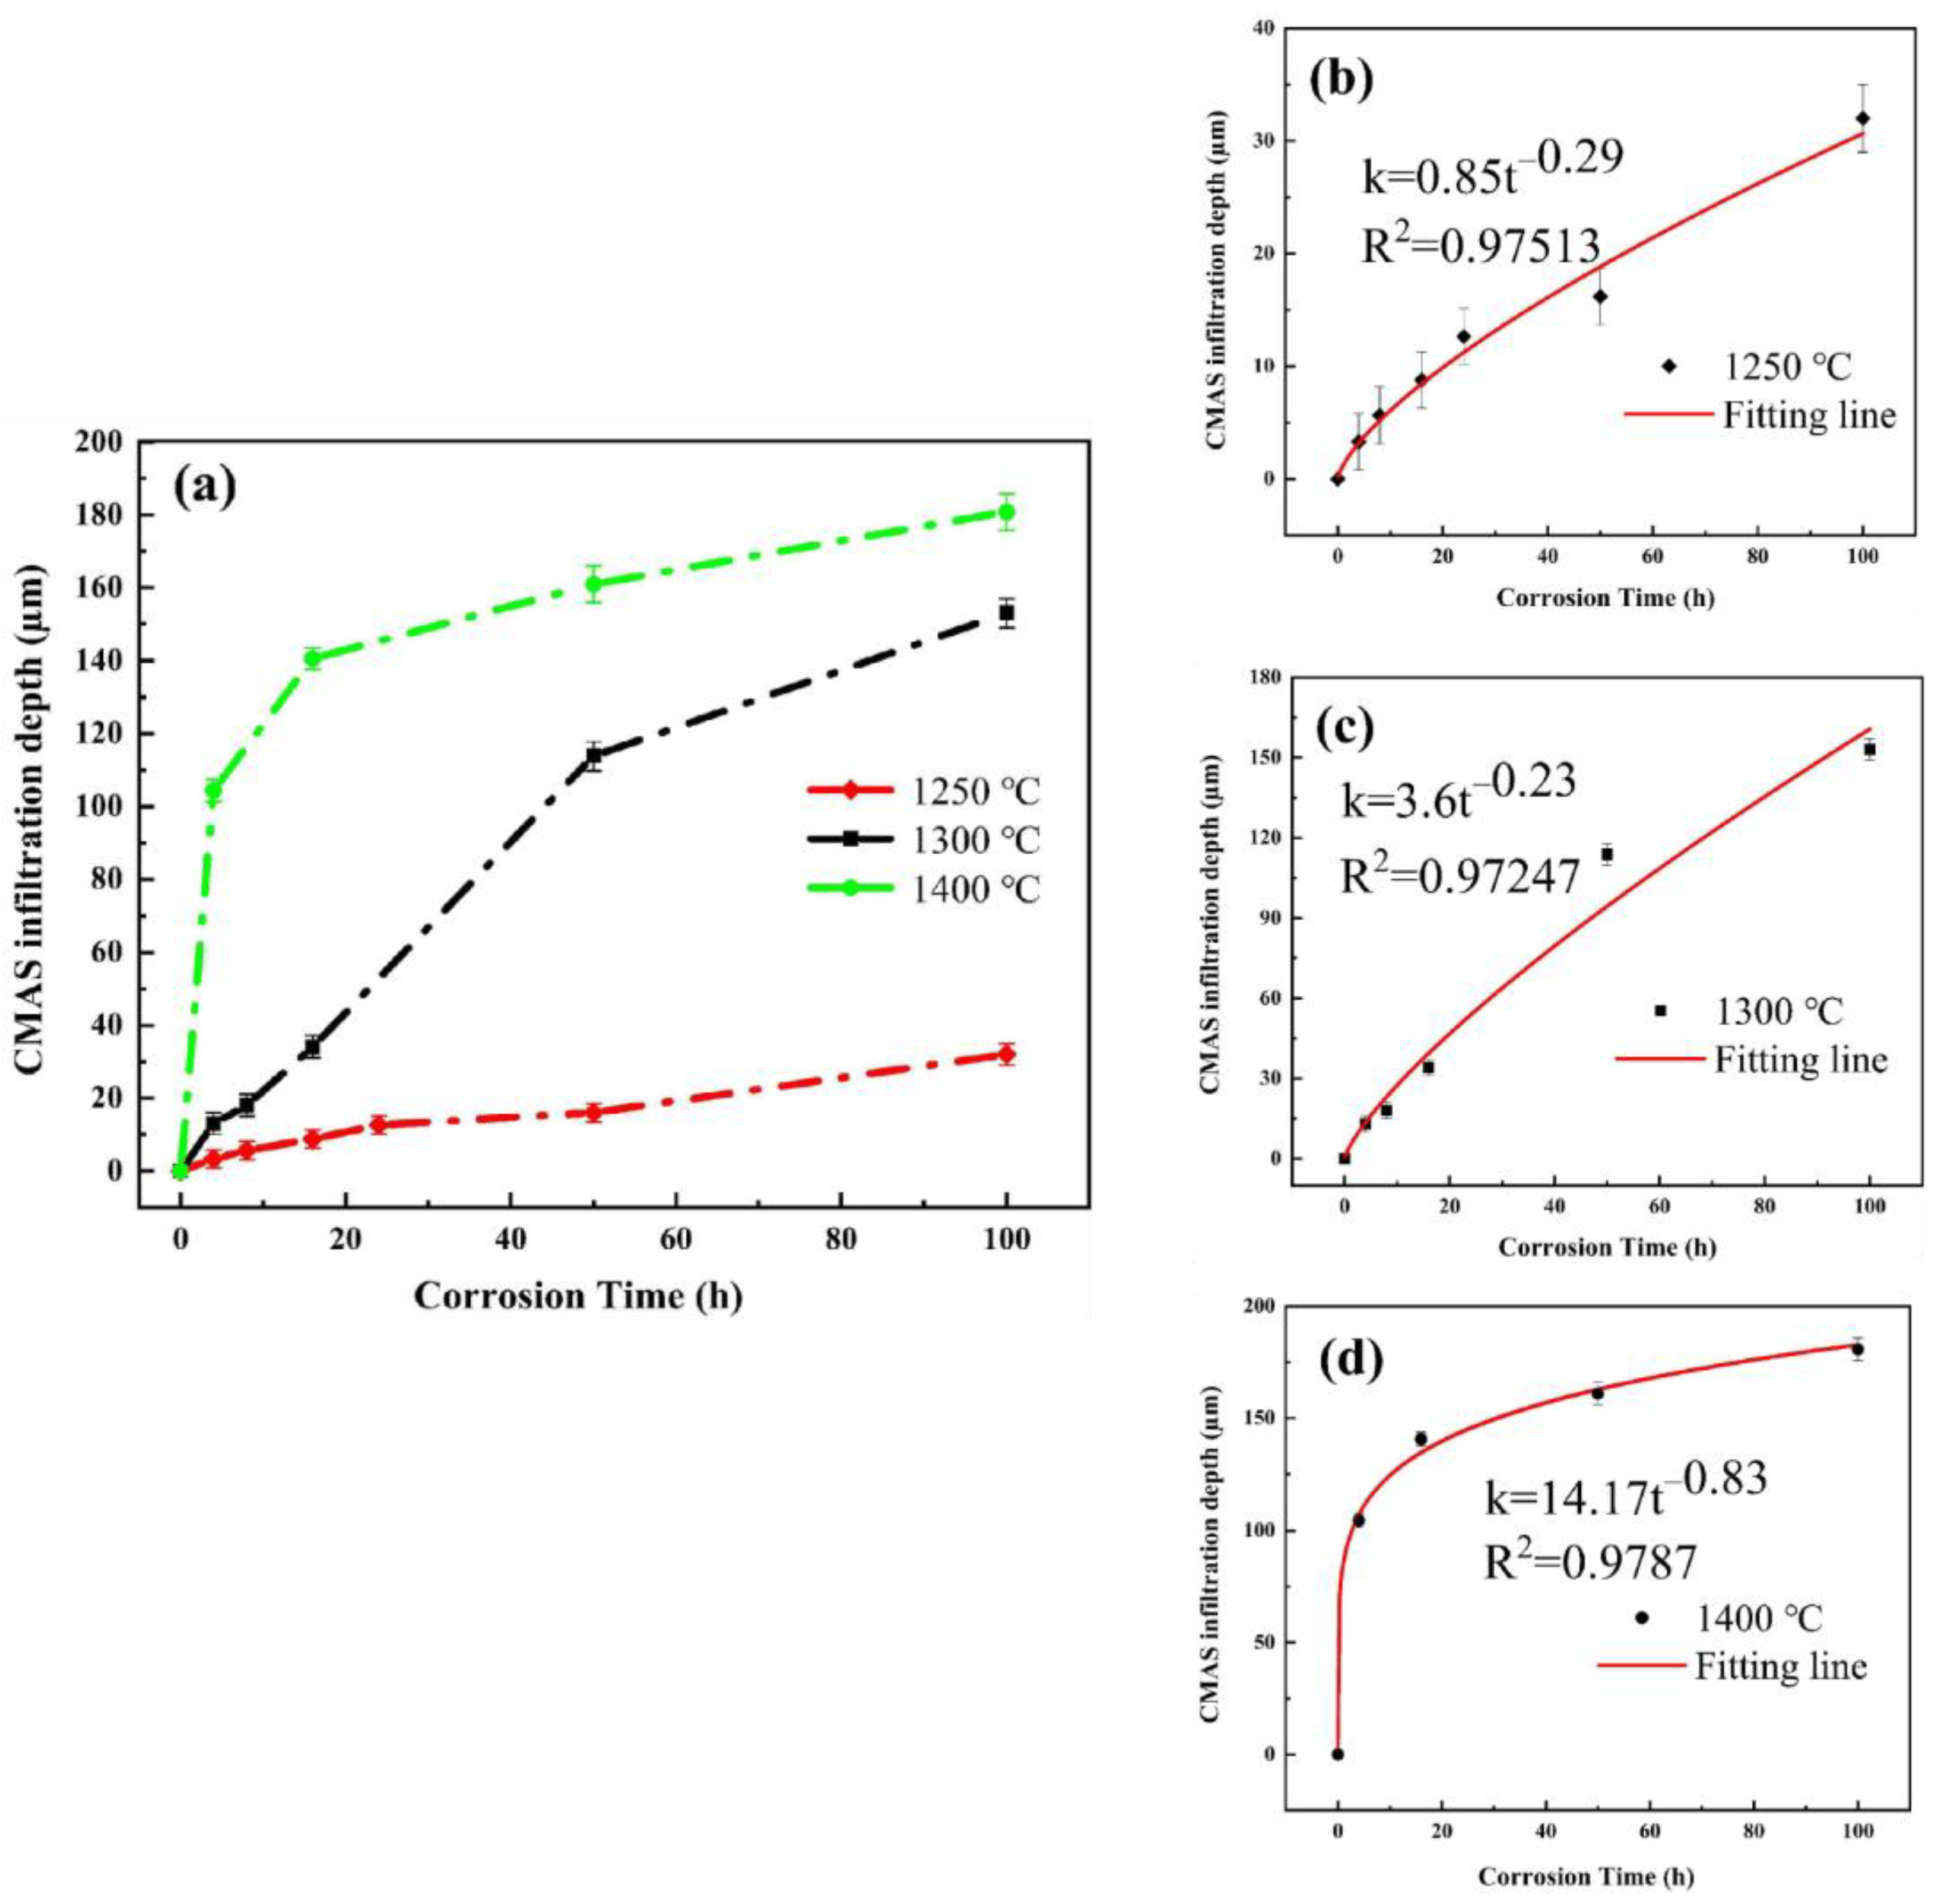
The evolution of CMAS infiltration depth with corrosion time of Hf6Ta2O17 ceramic at three temperatures is shown in Figure 5. After CMAS corrosion for 100 h, the CMAS infiltration depths at 1250, 1300 and 1400 °C are 32.3, 153 and 180.8 µm, respectively. Hf6Ta2O17 ceramic shows a lower infiltration depth (32.3 µm) at 1250 °C. At 1300 and 1400 °C, the infiltration depth of Hf6Ta2O17 ceramic increases significantly. After fitting the experimental data, the infiltration rate k at the three temperatures can be quantified in the form of a µm·tn, where a and n are constants and t is time. At 1250, 1300 and 1400 °C, the infiltration rates of Hf6Ta2O17 ceramic are 0.85 µm·t−0.29, 3.6 µm·t−0.23 and 14.17 µm·t−0.83, respectively. The parameter a increases significantly with increasing temperature, and the difference between n at 1250 and 1300 °C is not significant, while a notable decrease occurs at 1400 °C. This indicates that the infiltration rate at 1300 °C is significantly greater than that at 1250 °C. The infiltration rate also appears to increase at 1400 °C, while the enhancement is much greater than that at 1300 °C. The CMAS infiltration depth reaches 104.4 µm after corrosion for 4 h at 1400 °C, indicating that temperature is the most sensitive factor influencing the CMAS corrosion behavior of Hf6Ta2O17 ceramic. Furthermore, the infiltration depth increases with time, and the infiltration rate decreases with time. The relationship between CMAS infiltration depth and corrosion time basically follows a parabolic law, which is due to the formation and growth of the dense layer [30].
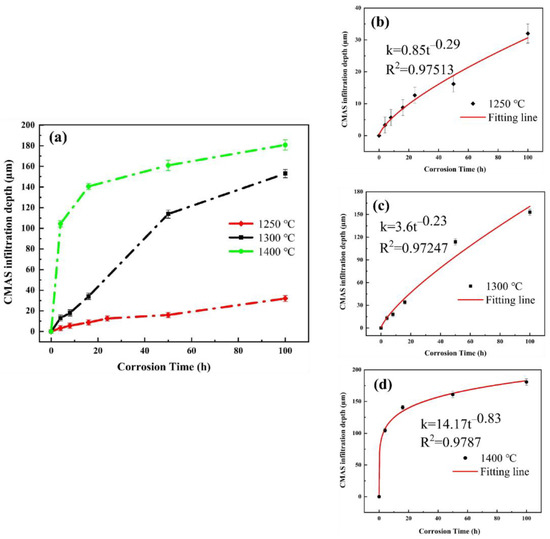
Figure 5.
(a) Evolution of CMAS infiltration depth with time in Hf6Ta2O17 ceramic at different temperatures; (b–d) Expanded view of infiltration depth with time in Hf6Ta2O17 ceramic at 1250, 1300 and 1400 °C, respectively. R2 represents the value of the matching factor.
3.3. Characterization of CMAS Corrosion Products of Hf6Ta2O17 Ceramic
3.3.1. Characterization of Corrosion Products at 1250 °C
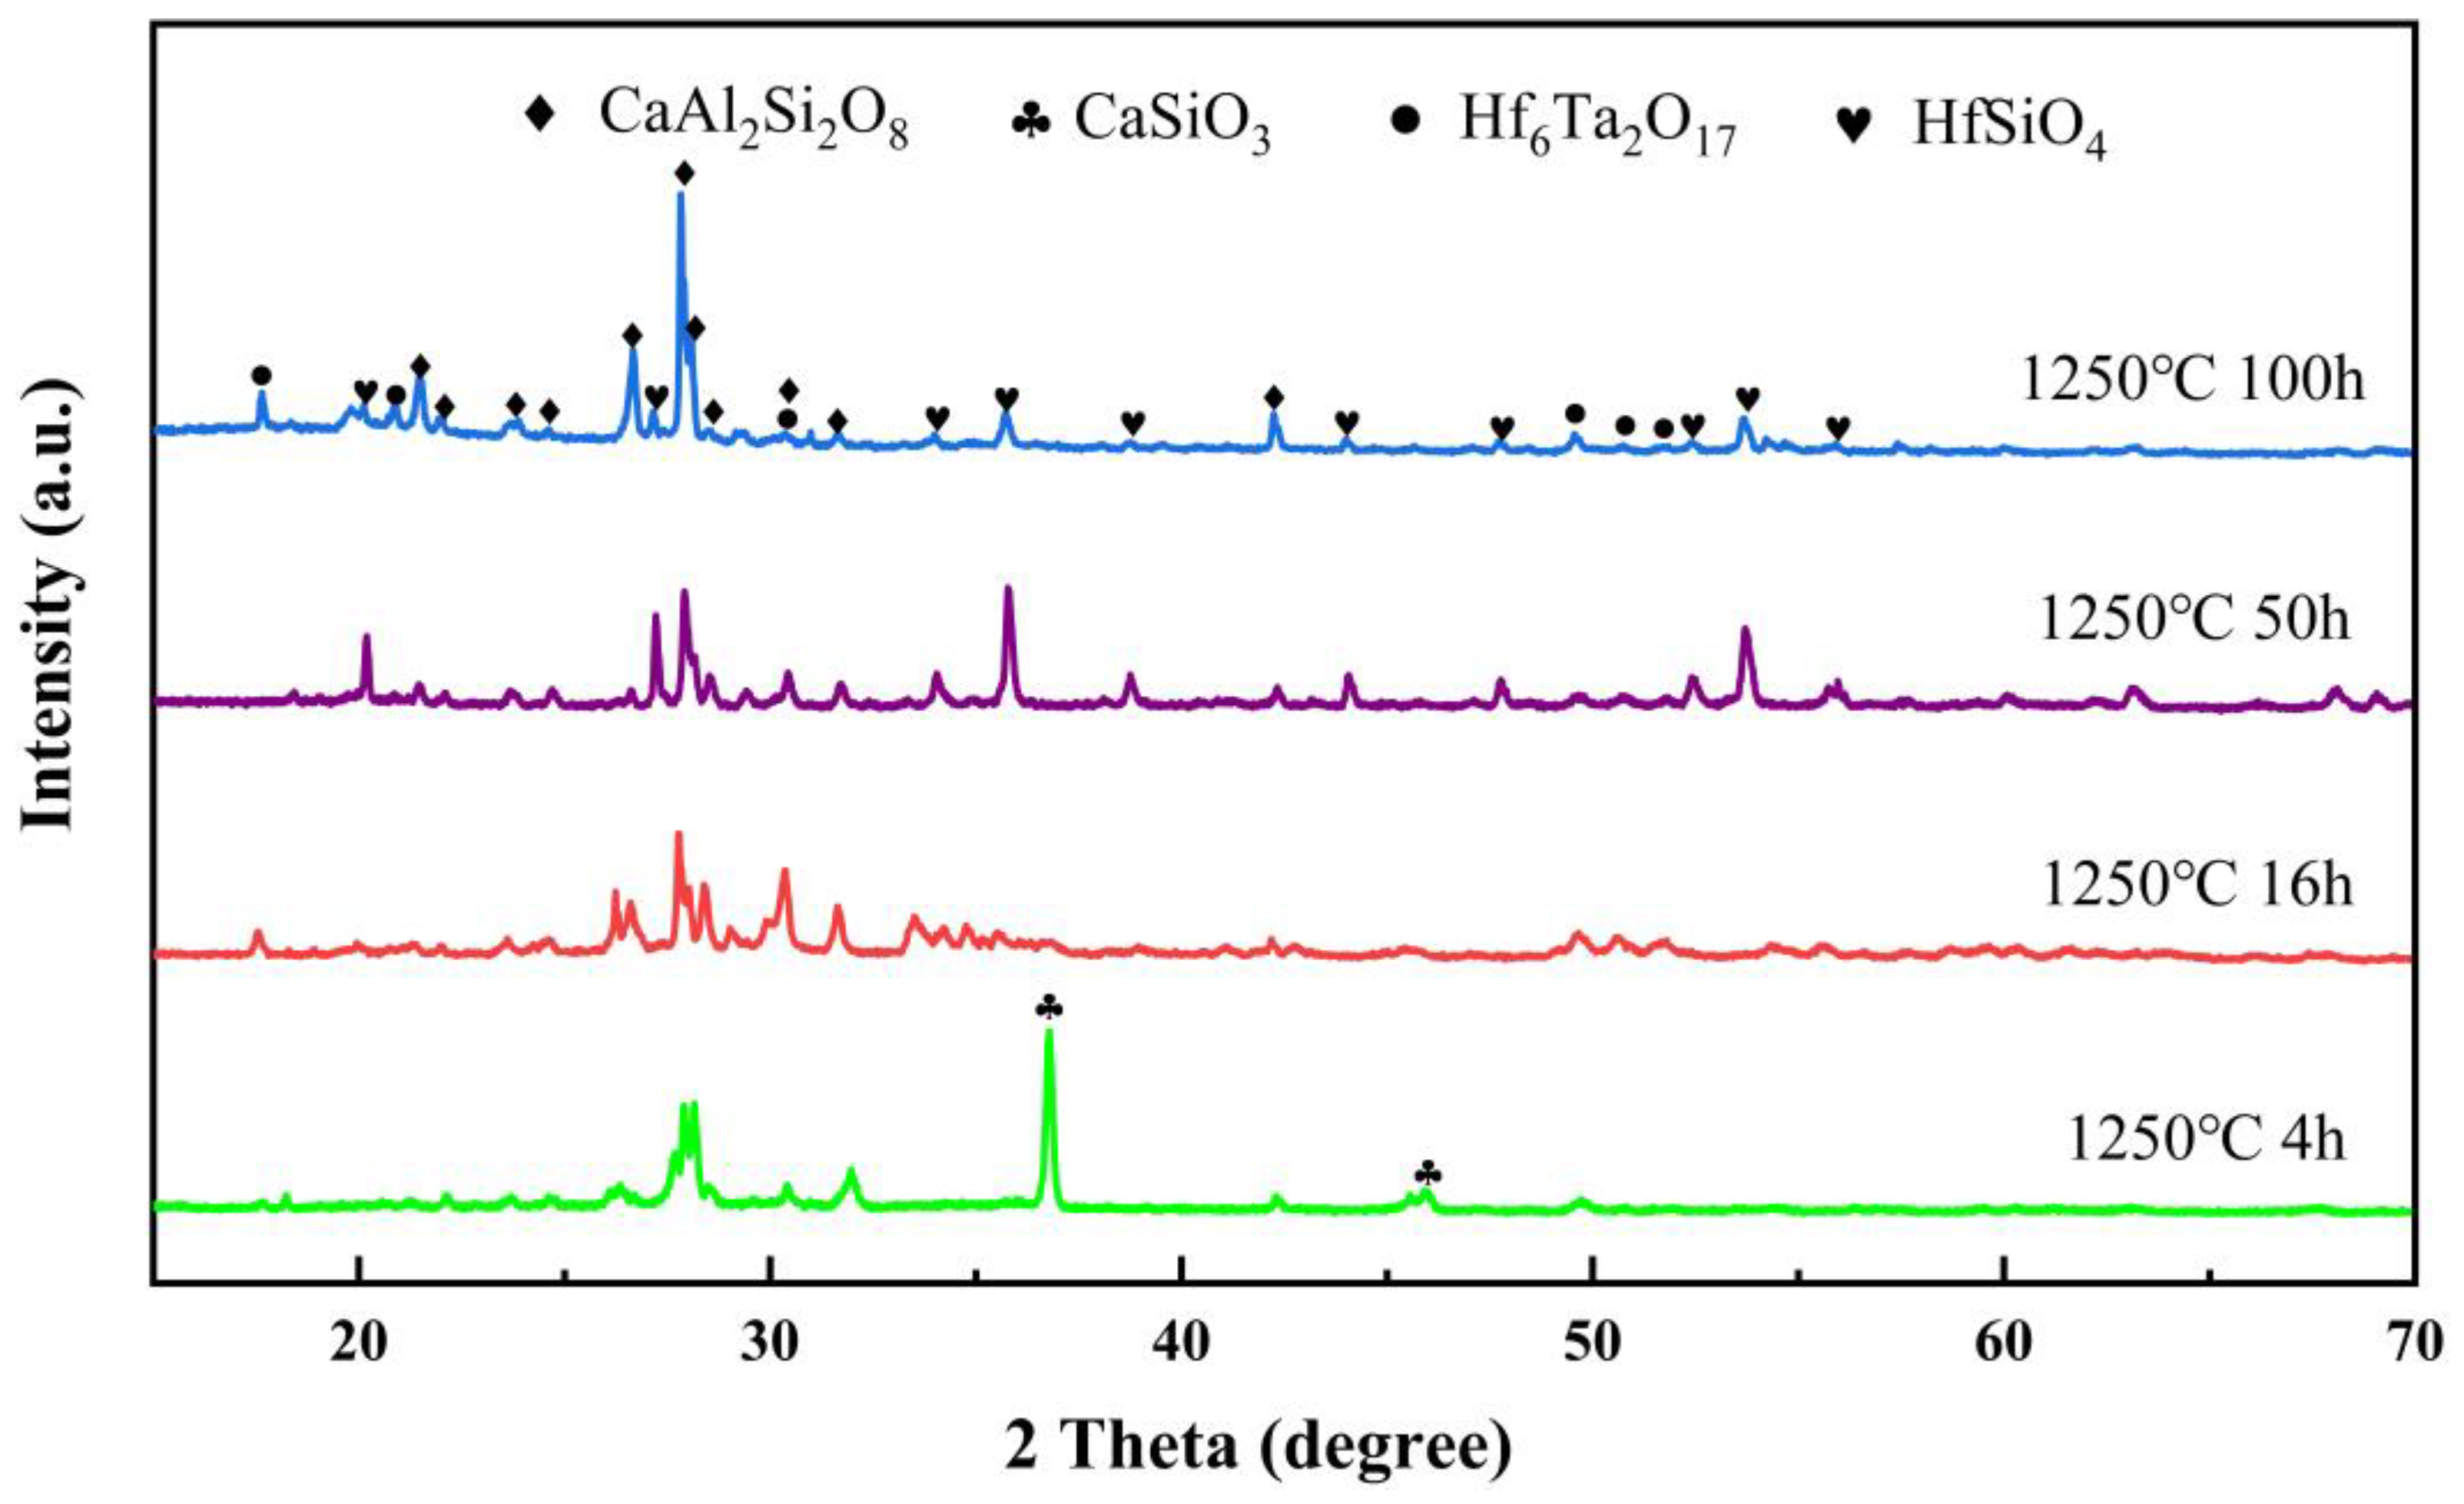
Figure 6 shows a cross-sectional image of Hf6Ta2O17 ceramic attacked by CMAS at 1250 °C for 4 h and its corresponding element mapping. There are two main types of products in the residual CMAS layer: A and B. The reaction layer is only 2~3 µm thick, made up of irregular lumps. At the same time, Ca element infiltrates into the ceramic layer, forming a thin dense layer. The element mapping results show that the segregation of Ca and Al appears in the residual CMAS layer, a small amount of Hf diffuses into the residual CMAS, and the content of Ta is extremely low. This is attributed to the fact that the Hf-O bond in Hf6Ta2O17 ceramic is longer than the Ta-O bond, which implies that Hf element more easily diffuses into the residual CMAS [21]. XRD patterns of Hf6Ta2O17 ceramic attacked by CMAS at 1250 °C for 4, 16, 50 and 100 h are shown in Figure 7. The characteristic peaks of the corrosion products are mainly CaAl2Si2O8 and CaSiO3 after corrosion for 4 h. However, the CaSiO3 phase disappears after corrosion for 16 h and the characteristic peak of HfSiO4 phase appears with time. The highest diffraction peaks of anorthite are detected under long-term corrosion. According to the XRD results and the EDS results in Table 2, it can be determined that the molten CMAS self-crystallizes into CaAl2Si2O8 (A) and CaSiO3 (B), the reaction layer consists of HfSiO4 (D), and the dense layer is composed of CaXHf6−xTa2O17−x (F) after corrosion for 4 h at 1250 °C. It is worth noting that there are no characteristic peaks of HfSiO4 phase after corrosion for a short time, because few HfSiO4 phases are formed under short-term corrosion and the residual CMAS is quite thick.
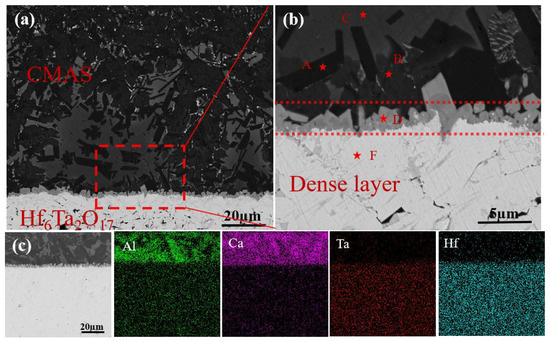
Figure 6.
(a,b) Cross-sectional BSE images of Hf6Ta2O17 ceramic after CMAS corrosion at 1250 °C for 4 h; (c) cross-sectional EDS mapping results of Hf6Ta2O17 ceramic corroded by CMAS.
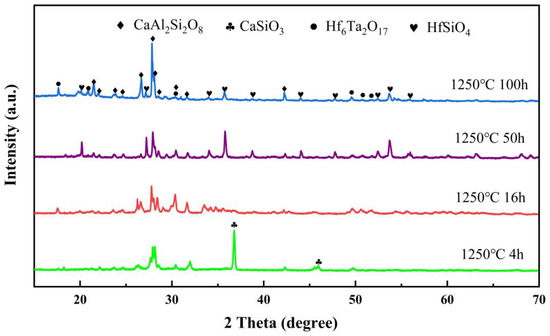
Figure 7.
XRD patterns of Hf6Ta2O17 ceramic corroded by CMAS at 1250 °C for 4 h, 16 h, 50 h and 100 h.
Table 2.
Chemical compositions of the marked regions in Figure 6b.
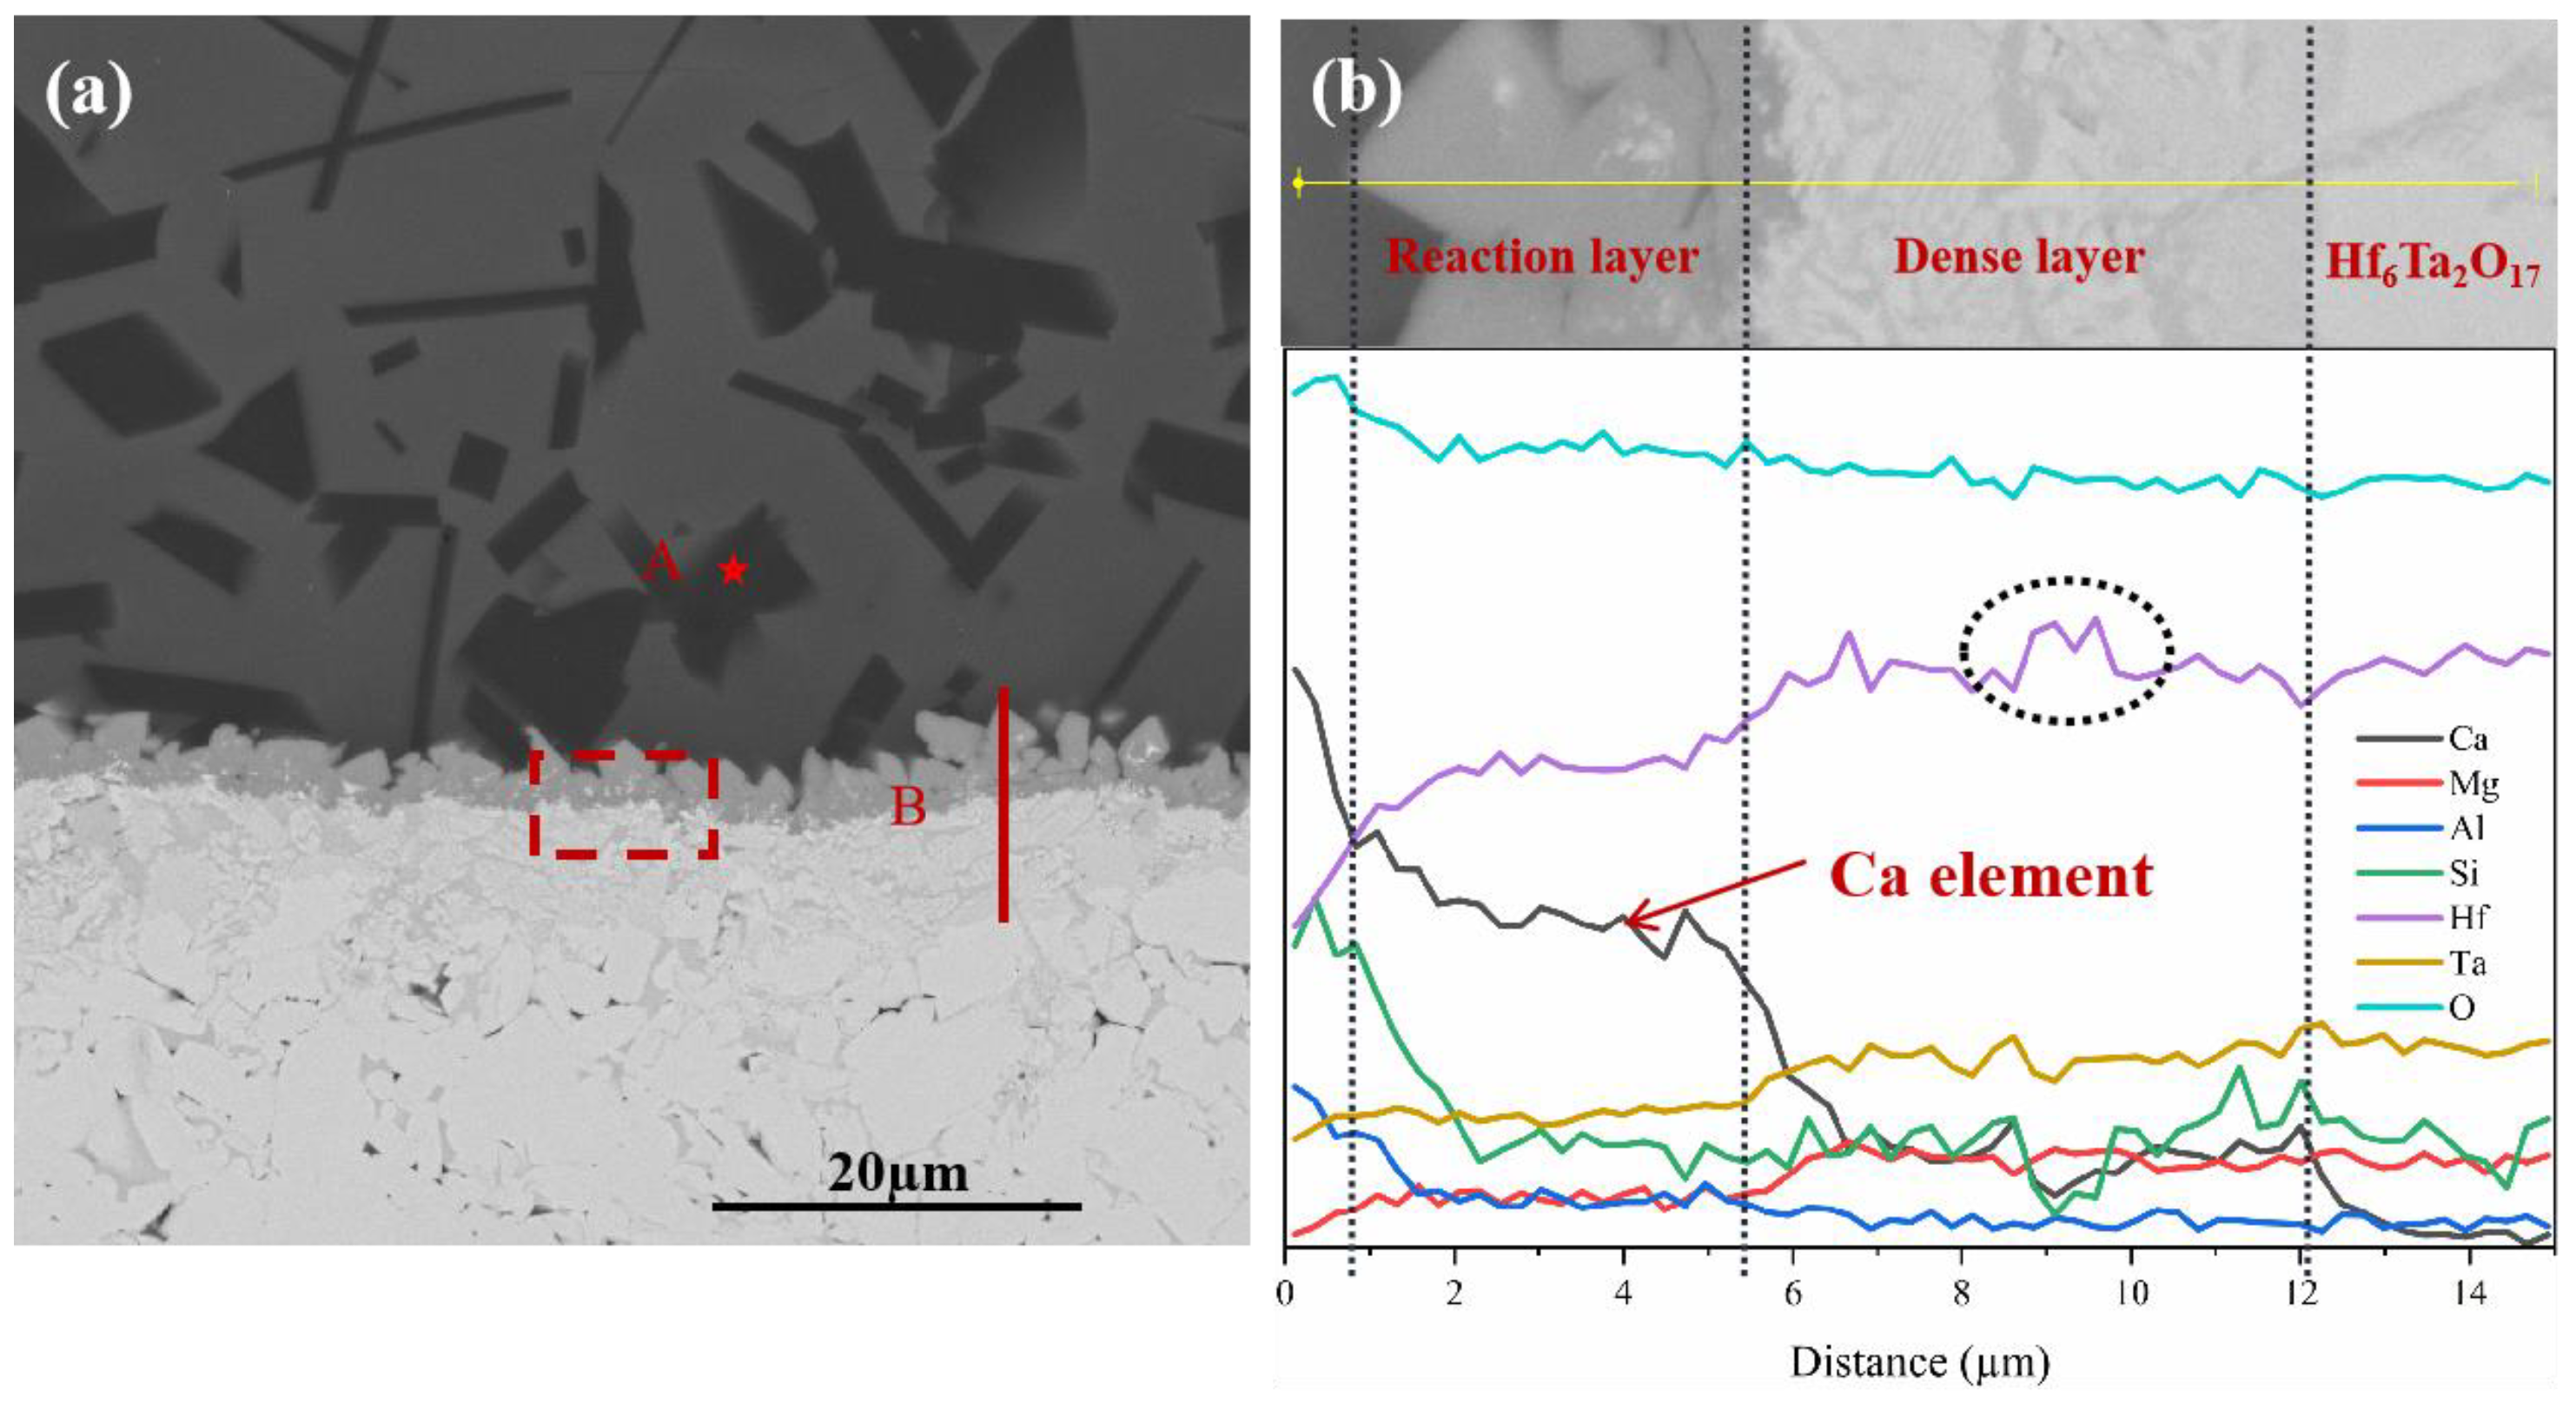
Figure 8 shows a cross-sectional image of Hf6Ta2O17 ceramic corroded by CMAS at 1250 °C for 16 h and its corresponding EDS line scan. It can be seen that there is only anorthite phase (CaAl2Si2O8) in the residual CMAS. The wollastonite phase (CaSiO3) disappears at 16 h, corresponding to the XRD result (Figure 7). To further characterize the dense layer, an EDS line scan is performed on the reactive layer and the dense layer in Figure 8a. The content of Ca element in the dense layer decreases in a gradient manner with the increase in the depth, as shown in Figure 8b, which proves that the Ca infiltration in Hf6Ta2O17 ceramic is the result of volume diffusion rather than grain boundary diffusion. In addition, the Hf element fluctuates in the dense layer, as shown in the dashed circle in Figure 8b, which may be due to the generation of HfO2 phase or Hf element segregation in the dense layer. To further determine the composition, TEM is used to characterize the interface between the reaction layer and dense layer (see Figure 9). Figure 9a,b are the bright-field (BF) TEM images of CMAS reaction front corresponding to the dashed rectangle in Figure 8a. It can be seen that there is a distinct interface between the reaction layer and the dense layer. According to the selected area electron diffraction (SAED) presented in Figure 9d,e, it can be determined that the product D is HfSiO4 and E is the orthorhombic Hf6Ta2O17 phase. Furthermore, no other phase structure is found in the dense layer, which confirms that m-HfO2 is not generated and only Hf element segregation exists. The TEM EDS mapping between the reactive layer and the dense layer in Figure 9c again proves that Ca element penetrates into the dense layer and dose not penetrate down along the grain boundary.
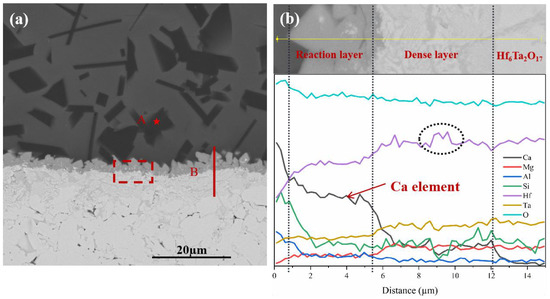
Figure 8.
(a) Cross-sectional BSE images of Hf6Ta2O17 after CMAS attack at 1250 °C for 16 h; (b) EDS line scan in location B of (a).
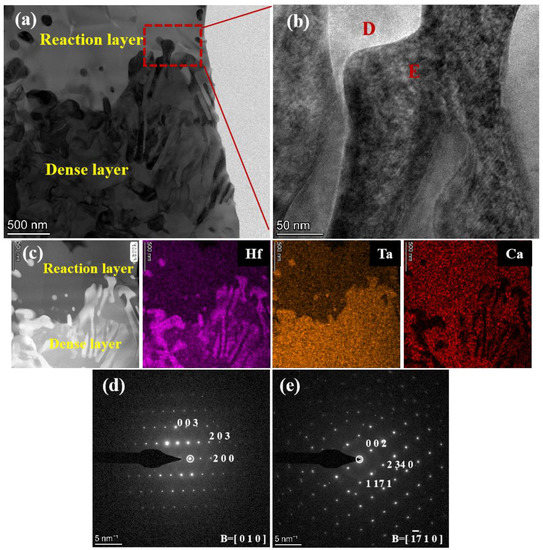
Figure 9.
(a) Cross-sectional BF TEM image of CMAS reaction front corresponding to the dashed rectangle in Figure 8a; (b) magnified HAADF image of reaction interface indicated by in (a); (c) the corresponding EDS elemental mapping; (d,e) SAED patterns of D and E in (b).
3.3.2. Characterization of Corrosion Products at 1300 °C
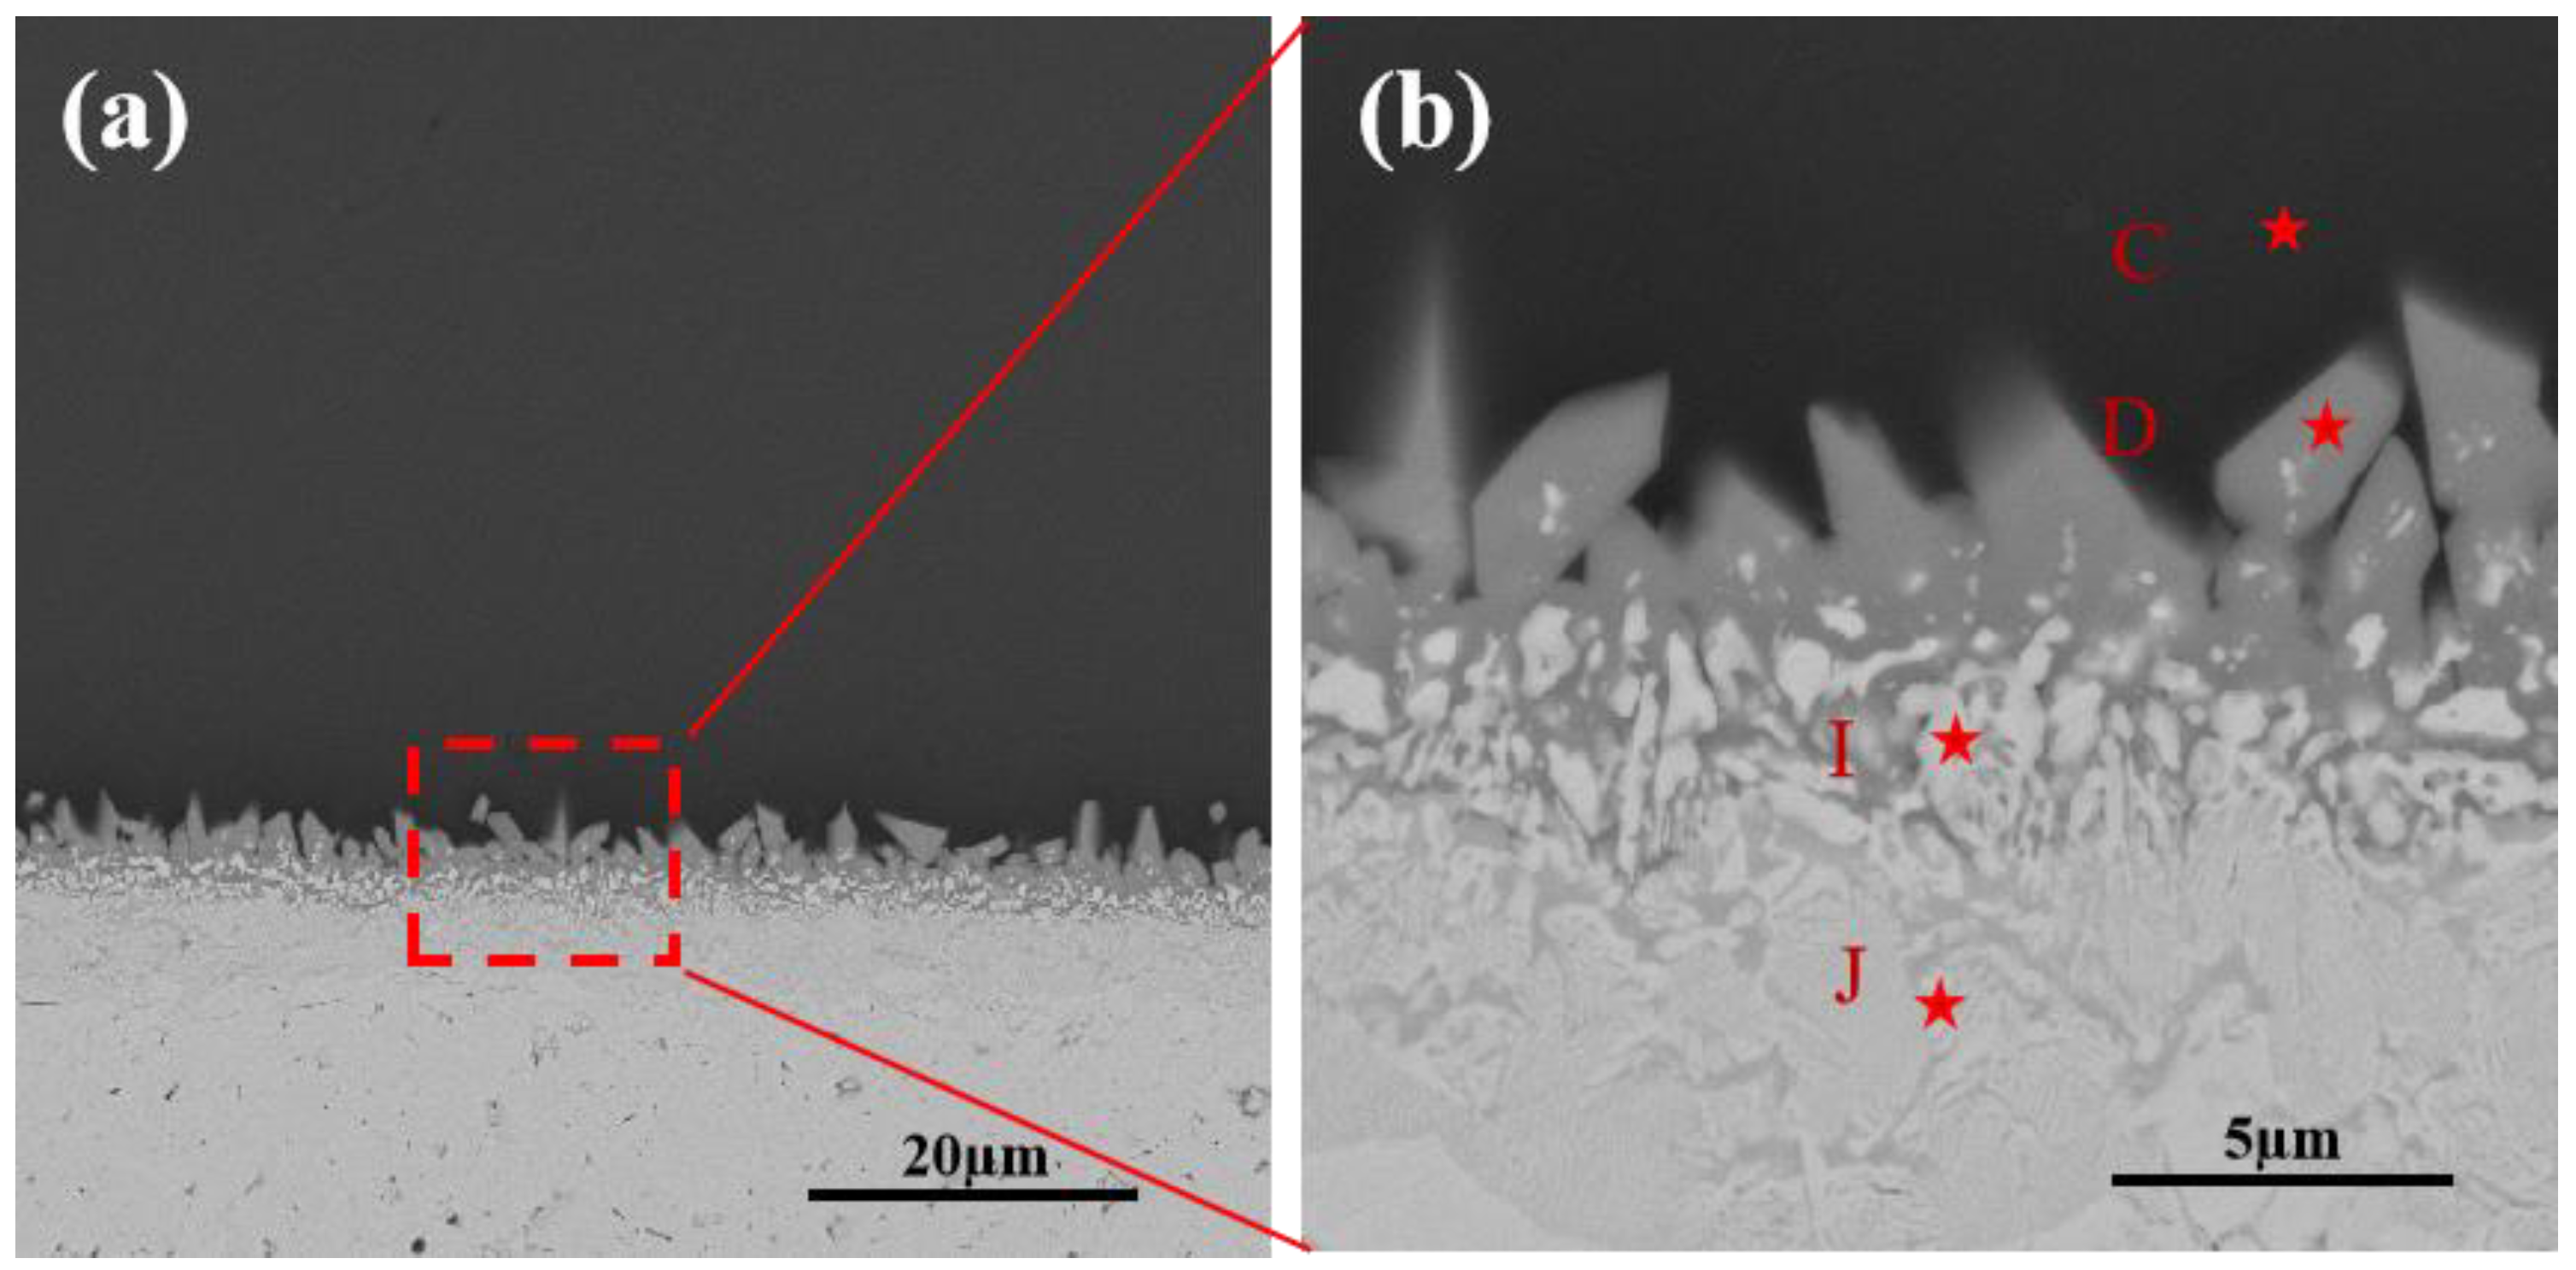
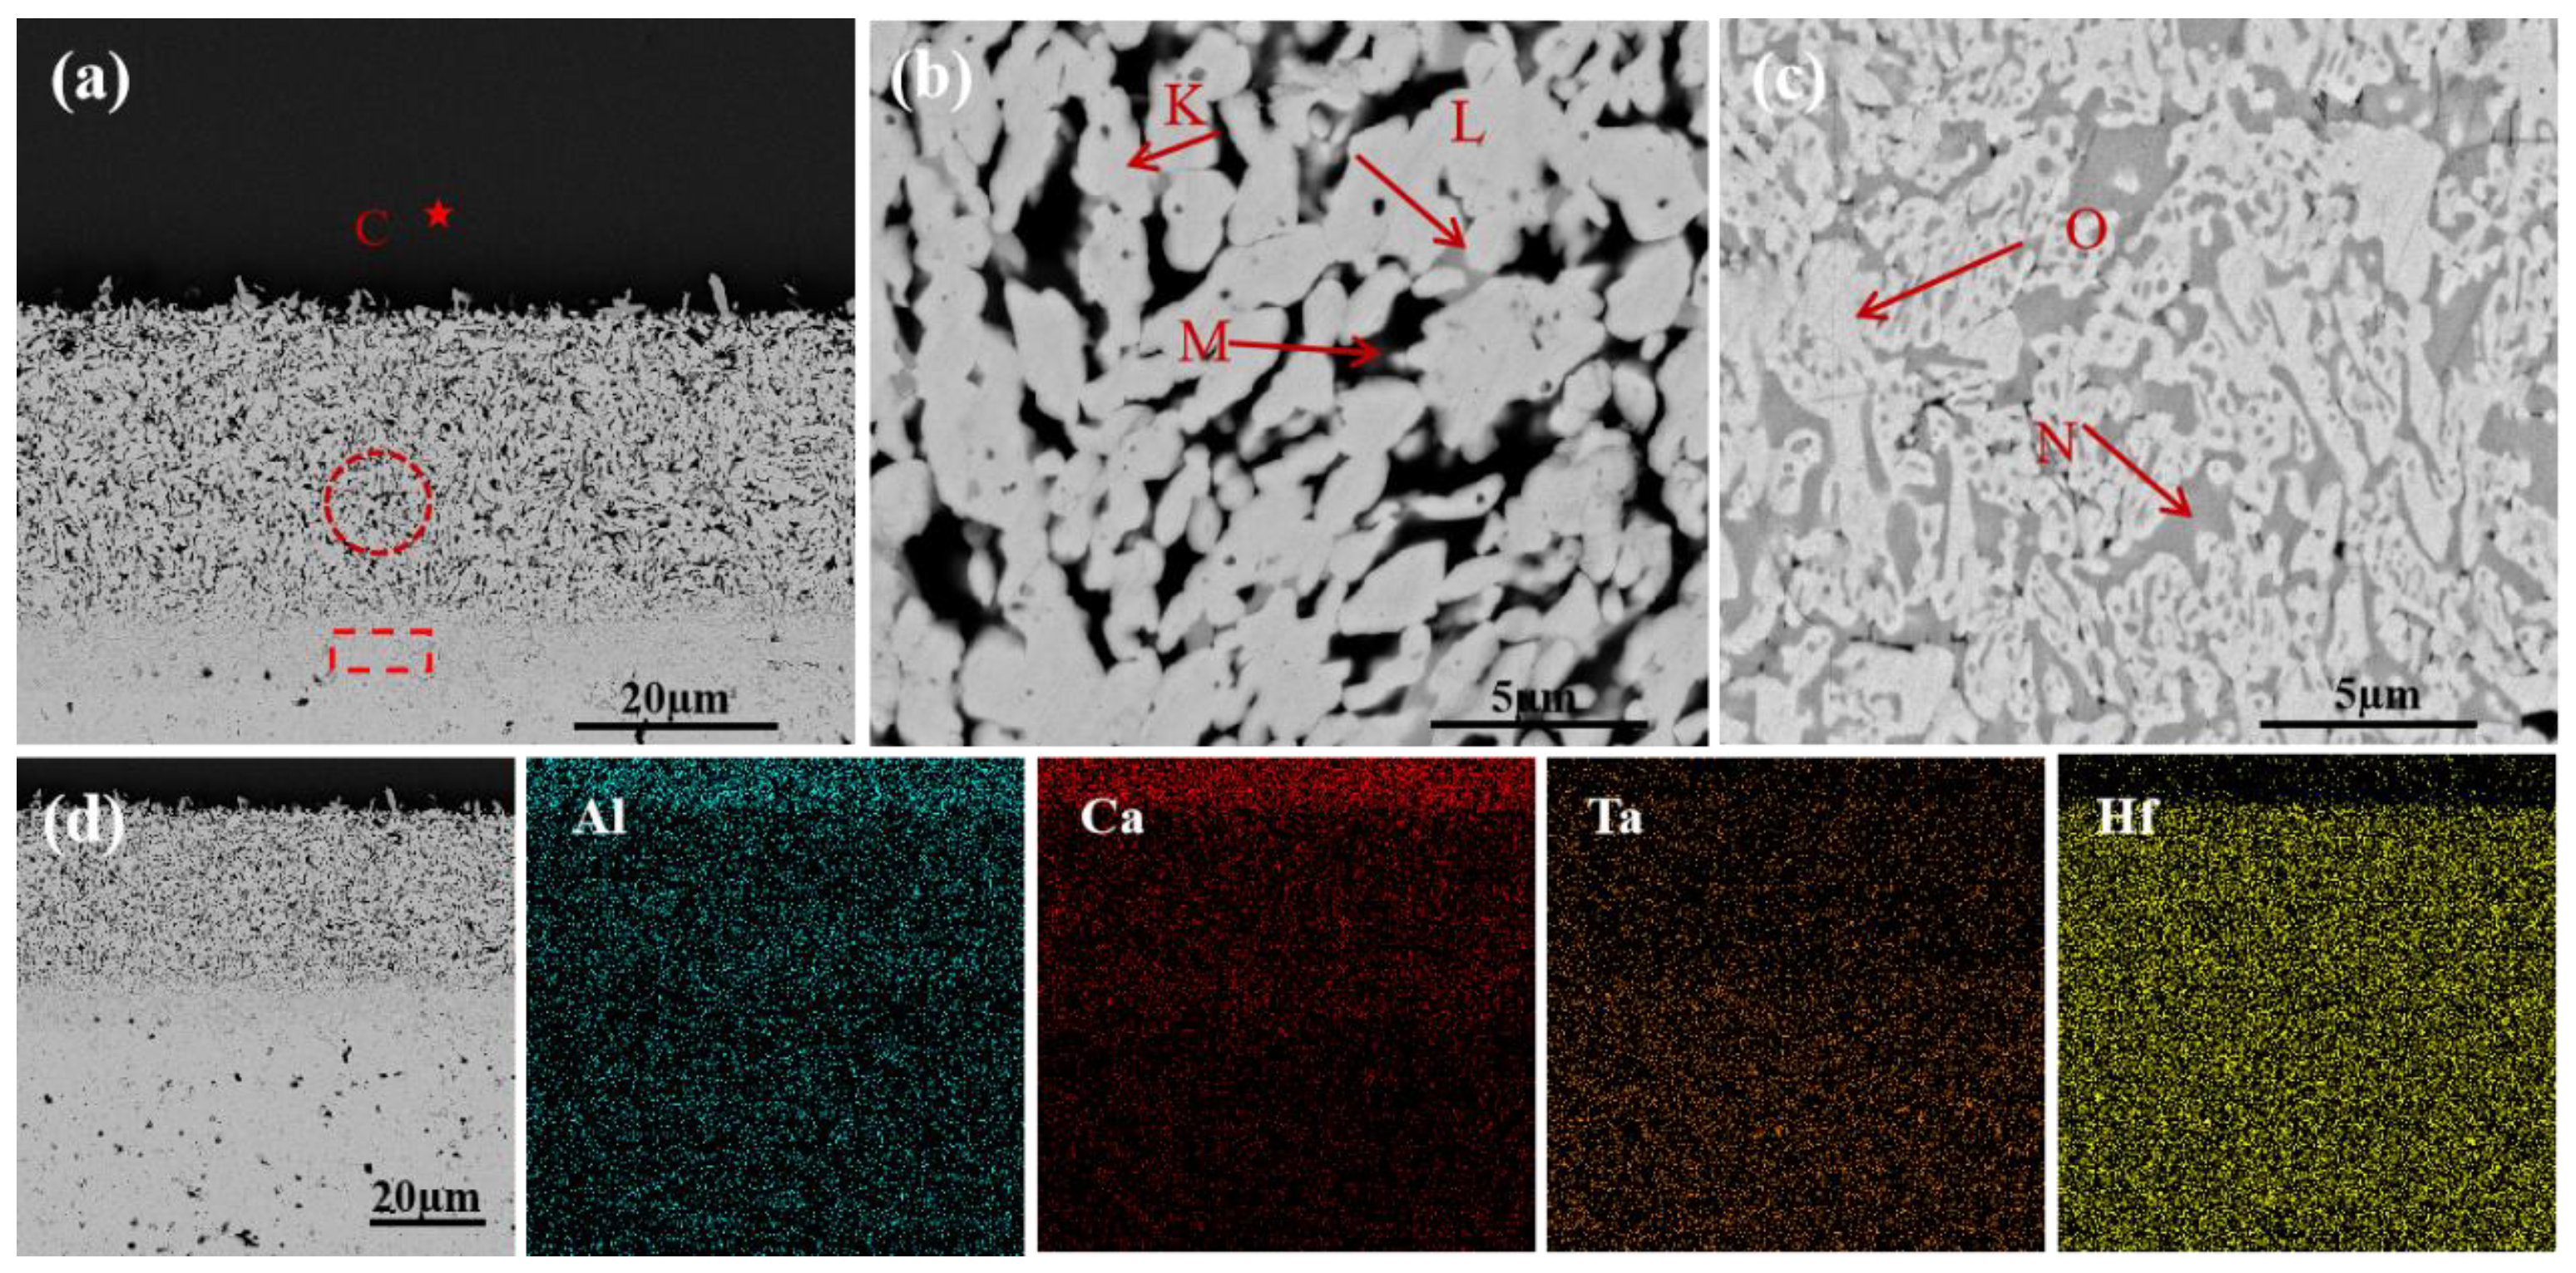
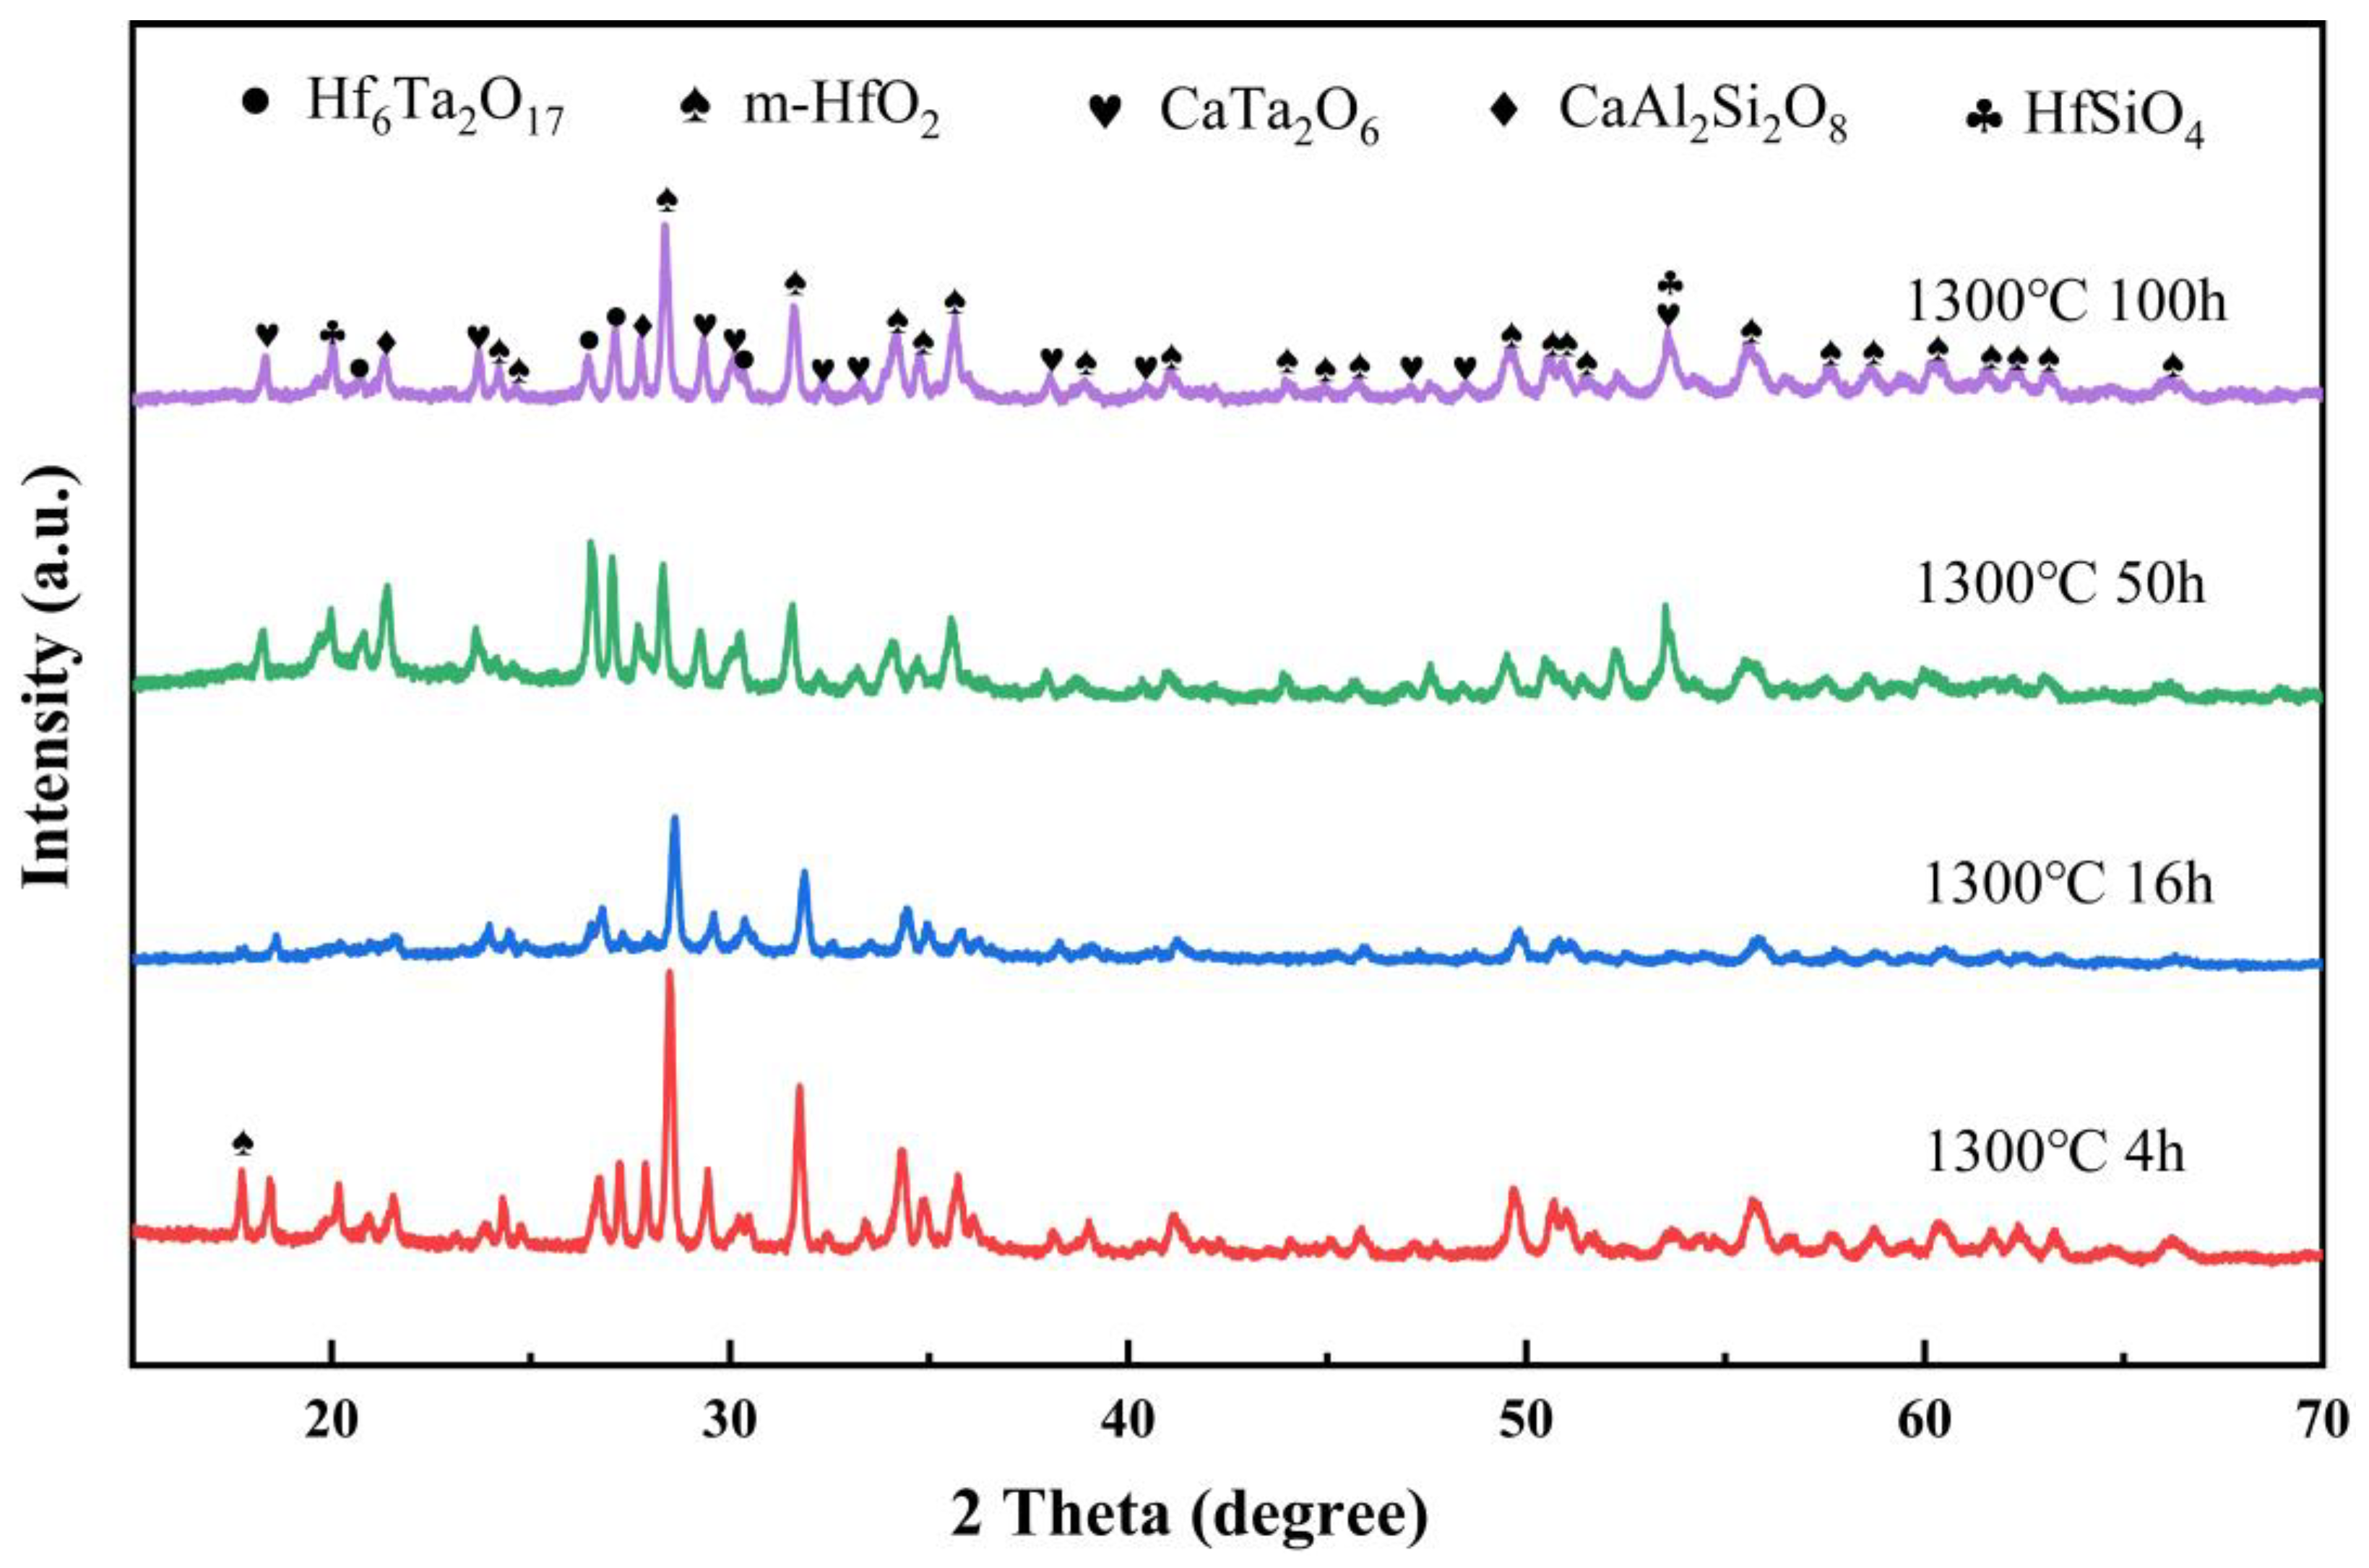
Figure 10 shows a cross-sectional SEM image of Hf6Ta2O17 ceramic corroded by CMAS at 1300 °C for 4 h. A new white bulk product I is formed in the reaction layer, and EDS results in Table 3 confirm that product I is HfO2 phase. After CMAS attack at 1300 °C for 16 h (Figure 11), the morphology of the reaction layer and the dense layer has changed considerably. The reaction layer mainly consists of blocky phase K and there is a small amount of L phase at the grain boundary. Two kinds of phase structures appear in the dense layer: O and N, and they are cross-embedded with each other, which further enhances the dense layer to prevent the CMAS infiltration. Increasing the corrosion time to 50 and 100 h at 1300 °C, the corrosion products of Hf6Ta2O17 ceramic show no significant change except the continuous growth of the dense layer. Combining the EDS mapping results in Figure 11d with EDS point analysis in Table 4, K and O are determined to be m-HfO2 phase. Both the L and N phases are rich in Ca, Hf and Ta elements, but the L phase contains more Hf element and the N phase contains more Ta element. It is speculated that L and N may be the same substance, but the composition is distinct due to different depths. According to Figure 11d, the dense layer prevents Ca element from penetrating into Hf6Ta2O17 ceramic. Figure 12 presents the XRD patterns of Hf6Ta2O17 ceramic corroded by CMAS at 1300 °C for 4, 16, 50 and 100 h. The results show that m-HfO2 has the highest diffraction peak, followed by a new CaTa2O6 characteristic peak, and a small number of CaAl2Si2O8 and HfSiO4 phases. But there is no significant difference in diffraction peak under different corrosion time. The corrosion products are mainly CaTa2O6 and m-HfO2 for different time. Based on the above analysis, the CMAS corrosion products of Hf6Ta2O17 ceramic at 1300 °C are m-HfO2 (K, O phase) and CaTa2O6 (L, N phase).

Figure 10.
(a) A cross-sectional BSE image of Hf6Ta2O17 ceramic after CMAS corrosion at 1300 °C for 8 h; (b) magnified image of the dashed rectangle in (a).
Table 3.
Chemical compositions of the marked regions in Figure 10b.

Figure 11.
(a) A cross-sectional BSE image of Hf6Ta2O17 ceramic after CMAS corrosion at 1300 °C for 16 h; (b) the high magnification BSE image corresponding to the dashed rectangle in (a); (c) the high magnification BSE image corresponding to the dashed circle in (a); (d) cross-sectional EDS mapping results of Hf6Ta2O17 ceramic.
Table 4.
Chemical compositions of the marked regions in Figure 11.
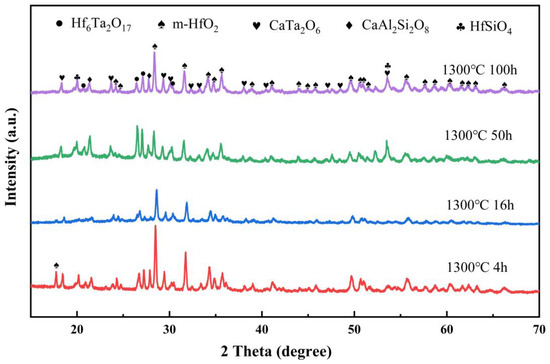
Figure 12.
XRD patterns of Hf6Ta2O17 ceramic after CMAS corrosion at 1300 °C for 4 h, 16 h, 50 h and 100 h.
3.3.3. Characterization of Corrosion Products at 1400 °C
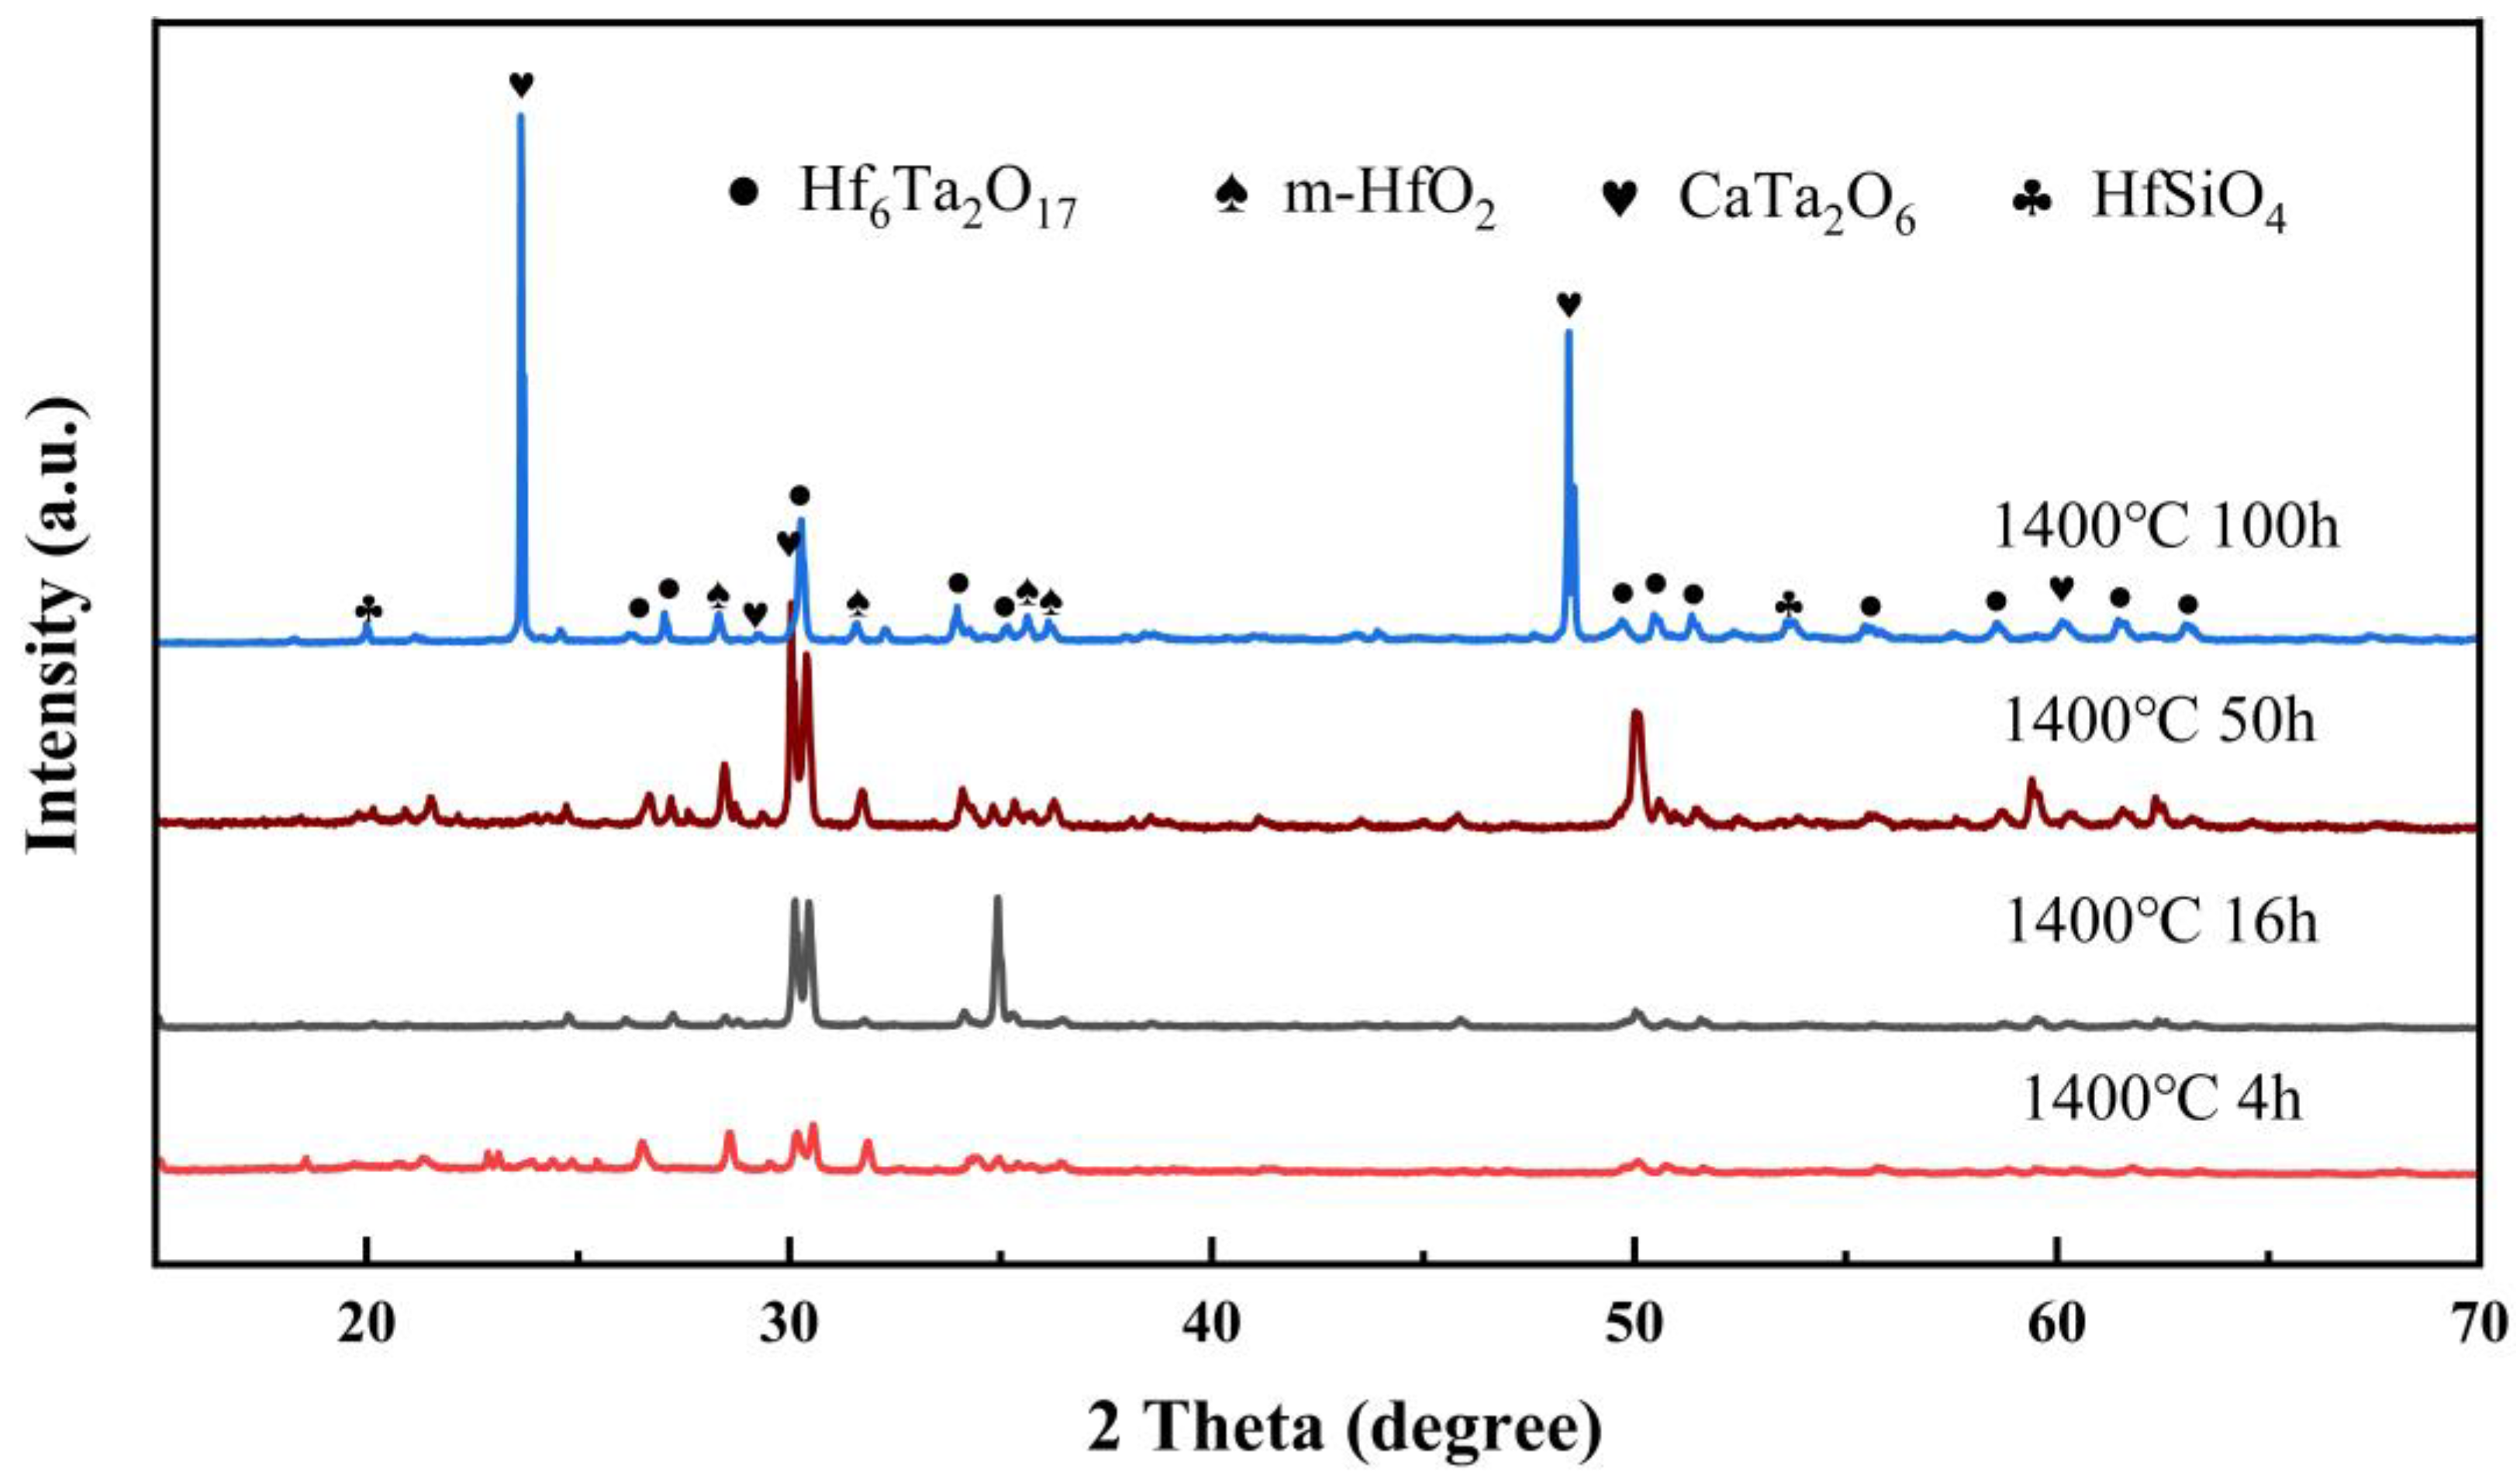
Figure 13 shows cross-sectional SEM images of Hf6Ta2O17 ceramic corroded by CMAS at 1400 °C for 16 h. The corrosion results are analogous to those of long-time corrosion at 1300 °C, and the cross section is also composed of residual CMAS layer, reaction layer and dense layer. Two notable features are observed at 1400 °C. First of all, there are abundant crystalline phases P in the residual CMAS layer, and new P phase presents a dendritic structure. It is confirmed that P phase is also CaTa2O6 in Table 5. Secondly, the corrosion depth increases significantly at 1400 °C for 16 h, and the corrosion depth of 140.6 µm is much greater than that at 1300 °C (~34.1 µm). Figure 14 shows XRD patterns of Hf6Ta2O17 ceramic corroded by CMAS at 1400 °C for 4, 16, 50 and 100 h. The corrosion products are mainly CaTa2O6 and m-HfO2. Because of the low XRD detection depth, the CaTa2O6 phase on the surface of the corroded sample is mainly detected, which is consistent with the cross-sectional BSE results. Based on the XRD and EDS results, the corrosion products are P, R and U phases (m-HfO2) and T and Y phases (CaTa2O6) at 1400 °C.
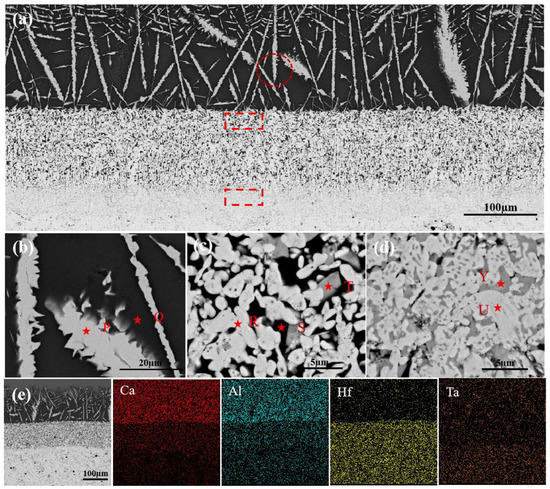
Figure 13.
(a) A cross-sectional BSE image of Hf6Ta2O17 ceramic after CMAS corrosion at 1400 °C for 16 h; (b) the high magnification BSE image corresponding to the dashed circle in (a); (c) the high magnification BSE image corresponding to the dashed rectangle in the reaction layer of (a); (d) the high magnification BSE image corresponding to the dashed rectangle in the dense layer of (a); (e) cross-sectional EDS mapping results of Hf6Ta2O17 ceramic.
Table 5.
Chemical compositions of the marked regions in Figure 13.
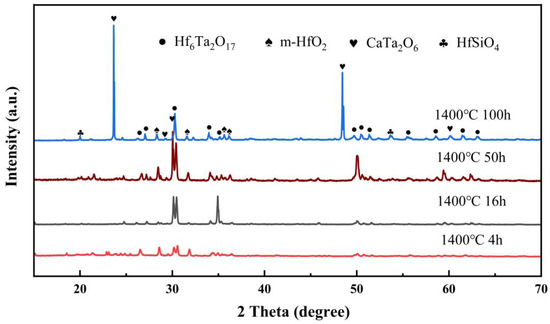
Figure 14.
XRD patterns of Hf6Ta2O17 ceramic after CMAS corrosion at 1400 °C for 4 h, 16 h, 50 h and 100 h.
4. Discussion
4.1. The Excellent CMAS Resistance of Hf6Ta2O17 Ceramic
Compared to other ceramic material in TBCs, Hf6Ta2O17 ceramic exhibits excellent CMAS resistance. After 100 h CMAS corrosion at 1250 °C, the CMAS infiltration depth of Hf6Ta2O17 ceramic only reaches 32.3 µm. In contrast, the CMAS infiltration depths of YSZ and YSZ doped by Er element ceramic at 1250 °C for 2 h reach 21.97 µm and 10.75 µm, respectively [31]. The average CMAS infiltration depths of NdPO4, SmPO4 and GdPO4 ceramic at 1250 °C for 4 h are 140, 60 and 40 µm, respectively [16]. The CMAS infiltration depth of nanosized Sm2Zr2O7 ceramic is 47 μm after 48 h CMAS corrosion at 1250 °C [32]. As the corrosion temperature rises to 1300 °C, CMAS resistance of Hf6Ta2O17 ceramic is superior than other ceramic material in TBCs. The corrosion depths of Hf6Ta2O17 ceramic after CMAS attack at 1300 °C for 4 and 50 h are 13 and 113.8 µm, respectively. The average thickness of the reaction layer of La2(Zr0.7Ce0.3)2O7 is 140 µm at 1300 °C for 4 h [17]. For 50 h CMAS exposure at 1300 °C, the CMAS infiltration depths of 17YSZ and Gd2Zr2O7 ceramics are 700 and 140 µm, respectively [9,30].
4.2. Effect of Temperature and Time on CMAS Corrosion Resistance of Hf6Ta2O17 Ceramic
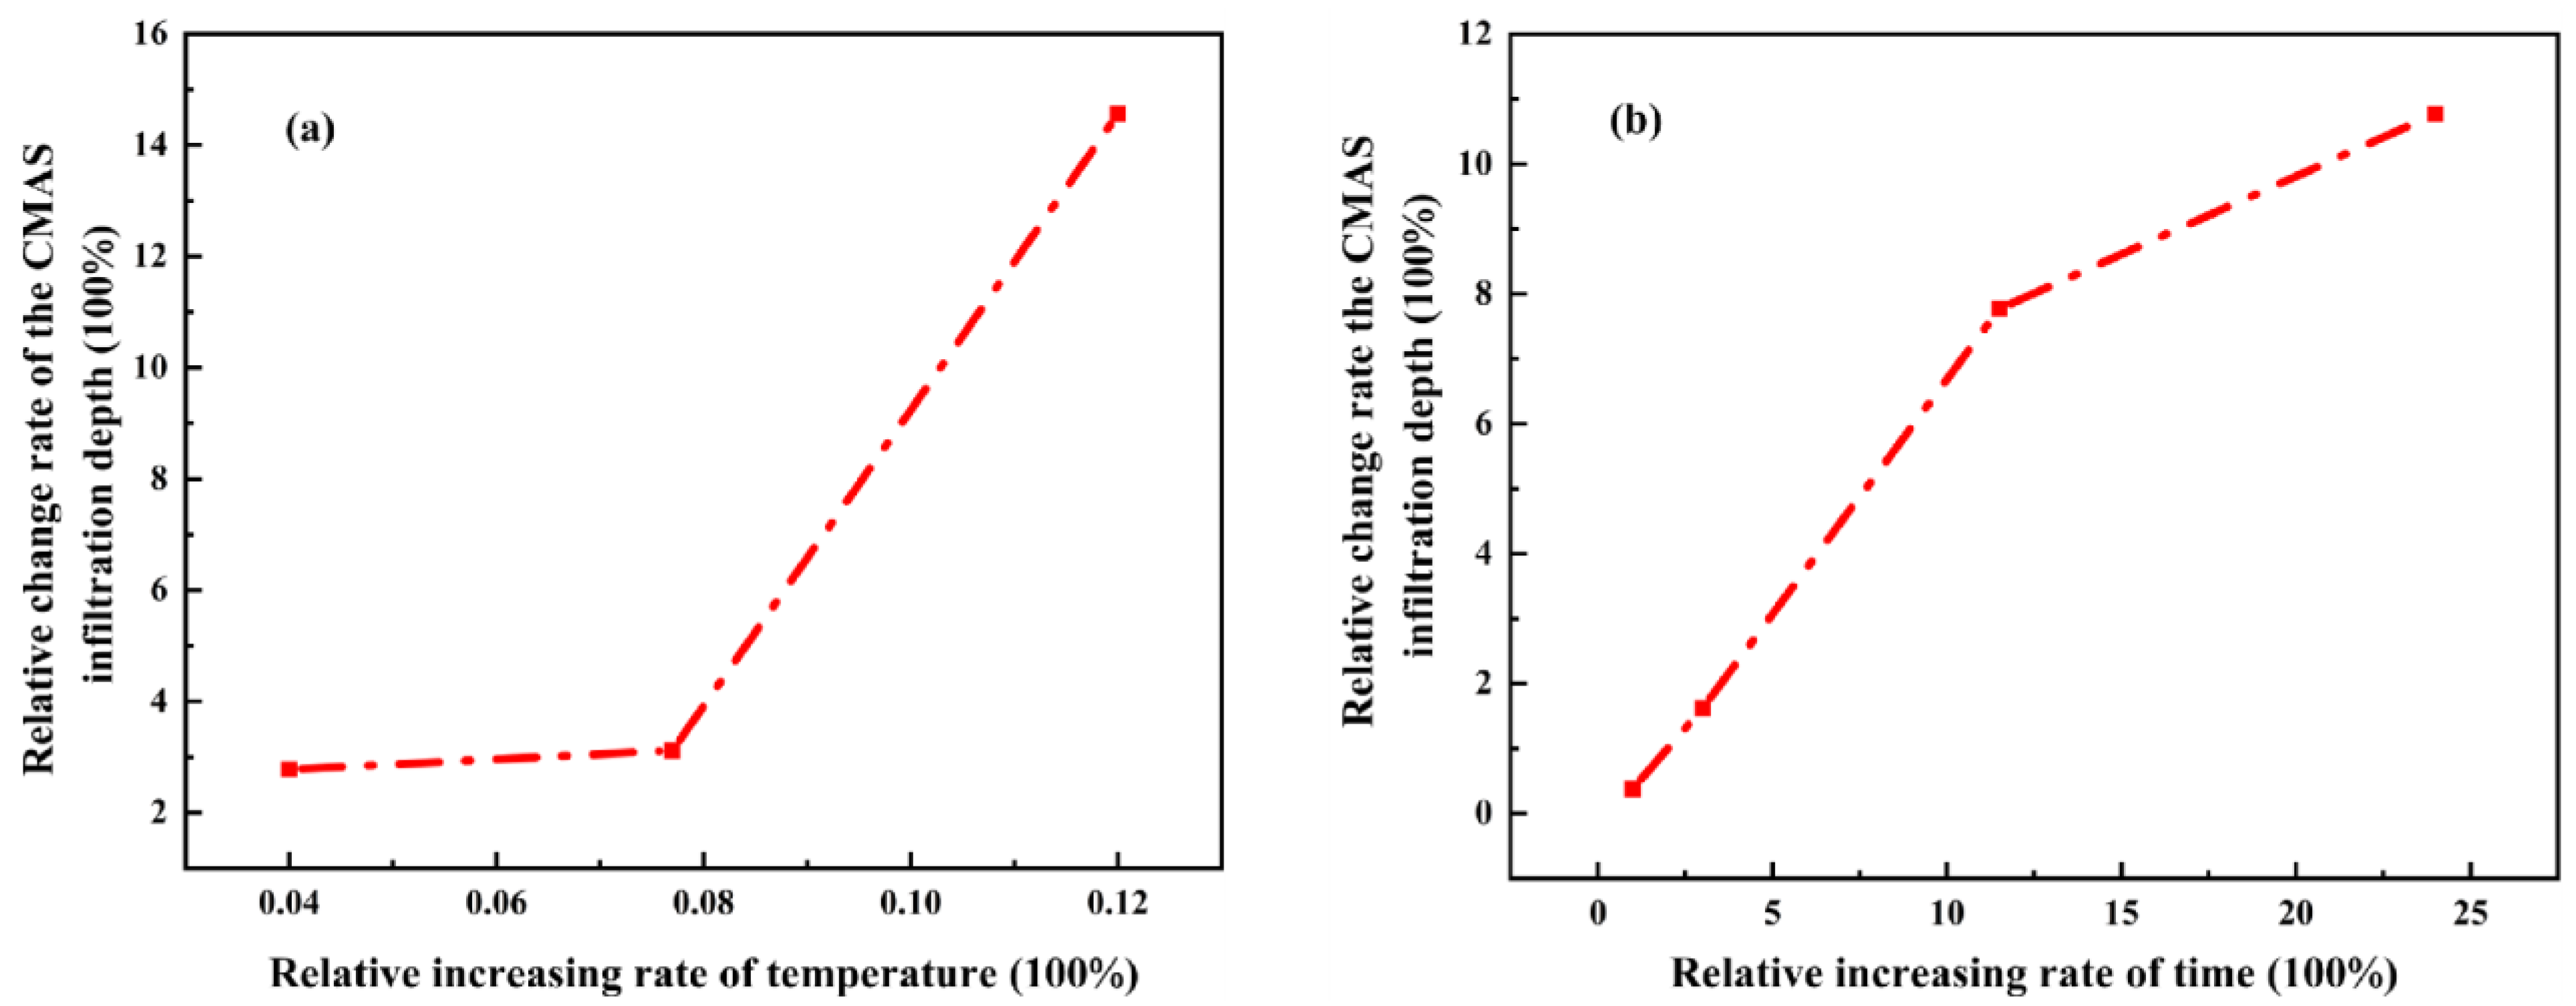
Temperature and time are important factors affecting the corrosion behavior of Hf6Ta2O17 ceramic. Figure 15 shows the relative change rates of the CMAS infiltration depth with the relative increasing rates of temperature and time. The relative increasing rate x of influencing factors and the change of CMAS infiltration depth y can be expressed by Equations (2) and (3), respectively [33]:
where xi and x0 represent the immediate value and the initial value of an influencing factor, respectively, and y(x0) and y(xi) are the infiltration depth of CMAS at xi and x0, respectively. It can be seen that temperature is the most important factor affecting CMAS infiltration, while time has a less effect on CMAS infiltration depth. A 4% increase in temperature leads to a 278% increase in the CMAS infiltration depth. When the time increases by 100%, the infiltration depth only increases by only 38%.
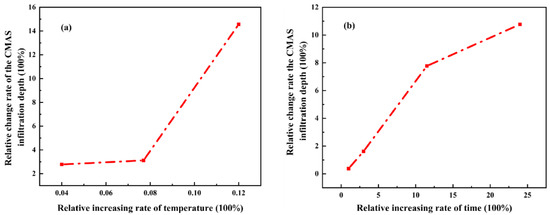
Figure 15.
Relative change rates of the CMAS infiltration depth with the relative increasing rates of temperature (a) and time (b).
Considerable studies have proven that CMAS viscosity decreases with an increase in temperature, and the CMAS infiltration rate increases with an increase in temperature. CMAS viscosity is directly related to the CMAS infiltration depth in TBCs at high temperature [8,34,35]. CMAS viscosity at different temperatures can be calculated by using the Vogel–Fulcher–Tammann (VFT) equation [36]:
where η is viscosity, A is a constant, B and C are related to the composition of CMAS, and T is the temperature. The parameter A is assumed to be a constant, which is the value of logη at infinite temperature. B and C are controlled by the CMAS composition effect, which can be estimated by using Equations (5) and (6) [8,37]:
where Ms and Ns refer to the combination of mol% oxides and the unknown coefficients bi, b1j, ci, c11 are adequate to compute the values of B and C for any individual melt composition.
According to Equation (4), an increase in corrosion temperature can reduce the CMAS viscosity by an order of magnitude, leading to an increase in the CMAS infiltration depth. Consequently, temperature is the most important factor in determining the CMAS corrosion behavior.
4.3. CMAS Resistance Mechanism of Hf6Ta2O17 Ceramic
Since temperature is the main factor affecting the corrosion behavior of Hf6Ta2O17 ceramic, the CMAS resistance mechanism is divided into two parts: the low-temperature section at 1250 °C and the high-temperature section at 1300–1400 °C. At low temperature, the reaction between Hf6Ta2O17 ceramic and CMAS is not high. The reaction layer has only a small amount of HfSiO4, and mainly residual CMAS is self-crystallized to form wollastonite and anorthite, as shown in reaction Equations (7) and (8). This is because a large amount of Ca element infiltrates into the dense layer, while Al element is blocked in the residual CMAS layer, resulting in changes in the composition of residual CMAS and the easier formation of self-crystallizing products [14]. Hf6Ta2O17 ceramic has excellent CMAS corrosion resistance at 1250 °C, which can be attributed to two aspects. Firstly, Hf6Ta2O17 ceramic at 1250 °C has excellent chemical inertness under high temperature, so the molten CMAS is less destructive to the ceramic. The formation of CMAS self-crystallization products consumes much of the Ca and Al elements, increasing the CMAS viscosity, thus impeding the downward infiltration of CMAS. Secondly, the appearance of a reaction layer and a dense layer effectively inhibits the downward infiltration of molten CMAS; in particular, the Ca element penetrates the HfSiO4 reaction layer and continues to penetrate downward to form the CaXHf6-xTa2O17-x dense layer, which suppresses CMAS above the ceramic. SEM and TEM results also indicate that the Ca elements penetrate downward through volume diffusion rather than grain boundary corrosion, thus greatly delaying the CMAS infiltration.
The corrosion behavior of Hf6Ta2O17 ceramic is greatly changed at high temperatures, and the most remarkable feature is the formation of m-HfO2 and CaTa2O6. The CMAS corrosion behavior of Hf6Ta2O17 ceramic needs to be divided into two stages at 1300 °C: (I) t < 16 h and (II) 16 h ≤ t ≤ 100 h. During stage I, a small amount of m-HfO2 is precipitated from the reaction layer, and the corrosion results of the ceramic are basically consistent with that at 1250 °C. During stage II, both the reaction layer and the dense layer are composed of CaTa2O6 and m-HfO2. The thickness of the reaction layer is basically unchanged, while the thickness of the dense layer keeps increasing at long-term corrosion. Recent research has shown that m-HfO2 and CaTa2O6 have extremely low solubility in molten CMAS and will not generate reaction products, which also suggests that m-HfO2 and CaTa2O6 can form dense layers that hinder downward infiltration of CMAS [38,39]. The corrosion behavior of Hf6Ta2O17 ceramic at 1400 °C is similar to that of stage II at 1300 °C. The difference is that a large amount of Ta element begins to diffuse upward to the residual CMAS layer, resulting in the formation of CaTa2O6. Therefore, the corrosion behavior of Hf6Ta2O17 ceramic at 1300–1400 °C can be explained from two aspects. Firstly, in terms of thermodynamics, Hf6Ta2O17 ceramic reacts violently with molten CMAS to generate m-HfO2 and CaTa2O6 at 1300–1400 °C, as shown in reaction Equation (9). The Ca element of molten CMAS plays an important role in the reaction process at this stage. The corrosion kinetics can also explain the corrosion resistance mechanism of Hf6Ta2O17 ceramic. According to Figure 4 and Figure 5, CMAS corrosion for a long time is not determined by chemical reaction, but penetration downward through solid diffusion. Continuous thickening of the dense layer can effectively improve the corrosion resistance of Hf6Ta2O17 ceramic. At the initial stage of CMAS corrosion at 1400 °C, the CMAS infiltration depth increases sharply, because the time is too short to generate a thick dense layer. Over time, the dense layer continues to thicken, and the corrosion rate begins to decrease significantly.
5. Conclusions
In this paper, the CMAS corrosion behavior of Hf6Ta2O17 ceramic at 1250–1400 °C is investigated, the effects of temperature and time on the CMAS corrosion resistance of Hf6Ta2O17 ceramic are discussed, and the CMAS resistance mechanism is clarified. Several conclusions can be drawn, as follows:
- (1)
- Compared with some traditional and novel CMAS-resistant ceramic materials in TBCs, Hf6Ta2O17 ceramic exhibits excellent CMAS resistance characteristics at short-term and long-term corrosion;
- (2)
- Based on the influence of CMAS viscosity, temperature is the most important factor affecting the CMAS behavior of Hf6Ta2O17 ceramic. At 1250 °C, CMAS self-crystallization products are composed of anorthite CaAl2Si2O8 and wollastonite CaSiO3. The reaction layer is composed of HfSiO4 and the dense layer is consisted of CaXHf6−xTa2O17−x. At 1300 and 1400 °C, the reaction layer and the dense layer are composed of CaTa2O6 and m-HfO2.
- (3)
- The CMAS resistance mechanism of Hf6Ta2O17 ceramic varies with temperature. At 1250 °C, the formation of CMAS self-crystallization products consisting of anorthite CaAl2Si2O8 and wollastonite CaSiO3, and the formation of HfSiO4 in a reaction layer and CaXHf6−xTa2O17−x in a dense layer effectively inhibit the CMAS infiltration. At 1300 and 1400 °C, the formation and thickening of CaTa2O6 and m-HfO2 in the dense layer improve the CMAS corrosion resistance of Hf6Ta2O17 ceramic.
Author Contributions
Conceptualization, W.Z.; formal analysis, X.H. and F.Z.; funding acquisition, W.Z. and J.X.; methodology, S.L., Q.L., X.H., W.Z. and F.Z.; resources, J.G. and J.X.; supervision, J.G. and W.Z.; validation, X.H.; writing—original draft, S.L. and Q.L.; writing—review & editing, W.Z. and F.Z. All authors have read and agreed to the published version of the manuscript.
Funding
This work was supported by the Science and Technology Innovation Program of Hunan Province (Grant No. 2022RC1082), the Scientific Research Foundation of Hunan Provincial Education Department (Grant No. 21A0120), the National Natural Science Foundation of China (Grant No. 52171015), the Natural Science Foundation of Hunan Province (Grant No. 2021JJ30467), and Postgraduate Scientific Research Innovation Project of Hunan Province (Grant No. XDCX2021B139).
Institutional Review Board Statement
Not applicable.
Informed Consent Statement
Not applicable.
Data Availability Statement
The raw/processed data required to reproduce these findings cannot be shared at this time as the data also forms part of an ongoing study.
Conflicts of Interest
The authors declare no conflict of interest.
References
- Clarke, D.; Oechsner, M.; Padture, N. Thermal-barrier coatings for more efficient gas-turbine engines. MRS Bull. 2012, 37, 891–899. [Google Scholar] [CrossRef]
- Vasile, B.; Birca, A.; Surdu, V.; Neacsu, I.; Nicoară, A. Ceramic composite materials obtained by electron-beam physical vapor deposition used as thermal barriers in the aerospace industry. Nanomaterials 2020, 10, 370. [Google Scholar] [CrossRef] [PubMed]
- Darolia, R. Thermal barrier coatings technology: Critical review, progress update, remaining challenges and prospects. Int. Mater. Rev. 2013, 58, 315–348. [Google Scholar] [CrossRef]
- Rabiei, A.; Evans, A. Failure mechanisms associated with the thermally grown oxide in plasma-sprayed thermal barrier coatings. Acta Mater. 2000, 48, 3963–3976. [Google Scholar] [CrossRef]
- Chen, X.; Wang, R.; Yao, N.; Evans, A.; Hutchinson, J.; Bruce, R.W. Foreign object damage in a thermal barrier system: Mechanisms and simulations. Mater. Sci. Eng. A 2003, 352, 221–231. [Google Scholar] [CrossRef]
- Levi, C.; Hutchinson, J.; Vidal-Sétif, M.; Johnson, C. Environmental degradation of thermal-barrier coatings by molten deposits. MRS Bull. 2012, 37, 932–941. [Google Scholar] [CrossRef]
- Krause, A.; Garces, H.; Dwivedi, G.; Ortiz, A.; Sampath, S. Calcia-magnesia-alumino-silicate (CMAS)-induced degradation and failure of air plasma sprayed yttria-stabilized zirconia thermal barrier coatings. Acta Mater. 2016, 105, 355–366. [Google Scholar] [CrossRef]
- Nieto, A.; Agrawal, R.; Bravo, L.; Hofmeister-Mock, C.; Pepi, M.; Ghoshal, A. Calcia-magnesia-alumina-silicate (CMAS) attack mechanisms and roadmap towards Sandphobic thermal and environmental barrier coatings. Int. Mater. Rev. 2021, 66, 451–492. [Google Scholar] [CrossRef]
- Pujol, G.; Ansart, F.; Bonino, J.; Malié, A.; Hamadi, S. Step-by-step investigation of degradation mechanisms induced by CMAS attack on YSZ materials for TBC applications. Surf. Coat. Technol. 2013, 237, 71–78. [Google Scholar] [CrossRef]
- Morelli, S.; Testa, V.; Bolelli, G.; Ligabue, O.; Molinari, E.; Antolotti, N.; Lusvarghi, L. CMAS corrosion of YSZ thermal barrier coatings obtained by different thermal spray processes. J. Eur. Ceram. Soc. 2020, 40, 4084–4100. [Google Scholar] [CrossRef]
- Yan, Z.; Guo, L.; Zhang, Z.; Wang, X.; Ye, F. Versatility of potential protective layer material Ti2AlC on resisting CMAS corrosion to thermal barrier coatings. Corros. Sci. 2020, 167, 108532. [Google Scholar] [CrossRef]
- Yang, W.; Ye, F. The thermophysical properties and the molten CMAS resistance performance of Ytterbium Tantalate. Surf. Coat. Technol. 2021, 423, 127584. [Google Scholar] [CrossRef]
- Gok, M.; Goller, G. Microstructural characterization of GZ/CYSZ thermal barrier coatings after thermal shock and CMAS+ hot corrosion test. J. Eur. Ceram. Soc. 2017, 37, 2501–2508. [Google Scholar] [CrossRef]
- Qu, W.; Li, S.; Chen, Z.; Li, C.; Pei, Y.; Gong, S. Hot corrosion behavior and wettability of calcium-magnesium-alumina-silicate (CMAS) on LaTi2Al9O19 ceramic. Corros. Sci. 2020, 162, 108199. [Google Scholar] [CrossRef]
- Krause, A.; Garces, H.; Herrmann, C.; Padture, N. Resistance of 2ZrO2·Y2O3 top coat in thermal/environmental barrier coatings to calcia-magnesia-aluminosilicate attack at 1500 °C. J. Am. Ceram. Soc. 2017, 100, 3175–3187. [Google Scholar] [CrossRef]
- Wang, F.; Guo, L.; Wang, C.; Ye, F. Calcium-magnesium-alumina-silicate (CMAS) resistance characteristics of LnPO4 (Ln= Nd, Sm, Gd) thermal barrier oxides. J. Eur. Ceram. Soc. 2017, 37, 289–296. [Google Scholar] [CrossRef]
- Zhou, X.; Zou, B.; He, L.; Xu, Z.; Xu, J.; Mu, R.; Cao, X. Hot corrosion behaviour of La2(Zr0.7Ce0.3)2O7 thermal barrier coating ceramics exposed to molten calcium magnesium aluminosilicate at different temperatures. Corros. Sci. 2015, 100, 566–578. [Google Scholar] [CrossRef]
- Chen, L.; Hu, M.; Guo, J.; Chong, X.; Feng, J. Mechanical and thermal properties of RETaO4 (RE= Yb, Lu, Sc) ceramics with monoclinic-prime phase. J. Mater. Sci. Technol. 2020, 52, 20–28. [Google Scholar] [CrossRef]
- Clarke, D.; Phillpot, S. Thermal barrier coating materials. Mater. Today 2005, 8, 22–29. [Google Scholar] [CrossRef]
- Barsoum, M.; Salama, I.; El-Raghy, T.; Golczewski, J.; Seifert, H.; Aldinger, F.; Porter, W.; Wang, H. Thermal and electrical properties of Nb2AlC, (Ti, Nb)2AlC and Ti2AlC. Metall. Mater. Trans. A 2002, 33, 2775–2779. [Google Scholar] [CrossRef]
- Mccormack, S.; Kriven, W. Crystal structure solution for the A6B2O17 (A = Zr, Hf; B = Nb, Ta) superstructure. Acta Crystallogr. Sect. B Struct. Sci. 2019, 75, 227–234. [Google Scholar] [CrossRef]
- Liu, Q.; Hu, X.; Zhu, W.; Guo, J.; Tan, Z. Effects of Ta2O5 content on mechanical properties and high-temperature performance of Zr6Ta2O17 thermal barrier coatings. J. Am. Ceram. Soc. 2021, 104, 6533–6544. [Google Scholar] [CrossRef]
- McCormack, S.; Tseng, K.; Weber, R.; Kapush, D.; Ushakov, S.; Navrotsky, A.; Kriven, W. In-situ determination of the HfO2-Ta2O5 temperature phase diagram up to 3000 °C. J. Am. Ceram. Soc. 2019, 102, 4848–4861. [Google Scholar] [CrossRef]
- McCormack, S.; Weber, R.; Kriven, W. In-situ investigation of Hf6Ta2O17 anisotropic thermal expansion and topotactic, peritectic transformation. Acta Mater. 2018, 161, 127–137. [Google Scholar] [CrossRef]
- Li, M.; Xu, Q.; Zhu, S.; Wang, L. Preparation and thermal conductivity of Hf6Ta2O17 ceramic. Key Eng. Mater. 2010, 434–435, 459–461. [Google Scholar]
- Tan, Z.; Yang, Z.; Zhu, W.; Yang, L.; Zhou, Y.; Hu, X. Mechanical properties and calcium-magnesium-alumino-silicate (CMAS) corrosion behavior of a promising Hf6Ta2O17 ceramic for thermal barrier coatings. Ceram. Int. 2020, 46, 25242–25248. [Google Scholar] [CrossRef]
- Zhao, H.; Levi, C.; Wadley, H. Molten silicate interactions with thermal barrier coatings. Surf. Coat. Technol. 2014, 251, 74–86. [Google Scholar] [CrossRef]
- Borom, M.P.; Johnson, C.A.; Peluso, L.A. Role of environmental deposits and operating surface temperature in spallation of air plasma sprayed TBC. Surf. Coat. Technol. 1996, 86, 116–126. [Google Scholar] [CrossRef]
- Zaleski, E.; Ensslen, C.; Levi, C. Melting and crystallization of silicate systems relevant to thermal barrier coating damage. J. Am. Ceram. Soc. 2015, 98, 1642–1649. [Google Scholar] [CrossRef]
- Wu, D.; Yao, Y.; Shan, X.; Cai, H.; Hu, L.; Zhao, X. ZrO2-doped YTaO4 as potential CMAS-resistant materials for thermal barrier coatings application. J. Am. Ceram. Soc. 2021, 104, 6029–6043. [Google Scholar] [CrossRef]
- Mo, Y.; Zhang, Y.; Chen, Z.; Zheng, H.; Li, G.; Gen, Y.; Li, G.; Peng, P. Effect of Er dopant on the corrosion resistance of YSZ in CMAS melt: Experimental and first-principles study. J. Mater. Sci. 2021, 56, 17542–17555. [Google Scholar] [CrossRef]
- Wang, Y.; Ma, Z.; Liu, L.; Liu, Y. Influence of the grain size on CMAS attack of Sm2Zr2O7 ceramic. Ceram. Int. 2021, 47, 24453–24457. [Google Scholar] [CrossRef]
- Cao, L.; Hu, H.; Gao, D. Design and fabrication of micro-textures for inducing a superhydrophobic behavior on hydrophilic materials. Langmuir 2007, 23, 4310–4314. [Google Scholar] [CrossRef]
- Poerschke, D.; Jackson, R.; Levi, C. Silicate deposit degradation of engineered coatings in gas turbines: Progress toward models and materials solutions. Annu. Rev. Mater. Res. 2017, 47, 297–330. [Google Scholar] [CrossRef]
- Kumar, R.; Rommel, S.; Jiang, C.; Jordan, E. Effect of CMAS viscosity on the infiltration depth in thermal barrier coatings of different microstructures. Surf. Coat. Technol. 2022, 432, 128039. [Google Scholar] [CrossRef]
- Fulcher, G.S. Analysis of recent measurements of the viscosity of glasses. J. Am. Ceram. Soc. 1925, 8, 339–355. [Google Scholar] [CrossRef]
- Giordano, D.; Russell, J.; Dingwell, D. Viscosity of magmatic liquids: A model. Earth Planet. Sci. Lett. 2008, 271, 123–134. [Google Scholar] [CrossRef]
- Holgate, C.; Yang, Y.; Levi, C. Reactive crystallization in HfO2 exposed to molten silicates. J. Eur. Ceram. Soc. 2021, 41, 5686–5695. [Google Scholar] [CrossRef]
- Li, B.; Chen, L.; Luo, K.; Guo, J.; Wang, J.; Zhang, L.; Feng, J. Synthesis and thermophysical properties of ATa2O6 (A= Co, Ni, Mg, Ca) tantalates with robust CMAS resistance. J. Am. Ceram. Soc. 2022, 105, 4840–4858. [Google Scholar] [CrossRef]


Disclaimer/Publisher’s Note: The statements, opinions and data contained in all publications are solely those of the individual author(s) and contributor(s) and not of MDPI and/or the editor(s). MDPI and/or the editor(s) disclaim responsibility for any injury to people or property resulting from any ideas, methods, instructions or products referred to in the content. |
© 2023 by the authors. Licensee MDPI, Basel, Switzerland. This article is an open access article distributed under the terms and conditions of the Creative Commons Attribution (CC BY) license (https://creativecommons.org/licenses/by/4.0/).