Abstract
Currently, hydrogel materials are being widely developed and investigated. Factors affecting their properties may be mentioned, such as the types and the amounts of the reagents used for the synthesis of the hydrogel matrix and modifiers; thus, the main aim of the investigations was to check the impact of the amount of photoinitiator applied during the UV-induced polymerization of polyvinylpyrrolidone-based hydrogels incorporated with vitamin C and Aloe vera juice. The experiments that were performed were focused on determining the hydrogels’ swelling capability, behavior in simulated body fluids, hydrophilicity, chemical structure (using FT-IR spectroscopy), as well as their surface morphology and roughness. It was proven that developed materials had relatively rough surfaces, they did not degrade in simulated physiological liquids, and their swelling ratios in these media were 2.0–3.0 g/g. The only change in the pH of the incubation media—a slight decrease—was caused by the release of the modifiers into the tested liquids. Subsequently, it was demonstrated that as the amount of the photoinitiator (2-hydroxy-2-methylpropiophenone) increased, the percentage elongation decreased, and the tensile strength increased. The content of the photoinitiator in the hydrogels also influenced their wettability. All samples showed hydrophilicity; the more photoinitiator in the hydrogel structure, the lower wetting angle for water. Moreover, the greater the amount of 2-hydroxy-2-methylpropiophenone, the smoother and more homogeneous the hydrogel surface; thus, considering the demonstrated physicochemical properties of developed materials, they seem to show application potential for more advanced research regarding the development of innovative dressing materials.
1. Introduction
Hydrogels belong to the group of polymers which may be obtained via photopolymerization; therefore, the process starts from the UV-initiated decomposition of the photoinitiator [1]. It has been shown that the amount of the photoinitiator used during the materials’ synthesis affects their properties [2]. The concentration of this reagent affects the polymerization rate, and thus, the crosslinking degree of the final material; this affects its mechanical or swelling properties [3,4]. Hong et al. demonstrated that the photoinitiator concentration influenced the hydrogels’ degradation rate [5]. In turn, Nasir et al. showed the significant impact that the amount of photoinitiator has on the electro-optical properties of UV-polymerized materials [6]. The impact of the photoinitiator on the materials’ sorption capacity was demonstrated by Bertolo et al. [7].
In addition to the amount of photoinitiator, hydrogel properties may also have an impact on the various modifiers that are introduced into its matrix. Depending on the potential application of the materials being developed, a modifier is selected to enhance the hydrogels with specific properties (therapeutic ones). One substance with promising characteristics, which may be used as modifying agent for the hydrogels that are being considered for applications in medicine, is Aloe vera [8,9]. For example, Praseetha et al. concluded that the combination of carbon quantum dots with Aloe vera gel leads to the preparation of a material that is conducive to chronic wound treatment. This is due to the presence of an additive, which is of plant origin. The additive consists of, inter alia, aloin, acemannan, and Aloe-emodin; these compounds bestow Aloe vera with antimicrobial and anti-inflammatory properties [10,11]. In turn, Cherukuri et al. demonstrated that Aloe vera gel, combined with dexibuprofen, formed emulgel; this bestows Aloe vera with adequate spreadability, viscosity, bioadhesive strength, and importantly, excellent anti-inflammatory properties, meaning that it has great potential for treating local inflammations and pain treatments [12]. Next, Sharifi et al. concluded that Aloe vera gel creates appropriate conditions that are conducive to the wound regeneration processes. During the investigations they showed that the composite Aloe vera gel, containing bone marrow-derived mesenchymal stem cells (BMSCs), promoted healing processes; this was due to the increase in the wound closure rate, stimulation of the angiogenesis process, and the formation of the tissue. Such results have been obtained due to the synergistic effect of Aloe vera gel and BMSCs [13]. Murugesan et al. demonstrated, in turn, that Aloe vera gel contains compounds showing anticancer activity [14]. In other publications, it was also demonstrated that nanoemulsion gels that are based on Aloe vera demonstrated antibacterial properties towards both gram-negative and gram-positive bacteria, anti-inflammatory properties, and importantly, they stimulated the synthesis of collagen [15].
Other modifiers contained in the composites, that were designed for biomedical purposes and which increase the number of their potential applications, are vitamins. For example, Nasef et al. developed composite membranes consisting of, inter alia, vitamin E; indeed, the membranes showed valuable properties with regard to their application as dressings [16]. Next, Guler et al. carried out investigations on composite nanofibers containing, inter alia, vitamin K2 and vitamin D3. They demonstrated that the vitamins present in tested nanofibers caused these materials to stimulate the mesenchymal stem cells for osteogenic differentiation; thus, nanomaterials designed in such a manner showed potential for use in bone tissue regeneration [17]. There is growing interest in using vitamin C during the preparation of biomaterials. For example, Hussain et al. demonstrated that hybrid composites containing vitamin C, among other compounds, in tissue regenerative medicine (as artificial cartilages) have great application potential [18].
In this article, both Aloe vera juice and ascorbic acid (vitamin C) were applied as modifiers of hydrogels which used polyvinylpyrrolidone (PVP) as a base. The materials were obtained via the waste-free and low-energy photopolymerization process. The main aim of this research was to verify the influence of 2-hydroxy-2-methylpropiophenone (photoinitiator) content on the physicochemical properties of hydrogels, as well as on their surface morphology. The impact of the photoinitiator on the hydrogels’ properties was verified in our previous work [19]; however, as part of this current work, the materials were prepared using polyvinylpyrrolidone with Mn = 10,000 g/mol (not 58,000 g/mol as in our previous work), and they have been investigated. The experimental part of this presented work included characterizing the hydrogels’ swelling capacity, wettability, and mechanical properties (the tensile strength and the percentage of elongation). Additionally, hydrogel materials were exposed to simulated body fluids in order to check whether such environments affect their chemical structures (via FT-IR spectroscopy). Finally, the hydrogels’ surface morphology was imaged using scanning electron microscopy (SEM) and digital microscopy.
2. Materials and Methods
2.1. Materials
Reagents such as polyvinylpyrrolidone (the base component of the hydrogel matrix, PVP, Mn = 10,000 g/mol, powder), diacrylate poly (ethylene glycol) (PEGDA, crosslinker, Mn = 700 g/mol), 2-hydroxy-2-methylpropiophenone (photoinitiator, 97%), as well as vitamin C (L-ascorbic acid, modifying agent, ≥99%, ACS reagent), were purchased from Sigma Aldrich (Saint Louis, MO, USA). The second modifier of the hydrogel matrix—Aloe vera juice (99.5%; thick and viscous liquid extracted from the Aloe vera leaves)—was purchased from Herbal Pharmaceutics (Krakow, Poland).
2.2. Synthesis of Hydrogels via the Photopolymerization Process
In order to obtain hydrogel materials, a photopolymerization process was applied. Firstly, adequate amounts of all reagents (15% PVP and 5% vitamin C solutions were applied) were carefully mixed; then, they were introduced to the reaction vessel (Petri dish) and subjected to the UV radiation. The EMPITA VP-60 lamp (power 180 W, λ = 320 nm), manufactured by Famed Company (Lodz, Poland), was employed as the UV source. The reaction time was 120 s. Detailed compositions of all obtained hydrogel samples are presented in Table 1.

Table 1.
Detailed compositions of hydrogel samples.
The hydrogel samples were subsequently dried at 37 °C and investigated to check whether they showed application potential as dressing materials.
2.3. Hydrogels’ Incubation in Solutions Simulating Physiological Liquids
The first experiment included placing hydrogels in selected simulated physiological liquids (50 mL) for eight days to verify whether the immersed sample would degrade in such environments, or whether it would affect their pH. For this purpose, Ringer liquid, simulated body fluid (SBF), 1% hemoglobin solution, and distilled water (reference liquid) were used. During the incubation, the temperature and the pH of the incubation media were checked; the CX-701 pH-meter (manufactured by Elmetron, Zabrze, Poland) was used for this purpose. The study was conducted at 37 °C to imitate the temperature of a human organism.
2.4. Characterization of Hydrogels’ Swelling Properties
Hydrogels are well-known for their unique ability to absorb large quantities of various liquids; thus, developed materials were also verified in this respect. Regarding the absorbed media, the same liquids in which the incubation was performed, were selected. The study involved comparing the mass of a dry sample with a swollen sample, and calculating the swelling ratio (α) using the following Equation (1):
where: α is the swelling ratio, g/g; m is the swollen hydrogel mass, g; and m0 is the dry hydrogel mass, g.
The analysis procedure occurred as follows. The dry hydrogel sample that weighed approximately 1.0 g was placed in a test liquid (50 mL) for 1 h. Then, the swollen hydrogel was removed from the absorbed liquid and its mass in the swollen state was verified. Next, the sample was introduced into the same vessel again, with the test liquid, and the same procedure was performed after 24 h and 48 h (each time, the sample was weighed and placed in the same liquid). Such a study was conducted to determine both the influence of the absorbed liquid (its composition) and the sample composition on the sorption properties of the hydrogels. The swelling in distilled water was defined as a reference measurement. Then, the obtained results were subjected to statistical analysis—for this purpose, two-way analysis of variance (ANOVA), with repetitions, was applied. The analysis allowed us to determine the influence of both the photoinitiator content in the hydrogels and the type of the swelling medium in which the study was performed to achieve the obtained results. The calculations were conducted to find the swelling ratios after swelling for 1 h; this is because after this period, the change in the samples’ masses were most noticeable. All measurements were performed in triplicate (n = 3), and the results were given in the form of an average value with a standard deviation. The value of the alpha parameter was 5%.
2.5. Analysis of the Hydrogels’ Tensile Strengths and Percentage Elongations
This analysis was carried out to determine the tensile strength, as well as the percentage elongation, under the influence of a given stress in each hydrogel sample. The research was performed in line with ISO 527-2 type 5A [20] and ISO 37 type 2 [21] standards. Firstly, the paddle-shape samples were cut via the ZCP020 manual blanking press. They were next placed within the jaws of the measuring apparatus, within which, the universal testing machine (Shimadzu, Kyoto, Japan) was used. As part of the study, the jaws of the universal testing machine moved the tested sample apart via stretching—the research was conducted until the sample ruptured. The research that was performed enabled us to characterize the tensile strength of the hydrogels using Equation (2) and their percentage elongation measurements were calculated using Equation (3):
where: is the hydrogels’ percentage elongation; is the maximum lengths of the hydrogels at the time they ruptured; is the lengths of the hydrogels before measurement; is the ultimate tensile strength (UTS); is the maximum force; is the cross-sectional area of the hydrogel sample before the analysis.
The obtained results were subjected to statistical analysis (the one-way analysis of variance (ANOVA) with repetitions). This allowed us to determine the influence of the photoinitiator content in the hydrogels on the obtained results. The alpha parameter was 5%. All measurements were performed in triplicate (n = 3), wherein the results are given in the form of an average value with a standard deviation.
2.6. Analysis of the Structure of Developed Hydrogels using Fourier Transform Infrared (FT-IR) Spectroscopy
FT-IR spectroscopy was applied to determine the presence of functional groups that are characteristic of the reagents that were included in the tested hydrogels. Importantly, this technique allowed us to check the potential influence of the hydrogels’ incubation on their structure. The analysis was carried out at an ambient temperature using the Thermo Scientific Nicolet iS5 FT-IR spectrophotometer (Thermo Fisher Scientific, Waltham, MA, USA). The FT-IR spectra were recorded within the 4000–500 cm−1 wavenumber range (32 scans, resolution 4.0 cm−1).
2.7. Studies on Hydrogels’ Wettability towards Polar and Non-Polar Liquids
These investigations were focused on defining the wettability of developed hydrogels as well as their surface free energy. The study was performed using the following optical contact angle measuring instrument: Drop Shape Analyzer Kruss DSA100M (Gmbh, Hamburg, Germany). The detailed procedure of the study, the conditions, as well the methodology for determining the surface free energies, were described in detail in a previous publication [22]. Briefly, hydrogel samples (diameter: 1 cm) were first dried at 40 °C; the moisture was then analyzed until the samples reached a constant weight. Next, dried samples were placed on the measuring table so that a drop of tested liquid could fall on the flattest area of the sample. The wetting angle was recorded and measured after achieving equilibrium with a drop of measuring liquid. In order to calculate the surface free energy, the Owens–Wendt method was employed [23]. The study was carried out eightfold for each hydrogel sample at an ambient temperature.
2.8. Characterization of Hydrogels’ Morphologies Using the SEM Technique
The surface morphology of hydrogel samples was calculated via scanning electron microscopy. First, dry samples were subjected to sputtering with gold. Then, the study was conducted at an ambient temperature using the Jeol 5510LV scanning electron microscope (Jeol Ltd., Tokyo, Japan).
2.9. Analysis of the Morphology and Roughness of Hydrogels Using Digital Microscopy
The morphology of hydrogels and their roughness were additionally calculated using the VHX-7000 digital microscope(Keyence International, Mechelen, Belgium). Importantly, this microscope is equipped with a high-performance camera that allows for imaging at high resolutions (4000 × 3000 pixels). In turn, its 4K CMOC sensor made it possible to perform 3D measurements, which enabled the roughness profile of each tested hydrogel sample to be obtained.
The results of the analysis were examined using images from the microscope. Importantly, the parameters and were determined in line with the ISO 4287:1997 standard [24], using VHX-7000 software (VHX-7000_970F version, Keyence Corporation, Osaka, Japan), Equation (4) for and Equation (5) for , as given below:
where: is the arithmetic average roughness (the average of the absolute value along the sampling length); and is the sampling length.
where: is the sum of the largest pit depth value and the largest peak height value within the tested area; is the height of the highest peak within the tested area; and is the absolute value of the height of the largest pit within the tested area.
3. Results and Discussion
3.1. Results of the Incubation Studies
Results of the incubation of hydrogels are presented in Figure 1, Figure 2, Figure 3 and Figure 4. The studies included the measurements of the pH and the temperature (samples were incubated at 37 °C; then, they were taken from the laboratory incubator for to perform measurements, and thus, the temperature on the presented graphs is lower than 37 °C) of the incubation liquids. These measurements were performed every two days during the eight day incubation period (thus, they were taken on the second, fourth, sixth, and eighth day of the incubation period). Importantly, the study was performed in triplicate, and the results are shown in the form of the average value standard deviation (SD).
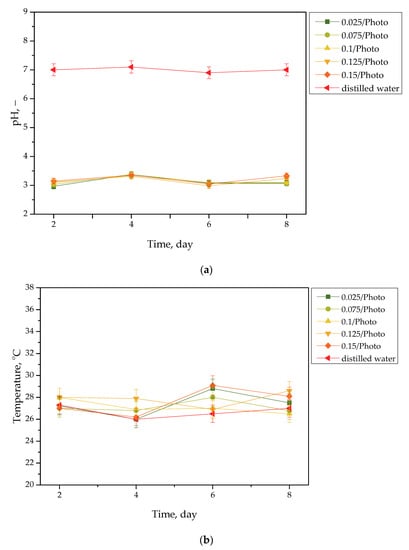
Figure 1.
pH (a) and temperature (b) values of distilled water, measured during the hydrogels’ incubation period (n = 3, n—number of repetitions).
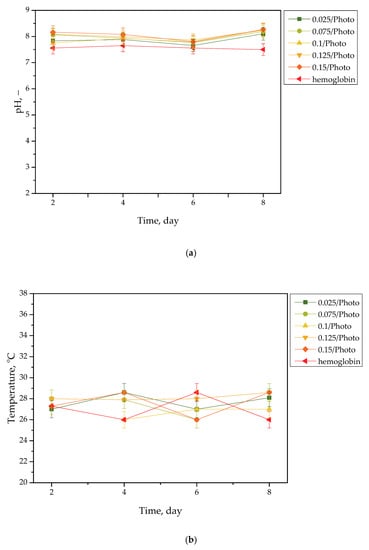
Figure 2.
pH (a) and temperature (b) values of hemoglobin, measured during the hydrogels’ incubation period (n = 3, n—number of repetitions).
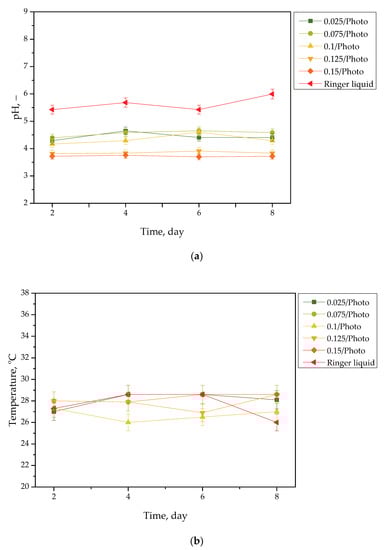
Figure 3.
pH (a) and temperature (b) values of Ringer liquid, measured during the hydrogels’ incubation period (n = 3, n—number of repetitions).
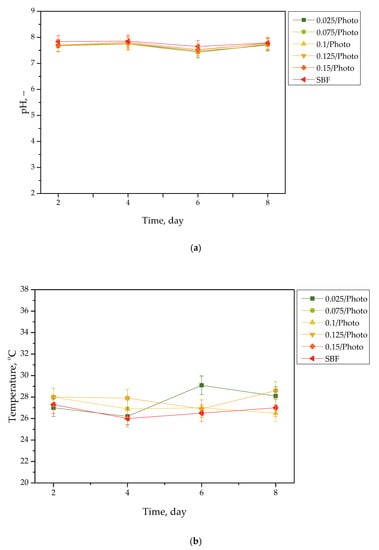
Figure 4.
pH (a) and temperature (b) values of SBF, measured during the hydrogels’ incubation period (n = 3, n—number of repetitions).
Incubation studies aimed at verifying the interactions between the given simulated physiological liquid and the incubated sample were carried out. Determining the stability of hydrogel in selected environments, as well as its potential degradation, may provide information concerning its future applications. For example, it will be possible to understand when the analyzed sample is stable in a given liquid, and thus, when it does not degrade; such results may then be reported. Considering the abovementioned results, it may be concluded that tested samples were stable in all the tested incubation media. In the case of all tested liquids, the differences between their pH values were determined during their individual measurements over the course of the study, and it was found that they only differed slightly from each other. Regarding the distilled water, the pH values that were determined during the study varied within the approximate range of 3.0–3.4. The acidic pH of the distilled water containing the incubated hydrogel samples is likely due to the release of their interior modifiers; in this instance, vitamin C and Aloe vera juice. A decreased pH was also observed in the case of Ringer liquid, compared with the pH of the liquid without a hydrogel sample. The pH of Ringer liquid is approximately 5.4, whereas the pH of this liquid with immersed hydrogel samples decreased to 3.7. This may also be related to the release of the aforementioned modifiers from hydrogel matrices. Nonetheless, the difference between the pH value of Ringer liquid and the liquid with tested hydrogels is not as significant as the difference between Ringer liquid and distilled water (pH of this liquid is approximately 7.0, whereas the incubation of samples resulted in a decrease in pH to 3.0, as previously described). Such a reduced difference is due to the composition of Ringer liquid. Ions included in this medium interact with functional groups of the hydrogel polymer network, thus increasing the degree to which it crosslinks. As a result, a less intense penetration of liquid into such a material takes place, which, in turn, translates into a less intense release of additives from the hydrogel into the incubation medium; therefore, a decline in its pH is reported for distilled water.
Importantly, the impact of the hydrogel samples incubated both in SBF and hemoglobin on the pH values of these liquids is lower than for Ringer liquid and distilled water. This is due to the complex composition of these liquids (i.e., numerous ions included in SBF and four protein chains of hemoglobin, which may interact with hydrogel matrices and also increase the degree to which they crosslink to a greater extent, as in the case of two other liquids); thus, the release of vitamin C and Aloe vera juice may be strongly limited in such environment. This translates into slight (in the case of hemoglobin) or practically unnoticeable changes in the pH of liquids with hydrogel samples, compared with the pH of liquids without any samples. Importantly, it should be added that any dependence between the photoinitiator content in hydrogels and the results of incubation studies has not been reported.
Slight changes in the pH of the incubation liquids may indicate that the tested hydrogels have a high stability in these environments. Rapid pH changes could testify to the rapidly progressive degradation of hydrogels, which, in turn, could be caused by errors occurring during the crosslinking process; therefore, the lack of such changes confirms that the tested materials were properly crosslinked, that they showed stability in tested environments, and that their degradation did not take place. These conclusions, in turn, may indicate that these materials may be considered for further, more advanced studies with regard to their application as stable dressing materials.
3.2. Results of Studies on the Sorption Properties of Hydrogels
The results of the swelling studies are presented in Figure 5. The results of the performed statistical analysis are presented in Table 2.
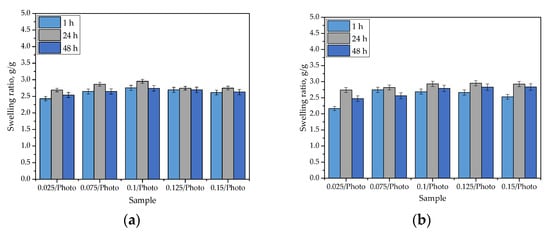
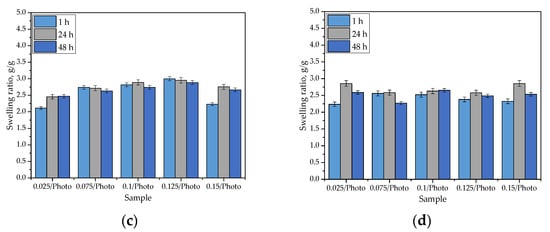
Figure 5.
Sorption capacity of hydrogels in distilled water (a); SBF (b); Ringer liquid (c); and hemoglobin (d). (The study was performed in triplicate, n = 3).
Table 2.
Results of the statistical calculations via the ANOVA method.
The swelling of hydrogels is caused by the presence of hydrophilic functional groups in the polymer network. When water molecules penetrate the hydrogel, they interact with the mentioned groups via hydrogen bonds. Next, other water molecules interact with water molecules that are already interacting with the polymer chains. As a consequence of these phenomena, when a hydrogel sample is placed in a given liquid, it swells, and its mass increases. As can be observed in Figure 5, the hydrogels exhibited swelling properties in every investigated liquid. The swelling ratios calculated for all samples varied within an approximate range of 2.0–3.0 g/g. Importantly, the tested hydrogels differed in terms of the amount of 2-hydroxy-2-methyopropiophenone (photoinitiator) used in their synthesis. Nonetheless, any dependance between the amount of this reagent and the swelling properties of hydrogels has not been observed. Moreover, it may be argued that the highest values were calculated for samples tested in distilled water, but the differences between them and the swelling ratios determined in other liquids are very slight. This may be related to the compositions of the tested liquids. Both SBF and Ringer liquid contain numerous ions (e.g., Ca2+, Na+, or K+) which may interact with ions in polymer networks that are formed via the dissociation of its groups (e.g., COO- ion is obtained as a consequence of the dissociation occurring in the -COOH group). Then, additional crosslinks between polymer chains (e.g., as a result of the reaction of calcium ion with two neighboring COO- ions) are formed. This, in turn, leads to an increase in terms of the degree of crosslinking that occurs in the polymer network, and simultaneously, it leads to a decrease in the number of free spaces between polymer chains that might be available for absorbed liquids. The decrease in hydrogel swelling, as a result of an increase in the degree of crosslinking that occurred, was also observed by Khan and Ranjha [25] and Khalid et al. [26].
The swelling ability of hydrogels is substantial, which must be considered for their potential uses; for example, as dressings. Sorption of a wound that is exudating, using such a dressing, would provide an adequate environment for healing processes thus promoting wound healing processes; therefore, the sorption properties of the hydrogels are advantageous in this regard.
3.3. Results of the Mechanical Investigations
The performed investigations also involved the mechanical characterization of hydrogels via a process that verified their tensile strength and percentage elongation. Results of the experiments are provided in Figure 6, and the results of the statistical analysis are given in Table 3.
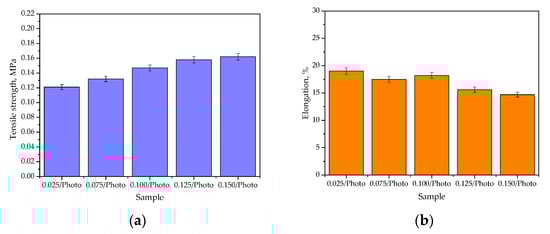
Figure 6.
The percentage elongation (a) and the tensile strength (b) of hydrogels (the study was performed in triplicate, n = 3).
Table 3.
Results of the statistical calculations, calculated using the ANOVA method.
It may be argued that the photoinitiator content in the hydrogel materials influenced both their tensile strength and percentage elongation. It may be observed that as the amount of this reagent in the polymer matrix increased, the tensile strength of the hydrogels also increased. The photoinitiator (here: 2-hydroxy-2-methylpropiophenone) initiates the polymerization process via the UV-induced decomposition of free radicals. The greater the amount of this reagent in the reaction mixture, the more places in which the photopolymerization process is initiated; thus, the formed polymer network consists of many short, crosslinked polymer chains. As a result, such a structure is more compact compared with the material obtained using the same reagents and a lower amount of photoinitiator. This is a reason for the increased tensile strength of hydrogels obtained using an increased amount of 2-hydroxy-2-methylpropiophenone. In turn, the more compact structure of hydrogels translates into lower percentage elongation under the tension applied (which may be visible in Figure 4b). As the amount of photoinitiator increased, the percentage elongation generally decreased. The use of 0.150 mL of 2-hydroxy-2-methylpropiophenone and 3.0 mL of the crosslinker led to the synthesis of the hydrogel with a structure that provided the highest tensile strength (0.162 MPa) and the lowest percentage elongation (14.7%) among all the investigated samples. In turn, the highest percentage elongation—19.0%—was reported for the hydrogel containing the lowest amount of the photoinitiator. The percentage elongation within the range of 14.7%–19.0% may indicate the elasticity of the developed materials, which is favorable considering their potential use for specific uses, such as dressings. The application of dressings in sites which are difficult to access, or ones with high mobility, often make them difficult to maintain in the application site; therefore, their appropriate flexibility, and their ability to stretch and adjust to the patient’s body and wound, may significantly increase the comfort of the patient using them. A percentage elongation of up to 30% was also previously reported by Jantrawut et al., who also indicated the application potential of such materials for biomedical purposes [27]. Of course, before discussing the application of developed materials, such as dressings, they should be subjected to other, more advanced studies (including biological ones); however, during the discussion on the results of studies that are aimed at determining the hydrogels’ basic properties (such as swelling or mechanical properties), attention was also paid to evaluating hydrogels in relation to this specific application—such as dressing materials.
3.4. Analysis of the Hydrogels Using FT-IR Spectroscopy
FT-IR spectroscopy allowed us to determine the presence of characteristic functional groups within the hydrogels’ structure, as well as to check whether the incubation affected hydrogels’ structure. Obtained FT-IR spectra are shown below in Figure 7.
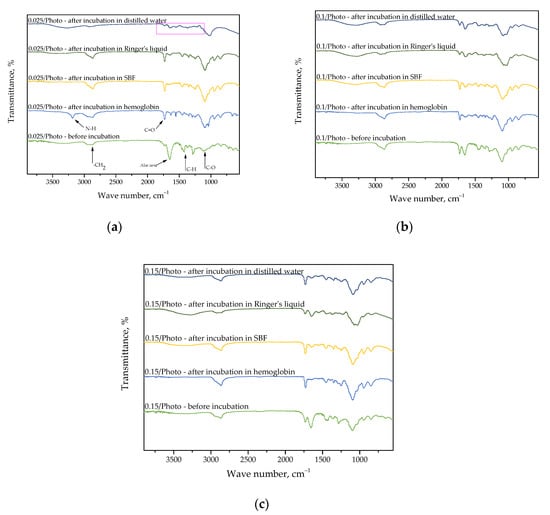
Figure 7.
FT-IR spectra of sample 0.025/Photo (a); 0.100/Photo (b); and 0.150/Photo (c), before and after incubation.
FT-IR spectroscopy was employed to analyze dry hydrogels which were previously subjected to incubation. Moreover, research was also performed for samples directly after synthesis for comparison. This comparison was carried out in order to verify potential changes occurring within their structures as a result of incubation; for example, the disappearance of particular absorption bands on the FT-IR spectra can give information pertaining to the degradation of samples in tested environments, or on the release of the modifier (e.g., Aloe vera juice or vitamin C) from the hydrogel matrix. Moreover, it should be noted that the appearance of additional absorption bands on the FT-IR spectra of samples after incubation may indicate that the abovementioned additives have been released from the polymer, or the appearance of a modifier on the surface of a polymer matrix may also indicate that additives have been released. The process of the release of the modifier from the polymer material occurs in a given liquid, and this occurs because the components of this liquid interact with the polymer chains of the analyzed material, meaning that they become looser. Finally, the modifier is released between the loose chains. This phenomenon was observed in samples wherein Aloe vera juice was released. On all obtained FT-IR spectra, only the band at 1732 cm−1, which was derived from the C=O group, may be noticed. This group is characteristic for the polysaccharides contained in the Aloe vera juice. Other bands correspond with the functional groups of the compounds, thus forming the polymer matrix; therefore, PVP is both the crosslinking agent and photoinitiator (these characteristic bands have been marked in Figure 5a).
Importantly, it may also be noted that in the case of the FT-IR spectrum in sample 0.025/Photo, which was incubated in distilled water (Figure 5a), a lower absorption band intensity, or even their total disappearance, may be reported. This indicates the likely occurrence of hydrogel degradation in this environment. Sample 0.025/Photo was obtained by using the lowest amount of the photoinitiator compared with the other samples; thus, its structure was likely insufficiently crosslinked, and therefore, insufficiently compact and stable in this incubation medium. In the rest of the tested media, such degradation did not take place. This may be caused by the composition of SBF, Ringer liquid, and hemoglobin, in which many components are able to react with the polymer matrix.
3.5. Investigations on Hydrogels’ Wettability
Studies on hydrogels’ wettability involved determining their contact angles in a polar liquid (water) and non-polar liquid (diiodomethane). Moreover, the surface free energy values were also calculated. The values of the wetting angles of the tested samples for both of the tested liquids and the surface free energy values are shown in Table 4. All data are given as average values of eight measurements standard deviation (SD). The images showing the drop of water on the hydrogels’ surfaces are presented in Figure 8.
Table 4.
Parameters determined during the wettability analysis (given as a mean value standard deviation (SD).
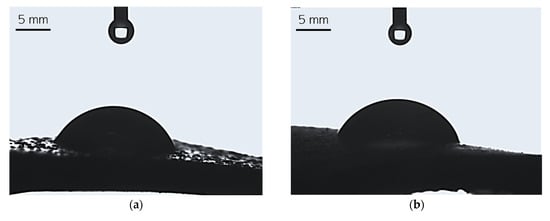
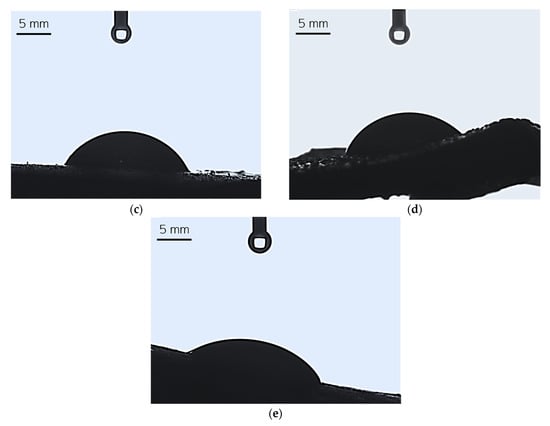
Figure 8.
Images showing the wettability of sample 0.025/Photo (a), 0.075/Photo (b), 0.100/Photo (c), 0.125/Photo (d), and 0.150/Photo (e).
A high affinity for water indicates the hydrophilicity of a surface of a given material; this is the case if the wetting angle values are below 90° [28]. For all tested hydrogels, the wetting angle values were within the range of 59.60°–69.84°; therefore, it may be argued that all hydrogels demonstrated hydrophilicity. Importantly, as the photoinitiator content in the hydrogels increased, the hydrophilicity of the sample increased (the contact angle for water decreased). There are likely to be two reasons for this phenomenon. Considering the structure of the reagent—in this case, the reagent was the photoinitiator and its quantity varied between the analyzed samples—we may note that this compound contains a hydroxyl group with a hydrophilic nature within its structure. This group, in turn, is able to interact with water molecules via hydrogen bonds, and this may result in the more intensive spreading of a water droplet on the material’s surface. On the other hand, the greater the amount of photoinitiator, the greater the number of sites in the reaction mixture wherein the photopolymerization process is initiated. As a result, the obtained hydrogel network consists of many short polymer chains forming at the same time, culminating in the production of a material with a smooth surface upon which a drop of water spreads easily.
3.6. Results of the Hydrogels’ SEM Imaging
SEM images of the hydrogels are presented below in Figure 9.
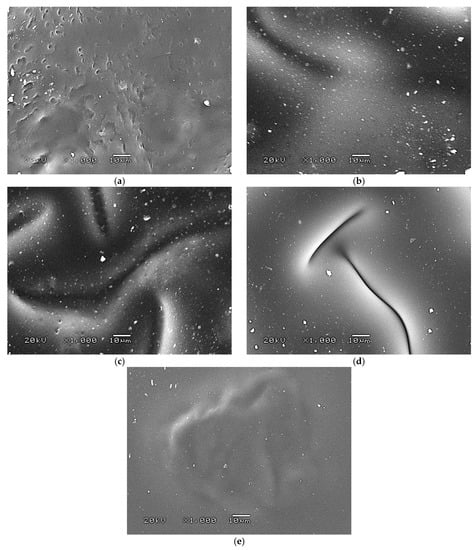
Figure 9.
SEM image of sample 0.025/Photo (a), 0.075/Photo (b), 0.100/Photo (c), 0.125/Photo (d), and 0.150/Photo (e).
As is evident from the SEM images above, as the amount of photoinitiator contained in the structure of the hydrogel increased, the smoother and more homogeneous the surface of the polymer became. The photoinitiator is responsible for initiating the reaction of photopolymerization, leading to the preparation of hydrogels. The greater the amount of this compound in the reaction mixture, the greater the number of places where photopolymerization is initiated; thus, if photopolymerization occurs in more places, more short polymer chains that are close to each other can emerge within the obtained polymer structure. As a result, such prepared materials have a very compact structure and smooth surfaces.
3.7. Characterization of the Hydrogels’ Morhology and Roughness via Digital Microscopy
The 3D view of the tested hydrogels, as well as their roughness profiles, are shown below in Figure 10, Figure 11, Figure 12, Figure 13 and Figure 14. The parameters determined during the analysis of the hydrogels’ roughnesses are presented in Table 5.
Figure 10.
A 3D view of the roughness profile of sample 0.025/Photo.
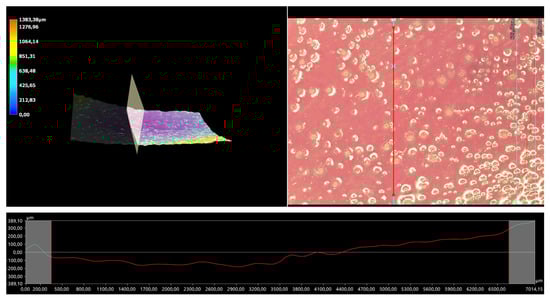
Figure 11.
A 3D view of the roughness profile of sample 0.075/Photo.
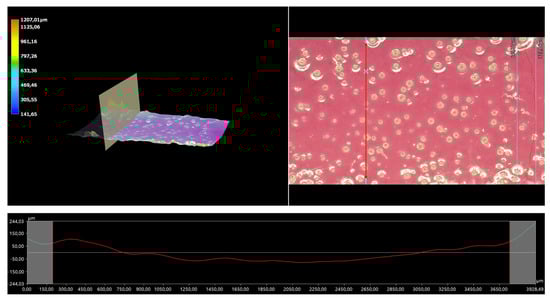
Figure 12.
A 3D view of the roughness profile of sample 0.100/Photo.
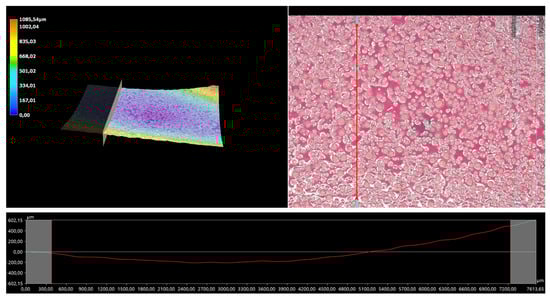
Figure 13.
A 3D view of the roughness profile of sample 0.125/Photo.
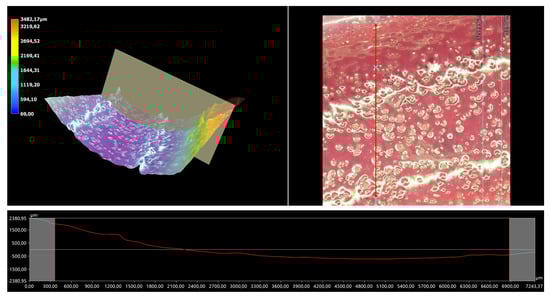
Figure 14.
A 3D view of the roughness profile of sample 0.150/Photo.
Table 5.
The roughness parameters of hydrogels.
The surface properties of the materials intended for biomedical purposes are very important because the surface of the biomaterial is in direct contact with the host tissue. The reaction of the cells to the surface of the hydrogel varies depending on such parameters; for instance, roughness. Cellular experiments confirmed that cell adhesion and their subsequent proliferation is better on rough surfaces [29]. The performed analysis allowed us to obtain a 3D view of the hydrogels, as well to verify their surface roughness profiles and determine selected roughness parameters, including the arithmetic mean height of the surface and maximum height of the surface; thus, it may be reported that all hydrogels displayed relatively rough surfaces. Considering the roughness profiles of the hydrogels, it may be observed that for sample 0.025/Photo, the clear surface undulation is visible; however, as the photoinitiator content increased, the lines presenting the roughness profiles became increasingly smoother. Indeed, in the case of sample 0.150/Photo, the smoothest line is visible; therefore, it has the highest photoinitiator content. Importantly, the clear “artifacts” on the hydrogels’ surfaces may be also observed, but these are likely to be the air bubbles that are present within the analyzed materials (as a result of the fact that the reaction mixtures were intensively mixed before being placed within the UV radiation source), rather than the unevenness.
4. Conclusions
- Most of the hydrogels showed stability in simulated physiological liquids. The only hydrogel which slightly degraded in one liquid (distilled water) was the sample obtained using the lowest amount of the photoinitiator. This was probably due to an insufficient degree of crosslinking.
- All hydrogels exhibited swelling properties in simulated physiological liquids—their swelling ratios were within the range of 2.0–3.0 g. The highest level of sorption was reported in distilled water, which was caused by the lack of ions in this medium; this might have caused the increase in the degree of crosslinking in hydrogels.
- As the amount of photoinitiator in the structure of tested hydrogel increased, the percentage elongation also increased, and the tensile strength of such hydrogels decreased.
- All of the hydrogels displayed hydrophilicity. Importantly, as the amount of photoinitiator increased in the structure of the tested hydrogel, the hydrophilicity (the lower wetting angle) also increased.
- As the photoinitiator in the structure of tested hydrogel increased, the surface morphology of the hydrogel became smoother and more homogeneous.
- The presented synthesis methodology allowed us to prepare materials of various shapes and sizes, without the need for further processing. Furthermore, there were no by-products that emerged from a reaction time of only 120 s. Developed materials showed relatively high roughness and surface hydrophilicity levels, which may additionally promote cell proliferation and support regeneration processes. Due to the demonstrated physicochemical properties of hydrogels, these materials may be subjected to further, more advanced studies verifying their biocompatibility and other characteristics, thus enabling them to be useful for biomedical applications (e.g., as dressing materials).
Author Contributions
Conceptualization, M.J. and S.K.-K.; methodology, M.J. and S.K.-K.; software, M.J.; validation, A.D. and M.B.; formal analysis, M.J., S.K.-K., A.D. and M.B.; investigation, M.J., S.K.-K., A.D. and M.B.; resources, M.J., S.K.-K., A.D. and M.B.; data curation, M.J., S.K.-K., A.D. and M.B.; writing—original draft preparation, M.J., S.K.-K., A.D. and M.B.; writing—review and editing, M.J., S.K.-K., A.D. and M.B.; visualization, J.W., M.K. and P.P.; supervision, M.K.; project administration, S.K.-K., A.D. and M.B.; funding acquisition, M.K. and P.P. All authors have read and agreed to the published version of the manuscript.
Funding
This research received no external funding.
Institutional Review Board Statement
Not applicable.
Informed Consent Statement
Not applicable.
Data Availability Statement
Not applicable.
Conflicts of Interest
The authors declare no conflict of interest.
References
- Xu, L.; Sheybani, N.; Yeudall, W.A.; Yang, H. The effect of photoinitiators on intracellular AKT signaling pathway in tissue engineering application. Biomate. Sci. 2015, 3, 250–255. [Google Scholar] [CrossRef] [PubMed]
- Choi, J.R.; Yong, K.W.; Choi, J.Y.; Cowie, A.C. Recent advances in photo-crosslinkable hydrogels for biomedical applications. Biotechniques 2019, 66, 40–53. [Google Scholar] [CrossRef]
- Emami, N.; Soderholm, K.J. Influence of light-curing procedures and photo-initiator/co-initiator composition on the degree of conversion of light-curing resins. J. Mater. Sci. Mater. Med. 2005, 16, 47–52. [Google Scholar] [CrossRef]
- Ferracane, J.L. Hygroscopic and hydrolytic effects in dental polymer networks. Dent. Mater. 2006, 22, 211–222. [Google Scholar] [CrossRef]
- Hong, B.M.; Park, S.A.; Park, W.H. Effect of photoinitiator on chain degradation of hyaluronic acid. Biomater. Res. 2019, 23, 21. [Google Scholar] [CrossRef] [PubMed]
- Nasir, N.; Kumar, S.; Kim, M.; Nguyen, V.H.; Suleman, M.; Park, H.M.; Lee, S.; Kang, D.; Seo, Y. Effect of the Photoinitiator Concentration on the Electro-optical Properties of Thiol–Acrylate-Based PDLC Smart Windows. ACS Appl. Energy Mater. 2022, 5, 6986–6995. [Google Scholar] [CrossRef]
- Bertolo, M.V.L.; Moraes, R.C.M.; Pfeifer, C.; Salgado, V.E.; Correr, A.R.C.; Schneider, L.F.J. Influence of Photoinitiator System on Physical-Chemical Properties of Experimental Self-Adhesive Composites. Braz. Dent. J. 2017, 28, 35–39. [Google Scholar] [CrossRef]
- Salehi, B.; Albayrak, S.; Antolak, H.; Kręgiel, D.; Pawlikowska, E.; Sharifi-Rad, M.; Uprety, Y.; Tsouh Fokou, P.V.; Yousef, Z.; Amiruddin Zakaria, Z.; et al. Aloe Genus Plants: From Farm to Food Applications and Phytopharmacotherapy. Int. J. Mol. Sci. 2018, 19, 2843. [Google Scholar] [CrossRef]
- Darzi, S.; Paul, K.; Leitan, S.; Werkmeister, J.A.; Mukherjee, S. Immunobiology and Application of Aloe vera-Based Scaffolds in Tissue Engineering. Int. J. Mol. Sci. 2021, 22, 1708. [Google Scholar] [CrossRef]
- Praseetha, P.K.; Nijam, M.A.; Vibala, B.V.; Sreedevy, K.; Vijayakumar, S. Aloe-vera conjugated natural Carbon Quantum dots as Bio-enhancers to accelerate the repair of chronic wounds. Ind. Crops Prod. 2021, 174, 114152. [Google Scholar]
- Kung, J.C.; Tseng, I.T.; Chien, C.S.; Lin, S.H.; Wang, C.C.; Shih, C.J. Microwave assisted synthesis of negative-charge carbon dots with potential antibacterial activity against multi-drug resistant bacteria. RSC Adv. 2020, 10, 41202–41208. [Google Scholar] [CrossRef] [PubMed]
- Cherukuri, S.; Thiruppathi, M.; Vuppalapati, L. Formulation and optimization of novel dexibuprofen- Aloe vera deformable emulgels for enhanced anti-inflammatory activity. J. Drug Deliv. Sci. Technol. 2022, 69, 103171. [Google Scholar] [CrossRef]
- Sharifi, E.; Chehelgerdi, M.; Fatahian-Kelishadrokhi, A.; Yazdani-Nafchi, F.; Ashrafi-Dehkordi, K. Comparison of therapeutic effects of encapsulated Mesenchymal stem cells in Aloe vera gel and Chitosan-based gel in healing of grade-II burn injuries. Regen. Ther. 2021, 18, 30–37. [Google Scholar] [CrossRef] [PubMed]
- Murugesan, M.P.; Ratnam, M.V.; Mengitsu, Y.; Kandasamy, K. Evaluation of anti-cancer activity of phytosomes formulated from Aloe vera extract. Mater. Today: Proc. 2021, 42, 631–636. [Google Scholar] [CrossRef]
- Valizadeh, A.; Darvishi, M.H.; Amani, A.; Zarchi, A.A.K. Design and development of novel formulation of Aloe Vera nanoemulsion gel contained erythromycin for topical antibacterial therapy: In vitro and in vivo assessment. J. Drug Deliv. Sci. Technol. 2022, 74, 103519. [Google Scholar] [CrossRef]
- Nasef, S.M.; Khozemy, E.E.; Kamoun, E.A.; El-Gendi, H. Gamma radiation-induced crosslinked composite membranes based on polyvinyl alcohol/chitosan/AgNO3/vitamin E for biomedical applications. Int. J. Biol. Macromol. 2019, 137, 878–885. [Google Scholar] [CrossRef]
- Guler, E.; Baripoglu, Y.E.; Alenezi, H.; Arikan, A.; Babazade, R.; Unal, S.; Duruksu, G.; Alfares, F.S.; Yazir, Y.; Oktar, F.N.; et al. Vitamin D3/vitamin K2/magnesium-loaded polylactic acid/tricalcium phosphate/polycaprolactone composite nanofibers demonstrated osteoinductive effect by increasing Runx2 via Wnt/β-catenin pathway. Int. J. Biol. Macromol. 2021, 190, 244–258. [Google Scholar] [CrossRef]
- Hussain, O.; Ahmad, B.; Saleem, S. Tribological performance of biomedical grade UHMWPE/nano-Al2O3/Vitamin-C hybrid composite for cartilage replacements. Mater. Lett. 2021, 291, 129515. [Google Scholar] [CrossRef]
- Kędzierska, M.; Bańkosz, M.; Potemski, P. Studies on the Impact of the Photoinitiator Amount Used during the PVP-Based Hydrogels’ Synthesis on Their Physicochemical Properties. Materials 2022, 15, 6089. [Google Scholar] [CrossRef]
- ISO 527-2:2012; Tensile Properties of Plastics—Determination of Tensile Properties—Part 2: Test Conditions for Moulding and Extrusion Plastics. ISO/TC 61/SC 2 Mechanical behavior. Technical Committee: Geneva, Switzerland, 2012.
- ISO 37:2017; Rubber, Vulcanized or Thermoplastic—Determination of Tensile Stress-Strain Properties. ISO/TC 45/SC 2 Testing and Analysis. Technical Committee: Geneva, Switzerland, 2017.
- Kudłacik-Kramarczyk, S.; Głąb, M.; Drabczyk, A.; Kordyka, A.; Godzierz, M.; Wróbel, P.S.; Krzan, M.; Uthayakumar, M.; Kędzierska, M.; Tyliszczak, B. Physicochemical Characteristics of Chitosan-Based Hydrogels Containing Albumin Particles and Aloe vera Juice as Transdermal Systems Functionalized in the Viewpoint of Potential Biomedical Applications. Materials 2021, 14, 5832. [Google Scholar] [CrossRef]
- Owens, D.K.; Wendt, R.C. Estimation of the surface free energy of polymers. J. Appl. Polym. Sci. 1969, 13, 1741–1747. [Google Scholar] [CrossRef]
- ISO-4287:1997; Geometrical Product Specifications (GPS)—Surface Texture: Profile Method—Terms, Definitions and Surface Texture Parameters. ISO/TC 213 Dimensional and Geometrical Product Specifications and Verification: Geneva, Switzerland, 1997.
- Khan, S.; Ranjha, N.M. Effect of degree of cross-linking on swelling and on drug release of low viscous chitosan/poly(vinyl alcohol) hydrogels. Polym. Bull. 2014, 71, 2133–2158. [Google Scholar] [CrossRef]
- Khalid, S.H.; Qadir, M.I.; Massud, A.; Ali, M.; Rasool, M.H. Effect of degree of cross-linking on swelling and drug release behaviour of poly(methyl methacrylate-co-itaconic acid) [P(MMA/IA)] hydrogels for site specific drug delivery. J. Drug Del. Sci. Tech. 2009, 19, 413–418. [Google Scholar] [CrossRef]
- Jantrawut, P.; Bunrueangtha, J.; Suerthong, J.; Kantrong, N. Fabrication and Characterization of Low Methoxyl Pectin/Gelatin/Carboxymethyl Cellulose Absorbent Hydrogel Film for Wound Dressing Applications. Materials 2019, 12, 1628. [Google Scholar] [CrossRef] [PubMed]
- Law, K.Y. Water–surface interactions and definitions for hydrophilicity, hydrophobicity and superhydrophobicity. Pure Appl. Chem. 2015, 87, 759–765. [Google Scholar]
- Rosqvist, E.; Niemela, E.; Venu, A.P.; Kummala, R.; Ihalainen, P.; Toivakka, M.; Eriksson, J.; Peltonen, J. Human Dermal Fibroblast proliferation controlled by surface roughness of two-component nanostructured latex polymer coatings. Colloids Surf. B Biointerfaces 2019, 174, 136–144. [Google Scholar] [CrossRef]


Disclaimer/Publisher’s Note: The statements, opinions and data contained in all publications are solely those of the individual author(s) and contributor(s) and not of MDPI and/or the editor(s). MDPI and/or the editor(s) disclaim responsibility for any injury to people or property resulting from any ideas, methods, instructions or products referred to in the content. |
© 2022 by the authors. Licensee MDPI, Basel, Switzerland. This article is an open access article distributed under the terms and conditions of the Creative Commons Attribution (CC BY) license (https://creativecommons.org/licenses/by/4.0/).