Article

Rational Analysis of Drag Reduction Variation Induced by Surface Microstructures Inspired by the Middle Section of Barchan Dunes at High Flow Velocity

1
College of Materials Science and Technology, Nanjing University of Aeronautics and Astronautics, Nanjing 210016, China
2
Key Laboratory of Icing and Anti/De-Icing, China Aerodynamics Research and Development Center, Mianyang 621000, China
3
Institute of Advanced Materials, Nanjing Tech University, Nanjing 210009, China
*
Authors to whom correspondence should be addressed.
Coatings 2022, 12(5), 563; https://doi.org/10.3390/coatings12050563
Submission received: 3 March 2022 / Revised: 7 April 2022 / Accepted: 18 April 2022 / Published: 21 April 2022
(This article belongs to the Special Issue Fluid Dynamics Applications in Coatings and Thin Films)

Abstract

:
Aerodynamic drag reduction is a key element for the design of aircrafts, and it is also considered to be affected by the flow velocity. Herein, the influence of high flow velocity on the drag reduction induced by the surface microstructure inspired by a cross-section of barchan dune was investigated by the computational fluid dynamics method in this work. Overall, the drag reduction ratio was decreased while the pressure drag and viscous resistance enhanced simultaneously with the augmentation of flow velocity. Otherwise, drag analysis revealed that the total drag was a power function of flow velocity, which meant that the effect of flow velocity on drag was extremely fierce. Additionally, the microstructure improved the thickness of the boundary layer with a growth rate of 14.2%, and then reduced the viscosity resistance with limits during the development process of flow velocity. Furthermore, the micro-vortex caused by the surface microstructure provided the reverse wall shear stress, with the maximum value ranging from −4.77 Pa to −51.27 Pa, and then reduced the velocity gradient above the microstructure, thereby improving the drag reduction. However, both Reynolds-averaged Navier-Stokes (RANS) and large eddy simulation (LES) calculations showed that the excessive velocity could lead to the dissipation of micro-vortex, which augmented the contact area between the fluid and the surface, resulting in the enlargement of viscous resistance. Finally, it was confirmed that the variation of surface microstructure height had a significant influence on drag reduction at high flow velocity. The underlying mechanism of drag reduction could also provide theoretical guidance for the design and optimization of drag reduction coatings in aeronautical applications.

Graphical Abstract

1. Introduction

With the rapid growth in the aviation industry, higher requirements for economic efficiency are raised in the aircraft manufacturing process. The windage is an important factor that affects flight energy consumption and further restricts the flight capacity. Hence, it is important to reduce windage for decreasing the fuel consumption during flight process. Previous studies have revealed that nearly half of windage is due to the viscous drag, which dominated the entire windage of the aircraft [1]. Notably, viscous drag can be further reduced by 40% with flow-control technologies, which is equal to approximately 15% of the windage [2]. With the development of drag reduction technologies, several viscous drag reduction methods have been proposed, such as the plasma method [3], periodic perturbation method [4], push-pull airflow method, [5] and separation suppression method [6]. These methods are classified as active drag reduction methods due to the requirements extra applying extra control devices and additional energy consumption, which severely limit their application in aviation industry. In contrast, passive drag reduction methods can effectually decrease viscous drag by adjusting aerodynamic layout or constructing surface texture without extra energy consumption, such as surface coatings [7,8], flexible wall methods [9], and bionic non-smooth surface [10]. In recent years, passive drag reduction technologies have attracted extensive attention due to their low energy consumption in the field of aerospace manufacturing.
In the early 1970s, bionic non-smooth surface methods were proposed and proved to be an extremely effective method for drag reduction [11]. Drag reduction experiments reveal that a non-smooth surface with a certain structure has better drag reduction ability than traditional smooth surfaces. Drag reduction ratio (RD) is usually used to evaluate drag reduction performance of non-smooth surfaces. The drag reduction rate is calculated using the following equation:
R D = F s m o o t h F n o n s m o o t h F s m o o t h
where Fnon-smooth is the drag value of a non-smooth region acquired from force report in Fluent, and Fsmooth is the drag obtained from a smooth area at the same position.
Subsequently, a turbulent drag reduction of 8% was achieved on an aluminum test plate with riblet structures inspired by the shapes of shark skin at the National Aeronautics and Space Administration (NASA) Langley Research Center [12,13]. It is worth noting that the drag-reductive ability of riblets is significantly affected by flow velocity. Relevant hydrodynamic research showed that the decreasing drag reduction effectiveness for a fixed riblet inspired by shark skin was correlated to the increasing flow velocity. As the flow velocity was fortified, the boundary layer thickness was reduced, resulting in an unexpected contact between riblet tips and high-velocity fluid, and diminishing the effectiveness of the riblet to control the turbulent structures in the turbulent boundary layer. Analogously, the riblet tip protrusion in the turbulent area was decreased when the flow velocity decreased synchronously, leading to the increased viscous drag from the enlarged surface region within the turbulent boundary layer [14,15]. Moreover, the pressure drop as a function of flow rate in the channel with various surfaces was studied in both water and air flow. It was suggested that the riblet surface was more beneficial in producing a drag reduction in turbulent flow than in laminar flow with the growth of water flow rate. Diversely, as the flow velocity enhanced, the pressure drop became larger, resulting in a higher pressure drag under air flow conditions, which was caused by the formation of air vortices [16]. Similar studies have indicated that the air tests achieved slightly higher pressure drops, perhaps due to lower viscosity and the tendency for the vortices to translate more easily [17]. Additionally, aerodynamic drag reduction research showed that the drag reduction ratio was independent of the average flow velocity within the band of variations. The larger the change in flow velocity, the worse the drag reduction effect for a riblet structure inspired by shark skin [18]. Furthermore, a super-hydrophobic surface with rectangular groove was simulated to study the influence of the flow velocity on the drag reduction characteristics. Calculated results demonstrated that the drag reduction rate decreased as the Mach number increased from 0.1 to 0.2 [19].
Recently, unlike the traditional riblet structures, the structures inspired by the cross-section of barchan dunes has been considered to be more appropriate for aerodynamic drag reduction [20,21]. The relationship between drag reduction and flow velocity for the structures inspired by barchan dunes was obtained by simulation. When the speed rose from 10 m/s to 30 m/s, the turbulent boundary layer thickness continued to decrease for both smooth and non-smooth surfaces, and the turbulent boundary layer thickness of the non-smooth surface was greater than that of the smooth surface at all stages [20]. Although structures inspired by the cross-section of barchan dunes exhibit excellent drag reduction in the aerodynamic field, previous studies have focused more on the drag reduction ability of large-size structures (millimeter-scale) under low-speed conditions. Obviously, uncertainties still exist in extending the results obtained under the conditions of low speed and low Reynolds number to the conditions of high speed and high Reynolds number. Moreover, the interactions between inner and outer wall mechanisms and the role of flow velocity played in the drag reduction have not yet been reported in detail.
In this work, the action mechanism of flow velocity on the drag was studied using computational fluid dynamics (CFD) methods. The distribution of pressure and velocity was mainly discussed to reveal the variation of flow field. Moreover, transient analysis was employed to characterize the evolution process of flow field near the surface. On this basis, the drag reduction mechanism was also analyzed in detail to provide theoretical guidance for the design and optimization of drag-reduction coatings under high-velocity flow condition.

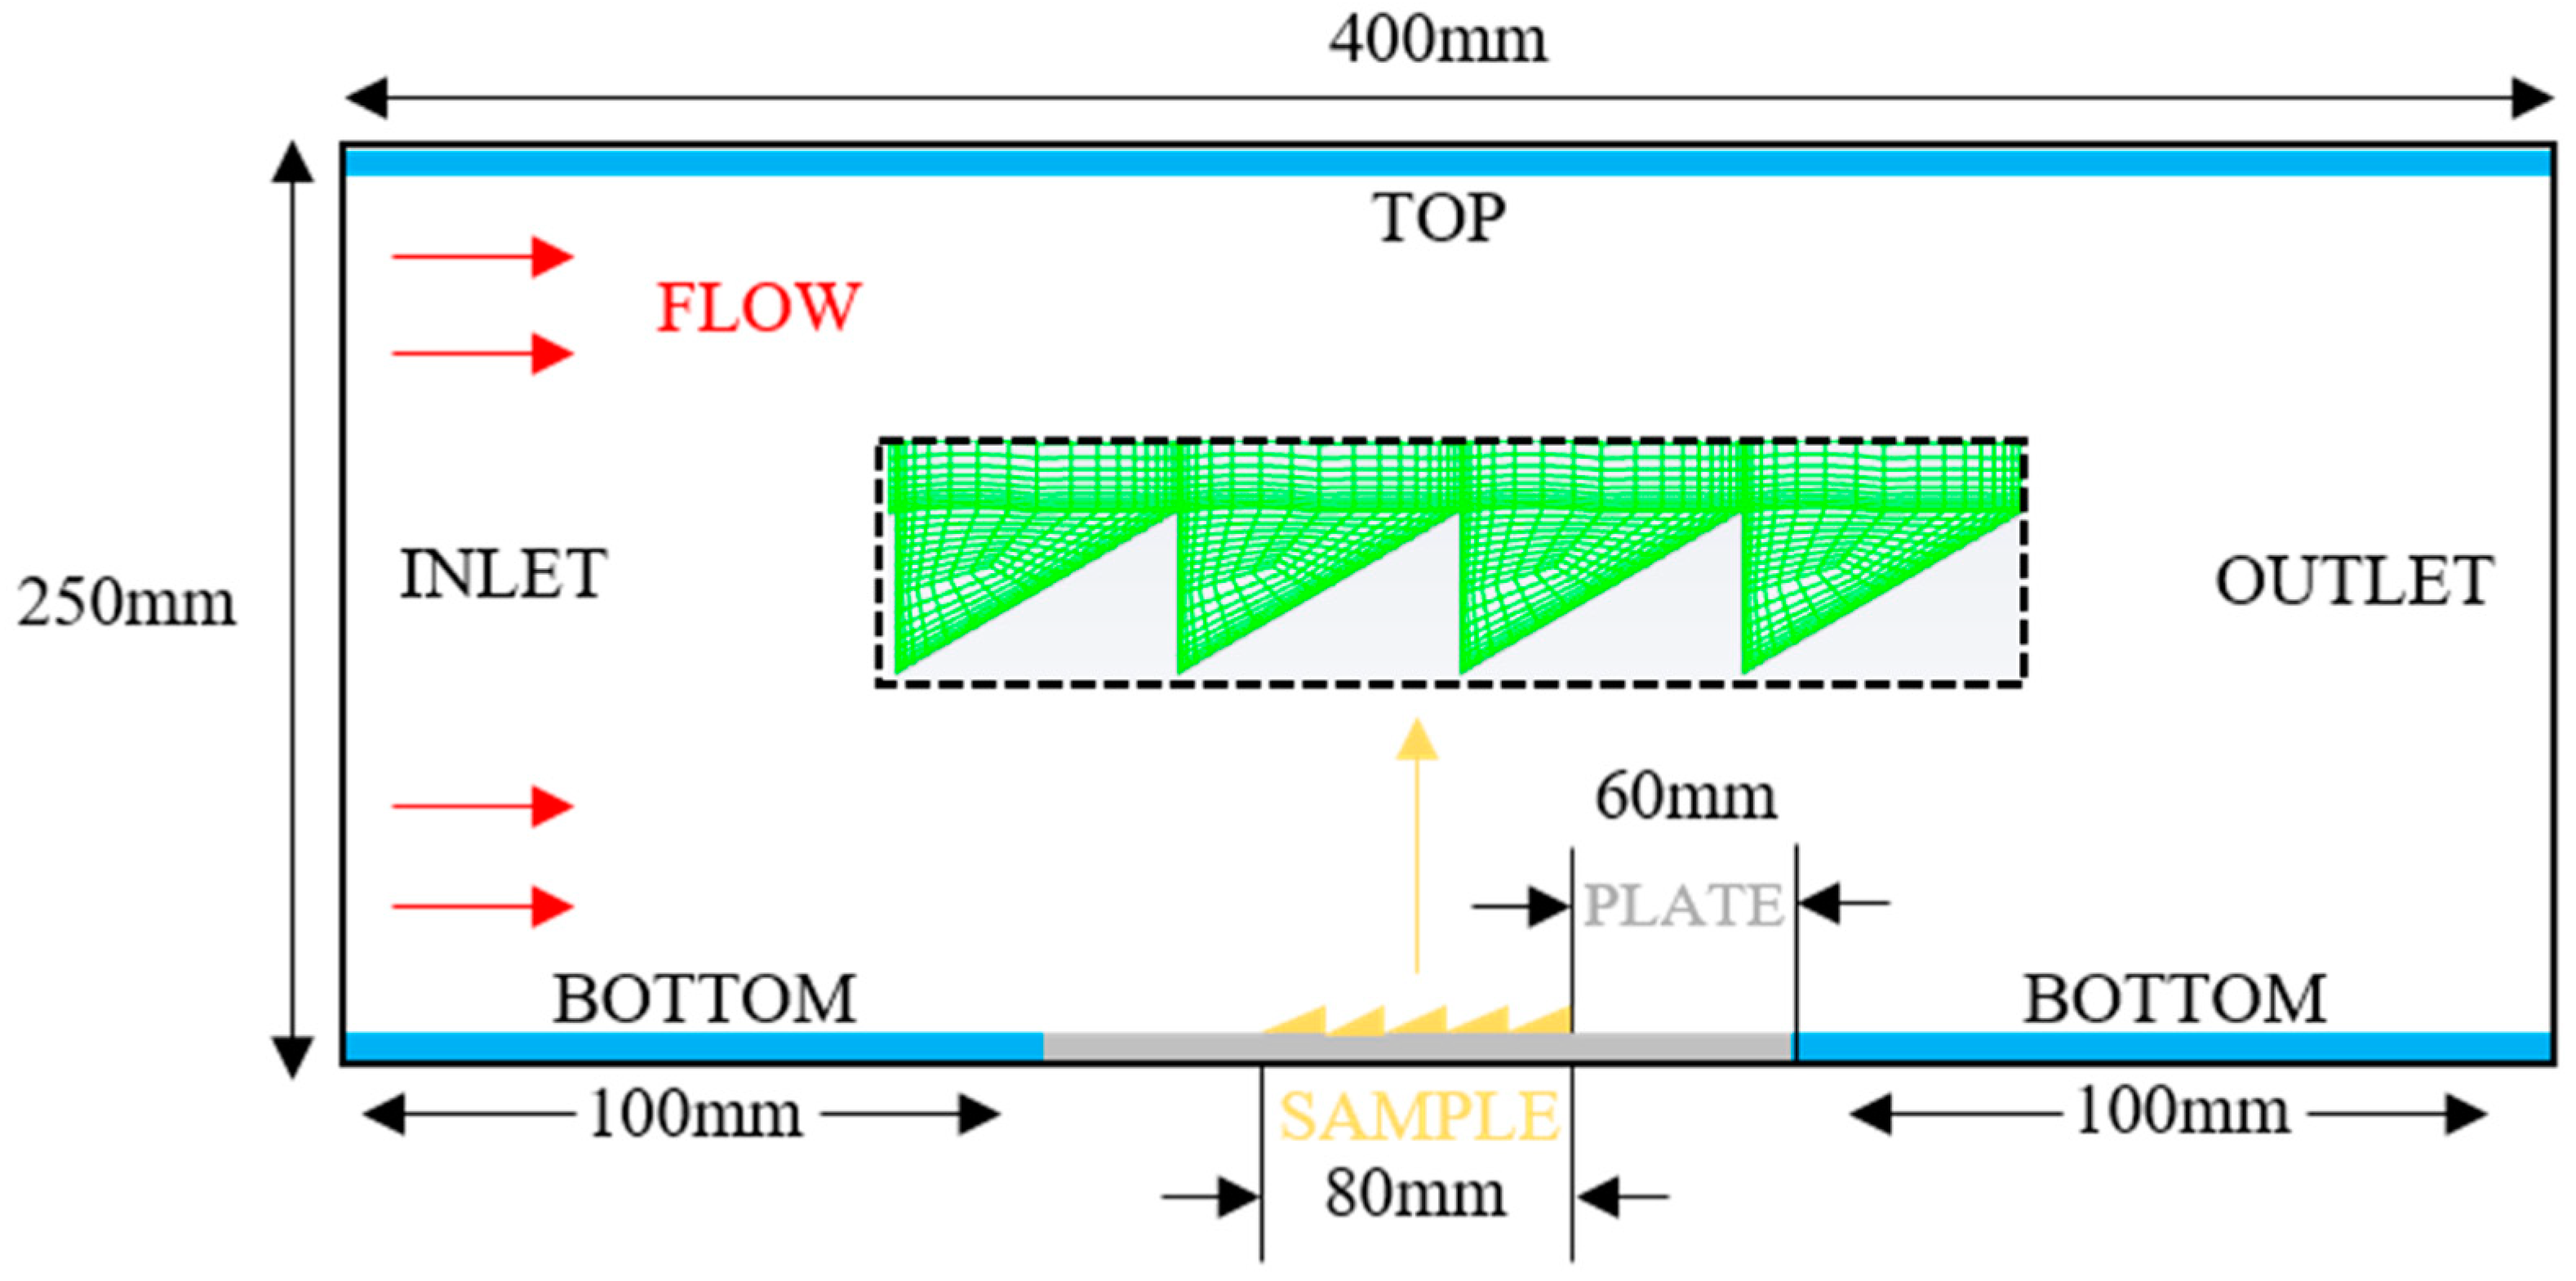
2. Numerical Simulation Approach

The microstructural unit of the barchan dune was inspired by the regularly arranged natural barchan dune, which consisted of unique windward and slip surfaces, indicating a strong ability to maintain shapes [21,22,23,24,25,26]. In this work, a symmetrical geometric shape was extracted from the cross-section of barchan dune in order to construct the microstructure unit, as proposed in our previous work and shown in Figure S1 [27].
The computational domain used in this work is the same as that used in the previous work [27]. Considering the aeronautical applications, the flow velocity ( U ) was broadly defined as 69.4, 83.3, 97.2, 111.1, 138.9, and 250 m/s, respectively. The Reynolds number of a plate was defined as follows:
Re L = U L ν
where L is the distance from the calculation position to the inlet of flow field, U is the free flow velocity, and ν is the kinematic viscosity coefficient.
The kinematic viscosity coefficient of air is 1.4607 × 10⁻⁵ m2/s. The corresponding Reynolds number ( Re L ) ranges from 9.50 × 10⁵ to 3.42 × 10⁶, which means a turbulent state in the flow field.
Reducing the burst in the turbulent boundary layer is an effective way to reduce drag. Therefore, the height of the microstructure should be smaller than the boundary layer thickness ( δ L ) in order to regulate the drag by disturbing the boundary layer. Meanwhile, the depth of the microstructure unit should also be greater than allowable roughness values ( k a d m ) to ensure that the surface is beyond the scope of dynamic smoothness in hydromechanics. To determine whether the microstructure can affect the turbulent boundary layer, the δ L and the k a d m with different velocity can be determined by the following formulas [20]:
δ L = 0.37 L × Re L 0.2
k a d m 100 L Re L
Notably, the height of the microstructure unit should be less than 1.80 mm, which is the minimum value of the thickness of the turbulent boundary layer. According to the flow velocity applied in this work, the allowable roughness value ranged from 21.65 μm to 6.84 μm. Thus, the microstructure with a certain height of 50 μm was selected to explore the drag reduction performance caused by the flow velocity. Meanwhile, because the angle (α) processed a typical value of around 30° in nature, the α was defined as 30°.
Previous research indicated that the realizable k-ε model was suitable to describe the boundary layer thickness with high precision [28,29]. Additionally, this model could minimize the error between simulation and experiment [30]. The comparison between the theoretical values and the calculated values under different turbulence models also verified the suitability of the realizable k-ε model, as shown in Figure S2. Therefore, the underlying physical mechanism of drag reduction induced by microstructure was studied by the realizable k-ε model in this work. More governing equations could be referred to previous studies [29,31]. Furthermore, the reliability of the calculation model is also verified in the previous work [27]. In addition, the large eddy simulation (LES) method is adopted for simulation in order to acquire the subtle flow characteristics and variation in the flow field. The detailed calculation mathematical model is described in Supplementary Files.
The numerical simulation was implemented by Fluent 19.2 in a 2D model. The computational domain is a rectangle with a length of 400 mm and a width of 250 mm, as depicted in Figure 1. For incompressible fluid with velocity below 0.3 Ma, a pressure-based solver was used in this work, while the density-based solver was adopted for a higher velocity above 0.3 Ma. Both the top (400 mm) and bottom (100 mm) regions were set as symmetry boundaries in order to prevent the interference from side walls, as marked in blue. In addition, the plate (60 mm) and structure (80 mm) regions marked with gray were defined as stationary walls with no slip. Moreover, the grids of structure region tagged with yellow were enlarged in the center of this figure. The inlet and outlet regions were set as velocity inlet boundary (marked with red arrows) and pressure outlet boundary, respectively, under incompressible flow conditions. In contrast, the pressure far field boundary was adopted to inlet and outlet under compressible flow conditions.
The previous solver parameters and grid construction methods were followed in this work [27]. Moreover, the independence of the computational grid was also verified to ensure the accuracy of the calculation, as shown in Figure S3. Several velocities were chosen to verify the dependability of the calculation model, and the theoretical skin friction coefficient was compared with the simulation result. The theoretical value of skin friction coefficient ( C f ) was expressed as C f = 0.074 × Re L 0.2 . As listed in Table 1, the theoretical skin friction coefficient value is decreased from 4.713 × 10⁻³ to 4.106 × 10⁻³ with the increase of flow velocity under the above boundary conditions. Otherwise, simulation results demonstrate the same tendency with theoretical values. The maximum relative error between the simulation and theoretical results is only 6.99%, indicating the reliability of the calculation model used in the high-speed flow condition. Moreover, additional simulations with a top boundary of wall with a velocity gradient of 0 and a bottom boundary of no slip were implemented to further check the numerical accuracy of the results. The difference between the theoretical value and the simulation value can also be controlled within 7%, which is similar to the data obtained under symmetry boundary conditions. It can be verified that the above model still has decent reliability even under the wall boundary condition, revealing a better applicability in simulation work.

3. Results and Discussion

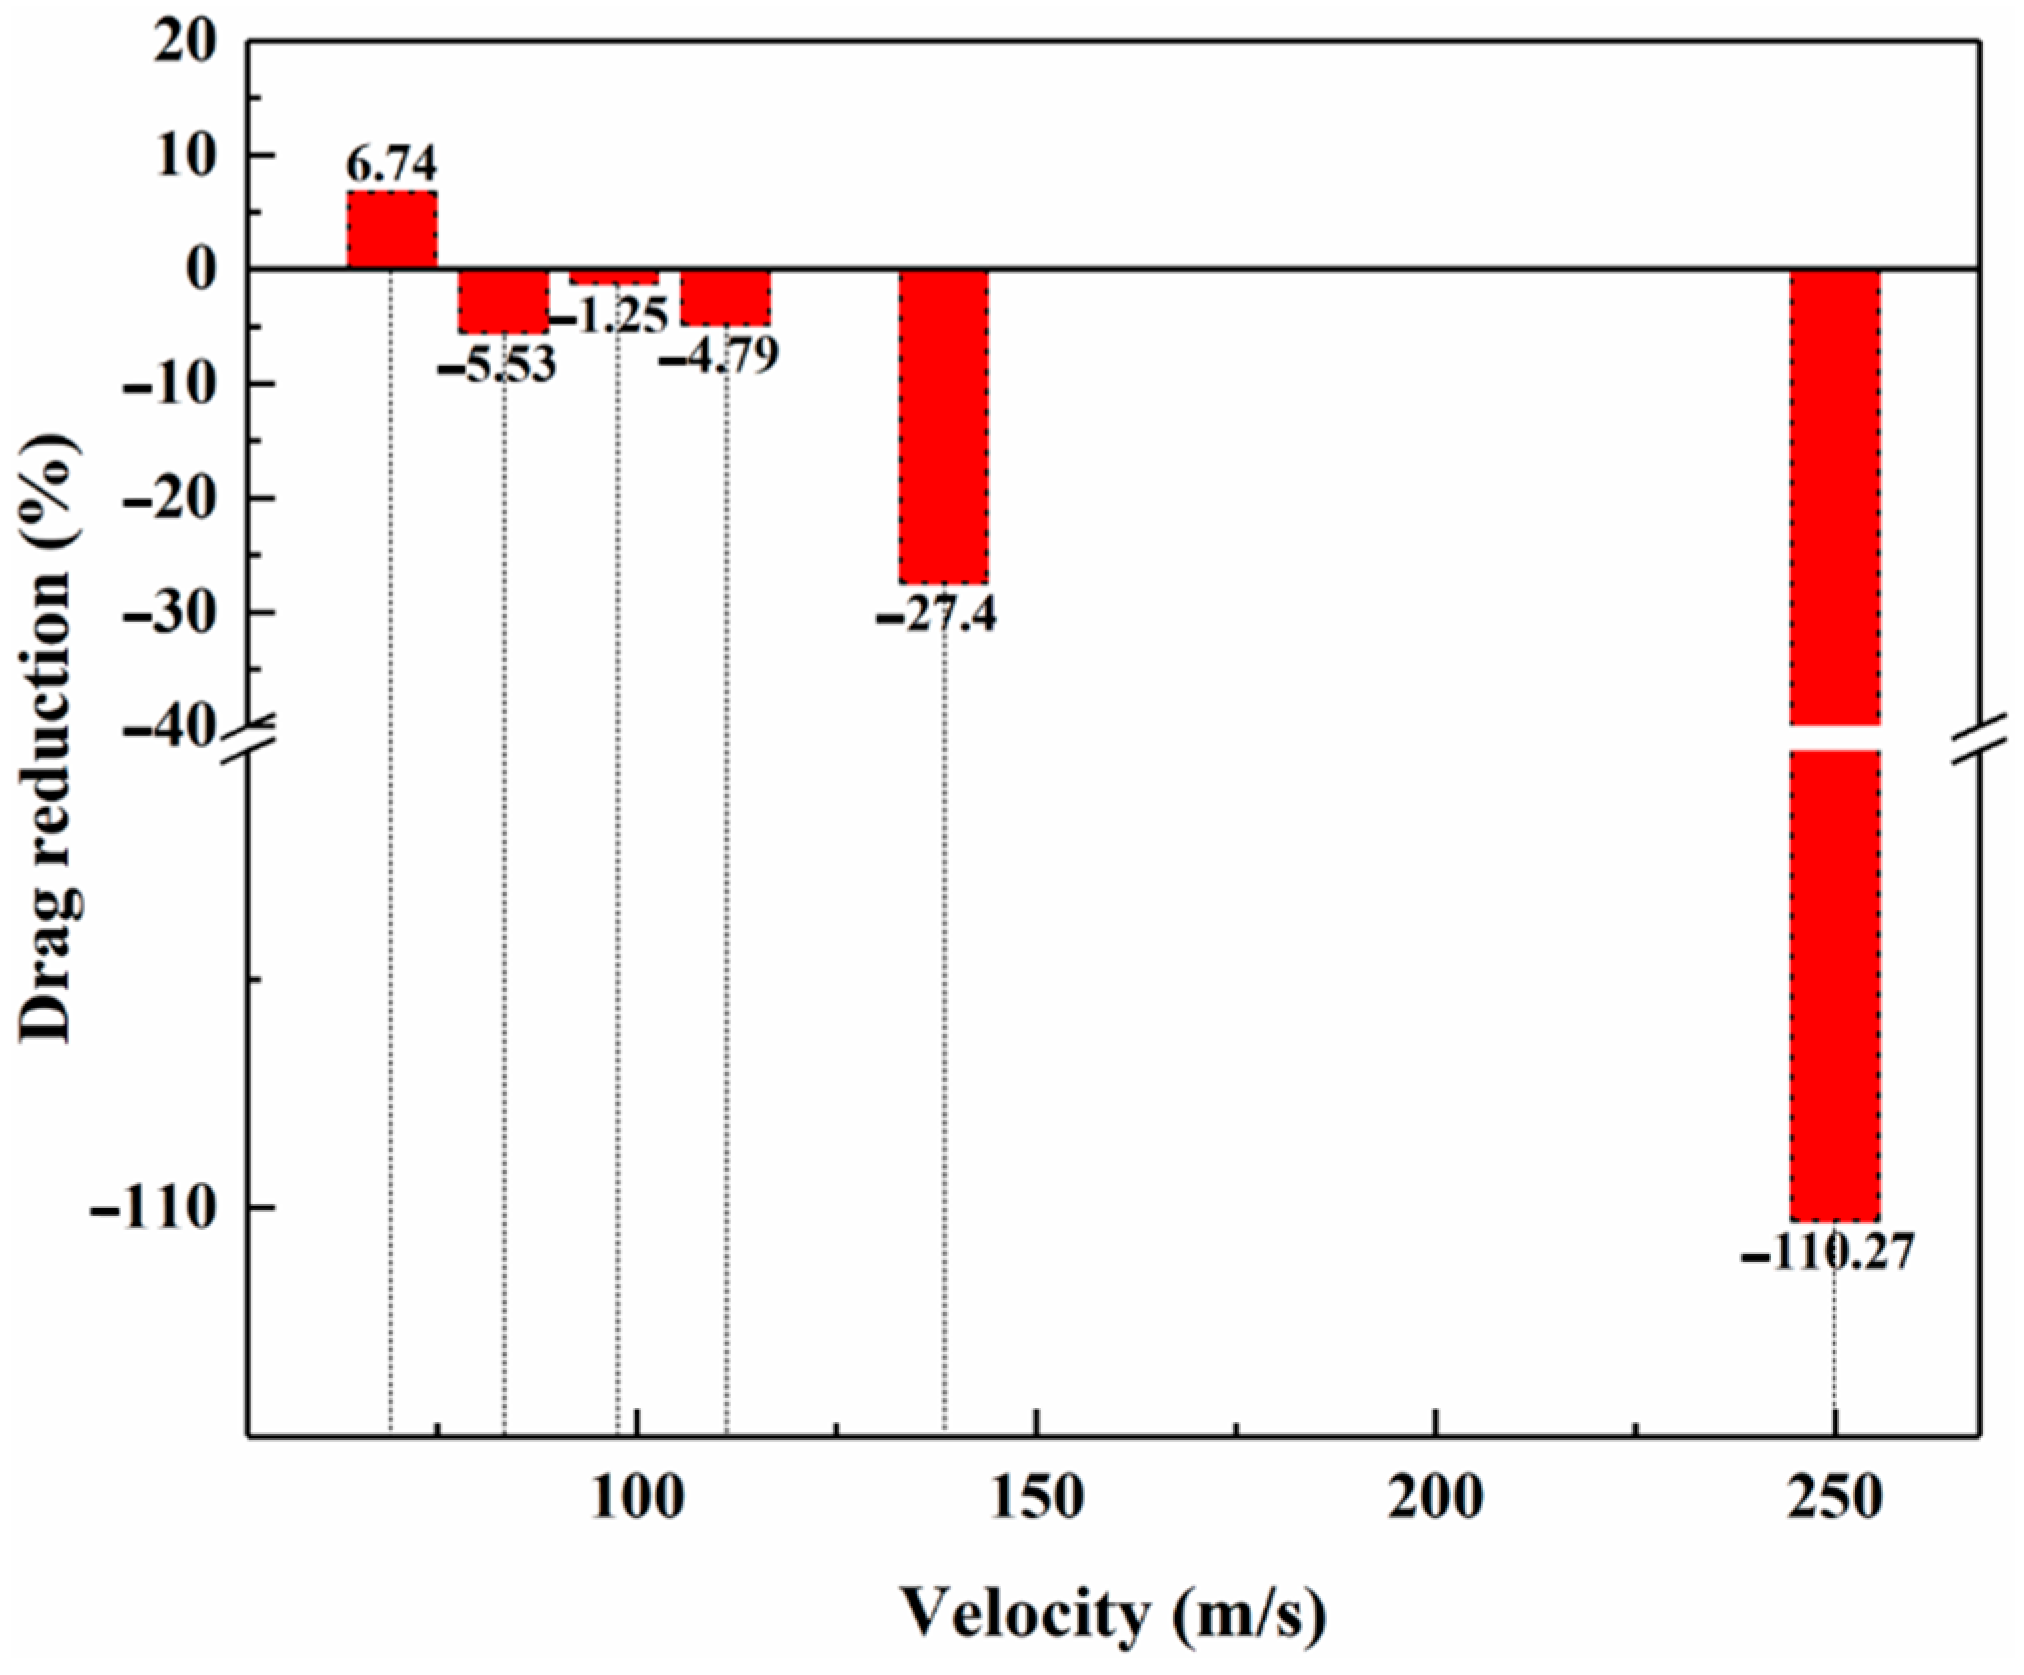
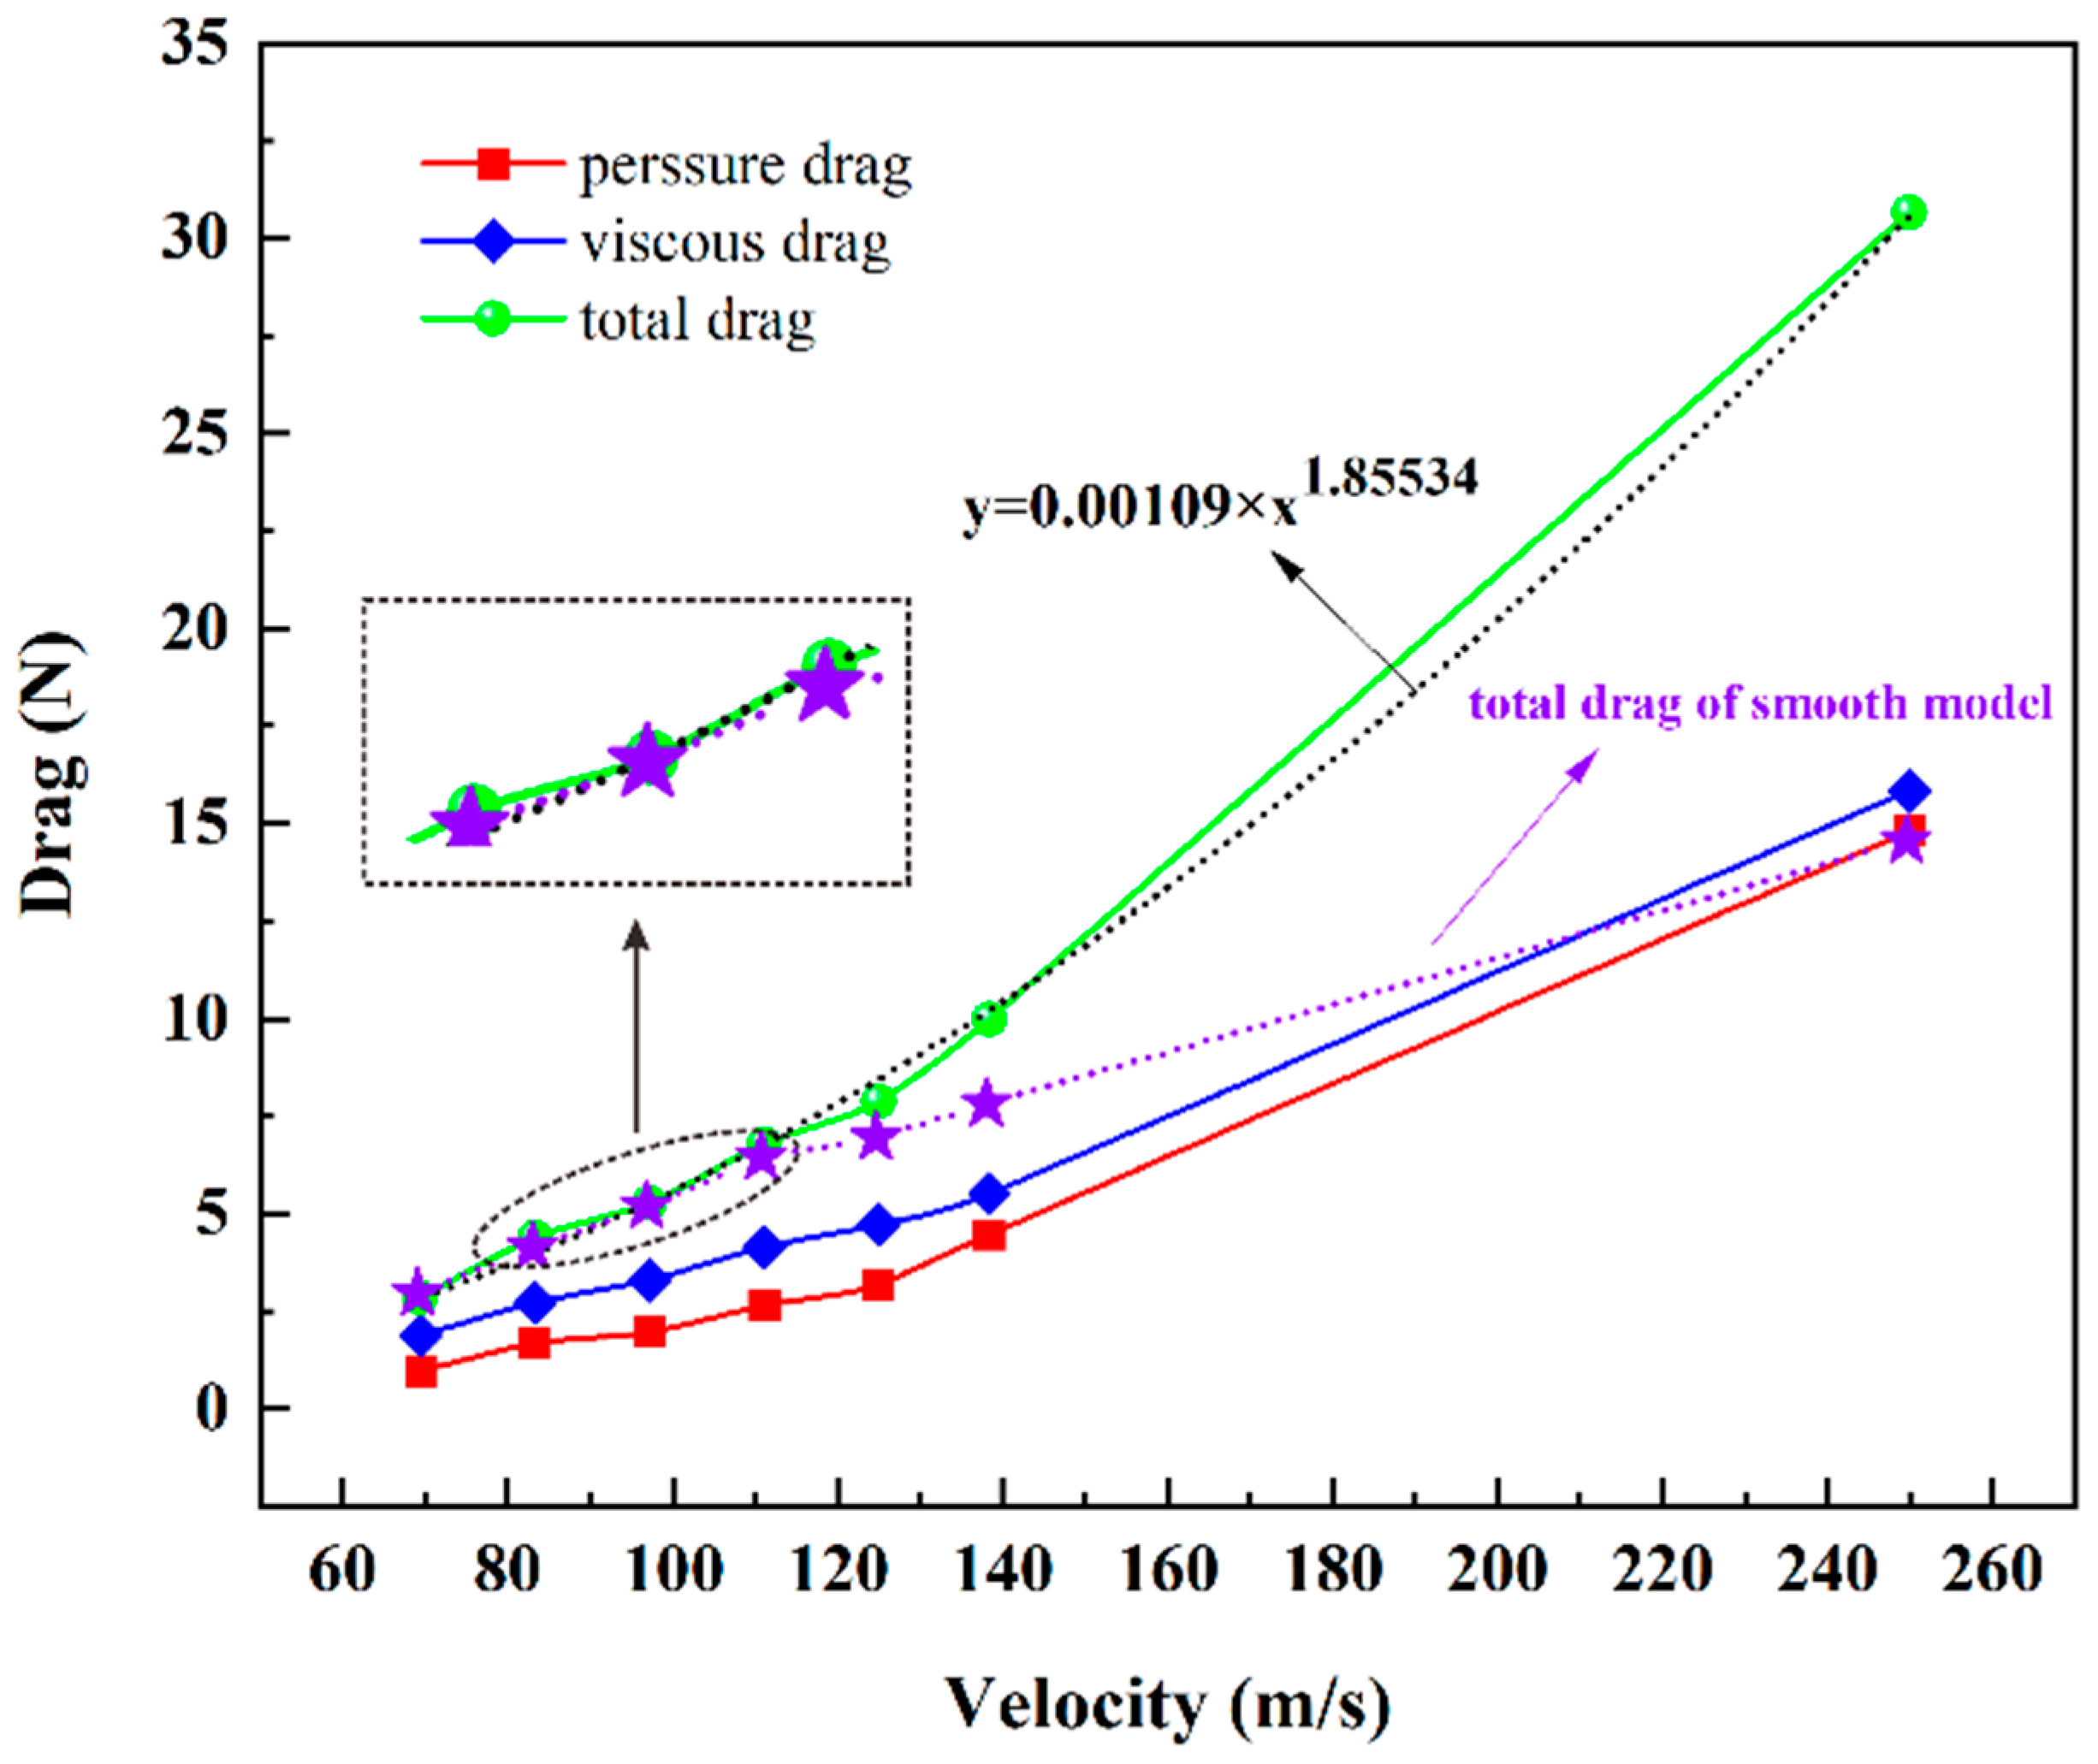
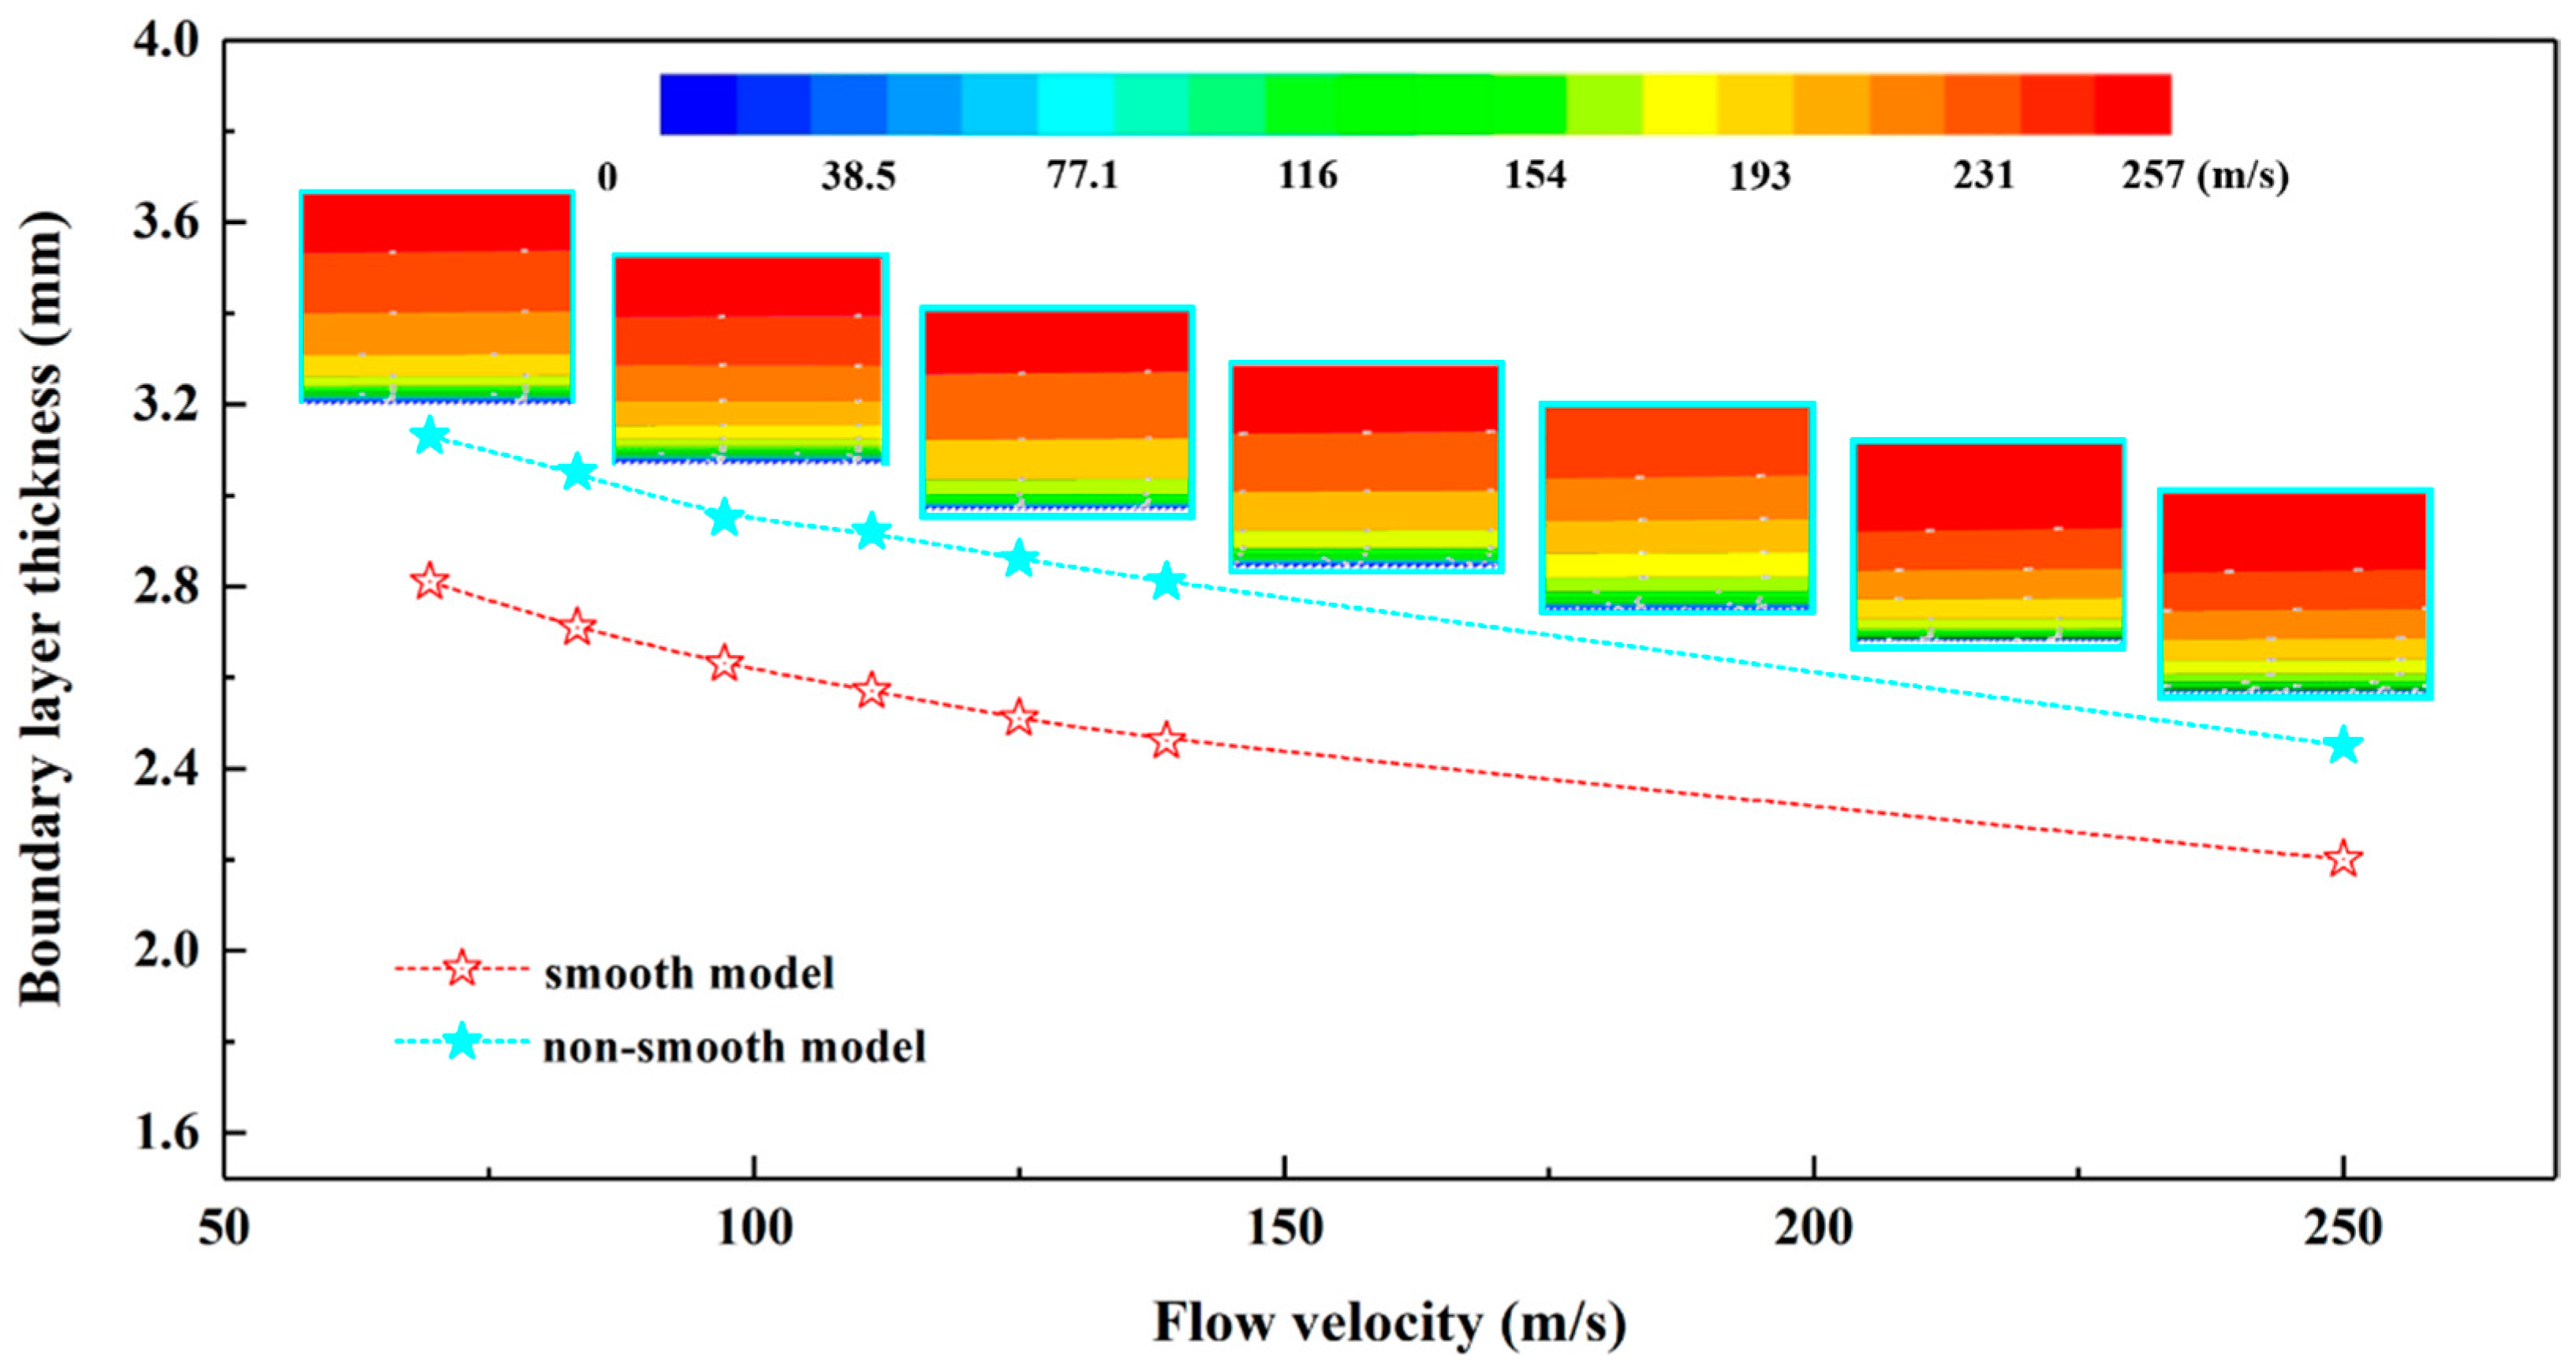
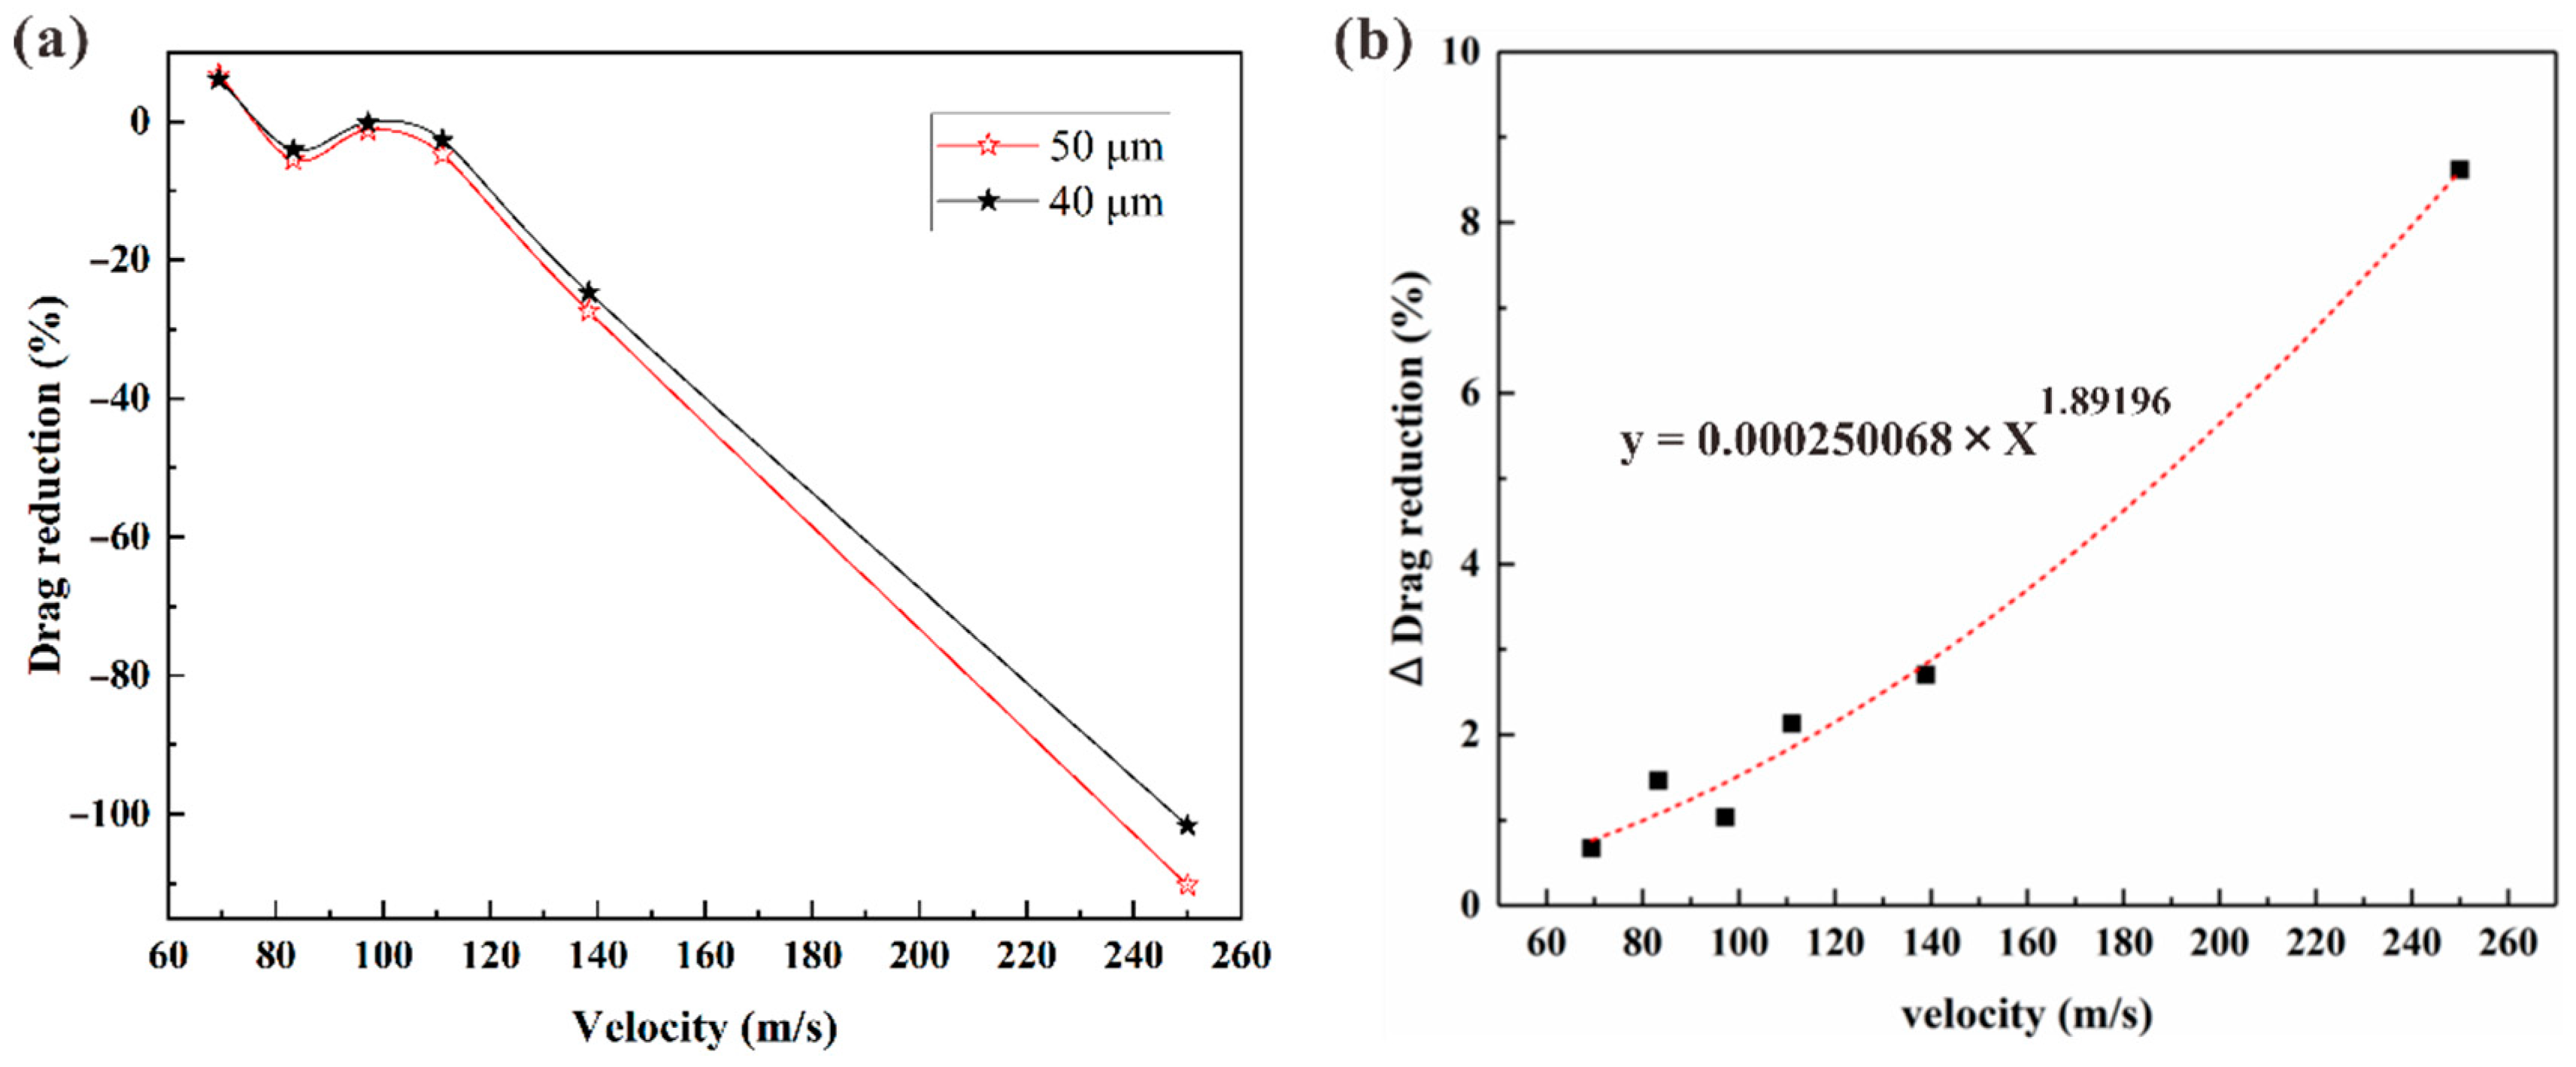
3.1. Drag Reduction Analysis

The relationship between flow velocity and drag reduction ratio is shown in Figure 2. It is clear that the microstructure processes a higher drag reduction effect with 4.23% at the flow velocity of 69.4 m/s. Therewith, as the flow velocity augments, the drag reduction ratio falls below zero. It is obvious that the drag reduction ratio decreases to different degrees with the growth of flow velocity. Although the drag reduction effect of the microstructure picks up at the velocity of 97.2 m/s, the tendency of drag reduction decreases with the development of velocity in general. Notably, at the flow velocity of 250 m/s, the drag reduction ratio even drops to −110.27%, which is equivalent to twice the total drag.
Drag analysis indicates that as the velocity augments, both viscous resistance and pressure drag improve continuously, leading to an enlargement of total drag in the non-smooth model, as presented in Figure 3. Meanwhile, viscous resistance is usually higher than pressure drag under high flow velocity. As illustrated in Figure 3, the relationship between flow velocity and drag of non-smooth model is verified to be
y = 0.00109 × x 1.85534
As described by the formula, drag is a power function of flow velocity. This means that the effect of flow velocity on drag is extremely fierce. In contrast, the drag variation of the smooth model is gentler than that of the non-smooth model. It reveals that the existence of the microstructures exacerbates the increase in drag under high-speed conditions. However, the growth rate of drag of the smooth model is higher than that of the non-smooth model in a certain velocity interval, resulting in an un-strict improvement of the drag reduction ratio of microstructure, as shown in the enlarged area in Figure 3.

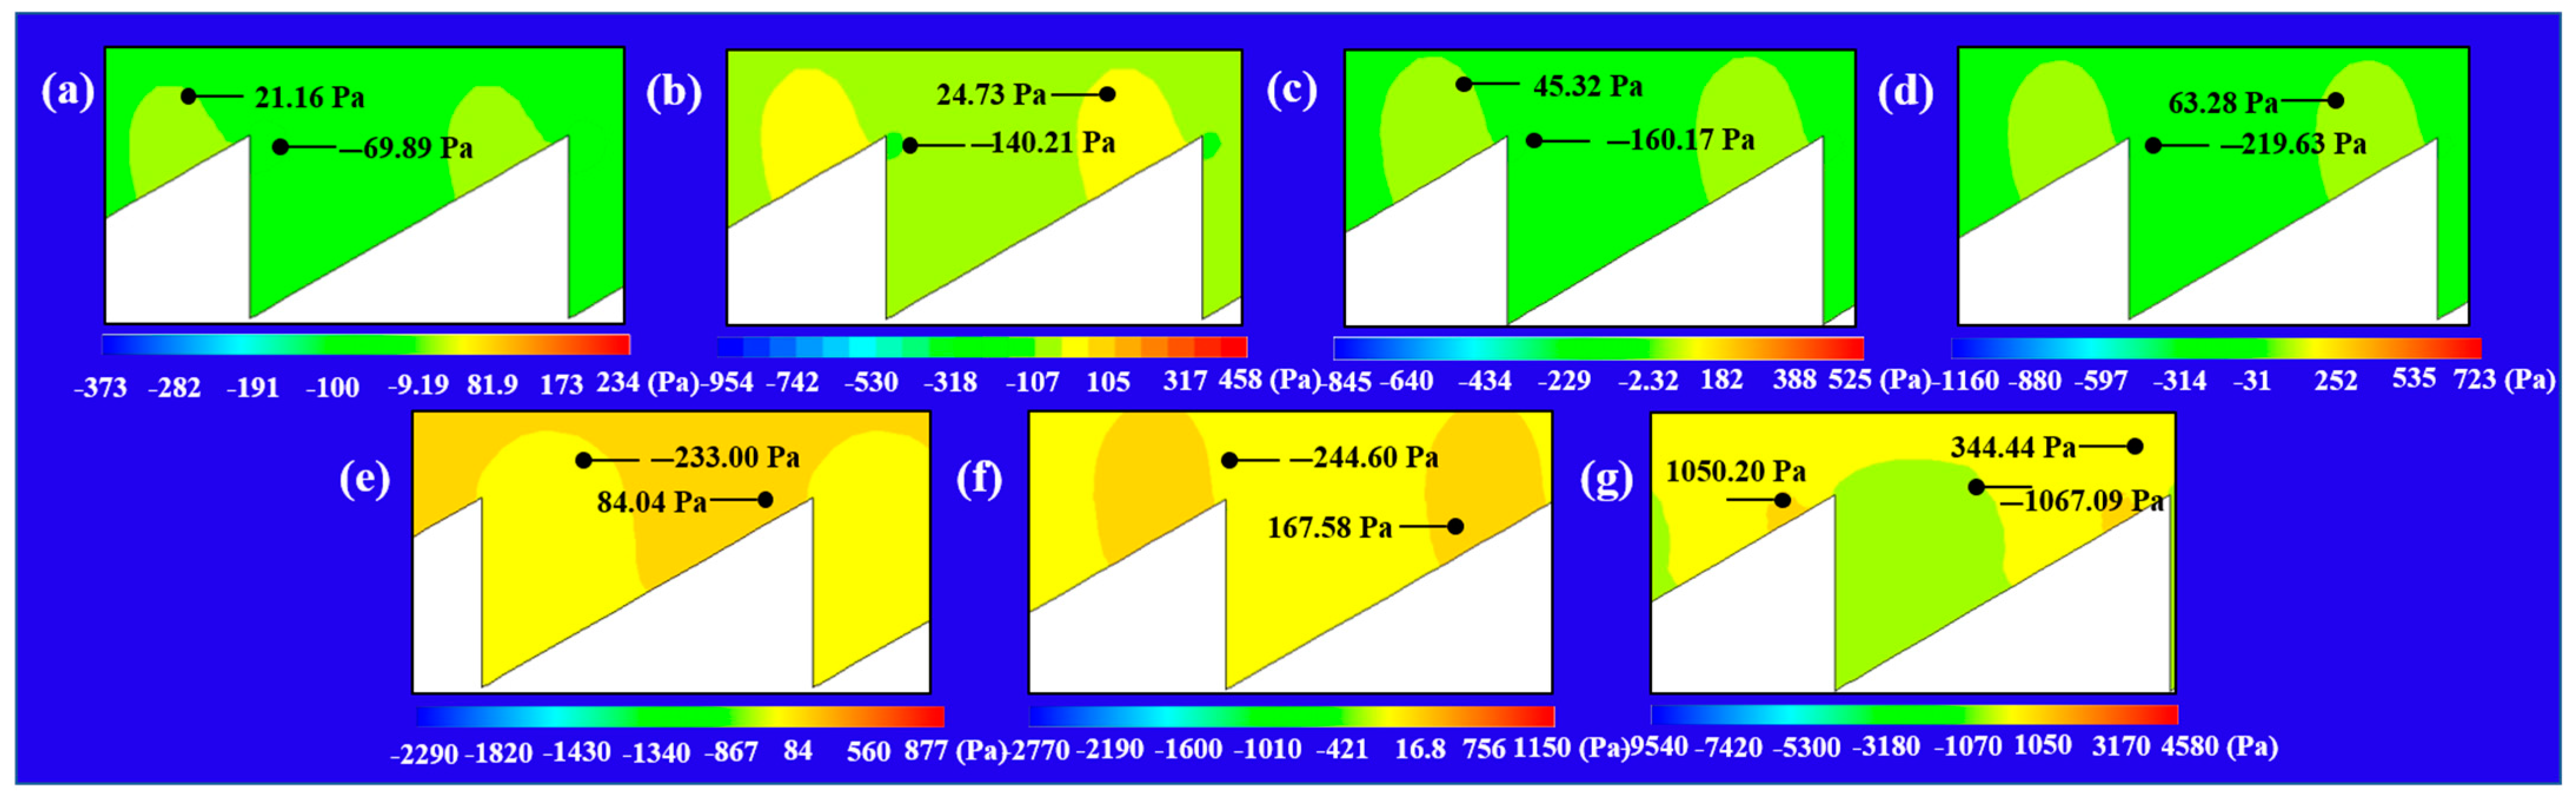
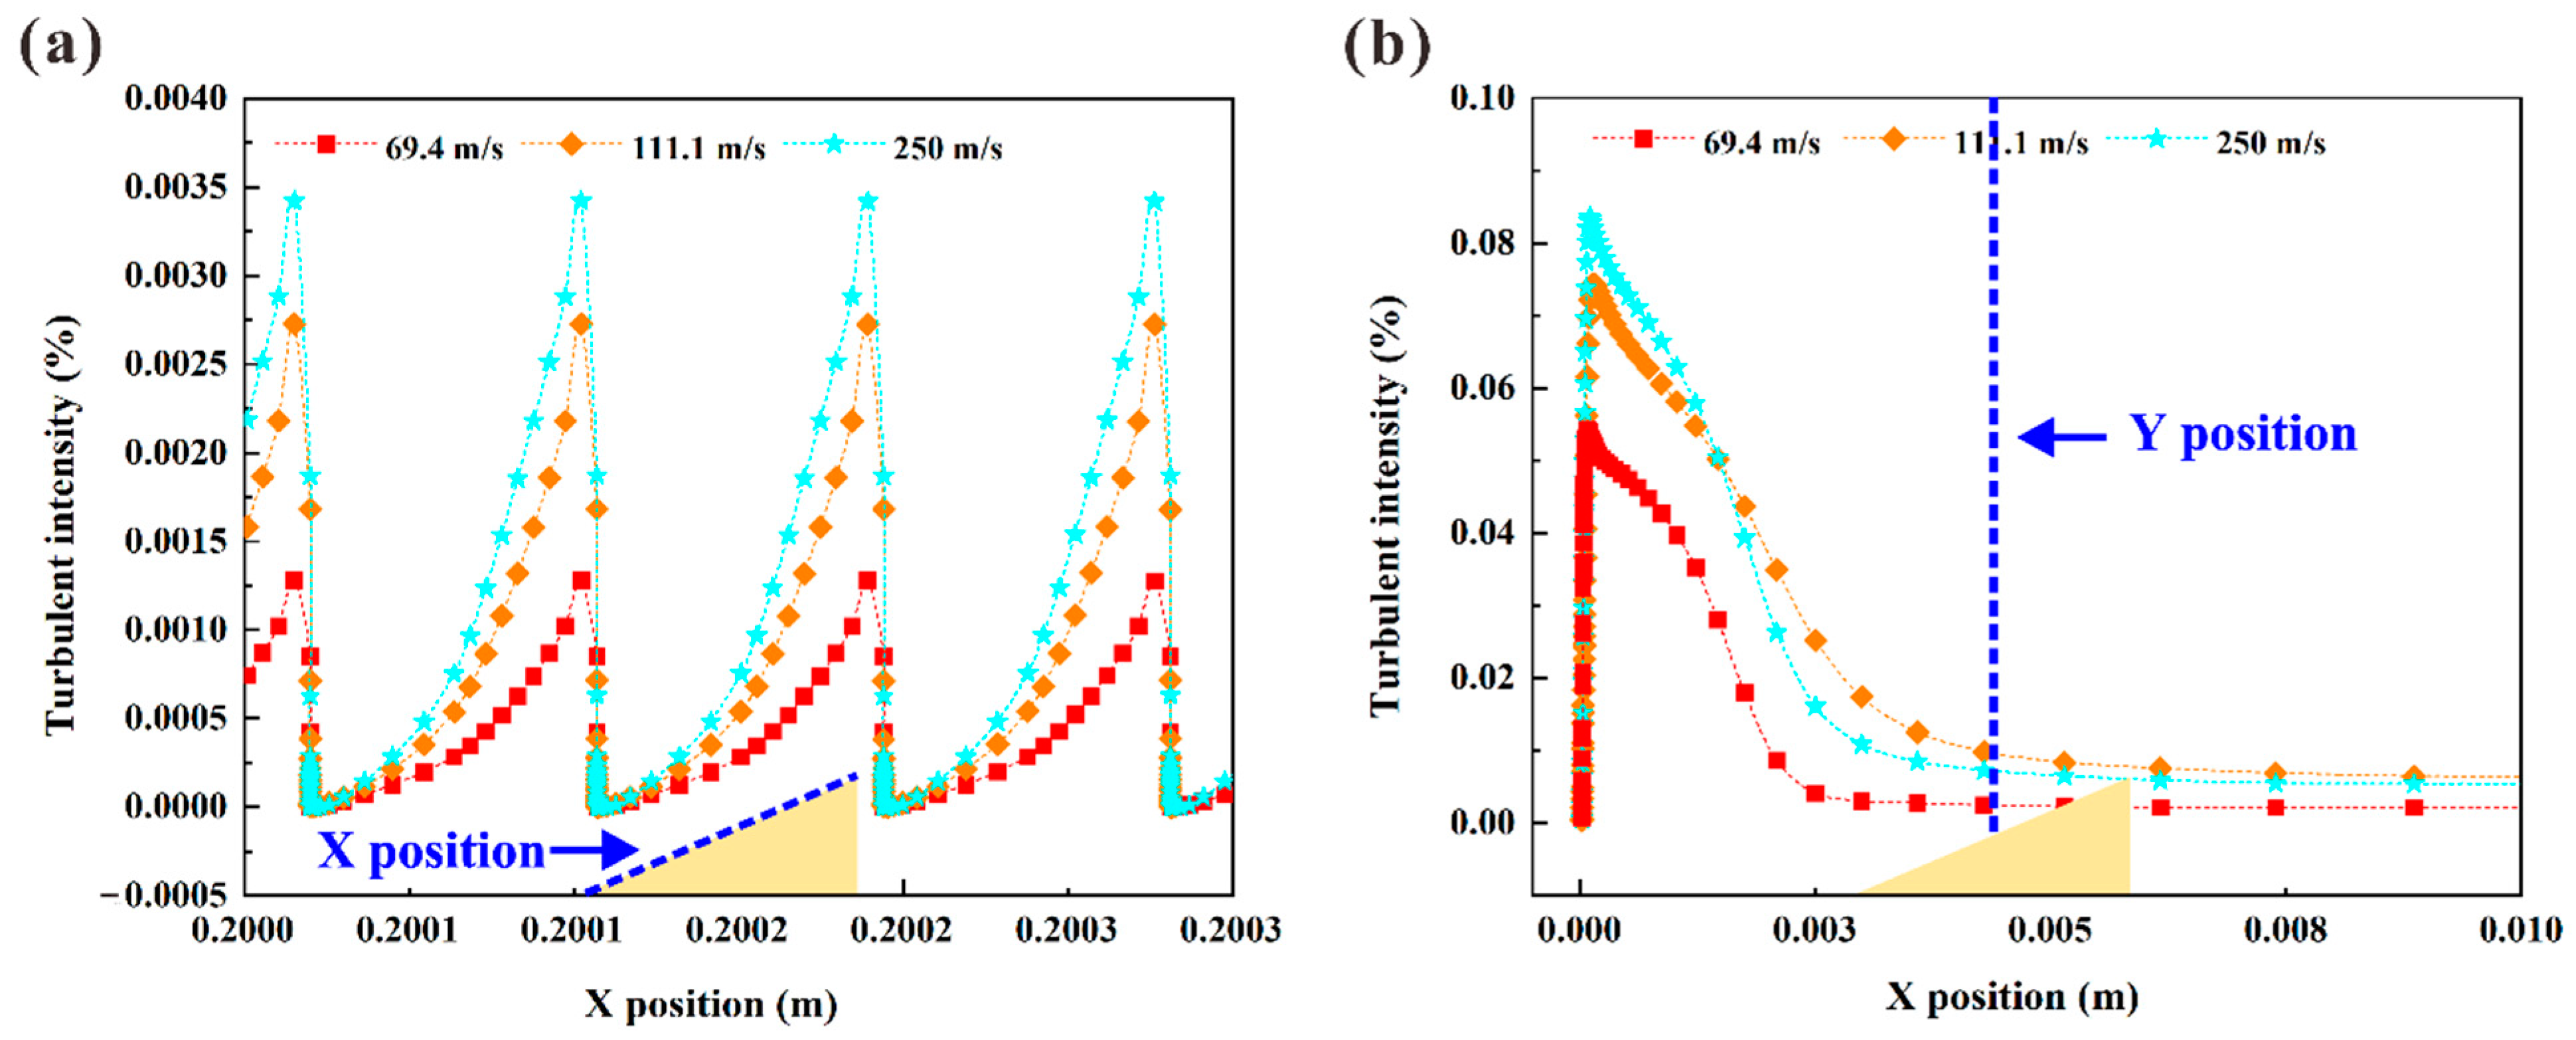
3.2. Variation Distribution of Pressure and Velocity

Figure 4 shows the variation of pressure around the microstructure unit with different flow velocity. The pressure contour map illustrates that the high-pressure area situated in the windward surface enlarges with the gradually increasing pressure value when the flow velocity rises from 69.4 m/s to 83.3 m/s. Although the negative pressure area has decreased, the average pressure in the negative pressure area shows a downtrend, resulting in an enlargement in pressure drag. Afterward, when the flow velocity augments from 83.3 m/s to 111.1 m/s, the high-pressure area on the windward surface amplifies gradually. Meanwhile, the average pressure in these areas reveals the same tendency. In addition, the negative pressure area on the slip face remains substantially stable, while the pressure value decreases gradually, leading to a continuous enlargement in pressure drag. The high-pressure area extends to the entire windward surface with a pressure value of up to 84.04 Pa when the flow velocity increases to 125 m/s. The negative pressure area on the slip face is also amplified at the same time, and the pressure value is further reduced to −223 Pa, causing a further improvement of pressure drag. The high-pressure area is reduced as the flow velocity is up to 138.9 m/s. However, the average pressure value of the high-pressure area extends to 167.58 Pa sharply, in contrast to the negative pressure value, which decreases slightly, resulting in a persistent drop in pressure drag. It is worth noting that the pressure value of the high-pressure area in the windward surface is as high as 344.44 Pa when the flow velocity is increased to 250 m/s. Moreover, an ultra-high-pressure area with a pressure value of 1050.2 Pa is generated in the local area of the windward surface. Simultaneously, in addition to the negative pressure area augmenting significantly, the pressure value drops to −1067.09 Pa, which reflects a greater pressure drag.
As an important hydrodynamic parameter, the thickness of the boundary layer greatly affects the drag. The microstructures located in the middle of the computational domain are selected to study the effect of microstructure on the boundary layer thickness under different flow velocity conditions, as shown in Figure 5. The thickness of the boundary layer above the microstructures are compared under different velocity conditions, and the corresponding velocity contours are displayed in the azury box in Figure 5. For comparison, the boundary layer thickness of the same position in the smooth model is also measured. It is obvious that both the smooth model and the non-smooth model reflect a reduction in boundary layer thickness with the growth of flow velocity. Even if the flow velocity is raised to 250, the boundary layer thickness obtained by non-smooth model is reduced from 3.13 mm to 2.55 mm, which is still higher than the boundary layer thickness measured in the smooth model. This means that as the flow velocity rises, the microstructure enlarges the thickness of the boundary layer continuously, and then reduces the viscosity resistance. However, based on the boundary layer thickness achieved by the smooth model, the growth rate of the boundary layer thickness has been maintained below 14.2% in non-smooth model as the flow velocity augments, which reveals that the ability of microstructure is extremely limited for improving the boundary layer thickness.
Velocity streamlines of microstructure extracted from middle of the computational domain are presented under different flow velocity conditions in order to explore the reasons for the variation of viscous resistance with flow velocity, as shown in Figure 6. It is obvious that the micro-vortexes appear within microstructures at each flow velocity. The size of micro-vortex gradually magnifies when the flow velocity rises from 69.4 m/s to 111.1 m/s. A larger micro-vortex can effectively reduce the contact area between the fluid and the surface to a certain extent, thereby decreasing the viscous resistance. It can be inferred that the drag reduction effect can be achieved when the influence of the micro-vortex is enlarged to almost compensate for the augment of viscous resistance and pressure drag caused by the growth of flow velocity. This can be explained by the fact that the drag reduction rate is fortified when the flow velocity augments from 83.3 m/s to 97.2 m/s. Additionally, the micro-vortex gradually shrinks when the flow velocity increases from 111 m/s to 250 m/s, resulting in a sudden expansion of the contact area between fluid and surface. The variation of contact type between fluid and surface should be one of the feasible reasons why the viscous resistance enlarges sharply, causing the drag reduction rate to decrease dramatically.

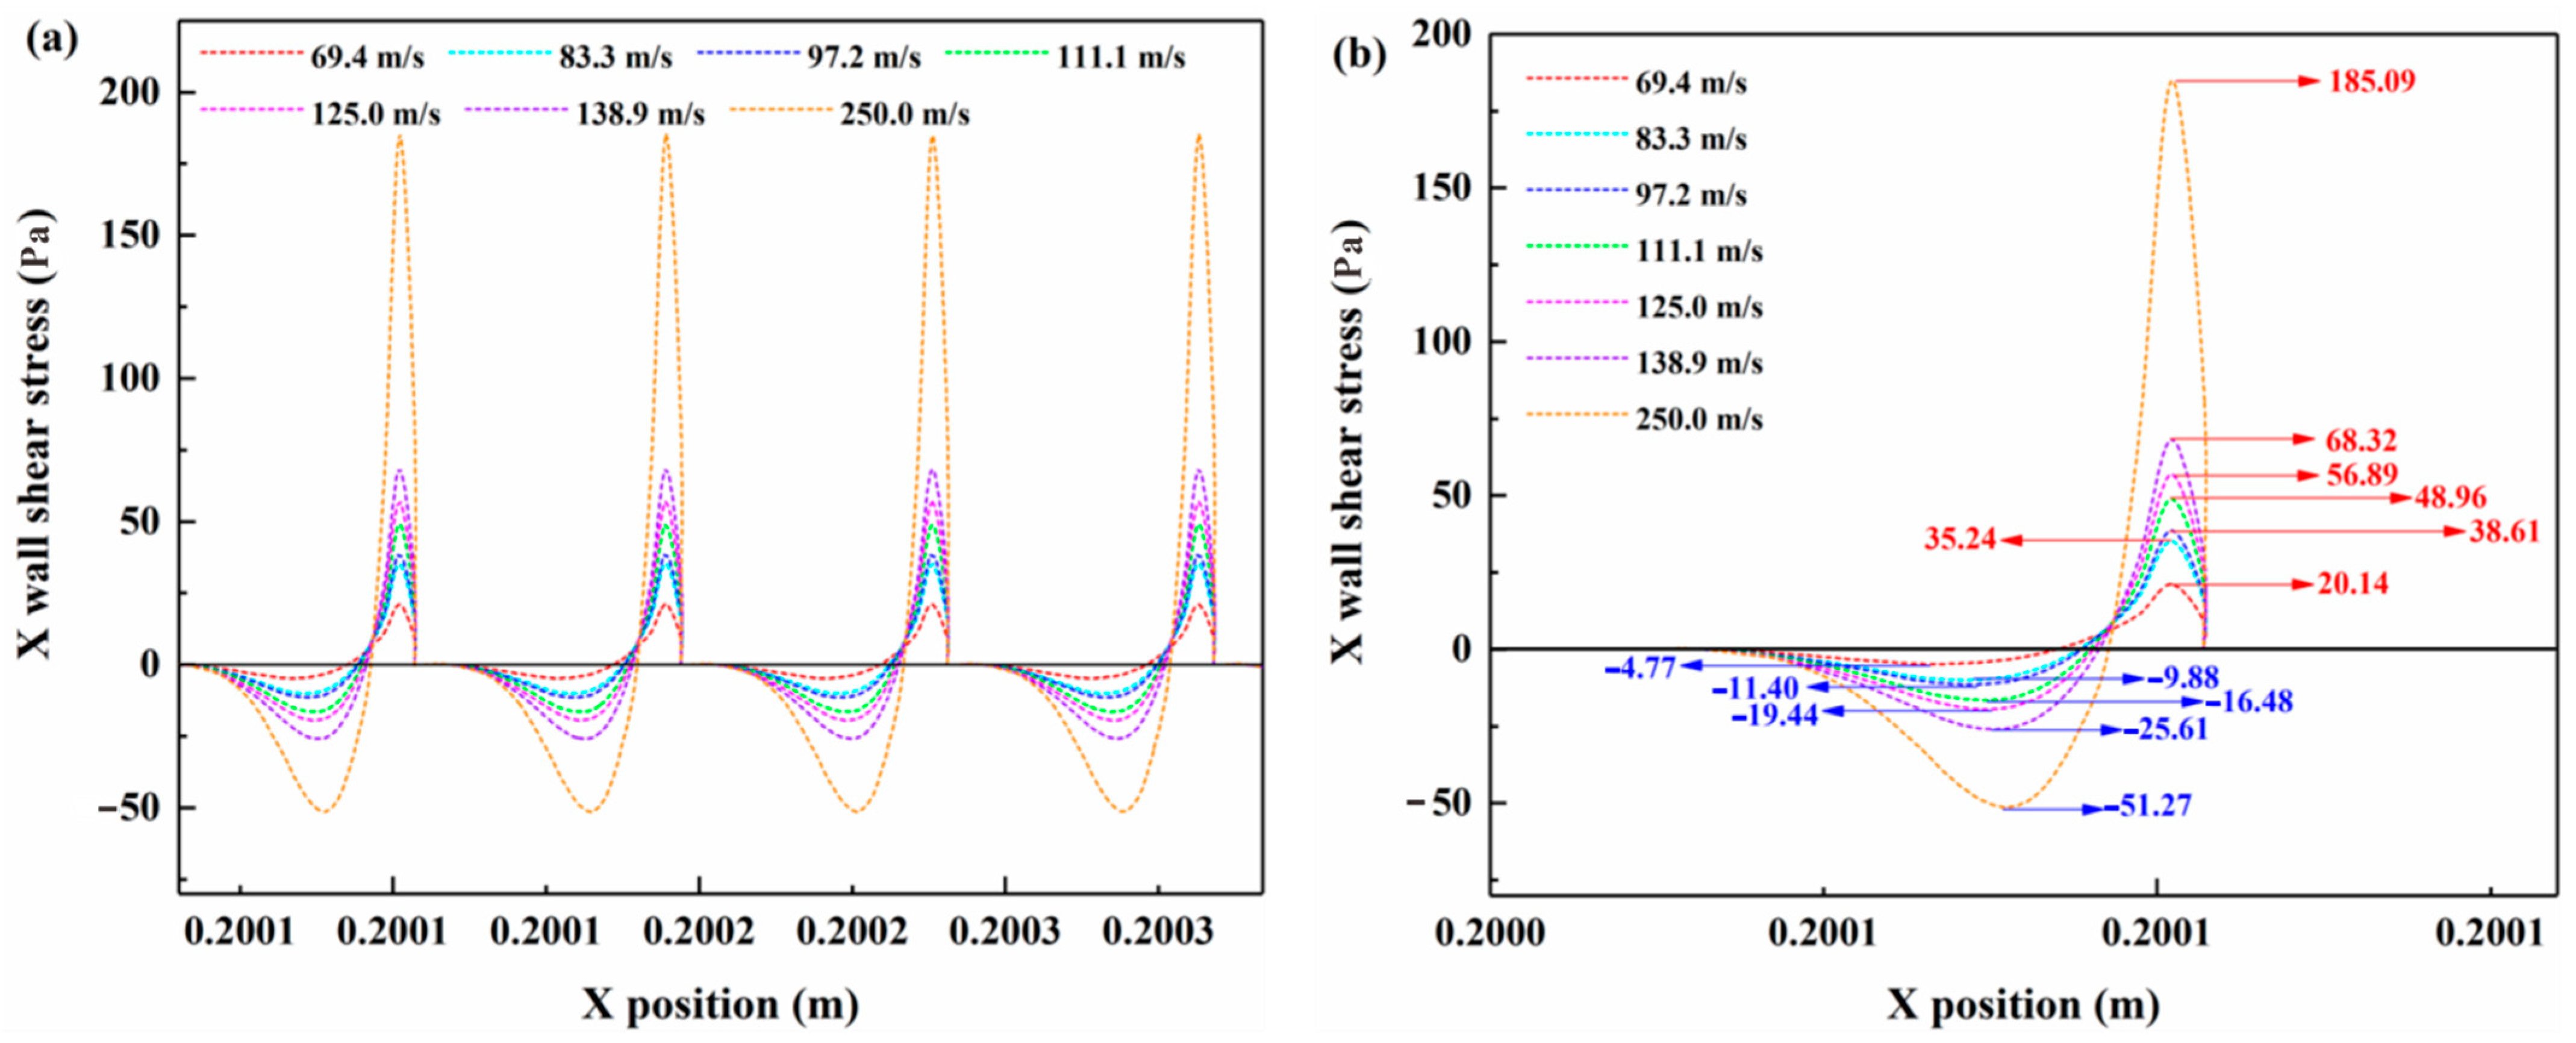
3.3. Analysis of Wall Shear Stress with Various Flow Velocity

The wall shear stress units extracted from the middle of the structure region are selected to further analyze the effect of flow velocity on viscous resistance under different velocity conditions, as shown in Figure 7. Figure 6a shows that both the positive and the negative wall shear stress enlarge as the flow velocity arises. In particular, the negative wall shear stress indicates a relatively gentle enlargement, while the increase of positive wall shear stress is more dramatic. The accurate values of the maximum wall positive shear stress and the maximum negative wall shear stress are illustrated in Figure 7b. It can be obtained that the maximum negative wall shear stress rises from −4.77 Pa to −51.27 Pa when the flow velocity is fortified from 69.4 m/s to 250 m/s. Meanwhile, the maximum positive wall shear stress aggrandizes from 20.14 Pa to 185.09 Pa dramatically. It is worth noting that the maximum positive wall shear stress remains almost 2.6 to 4.2 times the value of the maximum negative wall shear stress during the increment of flow velocity. According to the results of viscous resistance analysis, the total wall shear stress continuously augments with the increasing flow velocity. This means that the positive wall shear stress dominates the variation of viscous resistance. In addition, the velocity streamline analysis shows that the size of the micro-vortex continues to decrease when the flow velocity exceeds 111.1 m/s. This can be inferred that more fluid can directly contact with the surface, resulting in a greater increment of positive wall shear stress, which also confirms the above speculation from Figure 6. Otherwise, the reduced micro-vortex leads to a drop of the growth of negative wall shear stress due to the weakening of its influence on the bottom of the microstructure. Although, the velocity of the micro-vortex still augments as the flow velocity magnifies, resulting in an enlargement of negative wall shear stress. However, the increment of negative wall shear stress is gradually difficult to make up for the growth of the positive wall shear stress when the flow velocity is greater than 111.1 m/s, resulting in an enlargement of total viscous resistance.
The velocity gradient data of a single microstructure in the direction perpendicular to the bottom surface is extracted in order to verify the analysis of the wall shear stress, as shown in Figure 8. The microstructure adopted in this section is selected in the same position as that selected in the wall shear stress analysis. Figure 8a shows the velocity gradient between the bottom and the top of the microstructure. It is indicated that reverse speeds usually exist at different flow velocity conditions, which is caused by the rotation of the micro-vortex. In addition, the maximum reverse speeds under different flow velocity conditions both appear near the height of 3.3 × 10⁻⁵ m. The curve of reverse velocity gradient gradually shifts to the left as the flow velocity increases, while the curve of positive speed gradient shifts to the right. This proves the increment of velocity gradient, which is induced by the augment of flow velocity. Since the velocity gradient is positively related to the shear stress, this result confirms the enlargement of negative wall shear stress again.
Figure 8b illustrates the velocity gradient curve between the top of the microstructure and the top of the calculation domain. It is clear that the curve of the velocity gradient gradually shifts toward the high-speed direction as the flow velocity increases. The fluid above the microstructure usually reaches the extreme value of velocity at a height of 2.5 × 10⁻³ m under different velocity conditions. However, compared with the velocity gradient of the smooth model (marked by the dotted line in Figure 8b), the velocity gradient extracted from the non-smooth model is always less than that obtained from the smooth model with the increasing of flow velocity. It can be inferred that the existence of the micro-vortex provides a co-directional push to the fluid above the microstructure, thereby reducing the velocity gradient between the fluids.

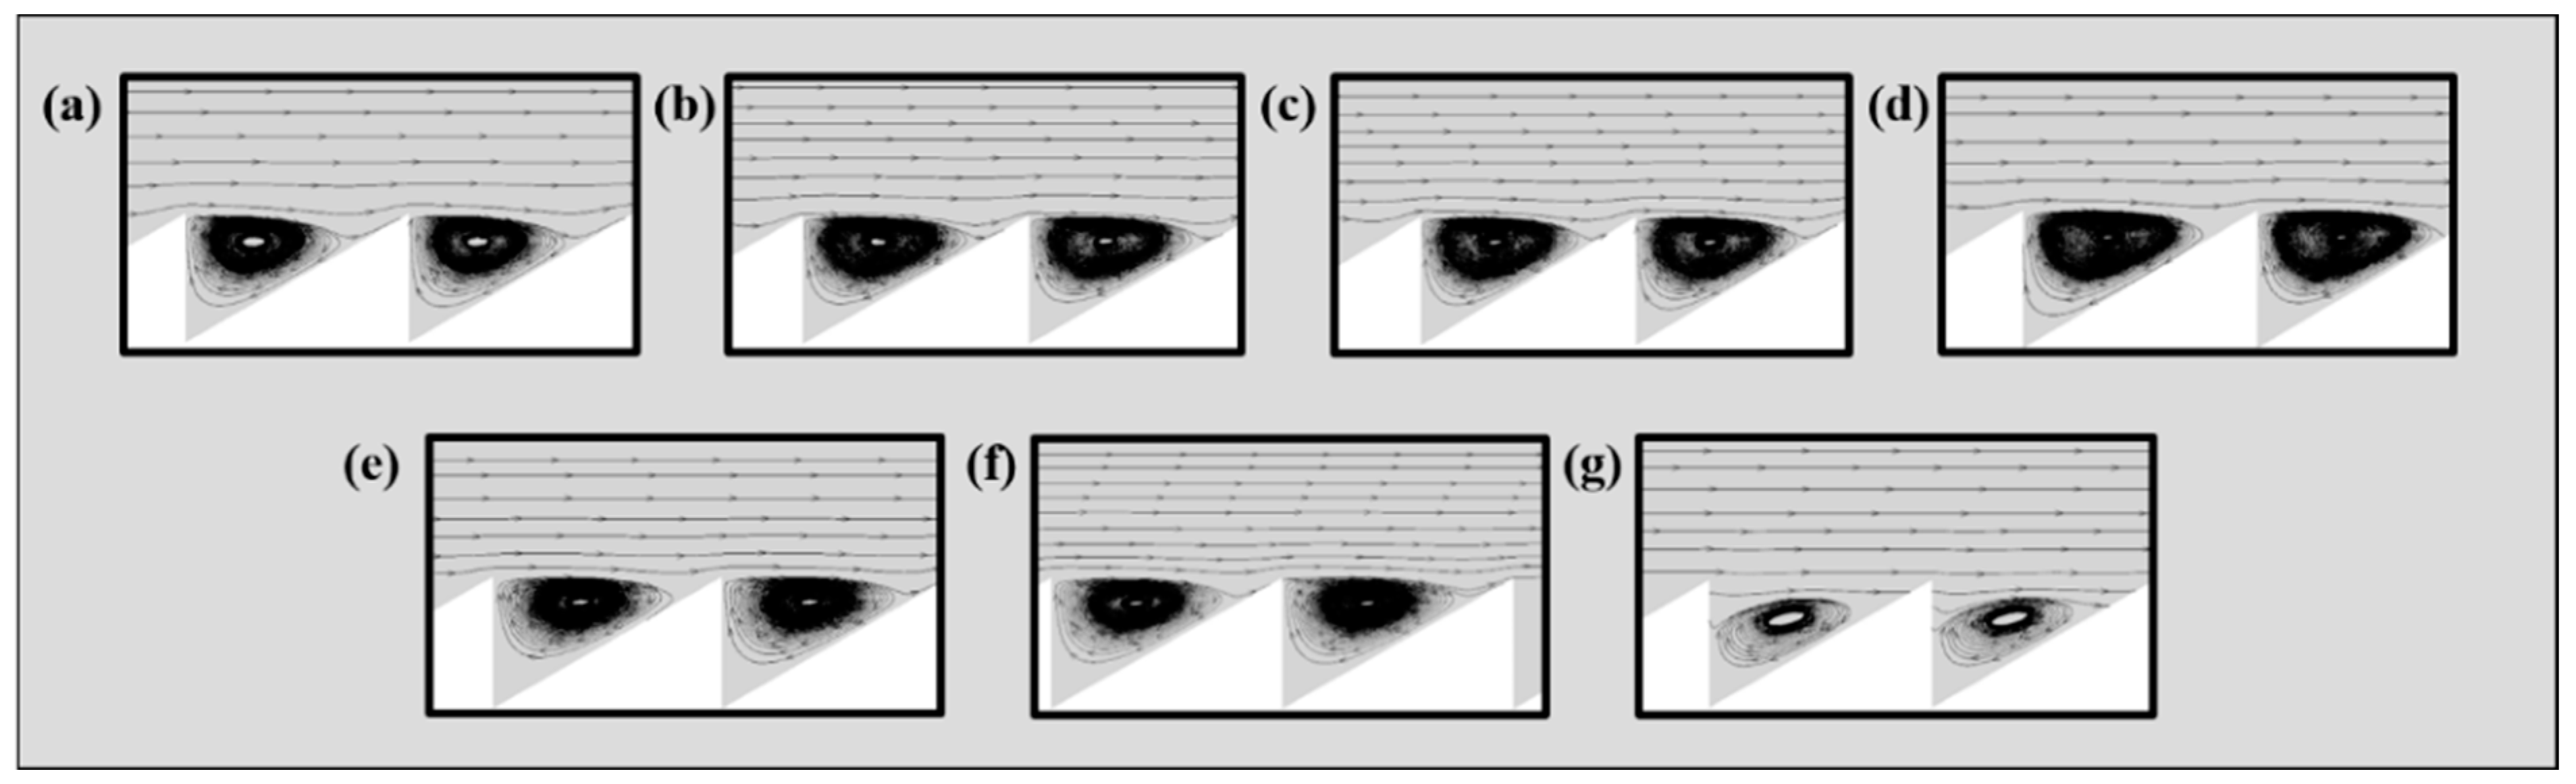
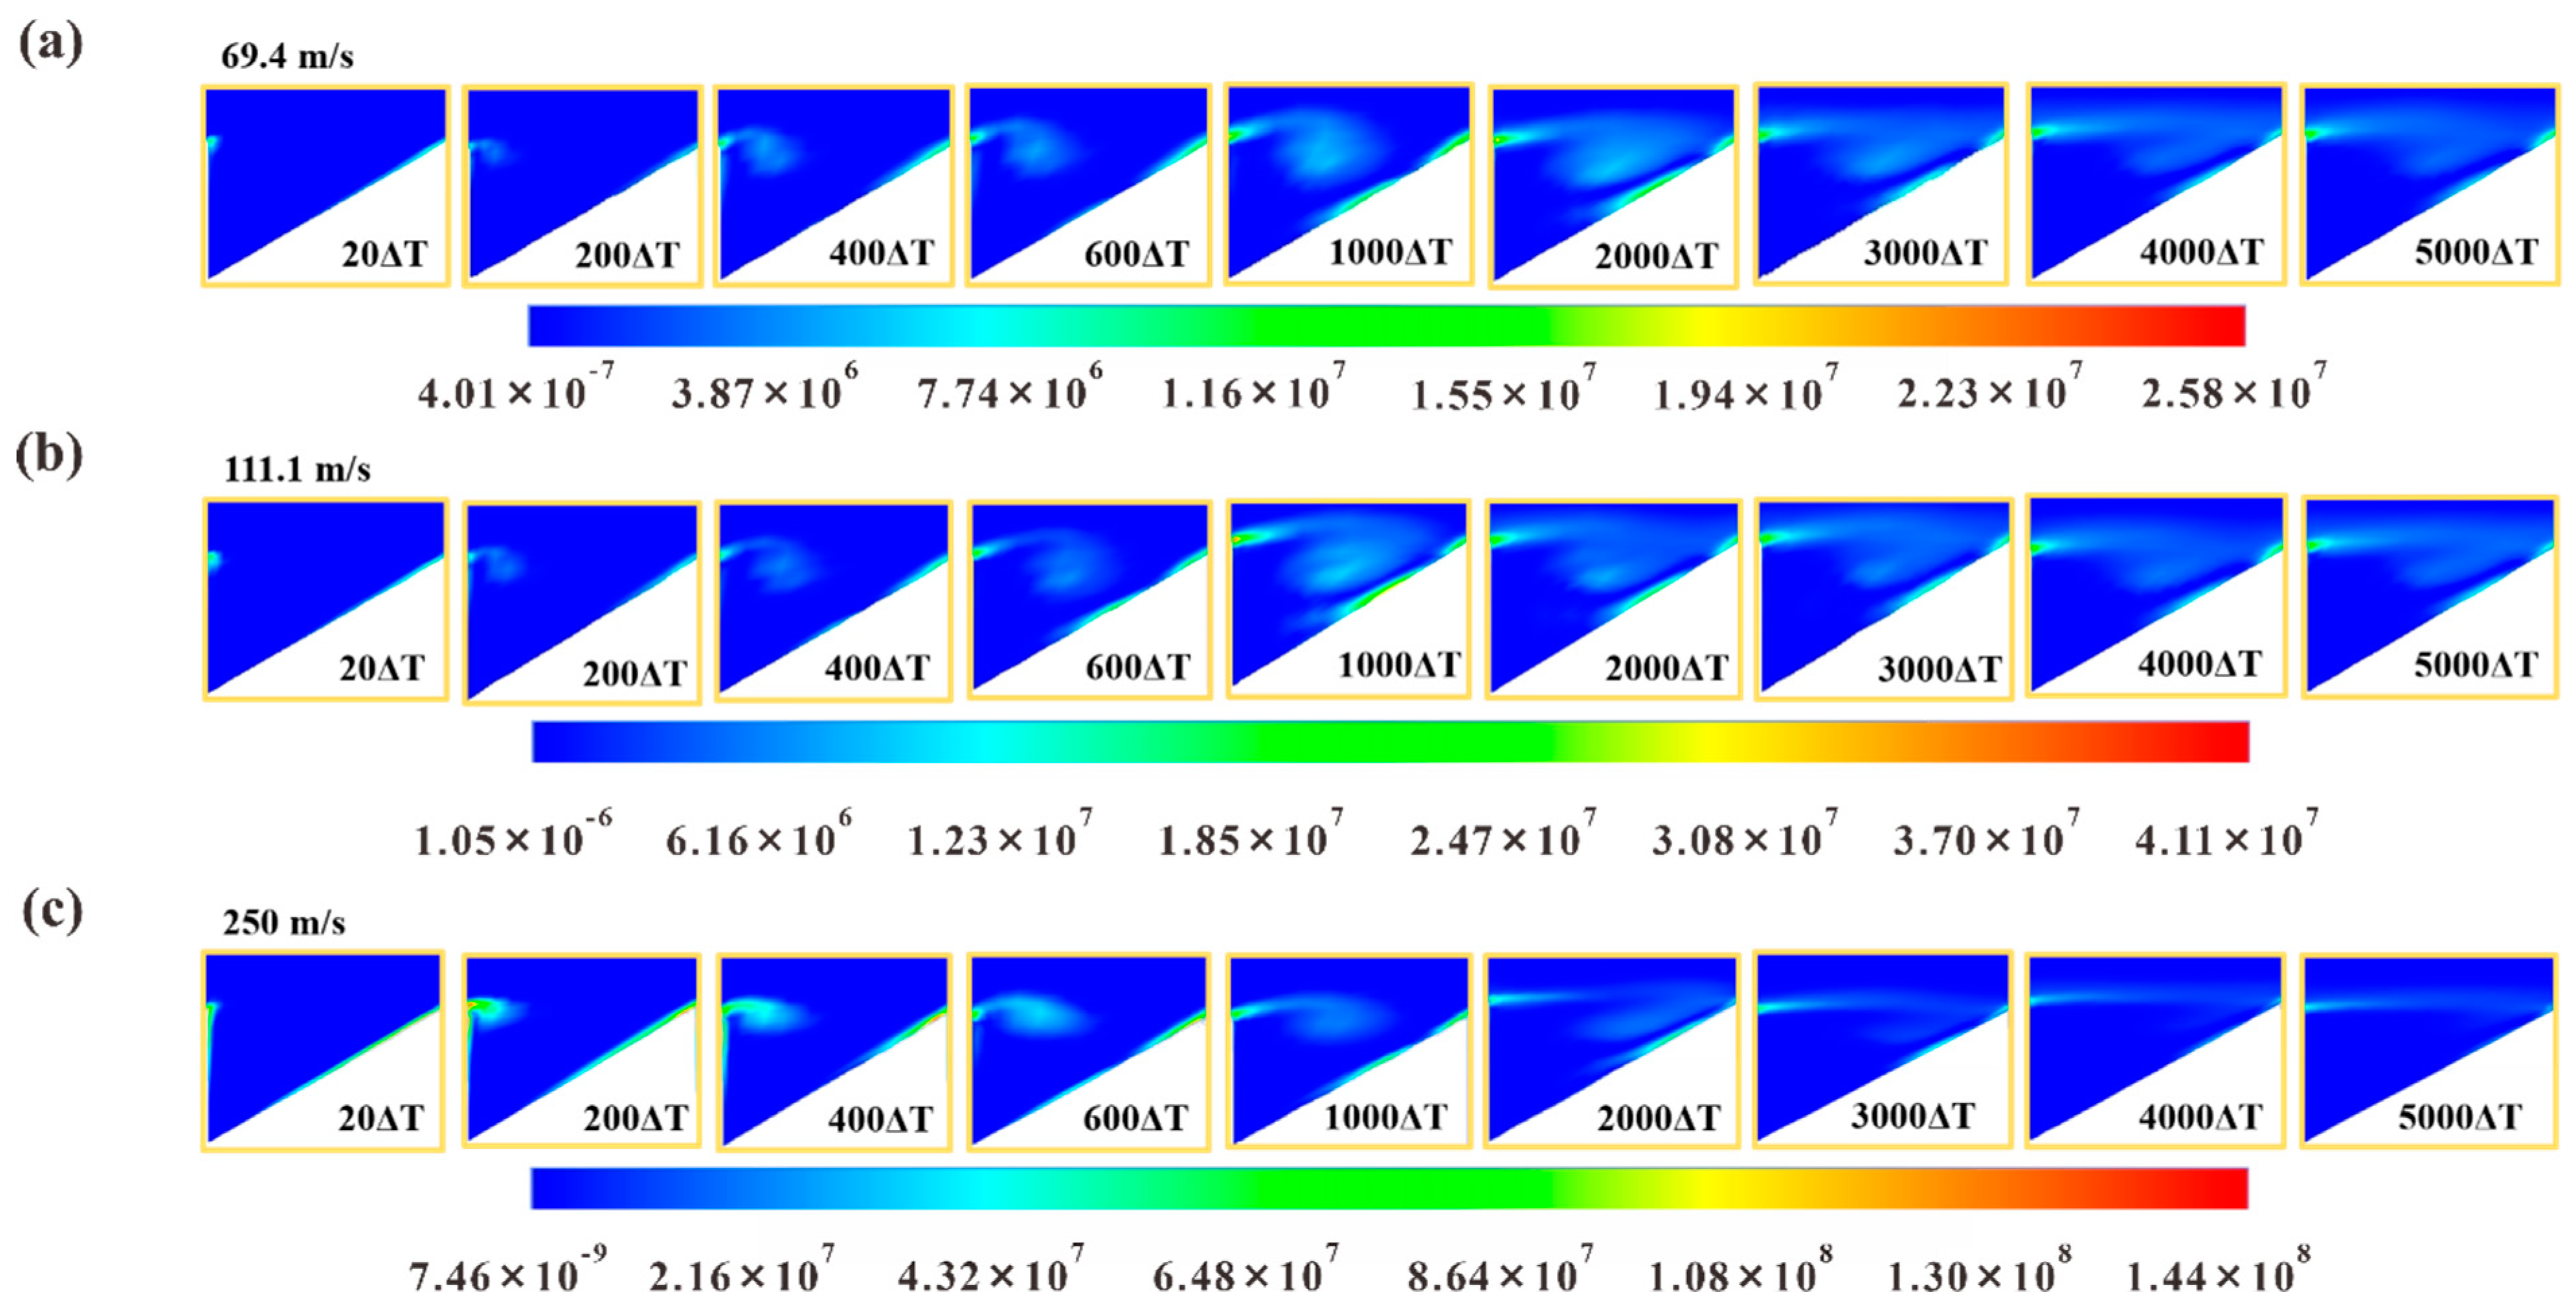
3.4. Evolution of Micro-Vortex with Various Flow Velocity

Based on the previous analysis, it is worth noting that the drag reduction ability of the micro-vortex is also greatly affected by the high-speed fluid. Therefore, it is important to analyze the variation of micro-vortex with increasing flow velocity. Turbulence intensity is an important index for evaluating the energy dissipation. Three different flow velocities were selected to explore the influence of the flow velocity on the micro-vortex as shown in Figure 9. Figure 9a shows the turbulence intensity of the horizontal direction within the microstructure under the velocity of 69.4, 111.1, and 250 m/s. The position of data collection is displayed by the blue dashed line in this figure. It can be seen that the turbulence intensity augments significantly with the development of flow velocity. Similarly, the turbulence intensity of vertical direction in this structure also rises simultaneously as the flow velocity aggrandizes, as displayed in Figure 9b. Hence, it can be speculated that both the intensity of turbulence and the energy dissipation increase sharply with the increase of flow velocity. Meanwhile, the kinetic energy exchange also magnifies near the wall, resulting in an enlargement of viscous resistance. Furthermore, the enlargement of energy dissipation can make it difficult to maintain the micro-vortex. Therefore, if the micro-vortex is hard to maintain, the contact area between the fluid and the microstructure is amplified, giving rise to an aggrandizement in drag reduction.
The Reynolds-averaged Navier-Stokes (RANS) method used in the preceding work has an excellent ability for calculation in a steady flow field. However, the large eddy simulation (LES) method is required for simulation in order to acquire the subtle flow characteristics and variation in the flow field. Therefore, the LES method is used for transient simulation with the time step (Δt) of 1 × 10⁻⁹ s, 9 × 10⁻¹⁰ s, and 4 × 10⁻¹⁰ s at three different speeds, respectively. The variation of micro-vortexes in the microstructure under different velocity conditions is illustrated in Figure 10. It is obvious that the micro-vortex is induced in the microstructure with the development of the flow field. The evolution of the micro-vortex at different speeds usually achieves stability at 3000 Δt. Under the flow velocity of 111.1 m/s, the development of micro-vortex is significantly faster than that under the flow velocity of 69.4 m/s in the flow field. Meanwhile, the size of micro-vortex at a higher speed is obviously larger than that under a lower speed in the steady state, which is consistent with the results in Figure 6. Moreover, the micro-vortex is developed completely at 1000 Δt under the flow velocity of 111.1 m/s, while the micro-vortex is fully developed at 2000 Δt under the flow velocity of 69.4 m/s.
It is worth noting that the micro-vortex becomes stronger but smaller at the velocity of 250 m/s than that at the velocity of 111.1 m/s. When the micro-vortex fully evolves at the same time step of 2000 Δt, the micro-vortex gradually constricts over time and even shows a tendency to disappear under the flow velocity of 250 m/s. This proves again that the micro-vortex becomes difficult to maintain gradually with the growth of flow velocity. Hence, this is supposed to be one of the reasons for the increase in drag under the condition of high-speed flow field, which verifies the above speculation.

3.5. Sensitivity Analysis of Structure Height on Flow Velocity

Two microstructures with different height were selected to study the influence of the drag reduction ratio on velocity at different height, as shown in Figure 11a. It can be seen that the drag reduction ratio of the two microstructures with the heights of 40 μm and 50 μm decreases with the augment of velocity. Otherwise, the downward trend of different microstructures is extremely similar. In addition, there is an increase in the drag reduction ratio, while the height of the microstructure decreases. However, the difference in drag reduction ratio between different the heights of 40 μm and 50 μm is expanded with the growing flow velocity.
The variation trend of the drag reduction ratio with flow velocity is presented in Figure 11b. It can be seen that the difference of drag reduction ratio (Δ-drag reduction) caused by the altitude intercept has a power function relationship with the flow velocity. The relationship between Δ-drag reduction and flow velocity is verified to be
y = 0.000250068 × x 1.89196
This means that the variation of microstructure height is extraordinarily sensitive to flow velocity in drag reduction field. Although the barchan dune structure with a certain height can effectively reduce the drag under incompressible conditions, the decrease of height is different to fundamentally reverse the tendency of increasing drag with the augment of flow velocity. Higher height of microstructure will cause more dramatic changes in drag-reduction with the increase of flow velocity. Therefore, the height of surface microstructure should be controlled reasonably under high-speed fluid environment in order to avoid the unexpected drag resistance augment. The optimum matching relationship between structure height and flow velocity should be sufficiently considered in order to satisfy the requirement of practical application with high-speed flow.

4. Conclusions

This work revealed that the drag reduction performance induced by the microstructure inspired by the cross-section of barchan dune was affected by the flow velocity significantly. Overall, the drag reduction ratio was decreased while the pressure drag and viscous resistance was enhanced simultaneously with the augment of flow velocity. Otherwise, drag analysis revealed that the total drag was a power function of flow velocity, which meant that the effect of flow velocity on drag was extremely fierce. Additionally, the microstructure improved the thickness of the boundary layer with a growth rate below 14.2%, and then reduced the viscosity resistance with limits during the growth of flow velocity. Moreover, the micro-vortex caused by microstructure provided the reverse wall shear stress with the maximum value ranged from −4.77 Pa to −51.27 Pa, and then reduced the velocity gradient above the microstructure, thereby improving the of drag reduction effect. However, both RANS and LES model analyses showed that the excessive velocity could lead to the dissipation of micro-vortex, which augmented the contact area between the fluid and the surface, resulting in the enlargement of viscous resistance. Furthermore, the velocity sensitivity analysis revealed that the variation of microstructure height had a significant influence on drag reduction at high flow velocity. The negative influence of surface structure height on drag should be fully considered when designing aircraft surface structure under high-speed fluid environments.

Supplementary Materials

The following supporting information can be downloaded at: https://www.mdpi.com/article/10.3390/coatings12050563/s1, Figure S1: Illustrations of simulation model. (a) Barchan dune topography in nature, (b) Typical model and cross-section parameters of a structural unit, (c) typical cross-section of the model, Figure S2: The comparison between the theoretical values and the calculated values under different turbulence models, Figure S3: Validation of the grid independence. References [29,31] are also cited in the supplementary materials.

Author Contributions

Conceptualization, J.J.; methodology, Y.S.; validation, J.J., Y.S., J.T., Y.X., Z.W. and S.L.; writing—original draft preparation, J.J. and Y.S.; writing—review and editing, J.T. and Y.S.; visualization, W.L. and Z.W.; funding acquisition, J.T., Y.S. and J.J. All authors have read and agreed to the published version of the manuscript.

Funding

This work was supported by the National Natural Science Foundation of China (No. 52075246, 12002364, and U1937206), the Natural Science Foundation of Jiangsu Province (No. BK20211568), the Project Funded by China Postdoctoral Science Foundation (No. 2019M661826), Open Fund of Key Laboratory of Icing and Anti/De-icing (No. IADL20190202 and IADL20200407), the Project Funded by the Priority Academic Program Development of Jiangsu Higher Education Institutions, and the NUAA Innovation Program for Graduate Education (KYCX19_0181).

Institutional Review Board Statement

Not applicable.

Informed Consent Statement

Not applicable.

Data Availability Statement

The data presented in this study are available within the article.

Conflicts of Interest

The authors declare no conflict of interest.

References

  1. Abbas, A.; Bugeda, G.; Ferrer, E.; Fu, S.; Periaux, J.; Pons-Prats, J.; Valero, E.; Zheng, Y. Drag reduction via turbulent boundary layer flow control. Sci. China Technol. Sci. 2017, 60, 1281–1290. [Google Scholar] [CrossRef] [Green Version]
  2. Quadrio, M.; Ricco, P. Critical assessment of turbulent drag reduction through spanwise wall oscillations. J. Fluid Mech. 2004, 521, 251–271. [Google Scholar] [CrossRef] [Green Version]
  3. Appartaim, R.; Mezonlin, E.D.; Johnson, J.A., III. Turbulence in plasma-induced hypersonic drag reduction. AIAA J. 2002, 40, 1979–1983. [Google Scholar] [CrossRef]
  4. Wang, G.H.; Jiang, N. Influence of periodic disturbance on statistic character of turbulent boundary layer. J. Aerosp. Power 2007, 22, 1505–1511. [Google Scholar]
  5. Gouder, K.; Potter, M.; Morrison, J.F. Turbulent friction drag reduction using electroactive polymer and electromagnetically driven surfaces. Exp. Fluids 2013, 54, 1441. [Google Scholar] [CrossRef] [Green Version]
  6. Aubrun, S.; McNally, J.; Alvi, F.; Kourta, A. Separation flow control on a generic ground vehicle using steady microjet arrays. Exp. Fluids 2011, 51, 1177–1187. [Google Scholar] [CrossRef]
  7. Yao, Y.; Luo, J.; Liu, H.; Zhu, K. Water tunnel experimental investigation on drag reduction of coating surface wall. Procedia Eng. 2015, 126, 247–253. [Google Scholar] [CrossRef]
  8. Shirtcliffe, N.J.; McHale, G.; Newton, M.I.; Zhang, Y. Superhydrophobic copper tubes with possible flow enhancement and drag reduction. ACS Appl. Mater. Interfaces 2009, 1, 1316–1323. [Google Scholar] [CrossRef]
  9. Lin, Y.; Chen, H.; Wang, G.; Liu, A. Recent Progress in Preparation and Anti-Icing Applications of Superhydrophobic Coatings. Coatings 2018, 8, 208. [Google Scholar] [CrossRef] [Green Version]
  10. Oeffner, J.; Lauder, G.V. The hydrodynamic function of shark skin and two biomimetic applications. J. Exp. Biol. 2012, 215, 785–795. [Google Scholar] [CrossRef] [Green Version]
  11. Walsh, M.J. Viscous drag reduction in boundary layers. Prog. Astronaut. Aeronaut. 1990, 123, 203–261. [Google Scholar]
  12. Walsh, M.J.; Weinstein, L.M. Drag and heat-transfer characteristics of small longitudinally ribbed surfaces. AIAA J. 1979, 17, 770–771. [Google Scholar] [CrossRef]
  13. Walsh, M.J. Riblets as a viscous drag reduction technique. AIAA J. 1983, 21, 485–486. [Google Scholar] [CrossRef]
  14. Han, X.; Zhang, D.; Li, X.; Li, Y. Bio-replicated forming of the biomimetic drag-reducing surfaces in large area based on shark skin. Chin. Sci. Bull. 2008, 53, 1587–1592. [Google Scholar] [CrossRef] [Green Version]
  15. Wen, L.; Weaver, J.C.; Lauder, G.V. Biomimetic shark skin: Design, fabrication and hydrodynamic function. J. Exp. Biol. 2014, 217, 1656–1666. [Google Scholar] [CrossRef] [PubMed] [Green Version]
  16. Jung, Y.C.; Bhushan, B. Biomimetic structures for fluid drag reduction in laminar and turbulent flows. J. Phys. Condens. Matter 2010, 22, 035104. [Google Scholar] [CrossRef]
  17. Bixler, G.D.; Bhushan, B. Shark skin inspired low-drag microstructured surfaces in closed channel flow. J. Colloid Interface Sci. 2013, 393, 384–396. [Google Scholar] [CrossRef]
  18. Xu, Y.; Song, W.; Zhao, D. Efficient Optimization of Ringlets for Drag Reduction over the Complete Mission Profile. AIAA J. 2018, 56, 1483–1494. [Google Scholar] [CrossRef]
  19. Pang, R.; Sang, W.; Cai, Y. Two-Dimensional Simulation Study on Aerodynamic Drag Reduction Characteristics of Superhydrophobic Structures. In Proceedings of the 2018 Asia-Pacific International Symposium on Aerospace Technology, Chengdu, China, 16–18 October 2018. [Google Scholar]
  20. Song, X.W.; Zhang, M.X.; Lin, P.Z. Skin Friction Reduction Characteristics of Nonsmooth Surfaces Inspired by the Shapes of Barchan Dunes. Math. Probl. Eng. 2017, 2017, 1–12. [Google Scholar] [CrossRef]
  21. Sauermann, G.; Andrade, J.S., Jr.; Maia, L.P.; Costa, U.M.S.; Araújo, A.D.; Herrmann, H.J. Wind velocity and sand transport on a barchan dune. Geomorphology 2003, 54, 245–255. [Google Scholar] [CrossRef]
  22. Bishop, M.A. Point pattern analysis of north polar crescentic dunes, Mars: A geography of dune self-organization. Icarus 2007, 191, 151–157. [Google Scholar] [CrossRef]
  23. Durán, O.; Claudin, P.; Andreotti, B. On aeolian transport: Grain-scale interactions, dynamical mechanisms and scaling laws. Aeolian Res. 2011, 3, 243–270. [Google Scholar] [CrossRef]
  24. Douady, S. Equilibrium versus disequilibrium of barchan dunes. Geomorphology 2011, 125, 558–568. [Google Scholar]
  25. Finkel, H.J. The barchans of southern Peru. J. Geol. 1959, 67, 614–647. [Google Scholar] [CrossRef]
  26. Sauermann, G.; Rognon, P.; Poliakov, A.; Herrmann, H.J. The shape of the barchan dunes of Southern Morocco. Geomorphology 2000, 36, 47–62. [Google Scholar] [CrossRef]
  27. Jiawei, J.; Yizhou, S.; Jie, T.; Zhenfeng, J.; Xinyu, X.; Chaojiao, Z. Drag reduction characteristics of microstructure inspired by the shapes of barchan dunes under high speed flow condition. J. Renew. Mater. 2021, 10, 781–797. [Google Scholar]
  28. Faheem, A.; Ranzi, G.; Fiorito, F.; Lei, C. A numerical study of turbulent mixed convection in a smooth horizontal pipe. J. Heat Transf. 2016, 138, 012501. [Google Scholar] [CrossRef]
  29. Shih, T.H.; Liou, W.W.; Shabbir, A.; Yang, Z.; Zhu, J. A new k-epsilon eddy viscosity model for high Reynolds number turbulent flows: Model development and validation. Comput. Fluids 1994, 24, 227–238. [Google Scholar] [CrossRef]
  30. Li, M.; Khan, T.S.; Al-Hajri, E.; Ayub, Z.H. Single phase heat transfer and pressure drop analysis of a dimpled enhanced tube. Appl. Therm. Eng. 2016, 101, 38–46. [Google Scholar] [CrossRef]
  31. Launder, B.E.; Spalding, D.B. The Numerical Computation of Turbulent Flows. Numerical Prediction of Flow, Heat Transfer, Turbulence and Combustion; Pergamon Press: Oxford, UK, 1983; pp. 96–116. [Google Scholar]
Figure 1. Numerical simulation domain of microstructure surface.
Coatings 12 00563 g001
Figure 2. The relationship between flow velocity and drag reduction ratio.
Coatings 12 00563 g002
Figure 3. Variations of drag with increasing flow velocity.
Coatings 12 00563 g003
Figure 4. Pressure contour map of different flow velocity (a) 69.4 m/s, (b) 83.3 m/s, (c) 97.2 m/s, (d) 111.1 m/s, (e) 125 m/s, (f) 138.9 m/s, and (g) 250 m/s.
Coatings 12 00563 g004
Figure 5. Variation in turbulent boundary layer thickness with flow velocity.
Coatings 12 00563 g005
Figure 6. Velocity streamline diagram of structures under different flow velocity conditions, (a) 69.4 m/s, (b) 83.3 m/s, (c) 97.2 m/s, (d) 111.1 m/s, (e) 125 m/s, (f) 138.9 m/s, and (g) 250 m/s.
Coatings 12 00563 g006
Figure 7. Wall shear stress of microstructure unit under different flow velocity conditions in X direction, (a) wall shear stress of 4 microstructure units, (b) a single wall shear stress unit with accurate values.
Coatings 12 00563 g007
Figure 8. Velocity gradient curves under different flow velocity conditions, (a) velocity gradient curves between the bottom and the top of the microstructure, (b) velocity gradient curves between the top of the microstructure and the top of the calculation domain.
Coatings 12 00563 g008
Figure 9. Turbulence intensity of different flow velocities on various directions: (a) along the structural surface, (b) perpendicular to the structural surface.
Coatings 12 00563 g009
Figure 10. Diagram of vorticity with different velocity under the LES model: (a) 69.4 m/s, (b) 111.1 m/s and (c) 250 m/s.
Coatings 12 00563 g010
Figure 11. (a,b) Influence of different structure height on drag reduction ratio under variations in flow velocities.
Coatings 12 00563 g011
Table 1. Comparison between calculated values and theoretical values.
Flow Velocity (m/s)Cf of Simulation Value (Symmetry Boundary)Cf of Theoretical Value (Symmetry Boundary)Relative Error (%)Cf of Simulation Value (Wall Boundary)Cf of Theoretical Value (Wall Boundary)Relative Error (%)
69.40.0047630.0047131.060.0040660.0041060.97
83.30.0043180.0045485.060.0037650.0039594.90
97.20.0041720.0044105.400.0036390.0038395.20
111.10.0040600.0042935.430.0035250.0037385.71
125.00.0039450.0041935.910.0034270.0036506.11
138.90.0038190.0041066.990.0033320.0035756.80
Publisher’s Note: MDPI stays neutral with regard to jurisdictional claims in published maps and institutional affiliations.

