Abstract
(1) Background: Due to the precarious situation of many monuments or archeological sites, analytical investigations are necessary to obtain information about the used materials, as well as to identify the most appropriate solutions for their conservation/restoration. This paper addresses the characterization of mural painting fragments collected during the excavation in 2018 in Rapoltu Mare (La vie), Deva. (2) Methods: Specific analytical techniques were used, as follows: X-ray diffractometry (XRD), wavelength dispersive X-ray fluorescence (WDXRF), optical microscopy (OM), zoom microscopy and scanning electron microscopy (SEM), spectroscopic techniques (UV–Vis, FTIR, Raman), porosity and thermal analysis, all of which provide information about the structure, chemical composition, morphology and topography of pigments and their deterioration as well. (3) Results: Up to seven different pigments were identified: Egyptian blue, carbon, calcite, gypsum, hematite, goethite and green earth. Egyptian Blue is identified in all the other color areas, except the white area: in the green zone (as degradation product with beeswax) and in the red zone (in mixture with ochre) too. In addition, carbon and beeswax were highlighted as toner and binder for pigments, respectively. In the presence of the organic beeswax binding environment, the Egyptian blue pigment particles darkened or turned yellow significantly, changing the blue to a greenish color. It is also possible to identify wollastonite (CaSiO3) in the blue pigment, which indicates that the temperature used in the manufacturing of Egyptian blue was higher than 950 °C from thermal analysis. The presence of apatite, hematite and gypsum deposits in the Hunedoara region certifies that these pigments could have been of local origin, as demonstrated by the presence of analytically identified elements (Fe, P, S, Ca). (4) Conclusions: The analytical techniques used for such investigations have highlighted the main pigments used in Roman times for various Roman murals.
1. Introduction
Archaeological discoveries in recent years have shown that all the buildings or ruins from the Roman period are decorated with various decorative paintings, and the nature of the pigments used is of great interest, due to the historical importance of these buildings, once under Roman rule. Even if some decorative pigments are not in a good state of preservation due to the degradation processes suffered, as well as the attack of pollutants, their identification may be of interest in terms of the materials used, the techniques for preparing these pigments and the application (on various supports: murals, mosaics and mortars) [1,2,3,4,5,6]. The information reported in the literature generally provides details for elucidating the social, political or economic characteristics of the geographical areas of that period [7].
Regarding the identified colors, in the Roman murals, the colors red and yellow are the most common, followed by the colors blue and green, knowing that the latter are more expensive. In historical documents, Pliny and Vitruvius mention pigments such as azurite, lazurite, chrysocola, indigo and Egyptian blue (for the color blue) and verdigris, malachite, celadonite, glauconite and chlorite (for the color green) [8,9]. Analytical controversies are found in the most common blue pigment, namely Egyptian blue, and in the case of green pigments, the analytical difficulties of identification are found in celadonite and glauconite, generically called “green earth”, difficult to characterize analytically. Given that Egyptian blue undergoes discoloration and degradation processes that influence other surrounding colors, it is important to identify paint lines, such as wax or beeswax.
Several such cases are reported in the literature, such as Ampurias, Cartagena and Baelo Claudia, Spain, dating from the 1st century BC until the second century AD [10] (emulsified beeswax), murals from Villa Papyri [11] and a painted wooden ceiling at the Telephus Relief House, both from Herculaneum (and dating to before 79 AD) [12], (tempera) Mycenaean murals at Nestor’s Palace in Pylos, Greece (before 1180 BC) [13], an Etruscan mural (4th century BC) [14] and a sarcophagus of Etruscan painted alabaster (4th century BC) (egg tempera) [15].
Archaeometric studies on Roman archeological sites in western Romania referred only to the political, social and economic status for that period, the analytical investigations not being reported so far [16,17,18,19].
Hunedoara is one of the richest counties in settlements and vestiges of the Roman Empire, Roman imperial roads and numerous castrums being discovered, and over time the remains of dozens of rustic villas.
Rapoltu Mare is a Romanian village in the Hunedoara area, in the northwestern part of the Orăștiei Corridor, in the south of the Metaliferi Mountains, approximately 1.5 km upstream of the confluence area of Streiului and Mureș. The geographical positioning, the soil and the subsoil rich in mineral resources (gold) of this region have attracted human communities since ancient times, and in Roman times, this area registered a wide activity, being located at the intersection of roads connecting the great centers Sarmizegetusa, Apulum and Micia. The intense activity carried out around the andesite mining quarry from Măgura Uroiului, as well as the geographical proximity to the Germisara settlement, also favored the development of the housing structures located on the terraces around the village of Rapoltu Mare [20].
The most extensive period of time was the Roman period when on the terrace around Rapoltu Mare there was the villa ‘’La vie’’, which was developed in the 2nd and 3rd centuries AD. By definition, the villa was a rural settlement that contained elements from both urban style and rural agricultural villages. It had a Hellenistic appearance surrounded by an archway that was built around the second quarter of the 1st century AD. and occupied at least until the middle or end of the 5th century AD. Towards the middle of the 3rd century, the villa from Rapoltu Mare—La vie enters a process of decline, as does the entire Dacia Province. The Roman settlement ends violently, the entire residence being destroyed in the middle of the third century AD. The building suggests that the villa located here enjoyed prosperity, a good argument in this regard being the discovery of numerous fragments of frescoes that seem to have adorned several buildings in this ensemble.
In this case, for the villa from Rapoltu Mare, both blue and green pigments, but also red and yellow, have been used, and it is important to identify the stage in which these pigments are and their degradation processes. In general, various investigative techniques have been used in the literature for these pigments: X-ray power diffraction (XRD), X-ray fluorescence (XRF), but also microscopic techniques and OM/AFM/SEM/TEM/ESEM/EDAXS techniques, all contributing to the identification of the chemical state and to the morphology and topography of the surfaces [21,22], but also to the highlighting of the influence of the environment and the weathering mechanism.
In this paper, for the first time in the literature, several complex analytical methods will be used to characterize the pigments and binders used for the murals at Villa Romana Rapoltu Mare, Romania. Being an original report with a high degree of novelty, to identify the types and stage of pigments and the technologies used in ancient murals, specific techniques such as X-ray diffractometry (XRD) and wavelength dispersive X-ray fluorescence (WDXRF) were used to identify chemical composition; optical microscopy (OM), stereomicroscopy, and scanning electron microscopy (SEM) techniques to study the morphology and topography of pigments in Roman murals; UV–Vis spectrophotometry (UV–Vis), Fourier transform infrared spectroscopy (FTIR), and Raman spectroscopy that provide both elementary and molecular information for such pigments and their deterioration processes. The presence of beeswax was also highlighted to demonstrate an encaustic painting technique.
2. Materials and Methods
2.1. Materials
Numerous other pieces of fresco were discovered throughout the area, proving that the gate building had been plastered and painted in the same manner (Figure 1). It could be noticed that, in the lower part, the background is red in the parts recovered, so far the geometric patterns of different colors being visible. The upper part, better preserved, is painted in white and blue. However, the color green has been identified in this fresco.
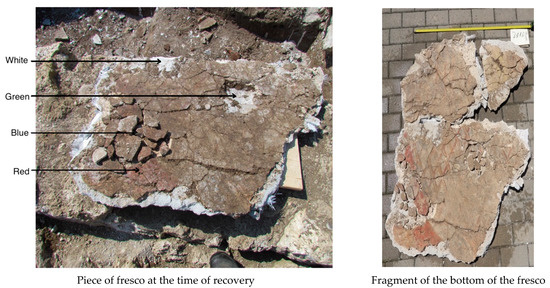
Figure 1.
Photos of the Rapoltu Mare fresco.
The analyzed samples consist of 10 wall painting shards and two fresco fragments, colored in bright or purple red, yellow, white, black, green and blue light. These samples, have fine decorations, containing a full color palette used for decoration of vanished rooms belonging to one or more private roman buildings.
2.2. Equipment
The X-ray diffraction (XRD) was recorded with an X-ray Rigaku Ultima IV, diffractometer (Rigaku, Tokyo, Japan) with wavelength of Cu-Kα radiation (λ = 0.15406 nm) operating at 40 kV and 30 mA, in the range 5°–80° 2θ angular range and a scanning rate of 2° min−1. The Rietveld method has been used by a nonlinear least square’s method, for a reasonable approximation of many free parameters, as: peak shape, cell lattice, crystallinity, and crystallite size [23].
The wavelength dispersive X-ray fluorescence (WDXRF) was carried out on a Rigaku ZSX Primus II spectrometer (Rigaku, Tokyo, Japan) equipped with an X-ray tube with Rh anode, 4.0 kW power, and a front Be window (30 µm thickness). The measurements were carried out under a vacuum atmosphere on pressed pellets.
Diffuse reflectance UV/Vis spectroscopy (DR-UV) has been registered with a T60 UV–VIS Spectrophotometer (PG Instruments, Lutterworth, UK) with split-beam technology, equipped with a sample analysis device, monochromator in a Czerny–Turner mount 1200 lines/mm, and spectral range: 190–1100 nm, using a BaCO3 pellet as a white reference.
The Fourier Transformed Infrared Spectroscopy (ATR-FTIR, Thermo Fisher Scientific, Waltham, MA, USA) in the range of 4000–400 cm−1 has been recorded with a Vertex 80 spectrometer (Bruker Optik GMBH, Billerica, MA, USA), equipped with a DRIFT accessory.
The Raman spectroscopy was performed using a portable analyzer (Xantus-2, Rigaku, Woodlands, TX, USA) equipped with 785 and 1064 nm laser, over a range from 200 to 2000 cm−1.
The optical microscopy was performed with a Novex trinocular microscope (Euromex Microscopen B.V., Arnhem, Holland) (magnifications: 40×, 100×, 400×, 1000×), in transmitted light, equipped with a digital video camera (Axiocam 105, Zeiss, Göttingen, Germany) for a real-time data acquisition. The images were processed using the ImageJ 1.50 software.
The Stereo trinocular stereomicroscope (EUROMEX Microscopen B.V., BD Arnhem, Holland), model 1903, was used for microscopic surface highlighting at magnification degrees of 7–45×, with direct lighting and incidence.
The scanning electron microscopy with energy dispersive spectroscopy (SEM–EDS) was recorded with a SU-70 (Hitachi, Tokyo, Japan) microscope, with a magnification range of 30−800,000×. Through the energy dispersive spectrometer (EDS), the qualitative and quantitative analysis (from Be (Z = 4) to Pu (Z = 94)) is allowed.
The porosity has been evaluated by nitrogen adsorption/desorption isotherms, at 77 K in the relative pressure range p/po = 0.005–1.0, recorded by using a NOVA2200e Gas Sorption Analyzer (Quantachrome, Boynton Beach, FL, USA). The BET (Brunauer–Emmet–Teller) method, t-plot analyses, and the BJH (Barret–Joyner–Halenda) methods allow the total surface area, total pore volume, and pore-size distribution curves of the substrates, respectively.
For the thermogravimetric analyses, a Pyris 1 TGA analyzer (PerkinElmer TGA-7, Waltham, MA, USA) with a scan range from 50 to 700 °C and a constant heating rate of 10 °C/min has been used. The sample was heated at a speed of 10 °C/min, from room temperature to 1000 °C, under continuous nitrogen, with a flow rate of 50 mL/min. The first stage of mass loss (up to 150 °C) corresponds to the loss of water, and between 150–500 °C can be a decomposition step (or two) and, at over 720 °C, it can be decomposition of carbonates, silicates, etc. (inorganic material).
3. Results and Discussion
The villa discovered at Rapoltu Mare—La Vie dates from the 2nd and 3rd centuries AD, and it is known that over time it went through several phases of construction in the Roman period. During the third century, the second stage of habitation continued, and, before the middle of the third century, the villa Rapoltu Mare—La Vie enters into a process of decline, as does the entire Dacia Province. The Roman settlement disappeared around the middle of the 3rd century AD. Many polychrome fragments from the decorated interiors with quality plaster did not survive.
The most used pigments in buildings erected during the Roman rule, and they are reported in different compositions and in different stages, as follows: earth pigments (red, yellow, brown ocher—iron oxides in different hydration states; green soils, having a complex structure of silicates, containing aluminum, iron, magnesium and potassium ions, were used less often due to its rarity) and carbon black (soot, coal) or manganese oxide MnO2. Natural pigments included green malachite (CuCO3·Cu(OH)2), blue azurite (2CuCO3·Cu(OH)2) and lapis lazuli (Na8[Al6Si6O24]Sn), red cinnabar (HgS), reddish yellow to orange realgar (As4S4)), and yellow orpiment (As2S3). The most famous and probably the oldest of the synthesized pigments was the Egyptian blue (CaCuSi4O10)—produced around 3000 BC. Celadonite is the small bluish green di-octahedron with the composition KFe3+(Mg, Fe2+)[Si4O10](OH)2, and Glauconite is a less crystalline structure with a theoretical composition of (K, Na)(Fe3+, Al, Mg)2(Si, Al)4O10(OH)2 [24,25,26]. The pigments identified in the samples, as well as the stage in which they are found, will be discussed in the following.
3.1. XRD/WDXRF Studies
The first stage of the analytical methodological approach proposed in this study consists of the semi-quantitative chemical analysis performed with the help of WDXRF mentioned above, Table 1. This technique showed that the main identification components are CaO and SO3, SiO2, Al2O3, Fe2O3, and as secondary substances, K2O, Na2O and MgO. The high CaO content and the presence of SO3 can be attributed mainly to the gypsum formed on the surface, or in white pigment, and the presence of aluminum, silicon and iron may indicate the presence of pigments present and stone substrates. Many samples contain carbon, most likely from the fire that destroyed the buildings, according to historical documents [27].

Table 1.
The WDXRF results obtained from Rapoltu Mare samples.
Blue pigments. We expected that the Egyptian blue pigment to be identified in these frescoes, according to reports in the literature [28,29], and Cu and Cl were detected in the blue area in very low concentrations, as WDXRF shows in Table 1.
The presence and relatively high concentration of phosphor could be due to the presence of vivianite being a hydrated iron phosphate (Fe3(PO4)2·8H2O, blue). Occurrences of vivianite deposits and of its use as pigment are listed in literature [30]. As a pigment, it only shows medium stability [31], a discoloration of this blue monoclinic phosphate to a greenish hue being attributed either to a changed Fe2+/Fe3+ ratio, or to its oxidation to green triclinic metavivianite Fe3(PO4)2(OH)2·6H2O, and finally to yellowish brown amorphous santabarbaraite Fe3(PO4)2(OH)3·5H2O [32]. This supposition has been taken into account due to the location of this Villa (Hunedoara and the golden triangle from this part of Romania), the gold presence being in the same deposits with apatite derivatives [33].
In all white areas, WDXRF spectroscopy detected a high concentration of Ca and a small amount of SO3, which is a sign of gypsum formed on surfaces, or in composition. Al, Si and Fe may be due to the pigments present and the stone substrates. Mg was detected in the WDXRF spectra of the white and earth layers, which may be an indication of the existence of huntite (Mg3Ca(CO3)4), another white pigment found in the painting technique [34].
Green samples reveal an earth-based green pigment based on glauconite and celadonite [35], with large green particles embedded in a very fine green matrix. As a minor component, it is As from orpiment. The green color has also been due to the degradation of Egyptian blue by various mechanisms. In the first, the initial blue color may change to green as the copper ions are extracted from the Egyptian blue and combine with the chloride ions and calcium carbonate to form copper chloride atacamite and paratacamite [36]. The second mechanism describes the cases in which the organic binding medium around the Egyptian blue pigment particles darkened or turned yellow significantly, changing the appearance of what was originally supposed to be blue, to a greenish color [37]. As atacamite or paratacamite have not been identified, the second mechanism is the plausible source of Egyptian blue degradation.
For the red pigment, the WDXRF elemental analysis indicates calcium and iron as the main elements corresponding to calcite and hematite, respectively. Interestingly, the red zone contains Cl and Cu, which is evidence of the presence of Egyptian blue, either by mixing with iron oxides, as indicated in the literature [38,39]. These results were supported by EDS results (Figure 2—for green and white samples) and the mineralogical composition of the pigment, identified by XRD qualitative analysis. However, the elemental analysis obtained from WDXRF confirms the presence of Fe and Cu (in red pigments) as well as minor amounts of As (in green pigments), while EDS gives major Ca peaks with lower percentages of Si, Al, Fe, Table 2. As a special mention, it has to be added that EDS has been recorded only for green and white pigments due to the very small amount of the other samples, and the inconsistency of the results (blue mixed with red pigments).
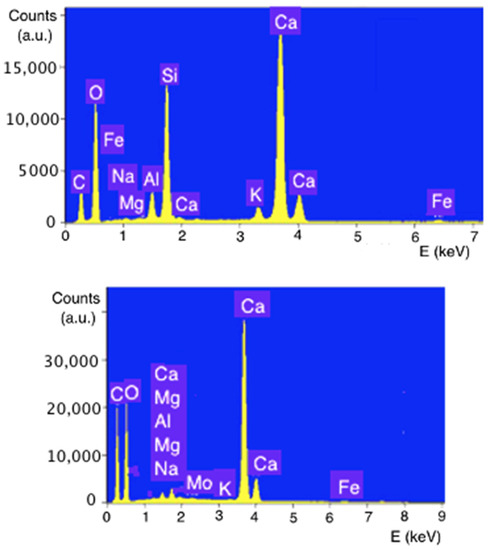
Figure 2.
EDS results for substrate and green pigment.
Table 2.
The EDS compositions for white and green pigments.
These statements could be checked by XRD data, both for substrate and for the green pigments, Figure 3. Even by the XRD technique, the presence of carbon (graphite) from the potential fire has been identified, Figure 4. The mineralogical phases found in the mortar sample by XRD analysis have been identified as calcite, as a major component, and quartz and gypsum as minor components. In addition, a small amount of albite, a sodium aluminosilicate, was detected [40].
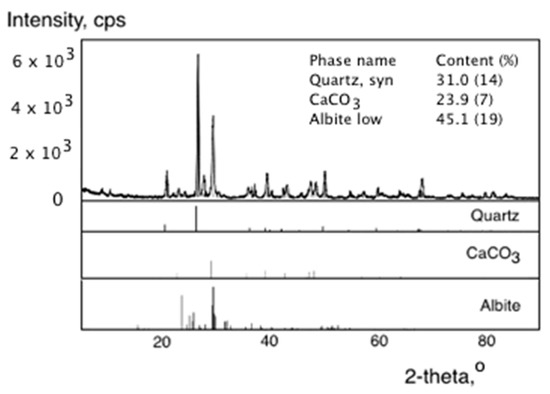
Figure 3.
XRD diagram of the white part of the fresco with Rietveld processing.
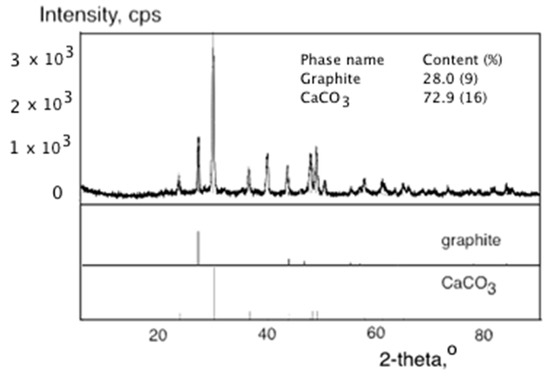
Figure 4.
XRD diagram of the black part of the fresco with Rietveld processing.
3.2. Microscopic Observations
The distribution of the pigment layers was microscopically examined by means of optical microscopy and by stereomicroscopy. For the blue, green and red pigment layers, it was observed that the pigments were applied over a layer of white earth (Figure 5), distributed on a white primer. In the cross section of the colored layer, a thickness of approximately 20 and 10 μm was observed, for the blue and red pigment layers, respectively. In the case of green pigment, a very thin layer was observed above the yellow-brown layer with a thickness of about 10 μm.
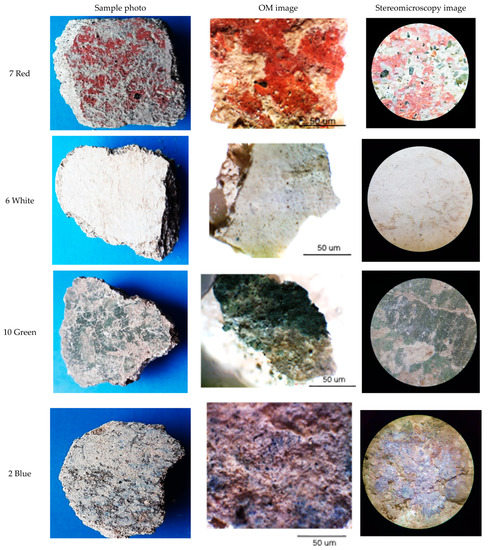
Figure 5.
Photos, OM and zoom microscopy of the investigated samples.
The SEM-EDS analysis of particulate distribution was used in order to identify the chemical composition of these samples, and the presence of the possible wax (or beeswax) used as glue for the paints has been identified, Figure 6. A glossed plate formation is visible, completely unusual for such paints, attributable to organic glue as wax or beeswax used to an encaustic painting technique [41,42,43].
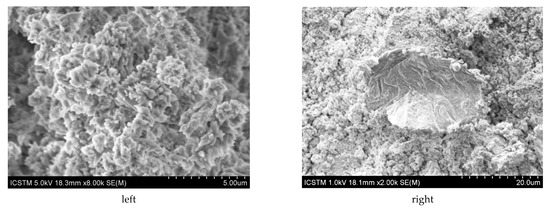
Figure 6.
The SEM images for the area with gypsum (left) and with waxes (right).
3.3. FTIR Results
By analyzing the above-mentioned techniques, it could be assumed that the pigments used to decorate the wall are Egyptian blue, green earth, iron ochres, green earth, orpiment, alone or in mixture, and, in addition, a carbon lamp-black and beeswax. FTIR spectroscopy argued and clarified these data, as it is shown in Figure 7.
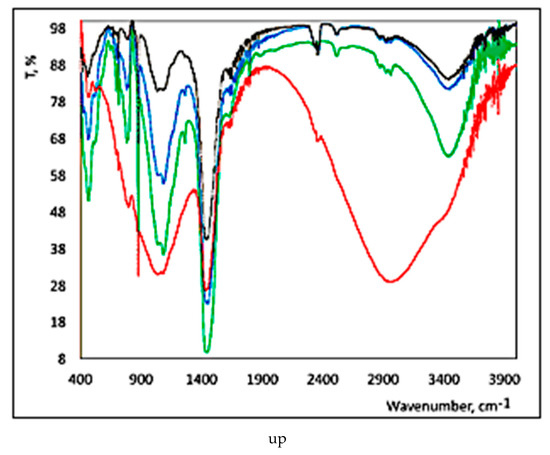
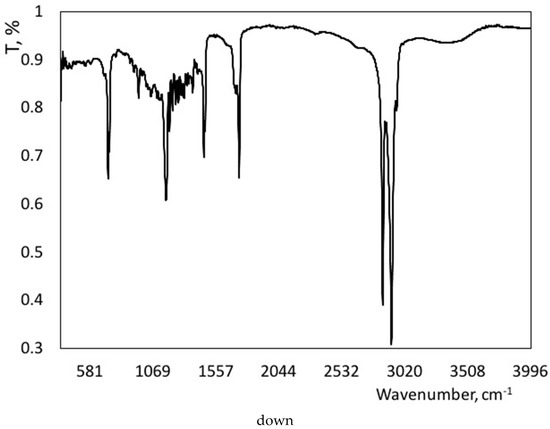
Figure 7.
FTIR spectra of the pigments (blue, green and red) (up) and beeswax (down).
FTIR–ATR spectra recorded on these pigments put into evidence similarities between them, as it is presented below:
The blue pigment (blue in Figure 7), with characteristic peaks in the region 1000 and 1050 cm−1 (Si−O−Si stretching vibrations), with typical bands (998, 1045, 1159 cm−1 and a specific band at 1080 cm−1) [44].
The green pigment (green in Figure 7) was identified as green earth (Terre Verte) by the bands: 3695 cm−1 (Al-O–H), 3553 and 3393 cm−1 (O–H); 1106 and 1004 cm−1 (Si–O) and 799 cm−1 (R–O–H, where R can be –Al, Fe+2, Fe+3, Mg). The FTIR-ATR spectra also show gypsum-specific bands at 3529, 3401, 1682, 1620, 1104 and 668 cm−1, the 1414 cm−1 band is due to calcite, and the quartz is identified by the 783 cm−1 band (from white area; black in Figure 7). The band at 3430 cm−1 can be assigned to the free hydroxyl ions of kaolinite (clay associated with ocher pigments), and, at 3140 cm−1, the band specific to the H–O–H structure in water and a wide peak attributed to hydrated ferric oxide appear. Kaolinite can also be identified by the bands of 3697, 3668, 3653 and 3620 cm−1 (OH stretching vibrations) and together with the bands of 935 and 915 cm−1 (OH bending vibrations).
Green colors could derive from green earths, which could contain mineral species, such as: glauconite, celadonite, chlorites, smectites, serpentinites and pyroxenes. A celadonite IR spectrum shows sharp and distinct bands in the region 3400–3700 cm−1 (stretching vibrations of hydroxyl groups, bands in the region 1110–950 cm−1 (stretching vibrations within the tetrahedral sheet) and OH bending modes involving octahedral cations.
In the IR spectrum, glauconite as an aluminosilicate shows bands between 1200 and 400 cm−1, a strong band at 960 cm−1 (assigned to in-plane Si–O–Si stretching vibrations), a band in the region of 776 to 780 cm−1 (assigned to Fe-OH), bands at 430 cm−1 (assigned to iron and magnesium in the octahedral layer), and a band at 470 cm−1 (assigned to Fe–O–Si bending).
Meanwhile, the green color could be due to Egyptian Blue degradation compounds, it being known that this pigment is able to degrade and discolor into a greenish color, especially in the presence of wax (or beeswax), as it was identified in this paper.
In fact, Egyptian Blue is identified in all the other color areas, except the white area: in the green area (as degradation product with beeswax) and in the red area (in mixture with ochre) too. This is the reason why some of the FTIR peaks are almost at the same wavenumbers for all the pigments, as it is visible in Figure 7.
The SO42− group (from white area) can be identified at 1120–1160 cm−1, and at the peaks from 980 and 640 cm−1, in accordance with the literature [45].
Gypsum strips centered at 1109, 667 and 596 cm−1 also appear, together with the stretching and bending vibrations of the O–H groups at 3525, 3429 and 3401 cm−1. The bands detected at approximately 714, 730, 876, 1440, 1880 and 2530 cm−1 could be attributed to CaCO3 [46].
Egyptian craftsmen created a blue pigment (i.e., Egyptian blue) by burning a mixture of compounds containing silicon (visible through the FTIR band from 1070–1080 cm−1), calcium and copper with a soda or potassium derived from plants as a flux to 850–1000 °C [47,48].
The red pigment (red in Figure 7) can be identified as red ocher (hematite), visible through the 668 cm– 1 band, which can be attributed to metal–oxygen (M–O) stretching vibrations [49]. In addition, this pigment has similar bands around 1050–1080 cm−1, as proof of blue pigments and a very large band around 2900 cm−1, as evidence for the beeswax presence and also large bands around 3400 cm−1, assigned to OH groups.
It was also possible to identify the presence of the methylene and ester functional groups identical to those for the FTIR spectrum specific to beeswax (brown in Figure 7), possibly used as a connecting medium in the mural from Roman villa. Evidence of hydrolysis reactions or partial saponification of the organic environment is visible by the presence of OH vibration bands in the regions of 3400 cm−1 as well as the region 1035 to 1060 cm−1, which indicates the presence of alcohols or glycerides with long chains. For murals, painting methods could involve the encaustic method, in which the colors were mixed with wax, painted on the surface and then “burned” with a hot rod. The encaustic paint was much more stable over time than the tempera and shows more intense tons of oil painting.
The act of creating encaustic paintings with molten wax has used cold paintable beeswax, which was initially described based on Pliny’s recipe for “Punic wax” [8,41,50]. This technique involves the formation of metal soaps and the reduction of wax ester components [43].
The Raman spectrum of the fragment painted on the wall of a Roman villa contains a significant amount of lime and calcite, with wave numbers at 1088, 740, 704 cm−1 and bands attributed to hematite, with wave numbers at 412 and 293 cm−1. It should take into account that this sample has been buried for almost 2000 years, and this fact could be observed in the Raman spectrum (Figure 8), which indicates the incomplete conversion of lime to calcium carbonate, most likely due to the limited penetration of carbon dioxide at a fairly dry archaeological site [50]. At the excitation with a laser wavelength of 1064 nm, the specific bands of calcium carbonate in the form of calcite appear, possibly from the reaction between carbon dioxide and wet calcium hydroxide, such as: 790 and 1088 cm−1. Gypsum (CaSO4·2H2O, with a sulfate band at 1008 cm−1) [51] and quartz (SiO2) are also visible through the band at 465 cm−1 [52]. The bands of 866 cm−1, associated with the mode of carbonate ions weakly bound to cations [53], and that of 740 cm−1, can be observed and assigned to the symmetric bending mode of CO32− in vaterite, suggesting favorable conditions for this form of metastable calcium carbonate (μ-CaCO3) [54].
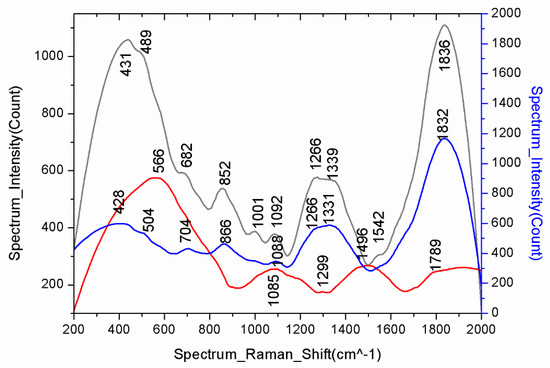
Figure 8.
Raman spectra of the investigated samples (red pigment—red line in the spectrum; blue pigment—blue line in the spectrum; green pigment—dark green line in the spectrum).
3.4. Blue Zone
The Egyptian blue is identified by three Raman bands: 1087 and 430 cm−1 (Figure 8). This pigment usually contains calcite and carbon, used to change the color tone from light to dark; the granules size affects the tone of the Egyptian blue color too, being darker when the particles are larger and lighter when the size is smaller. In this regard, Raman data can be correlated with porosity data, Table 3.
Table 3.
Porosity data for the investigated samples.
The high pore diameter has been identified for blue pigments, followed by the green pigment, most probably due to the glassy silicate network of Egyptian Blue and its aggregate forms with clays. The trend of the other parameters (specific area and total pore volume) is the same for the other pigments. These data have been obtained by Brunauer–Emmett–Teller (BET) Surface Area Analysis and Barrett–Joyner–Halenda (BJH) Pore Size and Volume Analysis [55,56].
A small amount of goethite for a green color could be presumed [57]. Under this context, the blue pigment is identified by the 428 cm−1 wide band, and by the weak band from 1088 cm−1. Egyptian blue is sometimes mixed with celadonite clays (Mg, Fe, Al)2(Si, Al)4O10(OH)2 and glauconite K(Fe, Al)2(Si, Al)4O10(OH)2, which makes it difficult to identify because their Raman spectra are quite similar. According to Ospitali et al. [58], the Raman bands of glauconite could be: 690 to 700 cm−1; 590 to 600 cm−1; 440–450 and 260–260 cm−1, probably attributed to the compositional changes of these mixtures [59,60].
The Raman spectrum performed in the blue area shows bands at 1088, 1001, 866, 704, 566, 504 and 482 cm−1 in good agreement with those described in the literature for the mineral cuprorivaite [61,62]. The wide band in the range 420–460 cm−1 is specific to quartz, SiO2. This association of quartz with cuprorivaite, and, in some cases, with wollastonite (CaSiO3) and calcite (CaCO3) is typical for Egyptian blue pigment [63].
As we have previously mentioned, Egyptian blue is a synthetic pigment that is obtained after heating a mixture of quartz at 850 °C for 24 h (SiO2), calcium carbonate (CaCO3), sodium carbonate (Na2CO3) and copper oxides or carbonates [64]. For blue and green pigments, bands at 1331 and 1339 cm−1, respectively, it has been observed, assigned to Calcium hydroxide phosphate, Ca5(OH)(PO4)3 + Carbon, C, as it has been mentioned above, and in good agreement with literature [65].
3.5. Red Zone
Generally, this pigment is from hematite, mixed with some other type of pigment, and is dominated by an intense sharp band around 1007 cm−1, indicative of the presence of gypsite, identified by the small bands at 682, and 428 cm−1. In addition, another signal intense at 1086 cm−1 is also indicative of the presence calcium carbonate. The study of the rest of the signals of the spectrum allows us to conclude the presence of hematite, since the bands at 566 and 1299 cm−1 are observed (wood soot, carbon C), and some of them overlapping with others. Therefore, the red color is derived from a mixture of hematite, gypsite and calcite. The gypsite was used to lighten the intense red of the hematite, but also to achieve the special effects which confer its use for the final appearance of the painting. This could be another reason for the appearance of Egyptian Blue in the red zone of the wall painting. Calcite and gypsum were occasionally added as a toner in red pigments from Egyptian painting workshops [61], with quartz having been identified in two studies of Pompeiian carbon blacks [66] and with gypsum in Pompeian black inks [63].
3.6. Green Zone
Green pigments have been used since ancient times, and they are very varied. Among the most prominent could be mentioned: malachite (basic copper carbonate (CuCO3·Cu(OH)2)), or the two natural minerals, glauconite and celadonite, identified by their mode of formation; glauconite occurs only in marine sediments and celadonite only in weathered volcanic rocks. The main identified Raman bands are: 1092, 682, 489 and 431 cm−1 indicate that the majority compound of this pigment is gypsite, a hydrated calcium sulfate, CaSO4·2H2O. The bands described above are associated with stress and strain vibrations of the S-O bonds of the SO4 groups. In this way, the specific bonds appear at 1001 cm−1, and at 1092 cm−1. Finally, the bands at 489 cm−1 are assigned to gypsite as the main compound in the green zone [67,68].
3.7. Diffuse Reflectance UV/Vis Spectroscopy (DR-UV)
The molecules of different chemical structures have different band gaps and different absorption spectra. There are four main types of electronic transitions according to the participating molecular orbitals: the π–π * and n–π * transitions usually present in the UV–Vis spectrum. Egyptian blue is a synthetic pigment with the formula CaCuSi4O10, which was widely used in Antiquity in Mediterranean areas. Due to the high sensitivity of this technique (10−9 M) [69], by means of this technique, it was possible to identify the pigment Egyptian Blue, by the absorption maxima at 668 and 826 nm (Table 4). The absorption at 600 nm suggests that the main pigment in the Egyptian blue could be mixed with ochre.
Table 4.
UV–Vis maxima for blue, green and pigments.
By examination of the DR-UV spectra (400–1100 nm), a small band around 520 nm could be assigned to goethite (α-Fe3+O(OH)), rather than hematite (Fe2O3) [70,71].
The absorption maximum at ~525 nm could indicate a green color, possibly from yellow ochre. UV–Vis spectra achieved from blue, green and red samples from Roman Villa are shown in Table 4.
Rodriguez-Navarro et al. [72] applied the UV–Vis spectroscopy technique to identify lime mortars and plasters, and identified the wax used as an additive. The UV–Vis spectrum showed a strong band around 280 nm, corresponding to carboxyl groups (transitions n → π *), most likely from the structure of polysaccharides modified with lime putty. The blue and green pigments showed wavelengths around 480 and 570 nm, respectively, and between 700 and 800 nm, respectively, show absorption bands of iron oxides, such as ferric oxide/oxyhydroxide. In the case of the fragments from Rapoltu Mare, wavelengths were observed at 473, 530 and 707 nm, which indicated the presence of Egyptian blue and hematite. In addition, the dominant wavelengths at 531 and 473 nm can be attributed to the presence of glauconite and celadonite. UV–Vis spectroscopy was thus able to confirm the data obtained by FTIR and Raman [46].
The red samples showed a spectrum similar to the blue pigment, and the presence of copper is an indication of its mixture of Egyptian Blue with hematite. A small amount of iron (less than 5%) may indicate a minimal amount of yellow ocher. Therefore, it can be concluded that the red areas on the surfaces of the mural were caused by the mixture of yellow and blue Egyptian ocher. The analysis of green wall surfaces showed the presence of sodium, magnesium, aluminum and iron, which suggested the use of “green earth” (celadonite and glauconite) as pigments in painting [47].
3.8. Thermal Gravimetric Analysis
In TG/DTA/DSC measurements, the weight loss curves at different temperatures are a very good indication of the thermal properties, as follows:
- −
- the endothermic peak at 100 °C is attributed to hygroscopic humidity (also known as physically adsorbed water), while those occurring at about 200–250 °C are due to hydrated inter-layer cations (i.e., bound water) [73].
- −
- weight loss between 120 and 200 °C can be attributed to hydrated salts.
In the case of the samples investigated in the paper (Figure 9), the results suggested that the samples have a content of 2.64% structurally bound water (weight loss occurs between 200 and 600 °C) and 13.87% carbon dioxide (loss weighing more than 600 °C). As shown in the DSC curve, three endothermic peaks were observed at approximately 110, 444 and 720 °C, which were attributed to evaporation of water in mortars, decomposition of Ca(OH)2 into CaO and H2O [74], and decomposition from CaCO3 to CaO and CO2, respectively. Weight loss at temperatures below 600 °C is attributed to the loss of chemically bound water in products such as calcium silicate hydrates and calcium aluminate hydrates [73]. Significant weight loss occurred at temperatures above 600 °C, corresponding to the processes of decomposition of CaCO3 and highlighting a high level of calcite in mortars. Weight loss at temperatures above 600 °C is attributed to the release of CO2 in the process of decomposing carbonates. Weight loss at reaction temperatures of approximately 750 °C indicates loss of CO2 from recarbonated lime, not pure CaCO3.
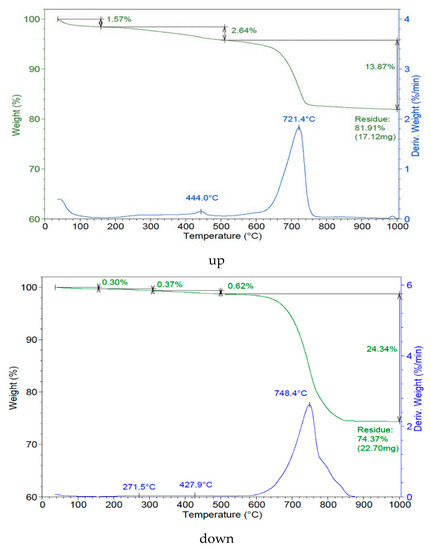
Figure 9.
Thermal analysis for the blue (up) and green (down) pigments zone.
TGA experiments were performed on the same samples analyzed by FTIR, and the presence of protein material was confirmed as an organic fraction present as a minor component of the mortar sample. The thermogram with differential thermogravimetry from Figure 9 shows a peak around 271.5 °C, which may be assigned to the exothermic decomposition of organic materials in the form of proteinaceous material and freely bound water. TGA and DTA analyses revealed bound or free water loss from 100 to 260 °C in the samples. There is a marked peak of mass loss at about 750 °C, attributed to calcite decarbonates, knowing that, between 700 and 850 °C, endothermic reactions occur in the samples caused by the existence of carbonate, which represents 65% to 75% of the loss and total mass. The decomposition of carbonates is the main reaction that took place with a distinct endothermic reaction releasing CO2 [75]. It is also possible to be wollastonite (CaSiO3) in the blue pigment, indicating that the temperature used in the manufacturing of Egyptian blue was higher than 950 °C [61].
4. Conclusions
Investigations into decorative paintings from fragments of the Roman villa Rapoltu Mare have made it possible to obtain new and valuable information about the pigments used in them, which in the future can significantly help restore this sector or, by extension, others in the same area. Some difficulties have been met because of the impossibility of extracting a sample of this layer to be analyzed in the laboratory without affecting the integrity of the sample. Up to seven different pigments have been identified, either in pure form or mixed together in different proportions: Egyptian blue, carbon, calcite, gypsum, hematite, goethite and green earth. Egyptian Blue is identified in all the other color areas, except the white area: in the green area (as degradation product with beeswax) and in the red area (in mixture with ochre) too. In addition, carbon and beeswax were highlighted as toner and binder for pigments, respectively. Charcoal or gypsum and/or calcite were used to darken or lighten the colors, respectively. In the presence of the organic beeswax binding environment (SEM-EDS), the Egyptian blue pigment particles darkened or turned yellow significantly, changing the blue to a greenish color. The presence of apatite, hematite and gypsum deposits in the Hunedoara region leads us to propose that these pigments could have been of local origin, as demonstrated by the presence of analytically identified elements (Fe, P, S, Ca). It is also possible to identify wollastonite (CaSiO3) in the blue pigment, indicating that the temperature used in the manufacture of Egyptian blue was higher than 950 °C. Only a few pieces of scientific evidence for the use of Egyptian blue, the classic blue pigment of Roman antiquity, in Early Medieval murals in Central and Southern Europe, have been recorded so far.
Author Contributions
Conceptualization, R.-M.I. and M.G.B.; methodology, R.-M.I.; software, M.E.D. and R.M.G.; validation, R.-M.I. and A.G.; formal analysis, R.-M.I.; investigation, R.-M.I., G.V., R.M.G., L.I., S.S.-T. and A.I.G.; resources, R.-M.I.; data curation, R.-M.I., M.E.D., L.I. and R.M.G.; writing—original draft preparation, R.-M.I., M.G.B. and A.G.; writing—review and editing, R.-M.I.; visualization, R.-M.I.; supervision, R.-M.I.; project administration, R.-M.I.; funding acquisition, R.-M.I. All authors have read and agreed to the published version of the manuscript.
Funding
This research received no external funding.
Institutional Review Board Statement
Not applicable.
Informed Consent Statement
Not applicable.
Data Availability Statement
Not applicable.
Acknowledgments
This research received support from the project 51PCCDI/2018 by the Romanian National Authority for Scientific Research (UEFISCDI) “New diagnosis and treatment technologies for the preservation and revitalization of archaeological components of the national cultural heritage”.
Conflicts of Interest
The authors declare no conflict of interest.
References
- Fermo, P.; Piazzalunga, A.; de Vos, M.; Andreoli, M. A multi-analytical approach for the study of the pigments used in the wall paintings from a building complex on the Caelian Hill (Rome). Appl. Phys. A 2013, 25, 2621–2630. [Google Scholar] [CrossRef]
- Westlake, P.; Siozos, P.; Philippidis, A.; Apostolaki, C.; Derham, B.; Terlixi, A.; Perdikatsis, V.; Jones, R.; Anglos, D. Studying pigments on painted plaster in Minoan, Roman and Early Byzantine Crete. A multi-analytical technique approach. Anal. Bioanal. Chem. 2012, 402, 1413–1432. [Google Scholar] [CrossRef] [PubMed]
- Gliozzo, E.; Cavari, F.; Damiani, D.; Memmi, I. Pigments and plasters from the roman settlement of thamusida (Rabat, Morocco). Archaeometry 2012, 54, 278–293. [Google Scholar] [CrossRef]
- Clementi, C.; Ciocan, V.; Vagnini, M.; Doherty, B.; Tabasso, M.L.; Conti, C.; Brunetti, B.G.; Miliani, C. Non-invasive and micro-destructive investigation of the Domus Aurea wall painting decorations. Anal. Bioanal. Chem. 2011, 401, 1815–1826. [Google Scholar] [CrossRef]
- Piovesan, R.; Siddall, R.; Mazzoli, C.; Nodari, L. The Temple of Venus (Pompeii): A study of the pigments and painting techniques. J. Archaeol. Sci. 2011, 38, 2633–2643. [Google Scholar] [CrossRef]
- Weber, J.; Prochaska, W.; Zimmermann, N. Microscopic techniques to study Roman renders and mural paintings from various sites. Mater. Charact. 2009, 60, 586–593. [Google Scholar] [CrossRef]
- Vaquerizo, D.; Carrillo, J.R. The roman ville of El Ruedo (Almedinilla, Córdoba). J. Roman Archaeol. 1995, 8, 12–152. [Google Scholar]
- Plinius, C.S. Naturalis Historia: Enciclopedia Cunoștințelor din Antichitate; Polirom: Iași, Romania, 2004; p. 408. [Google Scholar]
- Vitruvius. Despre arhitectură (Scriptores Graeci et Latini V); Editura Academiei Republicii Populare Române: Bucureşti, Romania, 1964. [Google Scholar]
- Cuní, J.; Cuní, P.; Eisen, B.; Savizky, R.; Bové, J. Characterization of the binding medium used in Roman encaustic paintings on wall and wood. Anal. Methods 2012, 4, 659. [Google Scholar] [CrossRef]
- Amadori, M.L.; Barcelli, S.; Poldi, G.; Ferrucci, F.; Andreotti, A.; Baraldi, P.; Colombini, M.P. Invasive and non-invasive analyses for knowledge and conservation of Roman wall paintings of the Villa of the Papyri in Herculaneum. Microchem. J. 2015, 118, 183–192. [Google Scholar] [CrossRef]
- Tamburini, D.; Łucejko, J.J.; Modugno, F.; Colombini, M.P.; Pallecchi, P.; Giachi, G. Microscopic techniques (LM, SEM) and a multi-analytical approach (EDX, FTIR, GC/MS, Py-GC/MS) to characterise the decoration technique of the wooden ceiling of the House of the Telephus Relief in Herculaneum (Italy). Microchem. J. 2014, 116, 7–14. [Google Scholar] [CrossRef]
- Brecoulaki, H.; Andreotti, A.; Bonaduce, I.; Colombini, M.P.; Lluveras, A. Characterization of organic media in the wall-paintings of the “Palace of Nestor” at Pylos, Greece: Evidence for a secco painting techniques in the Bronze Age. J. Archaeol. Sci. 2012, 39, 2866. [Google Scholar] [CrossRef]
- Pallecchi, P.; Giachi, G.; Colombini, M.P.; Modugno, M.; Ribechini, R. The painting of the Etruscan ‘‘Tomba della Quadriga Infernale’’ (4th century BC), in Sarteano (Siena, Italy): Technical features. J. Archaeol. Sci. 2009, 36, 2635. [Google Scholar] [CrossRef]
- Andreotti, A.; Bonaduce, I.; Colombini, M.P.; Gautier, G.; Modugno, F.; Ribechini, E. Combined GC/MS analytical procedure for the characterization of glycerolipid, waxy, resinous, and proteinaceous materials in a unique paint microsample. Anal. Chem. 2006, 78, 4499. [Google Scholar] [CrossRef] [PubMed]
- Băeştean, G.; Bălos, A.; Barbu, M.G.; Bărbat, I.A.; Barbu, I.L.; Țuțuianu, C.-D.; Marc, A.T.; Barbu, M.-M.; Gonciar, A. Rapoltu Mare, jud. Hunedoara, La Vie, CCA Campania 2019; Mega Print: Cluj-Napoca, Romania, 2020; pp. 286–287. [Google Scholar]
- Barbu, M.G.; Bărbat, I.A. New Archaeological Information Regarding the Exploitation of Andesite in Măgura Uroiului (Hunedoara County), Sargetia (S.N.); Altip: Alba Iulia, Romania, 2017; Volume VIII, pp. 71–121. [Google Scholar]
- Ion, R.-M.; Rizescu, C.E.; Vasile, D.A.; Vasilievici, G.; Atkinson, I.; Rusu, A.; Predoana, L.; Miculescu, F. Layered double hydroxides (LDHs) as new consolidants for cultural heritage masonry. Crystals 2022, 12, 490. [Google Scholar] [CrossRef]
- Bălos, A.; Ţuţuianu, C.D. Rapoltu Mare, com. Rapoltu Mare, jud. Hunedoara, Punt: La Vie, CCA, Campania 1999; Mega Print: Cluj-Napoca, Romania, 2000; p. 80. [Google Scholar]
- Băeştean, G.; Bălos, A.; Barbu, M.G.; Bărbat, I.A.; Gonciar, A.; Brown, A.; Barbu, I.L.; Tutuianu, D.C.; Tutilă, O.C.; Barbu, M.M.; et al. Rapoltu Mare, com. Rapoltu Mare, jud. Hunedoara. Punct: La Vie, CCA, Campania 2016; Mega Print: Cluj-Napoca, Romania, 2017; pp. 109–111. [Google Scholar]
- Ion, R.M.; Iancu, L.; David, M.E.; Grigorescu, R.M.; Trica, B.; Somoghi, R.; Vasile, S.F.; Dulama, I.D.; Gheboianu, A.I.; Tincu, S. Multi-analytic characterization of Corvins’ Castle—Deserted Tower. Construction materials and conservation tests. Heritage 2020, 3, 941–964. [Google Scholar] [CrossRef]
- Ion, R.M.; Tincu, S.; Minca, I.; Dulama, I.D.; Bucurica, I.A.; Ion, M.L.; Gheboianu, A.I. Instrumental analytical techniques applied to Old Gate Tower from Corvins’ Castle. IOP Conf. Ser. Mater. Sci. Eng. 2019, 877, 012050. [Google Scholar] [CrossRef]
- Rietveld, H.M. Rietveld method. Phys. Scr. 2014, 89, 098002. [Google Scholar] [CrossRef]
- Dal Fovo, A.; Mazzinghi, A.; Omarini, S.; Pampaloni, E.; Ruberto, C.; Striova, J.; Fontana, R. Non-invasive mapping methods for pigments analysis of Roman mural paintings. J. Cult. Herit. 2020, 43, 311–318. [Google Scholar] [CrossRef]
- Martinetto, P.; Blanc, N.; Bordet, P.; Champdavoine, S.; Fabre, F.; Guiblain, T.; Hodeau, J.-L.; Lelong, F.; Leynaud, O.; Prat, A.; et al. Non-invasive X-ray investigations of medieval sculptures: New insights on “applied tin-relief brocade” technique. J. Cult. Herit. 2021, 47, 89–99. [Google Scholar] [CrossRef]
- Eastaugh, N.; Walsh, V.; Chaplin, T.; Siddall, R. Pigment Compendium: A Dictionary of Historical Pigments; Butterworth Heinemann: Oxford, UK, 2004. [Google Scholar]
- Buckley, H.; Bevan, J.; Brown, K.; Johnson, L.; Farmer, V. Glauconite and celadonite: Two separate mineral species. Mineral. Mag. 1978, 42, 373–382. [Google Scholar] [CrossRef]
- Bearat, H.; Fuchs, M.; Maggetti, M.; Paunier, D. Roman Wall: Materials, Techniques, Analysis and Conservation. In Proceedings of the International Workshop on Roman Wall Painting, Fribourg, Switzerland, 7–9 March 1996; Institute of Mineralogy and Petrography, Fribourg University: Fribourg, Switzerland, 1997. [Google Scholar]
- Guglielmi, V.; Comite, V.; Andreoli, M.; Demartin, F.; Lombardi, C.A.; Fermo, P. Pigments on Roman wall painting and stucco fragments from the Monte d’Oro Area (Rome): A multi-technique approach. Appl. Sci. 2020, 10, 7121. [Google Scholar] [CrossRef]
- Paternoster, G.; Rinzivillo, R.; Nunziata, F.; Castellucci, E.M.; Lofrumento, C.; Zoppi, A.; Felici, A.C.; Fronterotta, G.; Nicolais, C.; Piacentini, M.; et al. Study on the technique of the Roman age mural paintings by micro-XRF with polycapillary conic collimator and micro-Raman analyses. J. Cult. Herit. 2005, 6, 21–28. [Google Scholar] [CrossRef]
- Aliatis, I.; Bersani, D.; Campani, E.; Casoli, A.; Lottici, P.P.; Mantovan, S.; Marino, I.G. Pigments used in wall paintings in the Vesuvian area. J. Raman Spectrosc. 2009, 41, 1537–1542. [Google Scholar] [CrossRef]
- Baraldi, P.; Bonazzi, A.; Giodani, N.; Paccagnella, F.; Zannini, P. Analytical characterization of Roman plaster of the “Domuns Farini” in Modena. Archeometry 2006, 48, 481–499. [Google Scholar] [CrossRef]
- Siddal, R. Mineral pigments in archaeology. Their analysis and the range of available materials. Minerals 2018, 8, 201. [Google Scholar] [CrossRef] [Green Version]
- Ion, R.-M.; Iancu, L.; Vasilievici, G.; Grigore, M.E.; Andrei, R.E.; Radu, G.-I.; Grigorescu, R.M.; Teodorescu, S.; Bucurica, I.A.; Ion, M.-L.; et al. Ion-substituted carbonated hydroxyapatite coatings for model stone samples. Coatings 2019, 9, 231. [Google Scholar] [CrossRef] [Green Version]
- Odom, I.E. GLAUCONITE and CELADONITE MINERALS. In Micas; Bailey, S.W., Ed.; De Gruyter: Berlin, Germany, 2018; pp. 545–572. [Google Scholar]
- Čermáková, Z.; Hradilová, J.; Jehlička, J.; Osterrothová, K.; Massanek, A.; Bezdička, P.; Hradil, D. Identification of vivianite in painted works of art and its significance for provenance and authorship studies. Archaeometry 2014, 56, 148–167. [Google Scholar] [CrossRef]
- Schiegl, S.; Weiner, K.L. Discovery of copper chloride cancer in ancient Egyptian polychromic wall paintings and faience: A developing archaeological disaster. Naturwissenschaften 1989, 400, 393–400. [Google Scholar] [CrossRef]
- Moussa, A.; Ali, M.F. Color alteration of ancient egyptian blue faience. Int. J. Archit. Herit. 2013, 7, 261–274. [Google Scholar] [CrossRef]
- Béarat, H. Chemical and mineralogical analyses of Gallo-Roman wall painting from Dietikon, Switzerland. Archaeometry 1996, 38, 81–95. [Google Scholar] [CrossRef]
- Brindley, G.W.; Brown, G. Crystal Structures of Clay Minerals and Their X-ray Identification; Mineralogical Society: London, UK, 1980. [Google Scholar]
- Stacey, R.J. The composition of some Roman medicines: Evidence for Pliny’s Punic wax? Anal. Bioanal. Chem. 2011, 401, 1749–1759. [Google Scholar] [CrossRef] [PubMed]
- Stacey, R.J.; Dyer, J.; Mussell, C.; Lluveras-Tenorio, A.; Colombini, M.P.; Duce, C.; La Nasa, J.; Cantisani, E.; Prati, S.; Sciutto, G. Ancient encaustic: An experimental exploration of technology, ageing behaviour and approaches to analytical investigation. Microchem. J. 2018, 138, 472–487. [Google Scholar] [CrossRef]
- Hossain, M.E.; Rahman, M.S.; Ketata, C.; Mann, H.; Islam, M.R. SEM-based structural and chemical analysis of paraffin wax and beeswax for petroleum applications. J. Charact. Dev. Nov. Mater. 2009, 1, 21–38. [Google Scholar]
- Mahmoud, H.H.M. Investigations by Raman microscopy, ESEM and FTIR-ATR of wall paintings from Qasr el-Ghuieta temple. Kharga Oasis, Egypt. Herit. Sci. 2014, 2, 18. [Google Scholar] [CrossRef] [Green Version]
- Mazzocchin, G.A.; Agnoli, F.; Mazzocchim, S.; Colpo, I. Analysis of pigments from Roman wall paintings found in Vicenza. Talanta 2003, 61, 565–572. [Google Scholar] [CrossRef]
- Franquelo, M.L.; Duran, A.; Herrera, L.K.; de Haro, M.C.J.; Perez-Rodriguez, L. Comparison between micro-Raman and micro-FTIR spectroscopy techniques for the characterization of pigments from Southern Spain Cultural Heritage. J. Mol. Struct. 1999, 924–926, 404–412. [Google Scholar] [CrossRef]
- Pagez-Camagra, S.; Collinart, S.; Coupry, C. Fabrication process of archeological Egyptian blue and green pigments enlightened by Raman microscopy and scaning electron microscopy. J. Raman Spectrosc. 1999, 30, 313–317. [Google Scholar] [CrossRef]
- Burgio, L.; Clark, R.J.H. Library of FT-Raman spectra of pigments, minerals, pigment media and varnishes, and supplement to existing library of Raman spectra of pigments with visible excitation. Spectrochim. Acta A 2001, 57, 1491–1521. [Google Scholar] [CrossRef]
- di Stefano, L.M.; Fuchs, R. Characterisation of the pigments in a Ptolemaic Egyptian Book of the Dead Papyrus. Archaeol. Anthropol. Sci. 2011, 3, 229–334. [Google Scholar] [CrossRef]
- Riontino, C.; Sabbioni, C.; Ghedini, N.; Zappiaa, G.; Gobbi, G.; Favoni, O. Evaluation of atmospheric deposition on historic buildings by combined thermal analysis and combustion techniques. Thermochim. Acta 1998, 321, 215–222. [Google Scholar] [CrossRef]
- Mateos, L.D.; Cosano, D.; Mora, M.; Muñiz, I.; Carmona, R.; Jiménez-Sanchidrián, C.; Ruiz, J.R. Raman microspectroscopic analysis of decorative pigments from the Roman villa of El Ruedo (Almedinilla, Spain). Spectrochim. Acta Part A Mol. Biomol. Spectrosc. 2015, 151, 16–21. [Google Scholar] [CrossRef] [PubMed]
- Vandenabeele, P.; Edwards, H.G.M.; Moens, L. A decade of Raman spectroscopy in art and archaeology. Chem. Rev. 2007, 107, 675–686. [Google Scholar] [CrossRef] [PubMed]
- Smith, G.D.; Clark, R.J. Raman spectroscopy in archaeological science. J. Archaeol. Sci. 2004, 31, 1137–1160. [Google Scholar] [CrossRef]
- Gauldie, R.W.; Sharma, S.K.; Volk, E. Micro-Raman spectral study of vaterite and aragonite otoliths of the coho salmon, Oncorhynchus kisutch. Comp. Biochem. Physiol. A 1997, 118, 753–757. [Google Scholar] [CrossRef]
- BS ISO 9277: 2010; Test Method Determining the Specific Surface Area of a Variety of Materials by the BET Nitrogen Adsorption Technique. International Organization for Standardization: Geneva, Switzerland, 2010.
- BS ISO 9277:2010; Brunauer-Emmett-Teller (BET) Surface Area Determination. International Organization for Standardization: Geneva, Switzerland, 2010.
- Colomban, P.; Sagon, G.; Faurel, X. Differentation of antique ceramics from the Raman spectra of their coloured glazes and paintings. J. Raman Spectrosc. 2001, 32, 351–360. [Google Scholar] [CrossRef]
- Ospitali, F.; Bersani, D.; Lonardo GDi Lottici, P.P. ’Green earths’: Vibrational and elemental characterization of glauconites, celadonites and historical pigments. J. Raman Spectrosc. 2008, 39, 1066. [Google Scholar] [CrossRef]
- Boschetti, C.; Corradi, A.; Baraldi, P. Raman characterization of painted mortar in Republican roman mosaics. J. Raman Spectrosc. 2008, 39, 1085–1090. [Google Scholar] [CrossRef]
- Colomban, P. The destructive/non-destructive identification of enamelled pottery and glass artifacts and associated pigments—A brief overview. Arts 2013, 2, 77–110. [Google Scholar] [CrossRef] [Green Version]
- Jaksch, H.; Seipel, W.; Weiner, K.L.; El Goresy, A. Egyptian blue-cuprorovaite. A window to ancient Egyptian technology. Die Nat. 1983, 70, 525–535. [Google Scholar] [CrossRef]
- Bouherour, S.; Berke, H.; Wiedemann, H.G. Ancient man-made copper silicate pigments studied by Raman microscopy. Chim. Int. J. Chem. 2001, 55, 942–951. [Google Scholar]
- Canevaliet, C. A multi-analytical approach for the characterization of powders from the Pompeii archaeological site. Anal. Bioanal. Chem. 2011, 401, 1801–1814. [Google Scholar] [CrossRef] [PubMed]
- Marucci, G.; Beeby, A.; Parker, A.W.; Nicholson, C.E. Raman spectroscopic library of medieval pigments collected with five different wavelengths for investigation of illuminated manuscripts. Anal. Methods 2018, 10, 1219–1236. [Google Scholar] [CrossRef] [Green Version]
- Cersoyet, S. Identifying and quantifying amorphous and crystalline content in complex powdered samples: Application to archaeological carbon blacks. J. Appl. Cryst. 2016, 49, 585–593. [Google Scholar] [CrossRef]
- Sotiropoulou, S.; Daniilia, S.; Miliani, C.; Rosi, F.; Cartechini, L.; Papanikola Bakirtzis, D. Microanalytical investigation of degradation issues in Byzantine wall paintings. Appl. Phys. A 2008, 92, 143–150. [Google Scholar] [CrossRef]
- Hradil, D.; Grygar, T.; Hradilová, J.; Bezdička, P. Clay and iron oxide pigments in the history of painting. Appl. Clay Sci. 2003, 22, 223–236. [Google Scholar] [CrossRef]
- Sanjurjo Sánchez, J.; Alves, C.A.S.; Vidal Romaní, J.R.; Fernández Mosquera, D. Origin of gypsum-rich coatings on historic buildings. Water Air Soil Pollut. 2009, 204, 53–68. [Google Scholar] [CrossRef]
- Owen, T. Fundamentals of Modern UV-Visible Spectroscopy: A Primer: Hewlett Packard; FAO: Rome, Italy, 1996. [Google Scholar]
- Hunt, G.R.; Salisbury, J.W.; Lenhoff, C.J. Visible and near-infrared spectra of minerals and rocks: III. Oxides and hydroxides. Modern Geol. 1971, 2, 195–205. [Google Scholar]
- Scheinost, A.C.; Chavernas, A.; Barrón, V.; Torrent, J. Use and limitations of second-derivative diffuse reflectance spectroscopy in the visible to near-infrared range to identify and quantify Fe oxide minerals in soils. Clays Clay Miner. 1998, 46, 528–530. [Google Scholar] [CrossRef]
- Rodriguez-Navarro, C.; Ruiz-Agudo, E.; Burgos-Cara, A.; Elert, K.; Hansen, E.H. Crystallization and colloidal stabilization of Ca(OH)2 in the presence of nopal juice (Opuntia ficus indica): Implications in architectural heritage conservation. Langmuir 2017, 33, 10936–10950. [Google Scholar] [CrossRef]
- Sanjurjo Sánchez, J.; Vidal Romaní, J.R.; Fernández Mosquera, D.; Alves, C.A. Study of origin and composition of coatings in a monument built with granitic rocks, by SEM, XRD, XRF and DTA-TGA. X-ray Spectrom. 2008, 37, 346–354. [Google Scholar] [CrossRef]
- Moropoulou, A.; Bakolas, A.; Bisbikou, K. Characterization of ancient, byzantine and later historic mortars by thermal and X-ray difraction techniques. Thermochim. Acta 1995, 269–270, 779–795. [Google Scholar]
- Ghedini, N.; Sabbioni, C.; Pantani, M. Thermal analysis in cultural heritage safeguard: An application. Thermochim. Acta 2003, 406, 105–113. [Google Scholar] [CrossRef]
Publisher’s Note: MDPI stays neutral with regard to jurisdictional claims in published maps and institutional affiliations. |
© 2022 by the authors. Licensee MDPI, Basel, Switzerland. This article is an open access article distributed under the terms and conditions of the Creative Commons Attribution (CC BY) license (https://creativecommons.org/licenses/by/4.0/).