Abstract
Surface textures such as laser-induced periodic surface structures (LIPSS) are of great interest to obtain industrial nanopatterns. In this work, plain uncoated 1.2344 steel with and without Chromium Nitride (CrN) and CrN plus diamond-like carbon (DLC) coatings were used in experiments. The laser texturing variables studied were the laser speed (3000–4000 mm/s) and the distance between laser lines (1–10 microns). These structures were characterized by scanning electron microscopy (SEM) and atomic force microscopy (AFM) to obtain an overview of the roughness and to analyze the heights of the obtained structures. A two-dimension fast Fourier transform (2D-FFT) of the SEM images and its characteristic frequencies was used to assess the periodicity of the textured surfaces and thus quantify the far-range order. The speed of laser depth ablation is related to the laser energy density for each coating and textures are qualified using the FFT approach.
1. Introduction
Laser texturing is a widely used technique for modifying the surface of different materials. Birmaun [1], in 1965, already created different laser patterns in the range of 10 microns (0.01 mm). Laser interactions with surfaces generate laser-induced periodic surface structures (LIPSS), structures 10 or 100 times smaller than usual laser-induced structures. These structures are sub-micron or even at the nanometric scale. These structures are observed in previous works [2,3]. In some cases, the explanation for these structures is not clear and is seen as an unexpected phenomenon [4]. They all have in common that they are produced by a short-pulse laser, from nanosecond to femtosecond [5]. With the short-time pulse, the laser does not heat the surface preventing melting phenomena.
The morphology of these structures depends highly on the polarization filter used [6], obtaining lines oriented at 90° from the polarization direction and points when the polarization is circular. The affectation of the orientation of the linear polarization filter was studied by Gräf et al. [7] and Nivas et al. [8].
Some studies describe the dependence of LIPSS morphology on the speed of the laser or linear overlapping [9], or the distance between laser lines or lateral overlapping [10]. Both can be modulated by the number of pulses applied to the surface or energy applied by surface or fluence [11].
LIPSS might deliver special surface properties to a sample. In the consulted literature, several works on the modification of surface properties are found, such as hydrophobicity by Moradi et al. [12] or biofilm preference growth by Epperleien et al. [13].
These structures are intended to obtain replicas via plastic injection molding [14]. LIPSS is a cheap and fast technique to obtain a pattern structure that can be replicated by plastic injection, reducing the price and allowing for production of around a million replicas, reaching a large market. One of the greatest problems of molds is erosion, which can lead to plastic filling the cavities of the mold, and the problem becomes greater when structures are at a nanoscale. The main solution to that problem is to coat the surface of the mold. Within the strategy of using coatings, there are two options. The first option is to coat once the textures are machined. The second option is to machine the coating to obtain these textures on top of the coating layer. The second strategy is better if we consider that the texture height is less than the thickness of the coating. This strategy is followed by Rodríguez [15] and Yasumaru et al. [16]. In this paper, the second option is chosen, otherwise, the submicron structures would become covered by the coating. To understand the trends of LIPSS, Bonse [17] and Bonse and Graf [18] provide reviews of the controlled manufacturing of nanostructures that enable tailored material functionalization for a wide range of industrial applications, electronics, medicine, etc., which have already made their way into our daily lives. Bonse defines the structures depending on low spatial frequency LIPSS (LSFL) and high spatial frequency LIPSS (HSFL), providing more than 103 different journal articles. Some of this research was related to coatings. For example, for LIPSS on thin films: “Often, the selective structuring of thin film coatings is necessary for creating specific surface functionalities”. Bonse et al. [19] worked with LIPSS coating Titanium nitride (TiN) on different substrate materials, namely pure titanium (Ti), titanium alloy (Ti6Al4V), and steel (100Cr6). Ahmmed et al. [20] also reviewed the use of femtosecond lasers for micromachining.
The objective of this work is to analyze the influence of the laser parameters, the composition, and the deposition technique of the coatings on the textures generated by LIPSS with a femtosecond laser on coatings.
2. Materials and Methods
2.1. Coatings
Four different 1.2344 steel discs of 30 mm diameter and 5 mm thick were polished to a mirror-like finish (Ra 100 nm) with silicon carbide papers decreasing in grit size to P1200 and subsequently polished with 6 and 1 µm (0.006 and 0.001 mm) diamond suspensions on a polishing cloth. Samples were ultrasonically cleaned with acetone, dried with compressed air, and stored.
Sample 1 was left uncoated. Sample 2 was coated with Chromium Nitride (CrN) by magnetron sputtering physical vapor deposition (MS-PVD). Sample 3 was coated with diamond-like carbon with a Chromium Nitride anchoring by magnetron sputtering physical vapor deposition. Finally, Sample 4 was coated with diamond-like carbon with a Chromium Nitride anchoring by Arc-PVD to observe the influence of the deposition technique on the results. A summary of the samples is shown in Table 1.

Table 1.
Samples used with coating technique.
CrN was chosen for its high hardness, low residual stress, good abrasive wear resistance, and high reliability in dry operations. On CrN, it is possible to reduce or replace lubricant with good corrosion resistance under conditions of high load and excellent chemical resistance. This has been used in previous research to coat plastic injection molds and obtain nanostructure benefits. The DLC was chosen for its high hardness and because it improves edge retention, wear resistance, and life span offering excellent protection on molds.
2.2. Laser Texturing
Laser texturing was performed with a femtosecond GF AgieCharmilles laser P400 (GF Machining Solutions, Basel, Switzerland) with a central wavelength of λ = 1030 nm (1.023 × 10⁻³ mm), a laser pulse duration of tl = 350 fs (3.5 × 10⁻¹³ s), a constant power of p = 1.08 W, and pulse frequency f = 500 kHz (5 × 10⁵ Hz). The laser optics used were F160 resulting in a spot size of the laser at the surface of diameter d = 50 microns (0.050 mm). A circular polarizer was used to make the structures independent of the laser speed or laser polarization [7].
The experimental parameters, speed of the laser (Sp) and lateral overlapping (Hd), were analyzed using values between 3000 and 4000 mm/s and 1–10 microns (0.001–0.01 mm), respectively. These parameters were chosen, as suggested by previous research, to obtain good micromachining conditions on plain steel. Such parameters are defined in the software that controls laser optics. At maximum speed, the distance traveled in the duration of a pulse of 350 fs is 4000 mm/s × 3.5 × 10⁻¹³ s = 1.4 × 10⁻⁹ mm, which is very small in comparison to spot size.
In order to generate the texture on the sample, the laser traces a 1.5 mm long line on the surface with a Sp speed. Successively, the laser spot returns to the starting point and is displaced a Hd distance in the y direction to obtain a textured surface of 1.5 × 1.5 mm2.
The different samples were modified by texturing an array of 3 × 5 different experimental conditions. The experimental conditions and resulting textured surface on the MS-PVD DLC sample 3 are shown in Figure 1b as an example.
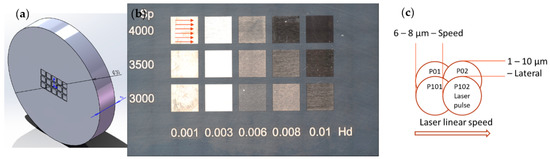
Figure 1.
Laser strategy on sample: (a) disc with laser ablation, (b) DLC matrix of samples, and (c) schema of linear and lateral overlapping.
The texturing strategy was to draw 1.5 mm side squares and overlap the laser line and consecutive lines, as defined by Lehr and Kietzig [21] and shown in Figure 1c. The distance between pulses or linear overlapping is determined by the speed of the laser (Sp) and the pulse frequency (f). The distance between the center of pulses and the diameter of the pulse is given by the optics knowing the number of pulses that are on the same point of the laser line. Finally, the lateral overlap was studied, from 0.001 to 0.01 mm converting the linear overlap into an area overlap.
The maximum time to manufacture one square is obtained for Sp = 3000 and Hd = 0.001 as follows:
with number of pulses 0.75 × 500,000 = 375,000.
tmax = (1.5 mm/3000 mm/s) × (1.5 mm/0.001 mm) = 0.75 s.
The minimum time to manufacture one square is obtained for Sp = 4000 and Hd = 0.01 as follows:
with number of pulses 0.05625 × 500,000 = 28,125.
tmin = (1.5 mm/4000 mm/s) × (1.5 mm/0.01 mm) = 0.05625 s.
In Figure 1, P01 is the first pulse of the laser. After traveling a distance given by the laser linear speed and pulse frequency, a second pulse is produced as P02. After completing the first line, the laser returns to the first P01 point and moves down to produce P101 and then P102, etc. In this way, it is possible to see how each new pulse covers some area that was already manufactured. In this figure, only four pulses are drawn from the minimum number of pulses, calculated previously to be 28,125.
Once the parameters were defined, we correlated the texturization depth to the amount of energy applied by the laser or fluence.
2.3. Fluence and Texturization Depth
In the bibliography, the parameter used to measure overlapping is fluence. Fluence is the amount of energy applied per unit of area on the surface. To calculate the fluence, the first step was to generate a normal distribution of a single pulse, distributing the energy through a circle, with a 50-micron diameter. The next step was to add all the normal distributions of a laser line as a function of the speed and frequency, resulting in a linear distance between pulses, from 6 microns at low speed (ol = 3000 mm/s/5 × 105 1/s = 0.006 mm) to 8 microns at high speed (ol = 4000 mm/s/5 × 105 1/s = 0.008 mm). This means that for a 50-micron diameter, the laser spot travels over the same point, according to laser line speed direction, between 50/6 = 8.33 and 50/8 = 6.25 times.
where ol is overlap, Sp is laser speed, and f is laser frequency.
ol = Sp/f
In the transversal direction, for a 50-micron (0.05 mm) diameter, the lases spot travels over the same point between 50/10 = 5 and 50/1 = 10 times, depending on the Hd parameter.
Secondly, once all linear pulses were added up, a new normal distribution was made with the linear energy value and all lines were superposed with a separation of 1-, 3-, 6-, 8-, and 10-microns, respectively, for each line energy. The resulting parameter is the accumulated fluence from 2.7 to 36.5 J/cm2 (2.7 × 10⁻² to 36.5 × 10⁻² J/mm2 or 2.7 × 10⁻⁸ to 36.5 × 10⁻⁸ J/µm2), as seen in Table 2. Values in most references are provided in J/cm2 but are reported here using J/mm2 for consistency.
Table 2.
Accumulated fluence per laser conditions, speed, and lateral overlapping (in J/cm2).
Please note that for just one pulse of 1.08 W during 350 fs and a spot size of 50 microns the fluence is just:
Fluence1 = 1.08 J/s × 3.5 × 10⁻¹³ s/((π × 0.052/4) mm2) = 1.925 × 10⁻¹⁰ J/mm2 = 1.925 × 10⁻⁸ J/cm2
However, power is not constant. Some researchers calculate fluence as a function of frequency repetition, for example, Winter et al. [22] relate the speed of ablation for stainless steel, aluminum, and copper, and Yang et al. [23] relate fluence to surface roughness.
Fluence2 = 1.08 J/s/(5 × 105 1/s × (π × 0.052/4) mm2) = 1.1 × 10⁻³ J/mm2 = 0.11 J/cm2
These Fluence1 and Fluence2 values do not take into account overlapping and the real machined area.
Finally, there is another way to calculate fluence for minimum and maximum machining times for the complete area of 0.15 cm × 0.15 cm, assuming the effective laser energy is just W = 1.08 J/s.
Fluence_min = 1.08 J/s × 0.05625 s/(0.15 × 0.15 cm2) = 2.7 J/cm2 = 0.027 J/mm2
Fluence_max = 1.08 J/s × 0.75 s/(0.15 × 0.15 cm2) = 36 J/cm2 = 0.36 J/cm2
Fluence_max = 1.08 J/s × 0.75 s/(0.15 × 0.15 cm2) = 36 J/cm2 = 0.36 J/cm2
In this paper, energy is calculated according to the Gaussian distribution shown in Figure 2. This is a consequence of the overlap shown in Figure 1, where we can have between 28,125 and 375,000 shots to produce the part. The ratio between the maximum and minimum fluence is 36.5/2.7 = 13.5, which is equal, as expected (without rounding errors), to the ratio of Sp and Hd 4000 × 10/(3000 × 1) = 13.3 or the ratio of the number of shots 375,000/28,125 = 13.3.
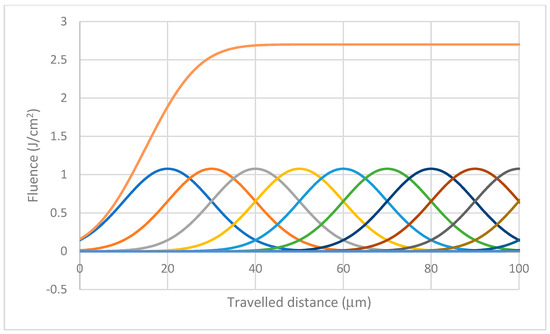
Figure 2.
Sum of Gaussian energy distribution for overlapping areas.
Once we have defined the energy applied to each square, we characterized the surface in order to relate energy to ablation depth for each material.
2.4. Morphological Characterization
Laser samples were analyzed by focus variation microscopy Alicona InfiniteFocusSL (Alicona Imaging GmbH, Graz, Austria) to obtain a 3D reconstruction of the surface. This method allows us to make some profiles and see how deep the laser texturization is. The coating was also measured with a Calotest series (Anton Paar, Graz, Austria) which is designed to quickly characterize coating thicknesses between 0.1 μm (0.0001 mm) and 50 μm (0.050 mm) on a wide range of materials. The simple ball-cratering method used offers a fast and accurate means of checking the thickness of any kind of coating, whether a single or multilayered stack. Typical examples include CVD, PVD, plasma spray coatings, anodic oxidation layers, chemical and galvanic deposits, polymers, paints, and lacquers. Once measured, the thickness of the coating and the depth of the laser texturing can be compared. As DLC has an anchor-base layer of CrN, the comparison allowed us to see if the texture is on the coating layer, the anchor layer, or the substrate.
A morphological analysis of all samples was performed by SEM JEOL JSM-6460 (Jeol, Tokyo, Japan) and AFM Nano-Observer (CSInstruments, Les Ulis, France). SEM micrographs were taken to obtain a clear description of the surface and to measure any possible far-range order and its periodicity. SEM micrographs were transformed by a two-dimension fast Fourier transform (2D-FFT) using MatLab (MathWorks, Natick, MA, USA) to decompose the image into the characteristic frequencies and to know if the frequencies are discrete (far-range order) or distributed (less or no order).
AFM was used to obtain the topography of samples and to obtain roughness parameters, AFM is not particularly useful to determine far-range order because it is limited to the image range of the microscope (50 × 50 microns, 0.05 × 0.05 mm).
3. Results
All samples were machined using three laser speeds (3000, 3500, and 4000 mm/s) for five laser line distances (0.001, 0.003, 0.006, 0.008, and 0.01 mm) and four different substrates (1.2344 Steel, MS—CrN, MS—DLC, and Arc—DLC) to obtain a total of 3 × 5 × 4 = 60 different textures. Visual inspection of samples shows that some of the colors of the sample matrix are different from the initial color of the coating. There were also reflection colors depending on the angle of incidence of the light and the angle of vision, which indicated the presence of structured nanopatterns.
3.1. Focus Variation Microscopy
Focus variation microscopy was performed to obtain the depth of the laser texturing for all samples. The sample depth was then compared with the Calotest results and the fluence of the laser. Each point shown in Figure 3 corresponds to the depth observed for each area of a sample for a given speed and lateral overlapping. Therefore, all x values range from 2.7 to 36.5 J/cm2, as shown previously in Table 2. At depth 0 we find a solid line and another solid line when we find the first transition from first coating layer to next level. In Figure 3a,b we find a dotted line as we have a transition from the second coating layer to substrate.
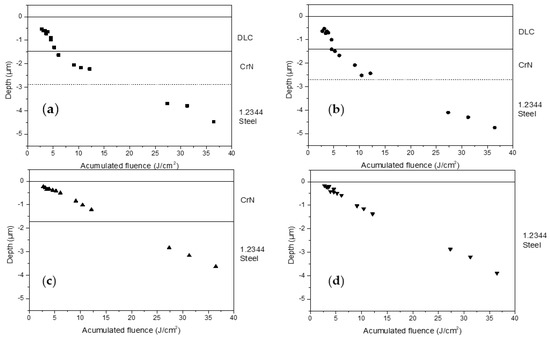
Figure 3.
Texturization depth vs. number of pulses per point: (a) Arc-DLC, (b) MS-DLC, (c) MS-CrN, and (d) 1.2344 Steel.
As we can see in Figure 3, there is a clear linear relationship between texturization depth and the amount of energy applied to the surface or laser fluence. If a regression is made between energy fluence in x and removal depth in y, the removal speed of material can be obtained. Figure 3a,b shows a 1.5 µm DLC layer on top of another 1.5 µm anchor layer on CrN before reaching 1.2344 steel substrate. For the DLC layers, there is clearly a much faster removal speed than in CrN and steel. This higher speed can be explained by the darker color of the layer. Being darker, the DLC layer absorbs more energy instead of reflecting that energy. The change of speed on the DLC layer can be seen clearly in Figure 3a,b, where once the DLC layer is removed, the removal speed at the CrN anchor layer is slower. The CrN and steel samples, having similar colors, reflect a similar amount of energy and show similar trends.
3.2. Morphological Analysis
Once the texturization depth of each coating and laser condition was analyzed, the morphology of the samples was characterized by SEM. Micrographs of each laser condition were taken. When looking at steel samples, the first remarkable thing is that there are some structures in the range of 500–800 nanometres. These structures are several times smaller than the laser spot size. Especially, S3500-Hd3 (Sp 3500 mm/s and lateral overlapping Hd 3 µm, fluence F 10.4 J/cm2) was the most ordered sample, shown in Figure 4. When performing 2D-FFT, some peaks of frequencies are present, indicating the periodicity of the samples. Inside the circle of frequencies in the 2D-FFT in Figure 4, six peaks indicated three different preferential directions of these textures. Samples were analyzed at different points and similar results were obtained indicating far-range order.
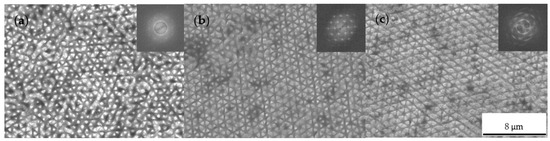
Figure 4.
S3500-Hd3 conditions from (a) 1.2344 steel, non-coated sample, and to reach CrN depth for (b) CrN, and (c) DLC.
Figure 4a shows the effect of reaching steel, while Figure 4b,c reaches the CrN coating layer. The greatest orders of 2D-FFT are obtained on CrN. Results are very similar when texturing directly a CrN sample or a DLC sample with CrN substrate. The range of periodicity is around 500–800 nm. The main difference between the 2D-FFT in CrN depth is the order and concretion of the main directions of the texture. SEM micrography allows us to see more order. There are clearly straight lines at 36, 97, and 155 degrees in Figure 4b. These lines can be seen in the SEM micrograph from LIPSS or in the 2D-FFT, where the circle of frequencies observed previously is clustering at six points, indicating the main distances and their linear combinations or harmonics of the structure, as in Romano et al. [24].
The use of 2D-FFT allows us to obtain the directions and wavelengths that can be inverted to obtain the periodicity of pattern structure. Table 3 shows the output from 2D-FFT where periodic distances are predicted for three directions with a similar period to the visual observation of Figure 4.
Table 3.
2D-FFT periodicity results for S3500-Hd3 CrN conditions.
The results on CrN have more order than the DLC anchor layer because we have found the ideal conditions of the laser to obtain the results on CrN. Moreover, the transition between CrN and DLC layers is a gradient, and some carbon might be present in sample S3500-Hd3 in the CrN anchor layer, and, as seen previously, the carbon layer absorbs more energy due to its darker color.
The interference of coatings is then evaluated. Two coatings are measured, CrN, a simple coating without any anchor layer, DLC, a complex coating that has CrN as an anchor layer, and a final coating of sp2 and sp3 carbon which provides low friction. No appreciable differences between magnetron sputtering and Arc-PVD DLCs were seen, so the analysis was made for the DLC MS sample.
Comparison is carried out in Figure 5 for all three samples in the S3000-Hd1 conditions (Sp 3000 mm/s, lateral overlap Hd 1 µm, and fluence F 36.5 J/cm2). With these conditions, we have the maximum energy fluence to guarantee the laser has arrived at the substrate, as shown in Figure 3. As in all cases, there is no coating left, and similar structures appeared. In Figure 5, the resulting texture can be seen for all samples and no coating is left so all samples are 1.2344 steel. All samples have similar periodicity with low order, as no peaks are visible in the 2D-FFT.
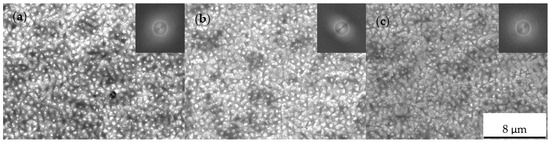
Figure 5.
S3000-Hd1 conditions to reach steel 1.2344 depth for: (a) 1.2344, (b) CrN, and (c) DLC.
3.3. Vertical Axis Measurements
A 3D reconstruction of the surface by AFM was performed to extract a profile and to determine the vertical dimensions of the texture. In Figure 6, the detail of the most ordered sample, CrN S3500-Hd3 conditions, is shown. By taking the profiles on the angles of the 2D-FFT, λ of the texture can be confirmed but not as precise as with the 2D-FFT. On the profile, made at the main angle of the texture, it was seen that there is a periodicity of 1 µm, corresponding to the 0.94 µm period from the 2D-FFT. As for the height of the sample, the amplitude of one period oscillates between 0.1 and 0.15 µm. Similar structures were measured to obtain hydrophobicity [25]. Hydrophobic structures showed a period and amplitude of 20 µm and submicron periods that were responsible for hydrophobicity. These AFM profiles showed some periodicity when a pattern was observed. This was a clear indication that structured patterns could be detected later by using FFT analysis.
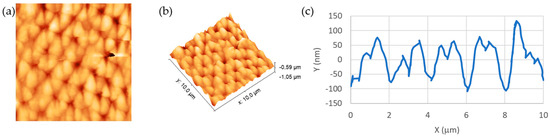
Figure 6.
AFM detail of S3500-Hd3 conditions on CrN: (a) 2D view; (b) 3Dview of 10 µm × 10 µm and (c) section cut of 10 µm to show depths.
3.4. Microfusion
A SEM micrograph at high magnifications of the more ordered sample, CrN, at S3500-Hd3 conditions reveals a spherical structure between 50 and 200 nm, as seen in Figure 7. Even though the femtosecond laser is a cold laser due to the short pulse, these spheres show signs of micro-fusion of the material. SEM images of all samples were produced but they did not reveal any relevant information for patterning issues. Shimizu et al. [26] observed a decrease in the formation thresholds of high-spatial-frequency LIPSS (HSFL) and low-spatial-frequency LIPSS (LSFL) with the increased irradiated laser spot size. For smaller laser spot sizes, HSFL was only formed at the periphery of the LSFL formation area, whereas for larger spot sizes, HSFL was randomly distributed within the laser spot. Their results are coincident with the hypothesis that the existence of defects in crystal contributes to the early stage in the formation of LIPSS, in which the electron excitation via one- or two-photon absorption in a defect site causes local nanoablation at a laser fluence below the intrinsic ablation threshold, followed by the formation of a nanovoid, which acts as a scatterer, and the interference of scattered wave and laser pulses leads to HSFL formation.
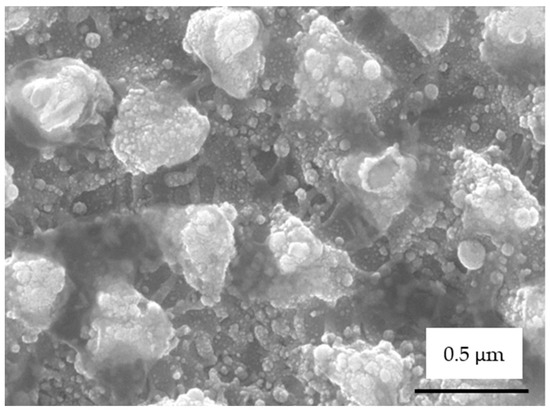
Figure 7.
SEM detail of CrN S3500-Hd3 texture to reveal microfusion.
3.5. Laser Polishing
DLC and laser conditions S3500-Hd10 (Sp 3500 mm/s, lateral overlap 10 µm, and fluence F 3.1 J/cm2) were chosen to achieve a depth of 0.51 µm within the DLC layer. In this sample, it was found that surface roughness decreased from the original sample (100 nm). With these conditions, the polishing of the sample was reduced to a Ra of 15.20 nm. The rest of the substrates did not show similar characteristics, just a progressive loss of order but similar to the ones shown in Figure 5 and Figure 6. Please note that other samples, as the one shown in Figure 6, provided values of Ra over 100 nm. Figure 8 shows SEM image laser machining on DLC with low roughness.
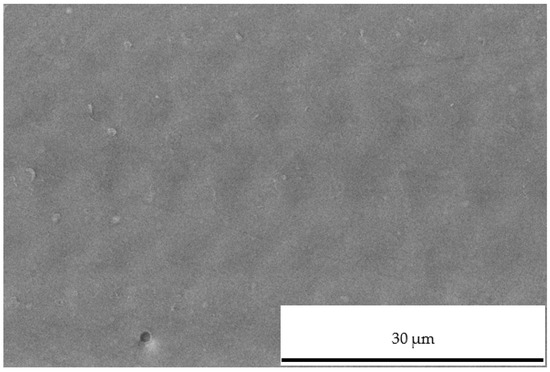
Figure 8.
S3500-Hd10 conditions on DLC.
4. Conclusions
Laser intensity surface structures, or LIPSS, were achieved, as in previous studies, with the novelty of PVD coatings CrN and DLC. The circular polarization of the laser allows us to see hexagonal structures instead of lines. There is a correlation between the laser conditions, the substrate, and the final order of the texture. There is a clear linear relationship between the texturization depth and laser conditions for each coating or material layer. The steeper slope in this depth to energy correlation is observed when machining DLC layer. Polishing conditions under a soft fluence of laser were found to produce a polishing of the DLC coating.
Author Contributions
Conceptualization, C.C. and T.B.-B.; methodology, C.C.; validation, T.B.-B., C.C. and A.G.-G.; formal analysis, T.B.-B.; investigation, T.B.-B.; resources, A.G.-G.; writing—original draft preparation, T.B.-B.; writing—review and editing, A.G.-G.; visualization, A.G.-G.; supervision, C.C.; project administration, C.C.; funding acquisition, A.G.-G. All authors have read and agreed to the published version of the manuscript.
Funding
This research was funded by “Fons Europeus de Desenvolupament Regional de la Unió Europea en el marc del Programa operatiu FEDER de Catalunya 2014–2020” with the acronym Ris3Cat-Plastfun Exp. COMRDI16-1-0018.
Institutional Review Board Statement
Not applicable.
Informed Consent Statement
Not applicable.
Data Availability Statement
Not applicable.
Acknowledgments
This study was possible thanks to Asociación de la Industria Navarra, responsible for the steel samples, Flubetech SL, responsible for the coatings, Microrrelleus SL, responsible for the laser texturing and a special mention to Crisanto Villalobos from Universitat Politècnica de Catalunya for the assistance given with SEM micrographs.
Conflicts of Interest
The authors declare no conflict of interest.
References
- Birnbaum, M. Semiconductor surface damage produced by ruby lasers. J. Appl. Phys. 1965, 36, 3688–3689. [Google Scholar] [CrossRef]
- van Driel, H.M.; Sipe, J.E.; Young, J.F. Laser-induced periodic surface structure on solids: A universal phenomenon. Phys. Rev. Lett. 1982, 49, 1955–1958. [Google Scholar] [CrossRef]
- Nivas, J.J.J.; Song, Z.; Fittipaldi, R.; Vecchione, A.; Bruzzese, R.; Amoruso, S. Direct ultrashort laser surface structuring of silicon in air and vacuum at 1055 nm. Appl. Surf. Sci. 2017, 417, 149–154. [Google Scholar] [CrossRef]
- Groenendijk, M.N.W.; Meijer, J. Surface Microstructures obtained by femtosecond laser pulses. CIRP Ann. 2006, 55, 183–186. [Google Scholar] [CrossRef]
- Zhang, B.; Liu, X.; Qiu, J. Single femtosecond laser beam induced nanogratings in transparent media—Mechanisms and applications. J. Mater. 2019, 5, 1–14. [Google Scholar] [CrossRef]
- Fraggelakis, F.; Mincuzzi, G.; Lopez, J.; Manek-Hönninger, I.; Kling, R. Controlling 2D laser nano structuring over large area with double femtosecond pulses. Appl. Surf. Sci. 2019, 470, 677–686. [Google Scholar] [CrossRef]
- Gräf, S.; Müller, F.A. Polarisation-dependent generation of fs-laser induced periodic surface structures. Appl. Surf. Sci. 2015, 331, 150–155. [Google Scholar] [CrossRef]
- Nivas, J.J.; He, S.; Song, Z.; Rubano, A.; Vecchione, A.; Paparo, D.; Marrucci, L.; Bruzzese, R.; Amoruso, S. Femtosecond laser surface structuring of silicon with Gaussian and optical vortex beams. Appl. Surf. Sci. 2017, 418, 565–571. [Google Scholar] [CrossRef]
- Xie, C.; Li, X.; Liu, K.; Zhu, M.; Qiu, R.; Zhou, Q. Direct writing of sub-wavelength ripples on silicon using femtosecond laser at high repetition rate. Appl. Surf. Sci. 2016, 360, 896–903. [Google Scholar] [CrossRef]
- Li, G.; Li, J.; Yang, L.; Li, X.; Hu, Y.; Chu, J.; Huang, W. Evolution of aluminum surface irradiated by femtosecond laser pulses with different pulse overlaps. Appl. Surf. Sci. 2013, 276, 203–209. [Google Scholar] [CrossRef]
- Rebollar, E.; Castillejo, M.; Ezquerra, T.A. Laser induced periodic surface structures on polymer films: From fundamentals to applications. Eur. Polym. J. 2015, 73, 162–174. [Google Scholar] [CrossRef]
- Moradi, S.; Kamal, S.; Englezos, P.; Hatzikiriakos, S.G. Femtosecond laser irradiation of metallic surfaces: Effects of laser parameters on superhydrophobicity. Nanotechnology 2013, 24, 415302. [Google Scholar] [CrossRef] [PubMed]
- Epperlein, N.; Menzel, F.; Schwibbert, K.; Koter, R.; Bonse, J.; Sameith, J.; Krüger, J.; Toepel, J. Influence of femtosecond laser produced nanostructures on biofilm growth on steel. Appl. Surf. Sci. 2017, 418, 420–424. [Google Scholar] [CrossRef]
- Muntada-López, O.; Pina-Estany, J.; Colominas, C.; Fraxedas, J.; Pérez-Murano, F.; García-Granada, A. Replication of nanoscale surface gratings via injection molding. Micro Nano Eng. 2019, 3, 37–43. [Google Scholar] [CrossRef]
- Rodríguez, A.; Morant-Miñana, M.C.; Dias-Ponte, A.; Martínez-Calderón, M.; Gómez-Aranzadi, M.; Olaizola, S.M. Femtosecond laser-induced periodic surface nanostructuring of sputtered platinum thin films. Appl. Surf. Sci. 2015, 351, 135–139. [Google Scholar] [CrossRef]
- Yasumaru, N.; Miyazaki, K.; Kiuchi, J. Control of tribological properties of diamond-like carbon films with femtosecond-laser-induced nanostructuring. Appl. Surf. Sci. 2008, 254, 2364–2368. [Google Scholar] [CrossRef]
- Bonse, J. Quo Vadis LIPSS?—Recent and future trends on laser-induced periodic surface structures. Nanomaterials 2020, 10, 1950. [Google Scholar] [CrossRef]
- Bonse, J.; Graf, S. Maxwell meets marangoni—A review of theories on laser-induced periodic surface structures. Laser Photonics Rev. 2020, 14, 2000215. [Google Scholar] [CrossRef]
- Bonse, J.; Kirner, S.V.; Koter, R.; Pentzien, S.; Spaltmann, D.; Krüger, J. Femtosecond laser-induced periodic surface structures on titanium nitride coatings for tribological applications. Appl. Surf. Sci. 2017, 418, 572–579. [Google Scholar] [CrossRef]
- Ahmed, K.M.T.; Grambow, C.; Kietzig, A. Fabrication of micro/nano structures on metals by femtosecond laser micromachining. Micromachines 2014, 5, 1219–1253. [Google Scholar] [CrossRef]
- Lehr, J.; Kietzig, A.M. Production of homogenous micro-structures by femtosecond laser micro-machining. Opt. Lasers Eng. 2014, 57, 121–129. [Google Scholar] [CrossRef]
- Winter, J.; Spellauge, M.; Hermann, J.; Eulenkamp, C.; Huber, H.; Schmidt, M. Ultrashort single-pulse laser ablation of stainless steel, aluminium, copper and its dependence on the pulse duration. Opt. Express 2021, 29, 14561–14581. [Google Scholar] [CrossRef]
- Yang, Y.; Lou, R.; Chen, X.; Fan, W.; Bai, J.; Si, J. Influence of energy fluence and overlapping rate of femtosecond laser on surface roughness of Ti-6Al-4V. Opt. Eng. 2019, 58, 106107. [Google Scholar] [CrossRef]
- Romano, J.M.; Garcia-Giron, A.; Penchev, P.; Dimov, S. Triangular laser-induced submicron textures for functionalising stainless steel surfaces. Appl. Surf. Sci. 2018, 440, 162–169. [Google Scholar] [CrossRef]
- Baldi-Boleda, T.; Sadeghi, E.; Colominas, C.; García-Granada, A. Simulation approach for hydrophobicity replication via injection molding. Polymers 2021, 13, 2069. [Google Scholar] [CrossRef] [PubMed]
- Shimizu, H.; Yada, S.; Obara, G.; Terakawa, M. Contribution of defect on early stage of LIPSS formation. Opt. Express 2014, 22, 17990–17998. [Google Scholar] [CrossRef]
Publisher’s Note: MDPI stays neutral with regard to jurisdictional claims in published maps and institutional affiliations. |
© 2022 by the authors. Licensee MDPI, Basel, Switzerland. This article is an open access article distributed under the terms and conditions of the Creative Commons Attribution (CC BY) license (https://creativecommons.org/licenses/by/4.0/).