Article

Corrosion Fatigue Test and Performance Evaluation of High-Strength Steel Wires Based on the Suspender of a 11-Year-Old Concrete-Filled Steel Tube Arch Bridge

Department of Road and Bridge Engineering, School of Transportation and Logistics Engineering, Wuhan University of Technology, Wuhan 430063, China
*
Author to whom correspondence should be addressed.
Coatings 2022, 12(10), 1475; https://doi.org/10.3390/coatings12101475
Submission received: 31 August 2022 / Revised: 26 September 2022 / Accepted: 3 October 2022 / Published: 5 October 2022
(This article belongs to the Special Issue Functional Materials for Building and Pavement Coatings)

Abstract

:
In this study, based on an actual project, the steel wire in the suspender of a concrete-filled steel tube arch bridge was selected from appropriate samples to perform acetic acid-accelerated salt spray tests, and steel wire samples with different corrosion degrees were obtained. A laser microscope was used to measure the roughness of the samples, and three corrosion samples were randomly selected from each group for grinding. Fatigue tests were performed on steel wire samples with different degrees of corrosion and polished steel wire samples, and the fatigue fracture was observed and analyzed. The results showed that few cracks on the steel wire surface could be eliminated by grinding, and the fatigue life of the specimens could be increased. Finally, the stress-life-mass loss rate (S-N-η) probability model based on the Weibull distribution was obtained using the measured fatigue data, which can be further referenced in the planning of the inspection of suspender service status, steel wire corrosion protection, and fatigue life prediction, etc.

1. Introduction

A suspender is an important stress component in the centre of an arch bridge, and its condition directly affects the safety and durability of the structure [1]. A suspender is typically designed to last 30 years, and many of the suspenders of bridges have been replaced in less than 10 years. Although the suspender replacement is technically feasible, the repair is expensive [2,3]. The bridge that provided the sample for this experiment also faced the problem of replacing the suspender [4]. Effective corrosion control measures can only delay the corrosion of the suspender [5]. As the in-service life increases, the life of the suspender will be far less than the expected life under the combined effect of corrosion and stress [6,7,8,9]. Corrosion is a common problem in both original design and service life evaluation.
The mechanism of steel-wire fracture caused by stress and corrosion is controversial. Mayrbaurl and Camo found that in a corrosive environment, the fracture of the wire rope is mainly due to stress corrosion cracking followed by hydrogen embrittlement cracking [10]. Through an accelerated corrosion test, Betti et al. found that hydrogen embrittlement alone is not sufficient to explain steel wire fracture. The main reason is that corrosion leads to an uneven steel wire surface, and pits and microcracks would cause local stress concentrations and fractures [11]. Nakamura et al. found that the fracture of steel wire removed from a suspension bridge was characterised by fatigue fracture rather than hydrogen embrittlement fracture [12]. Since the corrosion of steel wires in the suspension rods of arch bridges is inevitable, it is very important to investigate the quantitative effect of corrosion on the service life of steel wires.
Regarding the corrosion condition and fatigue performance of corroded steel wire, Li Rou investigated the relationship between fatigue fracture and corrosion degree and found that the fatigue life decreases significantly at a low stress amplitude and high corrosion degree. The fatigue crack propagation of a steel wire is sufficient at lower stress amplitudes [13]. Under the combined effect of fatigue loading and corrosive medium, Wang Ying found that the greater the depth and width of notched steel wire samples, the smaller the initial defect morphology, the faster the crack growth rate, and the shorter the service life [14]. Zheng Yuqian investigated the effect of the corrosion environment on the fatigue life of steel wires, simulated corrosion pits of different shapes, and studied the influence of initial defects on the life of steel wires by comparing the morphology of different initial tests and retests [15]. In the practical engineering of Ma Yafei, the corrosion process is uncertain, and the size of the corrosion pit is random. The stress concentration caused by corrosion pits accelerates the development of fatigue cracks and reduces the fatigue life of bridge slings [16]. Zheng et al. conducted steel wire corrosion and fatigue tests on the replacement slings of an arch bridge that had been in service for 13 years. The results showed that the corrosion performance of steel wire deceased significantly in the initial stage of corrosion, and the corrosion rate decreased as the corrosion progressed. The greater the pit depth, the lower the fatigue life [17,18]. Changqing studied the shape, number, and size of corrosion pits on the steel wires of an arch bridge. As the depth of corrosion increases, corrosion pits of different shapes combine to form larger elliptical corrosion pits [19]. Li Xiaozhang et al. used the suspender steel wire of an arch bridge, which had been in service for ten years, to assess the damage caused to the steel wire by varying degrees of natural corrosion, artificial corrosion, and mechanical damage. Through fracture analysis after tensile and fatigue tests, they found that the fatigue life of the steel wire was significantly reduced in the early corrosion stage due to corrosion. However, the fatigue life of steel wires is not significantly reduced by further corrosion [20]. Lepidi et al. used an analytical method to analyse the effect of uniform corrosion on the mechanical properties of the cable, but their study did not consider the corrosion law of the cable wire [21].
Chengming conducted fatigue tests on a high-strength, corroded steel wire with long service life by considering the stay cable as a research object. A three-parameter Weibull model was proposed to evaluate the fatigue life of corroded steel wire. A theoretical model of the fibre bundle for calculating the fatigue life of parallel wire stay cables was established [21,22,23]. Chen Airong et al. determined the yield and ultimate load of corroded steel wire by an accelerated corrosion test of steel wire and established a degradation model of yield and ultimate load of corroded steel wire based on normal distribution [24]. Chao et al. performed three-dimensional morphology measurements and fatigue tests on steel wires with six corrosion grades. Data analysis revealed a bilinear S-N curve on a logarithmic scale. On this basis, an empirical formula was established to calculate the fatigue life taking into account the corrosion effect [25].
Based on the above, the purpose of this test is to quantitatively investigate the fatigue performance of high-strength steel wire used as a suspender, and to analyse its corrosion appearance and fatigue fracture. In addition, based on the Weibull distribution model, the relationship between the stress and corrosion rate was described by the measured fatigue life data. This provides a basis for the performance and service life of corroded high-strength steel wires and for the maintenance and management of suspender members.

2. Materials and Experimental Preparation

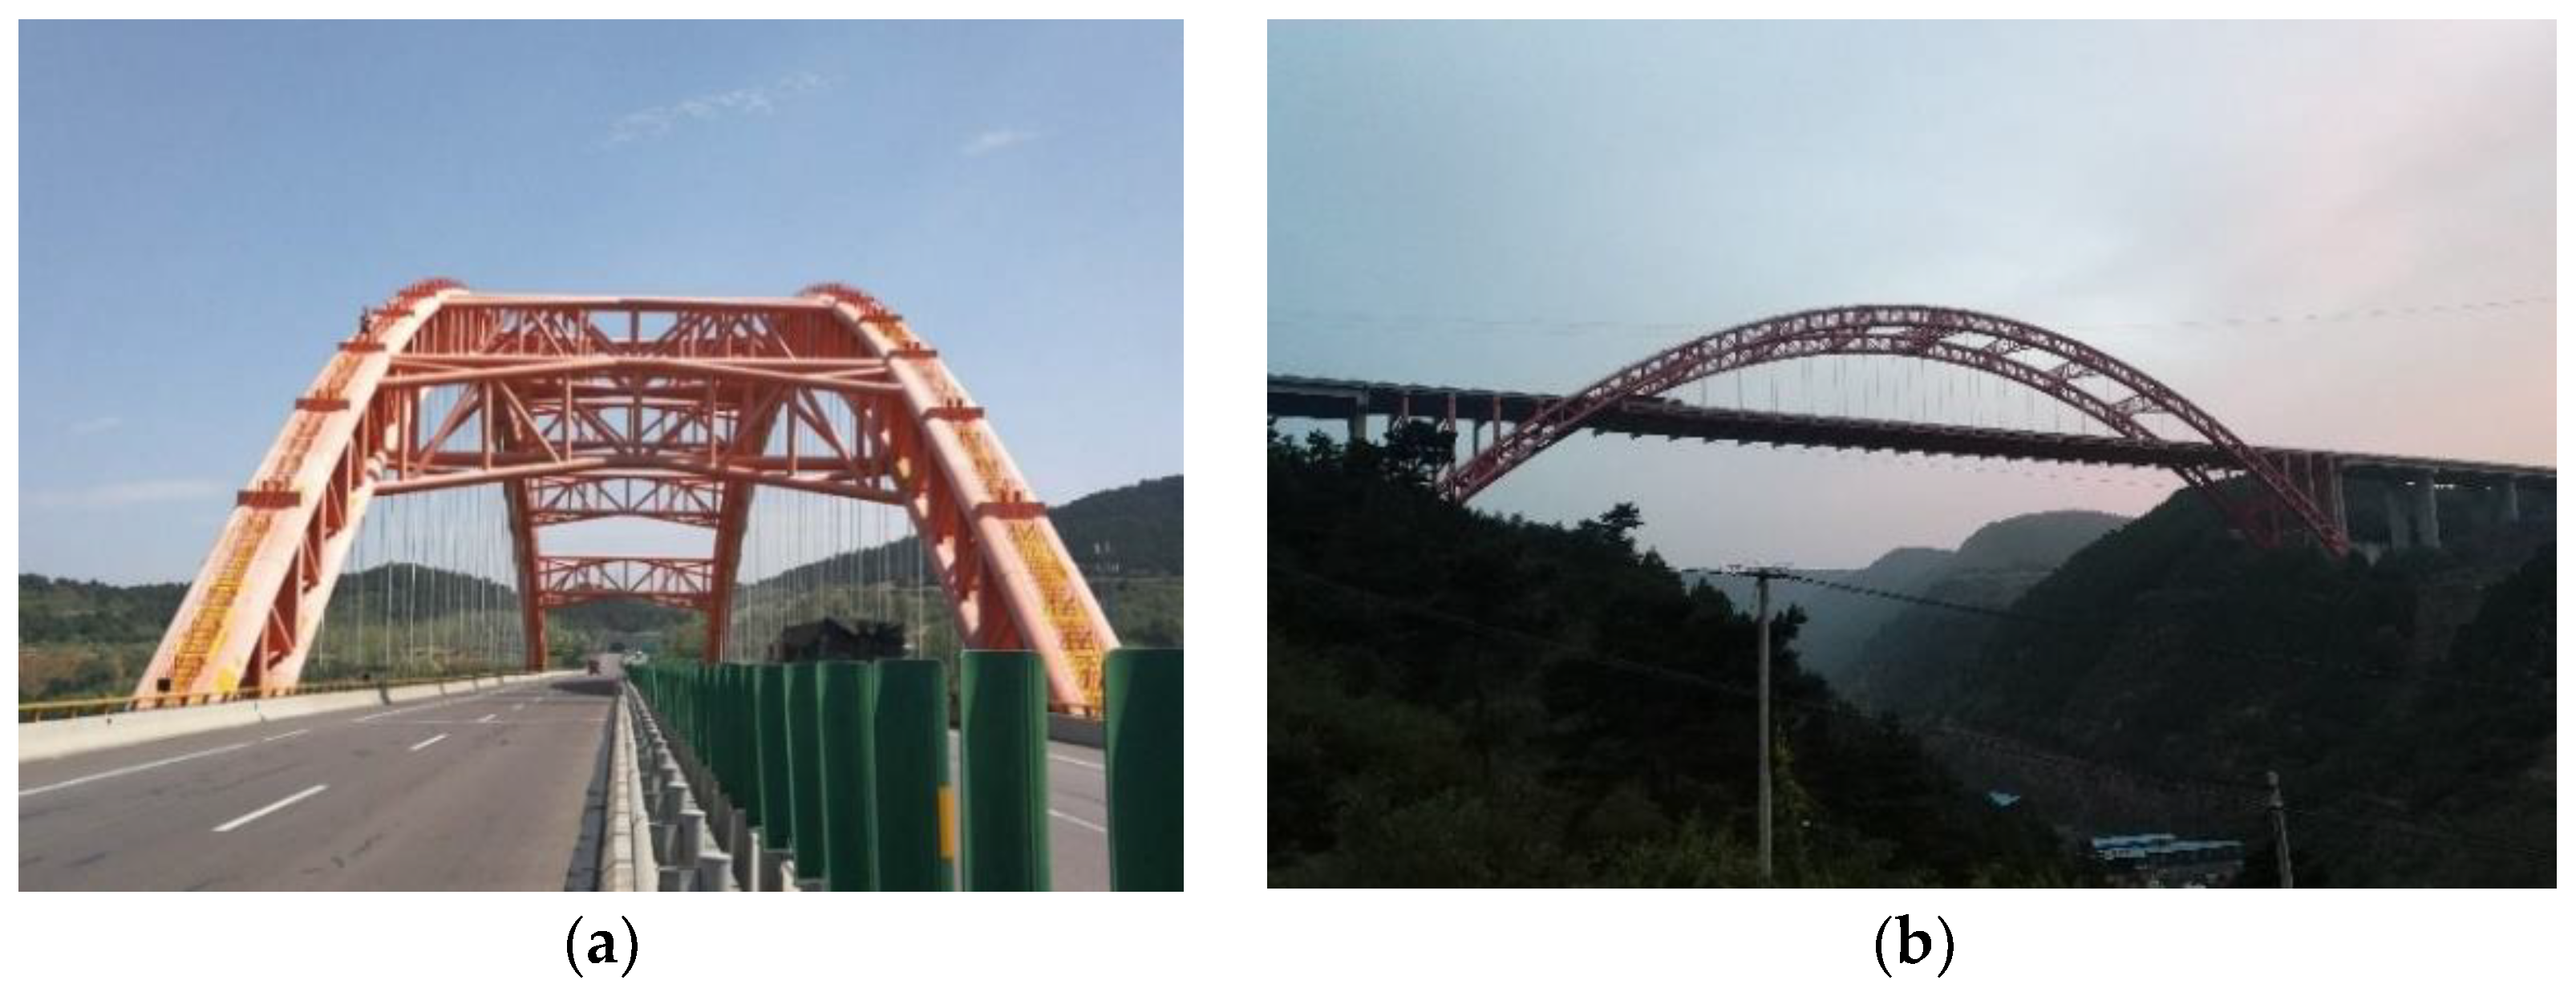
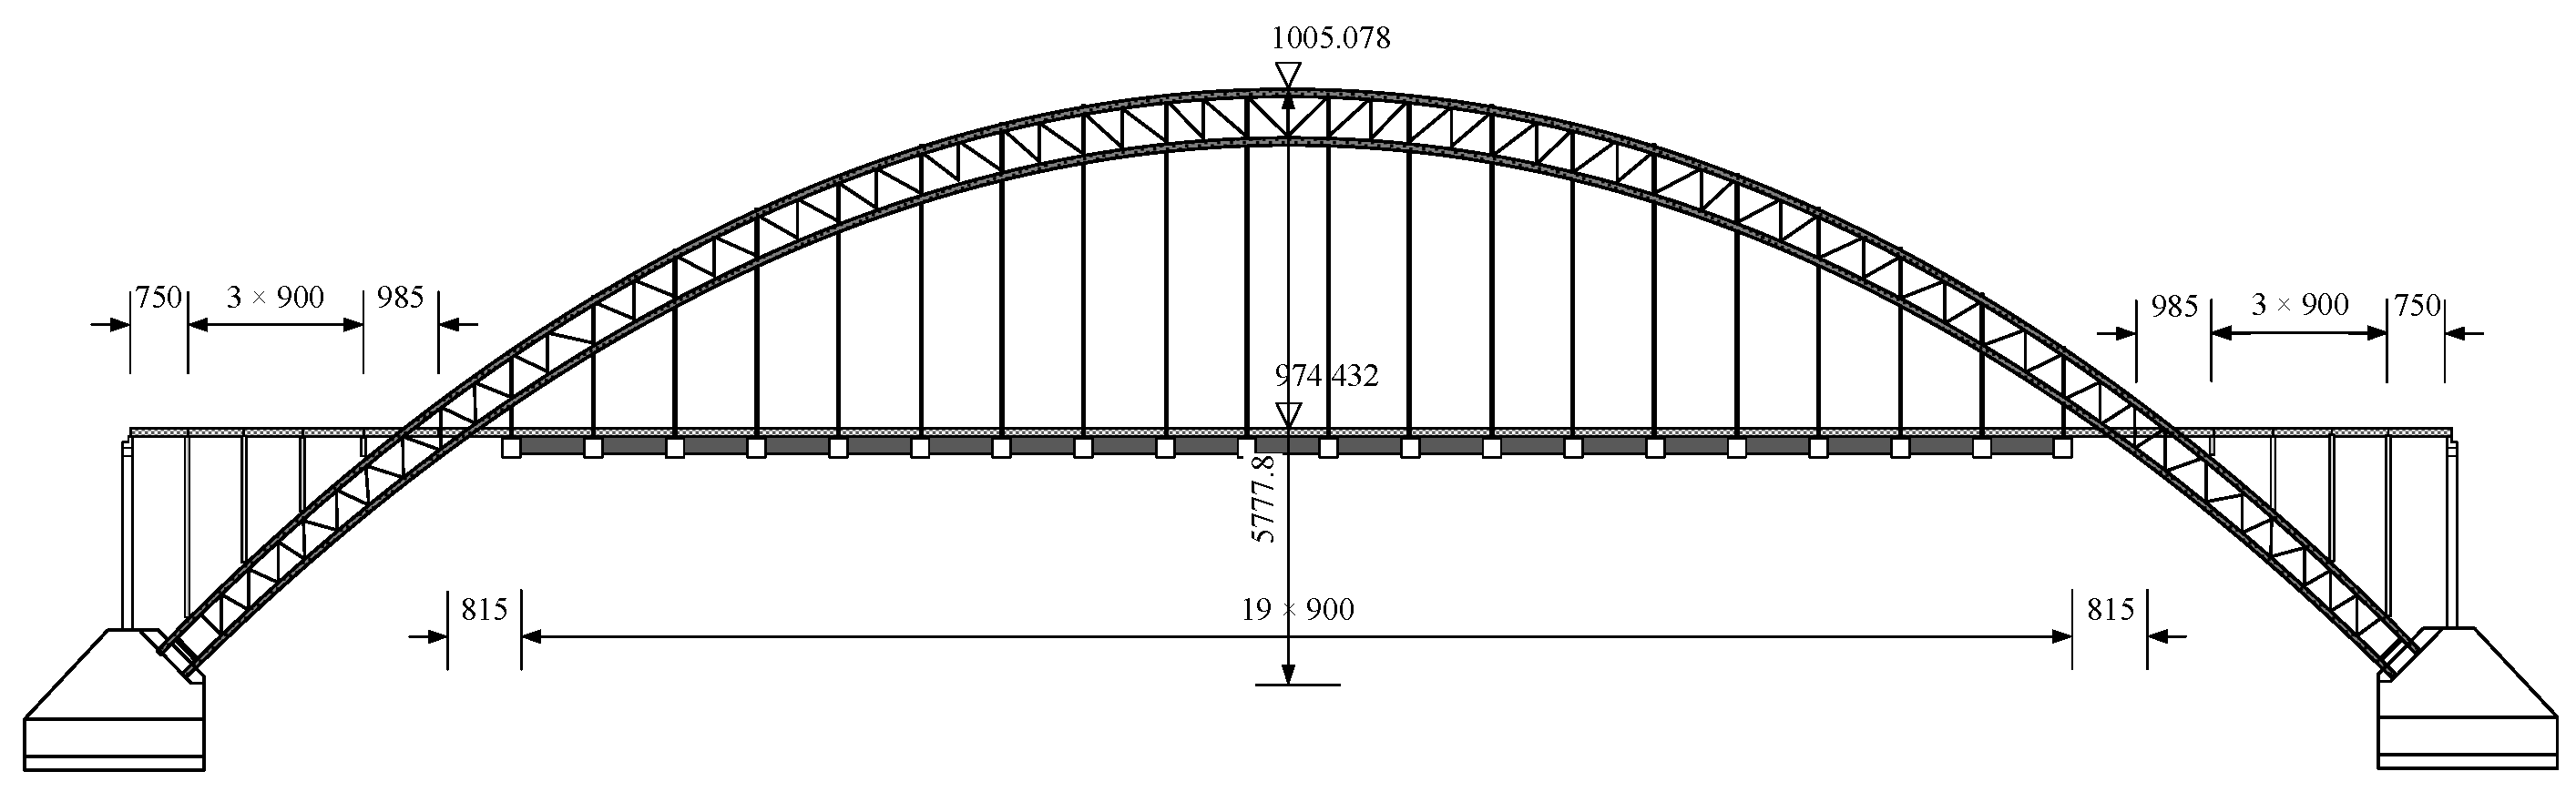
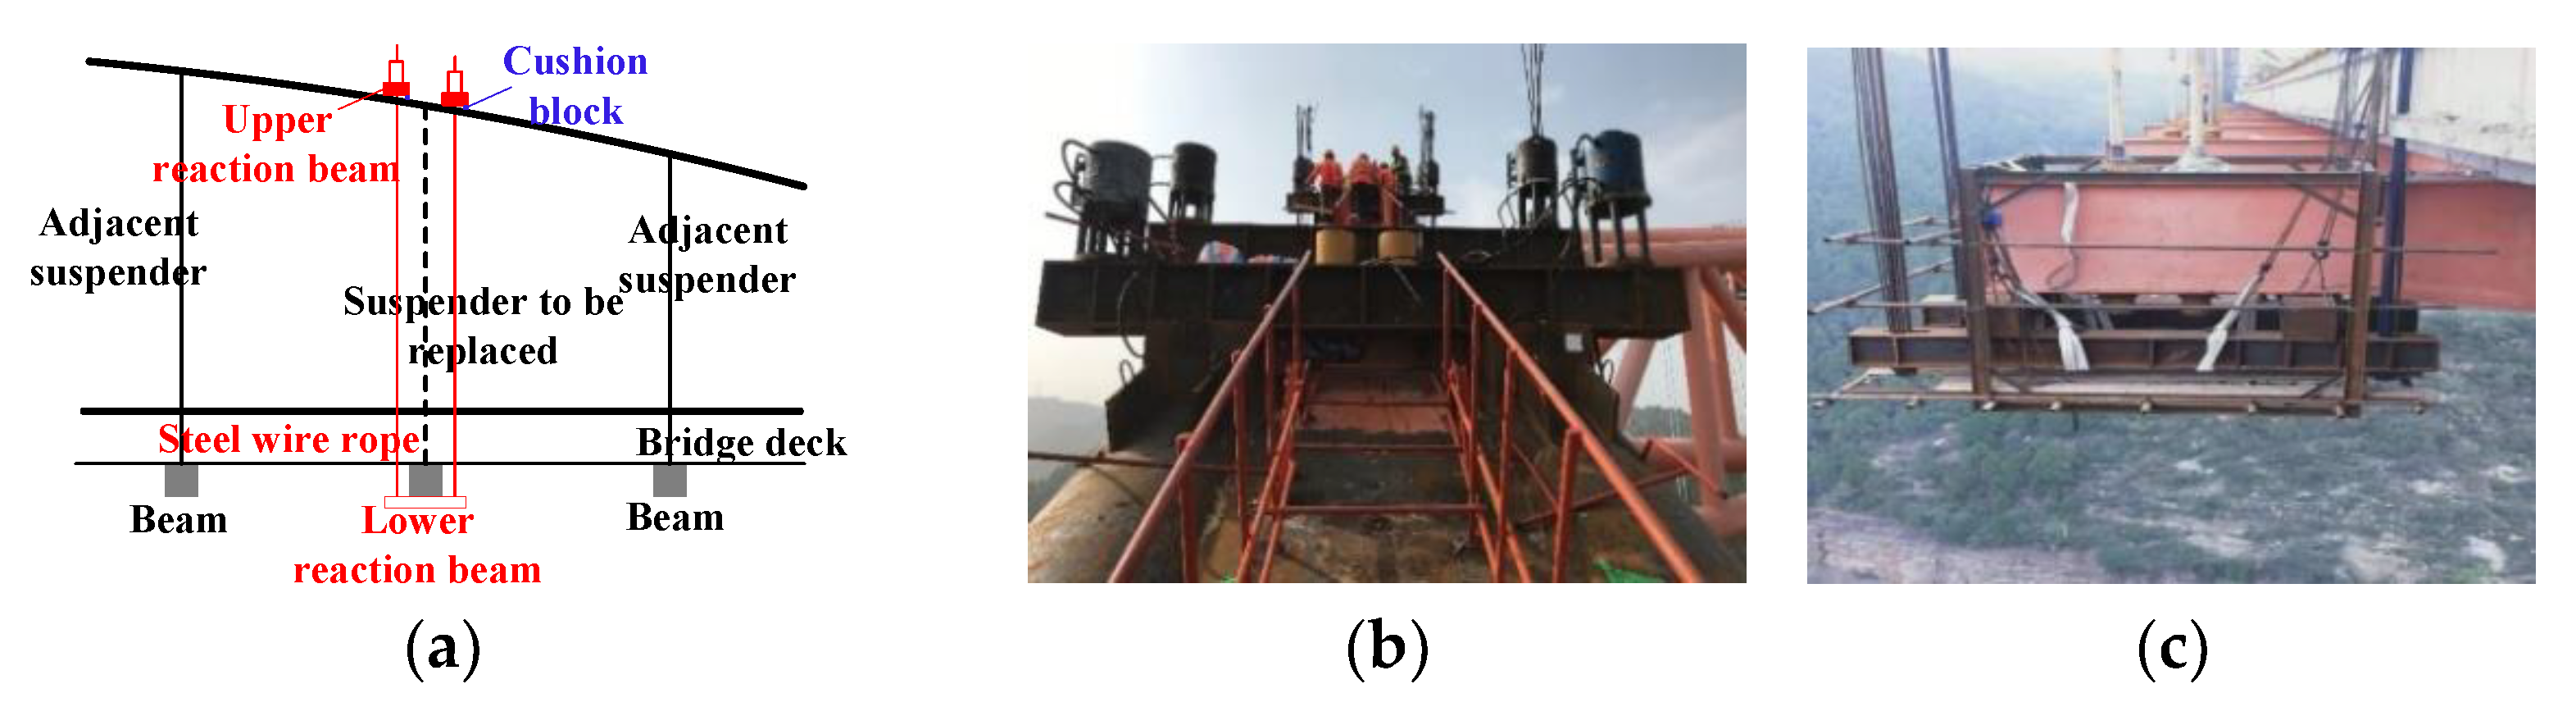
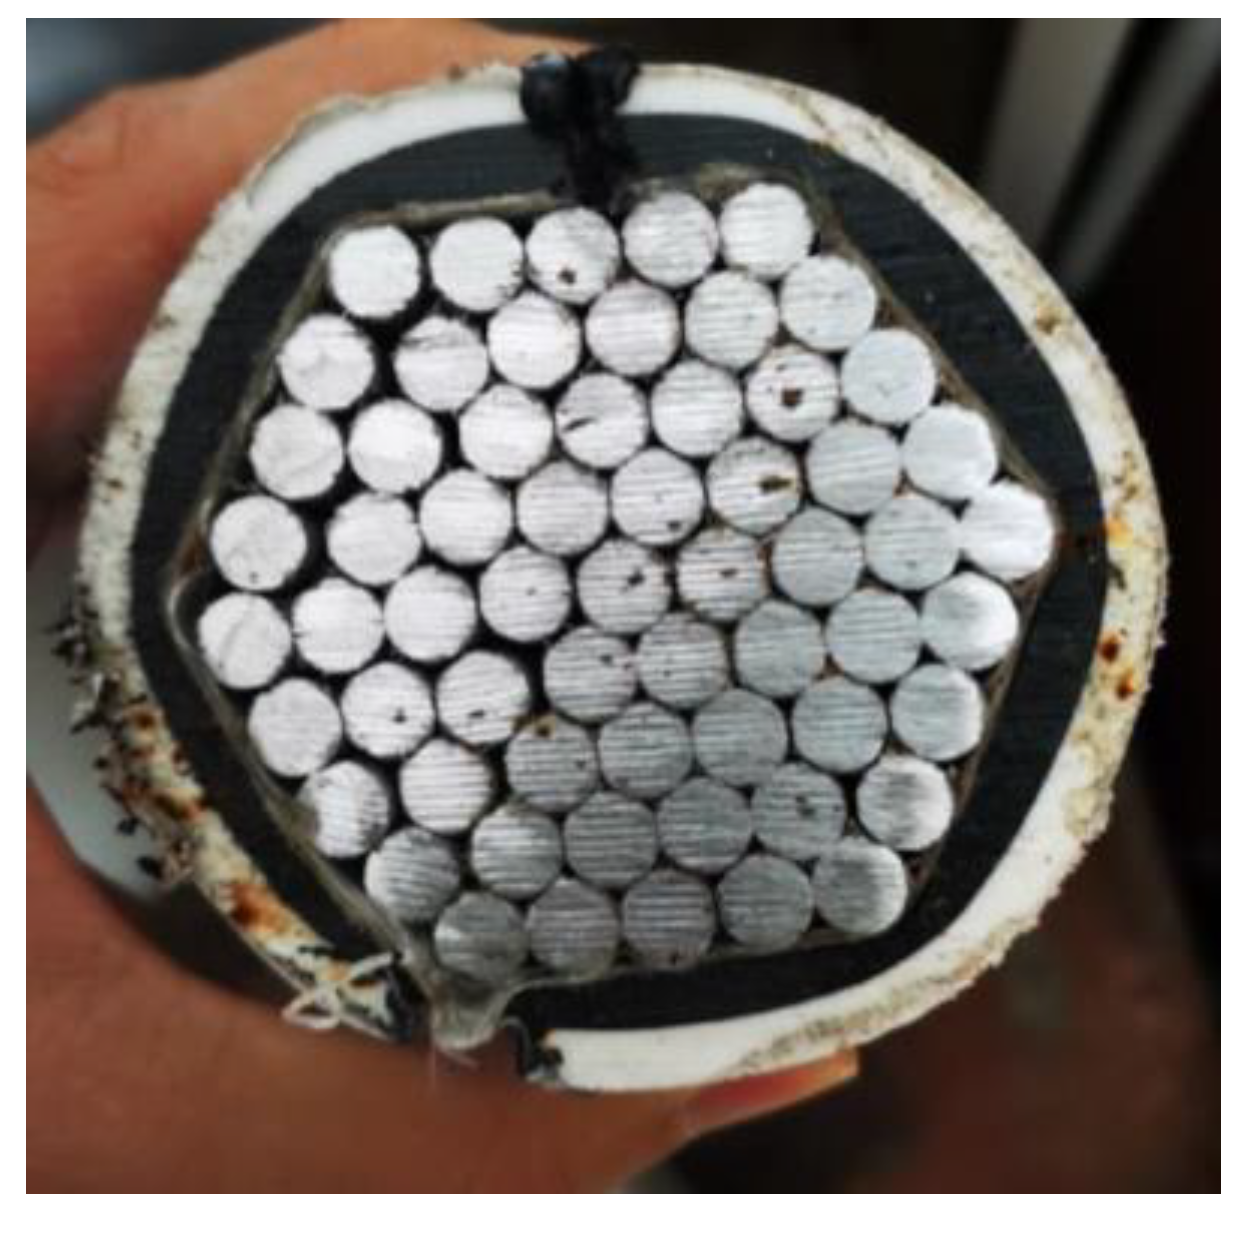
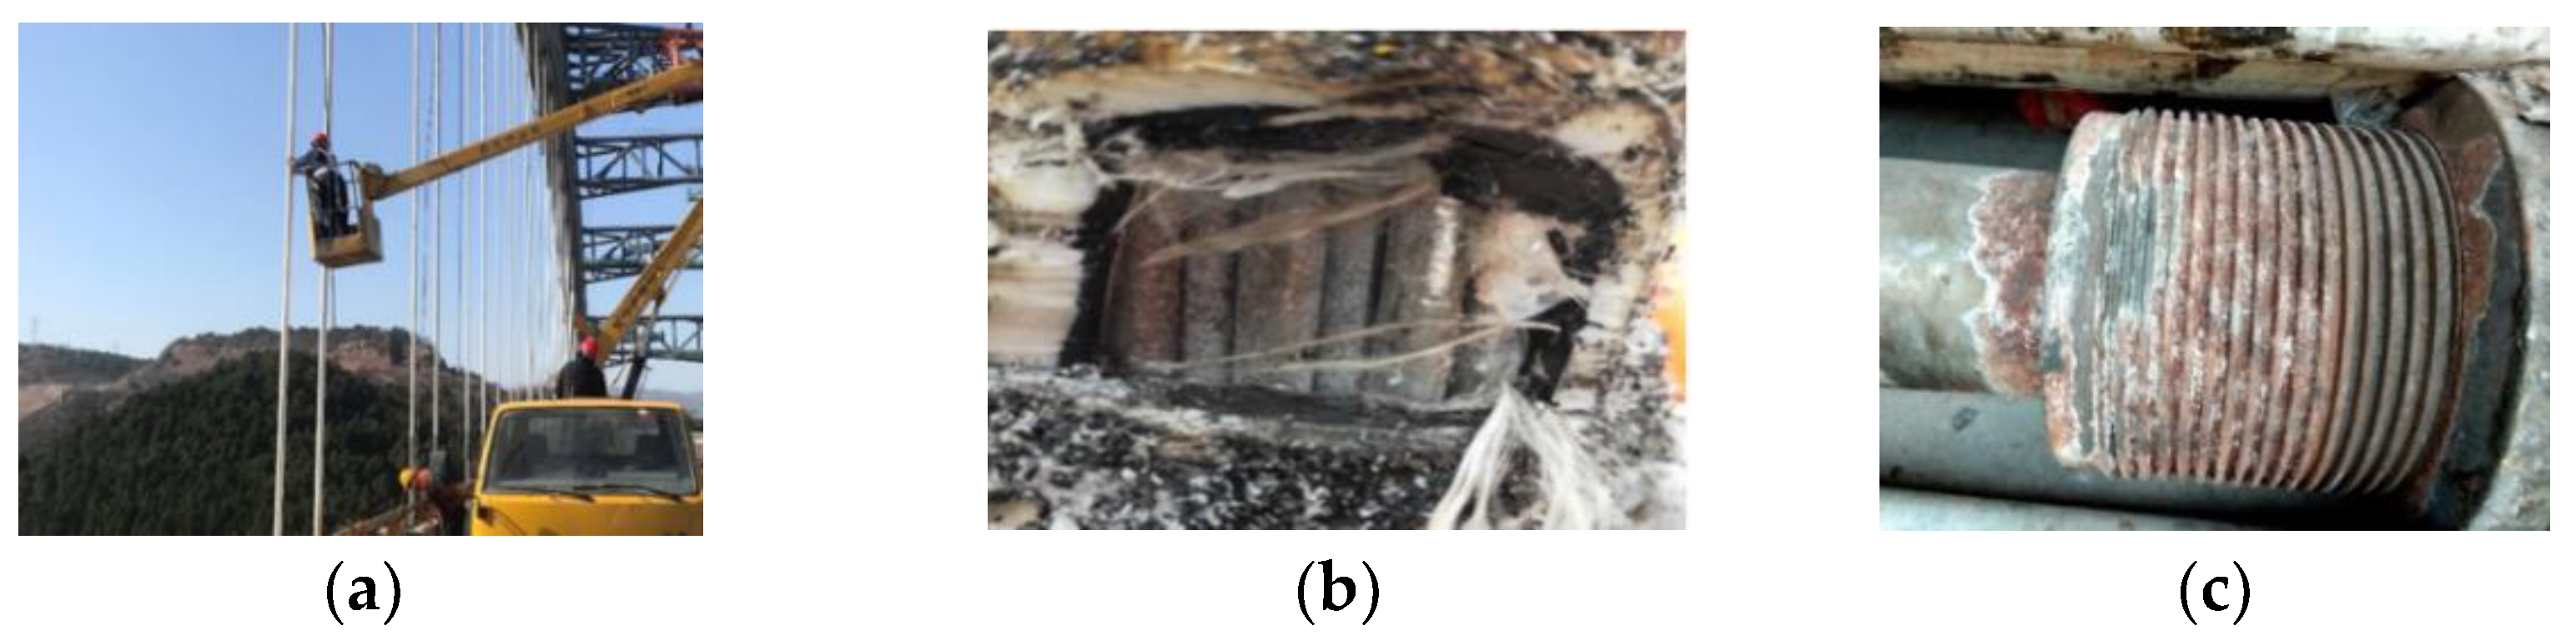
2.1. Engineering Background

The long-span suspender arch bridge is a half-through concrete-filled steel tubular arch bridge that spans a deep ditch in a mountainous area, with a main span of 260 m. The carriageway beam is a 7.5 + 3 × 9 + 9.85 + 8.15 + 19 × 9 + 8.15 + 9.85 + 3 × 9 + 7.5 m reinforced concrete π-shaped beam. The entire bridge first adopts simple support, followed by a continuous construction technology. The plan view of the main bridge structure is shown in Figure 1 and Figure 2.
After 11 years of operation, eight booms were no longer able to meet the load capacity requirements. The target boom from the anchoring end was considered as the starting point. The corrosion is shown in Figure 3. The area of severe corrosion is generally located near the anchor head area at the lower end of the suspender, near the damaged area of the sheath, and below the damaged area where the galvanised layer of the wire has completely failed and the wire base is corroded with brown metal oxide on the surface. However, on the surface of the steel wire far from the anchor head, only the galvanised layer oxidises, and the surface loses its metallic lustre and is still in the stage of uniform corrosion. The farther the wire is from the anchor head and the damaged part, the less corrosion occurs. The suspender was replaced with a heavily corroded suspender, and the design scheme is shown in Figure 4.

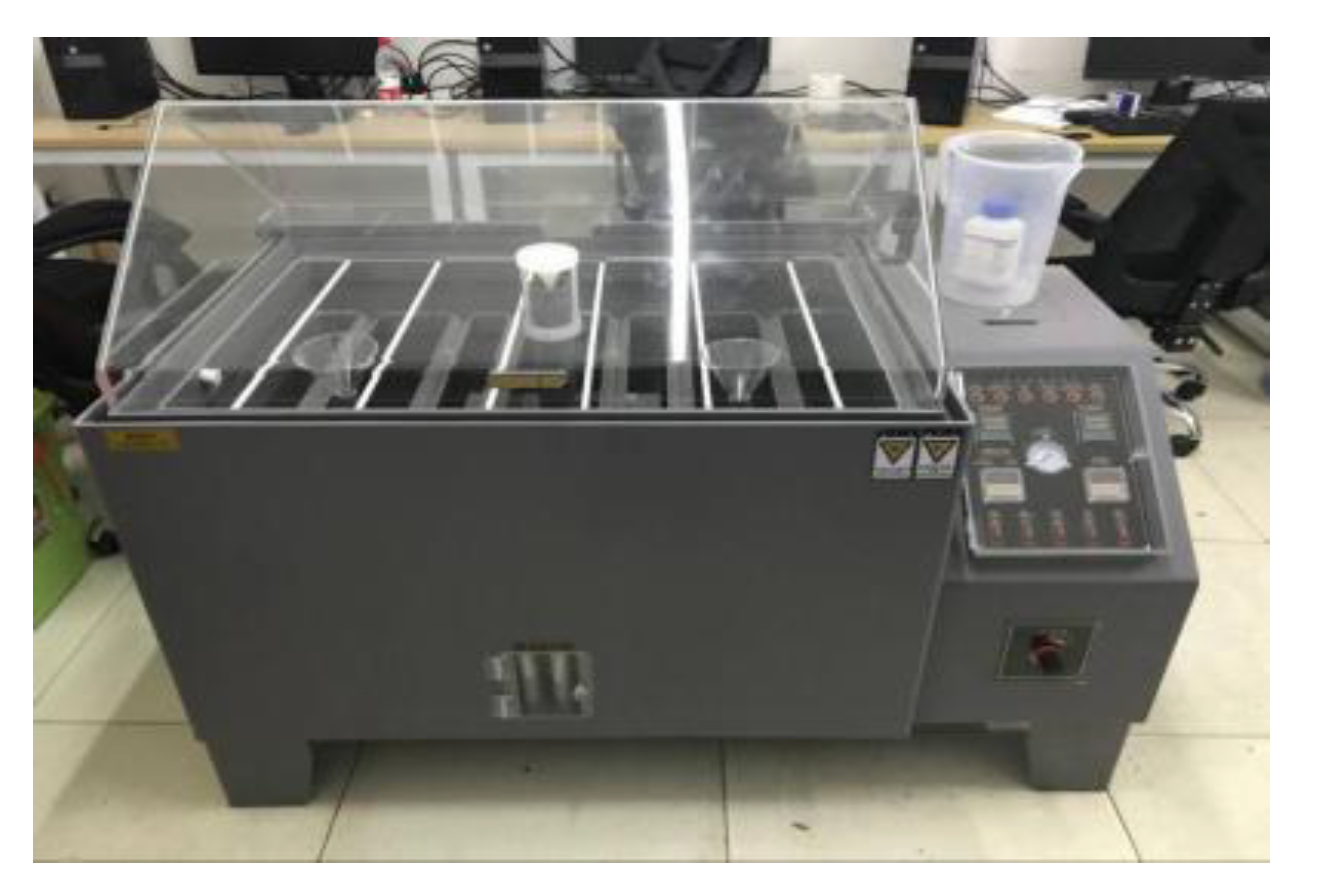
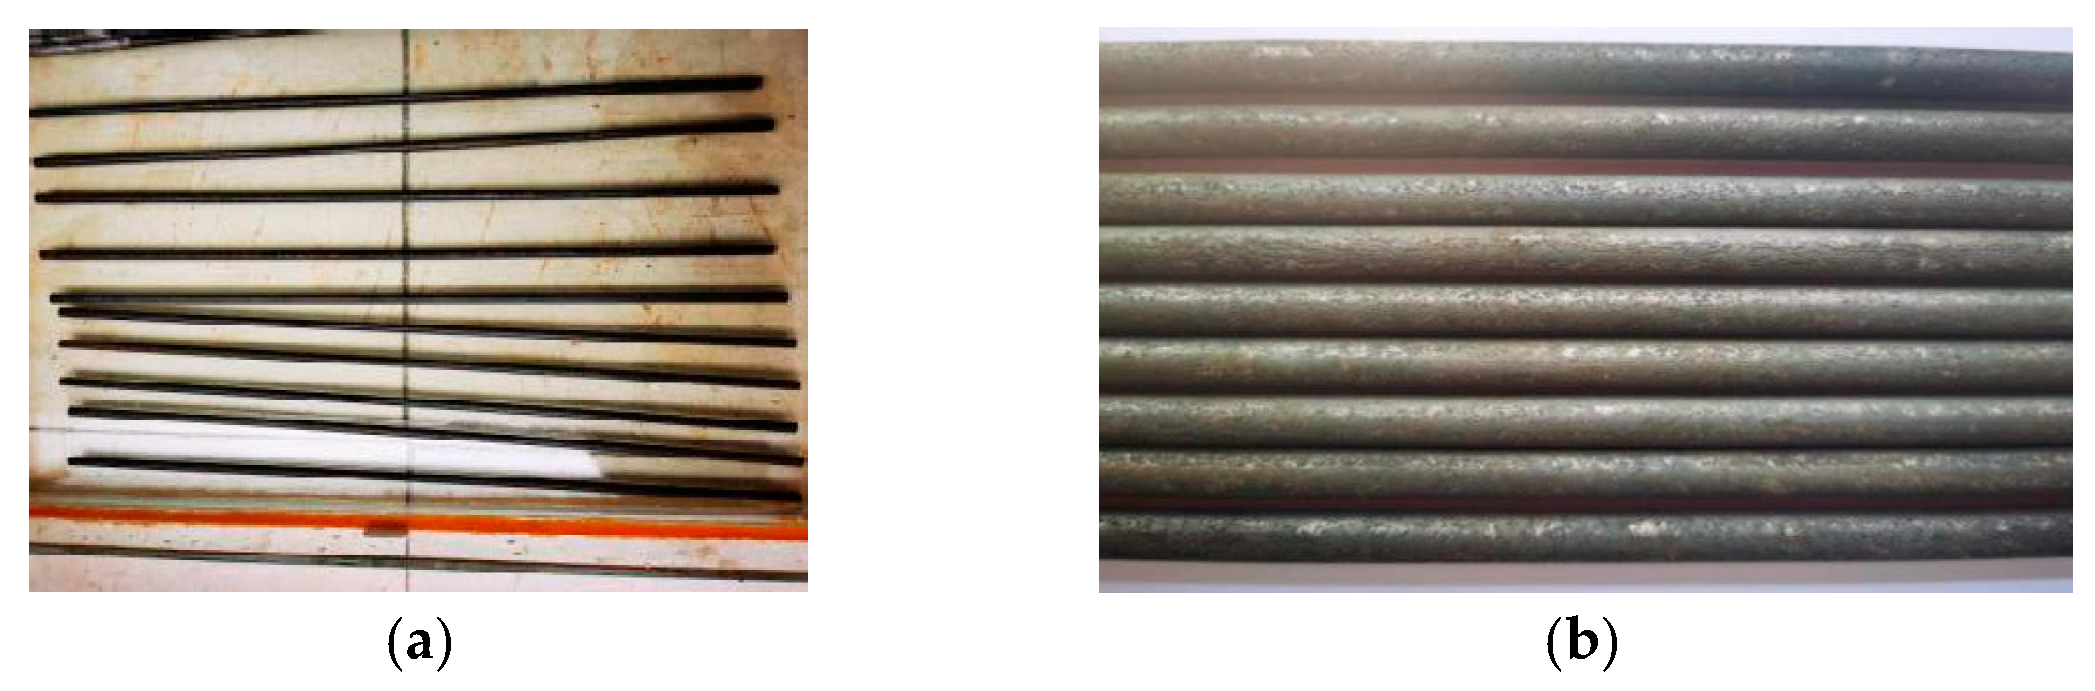
2.2. Salt Spray Corrosion Test and Specimen Production

The salt spray test wire came from Beishengou concrete-filled steel tube arch bridge. The bridge used OVMLZM-I type parallel steel wire cold cast anchor system. The suspender consisted of 61 parallel steel wires with a diameter of 7 mm and a tensile strength of 1670 MPa; its structure system mainly consists of dozens of parallel steel wire wrapped with polyurethane tape followed by HDPE protective layer, as shown in Figure 5. The chemical composition of the steel wires is given in Table 1. To ensure the reliability of the test, the steel wire used for the salt spray test was a non-corroded steel wire with a fully galvanised layer inside the suspender.
The corrosion test was performed using the salt-spray corrosion chamber (Ayi Instrument Technology Co. LTD, Shanghai, China) shown in Figure 6. The accelerated corrosion test was conducted using acetic acid salt spray (AASS) according to ISO 9227: 1990 [26]. The temperature of the corrosion environment for the acetic acid accelerated salt spray test was 35 °C; solid NaCl crystals with a purity of >99.5% were used, and the sodium chloride concentration was 50 g/L ± 5 g/L in the salt solution prepared with pure water. Then, an appropriate amount of glacial acetic acid was added to adjust the pH of the corrosion solution to 3.0. A salt spray test machine was used to atomise the corrosive solution. After a specified test period, the relevant corrosion data were observed and measured for the steel wire. The intervals for this test were 10, 20, 40, 60, and 90 days.
A measuring tape (Hengliang Measuring Tools Co., LTD, Shanghai, China) was used to measure the truncated suspensions. The length was 500 mm, and the error was within ±5 mm. Prior to testing, the specimen was cleaned, and wrapped 100 mm at both ends with a plastic film and sealed with paraffin wax. This process prevents complete corrosion, which could lead to the fracture of the sample in the clamping area.

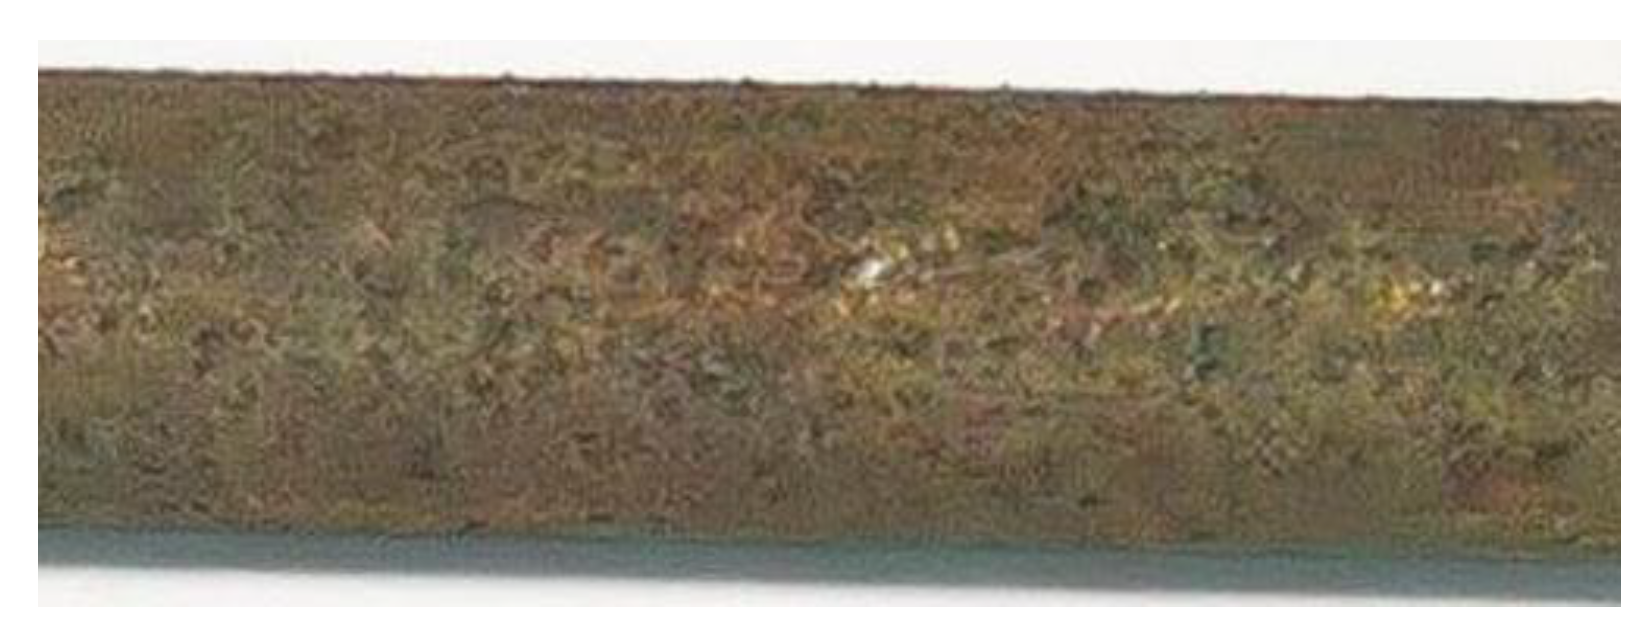
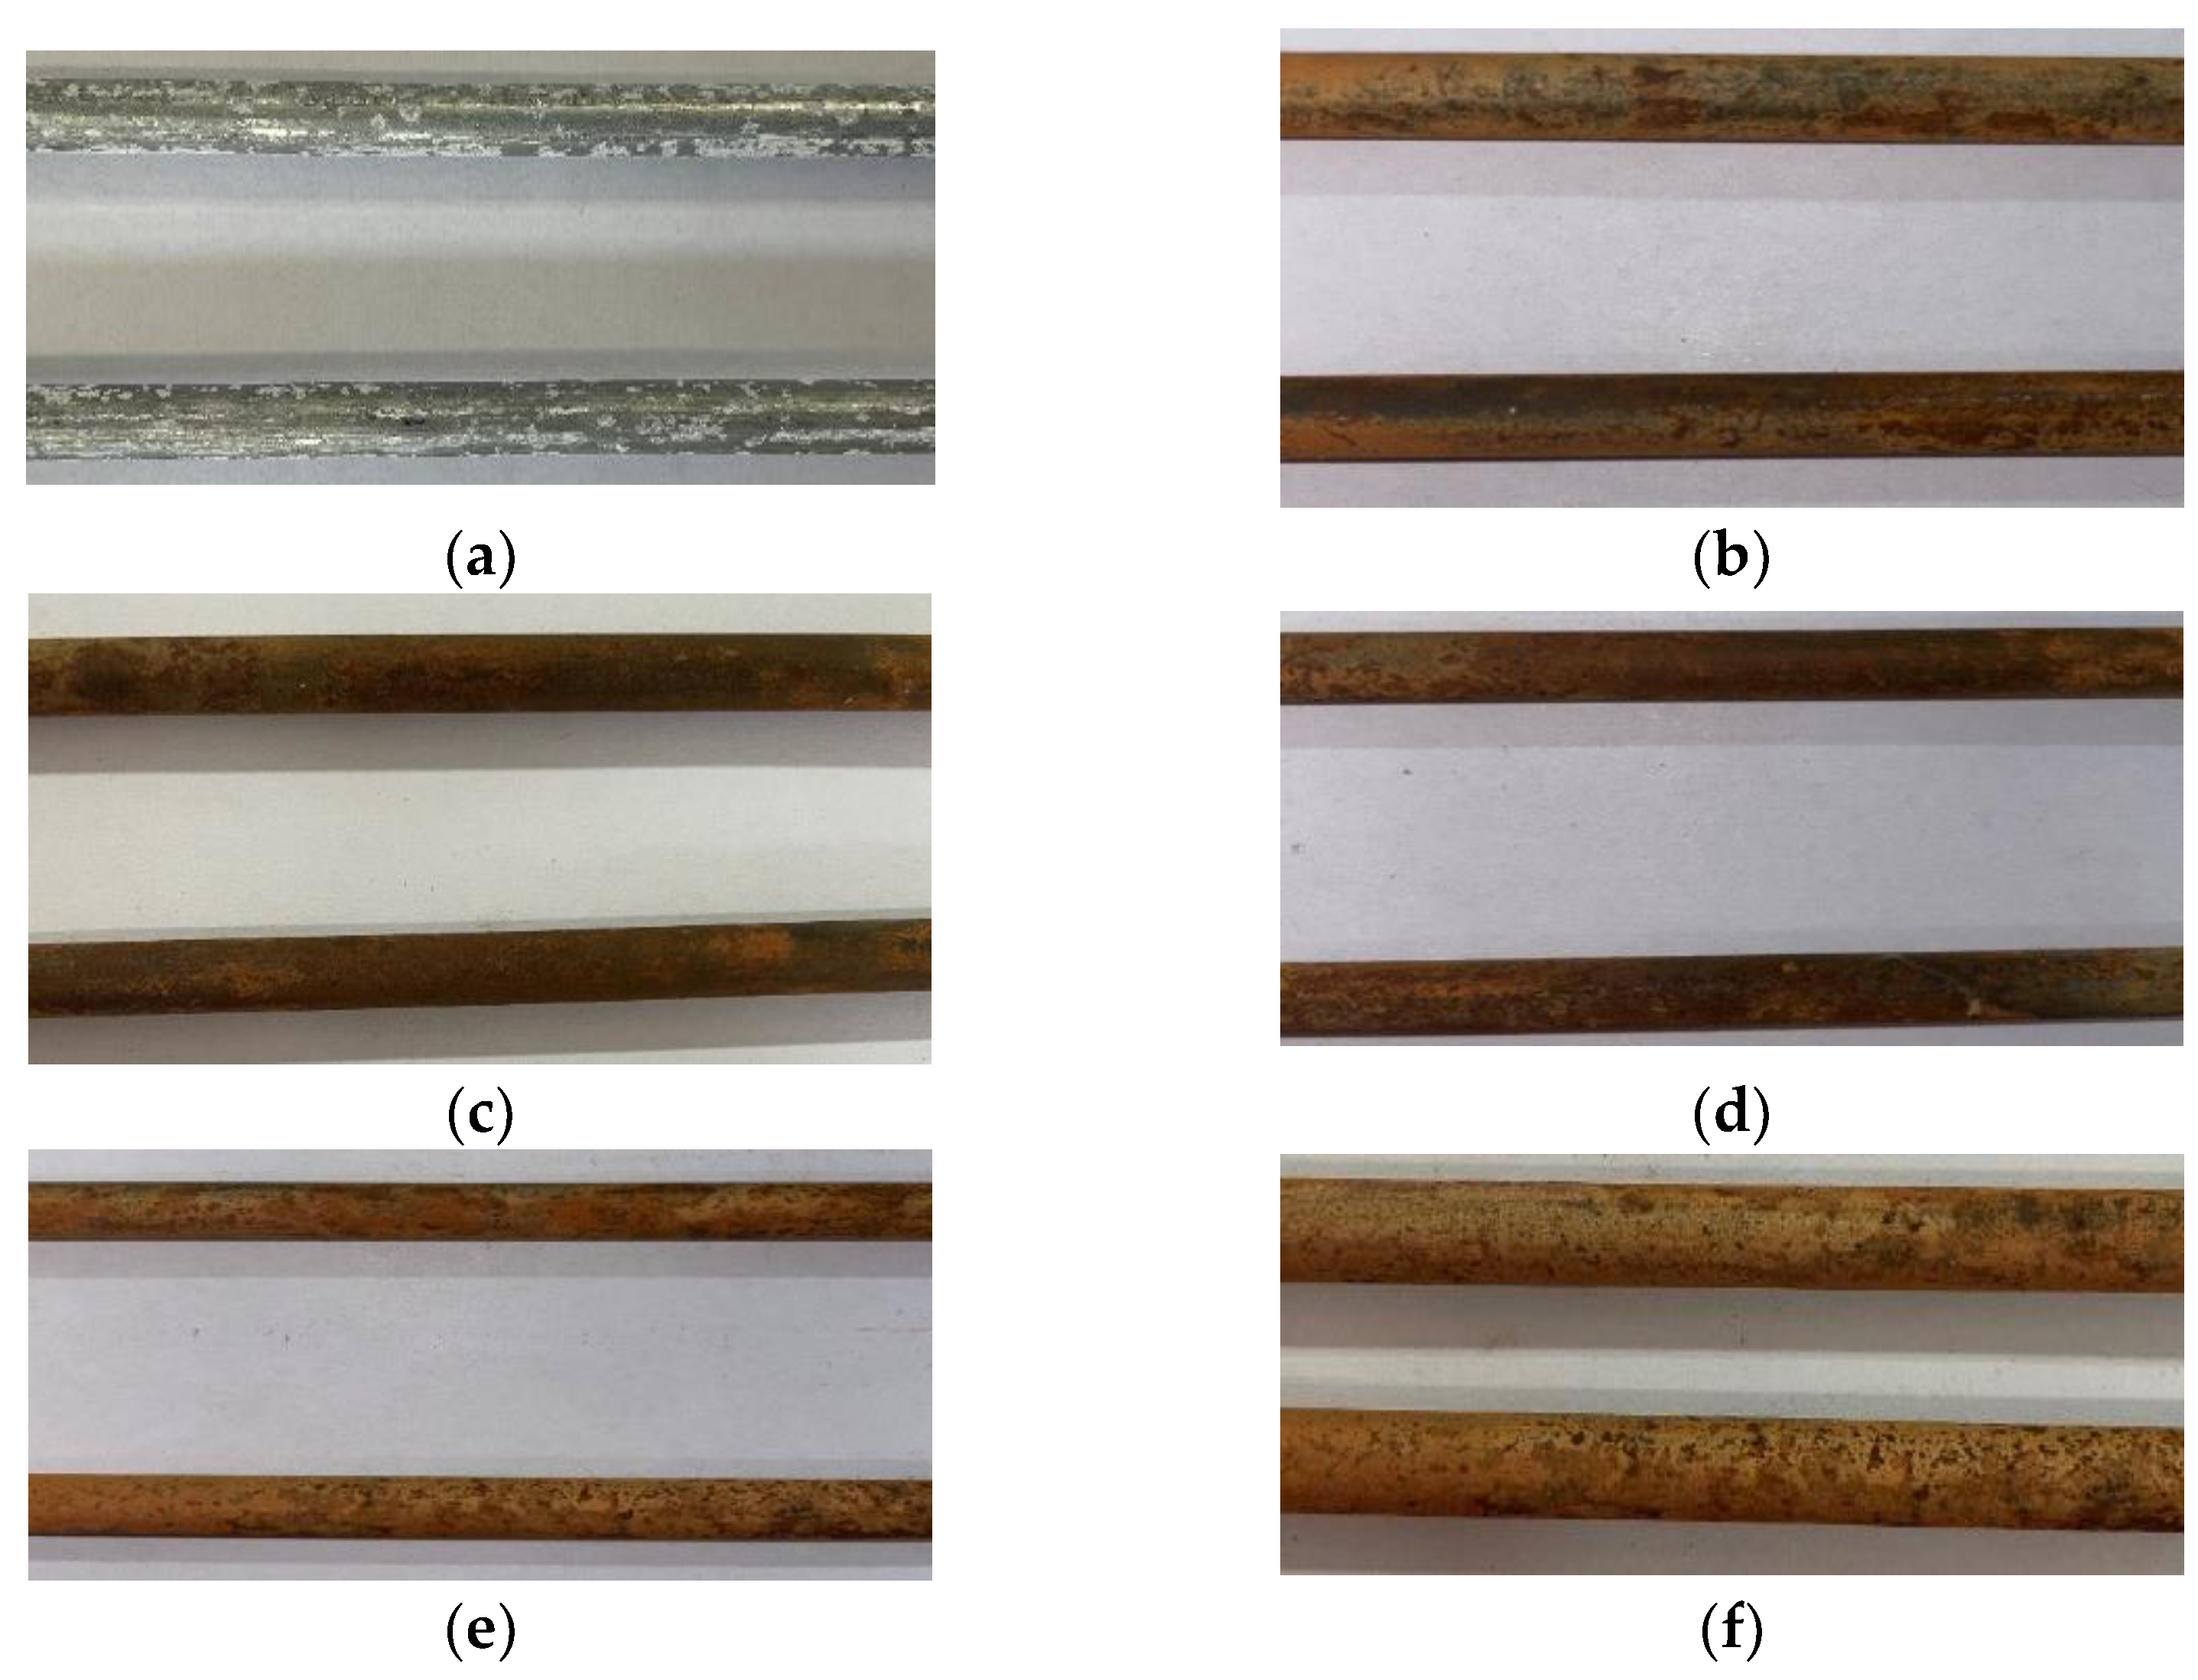
2.3. Corrosion Specimen Phenomenon and Treatment

As can be seen from Figure 7, the steel wire surface without corrosion of the matrix is covered by a complete silver galvanized layer or partially attached by zinc oxide. With the deepening of the degree of corrosion, the galvanized layer is corroded away, and the steel wire matrix gradually produces brown iron oxide [27,28].
Then, in order to control the reaction speed, the steel wire was derusted with a cleaning solution mixed with dilute hydrochloric acid and hexamethylenetetramine [29]. The corroded samples were placed in a glass container, diluted with hydrochloric acid, soaked for 5–6 min, and then cleaned. The acid-washed high-strength steel wire was placed in a Ca(OH)2 solution to neutralise the residual hydrochloric acid on the surface and then placed in clean water (not higher than 40 °C) to wash off the residual Ca(OH)2 on the high-strength steel wire. Finally, the steel wire was dried, as shown in Figure 8. The quality loss rate was used to evaluate the degree of corrosion, and the loss of weight η for each steel wire was measured as follows:
η = m 0 m 1 m 0
where m0 is the original steel wire mass, and m1 is the steel wire mass after rust removal.

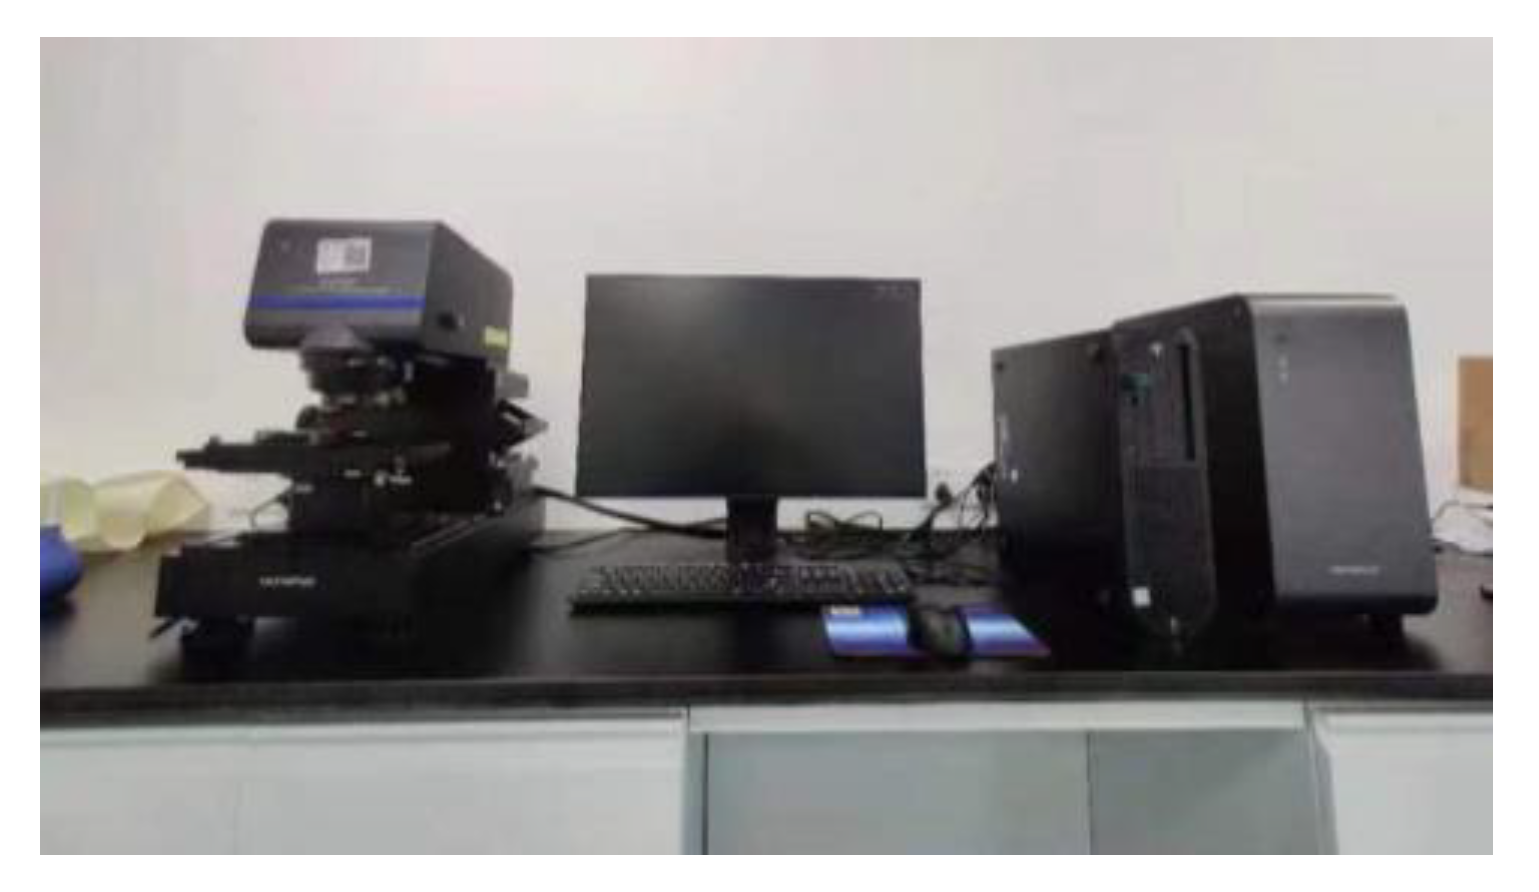
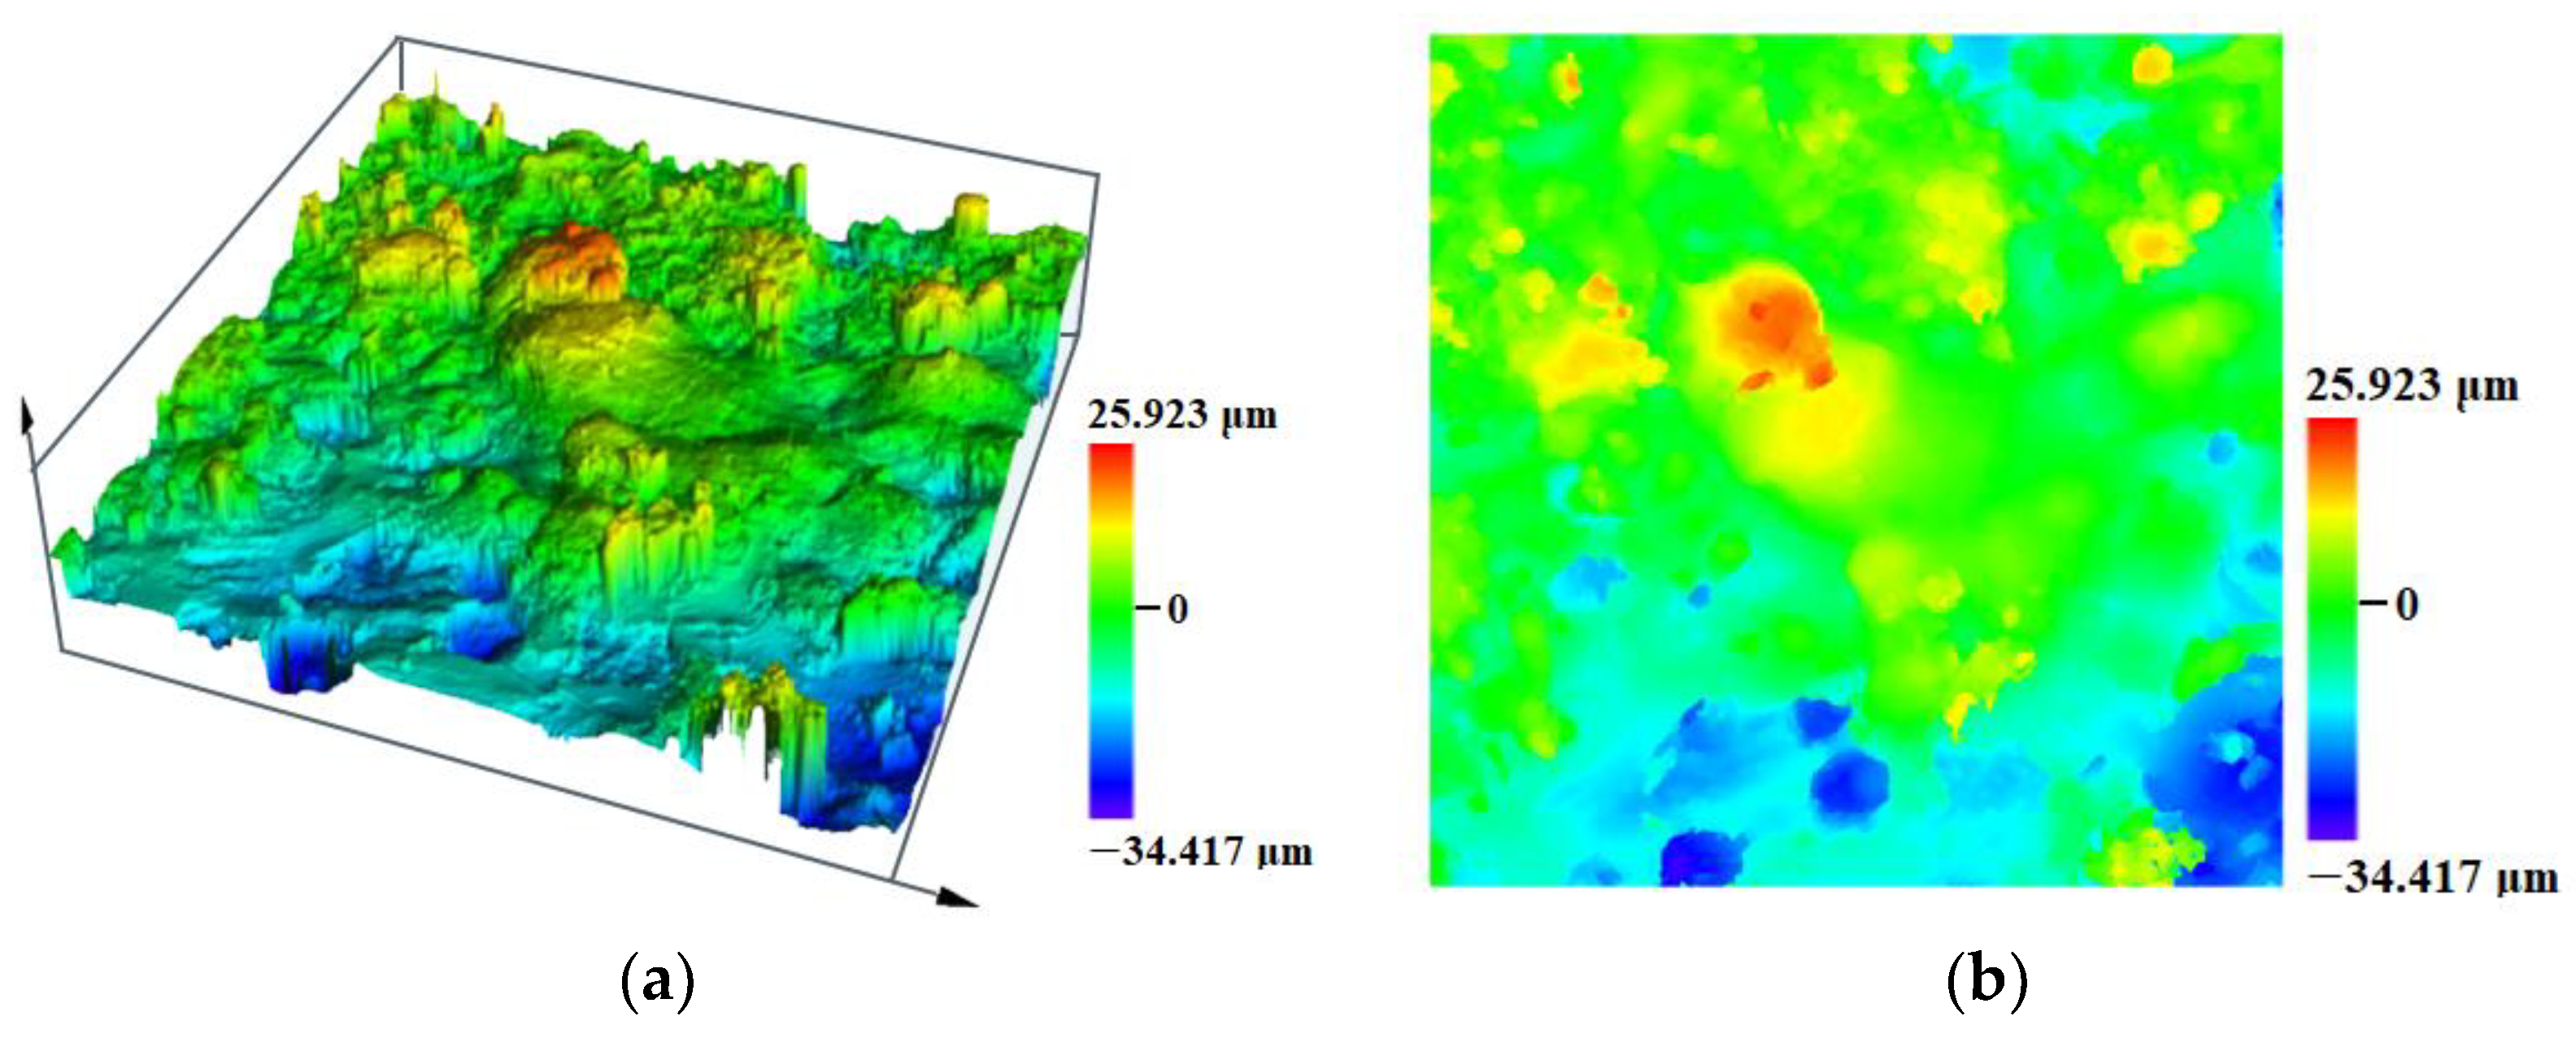
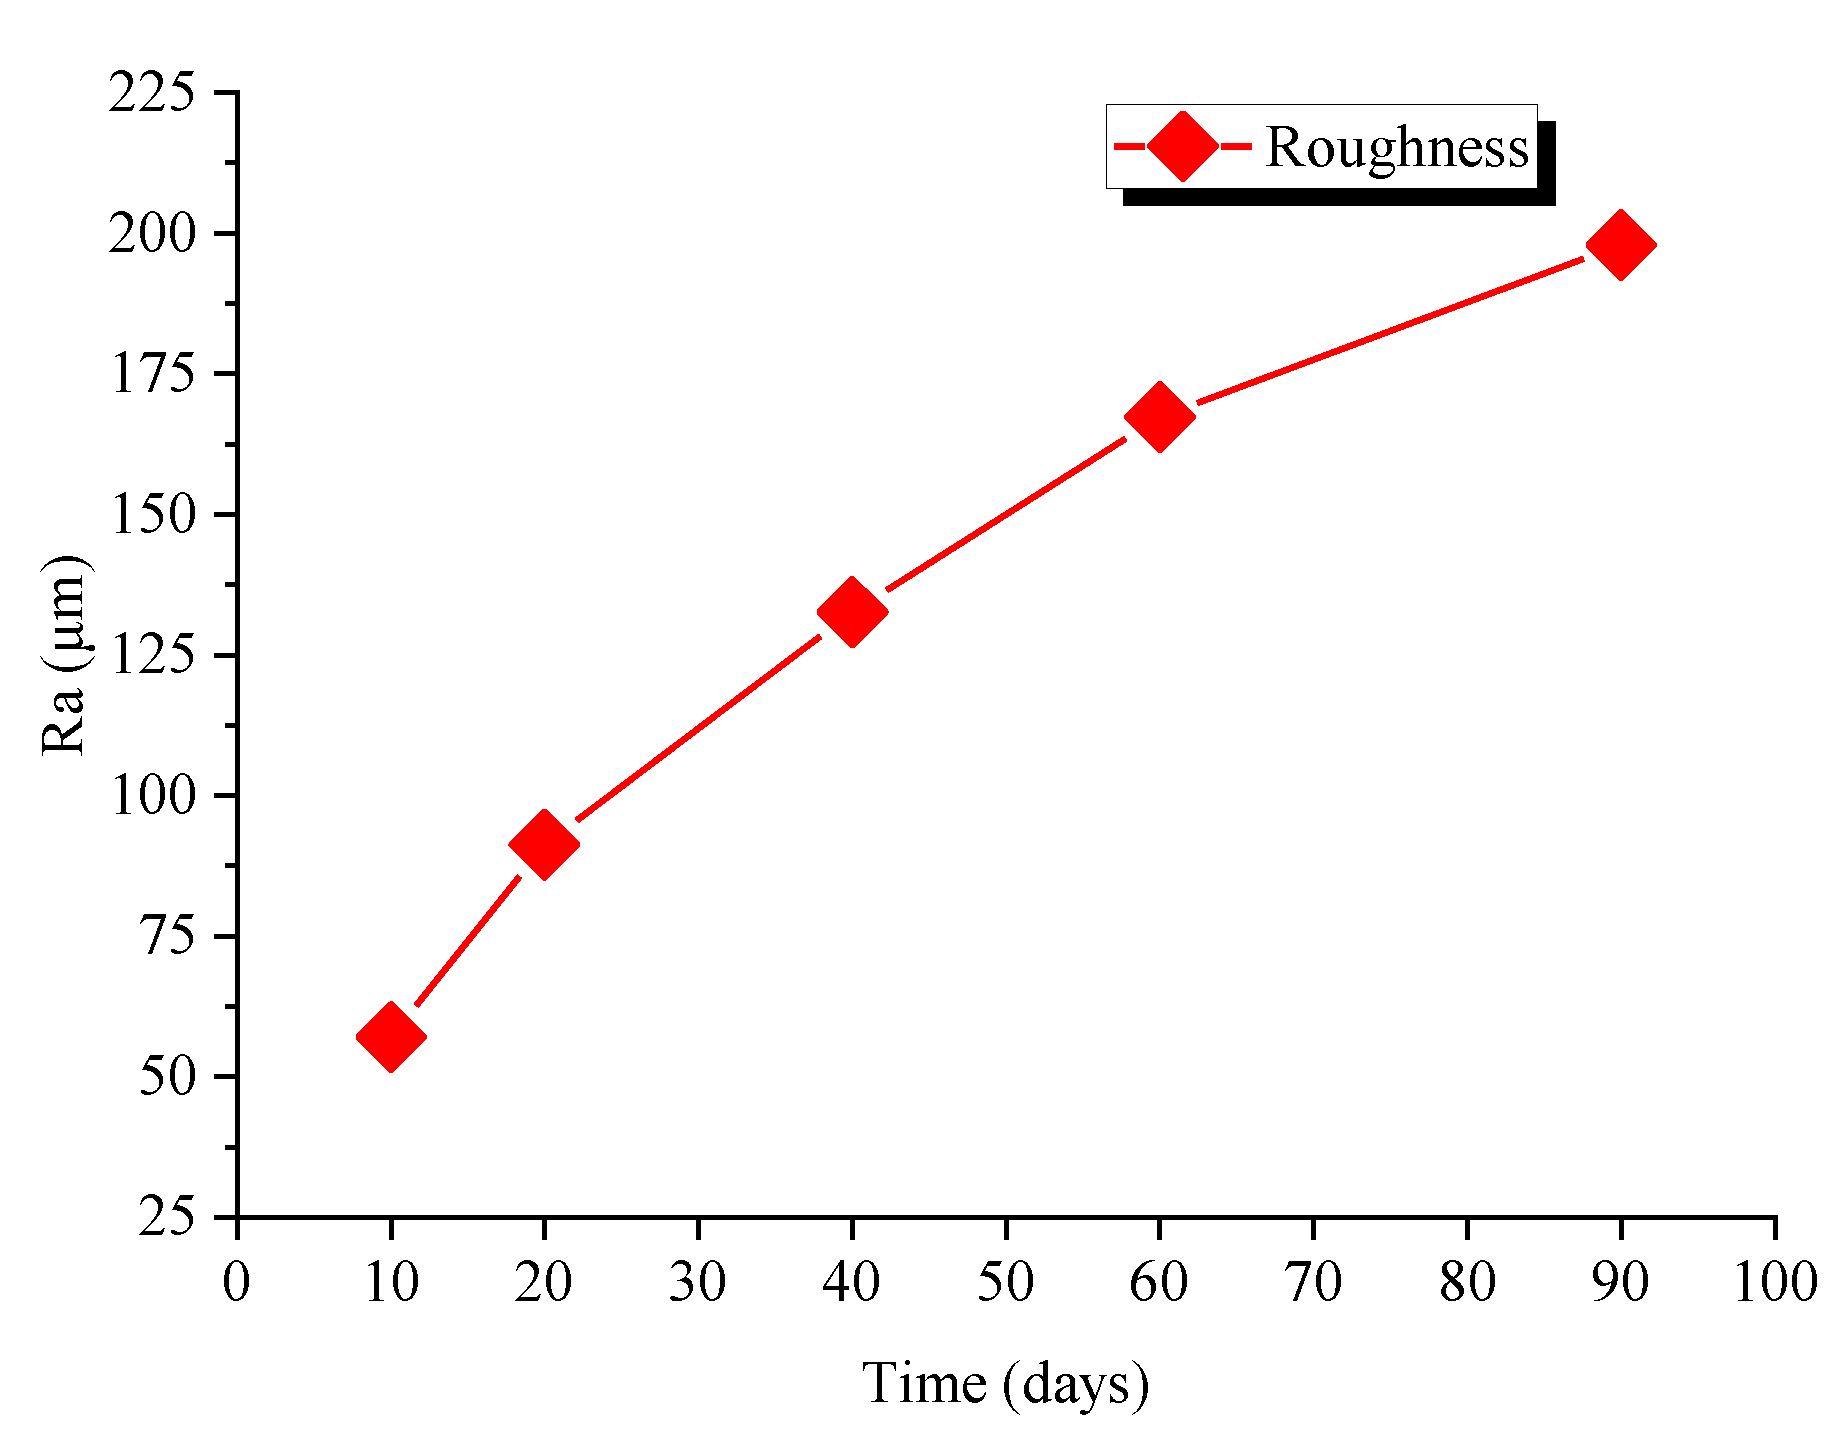
2.4. Surface Profile Measurement

In complex contour topography, Ra is often used to represent the roughness of the contour, i.e., the vertical deviation between the contour line and the mean line within the sampling length L. The mathematical expression is as follows:
R a = 1 l 0 l | y ( x ) y m | d x 1 k i = 1 k | y i y m |
where x is the coordinate of the contour length; y (x) is the contour height coordinate; ym is the average contour height; yi is the contour height of the ith measurement point, and k is the total number of measurement points.
Figure 9 shows the macroscopic appearance of the surface of the corroded steel wire; the corroded state was relatively uniform. The steel wire was scanned with a LexT OLS5100 laser microscope produced by Olympus Corporation (Olympus Corporation, Tokyo, Japan) (accuracy 0.12 μm). The equipment used in this study is shown in Figure 10. Typical surface scan results for the steel wire are shown in Figure 11. The size of a single scan block is a square with 260 μm side length. The surface conditions of the steel wire can be more intuitively visualised with 3D scanning and contour maps. Corrosion pits in areas of severe corrosion are interconnected, resulting in a loss of the cross-section area. The relationship between the specimen roughness and corrosion time is shown in Figure 12. As can be seen from Figure 12, the average roughness of the specimens gradually increases as the corrosion increases.
The effect of stress is to produce the stress intensity at the crack tip, at which the crack can expand. The corroded steel wire surface was full of holes, and some of the deeper small holes could be cracks. The corroded steel wire was polished until the surface was smooth and no hole was visible. The steel wire was then retested for fatigue loading.

3. Results and Discussion of the Fatigue Performance of Corroded Steel Wire

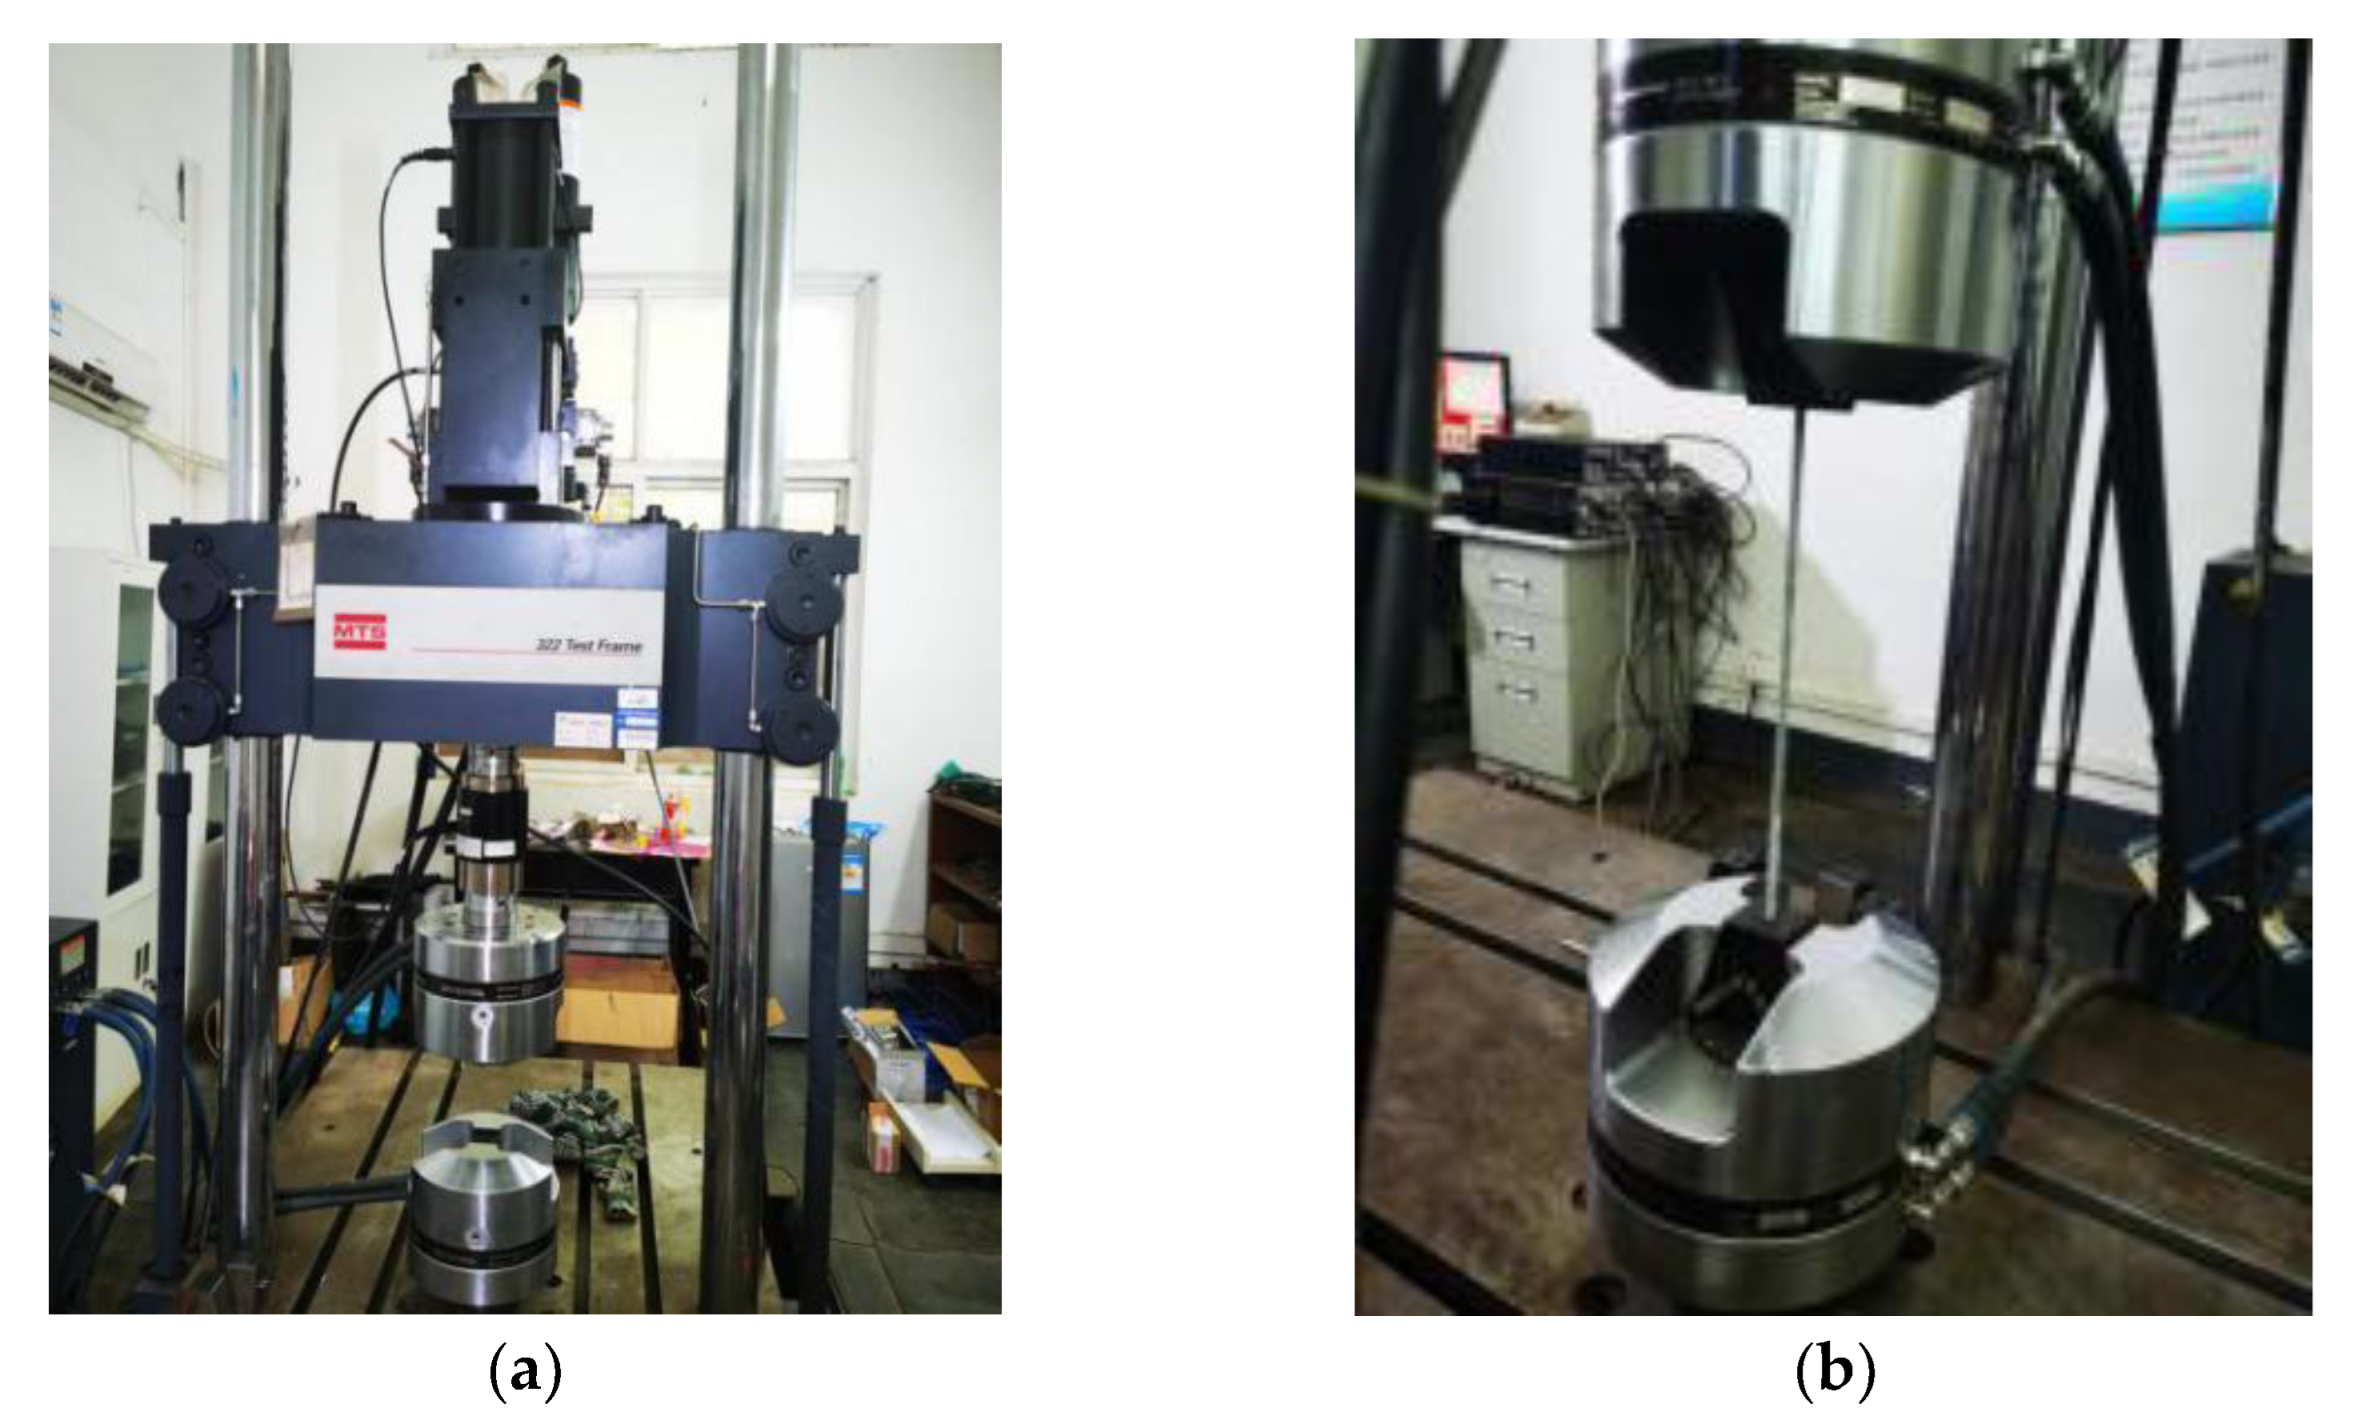
3.1. Test Equipment and Scheme

An MTS330 fatigue testing (MTS System Corporation, Eden Prairie, MN, US) was used for the test, as shown in Figure 13. The test wire was attached to the test machine using custom fixture equipment with a loading frequency of approximately 25 Hz. According to the regulations for “ot-dip galvanised steel wire for bridge cables” [30], the amplitude of the fatigue stress is 360 MPa; the maximum stress is set at 0.45 times the nominal ultimate tension of the steel wire, namely, the maximum stress is 756 MPa. The calculated stress ratio is 0.52. In this experiment, the rest stress amplitude is 270, 450, 540, and 630 MPa. The value of stress ratio is consistent with that of 360 MPa.

3.2. Loading Conditions and Fatigue Life Test Results

After the fatigue failure of the steel wire, it was found that the cross-section of the steel wire was clean, and there was no necking phenomenon, which is the standard fatigue failure and brittle failure. The results of the fatigue tests for the suspender steel wires with different degrees of corrosion under different stress amplitudes are shown in Appendix A in Table A1. The fracture positions are not the clamping positions of the steel wires, and the experimental data are valid.

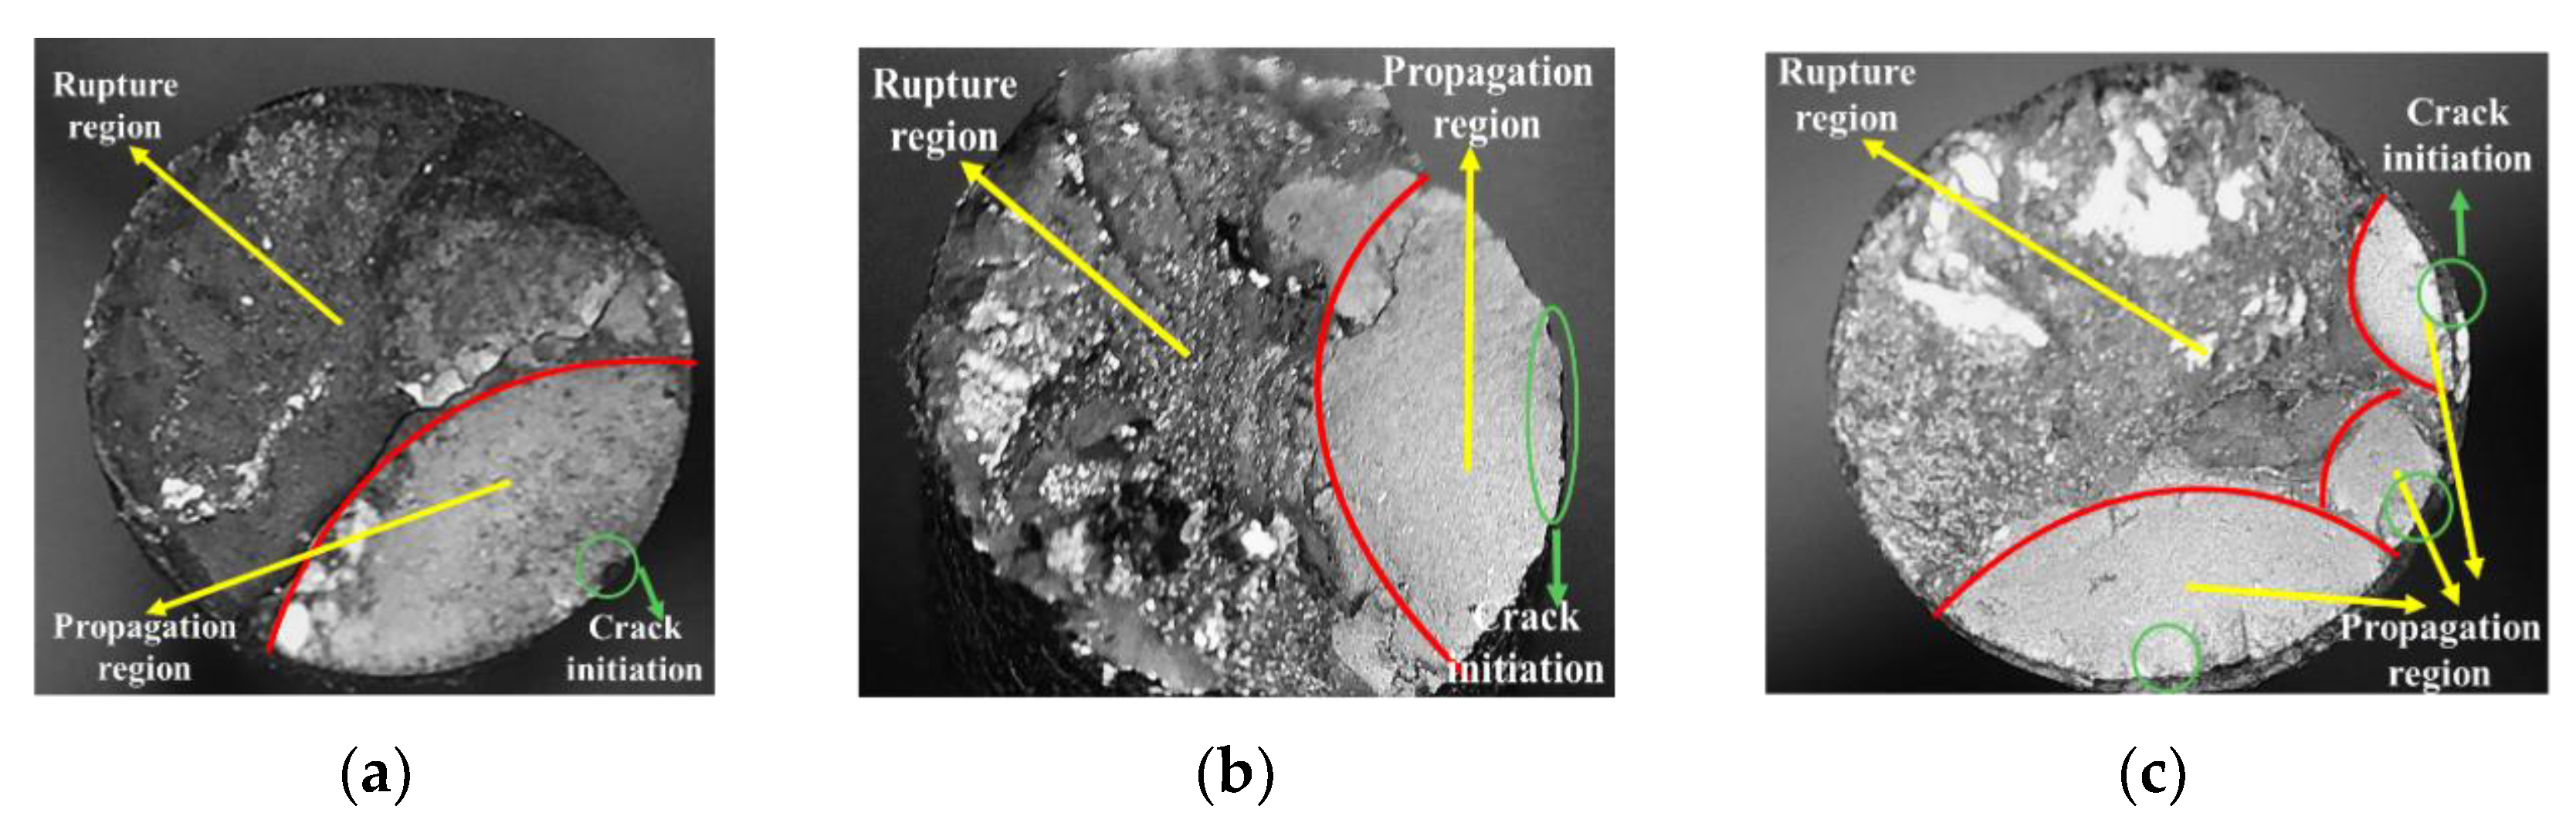
3.3. Fatigue Port Morphology Analysis

Figure 14 shows three typical fracture characteristics of steel wire corroded for 10 days, 40 days and 90 days at a stress amplitude of 360 MPa, which correspond to mild, moderate and severe corrosion states of steel wire matrix. In general, the fracture morphology of all corroded wires is basically similar and consists of a smooth and flat fatigue propagation zone and a transient fracture with rough surface and steps. No shell lines were found in the fatigue propagation zone, indicating that the steel wire rapidly developed to fracture once the macroscopic fatigue cracks occurred below the experimental stress amplitude. This is because the high-strength steel wire has strong resistance to crack initiation and weak resistance to crack propagation.
A comparison of the fracture shapes of the three types of steel wire showed that the fracture of the steel wire of type Ⅰ maintained a regular arc shape, whereas the fracture of the type Ⅱ steel wire had a distinct concave-convex tooth shape. A comparison of the typical fracture morphology of the type III steel wire with that of other steel wires showed that the steel wire contained three fatigue propagation plateaus, i.e., fatigue cracks originating from multiple sources. This results in faster fatigue crack growth and lower fatigue life than other wires for the same corrosion life.
The pitting corrosion of type I fractures does not change the geometry of the steel wire surface and is a microscopic defect. This indicates that the surface of the steel wire can form microcracks, even under mild corrosion. Under the action of fatigue load, a stress concentration is formed at the site of the micro-crack in the steel wire, which promotes the formation and development of fatigue cracks in this area, promotes the accumulation of fatigue damage, and eventually leads to fatigue failure. From the microscopic mechanism of fatigue crack initiation, the microcracks caused by corrosion are equivalent to the defects caused by the penetration and extrusion of a steel wire with intact surface under repeated cyclic loading, thus shortening the fatigue crack life.
In addition, the appearance of the corroded steel wire with the same corrosion days was similar, but the fatigue life span was longer with a certain jump. For example, steel wire corroded for 20 d has a life span of 581,724–483,217 times at a stress range of 450 MPa, and the fatigue life span is reduced by 17%. This indicates that the effect of corrosion on the fatigue life of steel wire is likely to be a jump; i.e., there is a defect failure threshold. If the defects caused by corrosion on steel wire do not reach this threshold, the expected fatigue life will basically remain unchanged. If the defect exceeds this threshold, the fatigue life is significantly reduced.
For steel wires with more severe corrosion, the distribution area of the pits is larger at the fatigue source location, which obviously changes the geometric shape of the steel wire substrate from a macroscopic point of view and creates a non-uniform fracture edge. Rust not only increases the surface roughness of the steel wire but also leads to the development of fatigue cracks and obviously reduces the stress area of the steel wire.

3.4. Corrosion Effects on Fatigue Life of Steel Wire

As shown in Figure 15, there is an obvious two-stage relationship between stress amplitude and fatigue life of steel wires with different degrees of corrosion. When ΔS ≤ 360 MPa, the decrease of stress amplitude ΔS leads to the obvious increase of steel wire fatigue life. When ΔS > 360 MPa, with the decrease of stress amplitude ΔS, the increasing trend of fatigue life of steel wire is obviously smaller than that of the interval with ΔS ≤ 360. Under the same stress amplitude, when ΔS ≤ 360 MPa, the decrease rate of steel wire fatigue life with increasing corrosion degree is more drastic than that of ΔS > 360 MPa. It can be seen that the lower the stress amplitude is, the more sensitive the steel wire life is to corrosion.
The fatigue life of each corroded steel wire after grinding is shown in the Appendix A in Table A1. At a stress range of 360 MPa, the fatigue limit of the polished steel wire increased by nearly 30%. The higher the degree of corrosion, the greater the possibility of irregular pits. The edge of the pit mouth is susceptible to stress concentration, which is a fracture source. Under the action of an external load, the crack automatically expands, and if the profit loading time is sufficiently long, this leads to complete failure. Mechanical grinding eliminates the pits and cracks caused by corrosion, eliminates the fracture sources to a certain extent, and improves the corresponding fatigue life.
In the logarithmic coordinate system, the relationship between fatigue life N and stress amplitude ΔS is usually linear, as shown in Equation (3); m and Z are material constants, and ln denotes natural logarithm. The S-N curve equations for the different rusting days are given in Table 2.
m ln Δ S + ln N = ln Z
It is easy to calculate the mean value of the experimental data and perform linear fitting; but this is obviously not rigorous enough. The fatigue life test data of the samples showed some randomness. The degree of corrosion and fatigue stress amplitude were used as independent input variables of the three-parameter Weibull model S-N-η. For the determined survival probability, the p-S-N curve can be expressed by Equation (4):
m ln Δ S p + ln N p = ln A p
It is assumed that under the specified stress amplitude ΔS, the cumulative distribution function (CDF) of the fatigue life N is a two-parameter Weibull distribution, and its expression is
F ( N ; Δ S ) = 1 exp [ ( N δ ( Δ S ) ) β ]
where β is the shape parameter of the Weibull distribution, and δ(ΔS) is a characteristic parameter that is a function of the specified stress range ΔS. Taking the logarithms of both sides of Equation (4), we obtain:
ln N = 1 β ln [ ln ( 1 F ( N ; Δ S ) ) ] + ln ( δ ( Δ S ) )
Comparison with Equations (4) and (7) under the specified stress range ΔS and identical survival probability p, one of the reasonable expressions of δS) is
δ ( Δ S ) = K Δ S m
Equation (7) is a function of the mass-loss rate η. Therefore, parameter K can be written as
K = A exp ( B η )
Parameter m is the slope of the S-N curve. The slope of the S-N curve reflects the influence of the stress amplitude on the fatigue life under different corrosion degrees. The slope m of S-N curve can be written as
m = C + D η
The cumulative function of the fatigue life probability of steel wire considering corrosion can be expressed as
F ( N ; Δ S , η ) = 1 exp [ ( Δ S C + D η N A exp ( B η ) ) β ]
f ( N ; Δ S , η ) = β ( Δ S C + D η N A exp ( B η ) ) β N β 1 exp [ ( Δ S C + D η N A exp ( B η ) ) β ]
where N is the fatigue life, ΔS is the nominal stress range obtained from the nominal cross-sectional area before corrosion, and η is the corrosion degree, which is quantified on the basis of weight loss. A, B, C, D, and β are unknown parameters, which can be estimated using the test data of all specimens; β is the shape parameter of the proposed Weibull model.
R = Δ S C + D η N exp ( B η )
A possible normalised variable R can be defined to evaluate the goodness of fit of the model parameters [31,32]. The cumulative distribution function of the normalised variable R can be viewed as a standard two-parameter Weibull distribution, where β is the shape parameter, and A is the characteristic parameter. The Weibull diagram of the normalised variable R can intuitively reflect the proposed model since fatigue samples with different stress ranges and corrosion degrees were pooled and normalised.
Based on the experimental data, the Weibull distribution of the normalised variable R of the two-stage corroded steel wire is shown in Figure 16, in which the estimated value of the two-stage parameters is 360 MPa as the limit. According to the estimated parameters, the sample of normalised variable, R, shows a significant linear trend. At 5% significance level, the standard Weibull distribution of the normalised variable R can pass the Kolmogorov–Smirnov test at the significance level of 5%. The proposed S-N-η Weibull model fits well with the fatigue data of the corroded steel wire.
The S-N curves of the corroded steel wires at different degrees of corrosion are shown in Figure 17, and the survival probabilities are 98% and 50%, respectively. As the corrosion degree increases, the slope of the S-N curve becomes steeper. In the lower stress range, the fatigue life of the steel wire decreases faster. With an increase in the stress range, the fatigue life and corrosion degree curves tended to be smoother. In the lower-stress range, the fatigue life decreased rapidly. The presence of corrosion exacerbates the decrease in the fatigue life of steel wires at lower stress ranges, indicating that the fatigue life of steel wires in lower stress ranges is more sensitive to corrosion.
The fatigue life and corrosion degree of steel wires with different survival probabilities under different stress ranges are shown in Figure 18. Combined with the measured experimental data, the fatigue data are scattered on the corresponding median curve, with most data points between 10% and 90% survival probability.

4. Conclusions

In this study, corrosion and fatigue tests were performed on an eleven-year service suspender steel wire, and an appearance test was carried out on the samples. The parameters of the fatigue life model, which is based on the Weibull distribution, were obtained from the fatigue life data of the steel wire samples. The conclusions drawn from this study are as follows.
  • Corrosion has a significant effect on the surface morphology of steel wire. As the corrosion degree increased, the roughness Ra of the steel wire showed an increasing trend, and the corrosion degree increased. The corrosion pits close to each other become larger, resulting in an increase in the width of the connected corrosion pits.
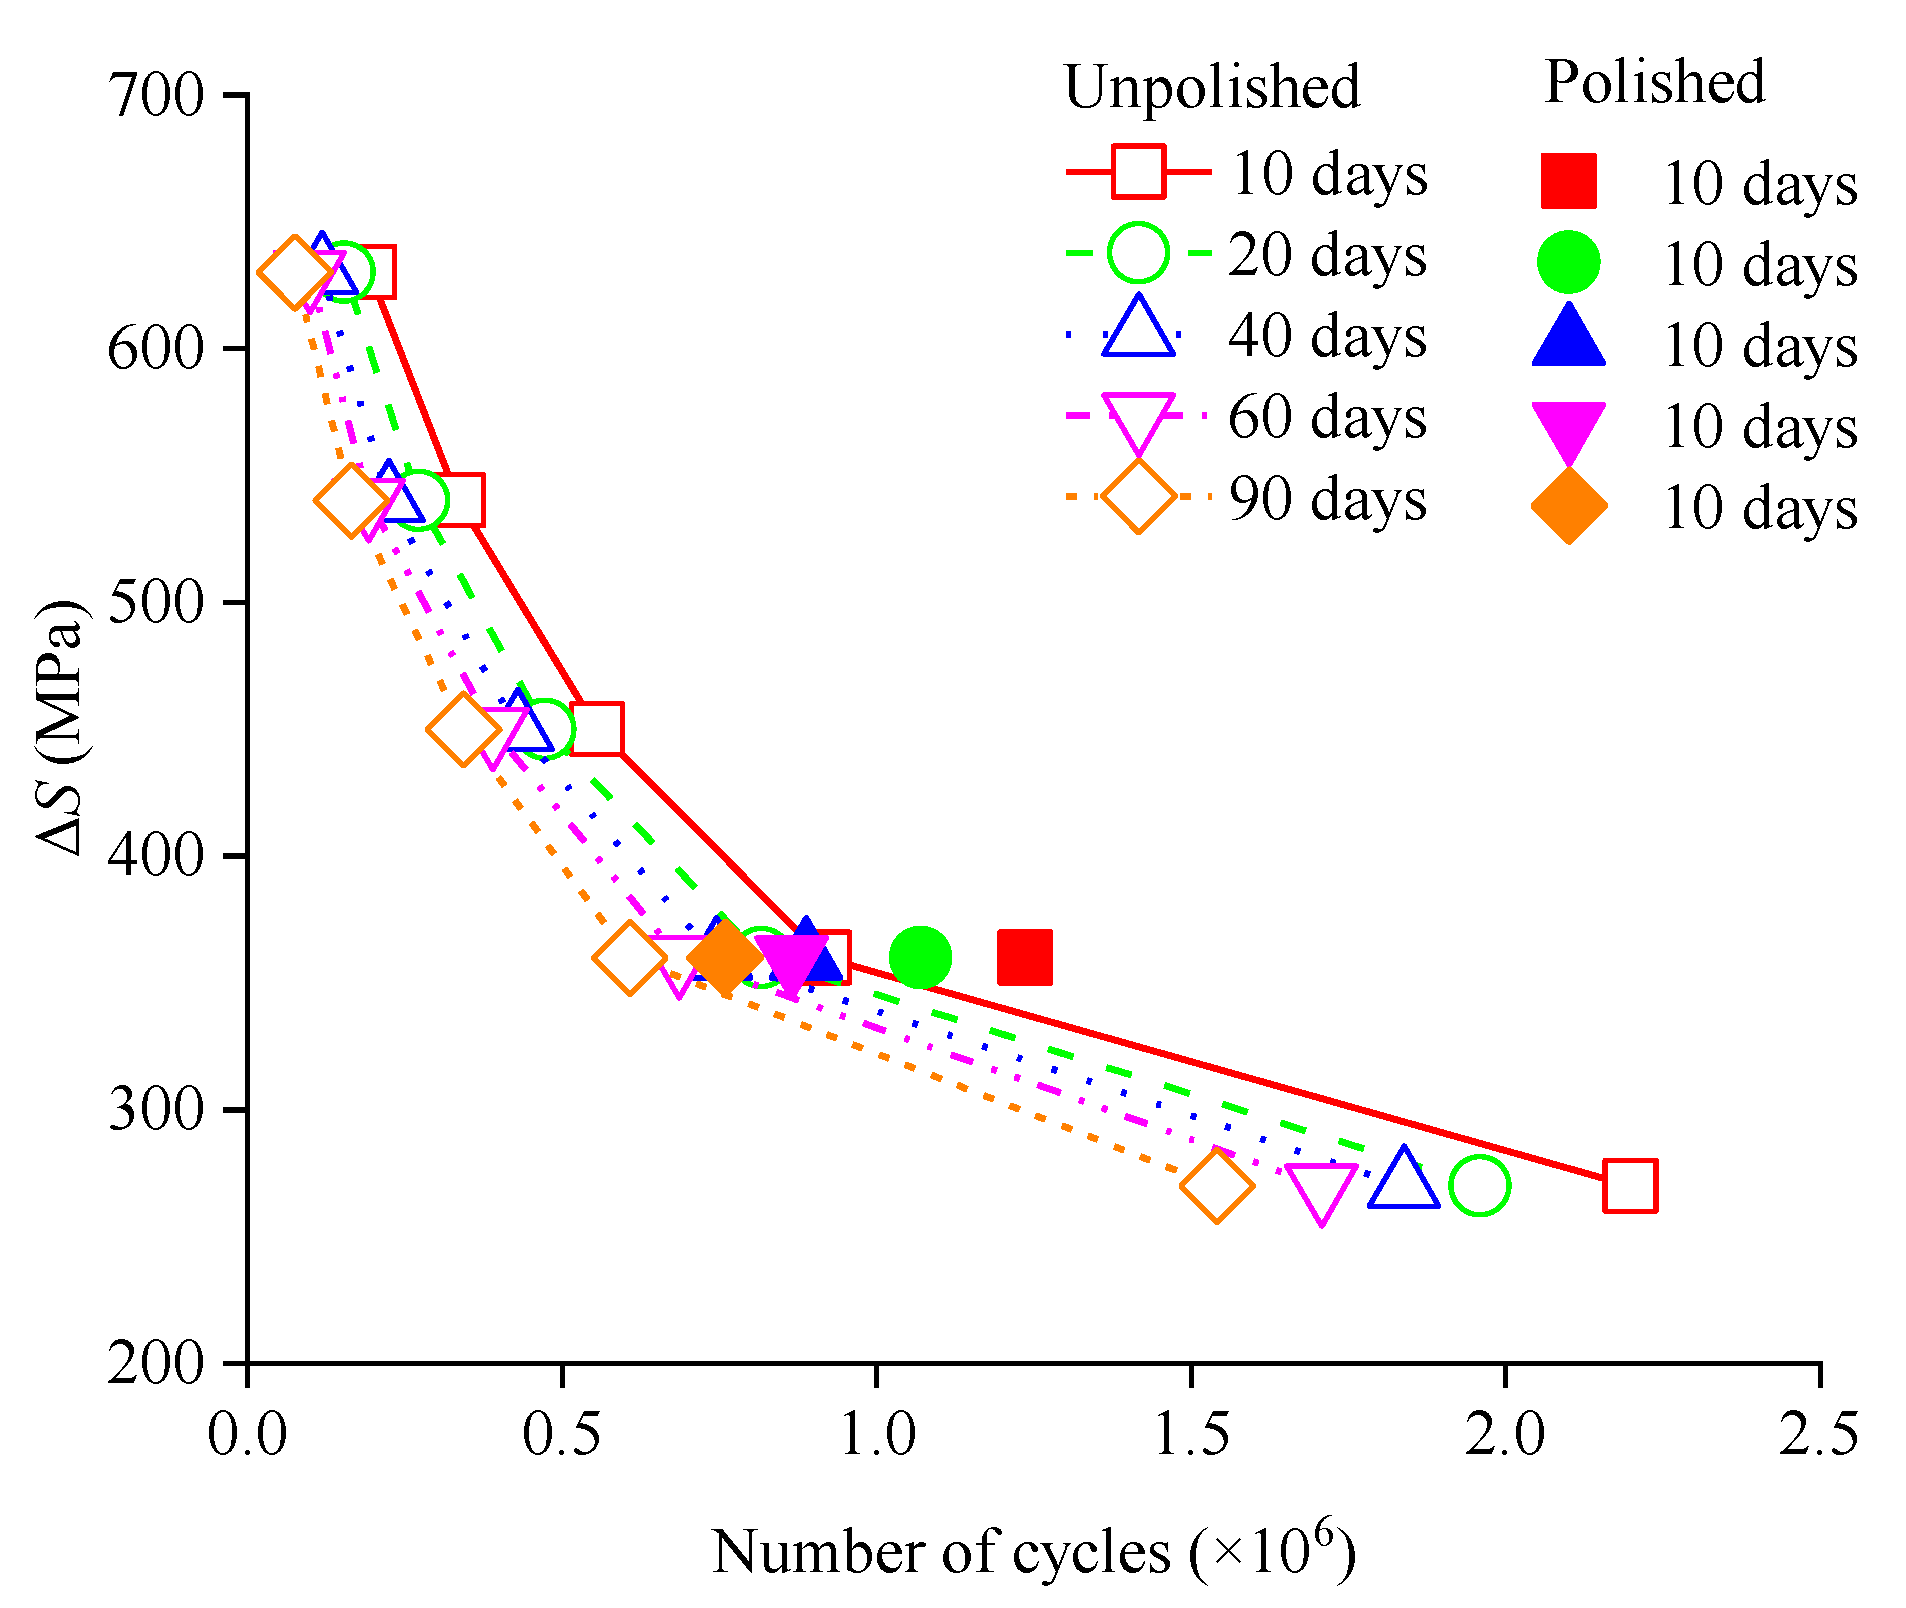
  • Environmental erosion forms microscopic cracks on the surface of the steel wire, owing to the environmental erosion that leads to crack propagation, thus resulting in practical failure under the action of stress. The fatigue life of the corroded steel wire which was polished and cleaned using mechanical grinding improved by about 30% in a stress range of 360 MPa.
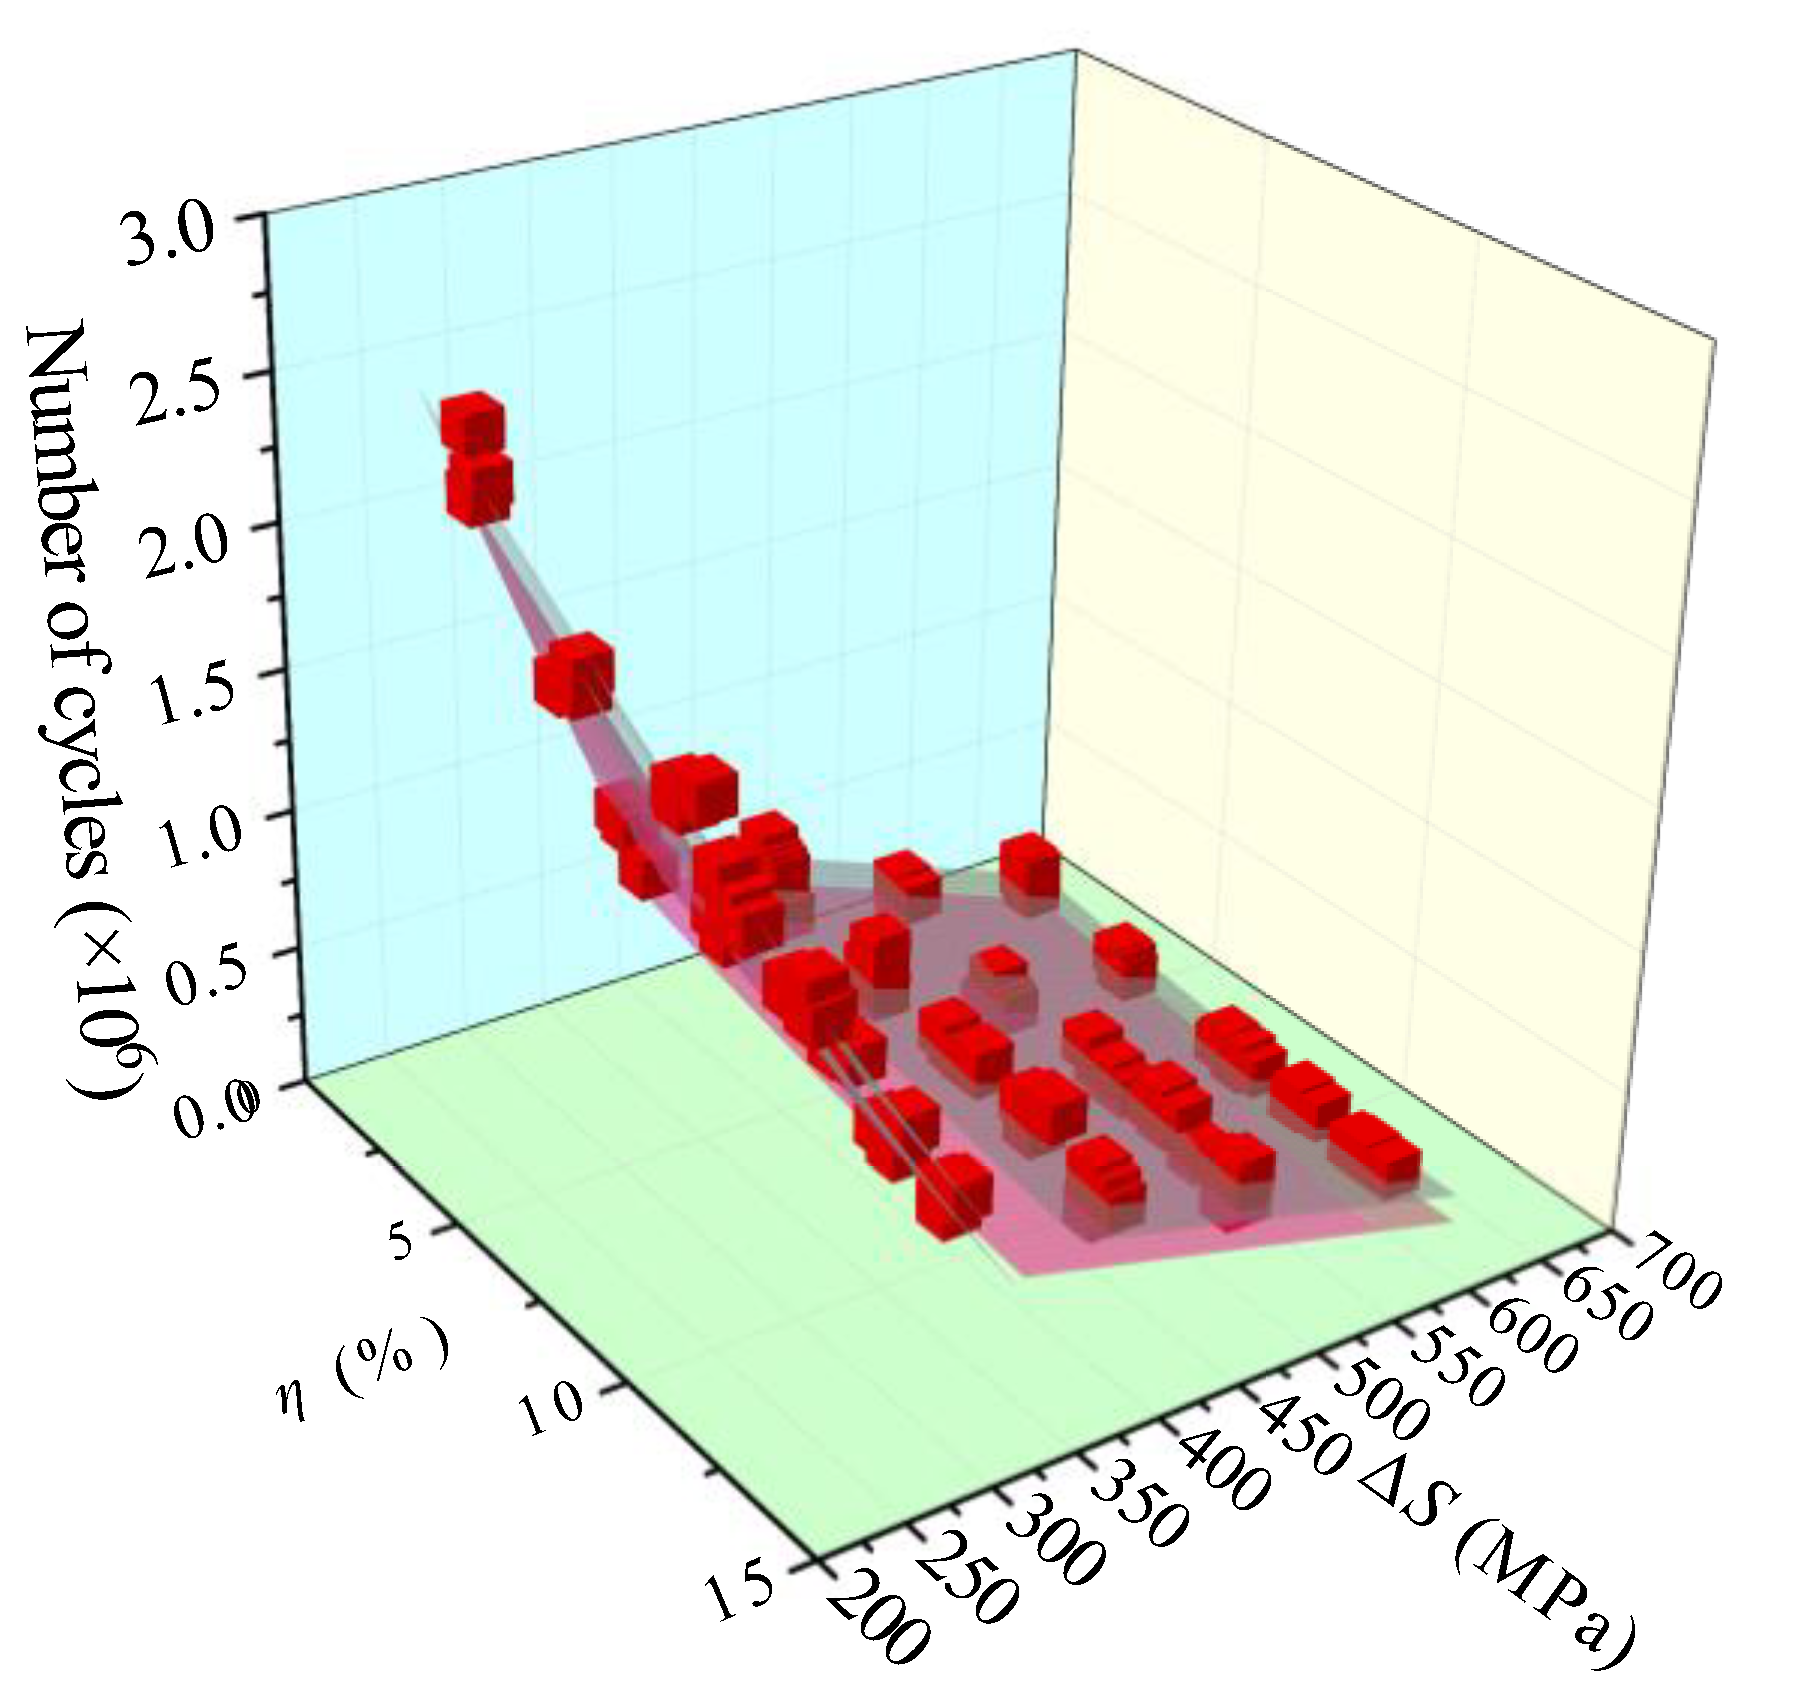
  • According to the measured data, the stress-life-corrosion scatter diagram exhibits a two-stage shape. When ΔS > 360 MPa, the fatigue life of steel wire increases at a similar rate with stress reduction. When ΔS ≤ 360 MPa, the fatigue life of steel wire increases more consumingly with the decrease of stress. With the decrease of stress, corrosion has more and more a significant effect on the life of corroded steel wire.
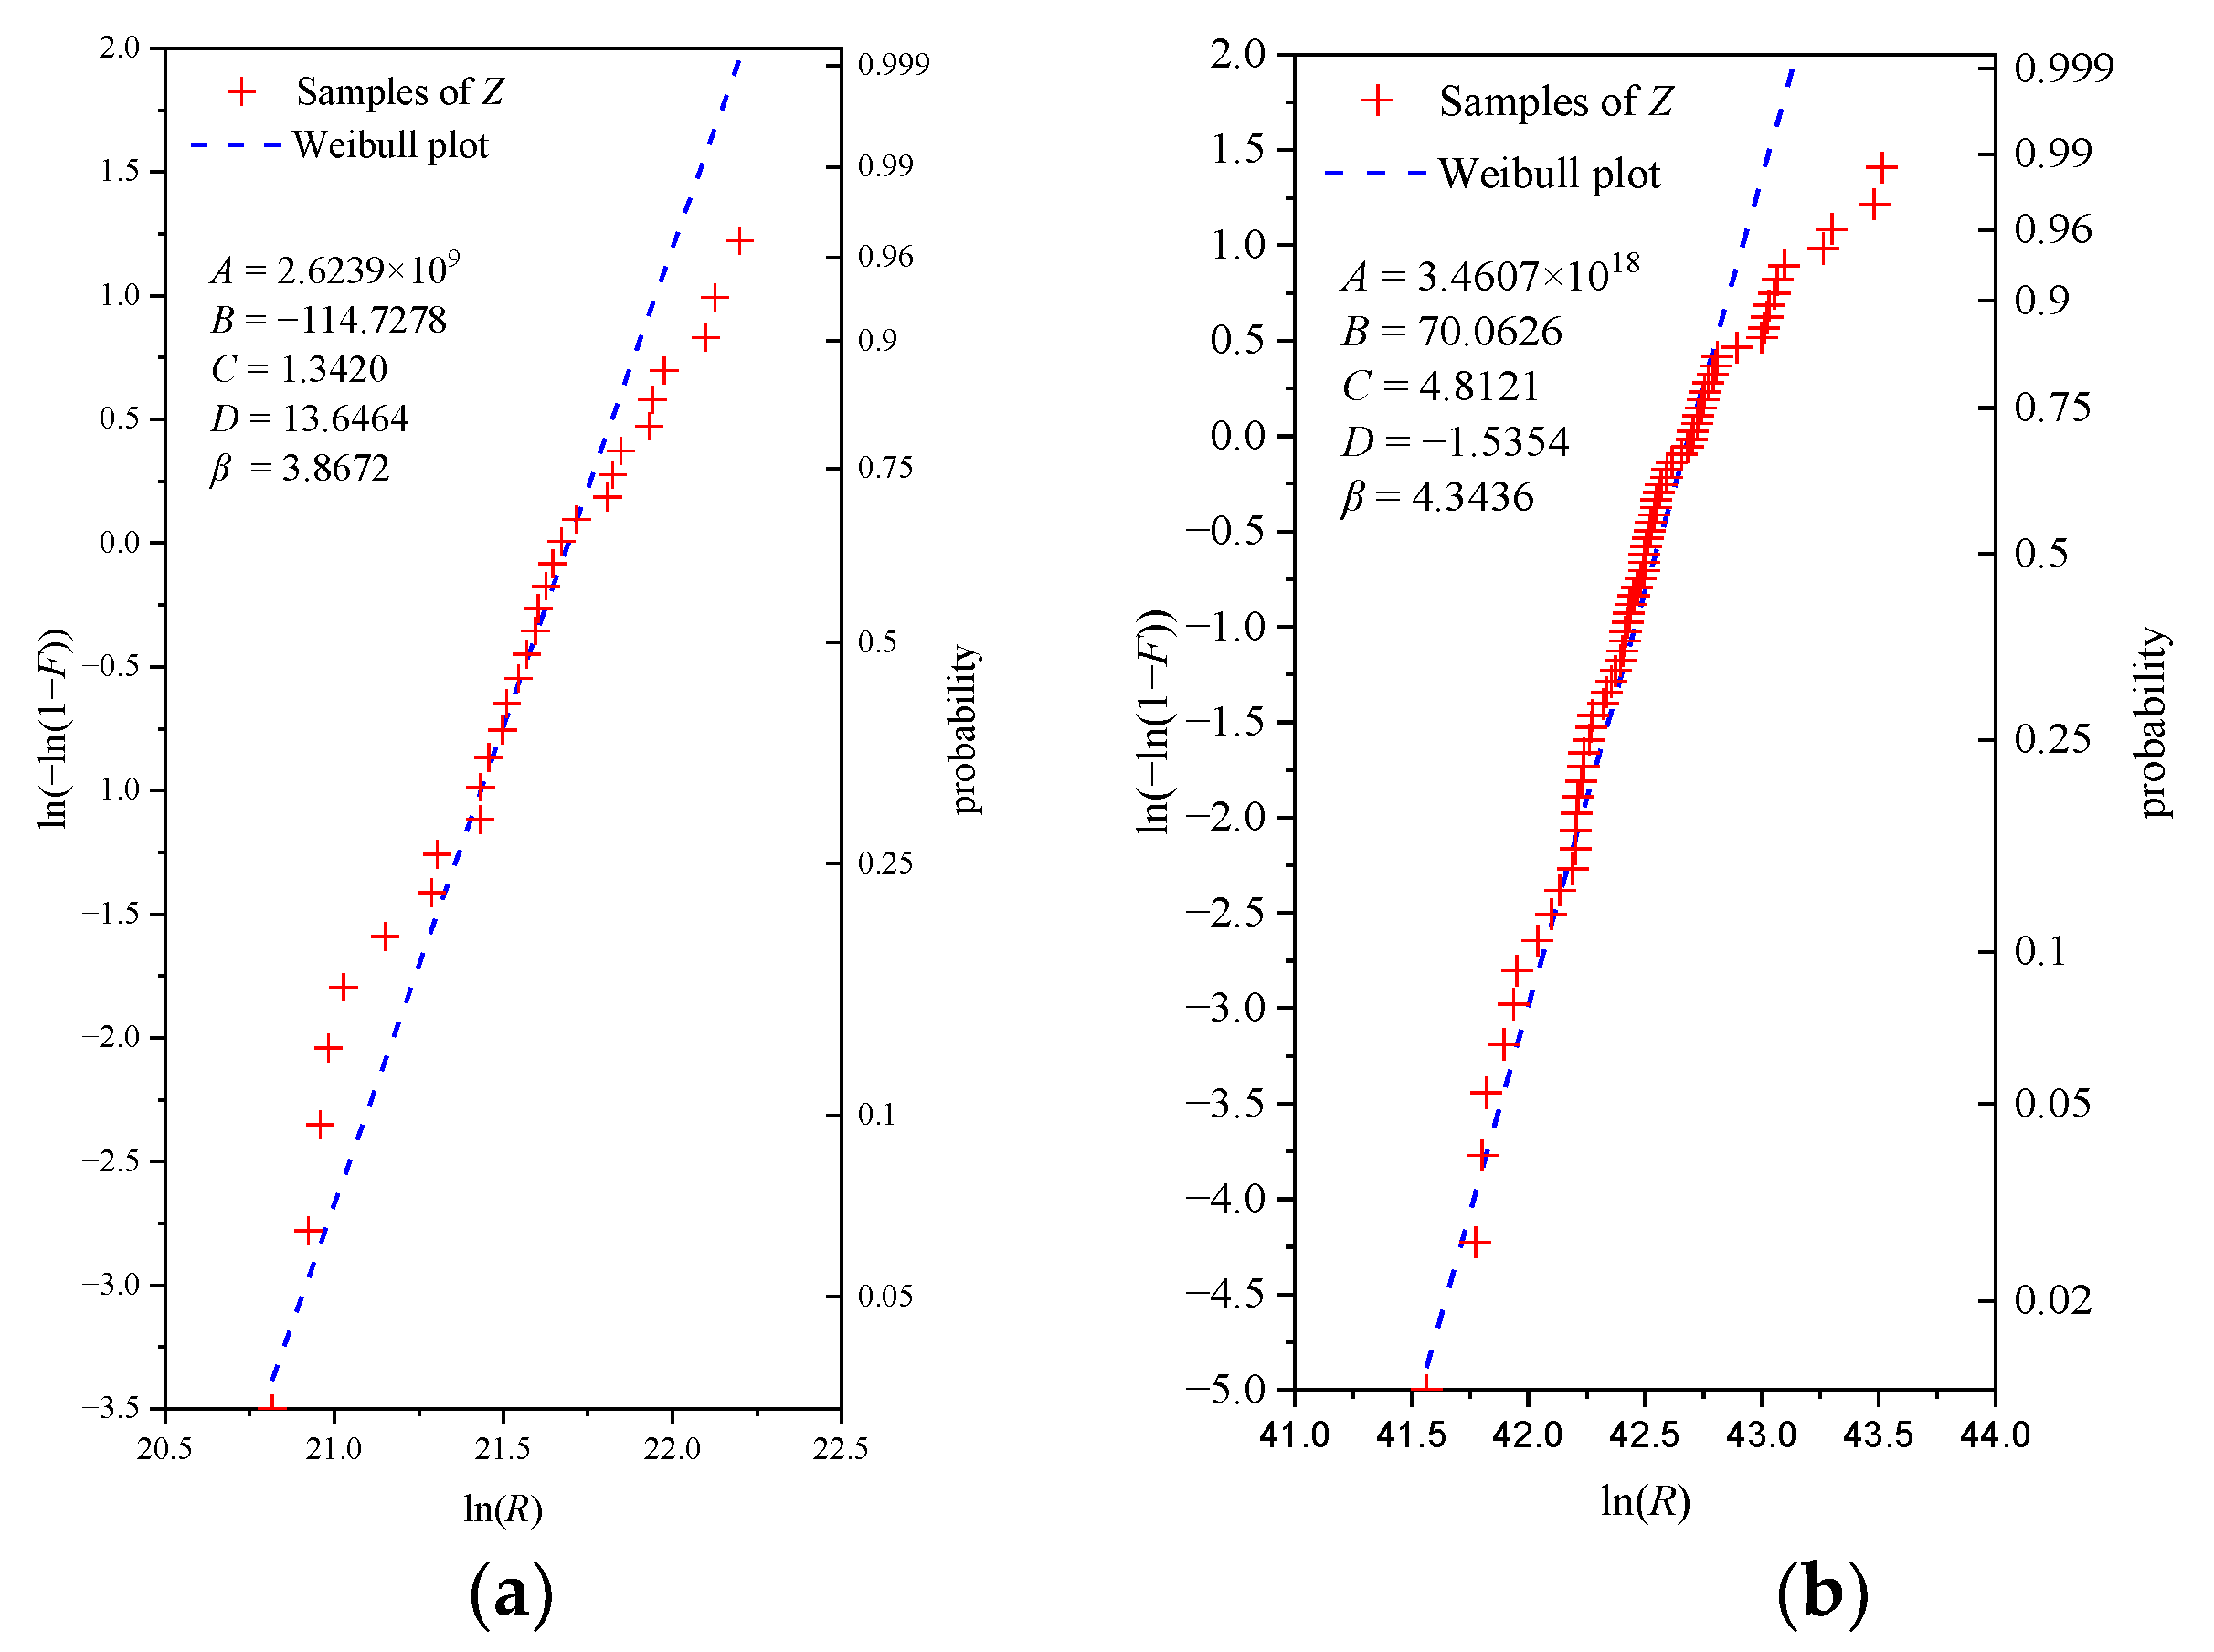
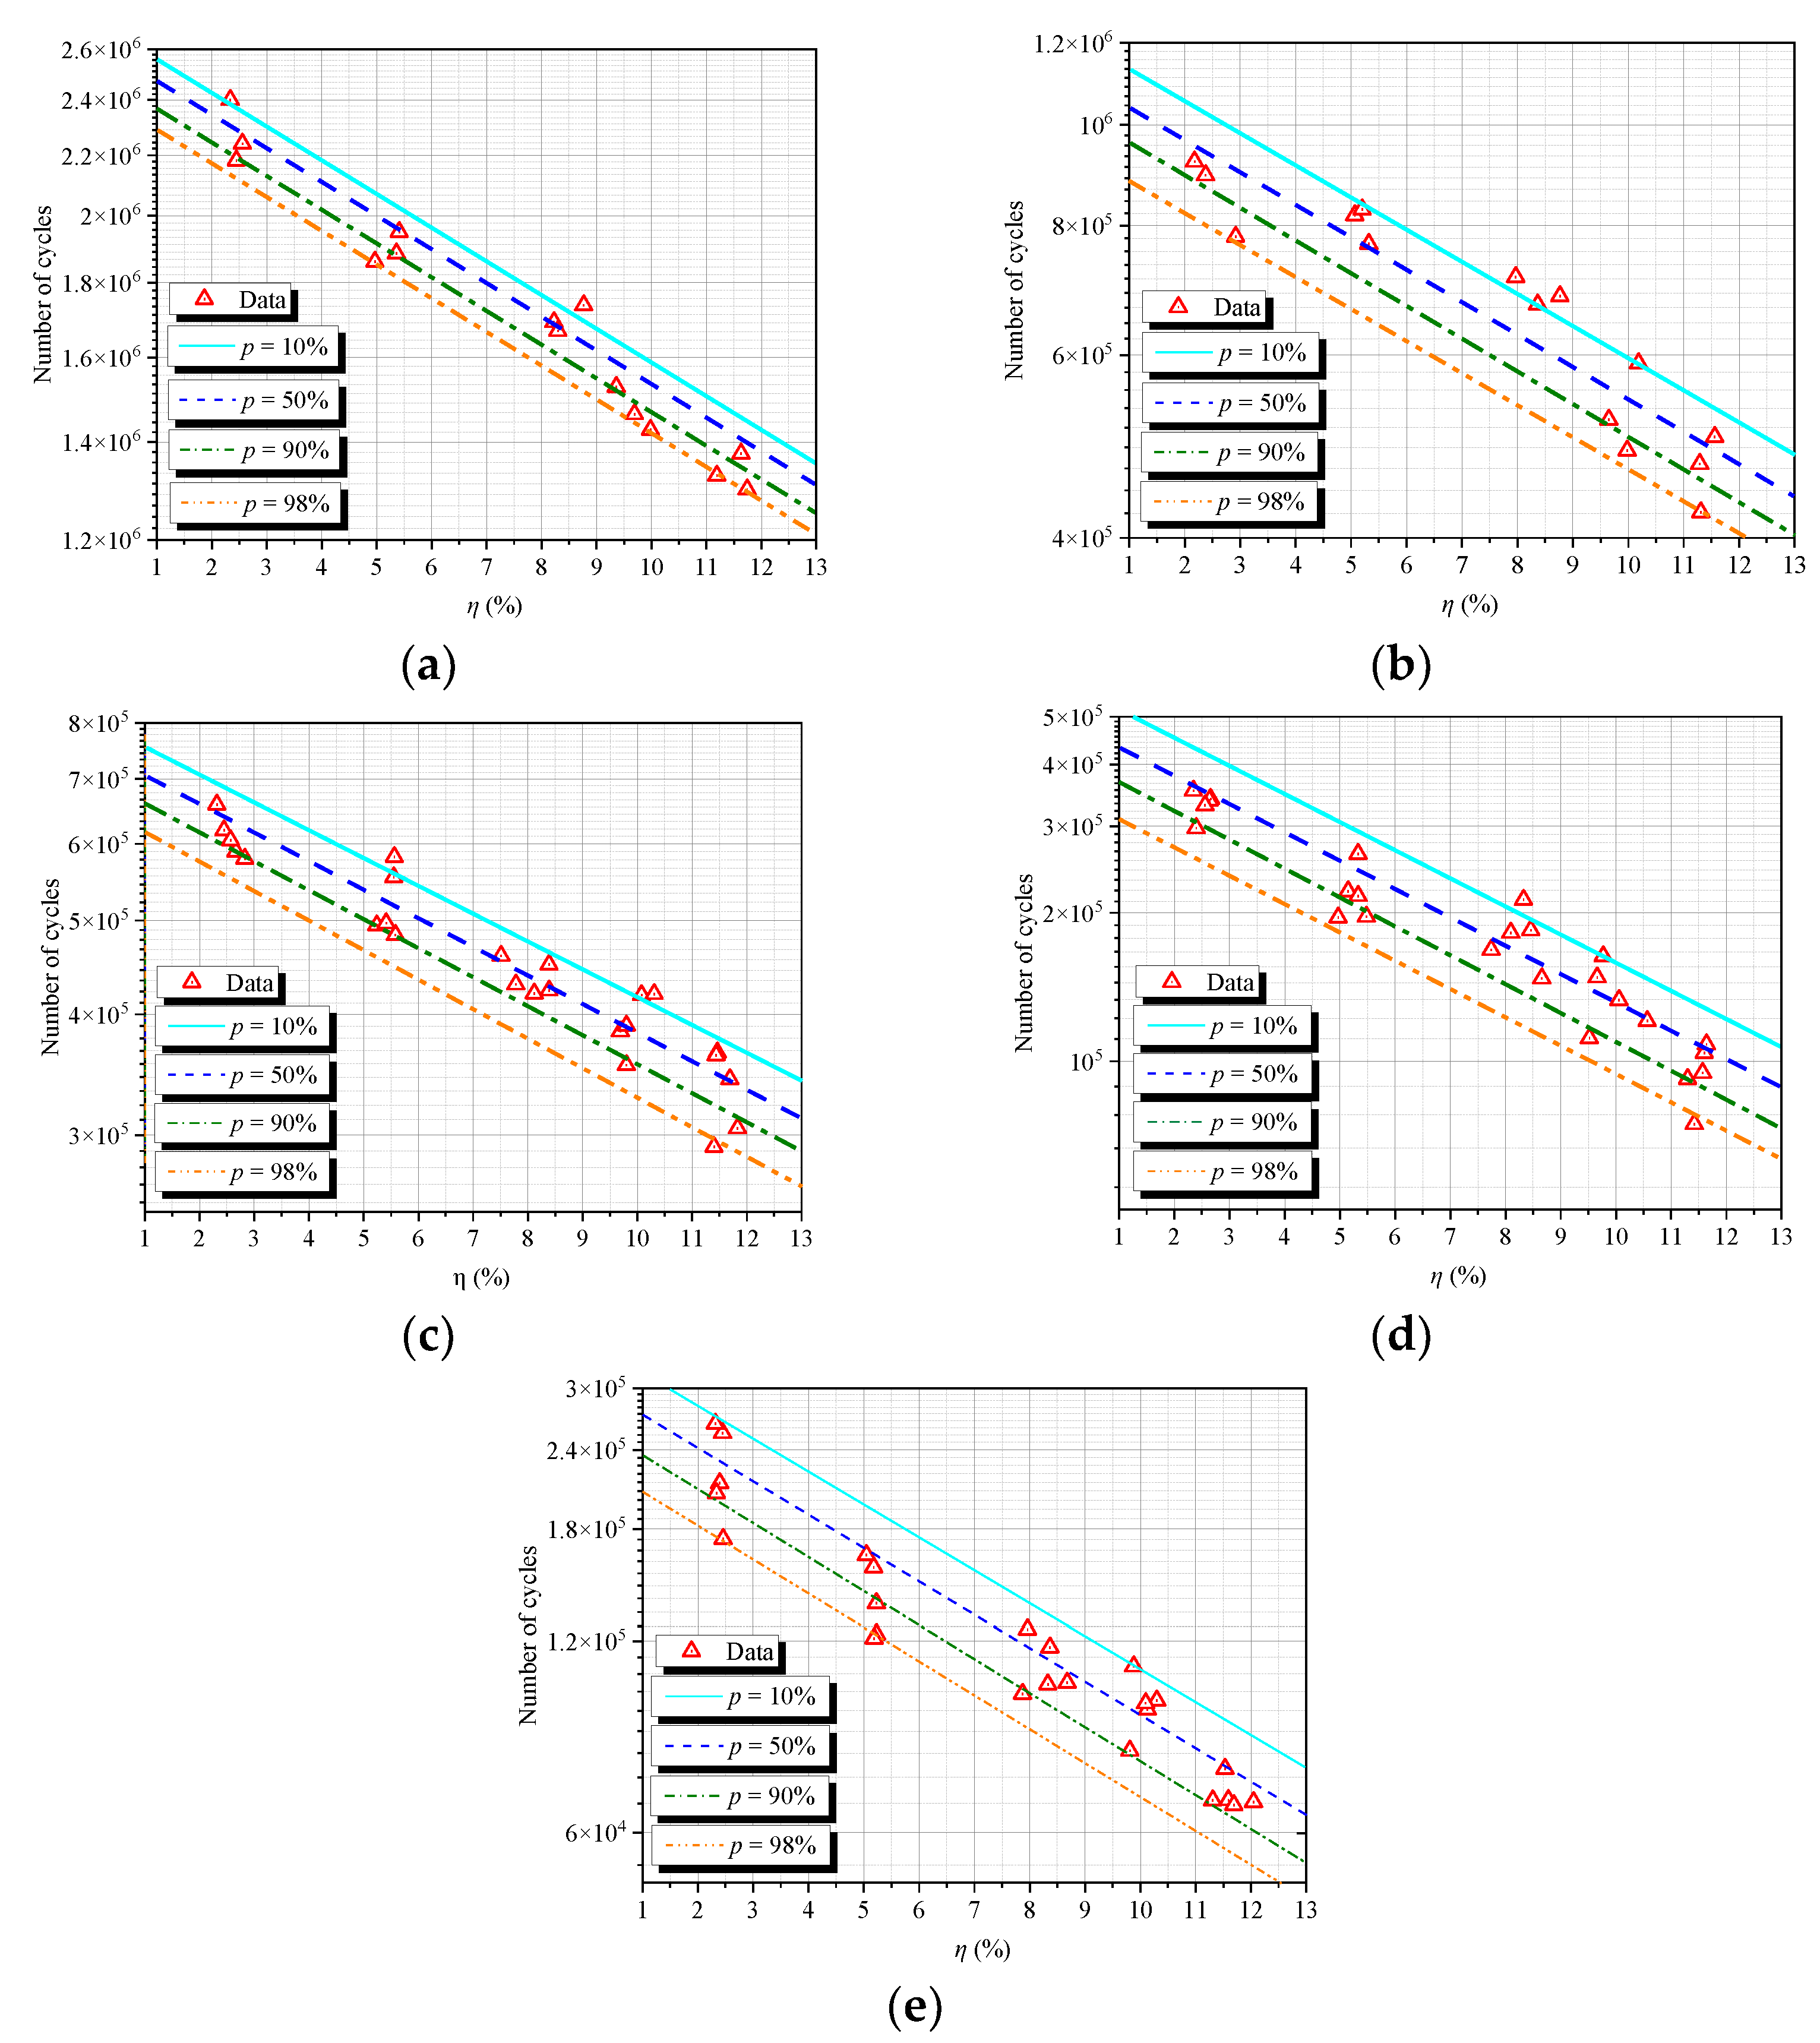
  • The fatigue data under different corrosion degrees and stress amplitudes were summarized using the statistical method. The cumulative function of the fatigue life probability of high-strength steel wires of bridge hanger rods with two stages was established, and the stress-life-corrosion rate surface equation of steel wires with different survival rates was provided, which can be selected according to different design requirements.

Author Contributions

Funding acquisition, Y.D.; project administration, Y.D.; conceptualization, L.D.; data curation, L.D.; formal analysis, L.D.; investigation, L.D.; methodology, L.D.; validation, L.D.; writing—original draft, L.D.; writing—review and editing, L.D. All authors have read and agreed to the published version of the manuscript.

Funding

This work was supported by the National Nature Science Foundation of China (Grant Nos. 51678459 and 51378406) and the Technology Project of Shanxi Transportation Holdings Group Co., Ltd. (Grant No. 19-JKKJ-8). Any opinions, findings, or conclusions expressed herein are those of the authors and do not necessarily reflect the views of the sponsors.

Institutional Review Board Statement

Not applicable.

Informed Consent Statement

Not applicable.

Data Availability Statement

Not applicable.

Conflicts of Interest

The authors declare no conflict of interest.

Appendix A

Table A1. Test data of steel wires.
No.Accelerated Corrosion Time (Day)η (%)ΔS (MPa)Number of Cycles (×106)No.Accelerated Corrosion Time (Day)η (%)ΔS (MPa)Number of Cycles (×106)
1102.342702.407162407.966300.1252
2102.452702.181263408.686300.0933
3102.562702.240264609.982701.427
4102.183600.922065609.362701.5272
5102.383600.894366609.692701.4628
6102.923600.7805676010.193600.5894
7102.674500.589268609.983600.4854
8102.454500.619569609.653600.5200
9102.574500.605470609.804500.3545
10102.324500.659716010.084500.4587
11102.834500.449372609.694500.424
12102.665400.3407736010.314500.4597
13102.645400.338474609.804500.4294
14102.355400.3538756010.575400.1206
15102.565400.330576609.665400.1481
16102.405400.2974776010.065400.1331
17102.456300.255078609.525400.1113
18102.406300.212679609.775400.1633
19102.326300.263880609.816300.0807
20102.346300.20524816010.136300.0937
21102.466300.1736826010.306300.0969
22205.362701.8841836010.106300.0959
23205.412701.949684609.886300.1096
24204.972701.8612859011.632701.3749
25205.073600.8185869011.192701.3276
26205.203600.829879011.742701.2995
27205.323600.7679889011.293600.4714
28205.554500.5541899011.313600.4235
29205.244500.4942909011.563600.5005
30205.584500.4832919011.404500.2316
31205.414500.4967929011.464500.3652
32205.564500.5817939011.694500.3428
33205.335400.2636949011.834500.3049
34205.155400.2214959011.444500.3629
35204.975400.1985969011.605400.1040
36205.335400.2166979011.425400.0746
37205.485400.1966989011.575400.0947
38205.236300.1177999011.645400.1082
39205.186300.15671009011.305400.0921
40205.236300.12311019011.596300.0675
41205.056300.16391029011.696300.0663
42205.196300.12131039011.536300.0756
43408.232701.69141049012.056300.067
44408.772701.7371059011.316300.0674
45408.302701.6680Fatigue data after polishing
46408.773600.6841106102.293601.1875
47407.973600.7736107102.263601.2471
48408.373600.6715108102.343601.2865
49408.124500.4203109205.433601.0064
50408.394500.4502110205.263601.1348
51408.394500.4232111205.373601.0956
52407.514500.4597112407.943600.8887
53407.784500.4294113408.253600.9773
54407.745400.1682114408.023601.0266
55408.335400.21251156010.143600.8010
56408.665400.1473116609.933600.9290
57408.105400.18241176010.073600.8136
58408.465400.18451189011.713600.6832
59408.376300.11741199011.463600.8350
60407.876300.09921209011.533600.6984
61408.336300.0727

References

  1. Xin, C.; Jinsong, Z.; Yangzi, L. Corrosion damage identification of suspenders of arch bridges in service based on guided wave multi-point scattering. J. Vibr. Shock 2021, 40, 295–301. [Google Scholar]
  2. Sun, Z.; Ning, S.; Shen, Y. Failure Investigation and Replacement Implementation of Short Suspenders in a Suspension Bridge. J. Bridge Eng. 2017, 22, 05017007. [Google Scholar] [CrossRef]
  3. Feng, D.; Mauch, C.; Summerville, S.; Fernandez, O. Suspender Replacement for a Signature Bridge. J. Bridge Eng. 2018, 23, 05018010. [Google Scholar] [CrossRef]
  4. Deng, Y.; Deng, L. Suspender Replacement Method for Long-Span Concrete-Filled Steel Tubular Arch Bridges and Cable Force Measurement Based on Frequency Method. Adv. Civil Eng. 2021, 2021, 7308816. [Google Scholar] [CrossRef]
  5. Sun, H.; Xu, J.; Chen, W.; Yang, J. Time-Dependent Effect of Corrosion on the Mechanical Characteristics of Stay Cable. J. Bridge Eng. 2018, 23, 04018019. [Google Scholar] [CrossRef]
  6. Li, H.; Lan, C.; Ju, Y.; Li, D.S. Experimental and Numerical Study of the Fatigue Properties of Corroded Parallel Wire Cables. J. Bridge Eng. 2012, 17, 211–220. [Google Scholar] [CrossRef]
  7. Lonetti, P.; Pascuzzo, A. Vulnerability and failure analysis of hybrid cable-stayed suspension bridges subjected to damage mechanisms. Eng. Fail. Anal. 2014, 45, 470–495. [Google Scholar] [CrossRef]
  8. Jarwali, T.; Nakamura, S. Anti-corrosion performance of bridge strands consisting of steel wires galvanised with zinc-aluminium alloy. Struct. Infrastruct. Eng. 2016, 12, 682–694. [Google Scholar] [CrossRef]
  9. Xue, S.; Shen, R. Corrosion-Fatigue Analysis of High-Strength Steel Wire by Experiment and the Numerical Simulation. Metals 2020, 10, 734. [Google Scholar] [CrossRef]
  10. Mayrbaurl, R.M.; Camo, S. Cracking and fracture of suspension bridge wire. J. Bridge Eng. 2001, 6, 645–650. [Google Scholar] [CrossRef]
  11. Betti, R.; West, A.C.; Vermaas, G.; Cao, Y. Corrosion and Embrittlement in High-Strength Wires of Suspension Bridge Cables. J. Bridge Eng. 2005, 10, 151–162. [Google Scholar] [CrossRef]
  12. Nakamura, S.; Suzumura, K. Experimental Study on Fatigue Strength of Corroded Bridge Wires. J. Bridge Eng. 2013, 18, 200–209. [Google Scholar] [CrossRef]
  13. Li, R.; Miao, C.; Feng, Z.; Wei, T. Experimental study on the fatigue behavior of corroded steel wire. J. Constr. Steel Res. 2021, 176, 106375. [Google Scholar] [CrossRef]
  14. Wang, Y.; Zhang, W.; Pan, X.; Zheng, Y. Experimental Study on Fatigue Crack Propagation of High-Strength Steel Wire with Initial Defects for Bridge Cables. Appl. Sci. 2020, 10, 4065. [Google Scholar] [CrossRef]
  15. Zheng, Y.; Wang, Y. Damage evolution simulation and life prediction of high-strength steel wire under the coupling of corrosion and fatigue. Corros. Sci. 2020, 164, 108368. [Google Scholar] [CrossRef]
  16. Ma, Y.; Wang, G.; Guo, Z.; Wang, L.; Jiang, T.; Zhang, J. Critical region method-based fatigue life prediction of notched steel wires of long-span bridges. Constr. Build. Mater. 2019, 225, 601–610. [Google Scholar] [CrossRef]
  17. Zheng, X.; Xie, X.; Li, X.; Qian, L.; Shen, Y. Estimation model for steel wire crack propagation and its application in calculation of pre-corrosion fatigue life. China Civil Eng. J. 2017, 3, 101–107. [Google Scholar]
  18. Zheng, X.; Xie, X.; Li, X. Experimental Study and Residual Performance Evaluation of Corroded High-Tensile Steel Wires. J. Bridge Eng. 2017, 22, 04017091. [Google Scholar] [CrossRef]
  19. Miao, C.; Yu, J.; Mei, M. Distribution law of corrosion pits on steel suspension wires for a tied arch bridge. Anti-Corros. Methods Mater 2016, 63, 166–170. [Google Scholar] [CrossRef]
  20. Zheng, X.; Xie, X.; Li, X. Experimental study on fatigue performance of corroded high tensile steel wires of arch bridge hangers. China Civil Eng. J. 2015, 48, 68–76. [Google Scholar]
  21. Lan, C.; Xu, Y.; Liu, C.; Li, H.; Spencer, B. Fatigue life prediction for parallel-wire stay cables considering corrosion effects. Int. J. Fatigue 2018, 114, 81–91. [Google Scholar] [CrossRef]
  22. Lan, C.M.; Xu, Y.; Ren, D.L.; Li, N.; Liu, Z. Fatigue property assessment of parallel wire stay cable I: Fatigue life model for wire. China Civil Eng. J. 2017, 6, 62–70. [Google Scholar]
  23. Lan, C.; Ren, D.; Xu, Y.; Li, N.; Liu, Z. Fatigue property assessment of parallel wire stay cable II: Fatigue life model for stay cable. China Civil Eng. J. 2017, 7, 69–77. [Google Scholar]
  24. Chen, A.; Yang, Y.; Ma, R.; Li, L.; Tian, H.; Pan, Z. Experimental study of corrosion effects on high-strength steel wires considering strain influence. Constr. Build. Mater. 2020, 240, 117910. [Google Scholar] [CrossRef]
  25. Jiang, C.; Wu, C.; Jiang, X. Experimental study on fatigue performance of corroded high-strength steel wires used in bridges. Constr. Build. Mater. 2018, 187, 681–690. [Google Scholar] [CrossRef]
  26. International Organization for Standardization. Corrosion Tests in Artificial Atmosphere Salt Spray Tests; HIS under license with ISO: Geneva, Switzerland, 1990; p. 9227. [Google Scholar]
  27. Suzumura, K.; Nakamura, S. Environmental factors affecting corrosion of galvanized steel wires. J. Mater. Civ. Eng. 2004, 16, 1–7. [Google Scholar] [CrossRef]
  28. Yuan, Y.; Liu, X.; Pu, G.; Wang, T.; Zheng, D. Temporal and spatial variability of corrosion of high-strength steel wires within a bridge stay cable. Constr. Build. Mater. 2021, 308, 125108. [Google Scholar] [CrossRef]
  29. International Organization for Standardization. Corrosion of Metals and Alloys-Removal of Corrosion Products from Corrosion Test Specimens; HIS under llicense with ISO: Geneva, Switzerland, 1991; p. 8407. [Google Scholar]
  30. GB/T 17101-2008; Hot-Dip Galvanized Steel Wires for Bridge Cables. B.C.S. Press: Swindon, UK, 2008.
  31. Lan, C.; Bai, N.; Yang, H.; Liu, C.; Li, H.; Spencer, B.F., Jr. Weibull modeling of the fatigue life for steel rebar considering corrosion effect. Int. J. Fatigue 2018, 111, 134–143. [Google Scholar] [CrossRef]
  32. Castillo, E.; López-Aenlle, M.; Ramos, A.; Fernández-Canteli, A.; Kieselbach, R.; Esslinger, V. Specimen length effect on parameter estimation in modelling fatigue strength by Weibull distribution. Int. J. Fatigue 2006, 28, 1047–1058. [Google Scholar] [CrossRef]
Figure 1. Beishengou concrete-filled steel tube arch bridge. (a) Arch bridge lane, (b) Overall state of arch bridge.
Coatings 12 01475 g001
Figure 2. Bridge elevation structure drawing (Unit: cm).
Coatings 12 01475 g002
Figure 3. Corrosion inside suspender. (a) Overall inspection of suspender, (b) Internal corrosion of suspender and (c) Corrosion of anchor cup.
Coatings 12 01475 g003
Figure 4. Suspender replacement construction process. (a) Schematic of the replacement scheme, (b) Upper construction and (c) Lower construction.
Coatings 12 01475 g004
Figure 5. Cross section of boom.
Coatings 12 01475 g005
Figure 6. Salt fog corrosion chamber.
Coatings 12 01475 g006
Figure 7. Samples of accelerated corrosion steel wire. (a) Matrix uncorroded specimens, (b) Specimens after 10 days of corrosion, (c) Specimens after 20 days of corrosion, (d) Specimens after 40 days of corrosion, (e) Specimens after 60 days of corrosion and (f) Specimens after 90 days of corrosion.
Coatings 12 01475 g007
Figure 8. De-rusting of steel wire. (a) Derusting with hydrochloric acid, (b) De-rusting with steel wire.
Coatings 12 01475 g008
Figure 9. Macroscopic surface of corroded steel wire.
Coatings 12 01475 g009
Figure 10. Laser microscope.
Coatings 12 01475 g010
Figure 11. Laser microscope scanning results. (a) 3D scanned image, (b) 2D contour chart.
Coatings 12 01475 g011
Figure 12. The relationship between roughness and time.
Coatings 12 01475 g012
Figure 13. Testing site. (a) Tensile tester, (b) Fixed-wire conditions.
Coatings 12 01475 g013
Figure 14. Scanning electron morphology of whole fatigue fracture of corroded wire. (a) Type Ⅰ, (b) Type Ⅱ and (c) Type III.
Coatings 12 01475 g014
Figure 15. Relationship between fatigue life and quality loss of pre-corroded steel wire.
Coatings 12 01475 g015
Figure 16. Weibull plot of the normalized variable R for corroded steel wire. (a) ΔS ≤ 360 MPa, (b) ΔS ≤ 360 MPa.
Coatings 12 01475 g016
Figure 17. Relationship between fatigue life of pre-corroded steel wire and mass loss rate.
Coatings 12 01475 g017
Figure 18. Fatigue life versus corrosion degree for steel wire. (a) ΔS = 270 MPa, (b) ΔS = 360 MPa, (c) ΔS = 450 MPa, (d) ΔS = 540 MPa and (e) ΔS = 630 MPa.
Coatings 12 01475 g018
Table 1. Chemical compositions (wt.%) of steel wires.
CompositionsCSiMnSCuCr
wt.%0.85–0.900.12–0.320.60–0.90≤0.0025≤0.100.10–0.25
Table 2. S-N curve under different corrosion degree.
Corrosion Time (d)ΔS ≤ 360 MPaR2ΔS > 360 MPaR2
10 3.0431 ln Δ S + ln N = 31.64 1 3.1227 ln Δ S + ln N = 32.327 0.9949
20 3.0407 ln Δ S + ln N = 31.511 1 3.3226 ln Δ S + ln N = 33.383 0.9969
40 3.1353 ln Δ S + ln N = 31.977 1 3.8173 ln Δ S + ln N = 36.307 0.9981
60 3.1675 ln Δ S + ln N = 32.084 1 4.074 ln Δ S + ln N = 37.776 0.9989
90 3.2365 ln Δ S + ln N = 32.367 1 4.4966 ln Δ S + ln N = 40.244 0.9949
Publisher’s Note: MDPI stays neutral with regard to jurisdictional claims in published maps and institutional affiliations.

