Article

Numerical Study on the Regression Method to Eliminate the Influence of Surface Morphology on Indentation Hardness of Thin Films

1
State Key Laboratory for Strength and Vibration of Mechanical Structures, Department of Engineering Mechanics, School of Aerospace Engineering, Xi’an Jiaotong University, Xi’an 710049, China
2
State Key Laboratory of Long-Life High Temperature Materials, Dongfang Electric Corporation Dongfang Turbine Co., Ltd., Deyang 618000, China
3
China Institute of Atomic Energy, Beijing 102413, China
*
Author to whom correspondence should be addressed.
Coatings 2022, 12(10), 1447; https://doi.org/10.3390/coatings12101447
Submission received: 5 September 2022 / Revised: 25 September 2022 / Accepted: 28 September 2022 / Published: 30 September 2022
(This article belongs to the Special Issue Trends in Coatings and Surface Technology)

Abstract

:
The surface morphology of specimens significantly affects the measurement accuracy of indentation hardness. Surface undulation leads to dispersion in measured hardness and makes it very difficult to obtain an accurate hardness. In the past, mechanical polishing and increasing the indentation depth were widely performed to decrease the influence of surface morphology. However, both methods have limitations for the hardness measurement of small-scale structures such as thin films or coatings. Thus, obtaining an accurate hardness measurement from one or two simple indentation tests is of great application value. In this study, we introduced a new regression method to eliminate the influence of surface undulation on hardness measurements. We simulated the indentation tests of thin films with undulating surfaces by finite element simulation and then analyzed the regularity of the measured hardness. The numerical simulations validated that the regression method can effectively eliminate the influence of surface undulation and obtain the accurate hardness of materials. This method breaks through the limitations of conventional methods, simplifies the testing workload, and improves measurement accuracy.

1. Introduction

Mechanical properties are essential to evaluate the reliability and failure behavior of structures in engineering. The instrumented indentation technique is one of the most powerful tools to characterize the mechanical properties of solid materials, especially for the measurements of hardness and elastic modulus [1,2]. More recently, the indentation technique has been widely used to characterize the mechanical behaviors of small-scale structures, such as thin films and coatings [3,4,5,6,7]. However, while the indentation technique offers great convenience in characterizing the mechanical behaviors of solid materials at small scales, many challenges remain unsolved, one of which is the surface morphology of specimens.
The indentation test is based on a smooth plane, but surface undulation of specimens makes an important impact on measurement accuracy [8,9]. Figure 1 shows an indentation test on the undulating surface of a thin film. The undulating morphology causes serious deviations in the measurements of hardness and elastic modulus, particularly at shallow indentation depths. In recent years, surface morphology has been of interest and has been reported in numerous studies [10,11,12,13,14,15,16,17,18,19,20]. For instance, Jang et al. [12] confirmed that surface morphology makes a significant impact on both hardness and elastic modulus and leads to serious measurement deviations through numerical simulations of copper film with straight groove defects. Walter et al. [13] indicated that Young’s modulus will be underestimated with increasing surface roughness and showed that the mean Young’s modulus of rough thin films is 5%–14% lower than that of smooth surfaces. Cech et al. [15] reported that a surface morphology of a wave character results in the severe underestimation of mechanical properties by more than 50%. As stated above, the surface morphology of thin films plays an important role in the determination of mechanical properties from indentation experiments.
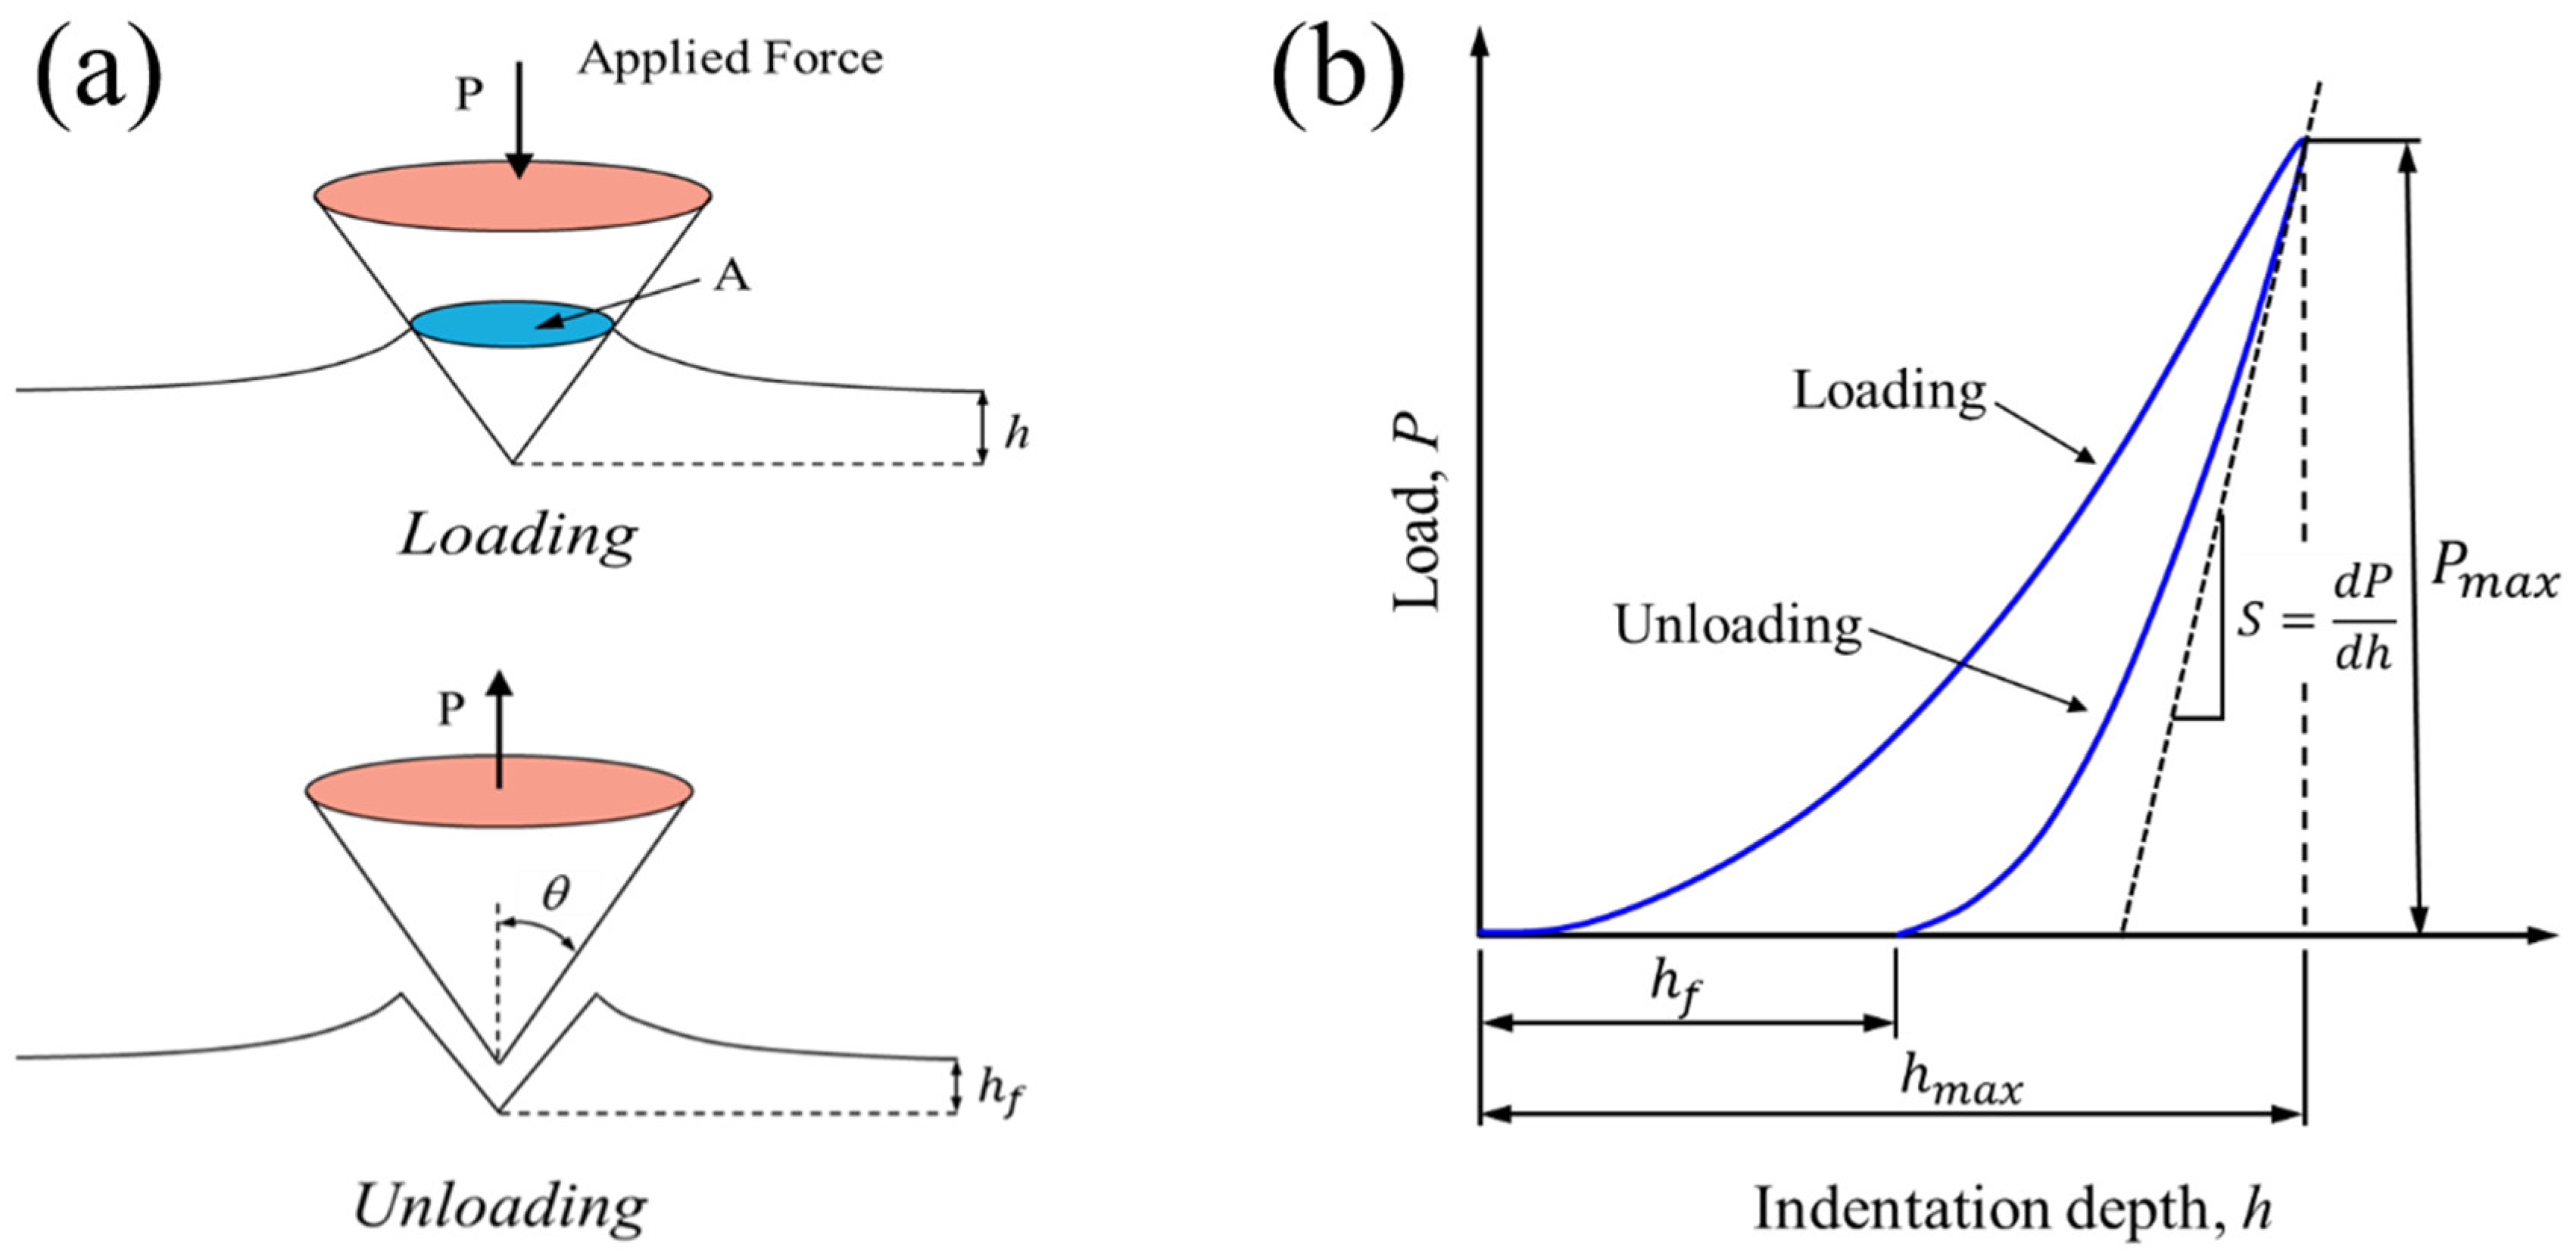
The measurement accuracy is usually subjected to the influence of surface morphology in indentation tests, and its inaccuracy is dependent on the deviation of the contact area resulting from depth deviation. The indentation test is a typical contact problem [21]. A complete indentation test consists of loading and unloading, shown in Figure 2a, which correspond to the measurements in plasticity and elasticity, respectively [1,2]. The indentation technique has micron or nano resolution, which accurately measures load and displacement changes during loading and unloading, and then a load-displacement curve is obtained, as in Figure 2b. The load-displacement curve presents many important measured parameters, on the basis of which hardness and elastic modulus can be calculated. Hardness is usually defined as the mean value of contact stress. Once contact area A is determined, the hardness is calculated from:
H = P max A
Note that this hardness definition is based on the contact area A under applied load P. Moreover, the measurement of the elastic modulus follows its relationship to the contact area A and the unloading stiffness S measured in Figure 2b. Since the indenter is not completely rigid, the effective elastic modulus E r is introduced
S = β 2 π E r A
where β is a constant depending on the indenter shape. Young’s modulus E is determined from the relation
1 E r = 1 v 2 E + 1 v i 2 E i
where E is the measured Young’s modulus, v is the Poisson’s ratio of the specimen, and E i and v i are the elastic modulus and Poisson’s ratio of the indenter, respectively. It can be seen that the hardness and elastic modulus are determined by the contact area that depends on the indentation depth. Hence, the influence of surface morphology on the measurement accuracy of hardness or elastic modulus is expressed by the measurement deviation of the indentation depth.
Hardness or elastic modulus is calculated by the contact area between the indenter and specimen. The contact area is not measured directly but calculated from the contact depth and indenter geometry. This implies that the specimen surface must be ideally smooth and all points within the contact depth in continuous contact. Hence, to eliminate the effect of surface morphology and obtain accurate mechanical parameters, it should be ensured that the specimens are perfectly smooth or that the indentation depth greatly exceeds the undulating height of the surface morphology [22]. In the past, mechanical polishing and increasing the indentation depth were widely performed to decrease the effect of surface morphology. Broadly speaking, mechanical polishing can effectively decrease surface roughness and obtain a desirable surface finish [23,24], which ensures that the contact is smooth and continuous. Likewise, increasing the indentation depth is also a common way to decrease the effect of surface morphology, which manifests as a decrease in hardness deviation with the increase in indentation depth. However, these two methods may raise a variety of problems for indentation tests of thin films. To be specific, mechanical polishing can lead to an emergence of a surface deformation layer and residual stress, which will introduce new variable factors that affect measurement accuracy. As a result, it is required that vibration treatment is utilized to eliminate residual stress after polishing, which undoubtedly increases testing workloads. Additionally, the method of increasing indentation depth is also inadequate for eliminating the influence of surface morphology. Thin films are different from bulk structures; increasing indentation depth too much can cause substrate effects. Generally, to avoid the substrate effect, the indentation depth is required to be less than ten percent of the thickness of the thin film. As a result, this method has an important limitation for eliminating the influence of surface morphology for the indentation tests of thin films. To sum up, there is still no applicable method to solve the challenges resulting from the surface morphology of thin films.
The surface morphology of samples significantly affects measurement accuracy and leads to an important deviation in the measured data in indentation tests [16,25]. It is essential to obtain accurate mechanical properties by one or two simple indentation tests for undulating surfaces. Exploring a new effective method to eliminate measurement deviation resulting from surface morphology is of great application value.
Herein, we show the influence of the surface morphology of thin films on indentation hardness testing. We propose a numerical regression method to eliminate the hardness deviation resulting from surface morphology. The feasibility of this method was validated by finite element simulation. This method avoids the limitations of traditional methods, reduces measurement workloads, and provides a theoretical reference for subsequent experimental tests.

2. Method and Modeling

A simplified schematic diagram of heterogeneous surface morphology is shown in Figure 3. To simplify the computational model and maintain the original undulating topography, we introduced a sinusoidal curve to establish a two-dimensional surface model to characterize the undulating morphology of thin film. Previous studies have reported that the surface morphology was described by sinusoidal curves [26,27]. Further, Chen et al. [28] demonstrated that the surface morphology was characterized by a single-level or multi-level sinusoidal function. The sinusoidal model is expressed by a combination of multiple continuous crests and troughs. The horizontal size of an adjacent crest and trough is D x , and the vertical height is R y . They were defined as the characteristic size to describe the sinusoidal surface model.
Hardness was measured on smooth surfaces, which was independent of the surface morphology of the samples. However, surface morphology can affect measurement accuracy in hardness. Note that the influence s expressed through contact positions between the indenter and the sample. Here, we simply took the contact positions of the crest and trough as examples to evaluate the influence of surface morphology on hardness measurements, as shown in Figure 4. For classical materials, mechanical properties are independent of the materials’ scale, and a geometric self-similar indenter can be infinitely enlarged. Both crest position and trough position are approximately manifested as a plane with the enlargement of contact positions between the indenter and the sample, as shown in Figure 4. In other words, the indentation tests on the crest or trough position are equivalent to those on a plane when geometric self-similar indentation is very shallow. Simply but importantly, the measured hardness of undulating surfaces is equal to the true hardness of smooth planes at the shallow indentation. However, shallow indentation tests are rather difficult and are affected by multiple uncertain causes, which leads to an important dispersion of measured data. It is difficult to obtain accurate results only by simple shallow indentation. Thus, based on our considerations, we proposed a numerical method to obtain accurate hardness by regressing measured data to that corresponding to shallow indentation.

3. Simulation and Validation

3.1. Finite Element Simulation

In this study, we used a plane strain model to simulate the indentation test of thin films using ABAQUS without a strain gradient. We defined the model as homogeneous and isotropic and characterized by an ideal elastoplastic model. The stress–strain relationship is given as follows:
σ = { E ε ε ε 0 σ 0 ε > ε 0
where σ 0 and ε 0 are the stress and strain values corresponding to the yield strength. This material model is often used for metal plasticity and is rate-independent. The Mises yield function with the associated flow was used. The volume strain is
ε υ o l = t r a c e ( ε )
the deviatoric strain is
e = ε 1 3 ε υ o l I
and the strain incremental decomposition is
d ε = d ε e l + d ε p l
where ε e l is the elastic component and ε p l is the plastic component of the strain ε . Using the standard definition of corotational measures, this can be written in an integrated form as
ε = ε e l + ε p l
The elasticity is linear and isotropic. Bulk modulus K and shear modulus G are computed readily from Young’s modulus E and Poisson’s ratio v, as
K = E 3 ( 1 2 v )
and
G = E 2 ( 1 + v )
The elasticity can be written in volumetric and deviatoric components as follows. Volumetric:
p = K ε υ o l
where
p = 1 3 t r a c e ( σ )
is the equivalent pressure stress. Deviatoric:
S = 2 G e e l
where S is the deviatoric stress,
S = σ + p I
The flow rule is
d e p l = d e ¯ p l n
where
n = 3 2 S q
q = 3 2 S : S
and d e ¯ p l is the equivalent plastic strain rate. As the material is rate-independent, the yield condition is
q = σ 0
where σ 0 ( e ¯ p l , θ ) is the yield stress and is defined as a function of the equivalent plastic strain ( e ¯ p l ) and temperature ( θ ). From what has been discussed above, the material behavior was defined. The constitutive parameters are shown in Table 1. To simplify calculations, we defined the indenter as a rigid body and assumed that the contact between the indenter and sample was frictionless and continuous.
The contact positions between the indenter and sample include the plane, crest, and trough. All the samples were 1000 μm × 500 μm in size, and the indenter angle was tan θ = 2 , as shown in Figure 5. Partial magnifications of the contact positions are shown in Figure 6, where Dx is 100 μm and Ry is 10 μm. The three models use eight-node quadratic plane strain elements (CPE8) that are suitable for large deformation and contact problems. The minimum size of meshes was 1 μm.
The half-wavelength Dx is 100 μm and the vertical height Ry is 10 μm.
In accordance with actual indentation tests, we set the boundary conditions for the finite element model. A fixed constraint was implemented to the bottom edge of the sample. We used the displacement loading mode and set two analysis steps of loading and unloading. A vertical displacement load was exerted to the indenter top. To observe the influence of surface undulation on measured hardness, the indentation depth was defined as twice the height Ry.
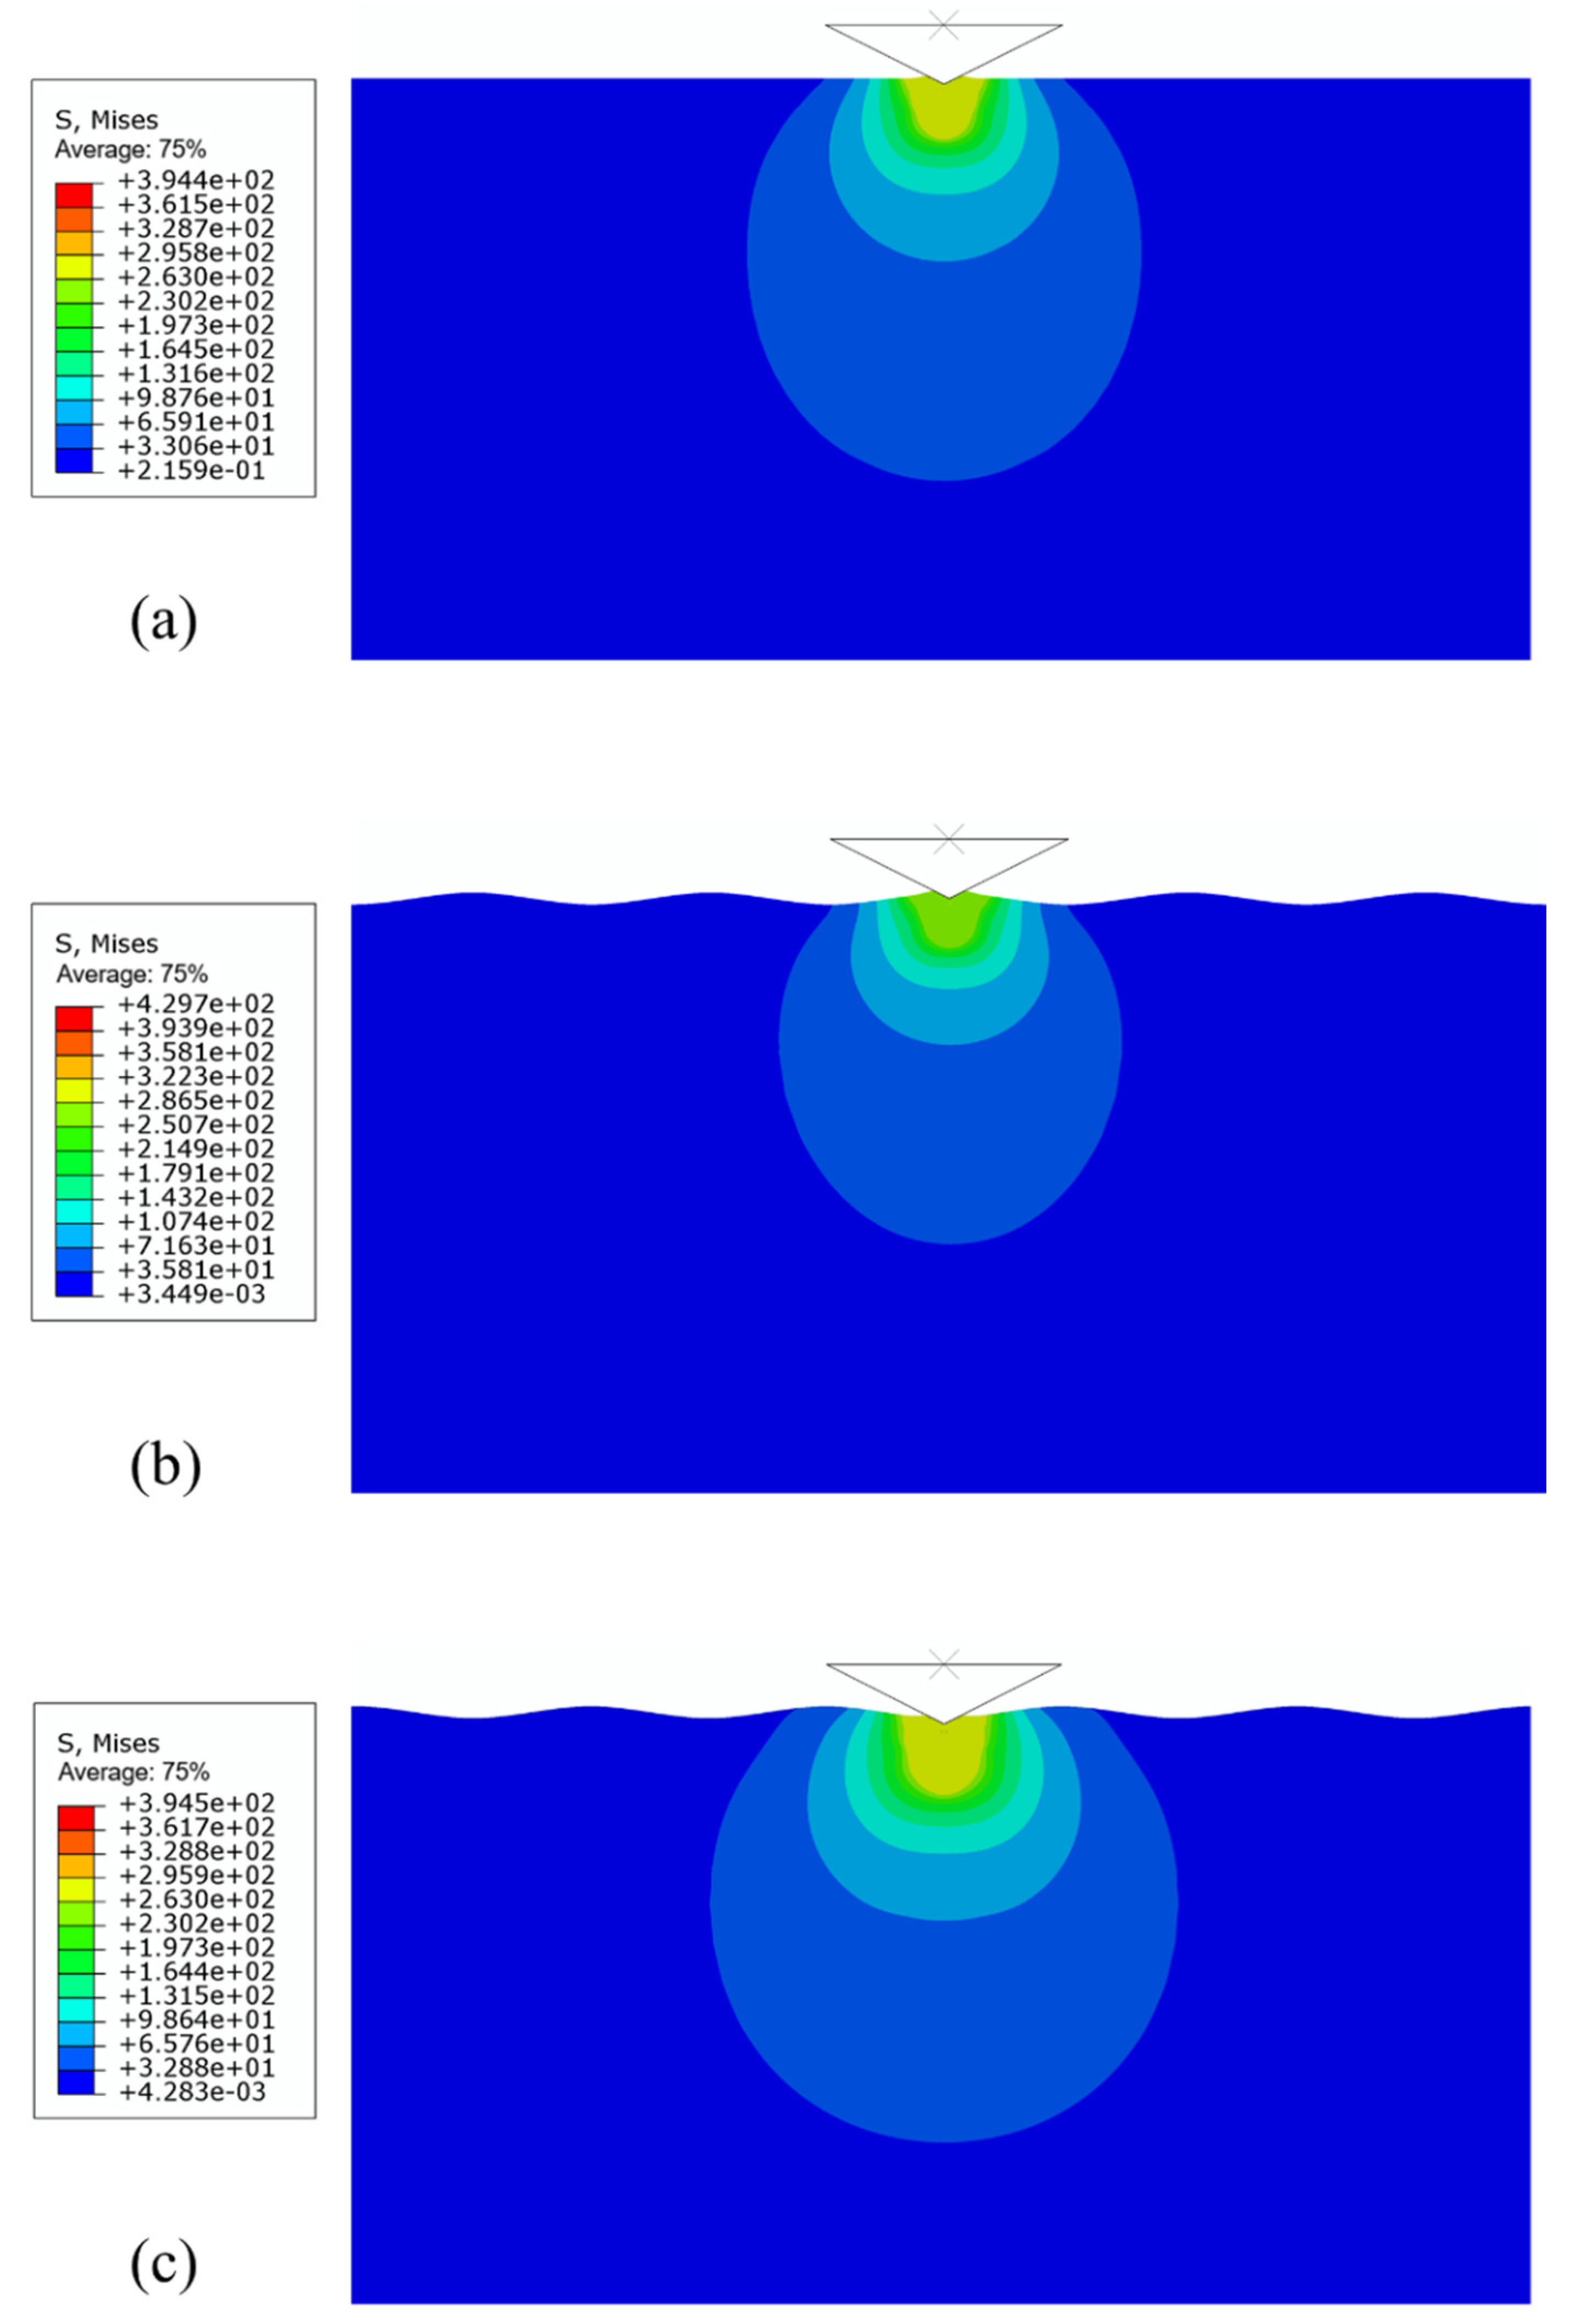
The stress contours of the simulations are shown in Figure 7. The stress distributions are symmetric, mainly concentrated at the indenter tips, and circularly diffuse outward. Moreover, Figure 7 shows that the stress contours are not affected by substrates.

3.2. Effect of Surface Morphology on Hardness

The load–depth curves are obtained by measuring the relationship between the load and the indentation depth during loading and unloading, as shown in Figure 8. From Figure 8, the load of the crest position is minimum while the load of the trough position is maximum at the same depth. This is because there is less material around the indenter tip at the crest position, which leads to a smaller opposite reaction to the indenter. On the contrary, there is more material around the indenter tip at the trough position, which leads to a larger opposite reaction to the indenter.
According to the Oliver–Pharr method [1], hardness is often defined as average contact stress. The contact area A is not directly measured and is often calculated through indentation depth h and indenter geometry. Here, the contact area is A = 4 h for the plane strain model. The hardness–depth curves of three positions are calculated in Figure 9. From Figure 9, a large oscillation emerges on these curves in the initial stage, which results from computational convergence. At the same depth, the measured hardness of the crest position is the smallest and the measured hardness of the trough position is the largest. For the smooth plane, the measured hardness is true hardness, and its hardness change is small and negligible. The crest and trough have different effects on the hardness measurements. For the crest, measured hardness is manifested as a decrease and then increases with increasing indentation depth. For the trough, measured hardness is manifested as an increase and then a decrease with increasing indentation depth. Further, we suggested that the measured hardness of both the crest and trough will approach the true hardness of the smooth plane when the indentation depth is large enough. This is because the influence of surface morphology will gradually decrease with increasing indentation depth. Hence, in the past, increasing indentation depth was often used to reduce the influence of surface morphology, but this will lead to the substrate effect, which introduces a new cause.
As mentioned, if both crest and trough positions are continuously magnified, they will approach a smooth plane. Equivalently, the measured hardness of both the crest and trough will approach the true hardness of a smooth plane with decreasing indentation depth, from Figure 9. Based on this idea, we proposed a regression method for eliminating the influence of surface morphology on measured hardness.

3.3. Regression and Validation

The regression method refers to the derivation of true hardness by fitting inaccurate hardness within an infinitely shallow indentation according to measured hardness changes. From Figure 9, the two hardness–depth curves of both crest and trough are non-linear, so we suggested using polynomial fitting to regress these curves. Here, for the sake of simplicity, we used a quadratic polynomial to fit the measured hardness and to derive the hardness corresponding to an infinitely shallow depth. The hardness at infinitely shallow depth is true hardness.
Firstly, we needed to determine the fitting segment of the data. From Figure 10, we found that the relative calculation error of hardness was less than 2% when the indentation depth is more than 2 μm. The measured hardness with a depth greater than 2 μm was picked for fitting. Moreover, since the vertical height of the surface undulation was 10 μm, measured hardness with a depth less than 10 μm was picked for fitting. Thus, the measured hardness of depths from 2 μm to 10 μm were picked for fitting.
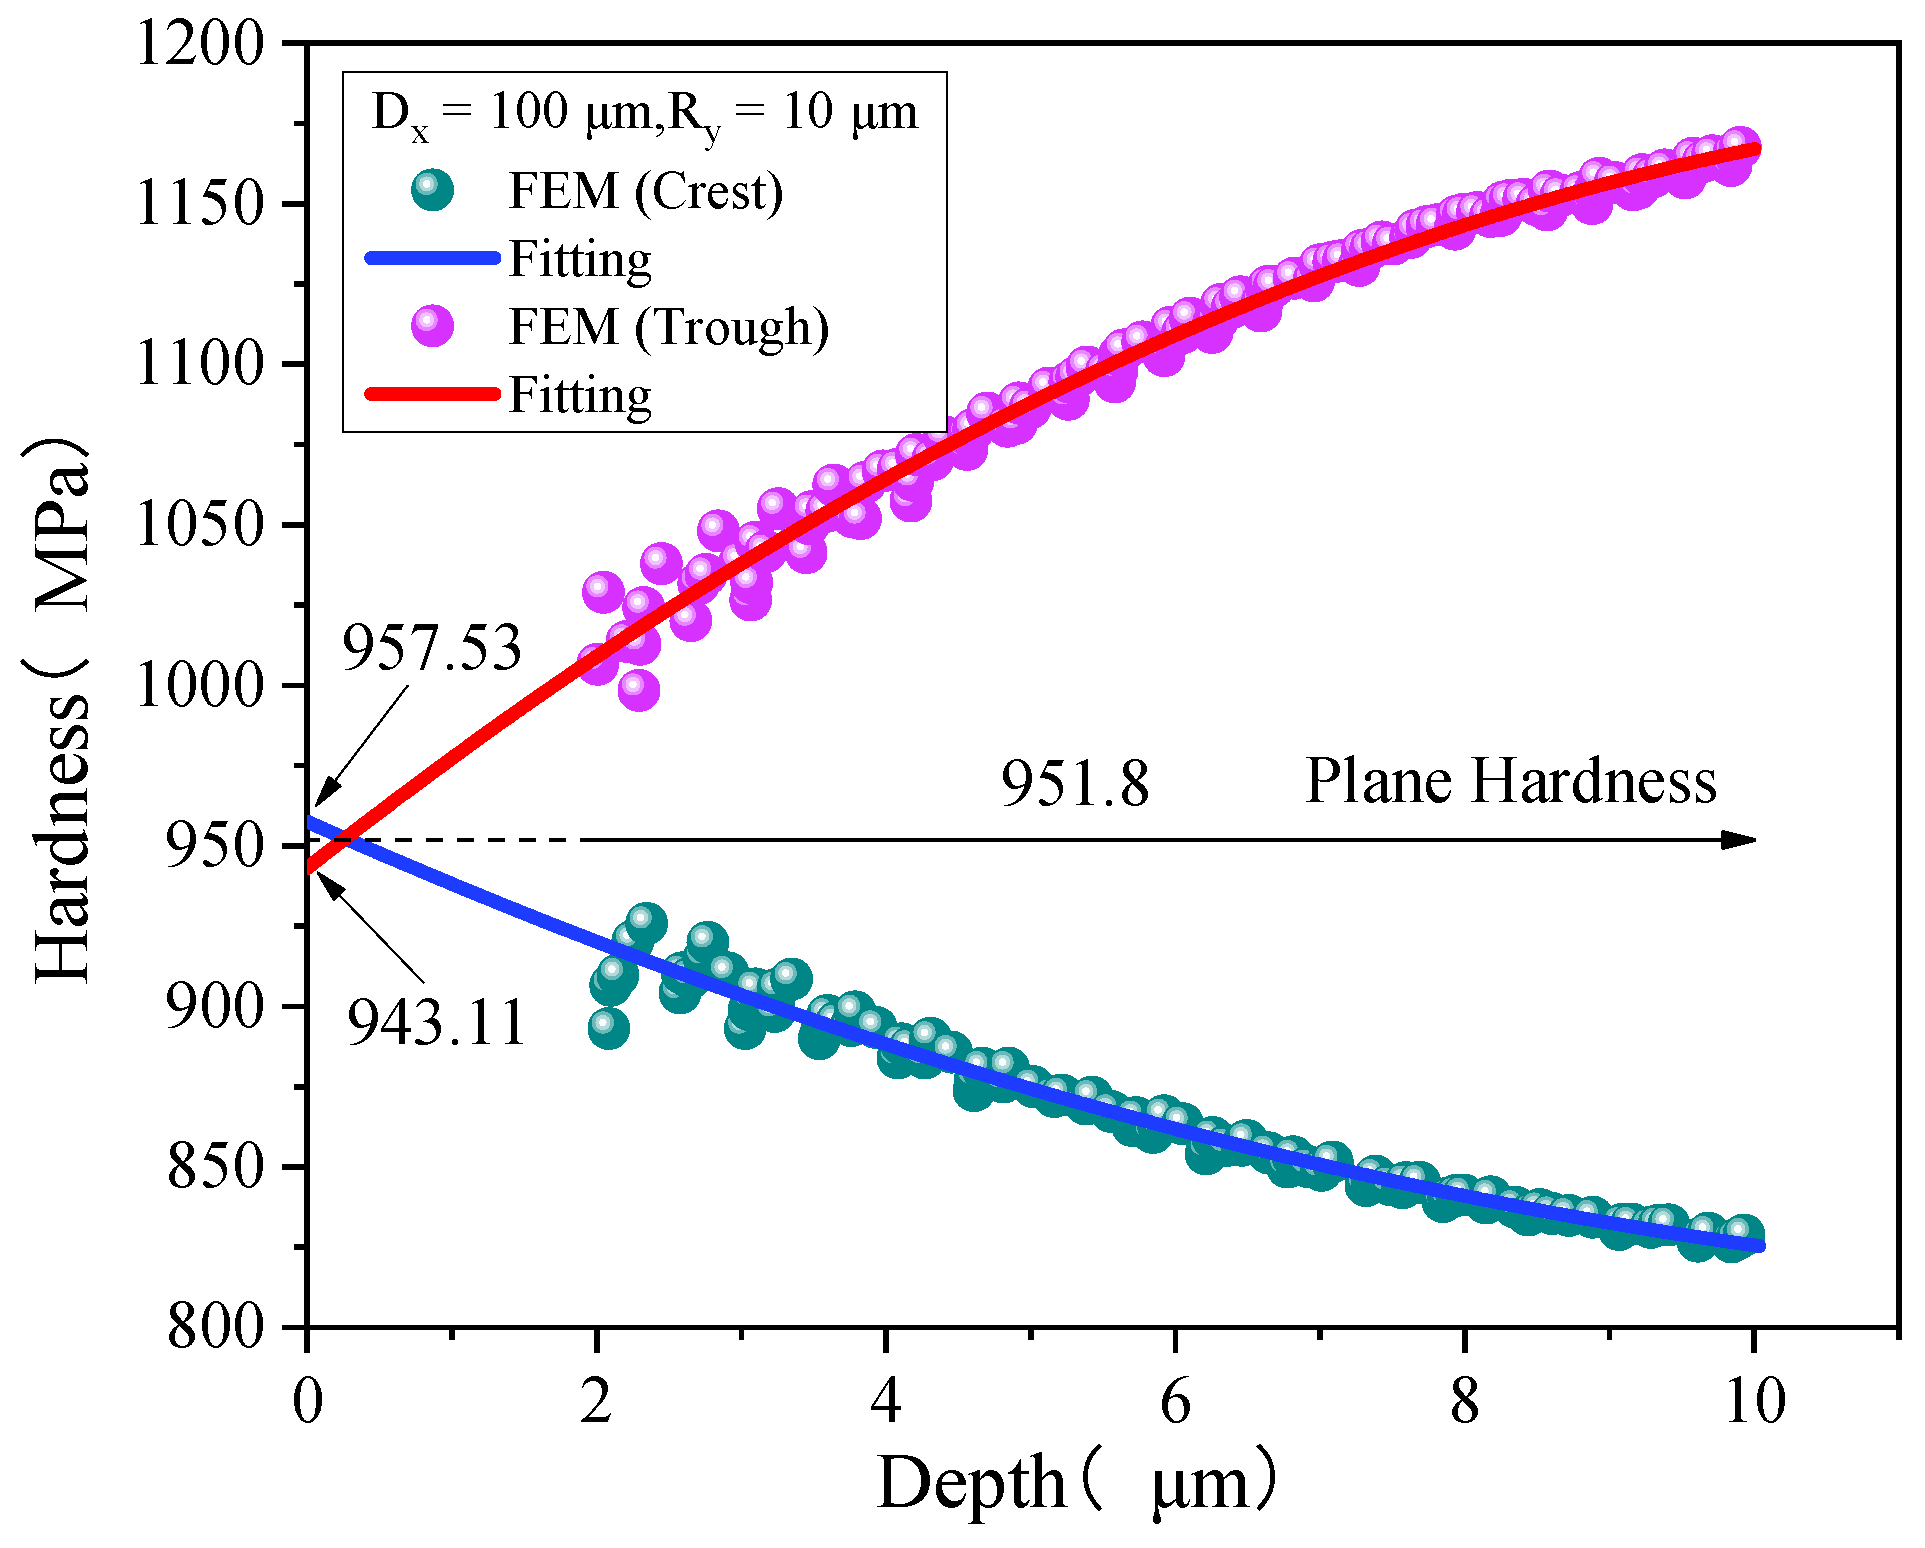
The regression results are shown in Figure 11. The measured hardness of indentation depths from 2 μm to 10 μm was regressed by quadratic polynomial fitting. When indentation depth was 0 μm, the regressed hardness of the crest was 957.53 MPa and the regressed hardness of the trough was 943.11 MPa. This suggested that the regressed hardness of the crest and trough approaches the true hardness of the smooth plane with decreasing depth.
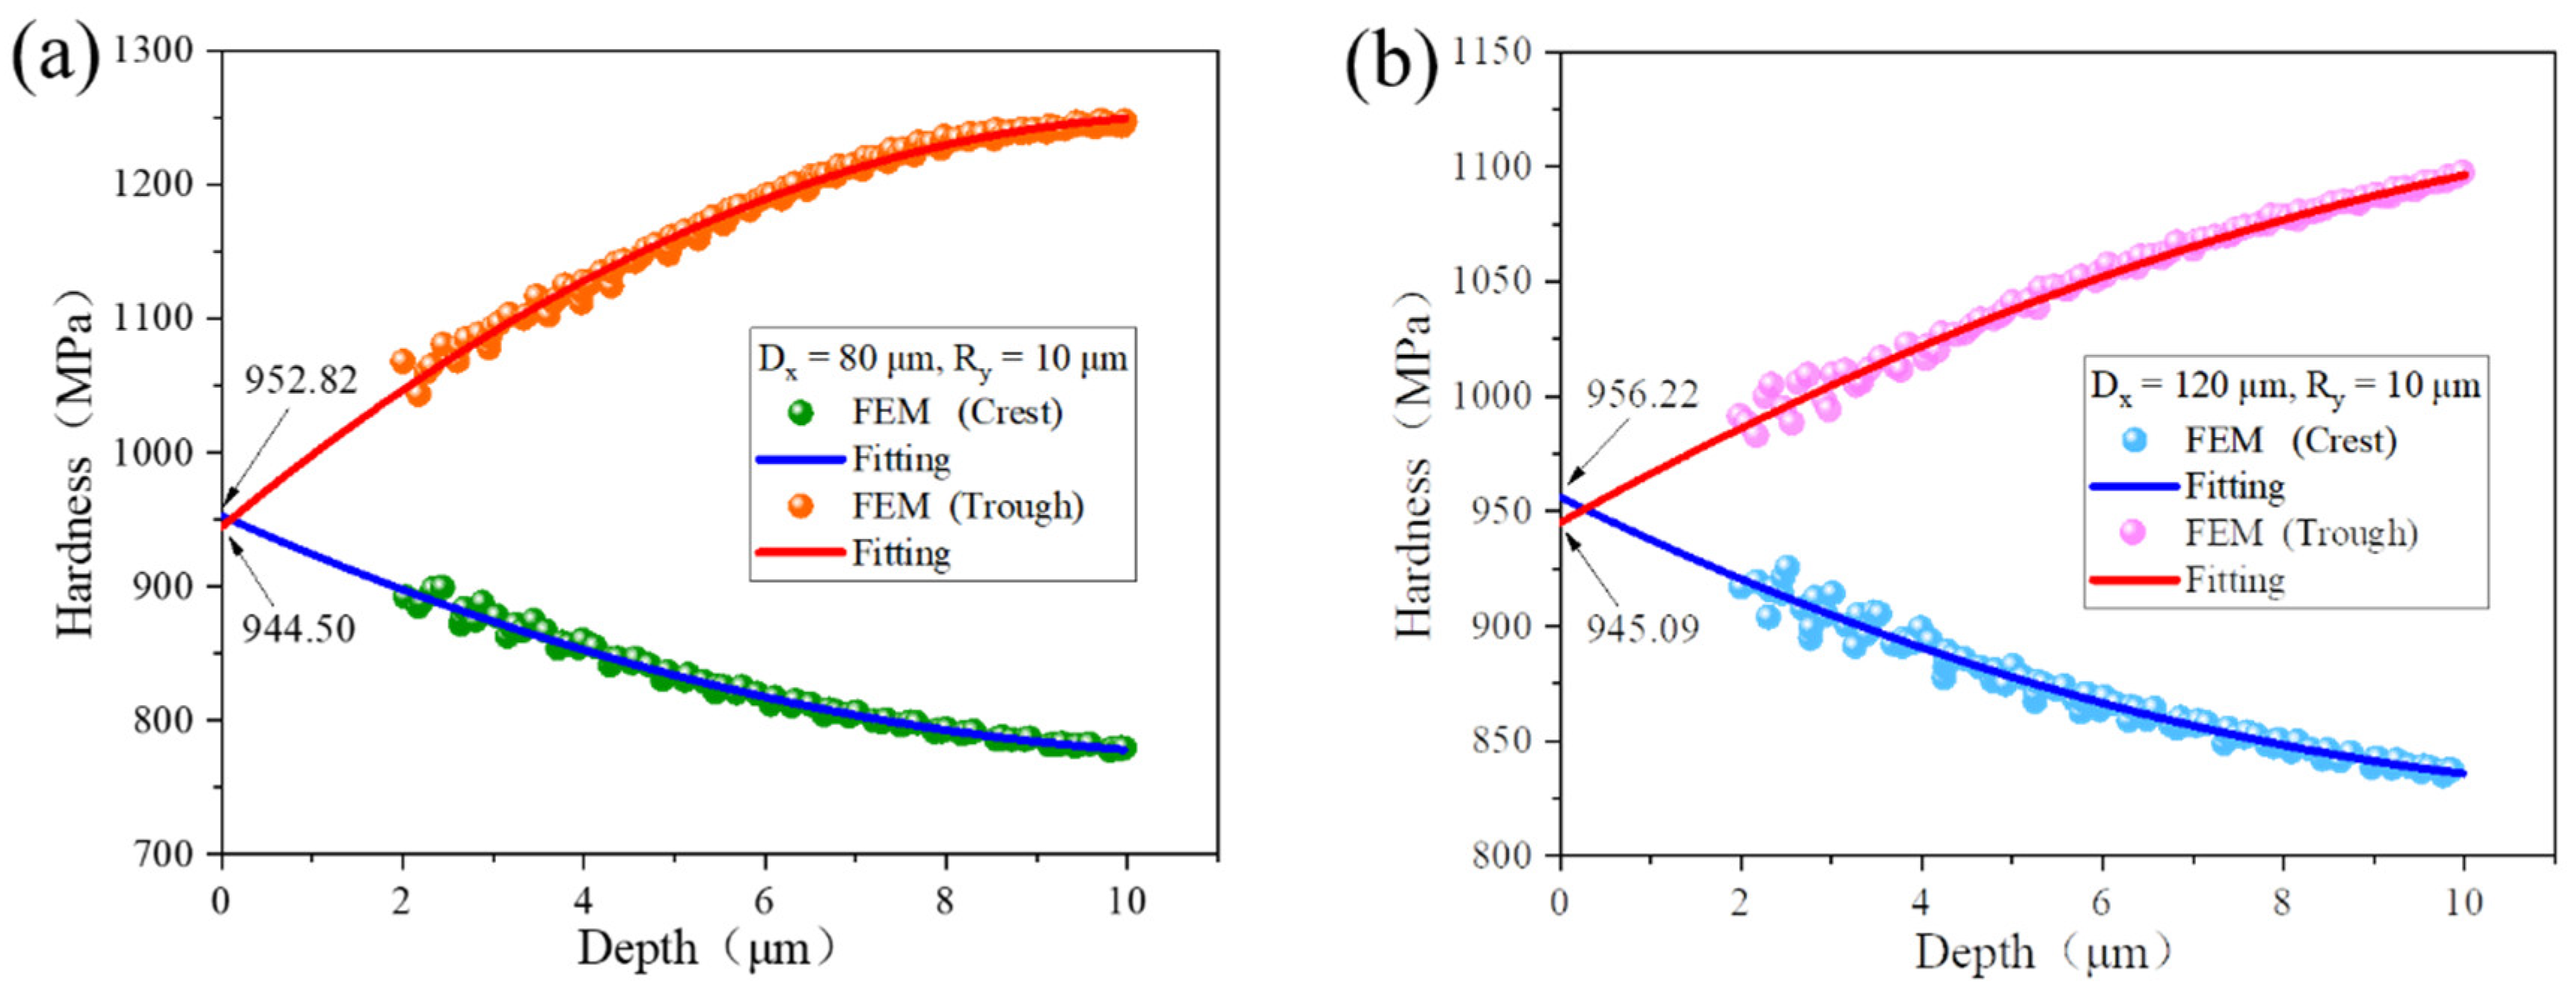
Then, we changed Dx and kept Ry constant to simulate indentation tests of different sinusoidal surfaces. Here, Dx = 80 μm, Ry = 10 μm, and Dx = 120 μm, Ry = 10 μm. The regression results are shown in Figure 12. From Figure 12a, the regressed hardness of the crest was 952.82 MPa and the regressed hardness of the trough was 944.50 MPa when the regressed depth was 0 μm. From Figure 12b, the regressed hardness of the crest was 956.22 MPa and the regressed hardness of the trough was 945.09 MPa when the regressed depth was 0 μm. These fitting curves converge to a point within a rather small depth, and the regression hardness approaches the true hardness of smooth plane.
The relative errors of the regressed hardness are shown in Table 2, which are all less than 1%. This demonstrates that our regression method can effectively eliminate hardness deviation resulting from the surface morphology of the samples.
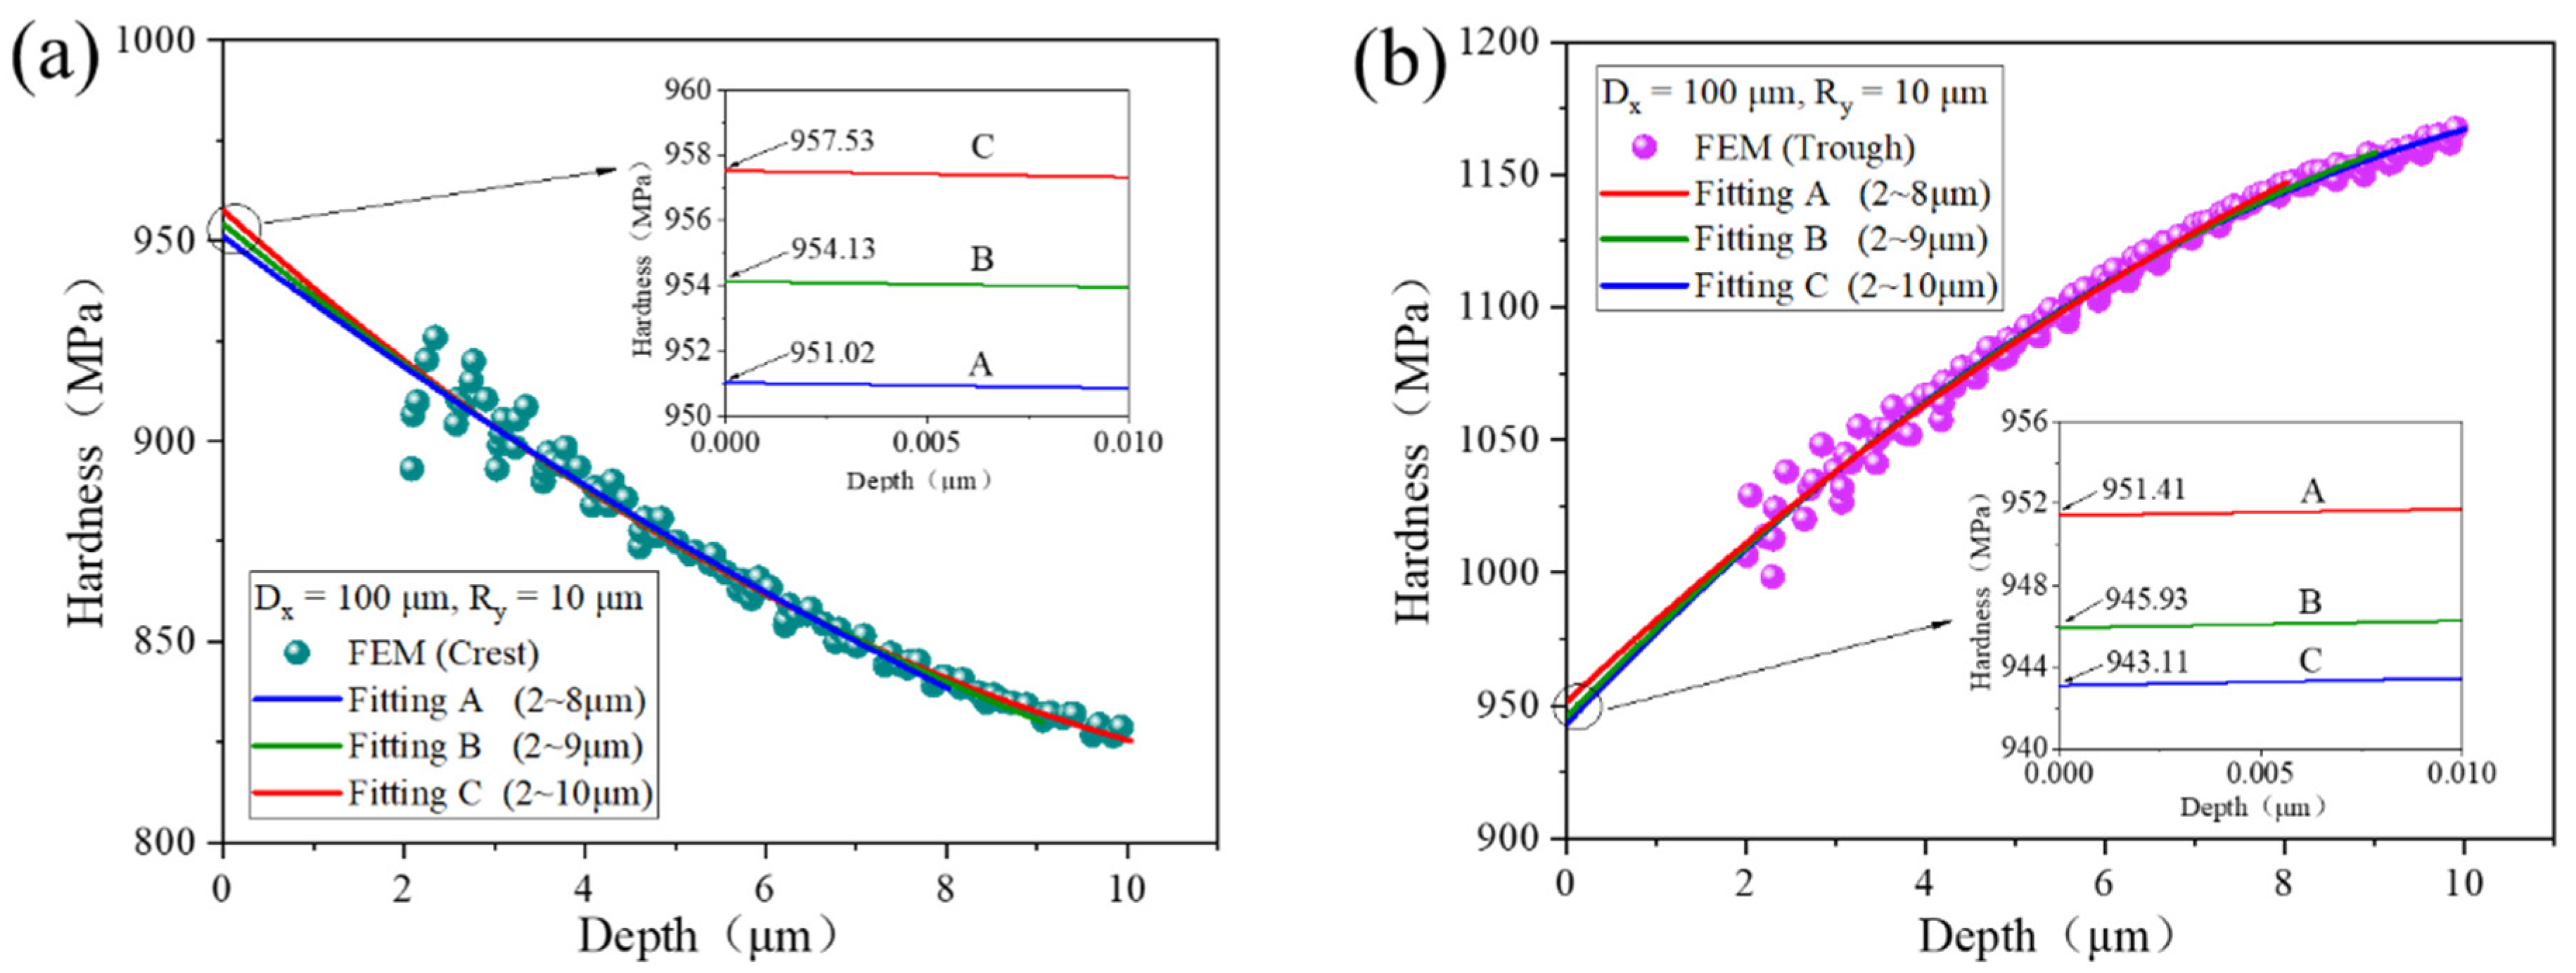
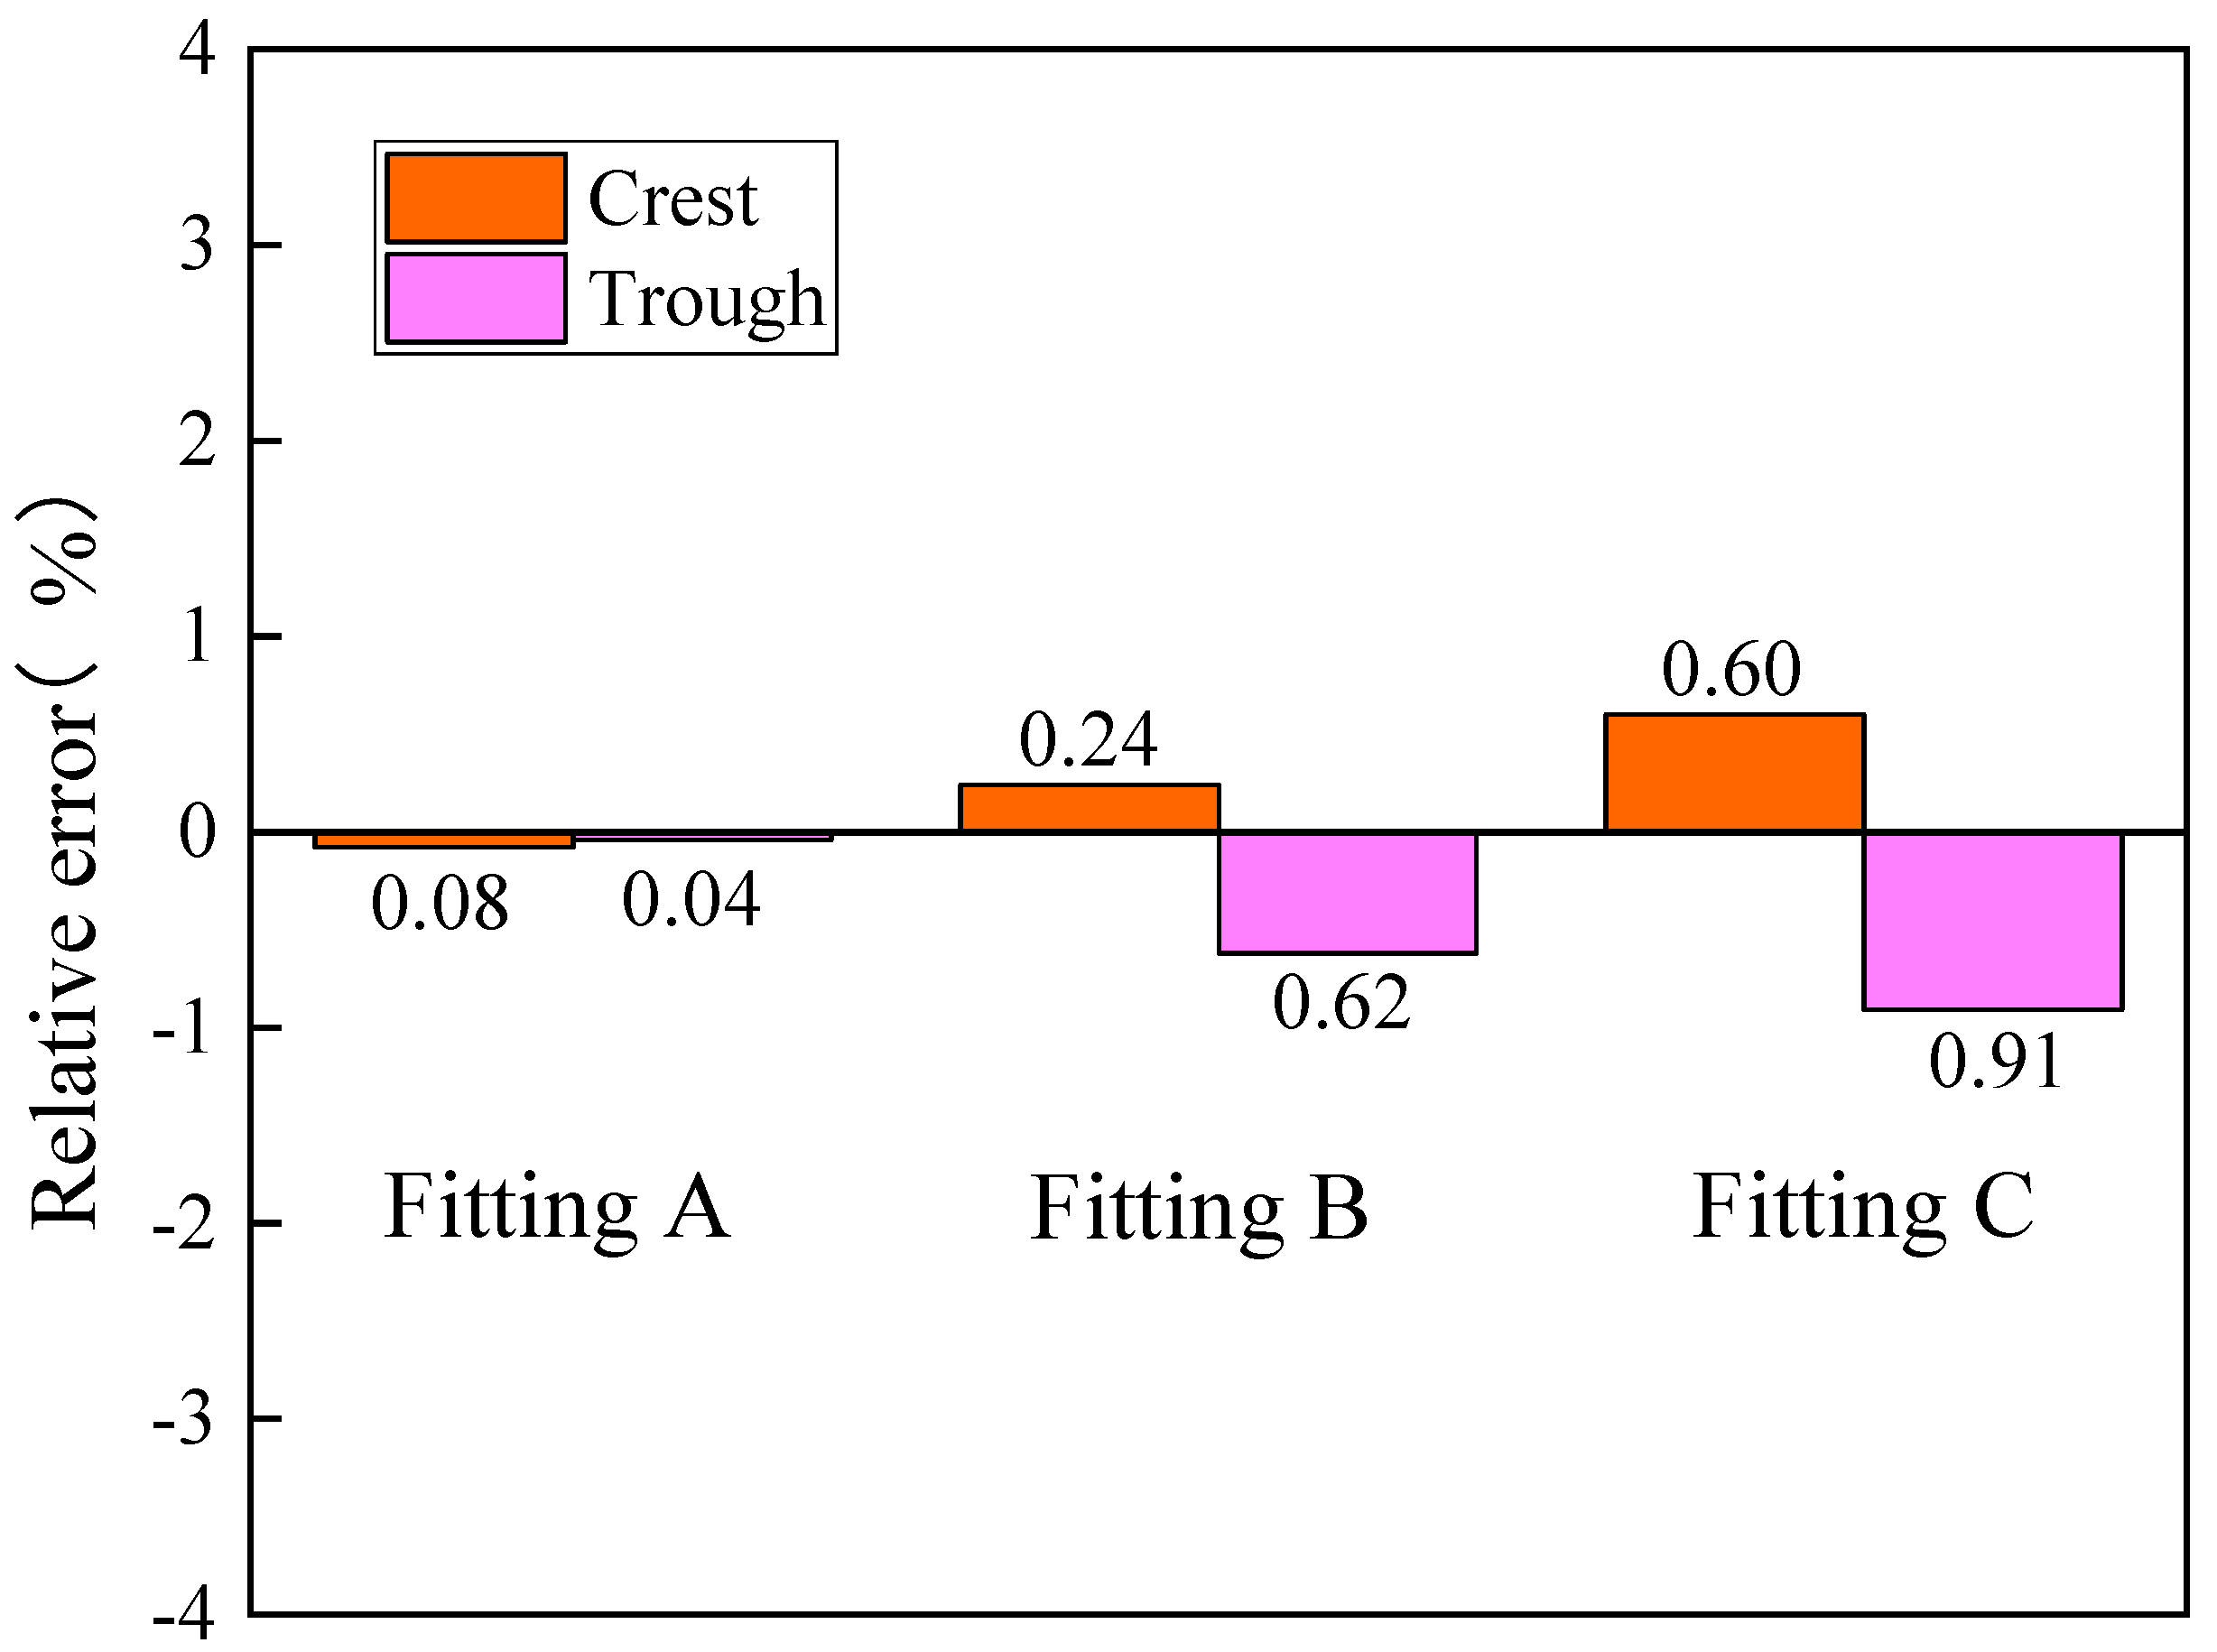
The measured hardness of the crest and trough was non-linear and presented a quadratic function with increasing depth. Therefore, we simply picked the initial monotonic section of the curves to fit. In this paper, because the profile height of the surface morphology was Dx = 10 μm, we suggested that the maximum fitting depth should not exceed 10 μm. Here, for the measured hardness of the crest and trough (Dx = 100, Ry = 10), we compared the regressed hardness for different fitting depths (from 2 μm to 8, 9, and 10 μm), as shown in Figure 13. One can find that all regressed hardness approaches the true hardness of the smooth surface when the indentation depth is small. From Figure 13a, when the depth is 0 μm, the regressed hardness of Fitting A is 951.02 MPa, the regressed hardness of Fitting B is 954.13 MPa, and the regressed hardness of Fitting C is 957.53 MPa. From Figure 13b, when the depth is 0 μm, the regressed hardness of Fitting A is 951.41 MPa, the regressed hardness of Fitting B is 945.93 MPa, and the regressed hardness of Fitting C is 943.11 MPa. The relative errors of regressed hardness were calculated as shown in Figure 14, which are all less than 1%. The results indicate that fitting ranges have little influence on the accuracy of regressed hardness. Thus, we suggest that fitting ranges should be selected within the characteristic size of the surface morphology.

4. Summary

In this study, we discussed the effect of the surface morphology of thin films on indentation hardness measurements. Given the insufficiency and limitation of traditional solutions, a new regression method was proposed to eliminate the influence of surface undulation. The method was validated by numerical simulation. The following conclusions are drawn:
An undulating surface consisting of crests and troughs can induce an inaccuracy in measured hardness. To be specific, the crests can lead to a decrease and then an increase in measured hardness with increasing indentation depth. The troughs can lead to an increase and then a decrease in measured hardness with increasing indentation depth.
Our regression method successfully eliminates the hardness deviation resulting from surface undulation and obtains accurate hardness with relative errors of less than 1%. This method is expressed as a reverse derivation of measured hardness through the quadratic polynomial fitting. The fitting scope of measured hardness should be determined by the characteristic size of the surface morphology.
The surface morphology of samples is not controllable, which leads to a significant measurement deviation in experiments. This study demonstrates that the reliable numerical method is beneficial to eliminate hardness deviation resulting from surface morphology. Furthermore, this regression method could be used to eliminate elastic modulus deviation. Since the elastic modulus is proportional to stiffness, the stiffness of crest positions is small, and the stiffness of trough positions is large. The elastic modulus measured on the sinusoidal surface has a similar change law with hardness. Thus, this method is theoretically applicable to eliminate measurement deviation in elastic modulus.
The regression method was developed to solve the problem of the surface morphology of thin films, independent of the thickness of thin films, and is also applicable to bulk materials. More importantly, this method breaks through the limitations of conventional methods, simplifies the experimental workload, and improves measurement accuracy, so that it is expected to be put into practice in the future.

Author Contributions

Conceptualization, W.Z., X.L.; investigation, X.L., W.Z., D.L., J.Z. and B.L.; methodology, W.Z.; resources, D.L. and J.Z.; supervision, W.Z.; validation, X.L.; visualization, X.L.; writing—original draft, X.L.; writing—review and editing, W.Z. All authors have read and agreed to the published version of the manuscript.

Funding

This work is supported by the National Natural Science Foundation of China or NSFC (Grant Nos. U21B2058, 11972025, 11772246), the National Science and Technology Major Project (2019-VII-0007-0147), the Innovative Scientific Program of CNNC (J202107006-025), in part by the Program for New Century Excellent Talents in University NCET-13-0466, and in part by the Natural Science Basic Research Plan in Shaanxi Province of China 2013GY2-14.

Institutional Review Board Statement

Not applicable.

Informed Consent Statement

Not applicable.

Data Availability Statement

Data is contained within the article.

Acknowledgments

WX Zhang acknowledges support from China Scholarship Council.

Conflicts of Interest

The authors declare no conflict of interest.

References

  1. Oliver, W.C.; Pharr, G.M. An improved technique for determining hardness and elastic modulus using load and displacement sensing indentation experiments. J. Mater. Res. 1992, 7, 1564–1583. [Google Scholar] [CrossRef]
  2. Oliver, W.C.; Pharr, G.M. Measurement of hardness and elastic modulus by instrumented indentation: Advances in understanding and refinements to methodology. J. Mater. Res. 2004, 19, 3–20. [Google Scholar] [CrossRef]
  3. Bhushan, B.; Li, X. Nanomechanical characterisation of solid surfaces and thin films. Int. Mater. Rev. 2003, 48, 125–164. [Google Scholar] [CrossRef]
  4. Chen, X.; Vlassak, J.J. Numerical study on the measurement of thin film mechanical properties by means of nanoindentation. J. Mater. Res. 2001, 16, 2974–2982. [Google Scholar] [CrossRef]
  5. Zhao, M.; Chen, X.; Xiang, Y.; Vlassak, J.J.; Lee, D.; Ogasawara, N.; Chiba, N.; Gan, Y.X. Measuring elastoplastic properties of thin films on an elastic substrate using sharp indentation. Acta Mater. 2007, 55, 6260–6274. [Google Scholar] [CrossRef]
  6. Wen, W.; Becker, A.A.; Sun, W. Determination of material properties of thin films and coatings using indentation tests: A review. J. Mater. Sci. 2017, 52, 12553–12573. [Google Scholar] [CrossRef]
  7. Zhang, Z.; Yao, P.; Wang, J.; Huang, C.; Zhu, H.; Liu, H.; Zou, B. Nanomechanical characterization of RB-SiC ceramics based on nanoindentation and modelling of the ground surface roughness. Ceram. Int. 2020, 46, 6243–6253. [Google Scholar] [CrossRef]
  8. Kim, J.-Y.; Lee, J.-J.; Lee, Y.-H.; Jang, J.-I.; Kwon, D. Surface roughness effect in instrumented indentation: A simple contact depth model and its verification. J. Mater. Res. 2006, 21, 2975–2978. [Google Scholar] [CrossRef]
  9. Marteau, J.; Bigerelle, M. Toward an understanding of the effect of surface roughness on instrumented indentation results. J. Mater. Sci. 2017, 52, 7239–7255. [Google Scholar] [CrossRef]
  10. Donnelly, E.; Baker, S.P.; Boskey, A.L.; van der Meulen, M.C. Effects of surface roughness and maximum load on the mechanical properties of cancellous bone measured by nanoindentation. J. Biomed. Mater. Res. Part A 2006, 77, 426–435. [Google Scholar] [CrossRef]
  11. Chung, S.; Yap, A. Effects of surface finish on indentation modulus and hardness of dental composite restoratives. Dent. Mater. 2005, 21, 1008–1016. [Google Scholar] [CrossRef] [PubMed]
  12. Jiang, W.-G.; Su, J.-J.; Feng, X.-Q. Effect of surface roughness on nanoindentation test of thin films. Eng. Fract. Mech. 2008, 75, 4965–4972. [Google Scholar] [CrossRef]
  13. Walter, C.; Antretter, T.; Daniel, R.; Mitterer, C. Finite element simulation of the effect of surface roughness on nanoindentation of thin films with spherical indenters. Surf. Coat. Technol. 2007, 202, 1103–1107. [Google Scholar] [CrossRef]
  14. Miller, M.; Bobko, C.; Vandamme, M.; Ulm, F.-J. Surface roughness criteria for cement paste nanoindentation. Cem. Concr. Res. 2008, 38, 467–476. [Google Scholar] [CrossRef]
  15. Cech, V.; Lasota, T.; Palesch, E.; Lukes, J. The critical influence of surface topography on nanoindentation measurements of a-SiC: H films. Surf. Coat. Technol. 2015, 261, 114–121. [Google Scholar] [CrossRef]
  16. Nazemian, M.; Chamani, M.; Baghani, M. A combined experimental and numerical study of the effect of surface roughness on nanoindentation. Int. J. Appl. Mech. 2019, 11, 1950070. [Google Scholar] [CrossRef]
  17. Kok, W.M.; Chuah, H.G.; How, H.G.; Teoh, Y.H.; Yee, H.M.; Tan, W.H. Quantifying geometrically necessary dislocation with surface roughness effect in copper (111) under indentation. Mater. Sci. Technol. 2022, 1–11. [Google Scholar] [CrossRef]
  18. Guo, Y.; Staedler, T.; Fu, H.; Heuser, S.; Jiang, X. A novel way to quantitatively determine the mechanical properties of thin films from the initial-grown surface by nanoindentation. Appl. Surf. Sci. 2019, 479, 253–259. [Google Scholar] [CrossRef]
  19. Campbell, A.C.; Buršíková, V.; Martinek, J.; Klapetek, P. Modeling the influence of roughness on nanoindentation data using finite element analysis. Int. J. Mech. Sci. 2019, 161, 105015. [Google Scholar] [CrossRef]
  20. Lv, B.; Xie, H.; Xu, R.; Fan, X.; Zhang, W.; Wang, T. Effects of sintering and mixed oxide growth on the interface cracking of air-plasma-sprayed thermal barrier coating system at high temperature. Appl. Surf. Sci. 2016, 360, 461–469. [Google Scholar] [CrossRef]
  21. Barber, J.R.; Ciavarella, M. Contact mechanics. Int. J. Solids Struct. 2000, 37, 29–43. [Google Scholar] [CrossRef]
  22. Chen, L.; Ahadi, A.; Zhou, J.; Ståhl, J.-E. Modeling effect of surface roughness on nanoindentation tests. Procedia CIRP 2013, 8, 334–339. [Google Scholar] [CrossRef]
  23. Xia, Y.; Bigerelle, M.; Marteau, J.; Mazeran, P.E.; Bouvier, S.; Iost, A. Effect of surface roughness in the determination of the mechanical properties of material using nanoindentation test. Scanning 2014, 36, 134–149. [Google Scholar] [CrossRef] [PubMed]
  24. Laurent-Brocq, M.; Béjanin, E.; Champion, Y. Influence of roughness and tilt on nanoindentation measurements: A quantitative model. Scanning 2015, 37, 350–360. [Google Scholar] [CrossRef] [PubMed]
  25. Bobji, M.; Biswas, S. Deconvolution of hardness from data obtained from nanoindentation of rough surfaces. J. Mater. Res. 1999, 14, 2259–2268. [Google Scholar] [CrossRef]
  26. Yang, W.H.; Srolovitz, D.J. Surface morphology evolution in stressed solids: Surface diffusion controlled crack initiation. J. Mech. Phys. Solids 1994, 42, 1551–1574. [Google Scholar] [CrossRef]
  27. Liu, J.L.; Feng, X.Q.; Yu, S.W. Morphology of liquid drops and thin films on a solid surface with sinusoidal microstructures. Acta Mech. Sin. 2006, 22, 315–322. [Google Scholar] [CrossRef]
  28. Chen, Z.; Diebels, S. Modelling and parameter re-identification of nanoindentation of soft polymers taking into account effects of surface roughness. Comput. Math. Appl. 2012, 64, 2775–2786. [Google Scholar] [CrossRef] [Green Version]
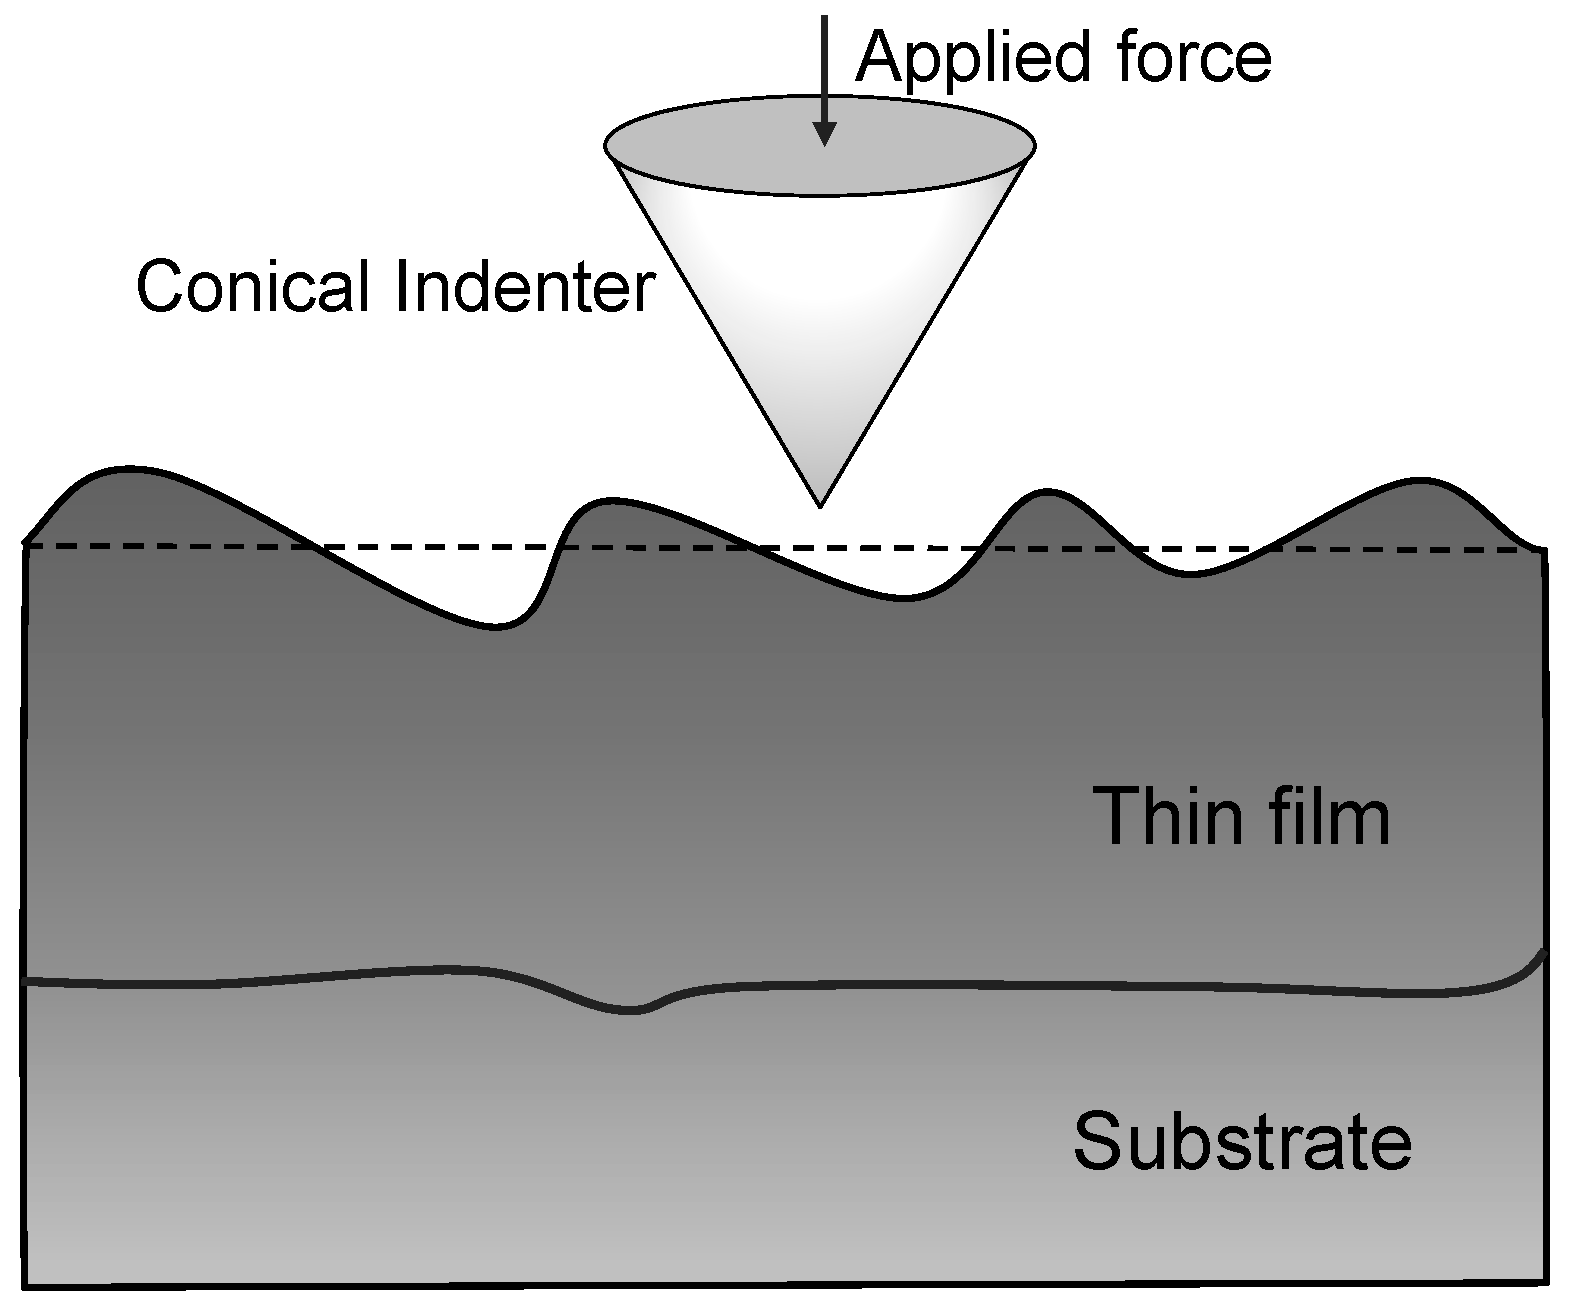
Figure 1. Schematic representation of indentation test on the undulating surface.
Coatings 12 01447 g001
Figure 2. (a) A schematic representation of loading and unloading in indentation tests. (b) Typical indentation load–depth curve with important measured parameters.
Coatings 12 01447 g002
Figure 3. Simplified schematic of heterogeneous surface morphology.
Coatings 12 01447 g003
Figure 4. Partial magnifications of contact positions on the two-dimensional sinusoidal surface.
Coatings 12 01447 g004
Figure 5. Schematic of meshing and assembly between indenter and sample.
Coatings 12 01447 g005
Figure 6. Partial magnification of contact positions. (a) smooth surface; (b) crest; (c) trough.
Coatings 12 01447 g006
Figure 7. Stress distribution of different contact positions between indenter and sample. (a) plane; (b) crest; (c) trough.
Coatings 12 01447 g007
Figure 8. Load–depth curves of different contact positions.
Coatings 12 01447 g008
Figure 9. Hardness–depth curves of different contact positions.
Coatings 12 01447 g009
Figure 10. Hardness–depth curve of a smooth plane. True hardness is 951.8 MPa. The relative calculation error of hardness is less than 1.8% when indentation depth is more than 2 μm.
Coatings 12 01447 g010
Figure 11. Hardness regression of crest and trough. The characteristic sizes of the sinusoidal surface are Dx = 100 μm and Ry = 10 μm.
Coatings 12 01447 g011
Figure 12. Hardness regression of crest and trough. (a) Dx = 80 μm and Ry = 10 μm; (b) Dx = 120 μm and Ry = 10 μm.
Coatings 12 01447 g012
Figure 13. Hardness regression of indentation depths from 2 μm to 8, 9, 10 μm; (a) Crest position. (b) Trough position.
Coatings 12 01447 g013
Figure 14. Relative errors of hardness regression. All relative errors of regressed hardness are less than 1%.
Coatings 12 01447 g014
Table 1. Constitutive parameters of thin film.
Thin FilmYoung’s ModulusPoisson’s RatioYield Strength
Parameters2.06 × 105 MPa0.28280 MPa
Table 2. Relative errors of regressed hardness.
Relative Errors (%)CrestTrough
Dx = 80 μm0.110.77
Dx = 100 μm0.600.91
Dx = 120 μm0.460.70
Publisher’s Note: MDPI stays neutral with regard to jurisdictional claims in published maps and institutional affiliations.