Article

Theoretical Analysis of Si2H6 Adsorption on Hydrogenated Silicon Surfaces for Fast Deposition Using Intermediate Pressure SiH4 Capacitively Coupled Plasma

1
Memory Thin Film Technology Team, Giheung Hwaseong Complex, Samsung Electronics, Hwasung 445-701, Korea
2
Department of Mechanical Engineering, Gachon University, 1342, Seongnam-daero, Sujeong-gu, Seongnam-si 13120, Gyeonggi-do, Korea
*
Author to whom correspondence should be addressed.
Coatings 2021, 11(9), 1041; https://doi.org/10.3390/coatings11091041
Submission received: 26 July 2021 / Revised: 19 August 2021 / Accepted: 26 August 2021 / Published: 29 August 2021
(This article belongs to the Special Issue Surface Modification by Plasma-Based Processes)

Abstract

:
The rapid and uniform growth of hydrogenated silicon (Si:H) films is essential for the manufacturing of future semiconductor devices; therefore, Si:H films are mainly deposited using SiH4-based plasmas. An increase in the pressure of the mixture gas has been demonstrated to increase the deposition rate in the SiH4-based plasmas. The fact that SiH4 more efficiently generates Si2H6 at higher gas pressures requires a theoretical investigation of the reactivity of Si2H6 on various surfaces. Therefore, we conducted first-principles density functional theory (DFT) calculations to understand the surface reactivity of Si2H6 on both hydrogenated (H-covered) Si(001) and Si(111) surfaces. The reactivity of Si2H6 molecules on hydrogenated Si surfaces was more energetically favorable than on clean Si surfaces. We also found that the hydrogenated Si(111) surface is the most efficient surface because the dissociation of Si2H6 on the hydrogenated Si(111) surface are thermodynamically and kinetically more favorable than those on the hydrogenated Si(001) surface. Finally, we simulated the SiH4/He capacitively coupled plasma (CCP) discharges for Si:H films deposition.

Graphical Abstract

1. Introduction

The most advanced production facilities in the semiconductor industry require technically complex and expensive reactors for the manufacturing of future semiconductor devices [1,2,3]. However, the acquisition of state-of-the-art reactors has had serious financial consequences for chip manufacturers when the production capacity needs to be expanded. Therefore, manufacturers have continuously targeted ways to enhance the efficiency of the production process. The thin film deposition process often meets various technical challenges related to coatings of functional layers [4]. Due to the ability to grow uniform films fast, plasma-enhanced chemical vapor deposition (PECVD) has been considered a mainstream production tool [5].
Hydrogenated silicon thin films (Si:H) are often deposited on Si substrates by PECVD [6]. Despite its long history of development, the PECVD of hydrogenated silicon is still considered a challenging area of research. In industrial applications, Si:H thin films are mainly deposited using the SiH4-based plasmas [7,8]. It is worthy to note that, in the plasma deposition process, optimization of the process window is often achieved under conditions of higher gas pressures (pg) [9,10]. For example, Isomura et al. [9] experimentally explored the feasibility of the high-pressure regime in the plasma silicon deposition. In the meantime, at higher gas pressure, SiH4-based plasma generates Si2H6 to a non-negligible degree. Si2H6 can be directly adsorbed onto Si surfaces to form SiHx species. This leads to the growth of a Si:H thin film with the release of H2 gas. Based thereupon, in several previous reports, it was observed that the Si2H6 adsorption promotes the Si:H deposition efficiency [11,12]. Thus, in-depth comprehension of the surface adsorption of Si2H6 at the atomic scale is required [12,13]. To achieve this purpose, in our previous study [14], it was theoretically investigated that Si2H6 on the clean Si(001) surface is the most efficient in deposition of Si:H thin films among SiH4 on the clean Si(001), Si2H6 on the clean Si(001), SiH4 on the clean Si(111) and Si2H6 on the clean Si(111).
The surface adsorption of Si2H6 has been investigated to establish whether dissociative adsorption occurs via Si-Si or Si-H bond cleavage. Several experiments have demonstrated that the mechanism for the Si2H6 dissociation into two SiH3 fragments is attributed to the cleavage of the weaker Si-Si molecular bond [15,16]. The initial step is commonly accepted to involve the decomposition of Si2H6 on Si(100)-(2 × 1) into two SiH3 fragments via Si-Si bond cleavage. However, alternatively, it was proposed also that the Si2H6 dissociation can occur primarily via Si-H bond cleavage [16,17,18]. Xia et al. [16] have elaborated an identical reaction probability variation for decomposition of both SiH4 and Si2H6 on Si(111)-(7 × 7) at high temperature (1173 K) under different gas kinetic conditions. They concluded that the Si2H6 precursors on silicon surfaces were decomposed via Si-H molecular bond cleavage at high incident energy and high temperature. Suemitsu et al. [17] suggested that the Si2H6 molecule is decomposed via cleavage of the Si-H bond. Further evidence based on in situ IR spectra was provided by Niwano et al. [18].
The mechanism whereby a Si:H thin film is grown from Si2H6 molecules has been extensively explored [11,15,19,20,21]; however, the theory regarding the overall reaction mechanism of Si2H6 on hydrogenated (H-covered) surfaces, including Si(001) and Si(111) surfaces, has not yet been reported. In this work, we have theoretically investigated the Si2H6 dissociation on these two different Si surfaces based on DFT calculations to understand the overall reactions. This theoretical investigation is necessary for further development of the Si deposition process because the surface reactivity of the molecule used for the deposition can significantly impact the growth of the subsequent layers.
Recently, Le et al. [22] claimed that the adsorption energy of the SiH4 molecule is higher on a H-covered Si(001) surface than on a clean Si(001) surface, and suggested that the surface species may become more stable in the presence of hydrogen. Unfortunately, their study did not take into account the surface reactivity of Si2H6, which is a highly important precursor for improving the throughput of Si deposition especially when using PECVD at intermediate pressure.
We additionally elucidated the two reaction paths of Si2H6, i.e., those related to the cleavage of both the Si-Si and Si-H molecular bonds. We expected a comparative analysis of the overall reaction mechanisms of the Si precursors on two different H-50% covered Si surfaces to provide insight into improving the growth rate of Si:H thin films for the mass production of Si-based devices in future. In addition, we attempted to clarify the effect of the gas pressure: we employed the discharge modeling to study the deposition of Si:H with SiH4/He capacitively coupled plasma (CCP). Based on the results of the plasma simulation, we hypothesized that understanding the adsorption mechanisms of Si2H6 would provide insight into understanding the way in which the reactivity could improve the growth rate of Si:H thin films.
The numerical methods and experimental details are briefly introduced in Section 2. The simulation results are provided in Section 3. In Section 4, we discuss Si2H6 surface reactivities and deposition rate profiles, and finally, the conclusion is provided in Section 5.

2. Materials and Methods

2.1. DFT Calculations

In this study, all DFT calculations were carried out using the Vienna ab initio simulation package (VASP) program with the Perdew-Burke-Ernzerhof (PBE) functional in the generalized gradient approximation (GGA) [23,24]. Details of DFT calculations were provided in our previous report [14]. We searched for the most probable hydrogen configurations (see Figure 1 and Figure 2) in the top layer of the H-50% covered Si(001) and H-50% covered Si(111) surfaces. Thus, the H-50% covered Si(001)-(4 × 4) and H-50% covered Si(111)-(4 × 4) surfaces were employed (see Figure 3 and Figure 4) to reduce the molecular interactions between the inter-unit cells by using a cell size twice as large as that of (4 × 2). Each slab consists of six atomic layers for all Si surfaces. As shown in Figure 3 and Figure 4, we considered two geometries and 10 positions for the Si2H6 on the H-50% covered Si(001) surface, whereas for the H-50% covered Si(111) surface, we used two geometries for Si2H6 together with six positions. The complete details of these cases are available in Electronic Supplementary Information (ESI).
The calculated lattice parameter of bulk Si was a0 = 2.368 Å, which corresponds well with the experimental value (a0 = 2.351 Å) [25]. For the surfaces we considered, namely the H-50% covered Si(001) and Si(111) surfaces, vacuum gaps with sizes of 18.8 Å and 19.3 Å were inserted in the z-direction to avoid interactions between adjacent slabs. The dangling bonds of the bottom layer of all the surfaces were terminated by hydrogen atoms to avoid reconstruction of the structure. The three bottom layers of all surfaces containing the terminated hydrogen atoms were kept fixed during structural relaxation in all DFT calculations.

2.2. Plasma Discharge Simulations

Particulars of the plasma discharge model were presented in our previous reports [26,27,28,29,30]; therefore, details are omitted here. Only equations about the electron density and flux balances are shown below:
n e t + J e = S e
J e = D e n e + μ e n e ϕ
Here, ne, t, Je, Se, De, μe and ϕ represent the electron density, time, electron flux, source of the electrons, electron diffusion coefficient, electron mobility and electric potential, respectively.
In this study, we used CFD-ACE+ software [31]. The Scharfetter-Gummel exponential scheme was adopted in both the electron and electron energy conservation equations. We calculated both the electron transport coefficients and the electron impact reaction rates, by solving the 0D Boltzmann equation.

2.3. Experimental Details

The experimental setup and methodology were described in detail in our previous studies [28,29,30]. By using an ellipsometer and an X-ray diffractometer, we measured the properties of the Si:H layer experimentally. We measured the film densities of the Si:H layer (ρSi), and the film densities were used to numerically estimate the deposition rates in the simulations: at the heater temperature of 673 K, ρSi was 2.32 g cm−3. By using an ellipsometer, film thicknesses were measured. To simulate surface depositions, by referring to the surface fluxes of silicon-containing radicals (SixHy), a sticking model was applied as similarly performed in previous studies [28,29,30]. Sticking coefficients of radicals were adopted from other groups’ experimental data [32,33].

3. Results

In Figure 5, due to the cylindrical shape of our reactor, computational domain was set in the r-z plane, where r represents the radial coordinate and z represents the axial coordinate. The left boundary denotes the axis, whereas the right boundary denotes the sidewall. The showerhead acts as a radio frequency (RF; 13.56 MHz)-powered electrode. The thin film is deposited on the heater (a grounded electrode). The gas mixture is fed through the showerhead inlet. Note that, in this study, due to the high computational cost, CCP discharge simulations were performed in a two-dimensional simplified geometry. In fact, since the showerhead has many very small holes to disperse the gas mixture uniformly into the discharge volume, the showerhead has a complex structure, which should be considered in a three-dimensional geometry. However, the gas mixture fed through the showerhead was assumed to have radially uniform density and temperature distributions in the showerhead inlet, as similarly assumed in other groups’ previous reports about CCP simulations [34,35,36].
The following input conditions were specified for all cases: the SiH4 flow rate was set to 50 sccm, the He flow rate was set to 5000 sccm, the input power was set to 100 W, the electrode spacing (d) was set to 15 mm and the temperatures of the showerhead (Tsh), sidewall (Tsw) and heater (Ts) were set to 473 K, 423 K and 673 K, respectively. The spatial variation in the gas temperature (Tg) is depicted in Figure 5a. Finally, Figure 5b,c show that H2 and H densities are spatially altered, respectively.

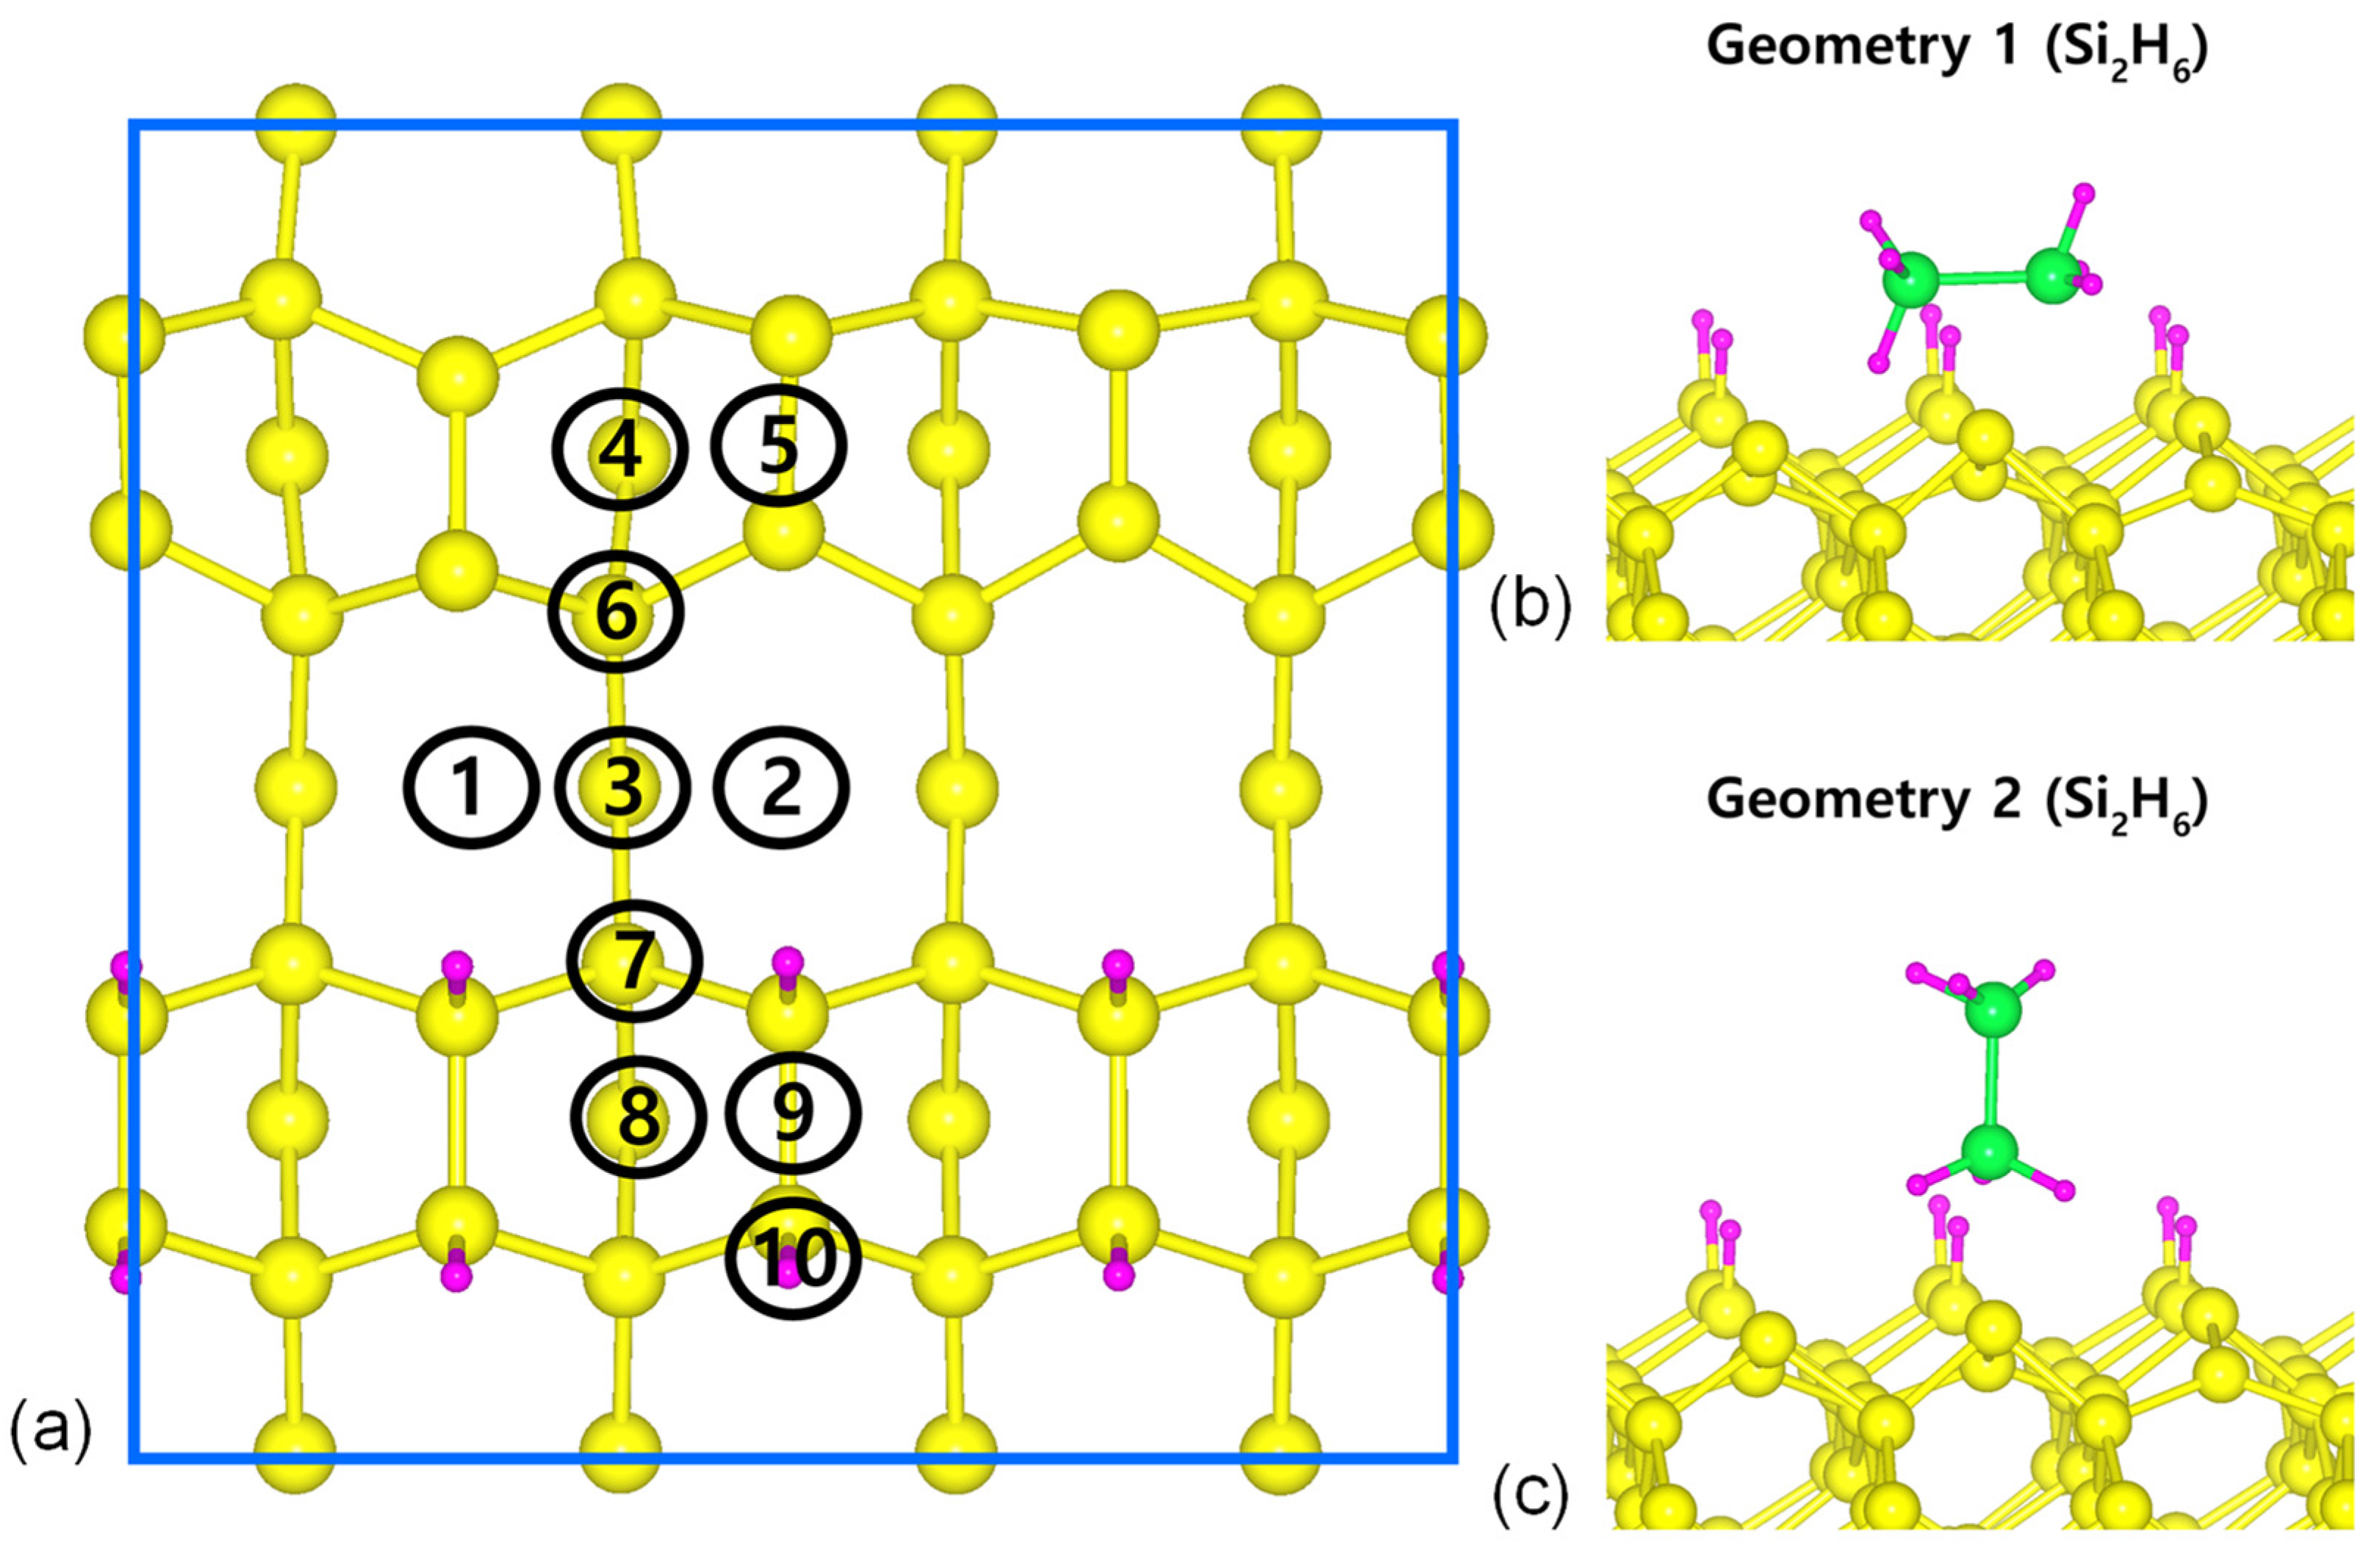
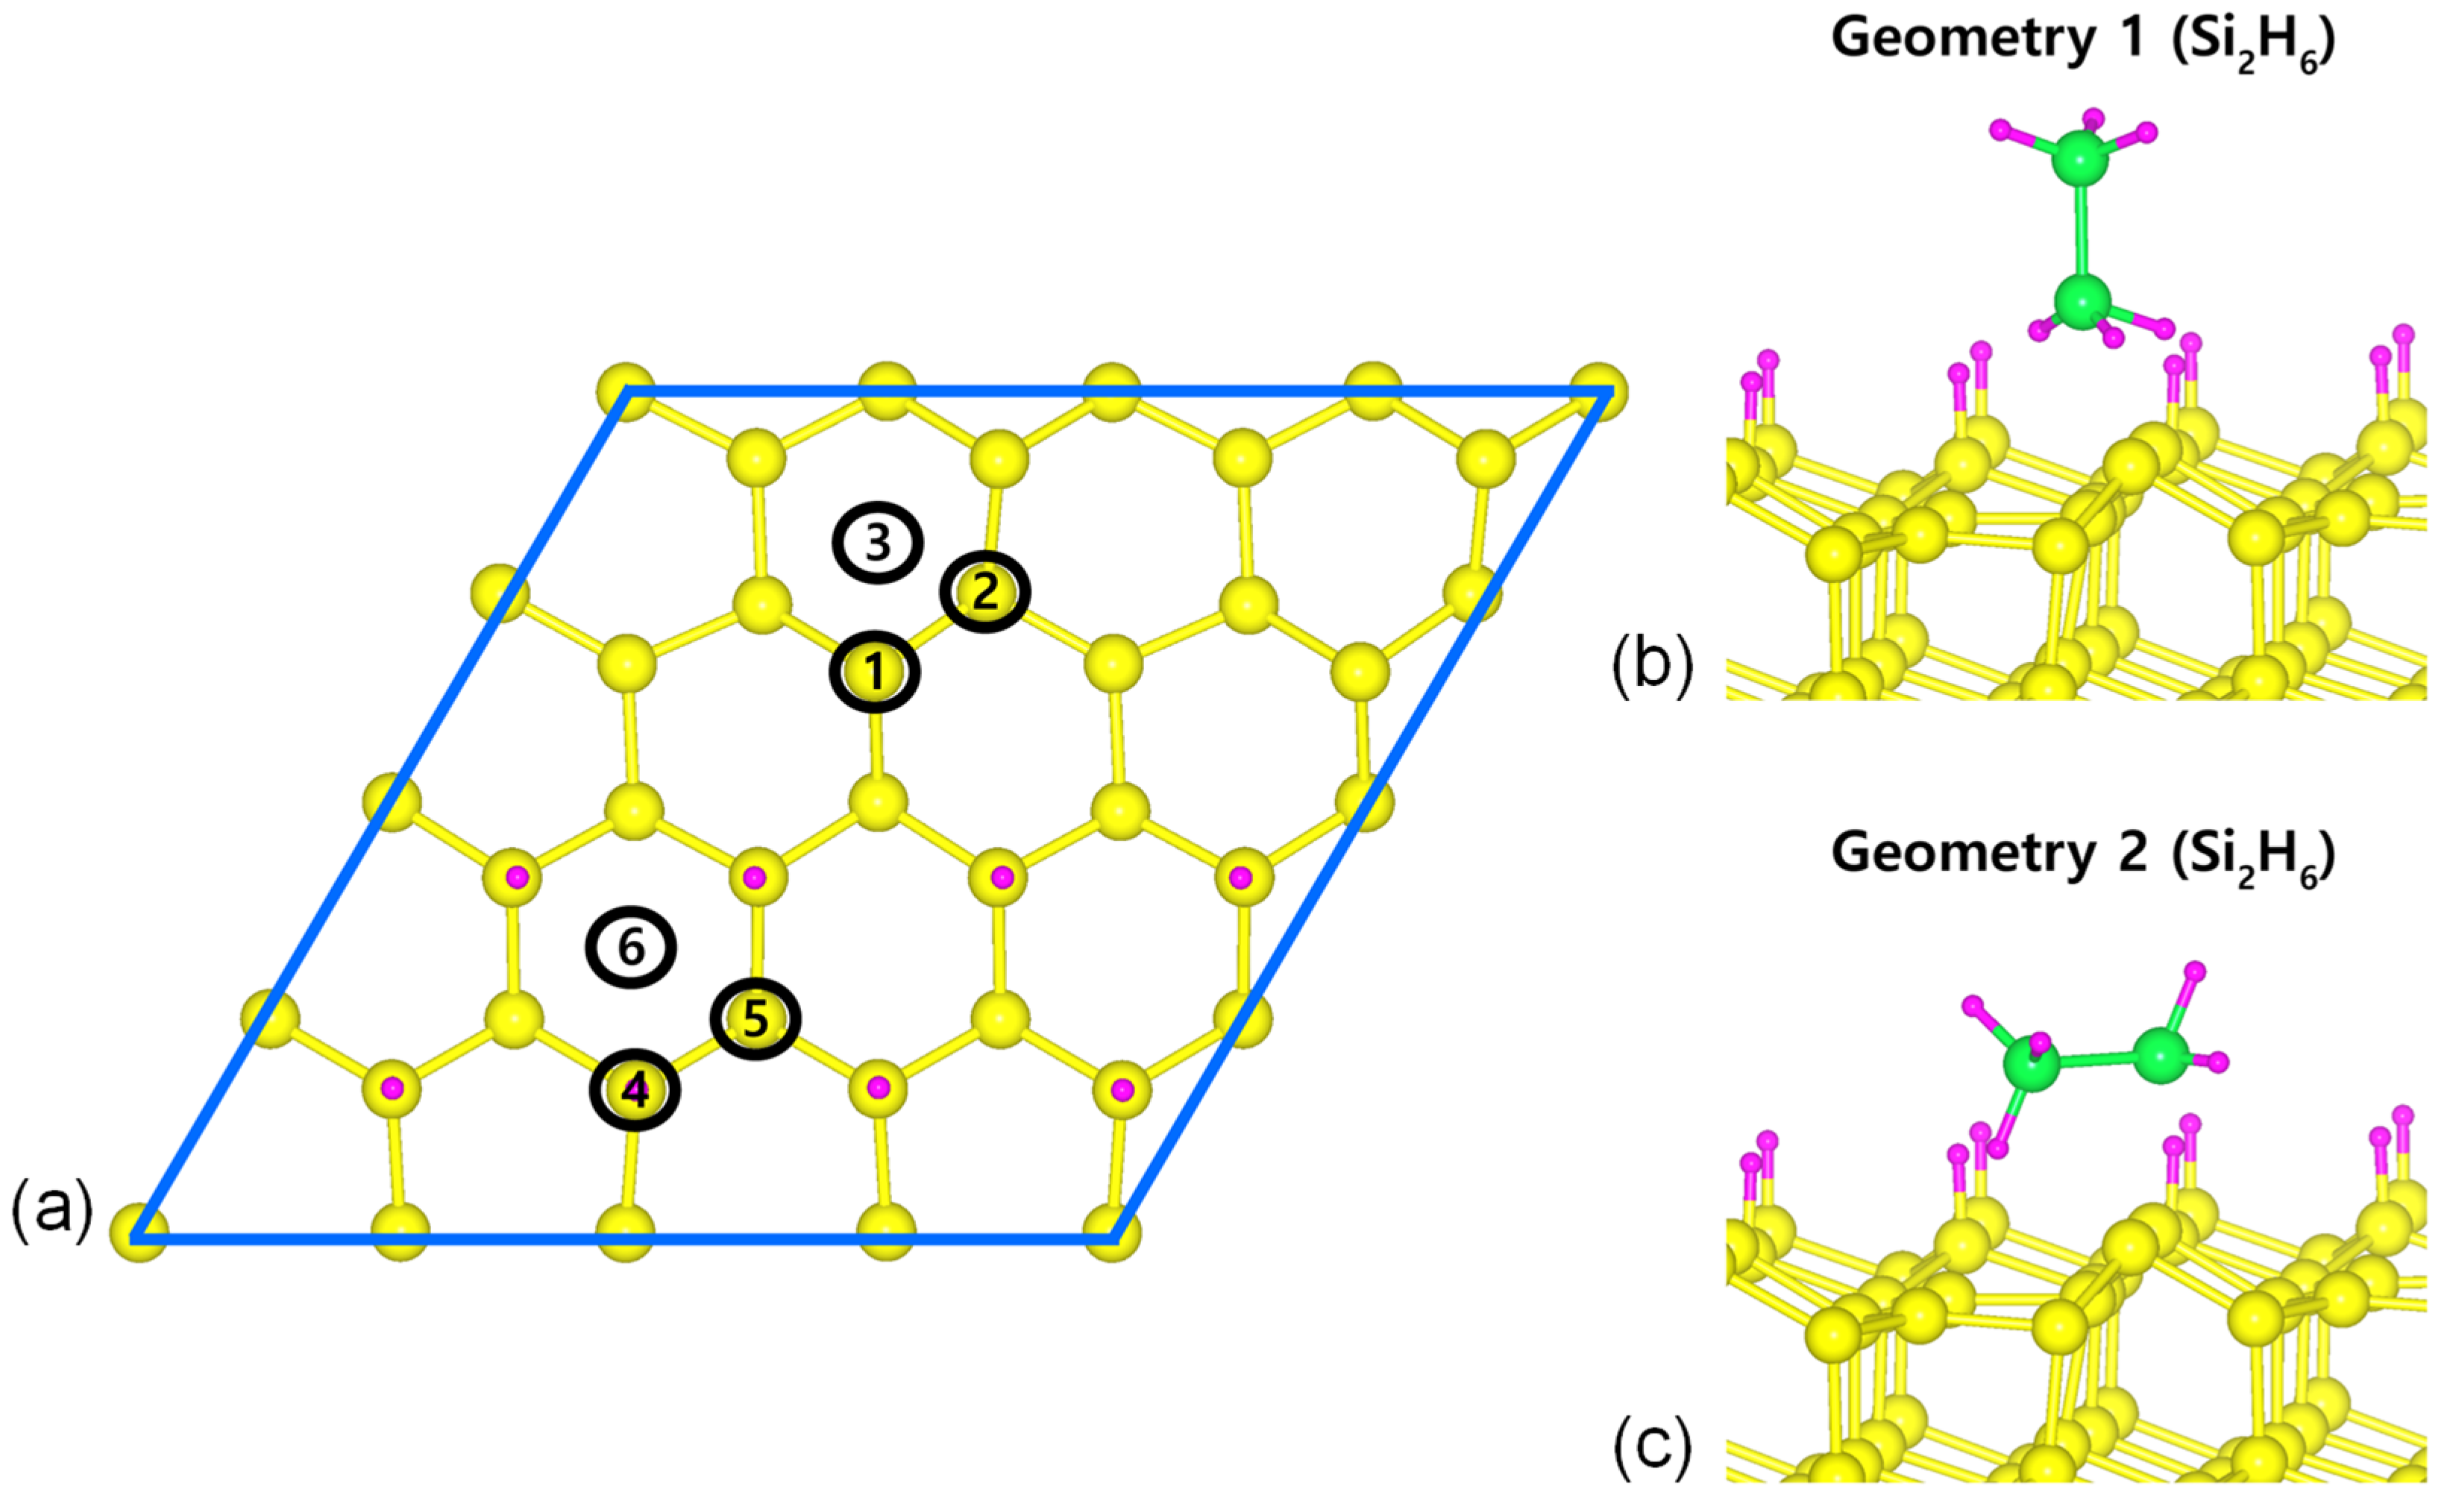
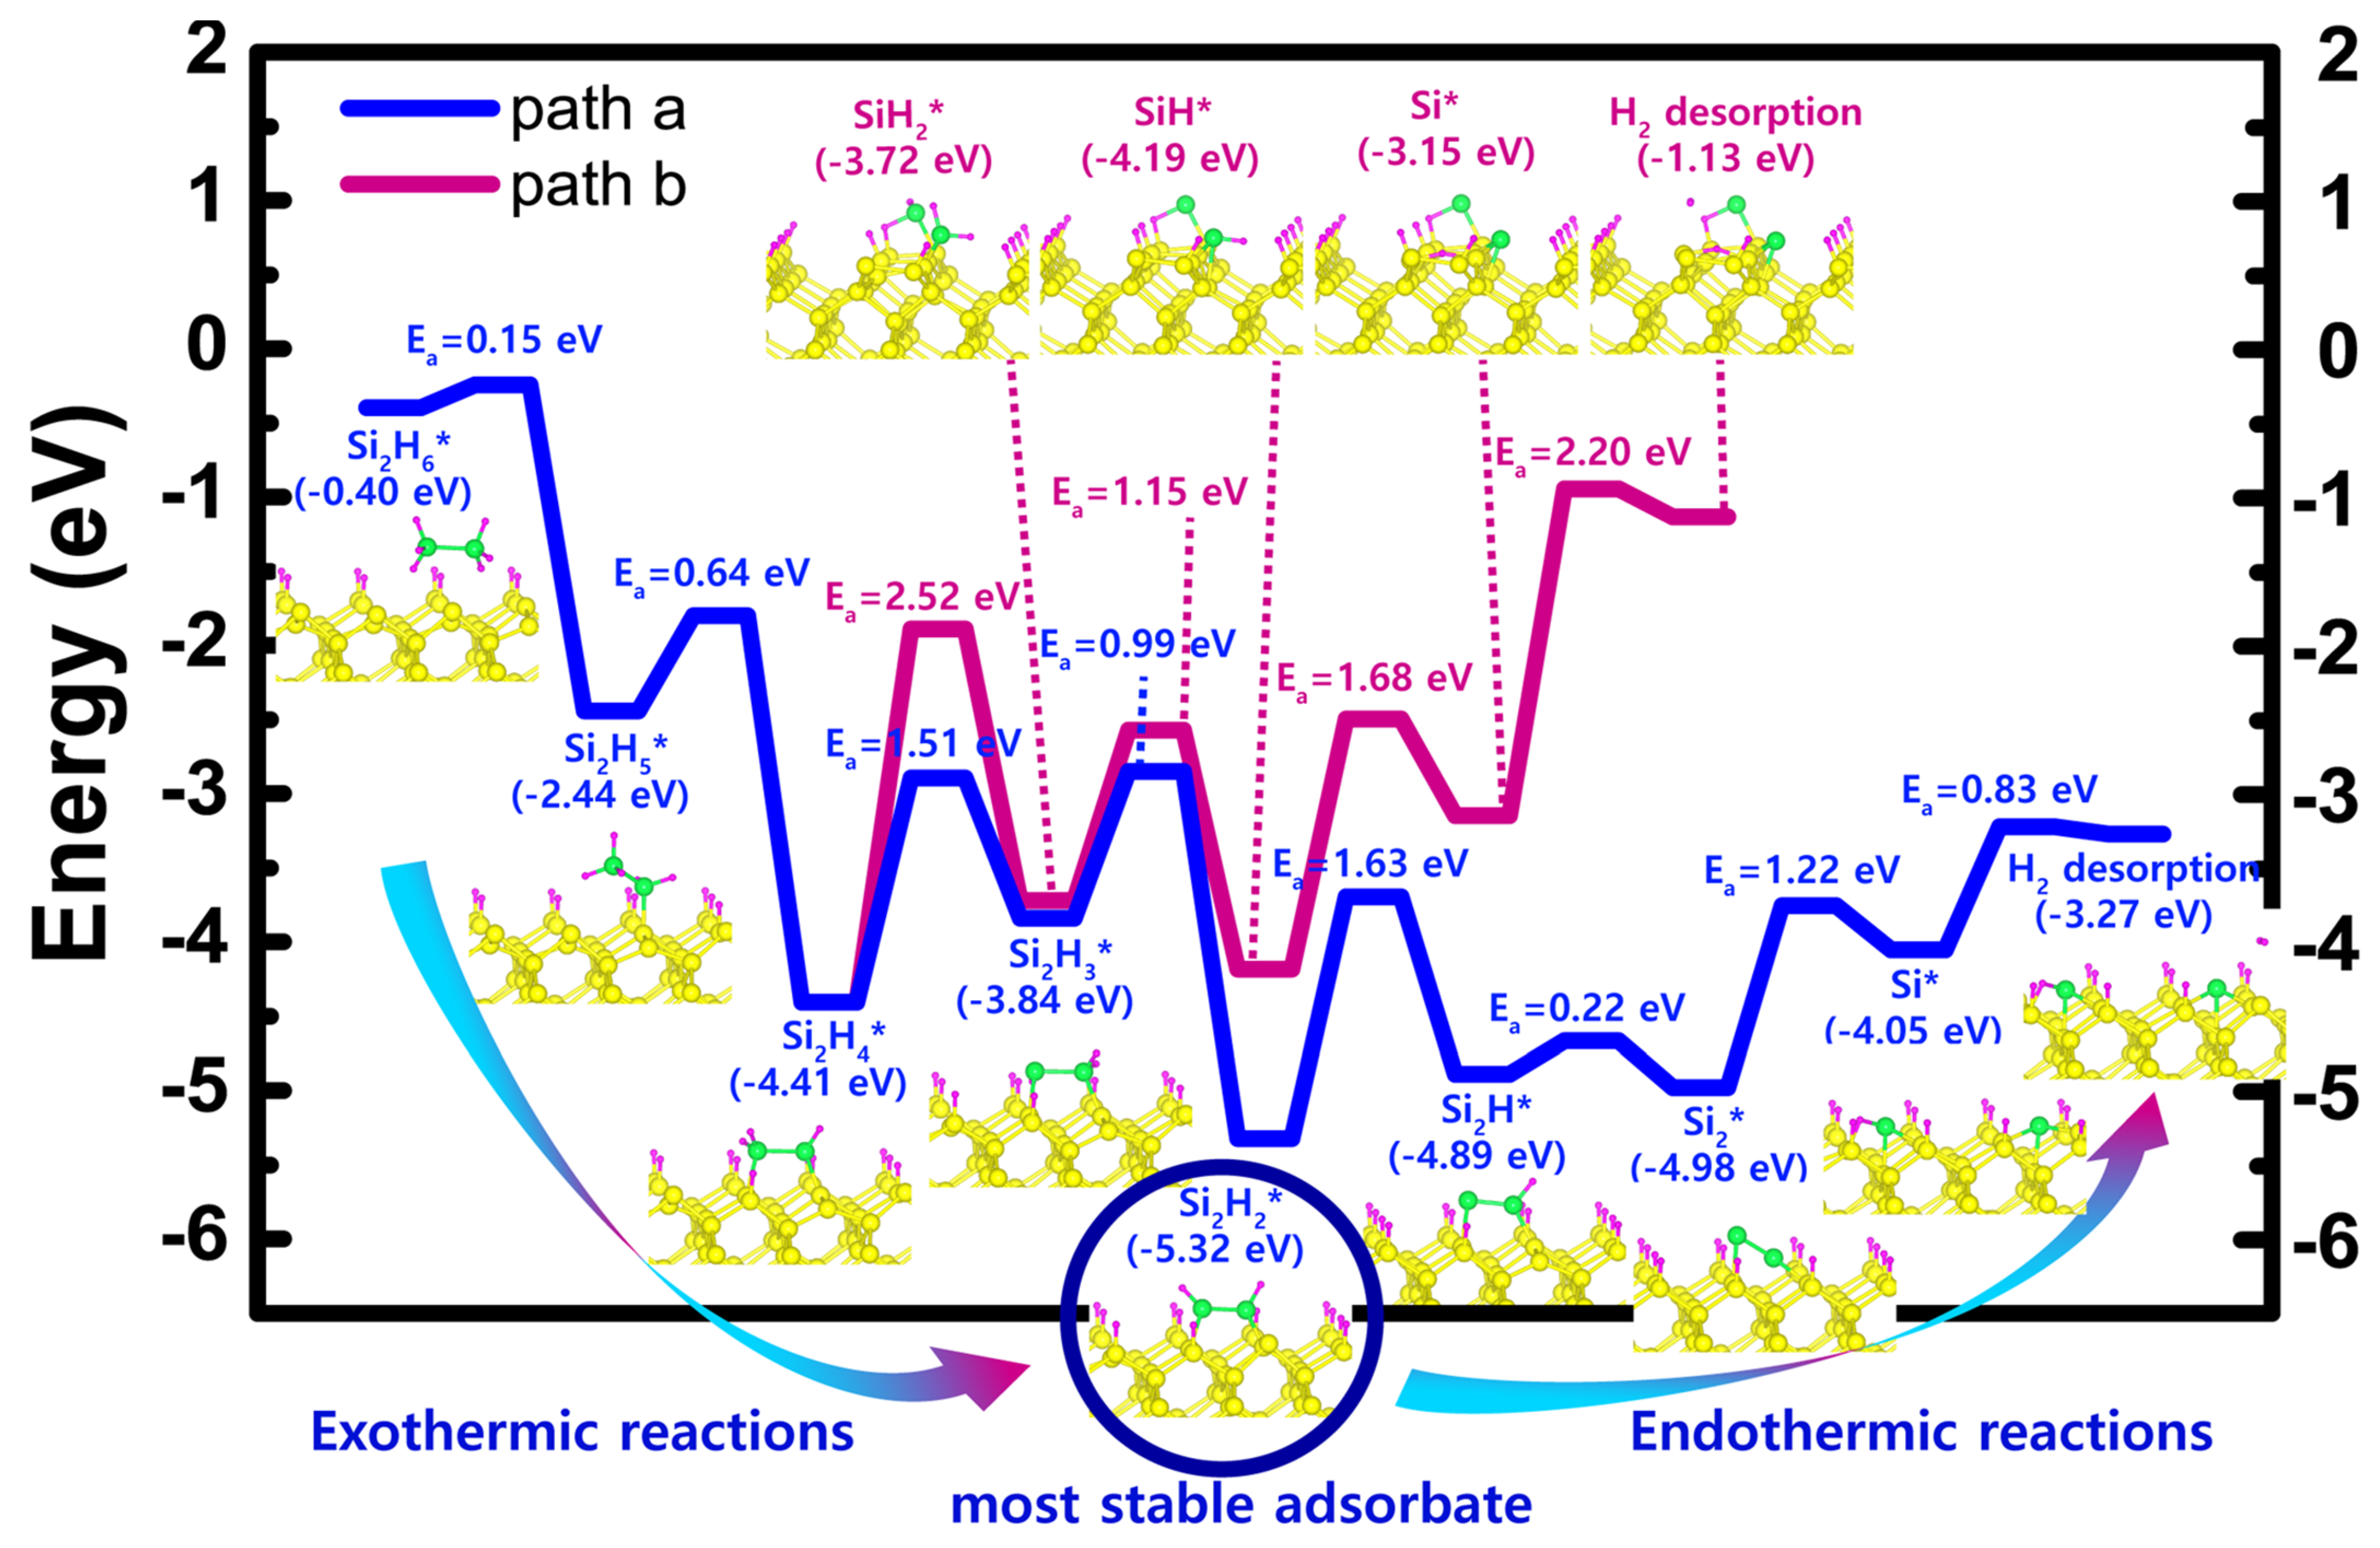
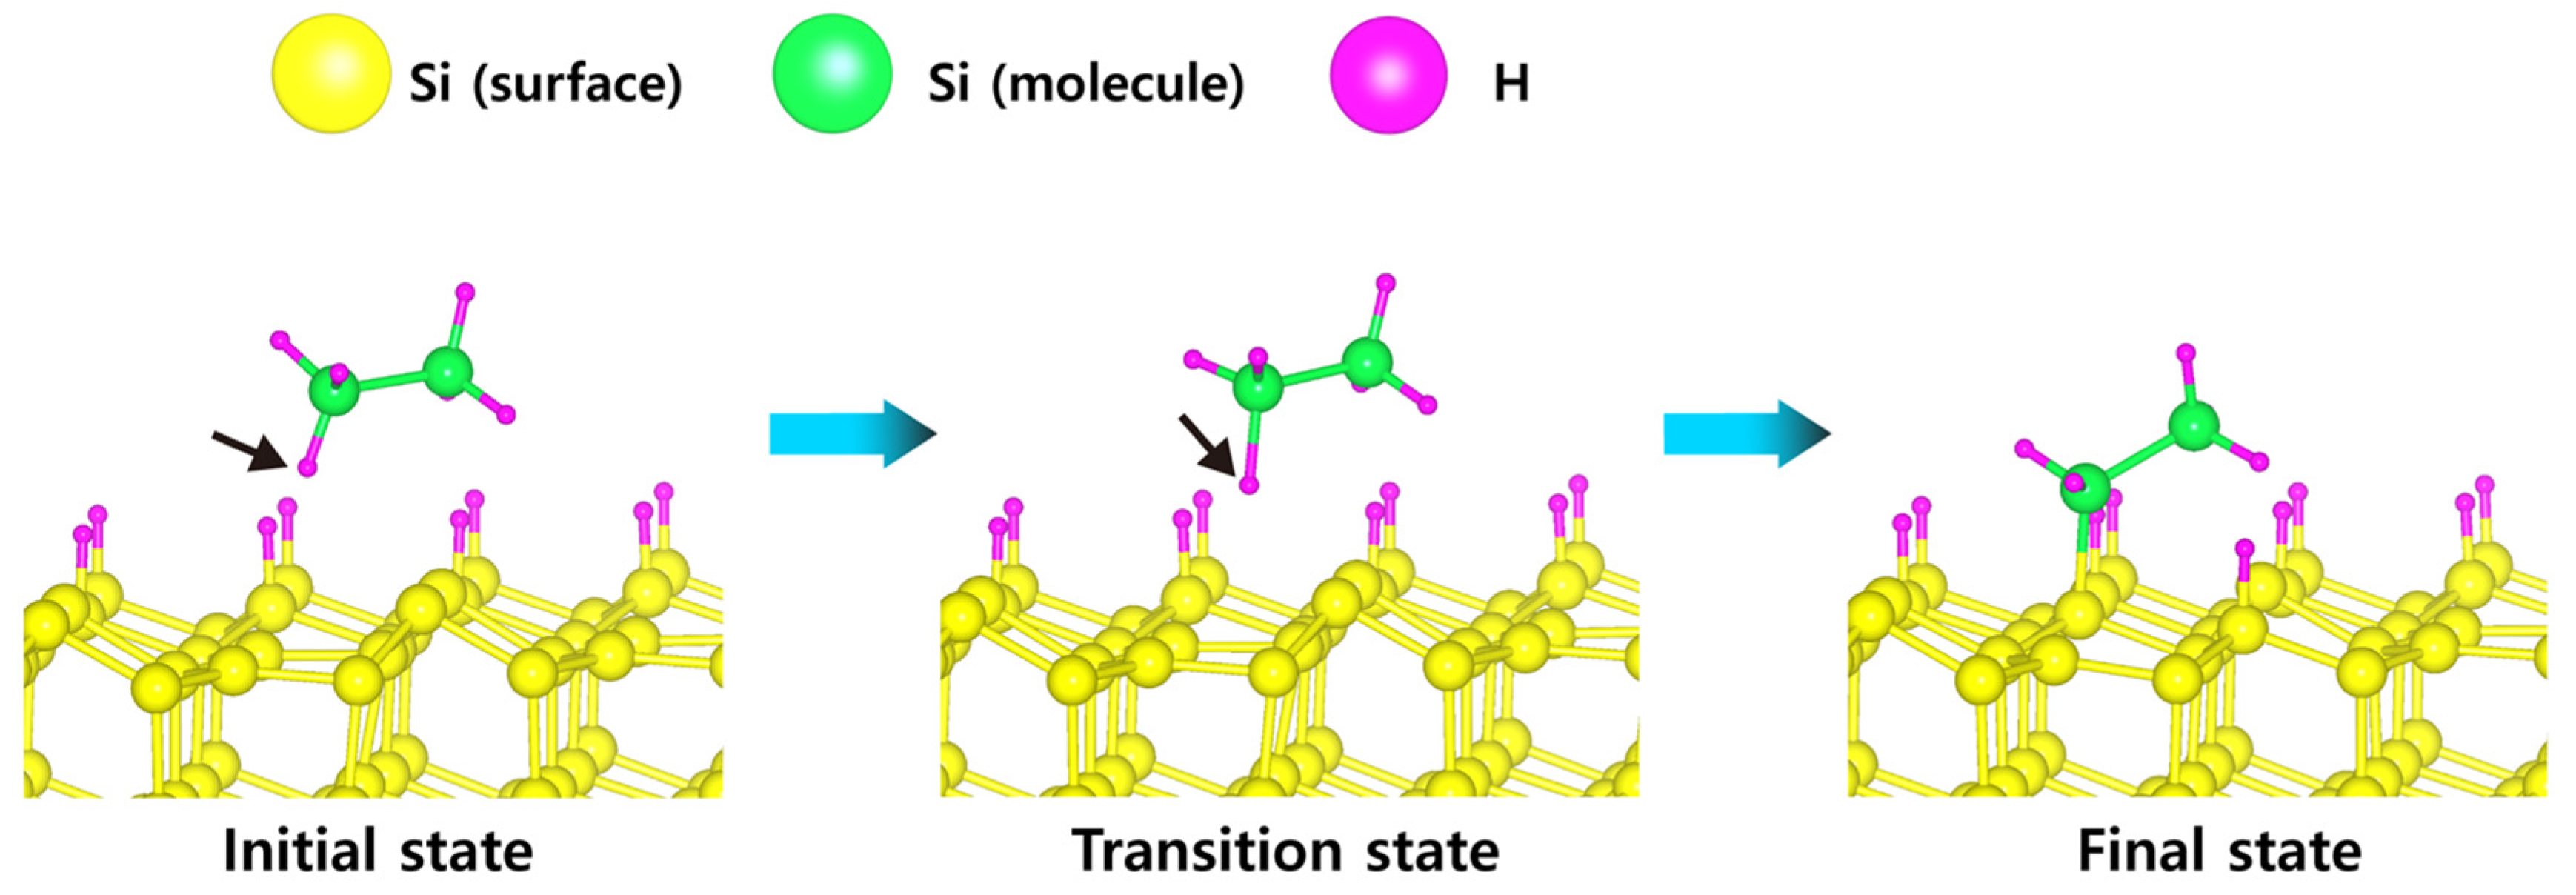
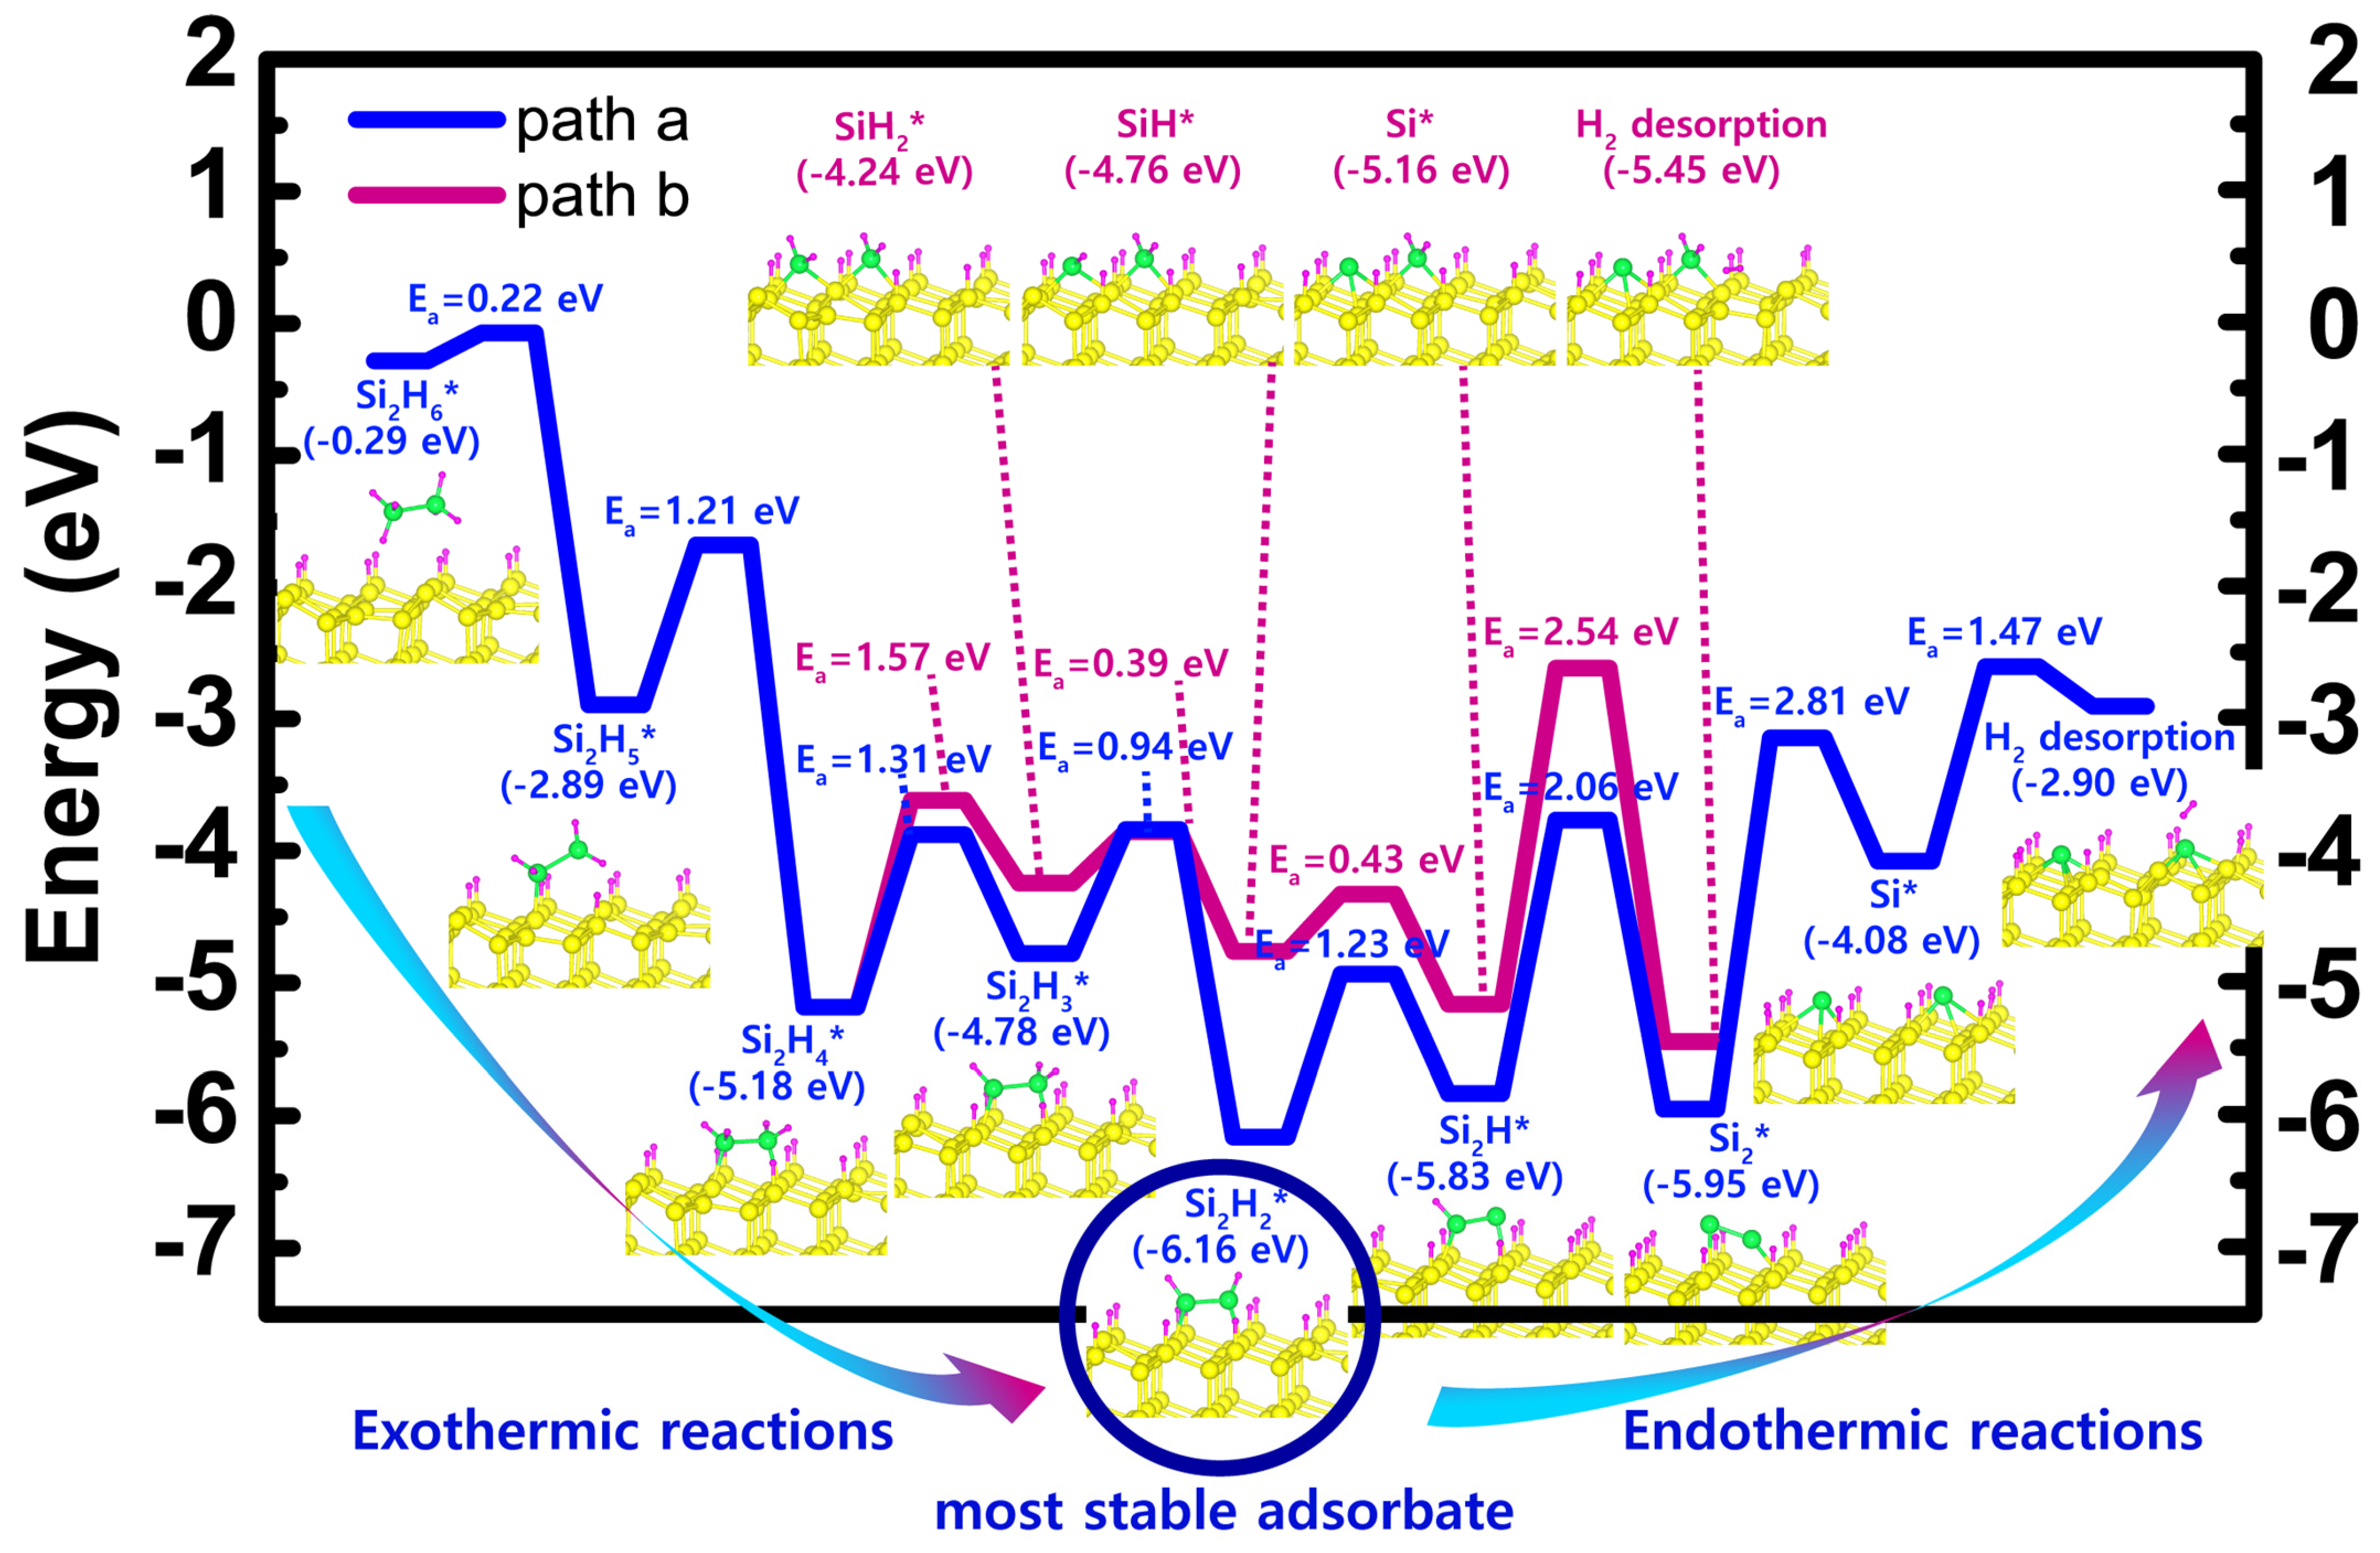
3.1. DFT Results: Si2H6 Adsorption

The optimized atomic structures of the initial, transition and final states for the first dissociative reaction step of the Si2H6 molecule on the H-50% covered Si(001) surface are shown in Figure 6. The calculated energy diagram representing the overall reaction for the decomposition of Si2H6 on the surface is presented in Figure 7. As depicted in Figure 7, on the H-50% covered Si(001) surface, the most stable of the various adsorbates is Si2H2 (Figure 7, circled adsorbate). The detailed atomic configurations of the transition states for the overall decomposition reaction of Si2H6 (i.e., along paths a and b) are included as ESI (Figures S1 and S2; Tables S3 and S4).
The dissociative reaction mechanism of Si2H6 was also investigated on the H-50% covered Si(111) surface, as illustrated in Figure 8 and Figure 9. As depicted in Figure 9, also on the H-50% covered Si(111) surface, the most stable of the various adsorbates is still Si2H2 (Figure 9, circled adsorbate). The detailed atomic configurations of the transition states of Si2H6 that were calculated to form on the surface during the overall reaction (i.e., along paths a and b) are also included as ESI (Figures S3 and S4; Tables S5 and S6).

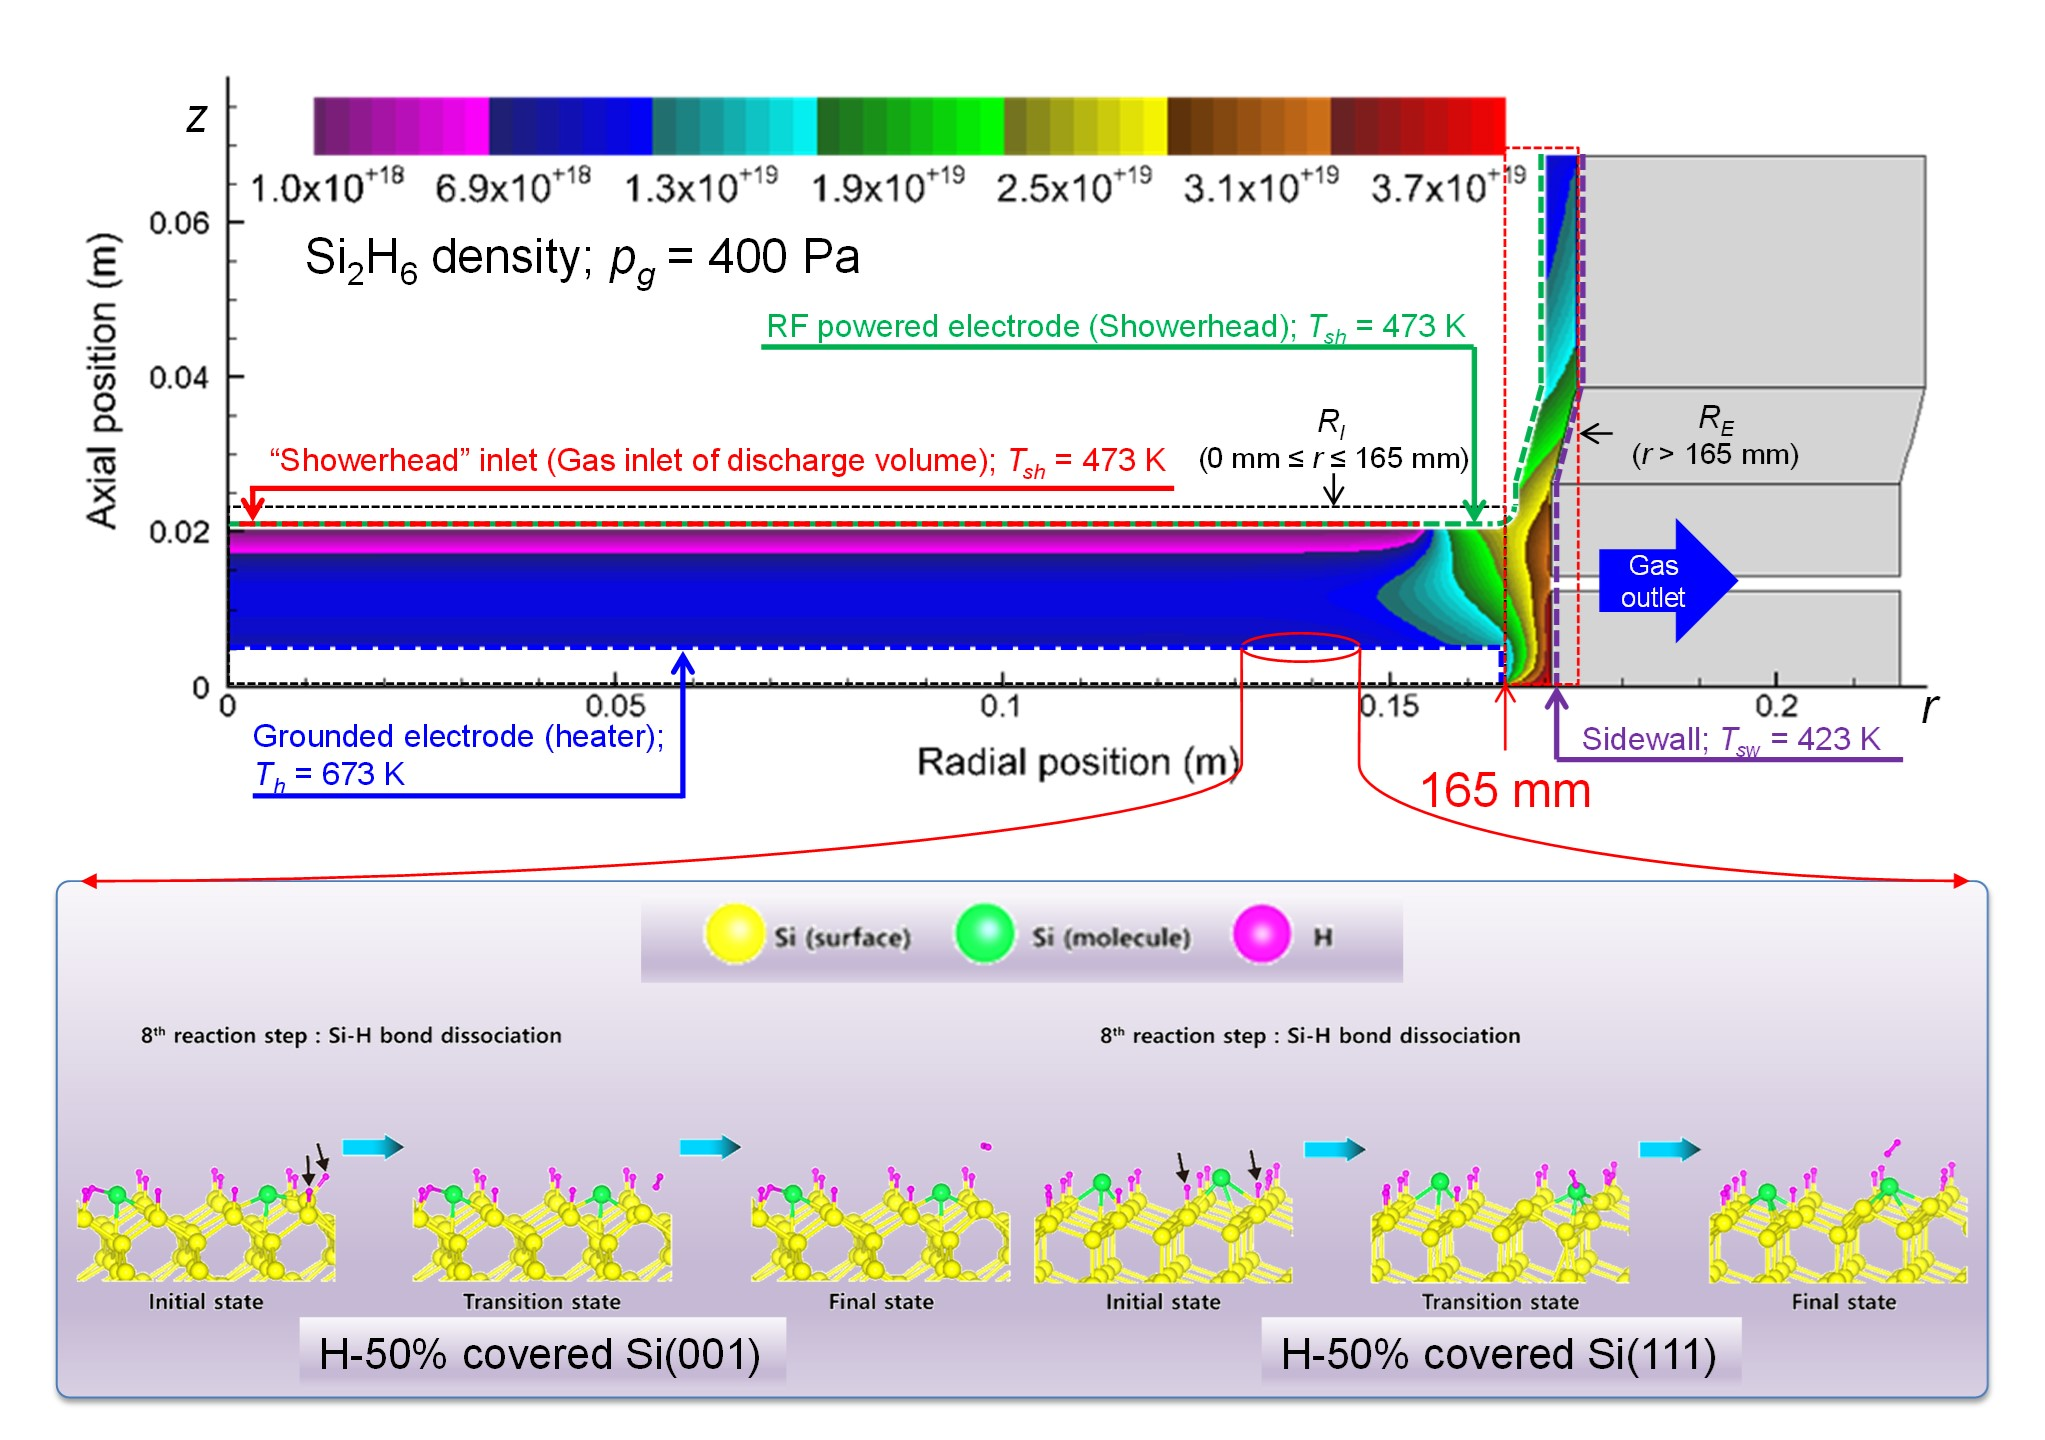
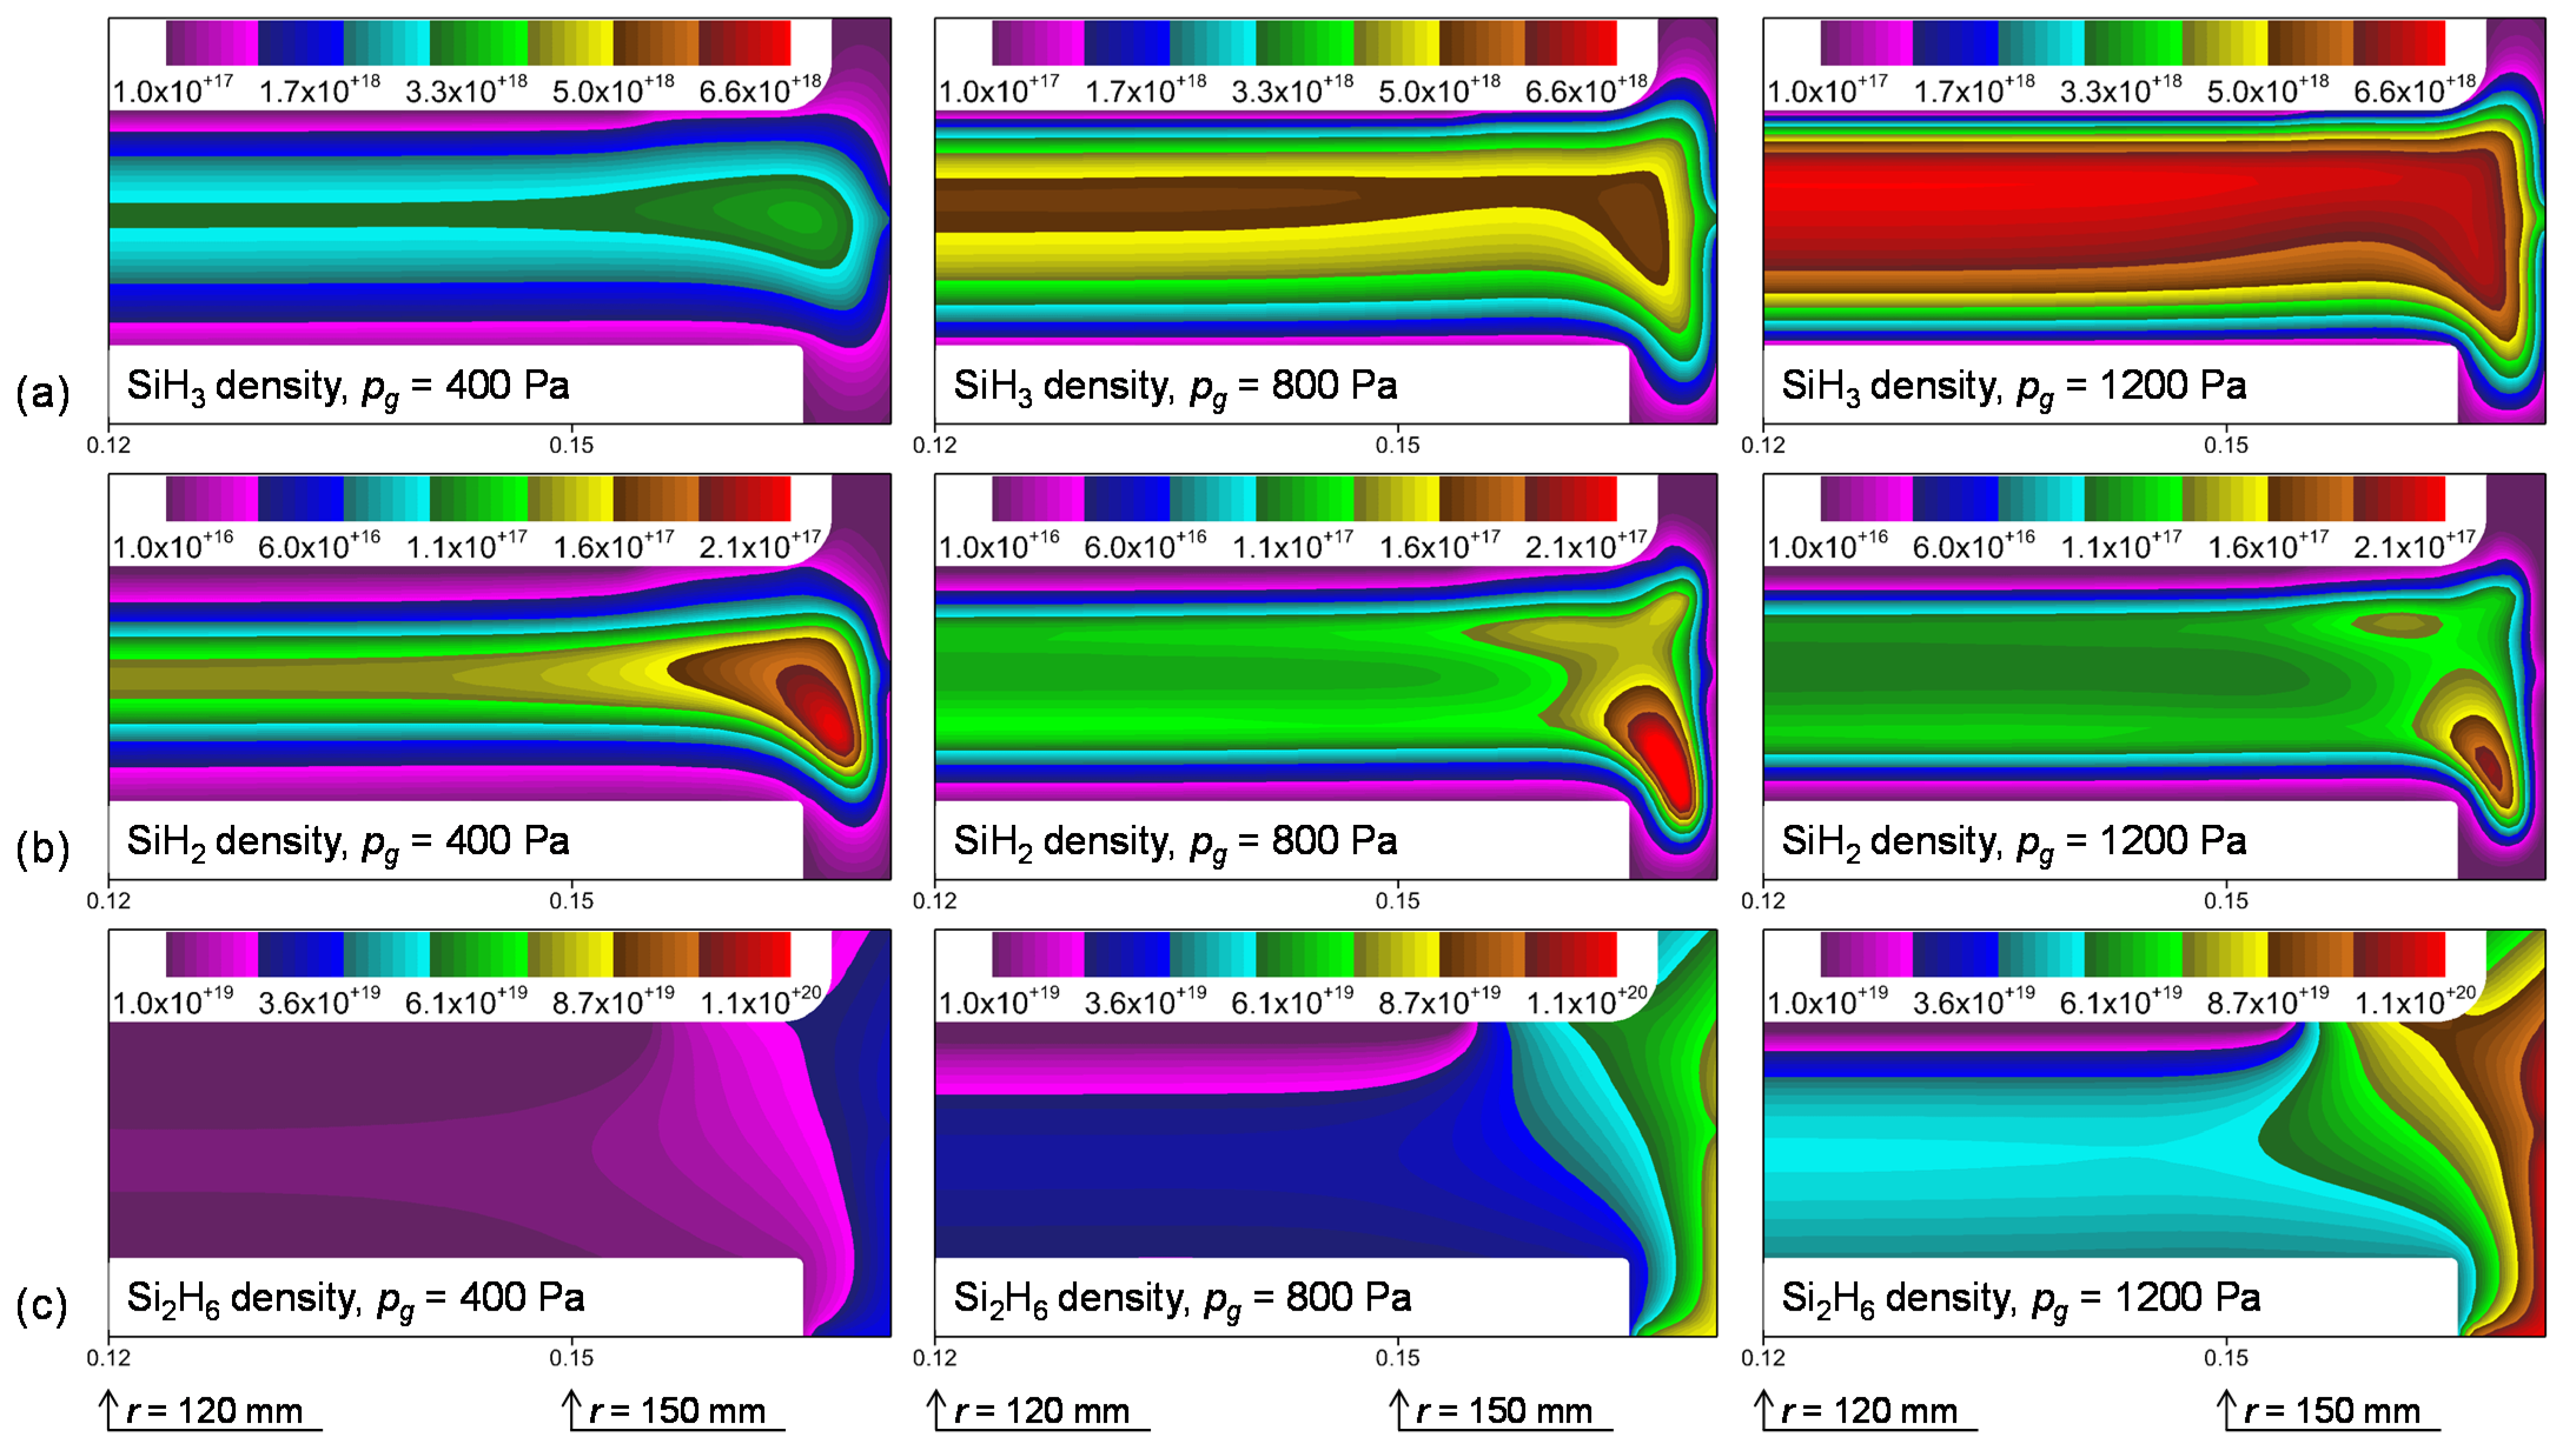
3.2. Plasma Modeling Results: SiH4/He Discharges

In this section, the effects of the gas pressure (pg) on the spatial distributions of the plasma variables are discussed. Note that Si2H6 production mainly occurs, as shown below:
SiH4 + SiH2 → Si2H6
kr = 2.0 × 10⁻¹⁶ [1 − (1 + 0.0032 pg (Pa))−1] (m3·s−1)
Here kr is the reaction rate coefficient. Thus, higher gas pressure accelerates the SiH2 insertion reaction. The results in Figure 10 and Figure 11 were obtained by varying the gas pressure between 400 Pa and 1200 Pa.
In Figure 10a, the ionization reaction [the production of SiH2+: e + SiH4 → SiH2+ + H + H + e + e] rate profiles for the cases of pg = 400 Pa, pg = 800 Pa and pg = 1200 Pa are depicted. For the cases of pg = 400 Pa and pg = 800 Pa, the ionization rates are significantly enhanced near the respective edges of both the showerhead and the heater. However, the ionization rate profile obtained by further increasing the gas pressure to pg = 1200 Pa clearly shows that the peak ionization rates are noticeably lower near the electrode edges, and its radial distribution becomes relatively more uniform in both the radial and axial directions.
In Figure 10b, the electron density contours for the cases of pg = 400 Pa, pg = 800 Pa and pg = 1200 Pa are depicted. Even though an increase in the pressure leads to an increase in the density of the source gas inside the reactor, the ionization rates decrease as shown in Figure 10a. However, the higher gas pressure can induce an increase in the electron density. These contradictory phenomena can be explained by the fact that higher pressure reduces the diffusion fluxes of the charged species, thus the wall losses of the charged species decrease. In addition, at higher pressure, the decrease in the electron mean free path lowers the mean energy of the electrons. Since the plasma potential also decreases with higher pressure, the edge effects are suppressed. Due to the suppressed edge effects, with higher pressure, although the off-axis maximum of the electron density decreases, the overall electron density increases in the bulk.
In Figure 10c, the increase in the gas pressure also results in a more uniform spatial distribution of the electron power density. In particular, the maxima of the spatial time-averaged profile of the power coupled to the electrons intensify and shift toward the electrodes. The positions of these maxima correlate with the position of the plasma-sheath boundary. We can therefore conclude that the shift of the maxima toward the electrodes is evidence of plasma bulk expansion. As a result, an increase in the pressure at constant frequency has the effect of enabling a larger amount of power to be transferred to electrons. This leads to higher dissociation/production of active radicals.
Figure 11 shows the spatial variations in the densities (m−3) of SiH3, SiH2 and Si2H6 when the gas pressure is increased from 400 Pa to 1200 Pa. In Figure 11a, since at higher pressure, more electrons are generated (Figure 10b), and a larger amount of power is transferred to electrons (Figure 10c). As a result, more radicals are generated: the SiH3 density increases in the bulk and its off-axis maximum is also enhanced. However, despite the pressure increasing threefold (i.e., pg increases from 400 Pa to 1200 Pa), the SiH3 density does not increase as much as expected. This saturation can be explained by the fact that, in the gas phase, the SiH3 radical is eliminated fast, as shown below:
SiH3 + SiH3 → SiH2 + SiH4
kr = 1.5 × 10⁻¹⁶ (m3 s−1)
In addition, due to the reduced diffusion coefficients of SiH3 (based on the Chapman-Enskog theory [37]), since a higher pressure can induce the “local accumulation” of SiH3, the loss of SiH3 occurs rapidly with concomitant lowering of the density near the bottom surface.
At the same time, as shown in Figure 11b, the SiH2 densities even decrease as the pressure increases. This is mainly because the rate of the SiH2 insertion reaction is a function of the pressure (see Equation 3). Thus, the pressure dependence of the SiH2 density distribution can be attributed to the fact that higher pressure promotes both its rate of generation and depletion in the gas phase, as the secondary gas phase reaction with SiH4 is accelerated. For the case with 1200 Pa, as the higher production rate does not compensate for the loss in the bulk, the axial density distribution develops a double-humped shape. Consequently, more extensive depletion of SiH2 promotes the generation of Si2H6 with higher pressure (Figure 11c): the density distribution of Si2H6 is nearly zero at the showerhead inlet and rapidly increases as it approaches the bulk plasma region. Finally, at higher pressure, the boundary layers of both SiH3 and SiH2 become thinner near the edge.

4. Discussion

4.1. Si2H6 Reactivity and Dependence on the Si Surface Orientation

Table 1 summarizes the reactivities of the Si2H6 molecules on the H-50% covered Si(001) and Si(111) surfaces. This table compares the energies of the initial and most stable adsorbates (Einitial adsorbate, Emost stable adsorbate, eV), the reaction energies of the initial to the most stable adsorbates (Erxn, eV) and the minimum and maximum activation energies of the initial to the most stable adsorbates (Ea, min, Ea, max, eV) on the two different Si surfaces. The energies in Table 1 were calculated following Appendix A. In Table 1, one can find that the dissociative reactions of Si2H6 on the H-50% covered Si(111) surface from the initial adsorbate to the most stable adsorbate are more favorable than those on the H-50% covered Si(001) surface because the reaction and activation energies on the former surface are lower than those on the latter of these two surfaces. Regardless of the hydrogenated state of the Si surface, the reactivity of the Si2H6 is highly dependent on the orientation of Si surfaces.

4.2. Comparisons of Si2H6 Surface Reactivities

Important to note is that the reactivity of Si2H6 molecules on H-covered Si surfaces is more energetically favorable than on clean Si surfaces (for the reactivities on the clean Si (001) and Si(111) surfaces, see Park et al. [14]). The H atoms covering the surface interact with the Si and H atoms attached to the Si2H6 molecules. Therefore, the H atoms lower the total energy of the system. The reason why the H atoms on the surface readily interact with the Si atoms is the strength of the Si-H bond. In addition, the H atoms on the surface easily interact with the H atoms of Si2H6 molecules because the H atoms tend to combine to form H2. That is, H atoms in close proximity to each other appear to interact to become energetically stable. This phenomenon is evident from the DFT results, as shown in Figure 1 and Figure 2. In Figure 1 and Figure 2, the H-covered Si surface is the most stable when the H atoms gather together. In fact, according to Le et al. [22], the mechanism for a partially H-covered Si (100) surface was similar but was characterized by higher adsorption energies in most cases. This implies that the presence of hydrogen atoms on the surface stabilizes the surface species.
At the same time, with respect to the H-covered Si surfaces, Si2H6 molecules are more reactive on the Si(111) surfaces. This comparison is against the results on the clean Si surfaces [14] and can be explained as follows. On the H-covered Si(111) surface, the H atoms are tilted slightly in the direction perpendicular to the xy-plane with a tetrahedral structure to form a crystallographically stable structure, because the H atoms form Si-H bonds. Therefore, the Si2H6 molecules are more reactive on the H-covered Si(111) surface on which the tilted H atoms are closer to each other on the surface.
The dependence of the surface reactivity on Si on the molecular size of SixHy molecules is understood as follows. As reported in our previous study [14], the surface reactivity of Si2H6 is superior to that of SiH4. The higher surface reactivity is because the Si-H bonds in Si2H6 are weaker than those in SiH4. This was clear from our previous study [14], which showed that strong Si-Si bonding weakens Si-H bonding, thereby ensuring that the surface reactivity of Si2H6 molecules is excellent. Similar results were obtained in other studies [38]. Similarly, the larger the size of the molecules of the SixHy species, the weaker the Si-H bond strength and the higher the surface reactivity becomes. As observed in previous studies, understanding the surface reactivity is important to improve the deposition rate and, consequently, the throughput of Si thin films [39,40]. Therefore, considering the high bonding nature and reactivity of Si2H6, the deposition rate of the Si films can be enhanced when Si2H6 adsorption occurs to a sufficient degree.

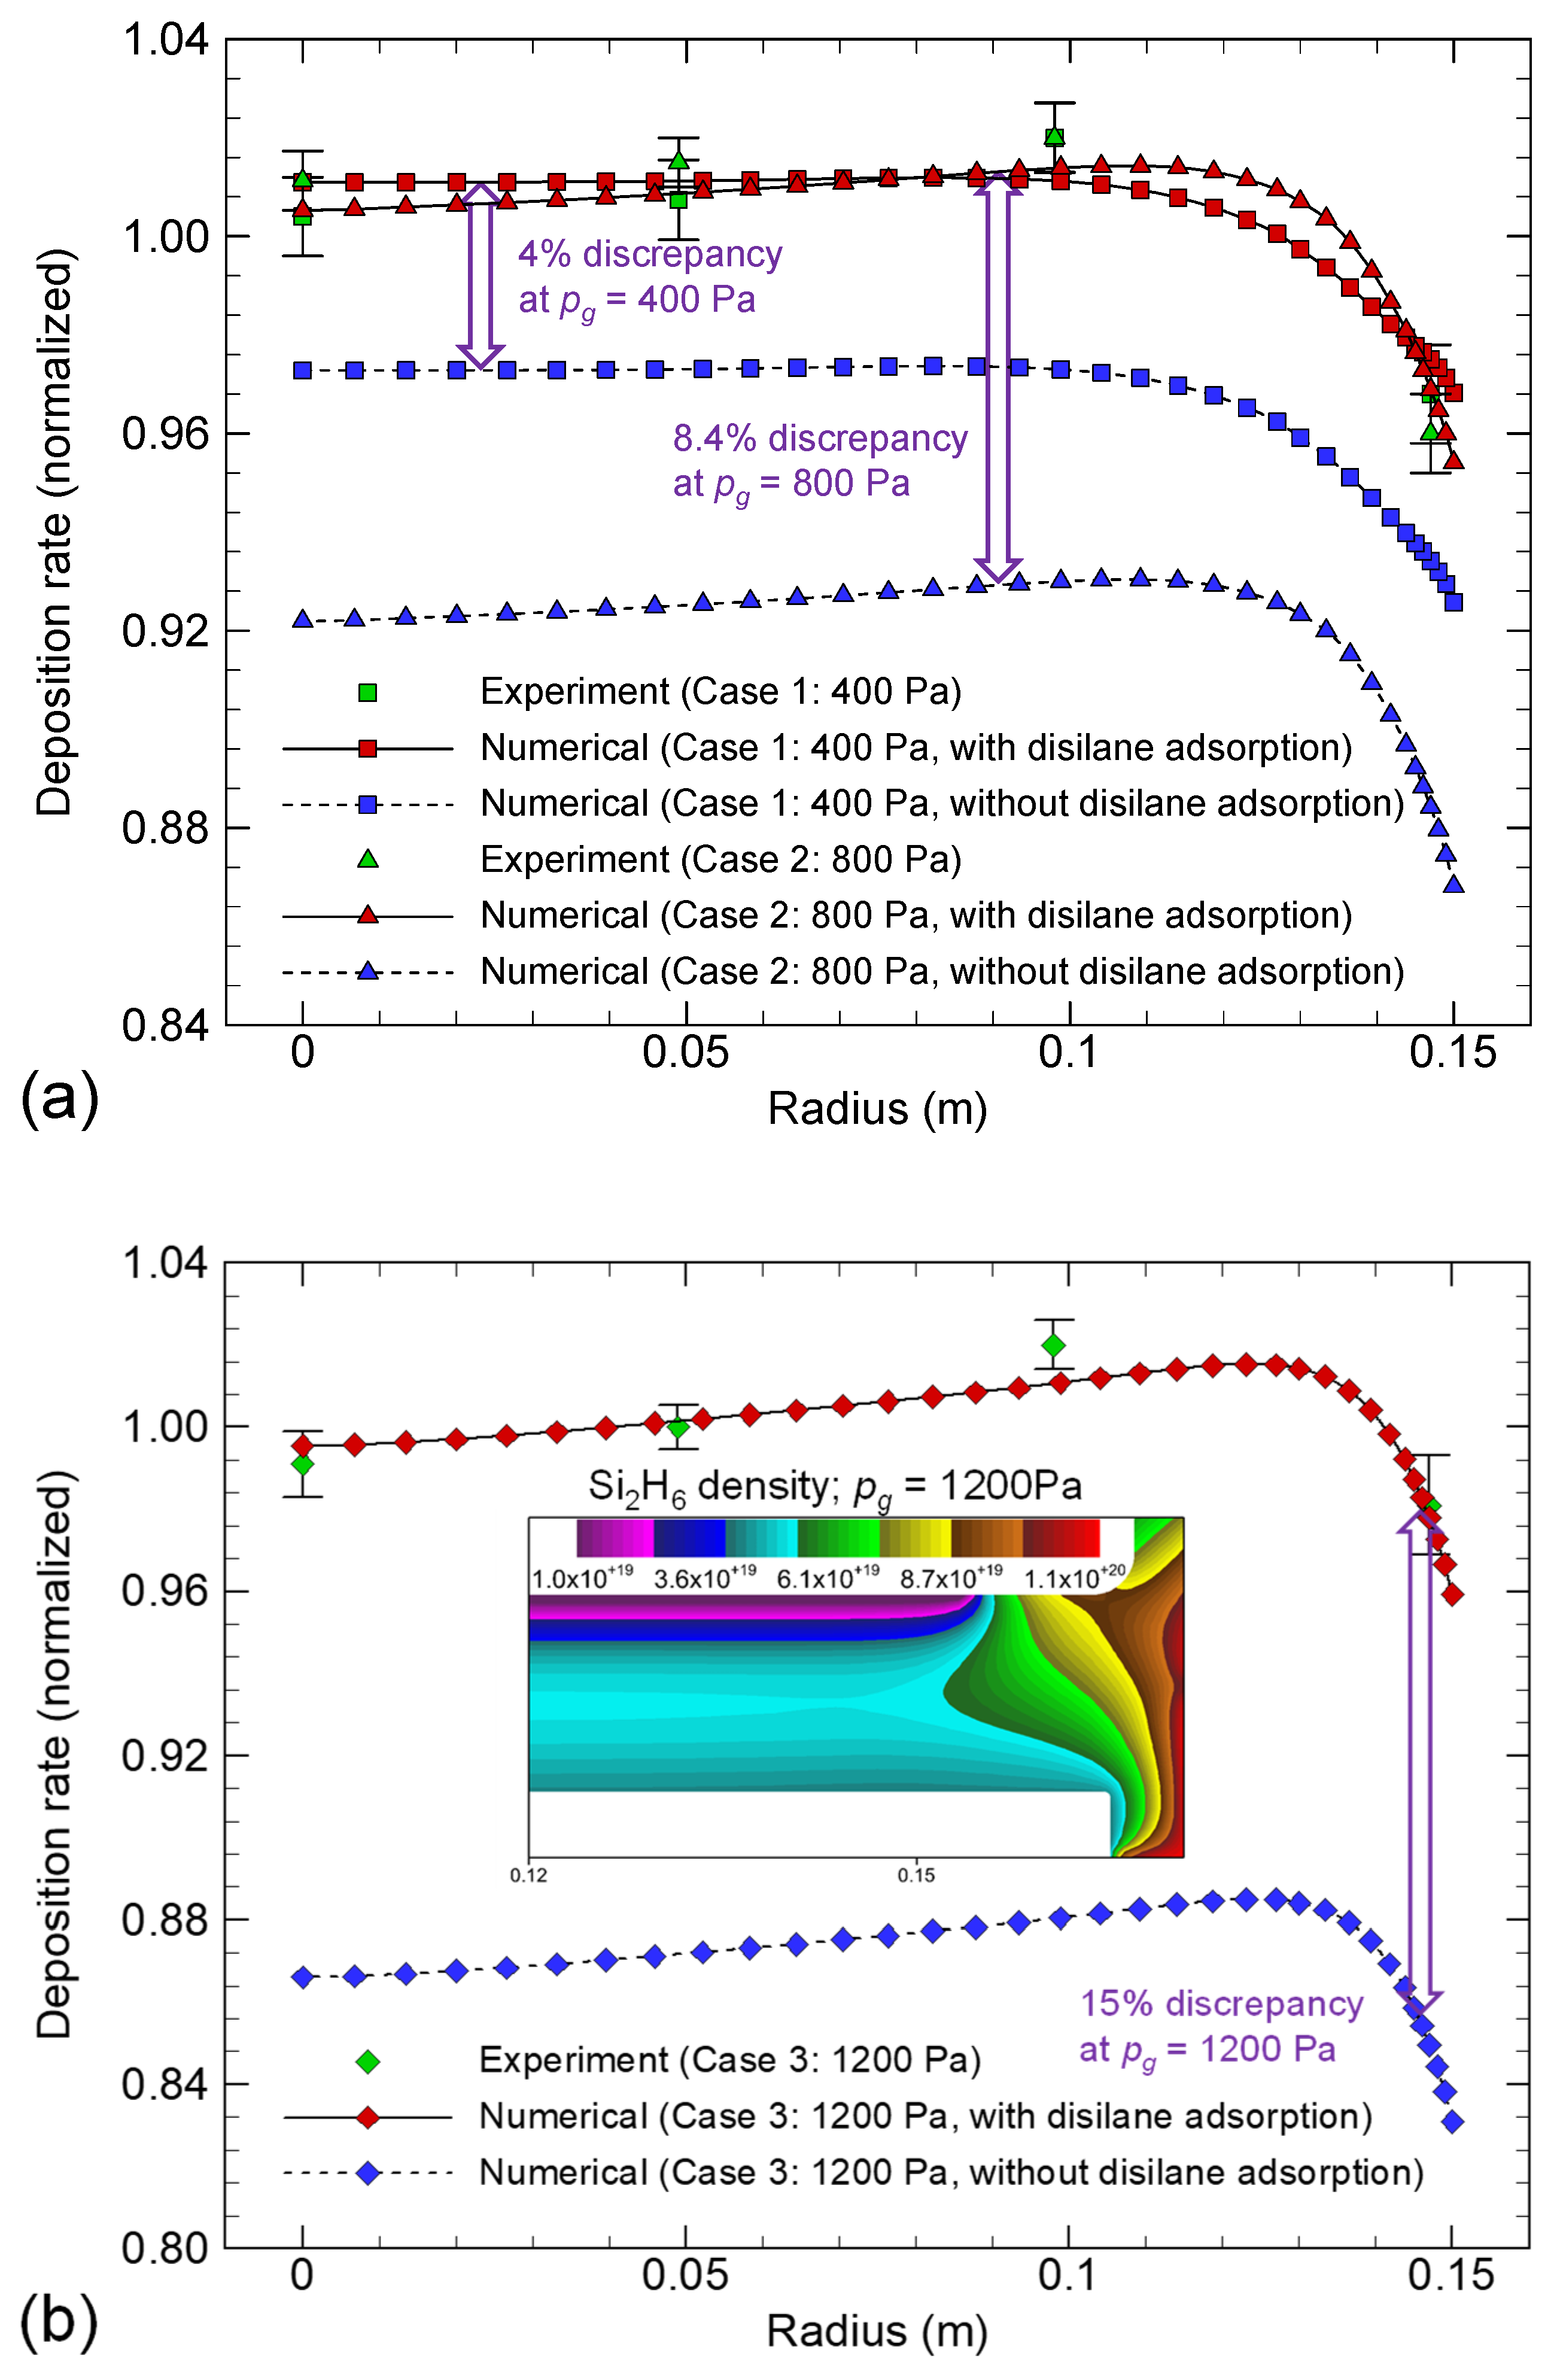
4.3. Deposition Rate Profiles of Si:H Films: Effects of Si2H6 Adsorption

Figure 12a,b show the deposition rate profiles for pg = 400, 800 and 1200 Pa. Due to the non-uniformities of the deposition rate profiles less than 10%, to compare the profiles keeping their shapes, the profiles were normalized using their own average values. However, the profiles of cases without consideration of Si2H6 adsorption were normalized to the average values of the corresponding numerical data with consideration of Si2H6 adsorption to serve as a quantitative comparison of their deposition rate profiles. In fact, in cases with the gas pressure less than 100 Pa, adsorption of reactive radicals such as SiH, SiH2 and SiH3 were considered, but Si2H6 adsorption was neglected due to its small amount produced in the gas phase under the given condition [7,41]. Due to the axi-symmetry of our reactor, we could compare the deposition rate profiles along the radial direction. Regardless of changes in the gas pressure, the experimental data were in good agreement with the simulated data. At pg = 400 Pa, the average value of the simulated data was 7.18 Å s−1, while that of the experimental data was 7.25 Å s−1. At pg = 800 Pa, the average value of the simulated data was 9.1 Å s−1, while that of the experimental data was 9.19 Å s−1. At pg = 1200 Pa, the average value of the simulated data was 10.18 Å s−1, while that of the experimental data was 10.32 Å s−1. In fact, in the experiment with pg higher than 1500 Pa, particle contamination was too serious due to the enhanced gas phase reaction, and also azimuthal non-uniformities were too high. In Figure 12a, at pg = 400 Pa and pg = 800 Pa, relative discrepancies of 4% and 8.4% can be seen between the deposition rates of cases with and without consideration of Si2H6 adsorption. Noteworthy is that, in Figure 12b, at pg = 1200 Pa, the relative discrepancy reaches 15% although a small amount of SiH4 (50 sccm) is used. The higher discrepancy is originated from the more efficient Si2H6 production (Figure 11c). One should also note that as depicted in Figure 10c, regardless of changes in the gas pressure, the maximum electron power densities were observed radially outward from the heater edge (i.e., outside the discharge volume between the showerhead and the heater). Even though these observations about the electron power densities were not experimentally validated, one can be sure about these observations by the fact that the deposition rate profiles are all concave: the deposition rates decrease along the radially outward direction. If the maximum electron power densities locate inside the discharge volume, enhanced ion and radical fluxes can induce high deposition rates near the heater edge, forming convex deposition rate profiles, as demonstrated in Kim and Lee [27].

5. Conclusions

We investigated the decomposition of Si2H6 on H-covered Si surfaces to allow us to fundamentally comprehend the reaction mechanisms of Si:H thin films in detail on the basis of DFT calculations. We found the reactivities of Si2H6 molecules on H-covered Si surfaces to be more energetically favorable than those on the clean Si surfaces. Furthermore, our theoretical results also showed that, upon exposure to Si2H6, the H-50% covered Si(111) surface enables efficient and rapid deposition of Si:H thin films. This finding is justified because, on the H-50% covered Si(111) surface, the dissociative reactions of Si2H6 are thermodynamically and kinetically more favorable than on the H-50% covered Si(001) surface. Using PECVD as an example, we investigated the deposition of a hydrogenated silicon (Si:H) film using SiH4/He CCP discharges. In the range of 400 Pa ≤ pg ≤ 1200 Pa, an increase in the gas pressure promoted the production of Si2H6. The experimental data (deposition rates) were in good correspondence with the simulated data. When the gas pressure was increased to 1200 Pa, a relative discrepancy of approximately 15% was observed between the deposition rates of cases with and without consideration of Si2H6 adsorption. The large relative discrepancy was attributed to an increase in the Si2H6 density difference. Based on our findings, since the larger the size of the molecules of the SixHy species, the weaker the Si-H bond strength and the higher the surface reactivity becomes, insertion of larger sized SixHy species will enhance productivity in plasma deposition of the Si:H layer.

Supplementary Materials

The following are available online at https://www.mdpi.com/article/10.3390/coatings11091041/s1, Table S1: Adsorption energies of Si2H6 on the H-50% covered Si(001)-(4 × 4) surface, calculated for each geometry and position. Table S2: Adsorption energies of Si2H6 on the H-50% covered Si(111)-(4 × 4) surface, calculated for each geometry and position. Figure S1: Initial (IS), transition (TS), and final (FS) states of intermediate reactions of Si2H6 from the 2nd reaction step to the 8th reaction step for path a on the H-50% covered Si(001) surface. Table S3: Activation energies (Ea, eV) and reaction energies (Erxn, eV) of Si2H6 dissociation for path a on the H-50% covered Si(001) surface. Figure S2: Initial (IS), transition (TS), and final (FS) states of intermediate reactions of Si2H6 from the 3rd reaction step to the 6th reaction step for path b on the H-50% covered Si(001) surface. Table S4: Activation energies (Ea, eV) and reaction energies (Erxn, eV) of Si2H6 dissociation for path b on the H-50% covered Si(001) surface. Figure S3: Initial (IS), transition (TS), and final (FS) states of intermediate reactions of Si2H6 from the 2nd reaction step to the 8th reaction step for path a on the H-50% covered Si(111) surface. Table S5: Activation energies (Ea, eV) and reaction energies (Erxn, eV) of Si2H6 dissociation for path a on the H-50% covered Si(111) surface. Figure S4: Initial (IS), transition (TS), and final (FS) states of intermediate reactions of Si2H6 from the 3rd reaction step to the 6th reaction step for path b on the H-50% covered Si(111) surface. Table S6: Activation energies (Ea, eV) and reaction energies (Erxn, eV) of Si2H6 dissociation for path b on the H-50% covered Si(111) surface.

Author Contributions

Conceptualization, H.P. and H.J.K.; Formal analysis, H.P. and H.J.K.; Funding acquisition, H.J.K.; Investigation, H.P. and H.J.K.; Methodology, H.P. and H.J.K.; Supervision, H.J.K.; Validation, H.J.K.; Visualization, H.P. and H.J.K.; Writing — original draft, H.P. and H.J.K.; Writing — review & editing, H.J.K. All authors have read and agreed to the published version of the manuscript.

Funding

This work was supported by the Gachon University research fund of 2019 (GCU–2019–0814) and the National Research Council of Science and Technology (NST) grant by the Korea government (MSIT) (No. CRC–20–01–NFRI).

Institutional Review Board Statement

Not applicable.

Informed Consent Statement

Not applicable.

Data Availability Statement

Not applicable.

Conflicts of Interest

The authors declare no conflict of interest.

Appendix A

Appendix A.1. Adsorption Energy, Activation Energy and Reaction Energy

The adsorption energy (Eads) was calculated using:
Eads = Etot, ads − (Esurf + Epre)
where Etot,ads, Esurf and Epre are the total energy of the system after adsorption, the energy of the surface only and the energy of the precursor only, respectively.
The activation energy (Ea) was calculated using:
Ea = Etot, tran − Etot, b.tr
where Etot, tran and Etot, b.tr are the total energy of the transition state and the total energy before transition, respectively.
The reaction energy (Erxn) was calculated using:
Erxn = Etot, a.tr − Etot, b.tr
where Etot, a.tr is the total energies of the system after transition.

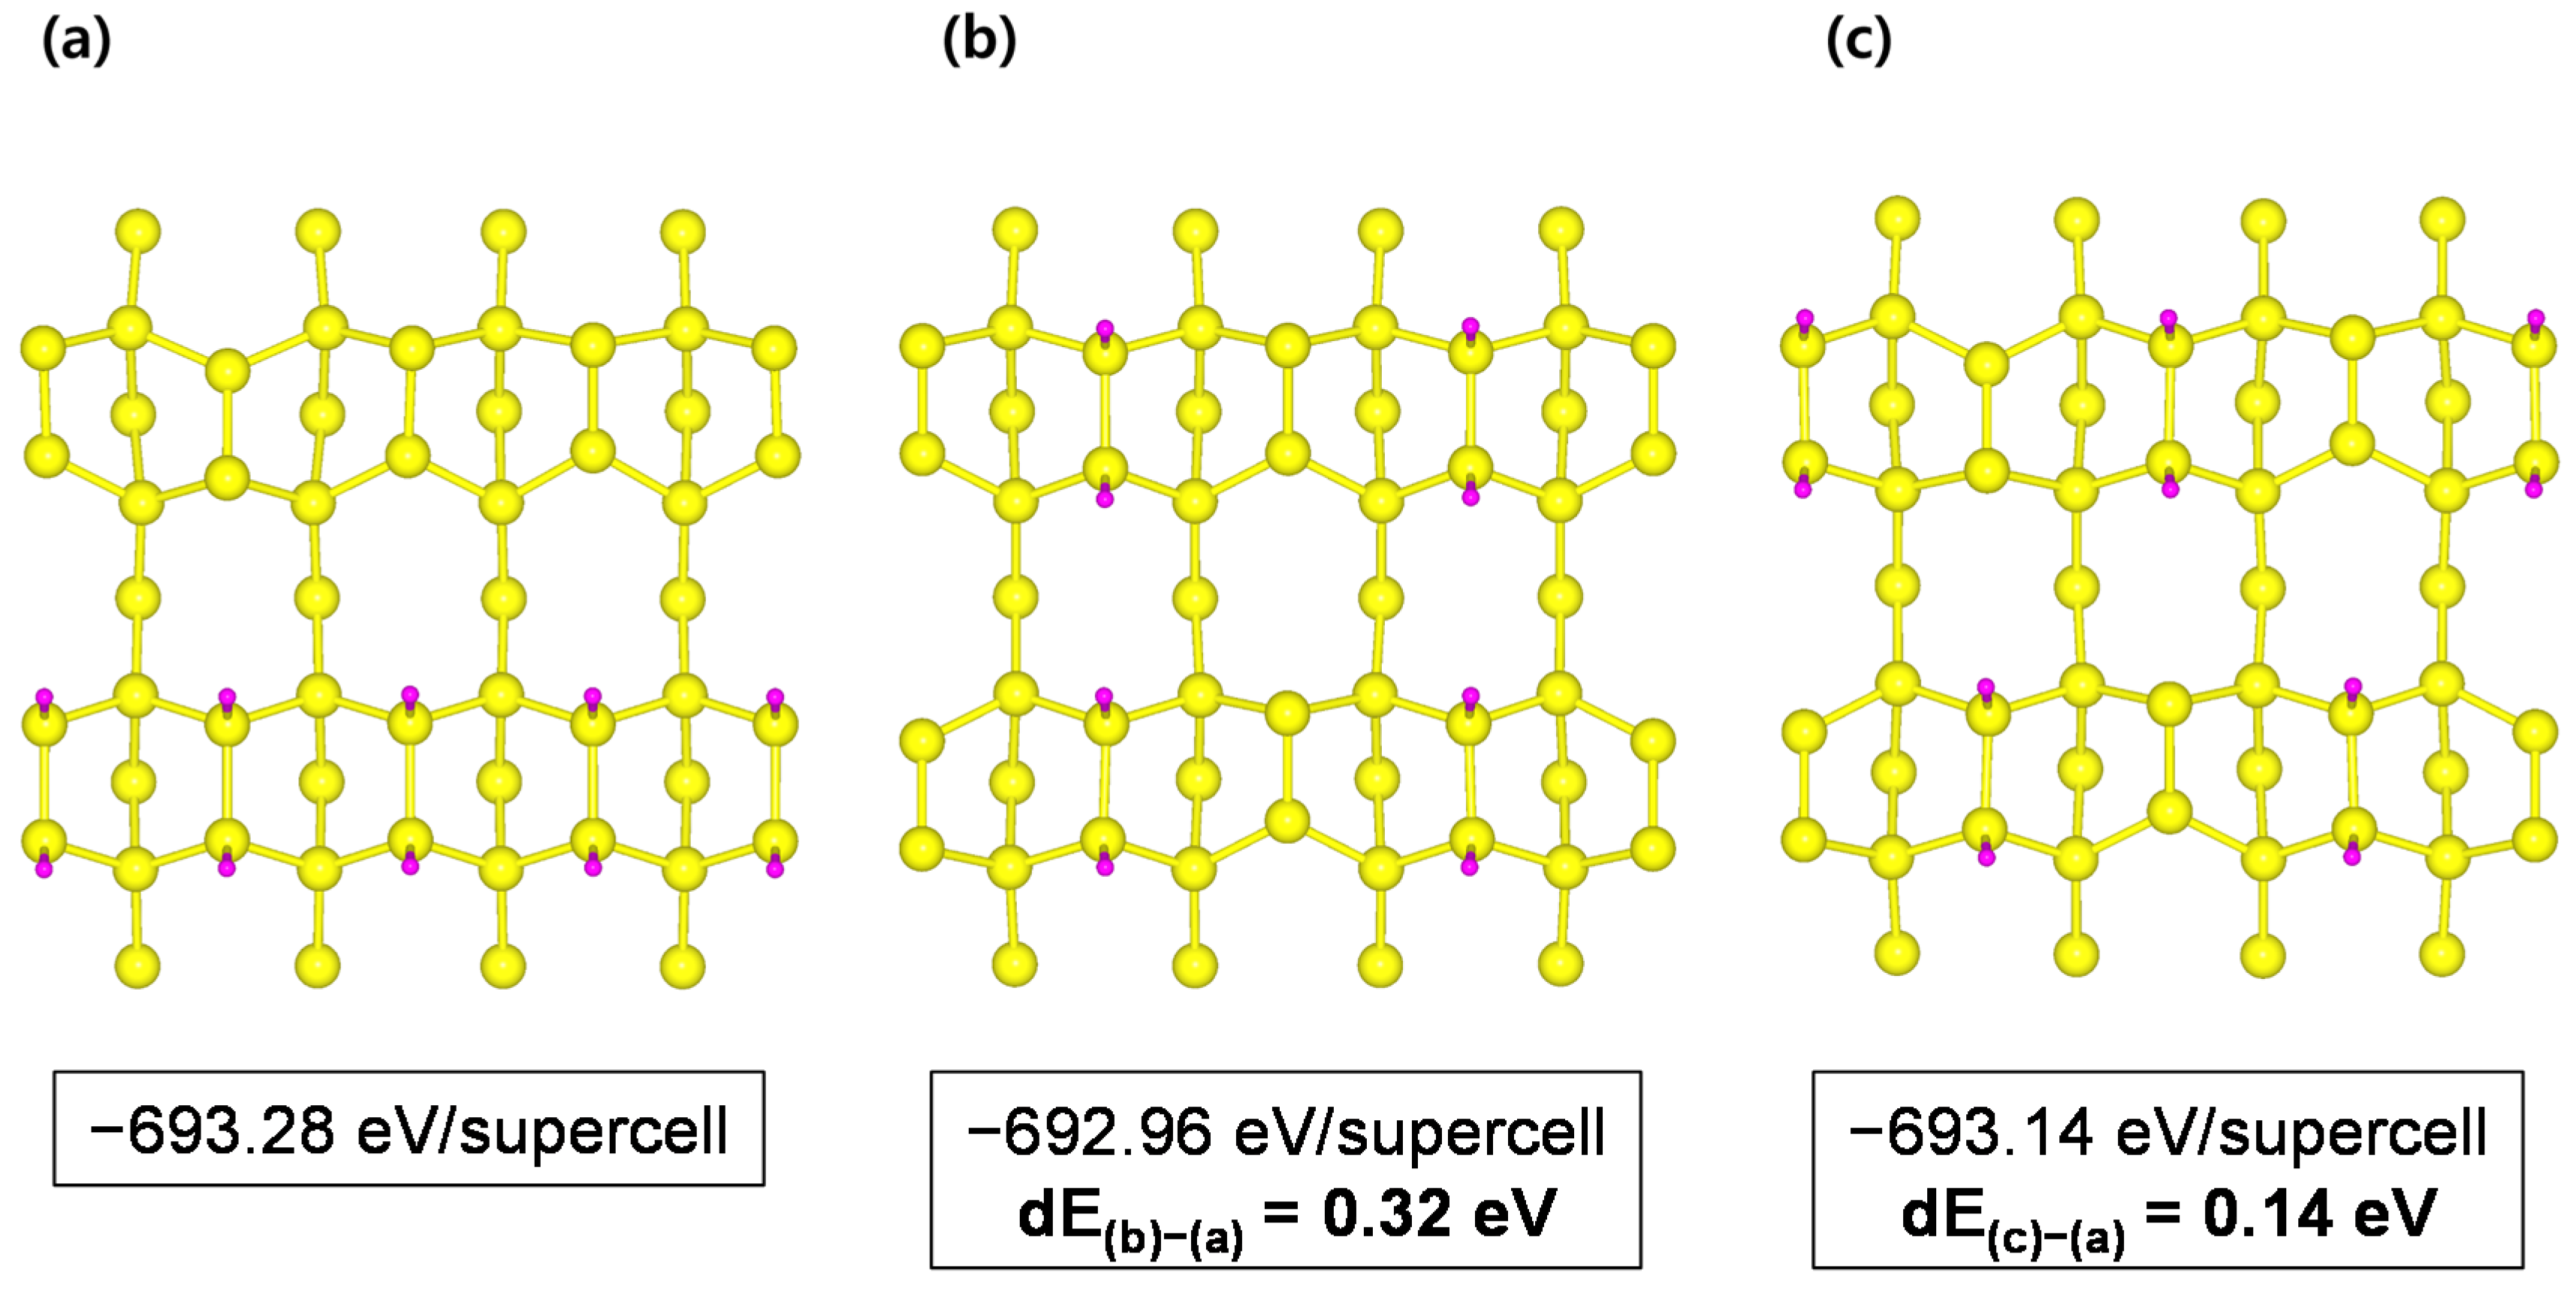
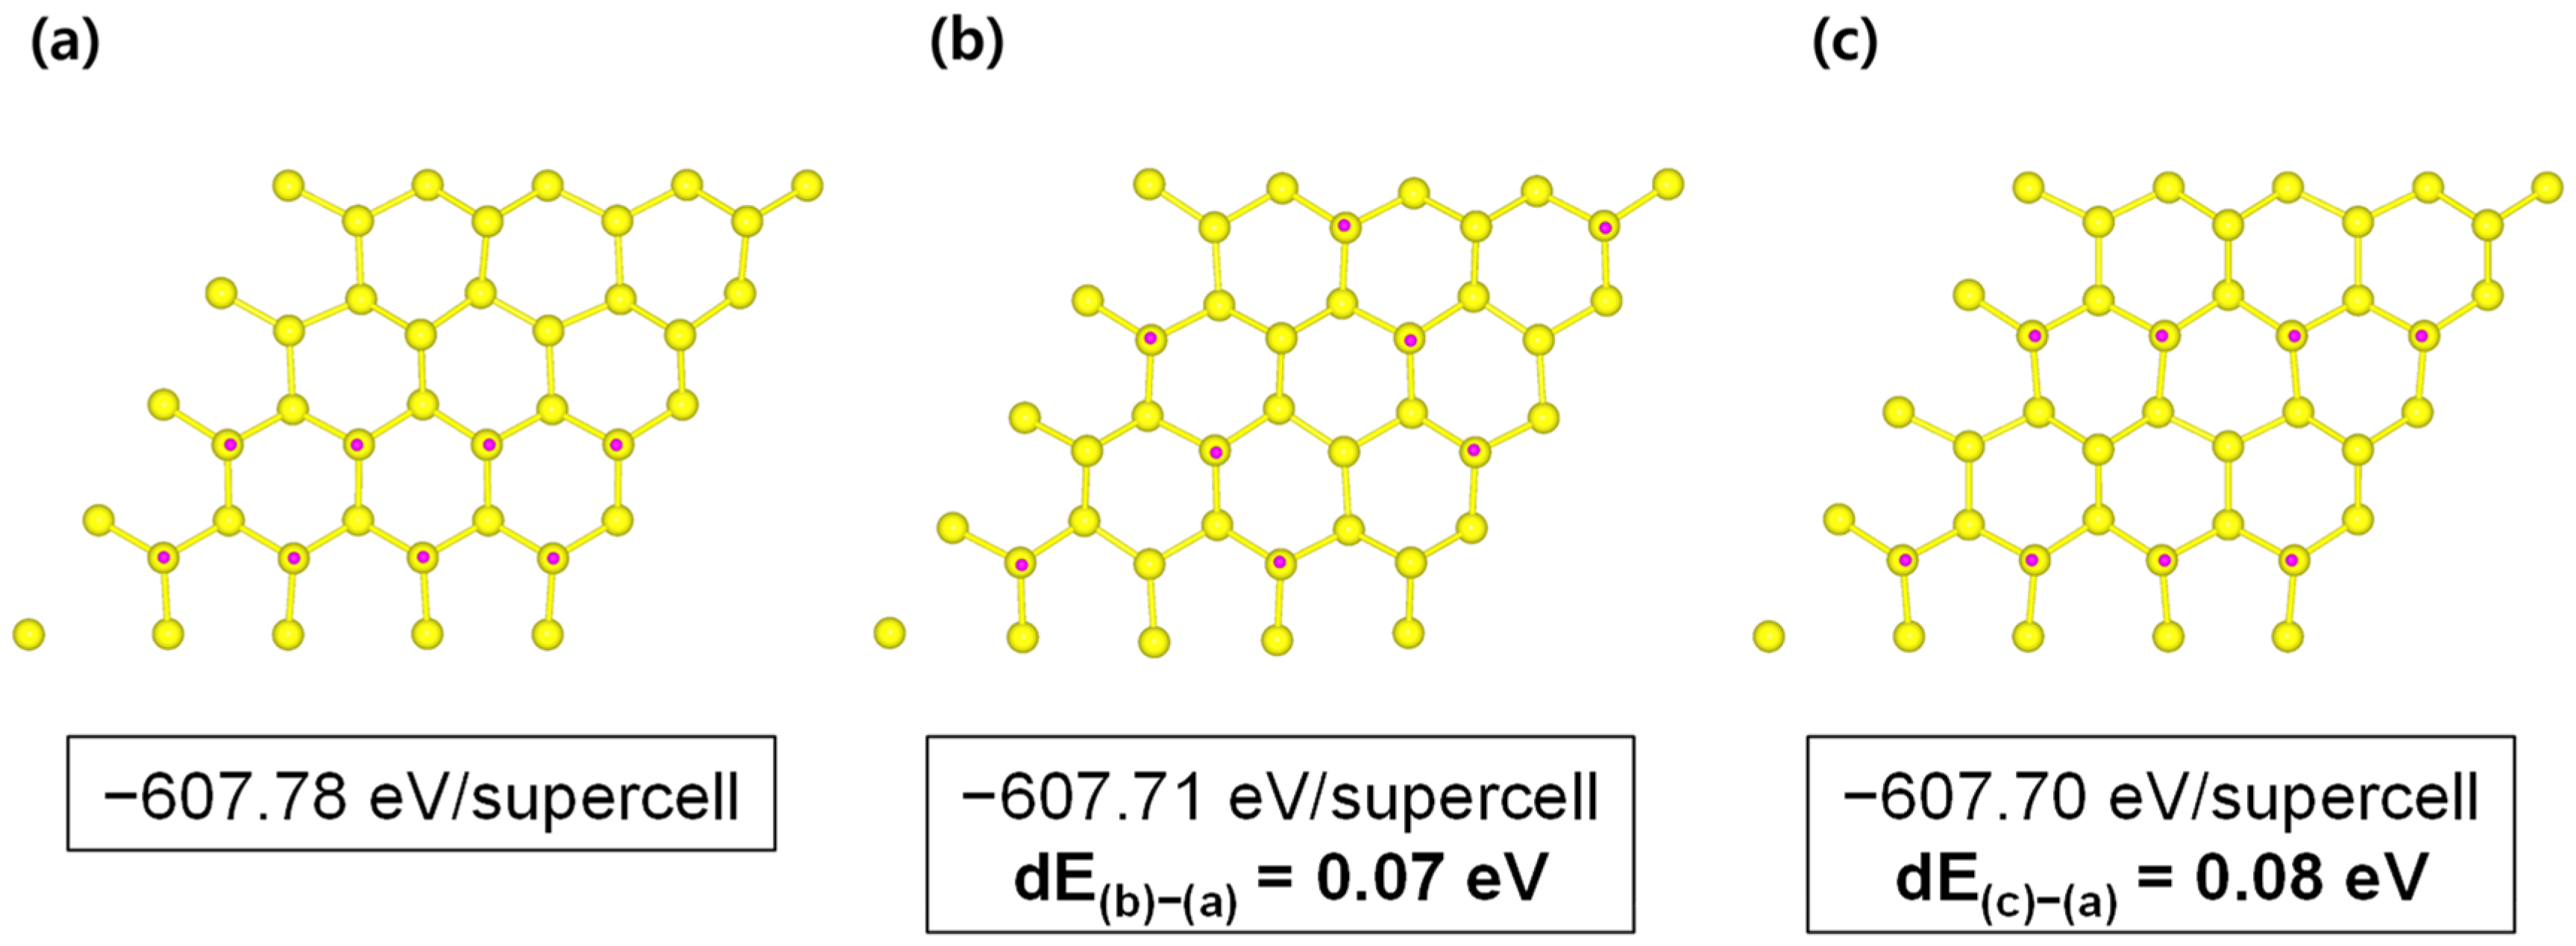
Appendix A.2. H-50% Covered Si(001) and H-50% Covered Si(111) Surfaces

For Si(111), the Si2H6 molecule is orientated vertical to the surface in Geometry 1, whereas in Geometry 2, the molecule is orientated horizontal to the surface. The adsorption energies of Si2H6 were calculated on two different Si surfaces for each geometry and position and are summarized in ESI (Tables S1 and S2).

References

  1. Maydan, D. The future of equipment development and semiconductor production. Mater. Sci. Eng. A 2001, 302, 1–5. [Google Scholar] [CrossRef]
  2. Yavas, O.; Richter, E.; Kluthe, C.; Sickmoeller, M. Wafer-edge yield engineering in leading-edge DRAM manufacturing. Semicond. Fabtech 2009, 39, 1–5. [Google Scholar]
  3. Kim, H.J. Numerical simulation of semiconductor fabrication system. In Proceedings of the International Conference on Microelectronics and Plasma Technology 2014, Gunsan Saemangeum Convention Center (GSCO), Gunsan, Korea, 8–11 July 2014. [Google Scholar]
  4. Smith, D.L. Thin-Film Deposition: Principles and Practice; McGraw-Hill: New York, NY, USA, 1995. [Google Scholar]
  5. Lieberman, M.A.; Lichtenberg, A.J. Principles of Plasma Discharges and Materials Processing; John Wiley & Sons, Inc.: Hoboken, NJ, USA, 2005. [Google Scholar]
  6. Street, R.A. Technology and Applications of Amorphous Silicon; Springer: Berlin/Heidelberg, Germany; New York, NY, USA, 2000. [Google Scholar]
  7. Nienhuis, G.J.; Goedheer, W.J.; Hamers, E.A.G.; Van Sark, W.G.J.H.M.; Bezemer, J. A self-consistent fluid model for radio-frequency discharges in SiH4-H2 compared to experiments. J. Appl. Phys. 1997, 82, 2060–2071. [Google Scholar] [CrossRef]
  8. Nienhuis, G.J.; Goedheer, W. Modelling of a large scale reactor for plasma deposition of silicon. Plasma Sources Sci. Technol. 1999, 8, 295–298. [Google Scholar] [CrossRef]
  9. Isomura, M.; Kondo, M.; Matsuda, A. Device-grade amorphous silicon prepared by high-pressure plasma. Jpn. J. Appl. Phys. 2002, 41, 1947. [Google Scholar] [CrossRef]
  10. Abdel-Fattah, E.; Sugai, H. Combined effects of gas pressure and exciting frequency on electron energy distribution functions in hydrogen capacitively coupled plasmas. Phys. Plasmas 2013, 20, 023501. [Google Scholar] [CrossRef]
  11. Rauscher, H. The interaction of silanes with silicon single crystal surfaces: Microscopic processes and structures. Surf. Sci. Rep. 2001, 42, 207–328. [Google Scholar] [CrossRef]
  12. Lin, D.-S.; Hirschorn, E.S.; Chiang, T.-C.; Tsu, R.; Lubben, D.; Greene, J.E. Scanning-tunneling-microscopy studies of disilane adsorption and pyrolytic growth on Si(100)-(2 × 1). Phys. Rev. B 1992, 45, 3494–3498. [Google Scholar] [CrossRef]
  13. Price, R.W.; Tok, E.S.; Zhang, J. Probing the silane, disilane and germane adsorption kinetics on the silicon (001) surface. J. Cryst. Growth 2000, 209, 306–310. [Google Scholar] [CrossRef]
  14. Park, H.; Yoon, E.; Lee, G.-D.; Kim, H.J. Analysis of surface adsorption kinetics of SiH4 and Si2H6 for deposition of a hydrogenated silicon thin film using intermediate pressure SiH4 plasmas. Appl. Surf. Sci. 2019, 496, 143728. [Google Scholar] [CrossRef]
  15. Lin, D.-S.; Miller, T.; Chiang, T.-C. Adsorption and thermal reactions of disilane and the growth of Si films on Ge(100)-(2 × 1). Phys. Rev. B 1993, 47, 6543–6554. [Google Scholar] [CrossRef]
  16. Xia, L.-Q.; Jones, M.E.; Maity, N.; Engstrom, J.R. Dissociation and pyrolysis of Si2H6 on Si surfaces: The influence of surface structure and adlayer composition. J. Chem. Phys. 1995, 103, 1691–1701. [Google Scholar] [CrossRef]
  17. Suemitsu, M.; Nakazawa, H.; Morita, T.; Miyamoto, N. Observation of hydrogen-coverage- and temperature-dependent adsorption kinetics of disilane on Si(100) during Si gas-source molecular beam epitaxy. Jpn. J. Appl. Phys. 1997, 36, L625–L628. [Google Scholar] [CrossRef]
  18. Niwano, M.; Shinohara, M.; Neo, Y.; Yokoo, K. Si2H6 adsorption and hydrogen desorption on Si(100) investigated by infrared spectroscopy. Appl. Surf. Sci. 2000, 162, 111–115. [Google Scholar] [CrossRef]
  19. Buss, R.J.; Ho, P.; Breiland, W.G.; Coltrin, M.E. Reactive sticking coefficients for silane and disilane on polycrystalline silicon. J. Appl. Phys. 1988, 63, 2808–2819. [Google Scholar] [CrossRef]
  20. Bramblett, T.R.; Lu, Q.; Karasawa, T.; Hasan, M.-A.; Jo, S.K.; Greene, J.E. Si(001)2 × 1 gas-source molecular-beam epitaxy from Si2H6: Growth kinetics and boron doping. J. Appl. Phys. 1994, 76, 1884–1888. [Google Scholar] [CrossRef]
  21. Hu, X.F.; Xu, Z.; Lim, D.; Downer, M.C.; Parkinson, P.S.; Gong, B.; Hess, G.; Ekerdt, J.G. In situ optical second-harmonic-generation monitoring of disilane adsorption and hydrogen desorption during epitaxial growth on Si(001). Appl. Phys. Lett. 1997, 71, 1376–1378. [Google Scholar] [CrossRef]
  22. Le, T.N.-M.; Raghunath, P.; Huynh, L.K.; Lin, M.C. A computational study on the adsorption configurations and reactions of SiHx(x = 1-4) on clean and H-covered Si(100) surfaces. Appl. Surf. Sci. 2016, 387, 546–556. [Google Scholar] [CrossRef]
  23. Perdew, J.P.; Burke, K.; Ernzerhof, M. Generalized gradient approximation made simple. Phys. Rev. Lett. 1996, 77, 3865–3868. [Google Scholar] [CrossRef] [Green Version]
  24. Kresse, G.; Furthmüller, J. Efficient iterative schemes for ab initio total-energy calculations using a plane-wave basis set. Phys. Rev. B 1996, 54, 11169–11186. [Google Scholar] [CrossRef] [PubMed]
  25. Kittel, C. Introduction to Solid State Physics, 8th ed.; Wiley: New York, NY, USA, 2004. [Google Scholar]
  26. Kim, H.J.; Lee, H.J. 2D fluid model analysis for the effect of 3D gas flow on a capacitively coupled plasma deposition reactor. Plasma Sources Sci. Technol. 2016, 25, 035006. [Google Scholar] [CrossRef]
  27. Kim, H.J.; Lee, H.J. Numerical analysis of the effect of electrode spacing on deposition rate profiles in a capacitively coupled plasma reactor. Plasma Sources Sci. Technol. 2016, 25, 065006. [Google Scholar] [CrossRef]
  28. Kim, H.J.; Lee, H.J. Analysis of intermediate pressure SiH4/He capacitively coupled plasma for deposition of an amorphous hydrogenated silicon film in consideration of thermal diffusion effects. Plasma Sources Sci. Technol. 2017, 26, 085003. [Google Scholar] [CrossRef]
  29. Kim, H.J.; Lee, H.J. Uniformity control of the deposition rate profile of a-Si:H film by gas velocity and temperature distributions in a capacitively coupled plasma reactor. J. Appl. Phys. 2018, 123, 113302. [Google Scholar] [CrossRef]
  30. Kim, H.J. Effect of electrode heating on the distribution of the ion production rate in a capacitively coupled plasma deposition reactor in consideration of thermal decomposition. Vacuum 2021, 189, 110264. [Google Scholar] [CrossRef]
  31. ESI Group. CFD-ACE+ 2020.0 Manual; ESI US R&D Inc.: Huntsville, AL, USA, 2020. [Google Scholar]
  32. Perrin, J.; Leroy, O.; Bordage, M.C. Cross-sections, rate constants and transport coefficients in silane plasma chemistry. Contrib. Plasma Phys. 1996, 36, 3–49. [Google Scholar] [CrossRef]
  33. Perrin, J.; Shiratani, M.; Kae-Nune, P.; Videlot, H.; Jolly, J.; Guillon, J. Surface reaction probabilities and kinetics of H, SiH3, Si2H5, CH3, and C2H5 during deposition of a-Si:H and a-C:H from H2, SiH4, and CH4 discharges. J. Vac. Sci. Technol. A. 1998, 16, 278. [Google Scholar] [CrossRef]
  34. Babaeva, N.Y.; Kushner, M.J. Penetration of plasma into the wafer-focus ring gap in capacitively coupled plasmas. J. Appl. Phys. 2007, 101, 113307. [Google Scholar] [CrossRef] [Green Version]
  35. Agarwal, A.; Rauf, S.; Collins, K. Gas heating mechanisms in capacitively coupled plasmas. Plasma Sources Sci. Technol. 2012, 21, 055012. [Google Scholar] [CrossRef]
  36. Denpoh, K.; Moroz, P.; Kato, T.; Matsukuma, M. Multiscale plasma and feature profile simulations of plasma-enhanced chemical vapor deposition and atomic layer deposition processes for titanium thin film fabrication. Jpn. J. Appl. Phys. 2020, 59, SHHB02. [Google Scholar] [CrossRef]
  37. Bird, R.B.; Stewart, W.E.; Lightfoot, E.N. Transport Phenomena; John Wiley & Sons, Inc.: New York, NY, USA, 2007. [Google Scholar]
  38. Shi, J.; Tok, E.S.; Kang, H.C. The dissociative adsorption of silane and disilane on Si(100)-(2 × 1). J. Chem. Phys. 2007, 127, 164713. [Google Scholar] [CrossRef] [PubMed]
  39. Paulus, B.; Rościszewski, K.; Stoll, H.; Birkenheuer, U. Ab initio incremental correlation treatment with non-orthogonal localized orbitals. Phys. Chem. Chem. Phys. 2003, 5, 5523–5529. [Google Scholar] [CrossRef]
  40. Sobolewski, M.A. Power coupling and utilization efficiencies of silicon-depositing plasmas in mixtures of H2, SiH4, Si2H6, and Si3H8. J. Vac. Sci. Technol. A 2014, 32, 041307. [Google Scholar] [CrossRef]
  41. Leroy, O.; Gousset, G.; Alves, L.L.; Perrin, J.; Jolly, J. Two-dimensional modelling of SiH4-H2 radio-frequency discharges for a-Si:H deposition. Plasma Sources Sci. Technol. 1998, 7, 348. [Google Scholar] [CrossRef]
Figure 1. Density functional theory (DFT) calculation results describing most probable hydrogen configurations on top-layer of the H-50% covered Si(001) surface. Configuration (a): all adsorbed hydrogens are in close to each other. Configuration (b,c): all of the two closest hydrogens are far away from the other two closest hydrogens.
Coatings 11 01041 g001
Figure 2. DFT calculation results describing most probable hydrogen configurations on top-layer of the H-50% covered Si(111) surface. Configuration (a): all adsorbed hydrogens are in close to each other. Configuration (b,c): all of the adsorbed hydrogens are slightly apart from the other hydrogens.
Coatings 11 01041 g002
Figure 3. Two geometries and 10 positions of Si2H6 on the H-50% covered Si(001)-(4 × 4) surface. Solid lines and numbers represent the (4 × 4) unit cells and the molecules adsorption sites, respectively. (a) 10 positions; (b) Geometry 1; (c) Geometry 2.
Coatings 11 01041 g003
Figure 4. Two geometries and six positions of Si2H6 on the H–50% covered Si(111)-(4 × 4) surface. Solid lines and numbers represent the (4 × 4) unit cells and the molecules adsorption sites, respectively. (a) 6 positions; (b) Geometry 1; (c) Geometry 2.
Coatings 11 01041 g004
Figure 5. Schematic diagram of our reactor. (a) Spatial variation in the gas temperature (Tg, K). Contour plots of the spatial density profiles (m−3) of (b) H2 and (c) H for r ≥ 120 mm. Based on our DFT results, we modified the surface adsorption model.
Coatings 11 01041 g005
Figure 6. Optimized initial, transition and final structures for the first dissociative reaction step of a Si2H6 molecule on the H-50% covered Si(001) surface.
Coatings 11 01041 g006
Figure 7. Calculated overall energy diagram of Si2H6 dissociative reactions for path a and b on the H-50% covered Si(001) surface.
Coatings 11 01041 g007
Figure 8. Optimized initial, transition and final structures for the first dissociative reaction step of a Si2H6 molecule on the H-50% covered Si(111) surface.
Coatings 11 01041 g008
Figure 9. Calculated overall energy diagram of Si2H6 dissociative reactions for path a and b on the H-50% covered Si(111) surface.
Coatings 11 01041 g009
Figure 10. Effects of the gas pressure on the spatial distributions of plasma variables. Contour plots for the spatial profiles of the time-averaged (a) direct impact ionization rate (kmol m−3 s−1) for pg = 400, 800 and 1200 Pa, (b) electron density (Ne; m−3) for pg = 400, 800 and 1200 Pa, and (c) electron power density (Pe; W m−3) for pg = 400, 800 and 1200 Pa for r ≥ 120 mm.
Coatings 11 01041 g010
Figure 11. Effects of the gas pressure (pg = 400, 800 and 1200 Pa) on the spatial density distribution of neutral species. Contour plots for the spatial profiles of the time-averaged (a) SiH3 density (m−3), (b) SiH2 density (m−3) and (c) Si2H6 density (m−3) for r ≥ 120 mm.
Coatings 11 01041 g011
Figure 12. Deposition rates are plotted along the radial direction for pg = 400 Pa (squares), 800 Pa (triangles) and 1200 Pa (diamonds). (a) Deposition rate profiles for pg = 400 and 800 Pa superimposed with the corresponding experimental data. (b) Relative discrepancy of approximately 15% at pg = 1200 Pa between the deposition rates with and without consideration of Si2H6 adsorption.
Coatings 11 01041 g012
Table 1. Comparison of Einitial adsorbate, Emost stable adsorbate, Erxn and Ea, min and Ea, max (eV) on the H-50% covered Si(001) and Si(111) surfaces.
SchemeEinitial adsorbateEmost stable adsorbateErxnEa, minEa, maxPath
H-50% covered Si(001)−0.40 (Si2H6)−5.32 (Si2H2)−4.920.151.51a
H-50% covered Si(111)−0.22 (Si2H6)−6.16 (Si2H2)−5.870.221.31a
Publisher’s Note: MDPI stays neutral with regard to jurisdictional claims in published maps and institutional affiliations.

