Article

Preparation of Graphene Oxide Composites and Assessment of Their Adsorption Properties for Lanthanum (III)

1
School of Environment and Municipal Engineering, Lanzhou Jiaotong University, No. 88, Anning West Road, Lanzhou 730070, China
2
Engineering Research Center of Comprehensive Utilization of Water Resources in Cold and Drought Areas, Ministry of Education, No. 88, Anning West Road, Lanzhou 730070, China
*
Author to whom correspondence should be addressed.
Coatings 2021, 11(9), 1040; https://doi.org/10.3390/coatings11091040
Submission received: 8 August 2021 / Revised: 24 August 2021 / Accepted: 24 August 2021 / Published: 29 August 2021
(This article belongs to the Special Issue Natural Fiber Based Composites II)

Abstract

:
In this study, graphene oxide (GO) was prepared using the improved Hummers’ method, and GO was carboxylated and modified into hydroxylated graphene oxide (GOH). Diatomaceous earth (DE), which exhibits stable chemical properties, a large specific surface area, and high porosity, as well as chitosan/magnetic chitosan, was loaded by solution blending. Subsequently, carboxylated graphene oxide/diatomite/chitosan (GOH/DCS) and carboxylated graphene oxide/diatomite/magnetic chitosan (GOH/DMCS) composites were prepared through simple solid–liquid separation. The results showed that the modified GOH/DCS and GOH/DMCS composites could be used to remove lanthanum La(III)), which is a rare earth element. Different factors, such as initial solution concentration, pH of the solution, adsorbent dosage, adsorption contact time, and adsorption reaction temperature, on adsorption, were studied, and the adsorption mechanism was explored. An adsorption–desorption recycling experiment was also used to evaluate the recycling performance of the composite material. The results show that at the initial solution concentration of 50 mg·g−1, pH = 8.0, 3 g·L−1 adsorbent dosage, reaction temperature of 45 °C, and adsorption time of 50 min, the adsorption effect is the best. The adsorption process is more in line with the pseudo-second-order kinetic model and Langmuir model, and the internal diffusion is not the only controlling effect. The adsorption process is an endothermic and spontaneous chemical adsorption process. The maximum adsorption capacity of GOH/DMCS for La(III) at 308K is 302.51 mg/g through model simulation. After four adsorption–desorption cycles, the adsorption capacity of the GOH/DMCS composite for La(III) initially exceeded 74%. So, GOH/DMCS can be used as a reusable and efficient adsorbent.

1. Introduction

Lanthanum (La) is a metal used in optical glasses, alloys, catalysts, and ceramics [1]. To extract trace elements of this rare earth metal, significant quantities of water and chemical reagents are needed, through a variety of chemical procedures. As a result, chemical reagents, rare earth elements, and radioactive substances end up in wastewater, which destroys surrounding vegetation, causing serious environmental pollution and affecting the lives of nearby residents [2].
Treating wastewater that contains rare earth elements is a complex and universal ecological problem. Membrane separation, photocatalysis, electrolysis, ion exchange, and adsorption are commonly used for wastewater treatment. The adsorption method is widely used because of its many advantages, such as low cost, a wide range of applications, ease of operation, and effectiveness in removing pollutants from the water [3]. For instance, Iannicelli-Zubiani et al. [4] developed an effective adsorbent for aqueous rare earths recovery, in which activated carbon (AC) was modified with pentaethylenehexamine. The strong improvement in the efficiency values detected by using modified carbons (uptake 100% until initial concentrations of about 2600 ppm and release over 95%) demonstrated that the coordination mechanism due to the modifying agent is effective. Abdel-Magied et al. [5] studied the adsorption properties of rare earth lanthanum by hierarchical porous zeolitic imidazolate frameworks nanoparticles (ZIF-8 NPs) prepared by a template-free method at room temperature using water. Adsorption equilibrium was reached after 7 h and moderate adsorption capacity was obtained for lanthanum (28.8 mg·g‒1) at a pH of 7.0. Kusrini et al. [6] investigated a biosorbent derived from the inner part of durian (Durio zibethinus) rinds. La ion was efficiently adsorbed by the biosorbent with optimum adsorption capacity as high as 71 mg La per gram biosorbent. The removal of lanthanum is due to the favorable chelation and strong chemical interactions between the functional groups on the surface of the biosorbent and the metal ions. If the REE concentration in wastewater is high, biological adsorption, extraction, and traditional zeolite, clay, and activated carbon adsorption can be used. Among the above methods, adsorption has been widely concerned and applied because of its simple operation, low cost, and high efficiency. Nanomaterials (NMs) provide a promising technology for wastewater with very low REE concentration because of its potential high adsorption efficiency as an adsorbent. Thus, research on the preparation and modification of efficient and reusable nanomaterials adsorbents is an essential part of realizing sustainable industrial development, protecting the environment and reducing pollution.
Nanomaterial adsorbents have many excellent physical and chemical properties, but there are limits to their applications [7]. Graphene oxide (GO), a graphene derivative, easily aggregates or accumulates between layers, with a decreased adsorption specific surface area that can weaken its adsorption effects [8,9]. Thus, modified GO materials have become a hot research topic. Nanocomposites are sometimes known as free radical substitutes in traditionally filled or blended polymers [10]. However, graphene oxide sheets can only be dispersed in aqueous media that are incompatible with most organic polymers due to their hydrophilic properties.
Presently, there are only two methods to modify the hydrophilicity of graphene oxide: magnetic modification [10] and chemical functionalization. In chemical functionalization, the exfoliation behavior of graphite oxide can be changed by modifying its surface properties, and functional groups such as amide and carbamate bonds will form on the carboxyl and hydroxyl groups of graphite oxide, respectively. As a result, this reduces the hydrophilicity of graphene oxide sheets [11].
Nanomaterials have a paradoxical combination of excellent performance with restricting limitations [12]. This makes them a vital topic for developing and preparing high-efficiency and recyclable green adsorbents to improve the adsorption and removal of water pollutants by the modification of graphene oxide-based materials. Specifically, one area of concern is that graphene oxide-based composite materials are difficult to separate from water [13]. Therefore, this study provides a reference for the removal of heavy metals from wastewater, to alleviate water pollution and facilitate ecological construction.
In this work, magnetic modified chitosan (CS) was compounded with hydroxylated graphene oxide (GOH) and diatomaceous earth (DE). This study focused on enhancing the adsorption capacity and effectively reducing the hydrophilicity of graphene oxide sheets, as well as creating graphene oxide-based composite materials that are easily separated in water to realize material recycling. We assessed the adsorption behavior of La(III) by diatomite and magnetic chitosan-modified graphene oxide-based adsorbents. In addition, scanning electron microscopy (SEM), Fourier transform infrared spectroscopy (FTIR), X-ray diffraction (XRD), zeta potential analysis (Zeta potential), and a vibrating sample magnetometer (PPMS-VSM) were used to characterize the materials, surface morphology, chemical structures, compositions, and their physical and magnetic properties. The modified composite materials (GOH/DCS and GOH/DMCS) were used for static adsorption experiments on the target pollutant, La(III), and the effects of five factors on the adsorption effect were investigated. Specifically, the initial concentration of the solution, pH value of the solution, adsorbent dosage, adsorption contact time, and the adsorption reaction temperature were assessed. The adsorption process was fitted and analyzed by adsorption kinetics, isotherms, and thermodynamics. Then, regeneration experiments to assess the adsorption saturated GOH/DMCS were carried out to evaluate the regeneration performance of the composites.

2. Materials and Methods

2.1. Chemicals and Reagents

All chemical reagents used for testing were analytically pure or of a higher grade, including graphite powder, H2SO4, H3PO4, KMnO4, H2O2, HCl, absolute ethanol, NaOH, C2H3ClO2, diatomite, chitosan (CS, deacetylation degree > 90%), CH3COOH, nano Fe3O4, and C5H8O2. All aqueous solutions were prepared with deionized water.

2.2. Preparation of Materials

Graphene oxide was prepared using the improved Hummers’ method [14]. The prepared graphite oxide was ultrasonically treated in deionized water for 30 min to fully disperse and exfoliate the graphite oxide, and the GO hydrosol concentration was 2 g/L. Then, 2.0 g of sodium hydroxide was added and stirred until completely dissolved, which was followed by the addition of 3.0 g of chloroacetic acid, which was ultrasonically dispersing for 1 h. Then, the solution was magnetically stirred for 24 h under constant heating at a temperature of 25 °C, and the mixed solution was centrifuged and washed with anhydrous ethanol three times. Afterward, the mixture was washed with ample amounts of deionized water several times until the pH was close to 6.0. Then, the mixed solution was dried in an oven at 60 °C and grounded and sieved with a 200-mesh sieve to obtain the carboxylated graphite oxide. Finally, the carboxylated graphite oxide was uniformly dispersed in quantitative distilled water by ultrasonic stripping to prepare the carboxylated graphene oxide hydrosol (GOH) at a concentration of 2 g/L.
To prepare the magnetic chitosan, 0.3 g of chitosan was dissolved in 50 mL of 2% glacial acetic acid solution and heated and stirred until completely dissolved. Then, 0.15 g of nano Fe3O4 was added to the above solution and mechanically stirred until it was thoroughly dispersed in the chitosan solution. Then, 2.0 mL of glutaraldehyde was added to the mixed solution and mechanically stirred at 60 °C for 4 h. The obtained product was washed with ethanol and deionized water several times until it reached a pH of 6, and then, it was dried in a vacuum drying oven at 60 °C for 12 h. Finally, magnetic chitosan (MCS) was prepared by grinding and sieving with a 200-mesh sieve.
The prepared carboxylated graphite oxide was ultrasonically treated in deionized water for 30 min, and the GOH hydrosol concentration was 2 g/L. First, 1.0 g of chitosan was weighed and added to 50 mL of 3% glacial acetic acid solution, heated, and stirred until it was fully dissolved. Then, 3 g of diatomite was added into the GO-COOH suspension, which was returned to room temperature. Then, it was ultrasonicated for 1 h, magnetically stirred for 12 h, and vacuum filtrated after washing with water. Then, the material was dried to achieve a constant weight in a drying oven at 60 °C, after which it was removed, ground, and placed through a 200-mesh sieve to prepare the carboxylated graphene oxide/diatomite/chitosan (GOH/DCS) material.
The prepared carboxylated graphite oxide was ultrasonically treated in deionized water for 30 min. The concentration of the GO hydrosol was 2 g/L. First, 1.0 g of magnetic chitosan and 3 g of diatomite were weighed and added to the suspension of GO-COOH in turn, ultrasonicated for 1 h, and magnetically stirred for 12 h. The obtained product was washed with ethanol and deionized water several times until the pH was 6 and then dried in a vacuum drying oven at 60 °C for 12 h. Finally, the product was grounded and screened with a 200-mesh sieve to prepare the carboxylated graphene oxide/diatomite/magnetic chitosan (GOH/DMCS) composite material.

2.3. Testing and Characterization

The materials were characterized by scanning electron microscope (SEM), Fourier transform infrared spectroscopy (FT-IR), X-ray diffraction (XRD), zeta potential analysis, and vibrating sample magnetometer (PPMS-VSM). The basic information of the instruments is shown in Table 1.

2.4. Adsorption Experiment

To study the adsorption behavior of GOH/DCS and GOH/DMCS, several groups of 25 mL and 25 mg/L of rare earth La(III) solutions were taken, and the effects of diatomite dosage, adsorption time, pH value, adsorption temperature, adsorbent dosage, and initial concentration of La(III) solution on the adsorption of La(III) by composite materials were studied. Next, a filter with a 0.45-μm pore size and the absorbance of the filtered supernatant with arsenazo III spectrophotometer was measured, the adsorption efficiency (w) and adsorption capacity (qe) were calculated, and the pH value of each suspension with hydrochloric acid and sodium hydroxide was controlled.
The equilibrium adsorption capacity (qe) and adsorption rate (w) of La(III) by GOH/DCS and GOH/DMCS were calculated according to Equation (1) and Equation (2), respectively.
q e = ( C 0 C e ) V m
w = ( C 0 C e ) C 0 × 100 %
where qe is the adsorption capacity (mg/g); C0 is the initial concentration of the solution, mg/L; Ce is the concentration of La(III) in the solution after adsorption equilibrium, mg/L; V is the liquid volume, mL; m is the amount of adsorbent (mg); and w is the adsorption rate (%).
Magnetic separation was carried out on the adsorption saturated GOH/DMCS composite material from the solution. Then, it was placed in 0.2 mol/L HNO3 desorption solution, at room temperature of 25 °C, oscillating frequency of 250 r/min, oscillating for t min to desorb until desorption equilibrium. Then, the absorbance of filtered supernatant was measured by arsenazo III spectrophotometer, and the desorption rate was calculated. The GOH/DMCS composite material after magnetic separation is cleaned to neutrality by deionized water many times, dried in an oven at 60 °C, and the above adsorption–desorption experimental operation is continuously circulated.
According to Equation (3), the desorption rate of rare earth element La(III) by GOH/DMCS was calculated.
R d = V   C e   M   q e × 100 %
where Rd is the desorption rate, %; Ce is the concentration of La(III) in the desorbed solution, mg/L; V is the volume of liquid, L; M is the amount of adsorbent (g); and qe is the adsorption capacity (mg/g).

2.5. Adsorption Kinetics, Adsorption Isotherms, and Adsorption Thermodynamics Experiments

2.5.1. Adsorption Kinetics

In order to quantify the change law of adsorption with time, describe the solute absorption rate, and reveal the mechanism involved in the adsorption process, the experimental data are processed by pseudo-first order kinetics, pseudo-second order kinetics, and internal diffusion model equations, which are as follows [15]:
ln ( q e q t ) = ln q e k 1 t
t q t = 1 q e 2 k 2 + t q e
q t = k d t 1 / 2 + C
where t (min) is the adsorption time, qe (mg·g1) and qt (mg·g−1) are the equilibrium adsorption capacity and adsorption capacity at time t, respectively. k1 (min−1), k2 (g·(mg·min)−1), and kd (mg·g−1·min−1/2) are the pseudo-first order kinetics, pseudo-second order kinetics, and diffusion rate constants in particles, respectively. C is the boundary layer constant.

2.5.2. Adsorption Isotherm

Adsorption isotherm study is of great significance to determine the adsorption capacity of La(III) on modified GOH/DMCS composites. Langmuir and Freundlich isotherm models are used to analyze adsorption data [16].
The linear equations of Langmuir and Freundlich isothermal models are as follows:
C e q e = C e q m + 1 q m · K L
ln q e = ln K F + 1 n ln C e
where Ce (mg·L−1) is the concentration of La(III) at adsorption equilibrium, qe (mg·g−1) is the adsorption capacity at adsorption equilibrium, qm is the maximum adsorption capacity (mg·g−1), KL is the Langmuir constant (L·mg−1) and KF is the Freundlich constant (mg·g−1)
The dimensionless parameter RL can further analyze the adsorption process. When RL = 0, the adsorption process is irreversible. When RL = 0~1, the adsorption process is favorable. When RL > 1, it is unfavorable for adsorption. The calculation formula is as follows:
R L = 1 1 + C 0 K L
where C0 is the initial concentration of solution, mg/L.

2.5.3. Adsorption Thermodynamics

Adsorption thermodynamics uses three calculated thermodynamic parameters, namely Gibbs free energy change (ΔG0), enthalpy change (ΔH0), and entropy change (ΔS0), to study the degree and driving force of adsorption process. Gibbs energy change (ΔG0) indicates the degree of spontaneity in the adsorption process, while the higher negative value reflects that it is more beneficial to adsorption in the adsorption process. Enthalpy change (ΔH0), which is the change of enthalpy of an object, is a thermodynamic energy state function, which indicates that the adsorption process belongs to endothermic or exothermic reaction. Entropy change (ΔS0) reflects the disorder or disorder degree of the interface between solid and solution during adsorption [17].
ΔH0 and ΔS0 are calculated by the van’t Hoff Equation:
ln K d = Δ H 0 R T + Δ S 0 R
where Kd is dispersion coefficient, L/g; ΔH0 is enthalpy change, KJ·mol−1; R is gas constant, 8.31 × 10⁻³ KJ·mol−1·k−1; T is absolute temperature, K; and ΔS0 is entropy change, J·K−1·mol−1.
ΔG0 is calculated using the following Equation:
Δ G 0 = R T ln K d
K d = q e C e
Thereinto, the change of Gibbs free energy of ΔG0 is KJ·mol−1.

3. Results and Discussion

3.1. Material Characterization

As shown in 
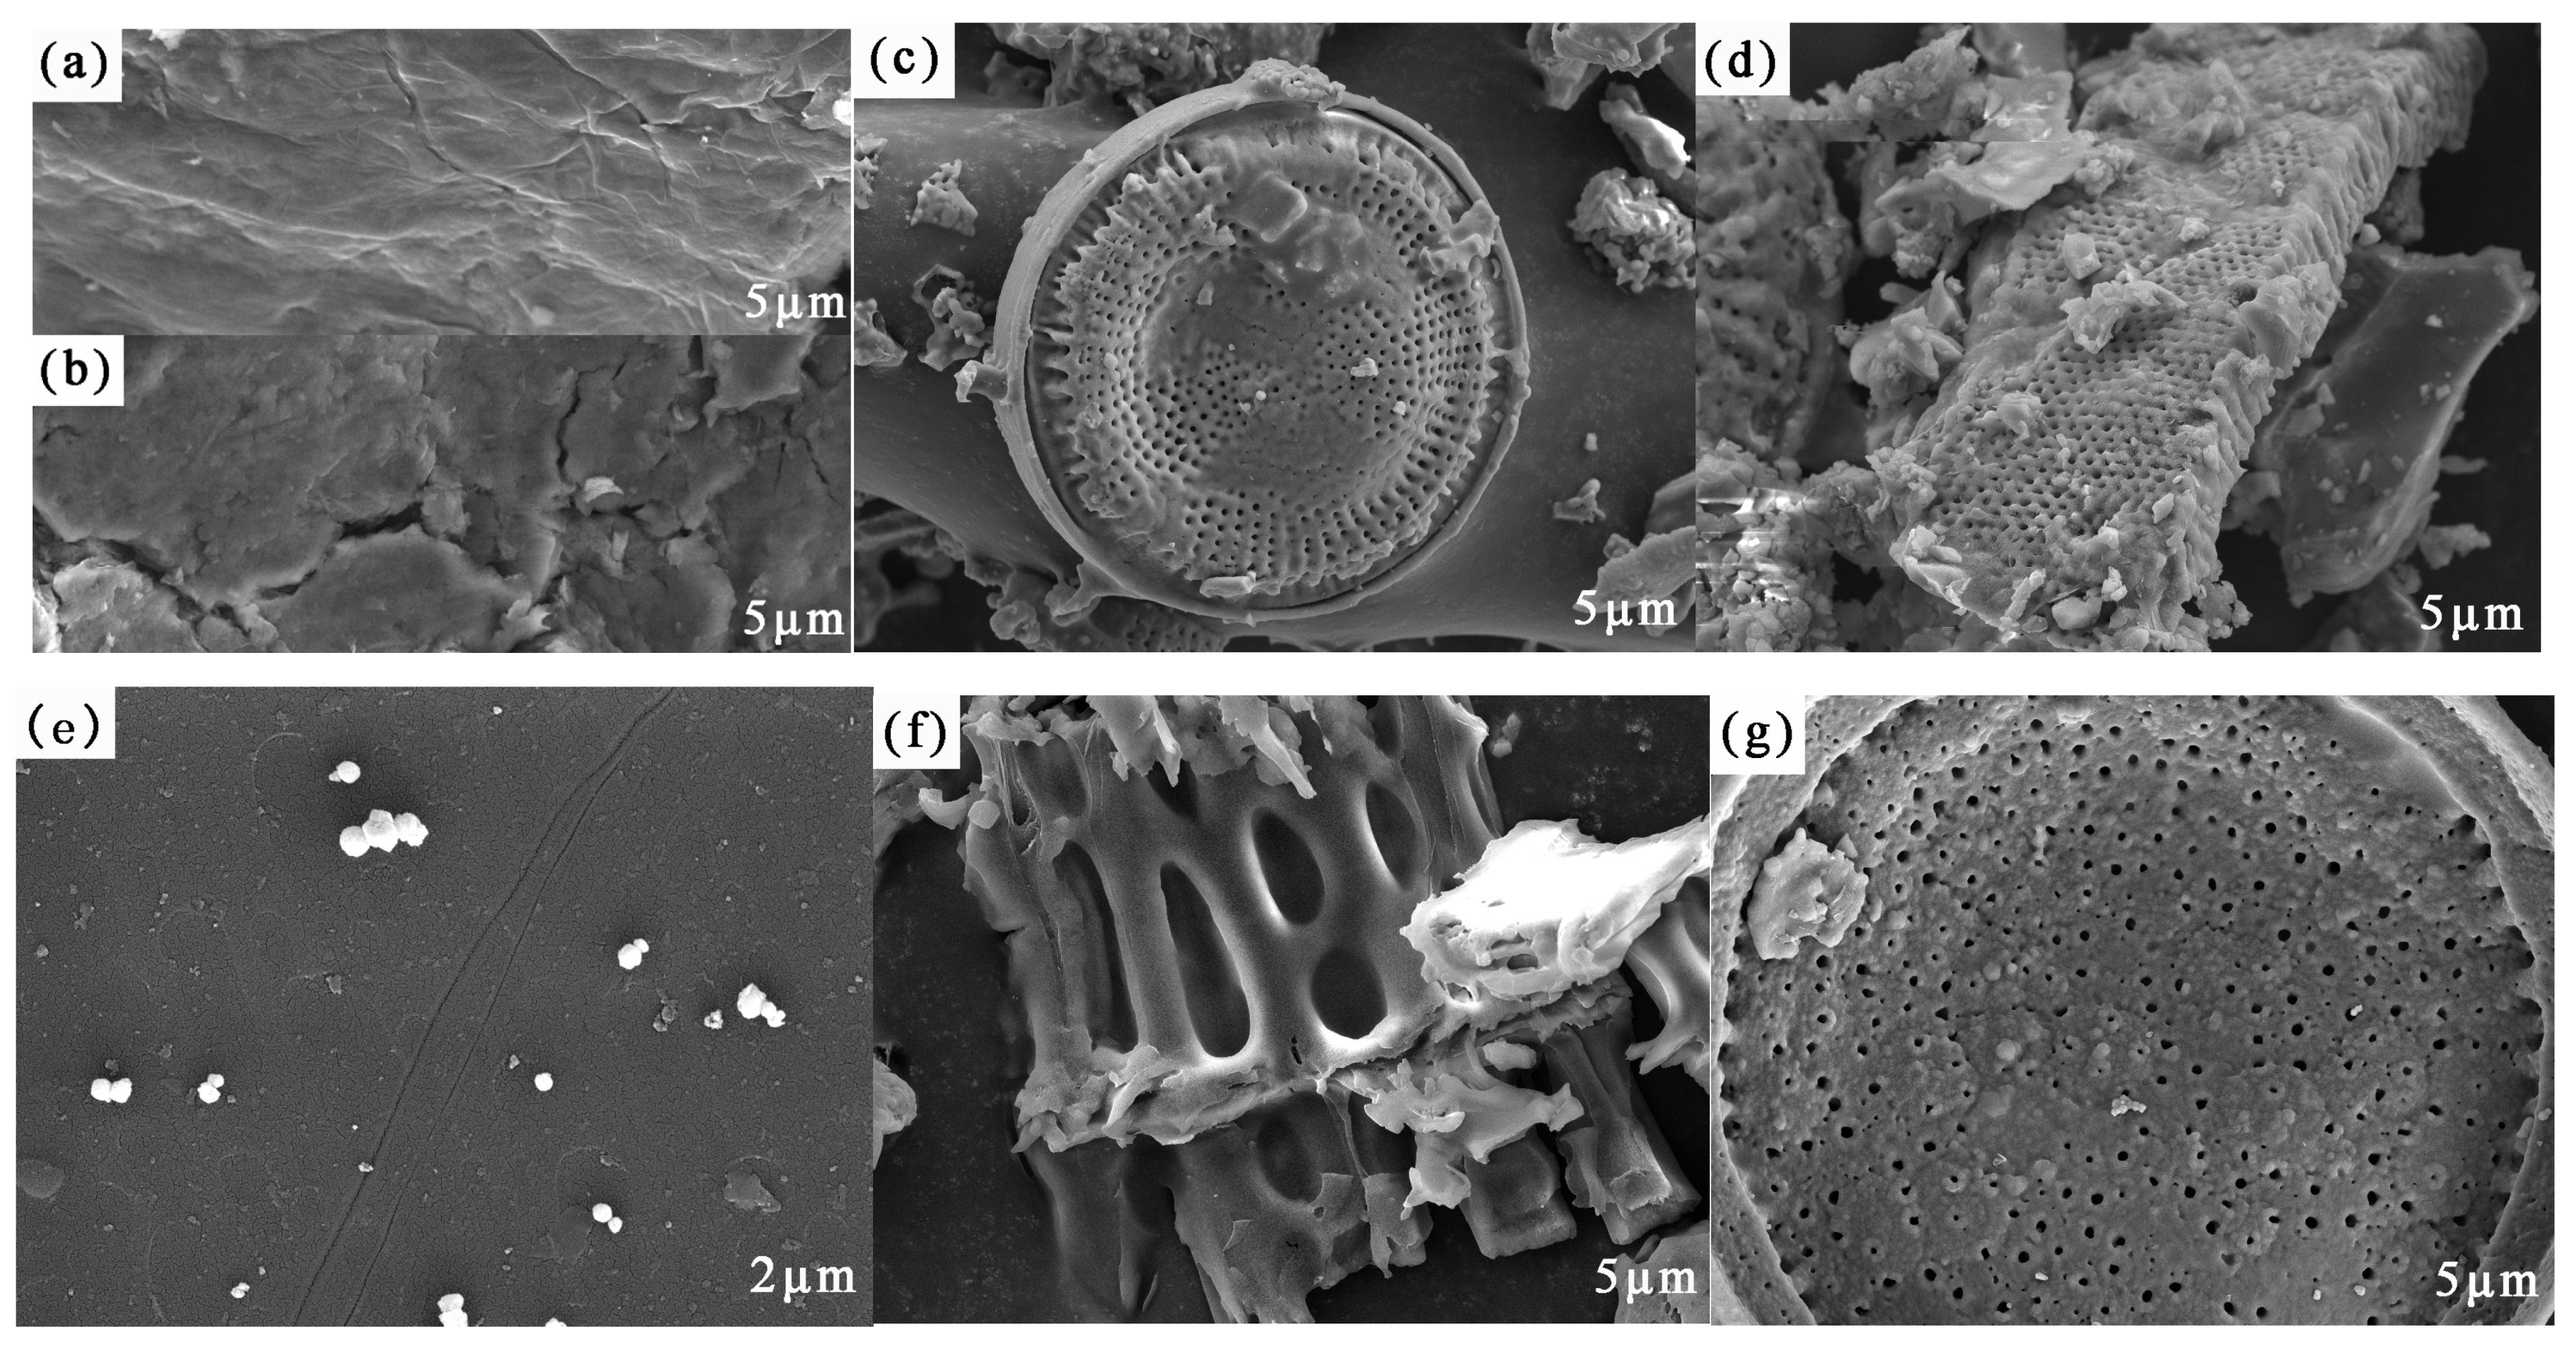
Figure 1, the surface of GO (a) prepared by the improved Hummers’ method was smooth, with an accumulated flaky structure and numerous wrinkles. Compared with the GO, the surface of GOH (b) was relatively rough, with numerous irregular wrinkles and cracks, which were possibly due to the activation of the epoxide and ester groups, and the conversion of hydroxyl groups (−OH) into carboxyl groups (–COOH) [18,19]. As observed in the SEM image (c) of the pretreated DE, DE was disc-shaped with a smooth surface and regular porosity [20]. Many impurities were observed on the diatomite surface. Acidification pre-treatment was used to remove impurities and to better prepare adsorbents for integrating with the composite materials. Thus, the internal structure of CS (d) was solid and filamentous, with a relatively rough surface and porous structure. The SEM image of MCS (e) showed that the chitosan was grainy after magnetic modification, with agglomerated white round particles, and the diameter of the magnetic particles was about 30 nm [21]. In the SEM image (f) of GOH/DCS, the interior of the modified adsorption material still showed the appearance of regular and large pores, thus increasing the specific surface area of the sheet structure. The increase in pore structure and the specific surface area provided a greater possibility for the adsorption of the rare earth La elements [22]. Furthermore, GOH/DMCS (g) had a fold on the porous disk structure, which differed from those on the DE surface, which was covered with a thick layer of folds, increasing the dispersity. This was attributed to the successful compounding of the carboxylated graphene oxide and modified materials. In addition, the apparent surface roughness of the intact DE structure, and the irregular adhesion of magnetic chitosan particles on the surface of the modified materials, confirmed the successful preparation of the magnetic chitosan/diatomite-modified carboxylated graphene oxide.
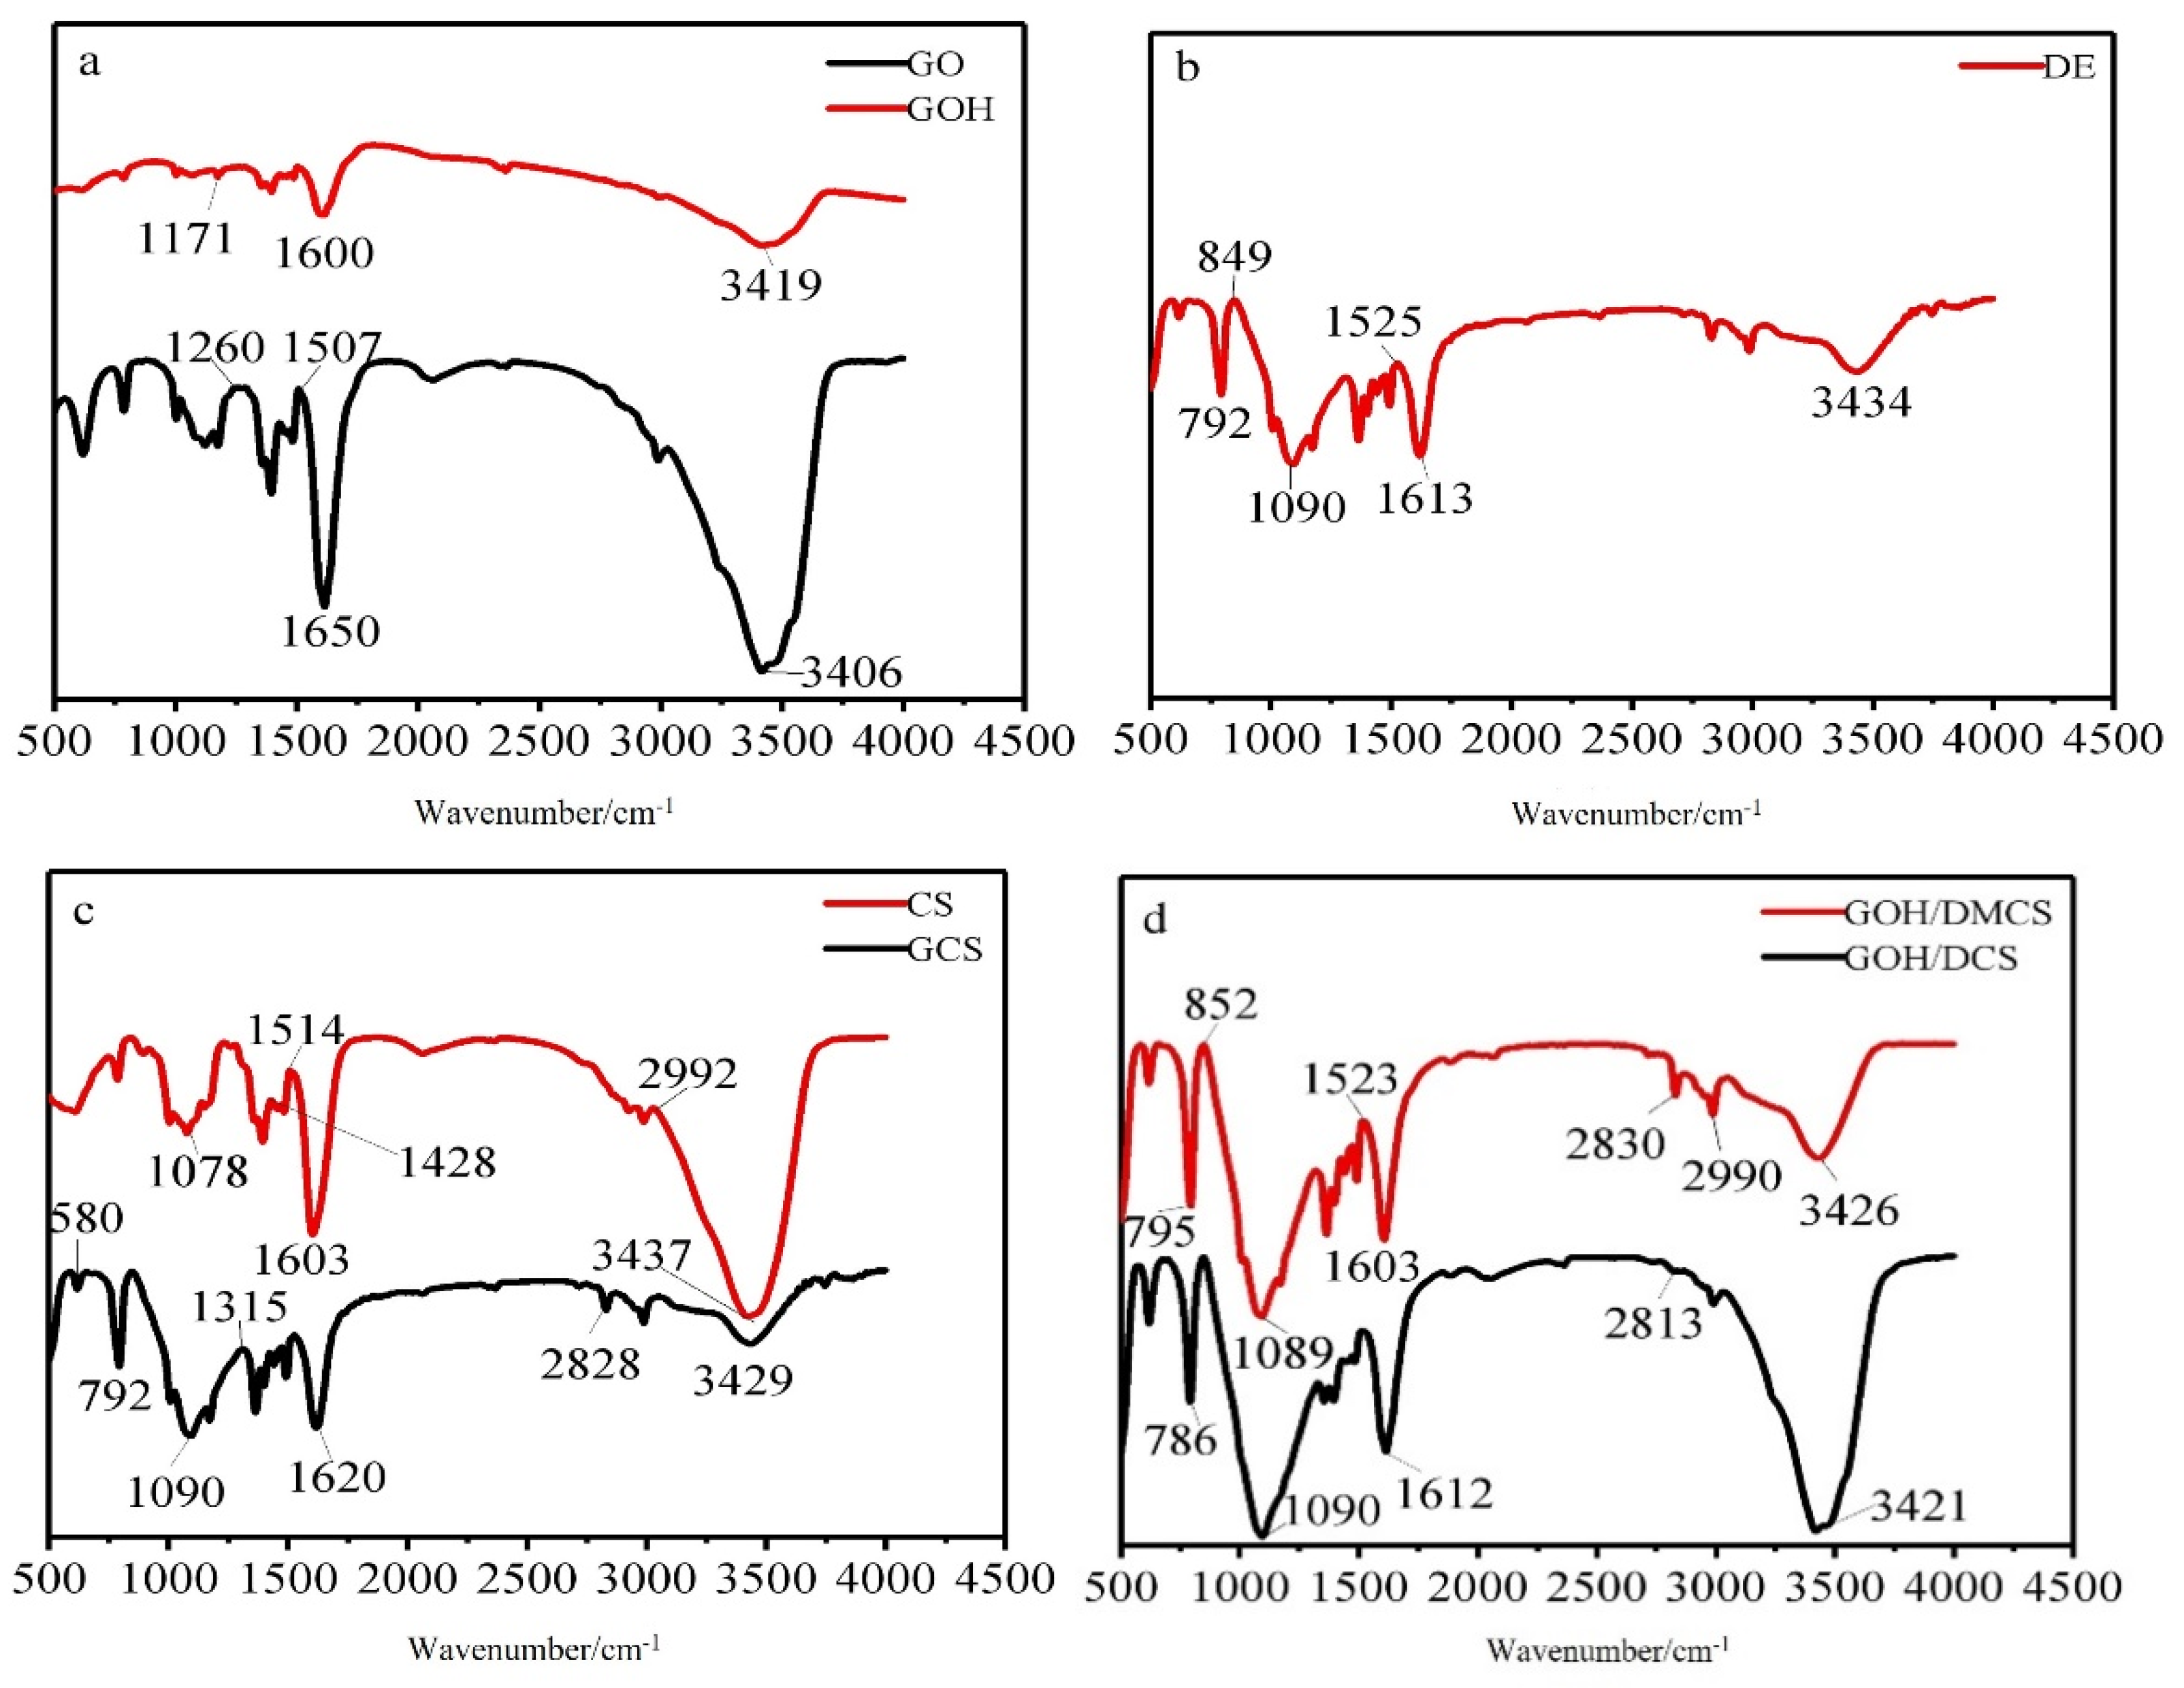
The infrared spectrograms of GO, GOH, DE, CS, GCS, GOH/DCS, and GOH/DMCS are shown in Figure 2. As shown in the FTIR spectrogram for GO in Figure 2a, the prominent peak at 3406 cm−1 corresponds to the asymmetric stretching vibration peak of −OH, while the vibration at 1650 cm−1 was the stretching vibration peak of C=O in the carboxyl group of GO, and C=O was grafted on the edge of GO. The peak at 1507 cm−1 reflected the vibration absorption of the C=C skeleton and the characteristic bending band of the O-H bond in the undamaged aromatic region. The C−O stretching vibration band and C−O−C vibration absorption band appeared at 1260 cm−1 [23]. Many oxygen-containing functional groups appeared in the interlayer and edge of GO, and the above conclusions indicated that GO was successfully prepared by the modified Hummers’ method. For GOH, the FTIR spectrum shows characteristic bands for GO, and a characteristic peak at 1171 cm−1 was attributed to the antisymmetric tensile vibration of C−O−C. Compared with GO, the characteristic bending of the O−H bond and the stretching vibration of C−O for the carboxyl group also appeared at 1600 cm−1. The prominent stretching vibration of −OH in GO shifted from 3406 cm−1, and a less obvious peak appeared at 3419 cm−1 in the FTIR spectrum of GOH, indicating that the carboxyl groups in the alkaline environment replaced some hydroxyl groups in GO. Thus, the FTIR results confirmed the successful preparation of GOH. In the FTIR spectrum of DE Figure 2b, the peak at 3434 cm−1 was attributed to the stretching vibration of the free silanol group (Si−OH). In addition, the bands at 1613 cm−1 and 1525 cm−1 were related to the bending vibrations of water molecules (H−O−H) [24]. The band at 1090 cm−1 reflected the stretching of the siloxane (Si−O−Si) group, while 849 and 792 cm−1 were associated with Si−O tension and SiO−H vibrations. The peak at 572 cm−1 reflected the stretching vibration of Si−O−Si [25,26]. In the FTIR spectrum of CS (c), there were apparent −OH asymmetric stretching vibrations at 3437 cm−1 and N-H stretching vibrations for the absorption peak on −NHCO−. A C−H stretching vibration appeared at 2992 cm−1, and at 1603 cm−1, the stretching vibration of the alcohol hydroxyl group C=O from -NHCO− occurred. The peak at 1514 cm−1 was related to the N-H stretching vibration of −NH2, and a C−H absorption peak appeared at 1428 cm−1. The absorption peak at 1078 cm−1 was attributed to the stretching vibration of C−O. [27] The FTIR spectrum of MCS showed that the characteristic peak at 580 cm−1 was Fe3O4, which indicated that the magnetic particles were successfully loaded. The hydroxyl peak intensity at 3437 cm−1 on CS weakened and moved to the left to 3429 cm−1, which was possibly caused by the interactions between nano-ferric oxide particles and chitosan functional groups during magnetization.
In the FTIR spectrum of GOH/DCS (d), the characteristic peaks of DE and CS appeared beside the characteristic peaks of the carboxyl group. The appearance of NH stretching and the characteristic peak of the amide group at 1612 cm−1 indicated that chitosan was successfully grafted onto the GOH molecule [28]. The typical band of the chitosan polymer (OH) appeared at 3410 cm−1. In addition, 2813 cm−1 corresponded to the C-H tensile absorption band. The modified infrared band was wider and stronger, which indicated that GOH/DCS carried more chitosan. The band at 1090 cm−1 reflected the stretching of the siloxane (Si−O−Si) group in DE. Thus, an SiO−H vibration peak appeared at 786 cm−1.
In summary, the GOH/DCS materials were successfully modified and prepared. In the FTIR spectrum of GOH/DMCS, a shift in the OH stretching vibration peak of the carboxyl group appeared at 3421 cm−1, which indicated that hydrogen bonding occurred between the hydroxyl groups in each material. The other peaks at 786, 1090, and 1612 cm−1 corresponded to the FTIR spectra of DE. Thus, the modification of the carboxylated graphene oxide/diatomite composite did not change the functional group structure of DE, and GOH covered the surface of DE through covalent bonding. Additionally, the carboxyl groups in the carboxylated graphene oxide and original graphene oxide were successfully compounded with GCS through covalent bonding. The electron micrographs also showed that the composite modified by GOH/DMCS retained the DE structure, which was consistent with the obtained FTIR results. Therefore, the excellent properties of DE, such as numerous pores, large specific surface area, and strong adsorption capacity, were retained when the composite was successfully prepared.
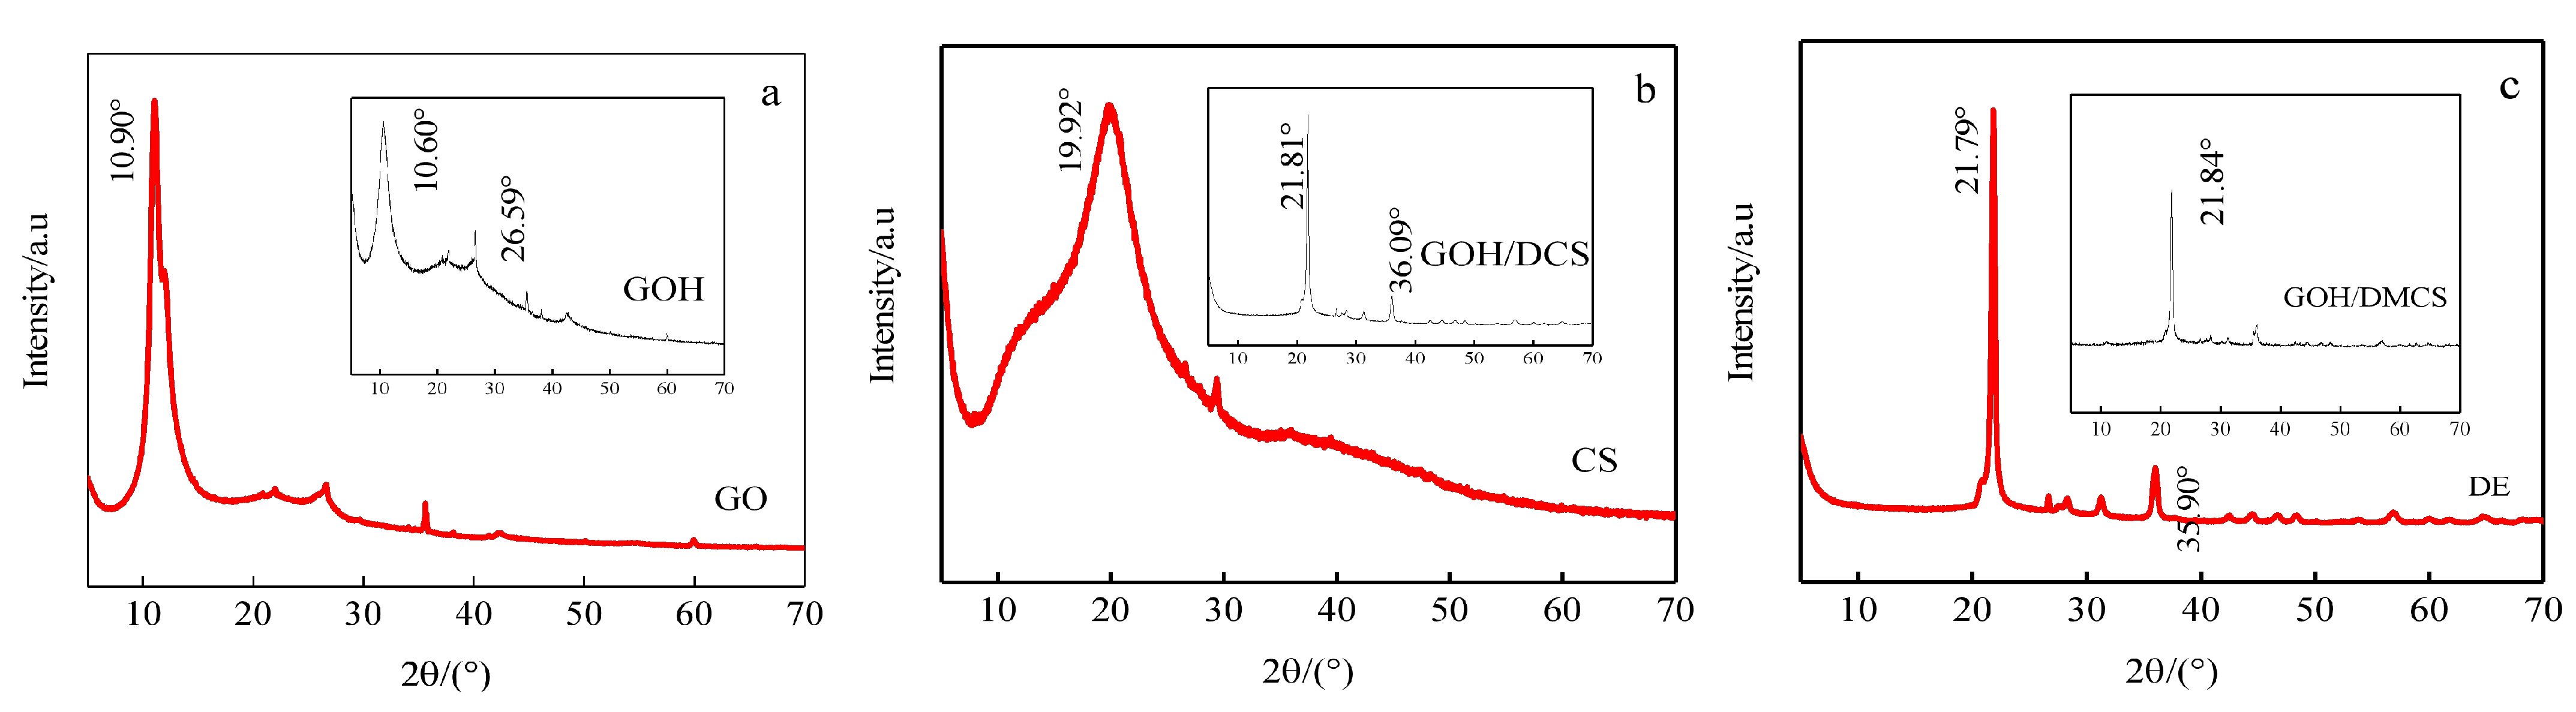
The crystal structure changes in each sample were analyzed by XRD, and the XRD analysis results of GO, GOH, CS, GOH/DCS, DE, and GOH/DMCS are shown in Figure 3. The diffraction peak of the (d001) crystal plane appeared in the GO (a), which was prepared by the improved Hummers’ method at 2θ = 10.9, according to Bragg formula (2dsinθ = nλ), with an interlayer spacing of 0.81 nm. In the XRD results for GOH, the diffraction peak appeared at 2θ = 10.6, and the interlayer spacing was 0.83 nm, which indicated that the diffraction peak of the same crystal plane shifted to a low angle. The calculated results showed that the introduction of chloroacetic acid increased the interlayer spacing of GOH, and a dense layered graphene oxide structure was layered into the disordered sheets of GOH. In addition, carboxylation treatment increased the number of -COOH groups at the edge and interlayers of GO. In the XRD results of CS, (b) the characteristic peak of the amorphous chitosan structure appeared at 2θ = 19.92, and the diffraction peak of the GOH/DCS composite decreased to 2θ = 21.81, indicating that the CS crystal phase content declined. Then, the diffraction peak of GOH appeared again, and the diatomite diffraction peak appeared at 2θ = 36.09. The analysis results showed that GOH was related to DE and CS. In DE(c) and GOH/DMCS, the diffraction peaks were very similar, indicating that silicon dioxide accounted for a large proportion of DE. The diffraction peak of magnetic ferric oxide simultaneously appeared, verifying the successful preparation of the magnetic graphene oxide-based composites.
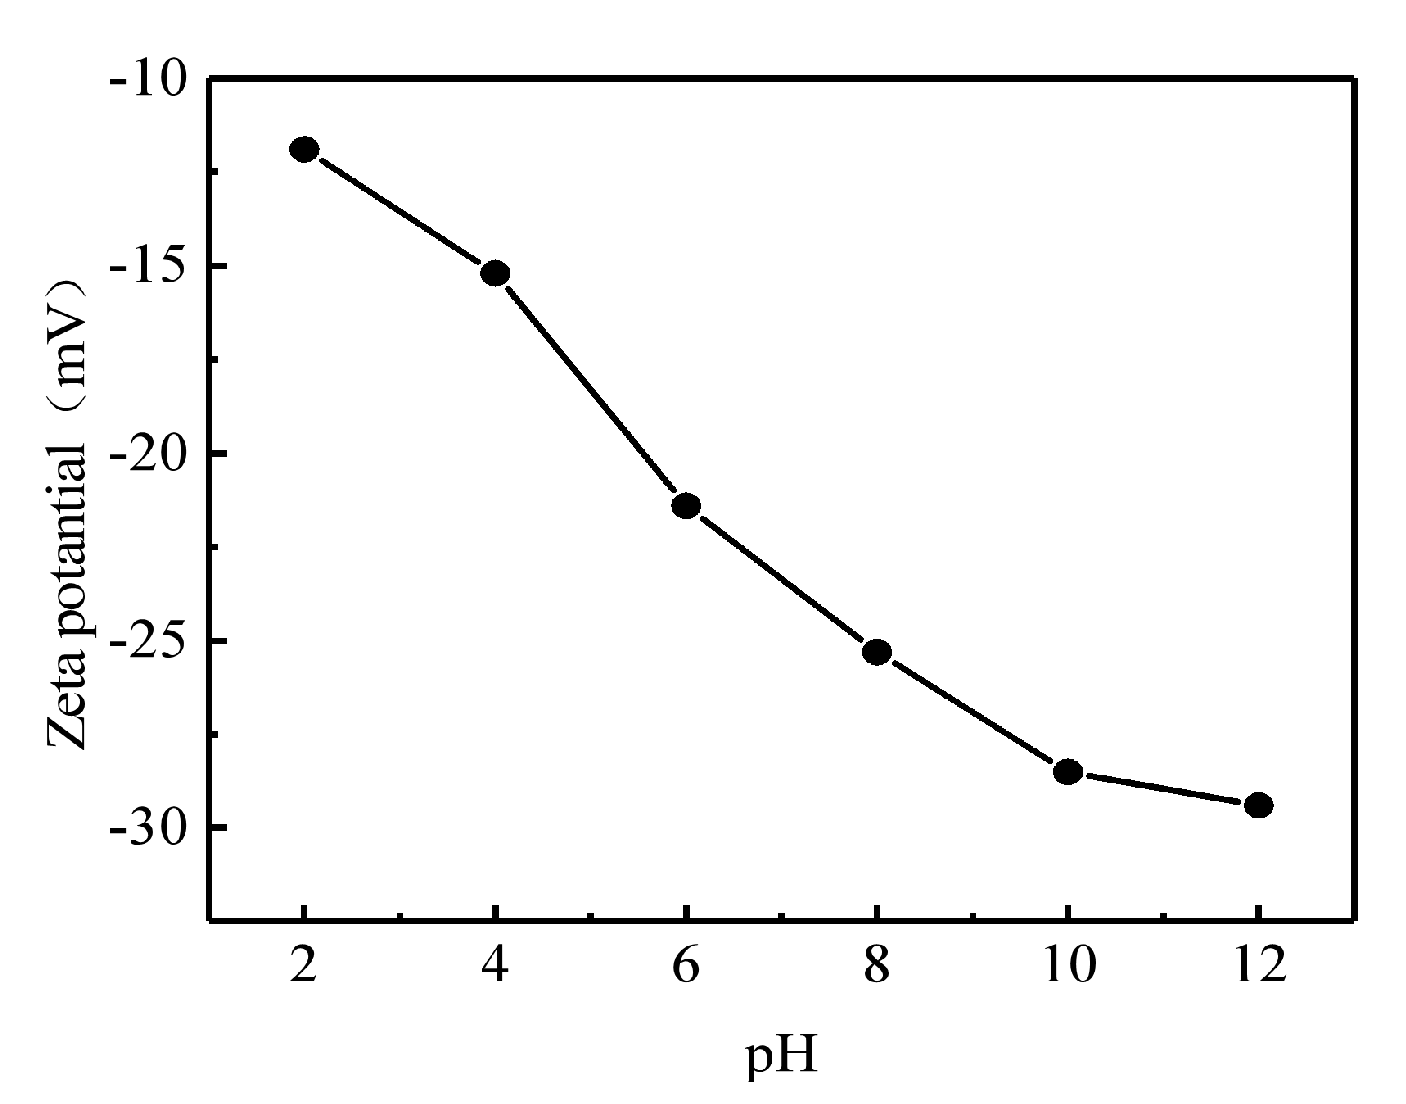
In this work, the zeta potential of GOH/DMCS in the water phase was measured using a Zetasizer Nano S90 potential analyzer from the Malvern company, in a 2–12 pH environment. The zeta potential results of GOH/DMCS are shown in Figure 4. The figure shows that the electronegativity of the GOH/DMCS surface gradually increased from acidic to alkaline with changes in pH, from −11.9 mV at pH = 2 to −30.4 mV at pH = 12. In addition, compared to a potential value of −9.5 mV when the pH of graphene oxide was 2, the electronegativity of the GOH/DMCS surface was enhanced by the oxygen-containing functional groups, which were ionized as they were exposed to electricity in the aqueous solution.
As shown from the negative zeta potential results under acid and alkaline conditions, the entire surface of the material became negatively charged, which was beneficial for the adsorption of positively charged rare earth La3+ elements. The negative charge density on the GOH/DMCS surface also increased with increased pH, and the sol stability of the composite material also increased. This did not cause aggregation when in solution form.
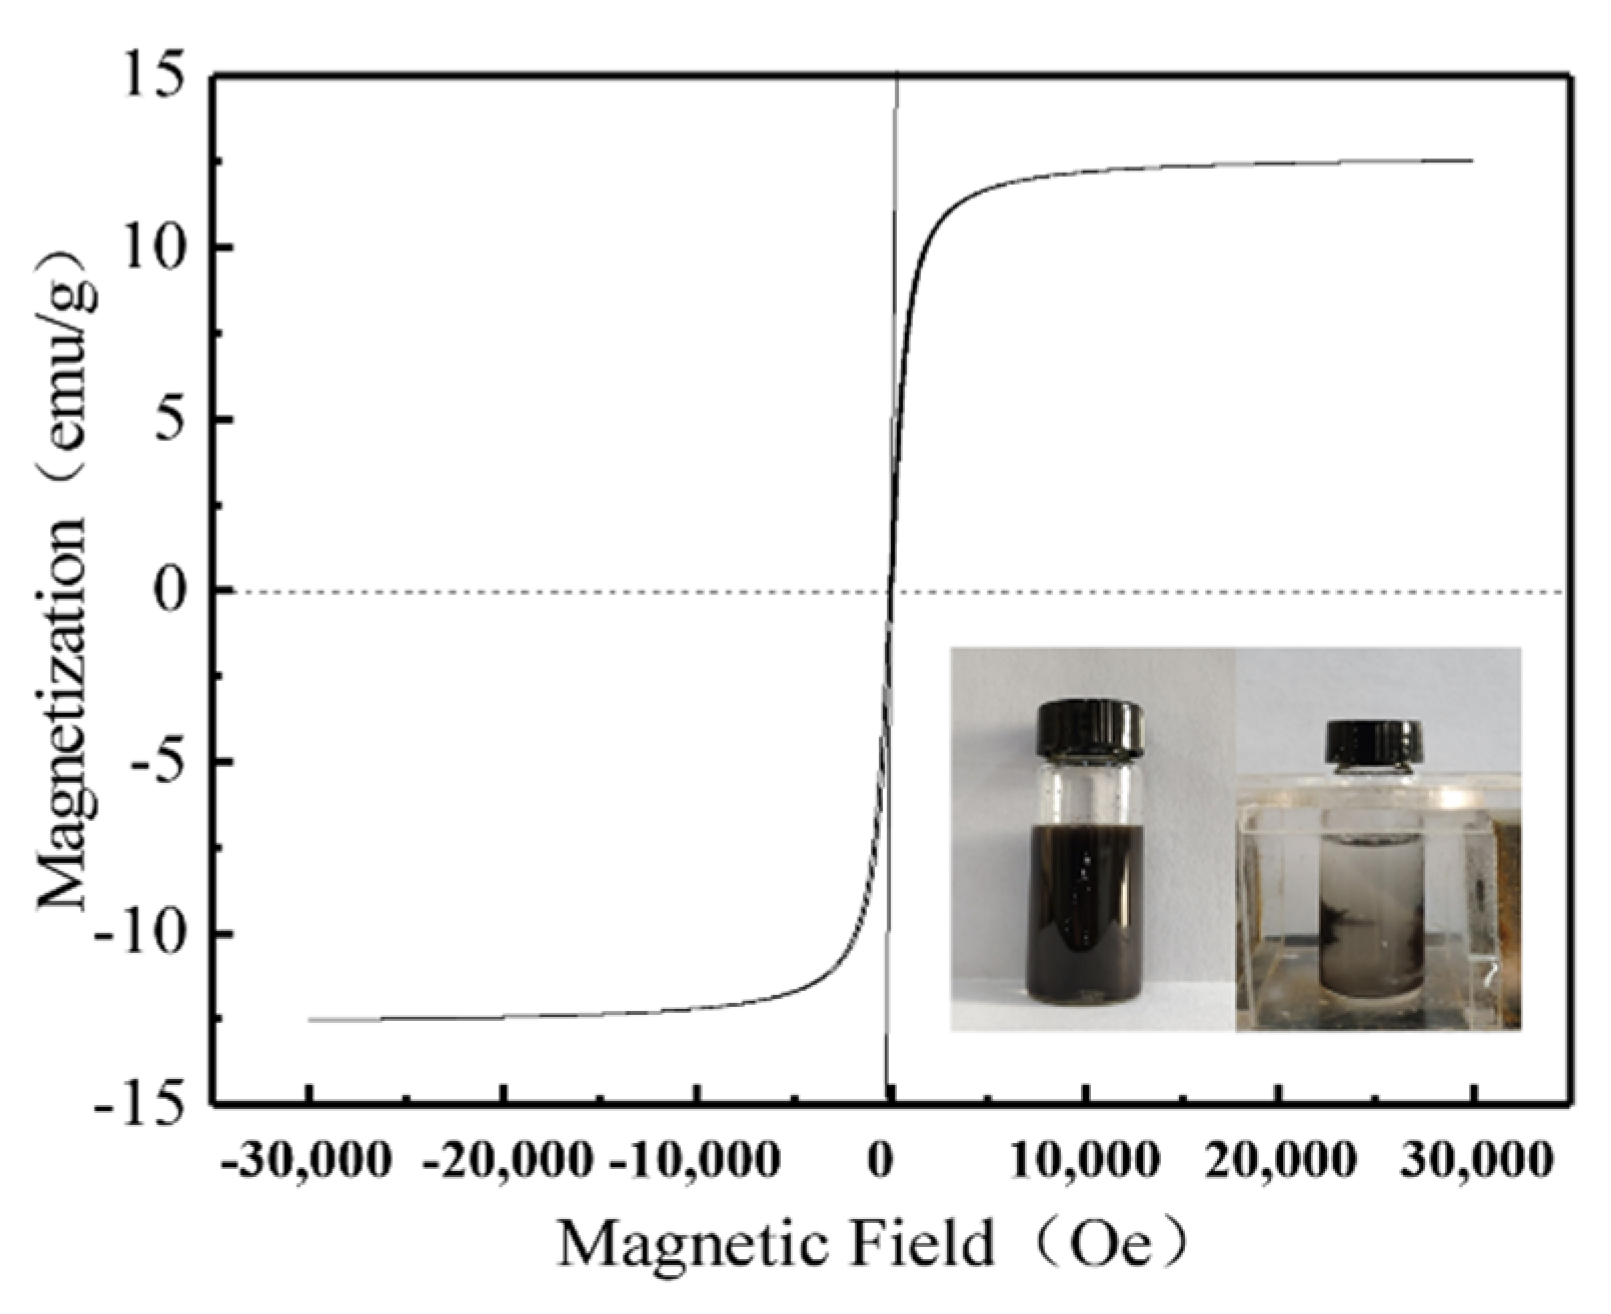
As observed in the hysteresis curve (Figure 5), the hysteresis loop of the GOH/DMCS composite was S-shaped with an asymmetrical origin, and there was no obvious hysteresis loop. The maximum magnetization of the GOH/DMCS composite was 13.1 emu/g, which was lower than the magnetization of Fe3O4 by 52.70 emu/g [29]. This was possibly due to the combination of GOH, DE, and CS non-magnetic materials, and the nanostructure of Fe3O4 during the preparation of the modified material, which weakened the magnetization of the composite material. However, the experimental diagram also showed that the ultrasonically dispersed uniform GOH/DMCS composite water solvent could be effectively separated in the aqueous solution in less than one minute, under an applied magnetic field. Thus, the above characterization results indicated that the GOH/DMCS composite was successfully prepared and could be used as an adsorbent that can be quickly separated and recovered.

3.2. Adsorption and Desorption Properties of La (III) by GOH-Based Composites

In this paper, compounding MCS not only changes the hydrophilicity of GO but also increases the number of functional groups (−COOH, −OH, −O−, −NH2, etc.) on the surface of composite materials. There are many oxygen-containing functional groups, hydroxyl bridges, and carboxyl groups on the surface of GOH/DCS and GOH/DMCS composites, which make the whole composites have a lot of negative charges, which can interact electrostatically with positively charged rare earth elements, and they may also have complexation and chelation to achieve the removal effect. The adsorption and desorption properties of composite materials for lanthanum will be discussed below.

3.2.1. Diatomite Content and the Influence of Different Materials on Adsorption

DE content in composite materials can directly affect the adsorption effects of La(III). Therefore, GOH/DCS and GOH/DMCS composite materials were prepared with different diatomite addition amounts. Specifically, 1, 2, 3, 4, and 5 g adsorption experiments were carried out on the target pollutant La(III). Additionally, adsorption experiments for La(III) were carried out with GO and GOH matrix materials. The adsorption effects of the different materials were studied, and the results are shown in Figure 6.
As shown in Figure 6, with increased addition of DE, the adsorption trend of the target pollutant La(III) by the composite GOH/DMCS and GOH/DCS material was roughly the same, with an apparent initial increase, which later slowed. The reason for this was due to GOH, which played a significant role in La(III) adsorption with small amounts of DE. With increasing DE content, its specific surface area, porous structure, and functional groups all participated in the reaction process and increased the number of adsorption sites for the adsorbent; thus, the adsorption capacity increased significantly. Therefore, the composite adsorbents used in the follow-up research were all prepared using 3 g of DE. Meanwhile, as observed from the adsorption capacity in the Table 2, the adsorption capacities of La(III) by GOH/DMCS, GOH/DCS, GOH, and GO were 146.58, 135.53, 109.23, and 101.37 mg/g, respectively. The adsorption capacities of the prepared graphene oxide composites were higher than those of GO and GOH. Thus, for the adsorption results, the modified composites had a better adsorption effect on La(III).

3.2.2. Influence of Adsorption Time on Adsorption and Kinetics

As shown in Figure 7, the adsorption trends of the target pollutant La(III) by GOH/DMCS and GOH/DCS were similar. The adsorption of La (III) by GOH/DMCS reached adsorption equilibrium within 60 min when the adsorption capacity was 141.19 mg/g. The adsorption of La (III) by GOH/DCS occurred within 50 min when the adsorption capacity was 134.23 mg/g. Within 60 min, the adsorption capacity increased rapidly; then, it reached adsorption equilibrium. The adsorption capacity of GOH/DMCS for La(III) was significantly higher than that of GOH/DCS, as during the initial period of adsorption, there were a sufficient number of exposed adsorption sites on the surface of the adsorbent. The negative charge on the surface of the adsorbent and the positively charged metal ions caused electrostatic interactions, and La(III) began to occupy the adsorption sites on the surface of the adsorbent. Thus, the adsorption capacity showed a rapid upward trend during the initial stage. As the contact time increased, the adsorption sites on the composite adsorbent gradually filled, and the adsorption gradually reached equilibrium. Thus, the GOH/DMCS composite material with added magnetic chitosan had a higher adsorption capacity than GOH/DCS for La(III) due to its magnetic separation. Based on the above conclusions, 50 min was chosen as the best equilibrium reaction time for the follow-up study.
After studying the effect of adsorption time on the adsorption, we found it necessary to further explore the adsorption kinetics of GOH/DMCS on La(III). The fitting results of the kinetic model for GOH/DMCS adsorption of La(III) are shown in Figure 8, showing that more data points fell on the curve fitted by the pseudo-second-order kinetic model. As shown by the experimental parameters in Table 3, the correlation coefficient (R2) for La(III) adsorption described by the pseudo-second-order kinetic model was 0.9854, which was higher than the correlation coefficient value of 0.9115 obtained by pseudo-first-order kinetics. Based on the above analysis results, we determined that the adsorption of La(III) on the GOH/DMCS composite material was best described by the pseudo-second-order kinetic model. The adsorption mechanism depended on the physical and chemical properties of the adsorbent and the chemical interactions of the adsorbent. Some scholars have found that the pseudo-second-order kinetic model indicates that most adsorption reactions are chemical rather than physical adsorption [30]. In addition, chemical adsorption was related to the sharing and transferring of electrons between the GOH composite material of GOH/DMCS and La(III). Thus, the initial reaction rate was calculated according to the following formula: h = k2·qe2, where the initial reaction rate was 13.4590 mg/g·min.
To describe the diffusion of the system in a specific range, an internal diffusion model was used to fit the adsorption process, and the results are shown in Figure 9 and Table 4. As depicted in Figure 9, the straight line fitted by qt to t0.5 was divided into two sections, and the straight line did not pass through the origin, C≠0, indicating that the adsorption rate was not solely controlled by internal diffusion. Thus, for the adsorption process, the adsorbate underwent two main processes. In the first stage, the external diffusion of the adsorbate La(III) in the aqueous solution was adsorbed on the surface of the composite material by GOH/DMCS. In the second stage, internal diffusion of La(III) in GOH/DMCS occurred on the surface of the composite material or between the layers. From the adsorption parameters of the internal diffusion model, kd1 of the first stage was greater than kd2 of the second stage, which proved that the adsorption rate of GOH/DMCS for La(III) was higher in the initial period.

3.2.3. Influence of pH Value of the Solution on Adsorption Effect

In this portion of the study, the experiments were carried out at pH 2–12, and the pH values were adjusted to 2, 4, 6, 8, 10, and 12 with NaOH or HCl. As shown in Figure 10 that when the pH was 2, the adsorption capacity of GOH/DCS for La(III) was 98.97 mg/g, and the adsorption rate was 65.98%. The adsorption capacity of GOH/DMCS for La(III) was 109.18 mg/g, and the adsorption rate was 72.78%. The figure shows that with increased pH, the adsorption rate rose, and the adsorption capacity of GOH/DMCS and GOH/DCS for the target La(III) pollutant initially increased. After the pH reached 8, the adsorption capacity was unchanged, and adsorption was optimal when pH was 8. During this time, the adsorption capacities were 133.30 and 141.19 mg/g, and the adsorption rates were 89 and 94%.
The pH affected the positive and negative charges on the surface of the adsorbent and affected the presence of La(III) ions in the aqueous solution. When pH was 2, the zeta potential value of GOH/DMCS in the water phase was −11.9 mV (Figure 4). The surface of the composite adsorbent was negatively charged, and the La(III) ions were electrostatically attracted for removal. However, a large number of positively charged H+ in the solution competed with the La(III) ions for adsorption sites on the adsorbent surface. Thus, due to the distribution of adsorption sites, the adsorption capacity was the lowest during this time. In addition, the GOH composite material had a high specific surface area and pore structure, which was conducive to adsorption.
Between pH 2 and 8, both the adsorption capacity and the adsorption rates trended upward, as shown in Figure 4, because the introduced oxygen-containing functional groups, −COOH and −OH, ionized into −COO- and −O in the aqueous solution. Thus, the surface of the material became negatively charged, the electronegativity of the GOH/DMCS surface gradually increased with pH from acidic to alkaline, the zeta potential values of the GOH/DMCS surface accelerated in the negative direction, and the adsorption capacity of La(III) increased. Thus, both the capacity and the adsorption rate gradually increased, and GOH/DMCS adsorbed La(III) through complexation.
At pH > 8, GOH/DMCS and GOH/DCS adsorbed and removed La (III) by forming a carboxylate complex. More OH ions were present in the solution, and the rare earth cations and OH ions combined, gradually becoming insoluble oxide and hydroxide precipitates. The precipitates hindered the adsorption of La(III), and the adsorption capacity was unchanged. According to the above analysis, the pH of the subsequent experiments was 8.

3.2.4. Influence of Adsorbent Dosage on Adsorption Rate

The adsorbent dosage curves are shown in Figure 11, indicating that the dosage of the adsorbent directly affected the adsorption of La(III) in the composite materials. When the dosage increased from 0.5 to 5 g/L, the adsorption rate increased, while the adsorption capacity declined. With increased adsorbent dosage, the number of active sites and functional groups in adsorbent gradually increased; therefore, there was a large contact area between the composite adsorbent and La(III), and the adsorption rate rose. However, the dosage effect of 5 g/L GOH/DCS and GOH/DMCS was smaller than 0.5 g/L of GOH/DCS and GOH/DMCS, and the higher adsorbent dosage caused an agglomeration of GOH/DCS and GOH/DMCS, resulting in a decrease in specific surface area. Thus, the adsorption capacity of GOH/DCS and GOH/DMCS for La(III) decreased with increased dosage.
According to the analyzed data, the adsorption effect of GOH/DMCS on La(III) was better than that of GOH/DCS under the same dosage amount. GOH/DMCS had the highest adsorption rate of La(III), at 93.84%, and the adsorption capacity was 197.94 mg/g. The highest adsorption rate of La(III) by GOH/DCS was 96.34%, and the adsorption capacity was 157.53 mg/g. The adsorption capacity of GOH/DCS for La (III) was low, which was possibly because the −COOH at the edge of the carboxylated graphene oxide was more accessible and could more easily react and bond with -NH2 in the chitosan without magnetic modification. This effect may have affected the roles of these two functional groups during adsorption, thus resulting in lower adsorption capacity compared to GOH/DMCS.

3.2.5. Influence of Temperature and Initial Concentration of the Rare Earth Ion Solution on Adsorption

We also studied the effects of different initial concentrations and temperatures on adsorption efficiency. Figure 12 shows a changing trend in the adsorption effect of La (III) by GOH/DCS and GOH/DMCS, which was similar at different temperatures. The adsorption capacities of GOH/DCS and GOH/DMCS for La (III) were 151.70 and 154.02 mg/g at 25 °C and 30 mg/L, respectively. When the temperature increased to 45 °C and the solution concentration was 30 mg/L, the adsorption capacities of GOH/DCS and GOH/DMCS for La(III) were 173.04 and 175.82 mg/g, respectively. At the same initial concentration, when the temperature increased from 25 to 45 °C, the adsorption capacity trended upward, and the adsorption process was endothermic; thus, an increase in temperature was beneficial to the reaction. When the temperature rose, the movement of the rare earth La(III) ions on the surface of the composite adsorbent accelerated, collisions intensified, and the contact probability of the adsorbent increased; therefore, the adsorption capacity increased.
At the same temperature, the initial concentration of the rare earth ion solution affected the adsorption and mass transfer processes, thus affecting the adsorption of La(III). As shown in Figure 12, the adsorption effects of GOH/DCS and GOH/DMCS on La(III) were the same at different initial solution concentrations. At 45 °C, when the concentration increased from 30 to 40, and then to 50 mg/L, the adsorption capacity of La(III) by GOH/DMCS increased from 175.83 to 227.94, and then to 287.01 mg/g, respectively. With increased initial concentration, the adsorption capacity exhibited a gradual upward trend. However, the adsorption capacity of GOH/DMCS was slightly higher than the GOH/DCS composite, as the GOH/DMCS composite provided more adsorption sites for La(III) during the adsorption process. Of note, this also proved that the composite was successfully modified and prepared.

3.2.6. Adsorption Isotherms

Figure 13 shows the fitting results of the adsorption data for the GOH/DMCS composites using the Langmuir (a) and Freundlich models (b), and Table 5 lists the relevant parameters of the fitting results. As observed in the figure, most of the correlation points accurately fell on the linear fitting line in the Langmuir model. As listed in Table 4, the correlation coefficient (R2) of the Langmuir model was higher than the fitting results of the Freundlich model; thus, the adsorption process of La(III) by GOH/DMCS was more in line with the Langmuir model, indicating that the adsorption process was attributable to monolayer adsorption. The surface contained a limited number of adsorption sites with uniform adsorption energies and with no migration of adsorbate on the surface [31,32]. According to the linear fitting line, the maximum adsorption capacity at 298 and 308 K reached 294.99 and 320.51 mg/g, respectively. This was closer to the experimental values than the maximum adsorption capacity obtained by the Freundlich model. As observed from the dimensionless RL parameter in the Langmuir model (Table 6), which was between 0 and 1 at 298 and 308 K, the adsorption of La(III) by GOH/DMCS was a favorable adsorption process, reflecting the high affinity between the adsorbent and adsorbate.

3.2.7. Adsorption Thermodynamics

As listed in Table 7 and Figure 14, the adsorption reaction enthalpy changes ΔH0 > 0 indicated that the adsorption process of La(III) by GOH/DMCS was an endothermic reaction. As mentioned in the above results, the adsorption capacity increased when the temperature increased from 25 to 45 °C. Thus, the adsorption process was an endothermic reaction, and the temperature increase was beneficial to the progression of the reaction. The resulting enthalpy change was the same as that of temperature. At three different temperatures, 298, 303, and 308 K, the Gibbs energy change (G0) was less than 0. As shown in Table 6, the absolute value of G0 increased with increased temperature, indicating that the adsorption of La(III) by GOH/DMCS proceeded spontaneously. This also verified the improved adsorption effects at higher temperatures. The entropy change value (ΔS0) was 50.0084 J·(mol·k)−1, indicating that the disorder of the solid–liquid interface system increased during the adsorption of La(III) by the GOH/DMCS composite. This also indicated that when discrete rare-earth ions combine with adsorbents, more ions will be released during adsorption.

3.3. Analysis of Desorption Results

In practical applications, the disposal of nanomaterial (NMs) adsorbents used in adsorption processes negatively affects water quality; thus, reusability is a critical factor for creating suitable adsorbents. Desorption from adsorbents with a high affinity requires a high concentration of acid and/or chelating agents. In addition, desorption of La(III) from nanomaterials occurs in acidic solutions such as hydrochloric acid, nitric acid, or sulfuric acid. We determined that the GOH/DMCS composites prepared in this study achieved a separation effect under an external magnetic field due to their magnetism. Therefore, 0.2 mol/L of HNO3 solution was used in this work for the desorption and adsorption-desorption cycling regeneration experiments.
As shown in Figure 15 that the adsorption capacities of the GOH/DMCS composites for La(III) exceeded 74% after four adsorption–desorption cycles, and the desorption percentage decreased only slightly after several adsorption–desorption cycles. This proved that the recycling of magnetic NMs can be simply and effectively achieved for adsorbent recycling, using external magnets. Of note, the gradual decrease in the desorption rate was possibly due to incomplete desorption.

4. Conclusions

In this study, GO was prepared using the improved Hummers’ method and was carboxylated and modified into GOH. Thus, DE and chitosan/magnetic chitosan with stable chemical properties, large specific surface areas, wear resistance, and high porosities were loaded by solution blending, and GOH/DCS and GOH/DMCS composites with suitable solid–liquid separation properties were prepared. Through La(III) adsorption experiments, various effects on adsorption were explored and fitted. The results showed that the adsorption of La(III) by the GOH/DCS and GOH/DMCS composites reached equilibrium in 50 min, and pH had the most significant effect on adsorption. When pH was 8, the adsorption capacity of La(III) by GOH/DMCS reached 141.19 mg/g. With increasing adsorbent dosage, the adsorption rate gradually increased, while the adsorption capacity gradually decreased. Therefore, the optimum adsorption effect was obtained when the addition amount of adsorbent was 3 g·L−1, and the reaction temperature and initial solution concentration were 45 °C and 50 mg·L−1, respectively. The adsorption process of La(III) by the GOH/DMCS composites followed the pseudo-second-order kinetic model, and adsorption efficiency was not solely controlled by internal diffusion. Thus, the adsorption process was more in line with the Langmuir model, which indicated that the adsorption process followed monolayer adsorption, and the surface contained a limited number of adsorption sites with uniform adsorption energies. Thus, there was no adsorbate migration on the surface. The thermodynamic fitting results showed that adsorption was an endothermic process, and an increase in temperature was beneficial to the reaction. After four adsorption–desorption cycle experiments, the adsorption capacity of the GOH/DMCS composite for La(III) initially exceeded 74%, and the desorption percentages after several adsorption–desorption cycles decreased only slightly.

Author Contributions

Conceptualization, J.Z. and X.S.; methodology, J.Z.; software, X.S.; validation, X.S., B.S. and S.W.; formal analysis, J.Z.; investigation, B.S.; resources, J.Z.; data curation, B.S.; writing—original draft preparation, X.S.; writing—review and editing, J.Z.; visualization, X.S.; supervision, S.W.; project administration, X.S.; funding acquisition, S.W. All authors have read and agreed to the published version of the manuscript. Please turn to the CRediT taxonomy for the term explanation. Authorship must be limited to those who have contributed substantially to the work reported.

Funding

This research was funded by the National Natural Science Foundation of China, grant number 21466019.

Institutional Review Board Statement

Not applicable.

Informed Consent Statement

Not applicable.

Data Availability Statement

The data presented in this study are available on request from the corresponding author. The data are not publicly available due to the author have not graduated.

Conflicts of Interest

The funders had no role in the design of the study; in the collection, analyses, or interpretation of data; in the writing of the manuscript, or in the decision to publish the results.

References

  1. Wu, D.; Zhang, L.; Wang, L.; Zhu, B.; Fan, L. Adsorption of lanthanum by magnetic alginate-chitosan gel beads. J. Chem. Technol. Biotechnol. 2011, 86, 345–352. [Google Scholar] [CrossRef]
  2. Jowitt, S.M.; Werner, T.T.; Weng, Z.; Mudd, G.M. Recycling of the rare earth elements. Curr. Opin. Green Sustain. Chem. 2018, 13, 1–7. [Google Scholar] [CrossRef]
  3. Asadollahzadeh, M.; Torkaman, R.; Torab-Mostaedi, M. Extraction and separation of rare earth elements by adsorption approaches: Current status and future trends. Sep. Purif. Rev. 2021, 50, 417–444. [Google Scholar] [CrossRef]
  4. Iannicelli-Zubiani, E.M.; Gallo Stampino, P.; Cristiani, C.; Dotelli, G. Enhanced lanthanum adsorption by amine modified activated carbon. Chem. Eng. J. 2018, 341, 75–82. [Google Scholar] [CrossRef]
  5. Abdel-Magied, A.F.; Abdelhamid, H.N.; Ashour, R.M.; Zou, X.; Forsberg, K. Hierarchical porous zeolitic imidazolate frameworks nanoparticles for efficient adsorption of rare-earth elements. Microporous Mesoporous Mater. 2019, 278, 175–184. [Google Scholar] [CrossRef]
  6. Kusrini, E.; Usman, A.; Sani, F.A.; Wilson, L.D.; Abdullah, M.A.A. Simultaneous adsorption of lanthanum and yttrium from aqueous solution by durian rind biosorbent. Environ. Monit. Assess. 2019, 191, 488. [Google Scholar] [CrossRef]
  7. Silva, A.; Martínez-Gallegos, S.; Rosano-Ortega, G.; Schabes-Retchkiman, P.; Vega-Lebrún, C.; Albiter, V. Nanotoxicity for E. Coli and characterization of silver quantum dots produced by biosynthesis with Eichhornia crassipes. J. Nanostructures 2017, 7, 1–12. [Google Scholar]
  8. Kegl, T.; Košak, A.; Lobnik, A.; Novak, Z.; Kralj, A.K.; Ban, I. Adsorption of rare earth metals from wastewater by nanomaterials: A review. J. Hazard. Mater. 2020, 386, 121632. [Google Scholar] [CrossRef]
  9. Chang, S.; Zhang, Q.; Lu, Y.; Wu, S.; Wang, W. High-efficiency and selective adsorption of organic pollutants by magnetic CoFe2O4/graphene oxide adsorbents: Experimental and molecular dynamics simulation study. Sep. Purif. Technol. 2020, 238, 116400. [Google Scholar] [CrossRef]
  10. Zhao, X.; Yang, M. Graphene nanocomposites. Molecules 2019, 24, 2440. [Google Scholar] [CrossRef] [Green Version]
  11. Chen, J.; Yao, B.; Li, C.; Shi, G. An improved Hummers method for eco-friendly synthesis of graphene oxide. Carbon 2013, 64, 225–229. [Google Scholar] [CrossRef]
  12. Zhang, Y.; Wang, L.; Zhang, N.; Zhou, Z. Adsorptive environmental applications of MXene nanomaterials: A review. RSC Adv. 2018, 8, 19895–19905. [Google Scholar] [CrossRef] [Green Version]
  13. Chen, P.; Li, H.; Yi, H.; Jia, F.; Yang, L.; Song, S. Removal of graphene oxide from water by floc-flotation. Sep. Purif. Technol. 2018, 202, 27–33. [Google Scholar] [CrossRef]
  14. Marcano, D.C.; Kosynkin, D.V.; Berlin, J.M.; Sinitskii, A.; Sun, Z.; Slesarev, A.; Alemany, L.B.; Lu, W.; Tour, J.M. Improved synthesis of graphene oxide. ACS Nano 2010, 4, 4806–4814. [Google Scholar] [CrossRef]
  15. Molavi, H.; Zamani, M.; Aghajanzadeh, M.; Kheiri Manjili, H.; Danafar, H.; Shojaei, A. Evaluation of UiO-66 metal organic framework as an effective sorbent for Curcumin’s overdose. Appl. Organomet. Chem. 2018, 32, e4221–e4231. [Google Scholar] [CrossRef]
  16. Liu, Y.; Shen, L. From Langmuir Kinetics to First-and Second-Order Rate Equations for Adsorption. Langmuir 2008, 24, 11625–11630. [Google Scholar] [CrossRef] [PubMed]
  17. Liu, Y. Is the Free Energy Change of Adsorption Correctly Calculated. J. Chem. Eng. Data 2009, 54, 1981–1985. [Google Scholar] [CrossRef]
  18. Ma, F.; Nian, J.; Bi, C.; Yang, M.; Zhang, C.; Liu, L.; Dong, H.; Zhu, M.; Dong, B. Preparation of carboxylated graphene oxide for enhanced adsorption of U(VI). J. Solid State Chem. 2019, 277, 9–16. [Google Scholar] [CrossRef]
  19. Park, K.-W. Carboxylated graphene oxide–Mn2O3 nanorod composites for their electrochemical characteristics. J. Mater. Chem. A 2014, 2, 4292–4298. [Google Scholar] [CrossRef]
  20. Sun, Z.; Yao, G.; Liu, M.; Zheng, S. In situ synthesis of magnetic MnFe2O4 /diatomite nanocomposite adsorbent and its efficient removal of cationic dyes. J. Taiwan Inst. Chem. Eng. 2017, 71, 501–509. [Google Scholar] [CrossRef]
  21. Fan, L.; Luo, C.; Lv, Z.; Lu, F.; Qiu, H. Preparation of magnetic modified chitosan and adsorption of Zn(2)(+) from aqueous solutions. Colloids Surf. B Biointerfaces 2011, 88, 574–581. [Google Scholar] [CrossRef] [PubMed]
  22. Khraisheh, M.; Al-Ghouti, M.; Allen, S.; Ahmad, M. The effect of pH, temperature, and molecular size on the removal of dyes from textile effluent using manganese oxides-modified diatomite. Water Environ. Res. 2004, 76, 2655–2663. [Google Scholar] [CrossRef] [PubMed]
  23. Nethravathi, C.; Rajamathi, M. Chemically modified graphene sheets produced by the solvothermal reduction of colloidal dispersions of graphite oxide. Carbon 2008, 46, 1994–1998. [Google Scholar] [CrossRef]
  24. Ghosh, B.; Agrawal, D.C.; Bhatia, S. Synthesis of zeolite A from calcined diatomaceous clay: Optimization studies. Ind. Eng. Chem. Res. 1994, 33, 2107–2110. [Google Scholar] [CrossRef]
  25. Ma, L.L.; Xie, Q.L.; Chen, N.C.; Xu, H.; Zhou, H.M.; Yu, Q.F. In Research on Lead (II) Adsorption Mechanism from Aqueous Solution by Calcium Carbonate Modified Diatomite Absorbent. Mater. Sci. Forum 2018, 921, 21–28. [Google Scholar] [CrossRef]
  26. Bahramian, B.; Ardejani, F.D.; Mirkhani, V.; Badii, K. Diatomite-supported manganese Schiff base: An efficient catalyst for oxidation of hydrocarbons. Appl. Catal. A Gen. 2008, 345, 97–103. [Google Scholar] [CrossRef]
  27. Roy, J.C.; Ferri, A.; Giraud, S.; Jinping, G.; Salaün, F. Chitosan–carboxymethylcellulose-based polyelectrolyte complexation and microcapsule shell formulation. Int. J. Mol. Sci. 2018, 19, 2521. [Google Scholar] [CrossRef] [Green Version]
  28. Li, W.; Xiao, L.; Qin, C. The characterization and thermal investigation of chitosan-Fe3O4 nanoparticles synthesized via a novel one-step modifying process. J. Macromol. Sci. Part A 2010, 48, 57–64. [Google Scholar] [CrossRef]
  29. Bei, Z. Removal Performance and Mechanism of Phenolic Pollutants by Go Based Water Treatment Materials. Ph.D. Thesis, Shandong University, Jinan, China, 2019. [Google Scholar]
  30. Yang, Q.; Wang, X.; Luo, W.; Sun, J.; Xu, Q.; Chen, F.; Zhao, J.; Wang, S.; Yao, F.; Wang, D. Effectiveness and mechanisms of phosphate adsorption on iron-modified biochars derived from waste activated sludge. Bioresour. Technol. 2018, 247, 537–544. [Google Scholar] [CrossRef]
  31. Dai, Y.; Lv, R.; Fan, J.; Zhang, X.; Tao, Q. Adsorption of cesium using supermolecular impregnated XAD-7 composite: Isotherms, kinetics and thermodynamics. J. Radioanal. Nucl. Chem. 2019, 321, 473–480. [Google Scholar] [CrossRef]
  32. Awwad, N.; Gad, H.; Ahmad, M.; Aly, H. Sorption of lanthanum and erbium from aqueous solution by activated carbon prepared from rice husk. Colloids Surf. B Biointerfaces 2010, 81, 593–599. [Google Scholar] [CrossRef] [PubMed]
Figure 1. SEM images of (a) GO, (b) GOH, (c) DE, (d) CS, (e) MCS, (f) GOH/DCS, and (g) GOH/DMCS.
Coatings 11 01040 g001
Figure 2. FTIR spectra of (a) GO and (GOH), (b) DE, (c) CS and MCS, and (d) GOH/DCS and GOH/DCS.
Coatings 11 01040 g002
Figure 3. XRD patterns of the different materials: (a) GO and GOH, (b) CS and GOH/DCS, and (c) DE and GOH/DMCS.
Coatings 11 01040 g003
Figure 4. Zeta potential diagram of GOH/DMCS.
Coatings 11 01040 g004
Figure 5. Magnetic hysteresis loops of GOH/DMCS.
Coatings 11 01040 g005
Figure 6. DE content and influence of different materials on adsorption: (a) GOH/DCS and GO adsorbing La(III), and (b) GOH/DMCS and GOH adsorbing La(III). (pH = 8, t = 50 min, T = 45 °C, La(III) concentration = 25 mg·L−1, Dosage = 1 g·L−1)
Coatings 11 01040 g006
Figure 7. Influence of adsorption time on adsorption effect. (pH = 8, T = 45 °C, La(III) concentration = 25 mg·L−1, Dosage = 1 g·L−1)
Coatings 11 01040 g007
Figure 8. Kinetic model of La(III) adsorption by GOH/DMCS.
Coatings 11 01040 g008
Figure 9. Intra-particle diffusion model of La(III) adsorption by GOH/DMCS.
Coatings 11 01040 g009
Figure 10. Influence of pH on the adsorption effects of (a) GOH/DCS and (b) GOH/DMCS. (t = 50 min, T = 45 °C, La(III) concentration = 25 mg·L−1, Dosage = 1 g·L−1)
Coatings 11 01040 g010
Figure 11. Influence of adsorbent dosage on adsorption for (a) GOH/DCS and (b) GOH/DMCS. (pH = 8, t = 50 min, T = 45 °C, La(III) concentration = 25 mg·L−1)
Coatings 11 01040 g011
Figure 12. Influence of temperature and initial La(III) concentration on adsorption effect for (a) GOH/DCS and (b) GOH/DMCS (pH = 8, t = 50 min, Dosage = 3 g·L−1).
Coatings 11 01040 g012
Figure 13. Isotherm models of La(III) adsorption by GOH/DMCS: (a) Langmuir model and (b) Freundlich model.
Coatings 11 01040 g013
Figure 14. Thermodynamic model of La(III) adsorption by GOH/DMCS.
Coatings 11 01040 g014
Figure 15. Cycle regeneration experiments. (pH = 8, t = 50 min, T = 45 °C, La(III) concentration = 50 mg·L−1, Dosage = 3 g·L−1)
Coatings 11 01040 g015
Table 1. Main characterization instruments.
InstrumentModelManufacturer
SEMTESCAN MIRA3Tesken Trading Co., Ltd., Shanghai, China
FT-IRVERTEX70Swiss Brook
XRDD/MAX-2500/PCNippon Neotoku Corporation
Zeta potentialZetasizer Nano S90Malvern Instrument Co. Ltd., Worcestershire, UK
PPMS-VSMPPMS-9Quantum Design, San Diego, CA, USA
Table 2. Adsorption capacity of different materials under the same conditions.
MaterialGOGOHGOH/DCSGOH/DMCS
Adsorption capacity (mg·g−1)101.37109.23135.53146.58
Table 3. Kinetic parameters of La(III) adsorption by GOH/DMCS.
Quasi-First-Order Dynamics ModelQuasi-Second-Order Dynamics Model
qek1R2hqek2R2
mg/gmin−1-mg/(g·min)mg/gg/(mg·min)-
162.770.06570.911513.4590170.364.637 × 10−40.9854
Table 4. Intra-particle diffusion parameters of La(III) adsorption by GOH/DMCS.
First StageSecond Stage
kd1C1R2kd2C2R2
mg·g−1·min−1/2--mg·g−1·min−1/2--
23.46812.53610.943611.754352.90580.8288
Table 5. Isothermal parameters of La(III) adsorption by GOH/DMCS.
TemperatureLangmuir ModelFreundlich Model
qmax/mg·g−1KL/L·mg−1R2KF/mg·g−1·L1/n·mg−1/n1/nR2
298 K294.990.34070.991580.77840.42450.9681
308 K320.510.46920.9912112.96520.34670.9890
Table 6. Dimensionless parameter RL.
TemperatureRL
298 K~0.0554–0.2269
308 K~0.0409–0.1757
Table 7. Thermodynamic parameters of La(III) adsorption by GOH/DMCS.
Temperature (K)∆G0/KJ·mol−1ΔH0/KJ·mol−1ΔS0/J·(mol·K) −1
298−5.513510.294350.0084
303−5.743310.294350.0084
308−6.044410.294350.0084
Publisher’s Note: MDPI stays neutral with regard to jurisdictional claims in published maps and institutional affiliations.

