Abstract
Coatings can be used as a preservative method to protect the wood, especially the wood surface. The different component of the coating’s dependence of the purpose of it. The Japanese beech (Fagus crenata Blume) applied by several Japanese commercials coating materials. The coatings application used were spray type and brush type. X-ray microtomography in Fuji, Japan was used for visualized the coating samples. The X-ray target used were Cu, and Mo with Al filter. The X-ray image analysis in 2D and 3D were conducted using image J and VGStudio Max, respectfully. The coating’s containing materials and the concentration of it strongly affected the image result of X-ray microtomography visualization. The different X-ray target shows the different image results. The larger energy of X-ray (Mo with Al filter) is recommended to use for visualization. The X-ray images shows the penetration phenomena, which can be applied to calculate the penetration depth.
1. Introduction
The face of the plywood exposed to environment can easily become damaged, such as, loss of gloss and color, the development of cracks, and changes in chemical composition, erosion, and roughening of wood surfaces [1]. Those damages reduce the quality of the wood products. Preventive measures to avoid wood damage due to environmental exposure, especially wood products and plywood color degradation damage include using coating material [2]. These not only provide protection for wood as a preventive method, but coating can also provide a decorative effect for wood, such as color and glossiness [2,3]. The coating material spreads over the surface of an object and forms a thin film after drying. It was applied directly to the wood surface to protect the wood surface, maintain the appearance, and make a cleanable surface of coated wood. Coating can be applied to wood by spraying, brushing, and dipping the coating materials onto the wood surface.
Coatings are generally made from resin, solvent, pigment, and other additives [4]. Thus, the final function of coatings depends on the different content and type of the constituting materials [5]. Based on its function, the coating is divided into several parts: colorant, varnish, insecticide, and UV absorber [2,6]. It does not rule out that a coating can function as an insecticide and UV absorber in one product.
Penetration of coating material into the wood is important to understand regarding the wood protection. The part of the wood on which the coating material is applied will be the part where more severe degradation caused by weathering occurs. The scheme of coating material penetration depends on the wood anatomy and the coating material itself.
Japanese beech (Fagus crenata Blume) is a commercial wood commonly used for plywood manufacture [7]. The physical characteristics of Japanese beech wood veneer, such as density (0.59–0.58 g/cm3) and porosity (diffuse porous) [8], are suitable to be used with X-ray microtomography, allowing for deeper observation of wood morphoanalogical distribution of the coating material using smaller F.O.V (field of view) X-ray microtomography apparatus.
Techniques such as conventional light microscopy, fluorescence microscopy and scanning electron microscopy have limitations in capturing images and measurement. This technique makes it impossible to take pictures in 3D in real time. In addition to the above-mentioned techniques, X-ray microtomography is a high-end tool for fast and non-destructive three-dimensional analysis. The technique has been used in several research domains for various applications ranging from plant biology to soil sciences [9]. X-ray microtomography can be used for the observation of the scheme of coating material penetration in wood. X-ray microtomography is applicable to observe the tomographic images, microstructures, thickness, porosity fraction, pore connectivity and size distribution of many materials, including wood [10]. To deeply understand the scheme of coating material penetration in wood affected by the chemical content and the active material concentration of it, the visualization of wood-coated surfaces is important to be investigated.
The aim of this study was to determine the effects of chemicals including Al, Co, Fe, Si and Ti (normally used to impart specific properties to coating materials, such as color, varnishing and biocide activity) on the image visualization results using X-ray microtomography for coatings applied to the surface of Japanese beech (Fagus crenata Blume).
2. Materials and Methods
2.1. Veneer Preparation
Four rotary veneers of Japanese beech (Fagus crenata Blume) with dimensions 300 mm × 300 mm × 1.0–1.3 mm were pre-treated in the constant humidity and temperature room for 30 days at 20 °C and 65% RH. Then, the veneers were dried in a constant temperature oven (DKN812) at 60 °C for 24 h. After drying, the veneers were cooled down in a plastic bag to prevent moisture content change. The veneers were cold-pressed with the pressure 1 MPa for 20 min and hot-pressed with pressure 1 MPa at 125 °C for 4 min. These pressing processes were carried out to imitate the veneer of the LVL manufacturing process. The veneers were cooled down in a plastic bag for 24 h and cut into 12 veneers with dimensions of 100 mm × 100 mm (length and width) using a table saw for the coated-veneer and uncoated-veneer samples (control).
2.2. Coating Preparation and Application
Eleven commercially available coatings were purchased from Shizuoka, Japan. Two of these were brush-type coatings and nine were spray-type coatings. The types and specifications of coatings used to finish the veneer samples are listed in Table 1.

Table 1.
Specifications of coatings.
Each coating material was applied onto one 10 cm squared veneer with a 2-coat application. In the case of spray-type coatings, two applications were applied onto the veneer with a distance of approximately 15 cm (Figure 1). The application interval of each spray-type coating was 30 min. In the case of brush-type application, the interval before the second application was 1–2 days. Those applications were applied to samples referred to the technical data sheet published by the manufacturers of the coatings. After a 2-coat application, the spreading rate approximately 280 g/m2 was achieved for all coating materials, as suggested by Kinoshita as the typical spreading rate for topcoat on hardwood surface [11].
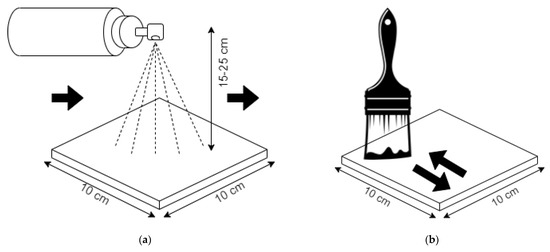
Figure 1.
Scheme of coatings application type: (a) spray type; (b) brush type.
2.3. Coating Thickness Measurement
The thickness of veneer-coating with brush-type and spray-type method were measured. The micrometer screw gauge was used for the measurement of dry coating thickness on the wood surface. The thickness of dry-coating is calculated by using this formula:
2.4. Micro X-ray Microtomography Samples Preparation
The dried coating veneers were cut into dimensions of 1 × 5 cm (Figure 2) using a table saw. Samples were selected from the middle of the veneer to avoid possible interference on the cross section of the sample used for X-ray image analysis. The sample arrangement of X-ray scanning is explained in Figure 3.
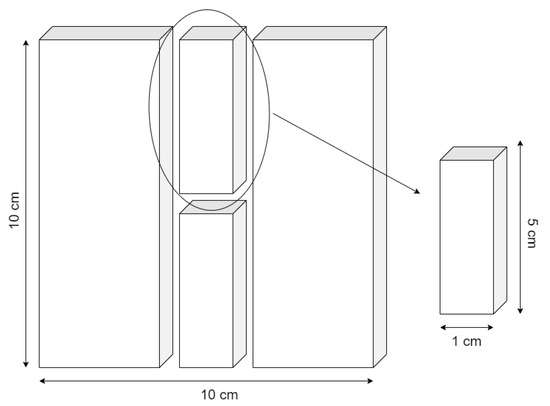
Figure 2.
Scheme of sample cutting.
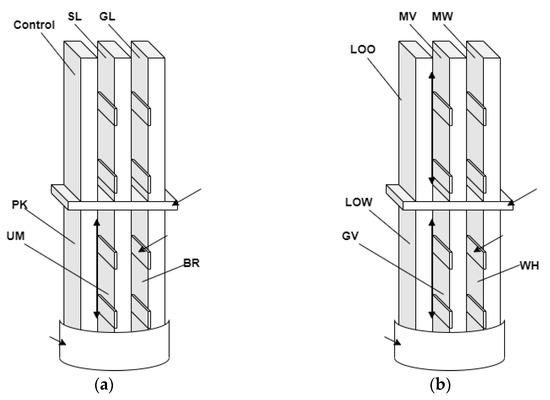
Figure 3.
The sample arrangements of X-ray scanning: (a) sample series 1 consists of control, silver (SL), gold (GL), pink (PK), ultramarine (UM), and brown (BR); (b) sample series 2 consists of light-oak oil-based (LOO), matte varnish (MV), matte white (MW), light-oak water-based (LOW), glossy varnish (GV) and white (WH); long arrow indicating tape, two-way arrow indicating face-to-face coatings side.
2.5. X-ray Microtomography
An X-ray microtomography apparatus (Rigaku Nano 3DX Fuji, Tokoyo, Japan) equipped with L1080 lens that has F.O.V. (field of view) φ3.6 (diameter) × 2.8 (height) mm was used. The apparatus was equipped with two X-ray sources, which were the Mo target with the tube voltage 50 kV and the tube current 24 mA with an 0.1 mm thick aluminum (Al) filter (for generating X-rays with higher energy) and Cu target with the tube voltage 40 kV and the tube current 30 mA (for generating X-rays with lower energy). The samples were put in the sample stage of the apparatus with the distance from the center of the sample stage to the 8 mm lens, and the stage height was adjusted as the six veneer samples were all in the field of view (Figure 4). Sequential image acquisition was implemented and with the angular step 0.2 degree during the sample rotation through 180 degrees. The binning level used in this X-ray machine to reach the good resolution was binning 2 as recommended by Oishi and Tanaka [12]. The exposure time used to reach the good contrast of the image when using Mo with Al filter and Cu X-ray targets were 6 s and 10 s, respectively. After the completion of the image acquisition, the CT reconstruction processes were implemented using the computer connected with the apparatus and thus 1234 16-bit grayscale tomograms with the resolution of 1648 × 1648 (2.2 μm/pixel) were obtained.
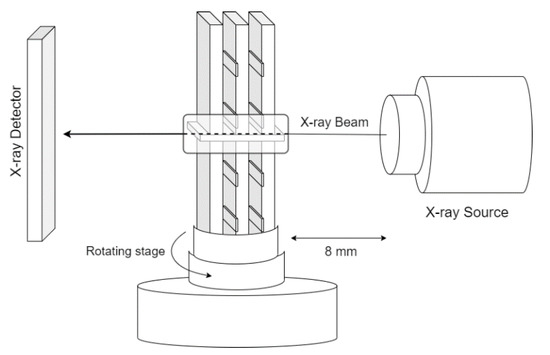
Figure 4.
Scheme X-ray scanning.
2.6. Visualization Analysis
Samples were evaluated by 2D and 3D analysis using ImageJ and VGStudio Max 3.3.4, respectively. 2D analysis in ImageJ was used to obtain gray value plot profile from a line drawn in the middle of the selected image for all the coating materials shown in Table 2. In addition, for the veneers with the three coating materials (GL, SL, and WH), 3D analysis was carried out to complete the color rendering of the coated part of the veneer based on the 2D analysis results.
Table 2.
Coating thickness.
3. Results
3.1. Coating Thickness
Table 2 shows the weight gain and coating thickness after drying. The coating thickness value varied from 0.015 (pink) to 0.050 (matte varnish).
3.2. Visualization Result and Plot Profile
The typical 2D cross-sectional images are shown in Figure 5, Figure 6, Figure 7, Figure 8, Figure 9, Figure 10, Figure 11 and Figure 12 with the grey value profiles along the center line of the image.
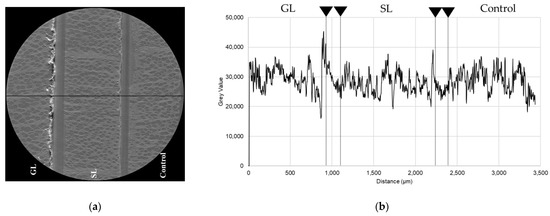
Figure 5.
Sample series 1 Cu target up side (GL, SL, control); (a) visualization result and the plot profile line; (b) plot profile graphic.
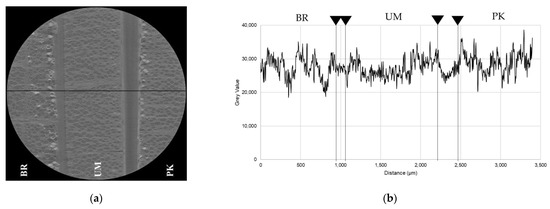
Figure 6.
Sample Series 1 Cu target down side (BR, UM, PK); (a) visualization result and the plot-profile line; (b) plot profile graphic.
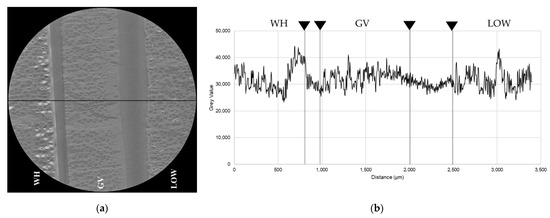
Figure 7.
Sample Series 2 Cu target down side (WH, GV, LOW); (a) visualization result and the plot profile line; (b) plot profile graphic.
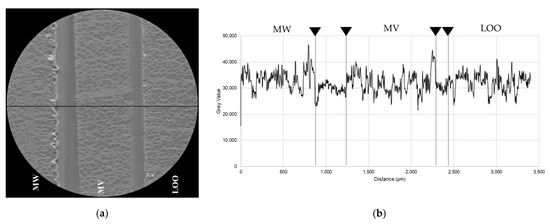
Figure 8.
Sample Series 2 Cu target up side (MW, MV, LOO); (a) visualization result and the plot profile line; (b) plot profile graphic.
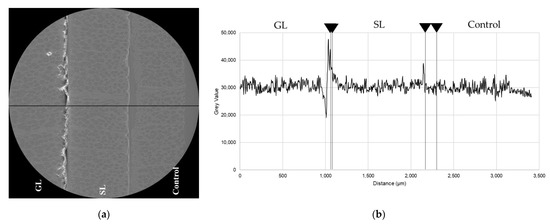
Figure 9.
Sample series 1 Mo target with Al filter up side (GL, SL, control); (a) visualization result and the plot profile line; (b) plot profile graphic.
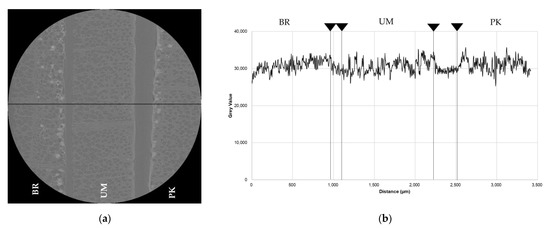
Figure 10.
Sample series 1 Mo target with Al filter down side (BR, UM, PK); (a) visualization result and the plot profile line; (b) plot profile graphic.
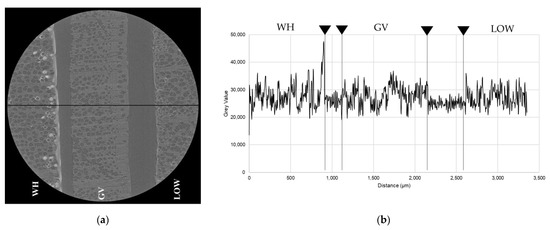
Figure 11.
Sample series 2 Mo target with Al filter down side (WH, GV, LOW); (a) visualization result and the plot profile line; (b) plot profile graphic.
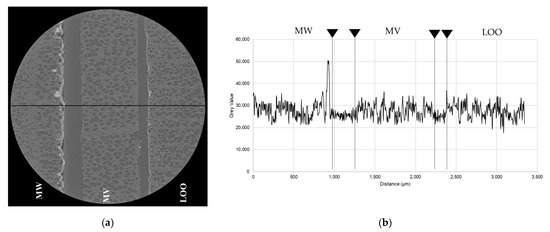
Figure 12.
Sample series 2 Mo target with Al filter up side (MW, MV, LOO); (a) visualization result and the plot profile line; (b) plot profile graphic.
Figure 5 shows a 2D image of wood covered with gold (GL) and silver (SL) coatings, and control. The image result shows that there are artifacts in the gold sample. In addition, the results of the plot profile show that the gold sample has the highest gray value compared to the silver one. The grey value calculation of the gray value plot profile failed to be calculated on the gap between GL-coated part (the white color on the GL-coated veneer) and the air owing to the artifacts in the GL sample. The maximum grey value of the X-ray target Cu in general was around 70,000 grey values, but the maximum of the result was lower than usual.
Figure 6 shows a 2D image of wood covered with brown (BR), ultramarine (UM), and pink (PK) coatings. The image results show that the UM coating produce an image with a gray value similar to the wood. As for the BR coating shows there is a little amount of coating on the wood surface; however, it is clearly seen that there is deep penetration to the wood.
Figure 7 shows a 2D image of wood covered with white (WH), glossy varnish (GV), and light-oak water-based (LOW) coatings. The coating can be clearly seen for the WH coating sample. This is indicated by a high peak in the gray value in the profile plot which shows the coating side. For the LOW coating sample, the coating cannot be seen on the surface of the wood. However, it is clearly seen that there is a deep penetration to the wood. Meanwhile, the GV sample shows that the coating sample is not visible either on the surface or in the pores of the wood.
Figure 8 shows a 2D image of wood coated with matte white (MW), matte varnish (MV), and light-oak oil-based (LOO) coatings. Based on the image, the MV sample shows that the coating sample is not visible either on the surface or in the pores of the wood. However, there is a peak in gray value in the profile plot between MV and air, which is thought to be an artifact.
Figure 9 shows a 2D image of wood with gold (GL) and silver (SL) coatings, and control. The image shows that there are artifacts on the GL sample and between the SL and the air. However, the air looks more constant than the samples before.
Figure 10 shows a 2D image of wood with brown (BR), ultramarine (UM), and pink (PK) coatings. From this figure, the coatings are visible and can be distinguished based on the grey value on the plot profile.
Figure 11 shows a 2D image of wood coated with white (WH), glossy varnish (GV), and light-oak water-based coatings. Based on the image, GV coating is not visible proven by its plot profile which shows no peak in gray value on the wood surface.
Figure 12 shows a 2D image of wood with matte white (MW), matte varnish (MV), and light-oak oil-based (LOO) coatings. Same with the image before, the varnish is not visible by the X-ray visualization.
3.3. 3D Color Rendering for Coating Penetrations
Figure 13, Figure 14 and Figure 15 show the 3D color rendering results for the coatings GL, SL, and WH. Most of GL and SL exist on the surface of veneers, whereas WH was deeply penetrated into the voids of veneer. The Mo and Al filter X-ray target image shows a clearer 3D color rendering than Cu.
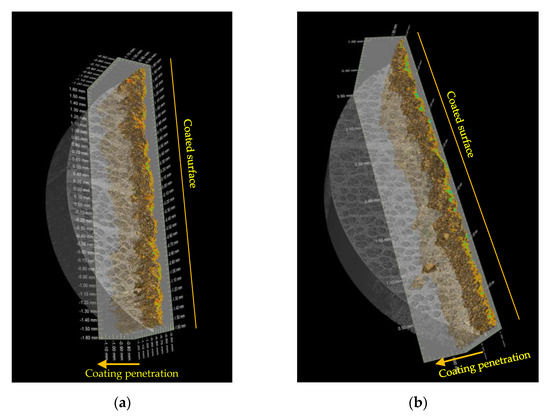
Figure 13.
GL-coated veneer; (a) 3D visualization result using Cu target; (b) 3D visualization result using Mo target with Al filter.
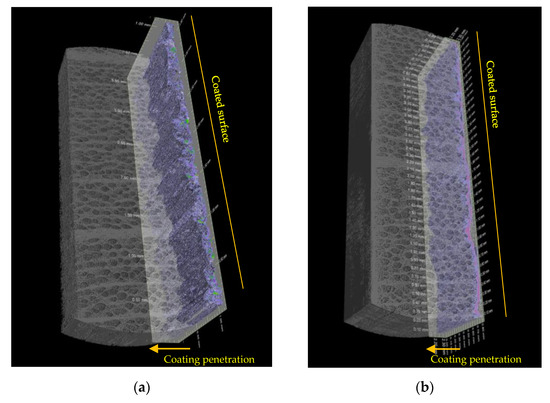
Figure 14.
SL-coated veneer; (a) 3D visualization result using Cu target; (b) 3D visualization result using Mo target with Al filter.
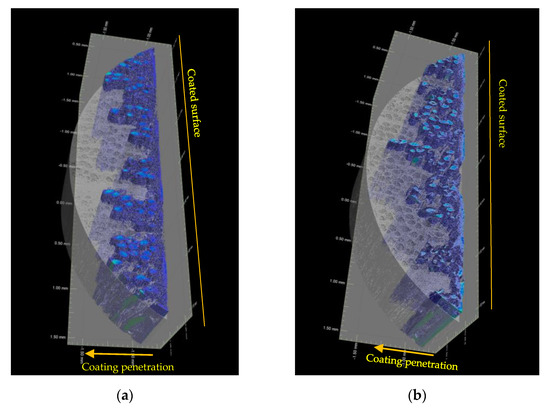
Figure 15.
WH-coated veneer; (a) 3D visualization result using Cu target; (b) 3D visualization result using Mo target with Al filter.
Figure 13 shows a 3D image of wood with GL (gold) coatings. The coating side is the yellow part on the surface of the wood (right side). In the case of GL coatings, the coating only penetrates on the surface of the wood. Figure 13a indicates the Figure 5 GL and Figure 13b indicates the Figure 9 GL side as the 3D images. The coating is distributed only on the surface because of the content of the coating materials.
Figure 14 shows a 3D image of wood with SL (silver) coatings. The coating side is the purple part on the surface of the wood (right side). In the case of SL coatings, it is same with the SL coating, which penetrates only on the surface of the wood. Figure 14a indicates the Figure 5 SL and Figure 14b indicates the Figure 9 SL side as the 3D images. The coating is distributed only on the surface because of the content of the coating materials.
Figure 15 shows a 3D image of wood with WH (white) coatings. The coating side is the blue part on the surface of the wood (right side). Based on the figures, it can be seen that the WH coating is penetrated not only on the wood surface, but also deeply into the wood vessel. Figure 15a indicates the Figure 7 WH and Figure 15b indicates the Figure 11 WH side as the 3D images. The coating is distributed deeply because of the content of the coating materials.
4. Discussion
X-ray microtomography is applicable to visualize the coating material distribution on the Japanese beech veneer, including the coating penetration phenomena. The images and grey value obtained can persuade future quantitative analysis of coating penetration of the coated veneer. Most of the visible visualization of the coating material was the coating with the purpose of a colorant. In this case, the image shows penetration of the coating into the wood vessels. The morphology of the film formation mechanism after coating application changed the wood characteristics [13], and this phenomenon was successfully visualized. The coating material with the purpose of a biocide could be visualized; nevertheless, it did not show the penetration phenomena of the wood. It mostly accumulated on the surface of the veneer. On the other hand, the coating material with the purpose of a varnish failed to be visualized by X-ray microtomography. This happened due to the small number of ions in its chemical composition. Notwithstanding, Table 2 shows that all the applications of the coatings result in a certain coating thickness, indicating that all the veneers were adequately coated.
The X-ray microtomography images in 2D and 3D enable to investigate and observe the existence of the coating material, and coating penetration phenomena occurred on the coated veneer. The 3D visualization was successfully obtained due to the superior resolution of X-ray [14] and the voxel size of the X-ray image, which was sufficient for wood coatings [15]. The high X-ray energy (X-ray target using Mo with Al filter) and low X-ray energy (X-ray target using Cu) affected the image quality. The high X-ray energy resulted in a better image. The low X-ray energy led to artifact formation in the gap between air and the sample. The grey value plot profiles of Figure 5, Figure 6, Figure 7 and Figure 8 proved the existence of the artifact indicated by the inconstant peak.
The 3D visualization using high X-ray energy resulted in a better color rendering image. The coating materials were clearly distinguished from wood cells by color gradation based on a different grey value, which is in accordance with the results of a preliminary work conducted by Van den Bulcke et al. [15].
The results suggest that the elemental composition of coating materials strongly affects the visualization. Most biological samples are largely composed of light elements such as hydrogen, oxygen, carbon, and nitrogen, which weakly absorb X-rays [16]. Due to this fact, a coating material containing heavier elements leads to a clear visualization. In particular, the existence of elements such as Al, Fe, Cu, Zn, Si and/or Ti improves the contrast between coatings and wood cells.
5. Conclusions
The used X-ray CT analysis successfully visualized the distributions of various coating materials that were applied to the surface of Japanese beech veneer. Elemental components such as, Al, Fe, Cu, Zn, Fe, Si, and Ti highly enhance the contrast between coatings and wood cells. The percentages of such elements also affect the contrast. The highest percentage shows a higher contrast than the lowest percentage. The results also imply that a higher energy X-ray source leads to better visualization. The penetration of the coating into wood cell-vessel network in the veneer is clearly visible both in 2D and 3D visualization, suggesting that the technique presented in this study can persuade the quantitative analysis of the penetrations of coating materials.
Author Contributions
Conceptualization, T.S.E., A.N.A. and T.T.; methodology, T.S.E., A.N.A. and T.T.; software, T.S.E. and A.N.A.; writing—original draft preparation, T.S.E.; writing—review and editing, T.S.E., A.N.A. and T.T.; supervision, T.T.; funding acquisition, T.T. All authors have read and agreed to the published version of the manuscript.
Funding
This work was supported by JSPS KAKENHI Grant Number 20K06163.
Institutional Review Board Statement
Not applicable.
Informed Consent Statement
Not applicable.
Data Availability Statement
Data sharing is not applicable to this article.
Conflicts of Interest
The authors declare no conflict of interest.
References
- Evans, P.D.; Haase, J.D.; Shakri, A.; Seman, B.M.; Kiguchi, M. The search for durable exterior clear coatings for wood. Coatings 2015, 5, 830–864. [Google Scholar] [CrossRef]
- Gibbons, M.J.; Nikafshar, S.; Saravi, T.; Ohno, K.; Chandra, S.; Nejad, M. Analysis of a wide range of commercial exterior wood coatings. Coatings 2020, 10, 1013. [Google Scholar] [CrossRef]
- Kong, L.; Xu, D.; He, Z.; Wang, F.; Gui, S.; Fan, J.; Pan, X.; Dai, X.; Dong, X.; Liu, B.; et al. Nanocellulose-reinforced polyurethane for waterborne wood coating. Molecules 2019, 24, 3151. [Google Scholar] [CrossRef] [PubMed]
- Šimůnková, K.; Oberhofnerová, E.; Reinprecht, L.; Pánek, M.; Podlena, M.; Štěrbová, I. Durability of selected transparent and semi-transparent coatings on Siberian and European larch during artificialweathering. Coatings 2019, 9, 39. [Google Scholar] [CrossRef]
- Shukla, S.; Pandey, K.K.; Kishan Kumar, V.S. Chemical and application properties of some solvent and water based coatings on wooden substrate. Drv. Ind. 2019, 70, 107–114. [Google Scholar] [CrossRef]
- Wu, Z.; Deng, X.; Luo, Z.; Zhang, B.; Xi, X.; Yu, L.; Li, L. Improvements in fire resistance, decay resistance, anti-mold property and bonding performance in plywood treated with manganese chloride, phosphoric acid, boric acid and ammonium chloride. Coatings 2021, 11, 399. [Google Scholar] [CrossRef]
- Tateishi, M.; Kumagai, T.; Suyama, Y.; Hiura, T. Differences in transpiration characteristics of Japanese beech trees, Fagus crenata, in Japan. Tree Physiol. 2010, 30, 748–760. [Google Scholar] [CrossRef][Green Version]
- Takahashi, A.; Nakayama, Y. Fagus crenata Blume. In Wood Science Series, 3rd ed.; Kaiseisha Press: Otsu City, Japan, 2015; p. 79. [Google Scholar]
- Clark, G.L.; Fitch, K.R. Chemical effects of X-rays upon some aromatic colors and dyes. Radiological 1931, 17, 285–293. [Google Scholar] [CrossRef]
- Wang, Q.P.; Liu, X.E.; Zhang, G.L. Rapidly detection for moso bamboo density under different moisture condition based on X-CT technology. Spectrosc. Spectr. Anal. 2016, 36, 1899–1903. [Google Scholar]
- Kinoshita, K.; Tsubota, M.; Ikemoto, E. Chapter 9: Paint selection and painting process (Part 2)-wood. Color Mater. 1996, 69, 327–342. [Google Scholar]
- Oishi, A.; Tanaka, T. Development of a nondestructive imaging method for morphological characterization of adhesive bondlines in wood-based materials using X-ray micro-computed tomography. J. Jpn. Soc. Adhes. 2020, 57, 145–151. [Google Scholar]
- Mader, A.; Schirò, A.; Brischetto, M.; Pizzo, B. Interactions and penetration of polymers and nanolatexes into wood: An overview. Prog. Org. Coat. 2011, 71, 123–135. [Google Scholar] [CrossRef]
- Bessières, J.; Maurin, V.; George, B.; Molina, S.; Masson, E.; Merlin, A. Wood-coating layer studies by X-ray imaging. Wood Sci. Technol. 2013, 47, 853–867. [Google Scholar] [CrossRef]
- Van den Bulcke, J.; Boone, M.; Van Acker, J.; Van Hoorebeke, L. High-resolution X-ray imaging and analysis of coatings on and in wood. J. Coat. Technol. Res. 2010, 7, 271–277. [Google Scholar] [CrossRef]
- Karahara, I.; Yamauchi, D.; Kentaro, U.; Muneyuki, Y. Three dimensional imaging of plant tissues using X-ray micro-computed tomography. Plant Morphol. 2015, 27, 21–26. [Google Scholar] [CrossRef]


Publisher’s Note: MDPI stays neutral with regard to jurisdictional claims in published maps and institutional affiliations. |
© 2021 by the authors. Licensee MDPI, Basel, Switzerland. This article is an open access article distributed under the terms and conditions of the Creative Commons Attribution (CC BY) license (https://creativecommons.org/licenses/by/4.0/).