Article

Hydrophilic Surface Treatment of Carbon Powder Using CO2 Plasma Activated Gas

Institute of Plasma Technology, Korea Institute of Fusion Energy, 814-2, Osikdo-dong, Jeollabuk-do, Gunsan City 54004, Korea
*
Author to whom correspondence should be addressed.
Coatings 2021, 11(8), 925; https://doi.org/10.3390/coatings11080925
Submission received: 22 July 2021 / Revised: 27 July 2021 / Accepted: 29 July 2021 / Published: 2 August 2021
(This article belongs to the Special Issue Surface Modification by Plasma-Based Processes)

Abstract

:
Carbon powders exhibit electrical conductivity that causes the powders to agglomerate due to the applied electrostatic forces and discharges capacitance when used for surface treatments with plasma sources. To avoid this obstacle, a non-direct method is used with active gas that is generated through plasma. This active gas is in contact with the carbon powder so that the hydrophilic characteristics are formed. It is the carboxyl COO functional group that causes hydrophilic improvement and it is shown to increase in the carbon surface after soft oxidation. The wettability of carbon powder gradually improves with more plasma treatment time. This is shown through a simple water dispersion test. Eventually, the dispersed aqueous solution gradually separates the powder, which either floats or sinks. The sample treated for 60 min is shown to continuously sustain dispersibility in water over a long period of time.

1. Introduction

Carbon powders are useful in many ways, such as colorings, light-blocking additives, and conductive materials that are used in secondary batteries and capacitors. These carbon powders are added to the production of slurry that is used as an electrode material, in which some type of suitable dispersion is required [1,2,3]. The carbon powder has low surface energy due to the C-C bonds because it is manufactured with almost no functional groups. In addition, it is difficult to be wetted in water [4].
To improve dispersion properties, additives such as surfactants or dispersive resins are used. However, a few additives do not provide sufficient dispersion. On the other hand, using more additives could reduce the carbon content and degrade the electrical properties [4,5]. Due to this difficulty, there have been various surface treatments [6].
The existing conventional technology involves the use of chemical solutions, such as nitric acid and hydrogen peroxide, which create hydrophilic functional groups by combining a hydroxyl group (OH) or a carboxyl acid group [7,8,9]. This method is simple, although it requires time for purification and drying.
There are gaseous methods that use ozone, nitrogen oxide, He-O2 plasma, and CO2 plasma treatment that mainly use oxygen-related radicals [10,11,12,13,14,15,16]. Carbon powder is easy to degrade, making it difficult to be processed at high temperatures. Therefore, low-temperature plasma is commonly used by capacitively coupled plasmas in vacuums with a radio frequency of 2.45 GHz microwave power, or by dielectric-barrier discharge (DBD) type atmospheric plasmas [10,11,12,13,14,15,16].
In vacuums, due to the long mean free path of particle interaction and low operation pressure, the amount of the reactive gas concentration generated from plasma is small, making it difficult to penetrate through the powder surface layer. Even at atmospheric pressure, O2 plasma is difficult to control because of its strong oxidizing species. Especially in ozone, the carbon powder surface tends to denature and erode. In particular, high ozone concentrations may cause carbon powder to explode into flammable dust. Carbon powders are highly electrical and can interfere with electrode capacitance when in direct contact with the plasma [17]. Therefore, we apply a non-direct method, where carbon powder is remotely treated with the active gas generated from the atmospheric pressure DBD plasma.
When oxygen radicals are bound to the surface of the carbon powder, hydrophilic functional groups, such as C–O, C=O, and COOH are formed, where it becomes possible to be wetted with water [9,18,19]. Therefore, when the gas containing C and O is dissociated, a similar functional group is created. Additionally, CO, O2, and O3, which are gaseous active species generated from the CO2 plasma, react with the carbon powder so that hydrophilic functional groups are bonded. The CO2 gas is relatively safe, non-toxic, and can easily be generated from atmospheric pressure DBD plasmas. To optimize the production of CO2 plasma, surface functionalization of the carbon powder is carried out at a fixed flow rate of 1 L/min (liter per minute).

2. Materials and Methods

The carbon black powder (Ketjen Black 600JD) sample used for the experiment was purchased from Infochems Inc., Goyang, Korea (CAS number: 1333-86-4). The sample had an average powder size of 40 nm and could be used as a battery electrode or as a semiconductor component for electro-conductive and antistatic agents. As shown in Figure 1, CO2 activated gas from the plasma was supplied through a tube so that it was in contact with the carbon powder.
The DBD device that produced high concentrations of active gas was employed for CO2 plasma-activated gas (PAG) generation, where the operating conditions were optimized with an output power of 800 W at an AC frequency of 30 kHz [20]. To increase the contact area of the powder, a vortex mixer (VM-96A, Lab Companion, Billerica, MA, USA) installed at the bottom was used to stir the power. The gas flow of pure CO2 (99.9995%) was fixed at 1 L/min. Finally, at the end of the reaction, the gas was vented through a 0.01 µm filter (SFB100-02, SMC Corporation, Tokyo, Japan).
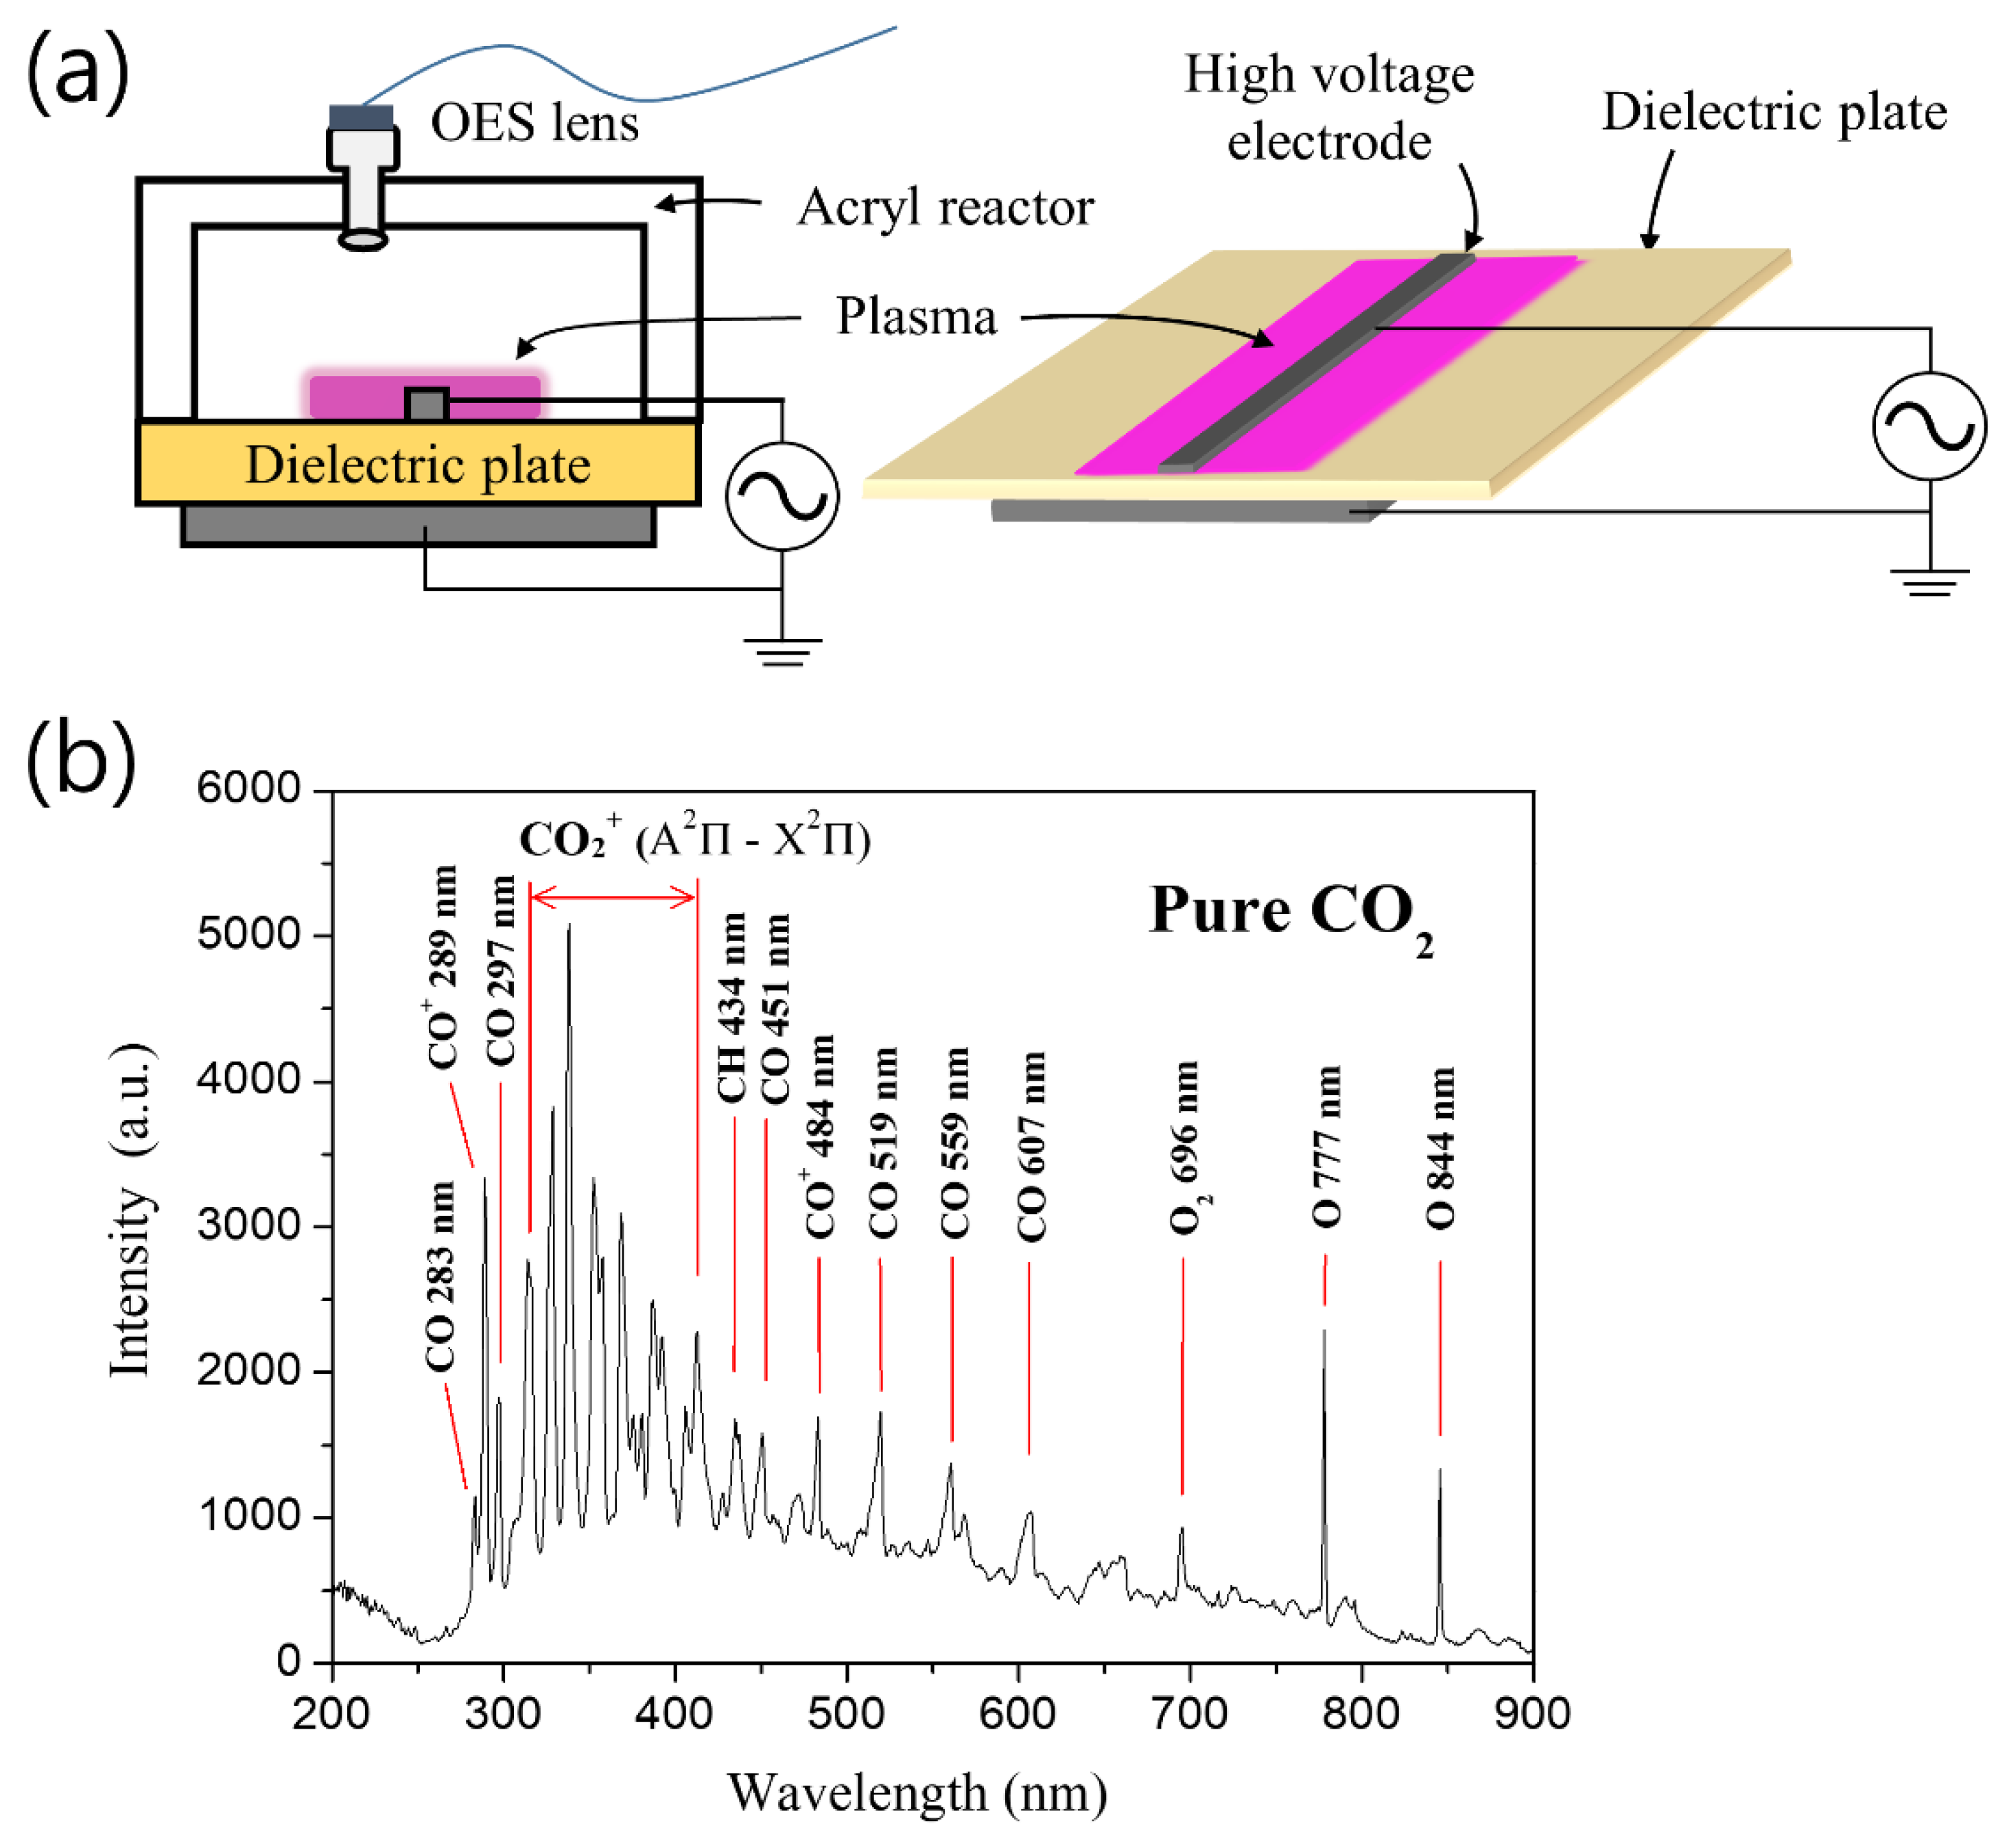
As shown in Figure 2a, optical emission spectroscopy (OES) was used to identify the active species of the CO2 plasma. From the schematic, an alumina plate was used as a dielectric material having a size of 105 mm × 105 mm and 1 mm thick with a strip-type electrode of 1 mm in width applied at high voltage. In addition, a ground electrode was attached on the opposite side of the dielectric plate. Inside the acrylic reactor, a flow rate of 1 L/min of CO2 gas was supplied with an AC power source having a frequency of 30 kHz and a pulse width of 1.5 μs applied at approximately 11.5 kV (pk-pk) voltage. The position of the OES, having a fixed 10 mm diameter lens (QEPro, Ocean optics inc., Orlando, FL, USA), was 40 mm away from the electrodes.
Radicals produced from the CO2 plasma mainly involved the process of excitation, ionization (e + CO2 → 2 e + CO2+), dissociation (e + CO2 → e + CO + O), and (e + CO2→ e + C + O2) by electro-collisions [21,22]. The measured emission spectrum of CO2 plasma was in the form of CO + (B2Σ ~X2Σ), which consisted of the First Negative System, 315, 327, 338, 352, 368, 387, 391, 392, 413 nm, CO2 + (A2Π ~ X2Π) band, CO (d3Δ ~ a3Π) low-intensity CO peaks estimated to be triplet bands, 696 nm O2 line, 777 nm, and 844 nm oxygen atom radical lines [23]. Primarily CO, CO2, O, and O2 were detected, where the same emission ratio was detected irrespective of the measurement distance and input power condition.
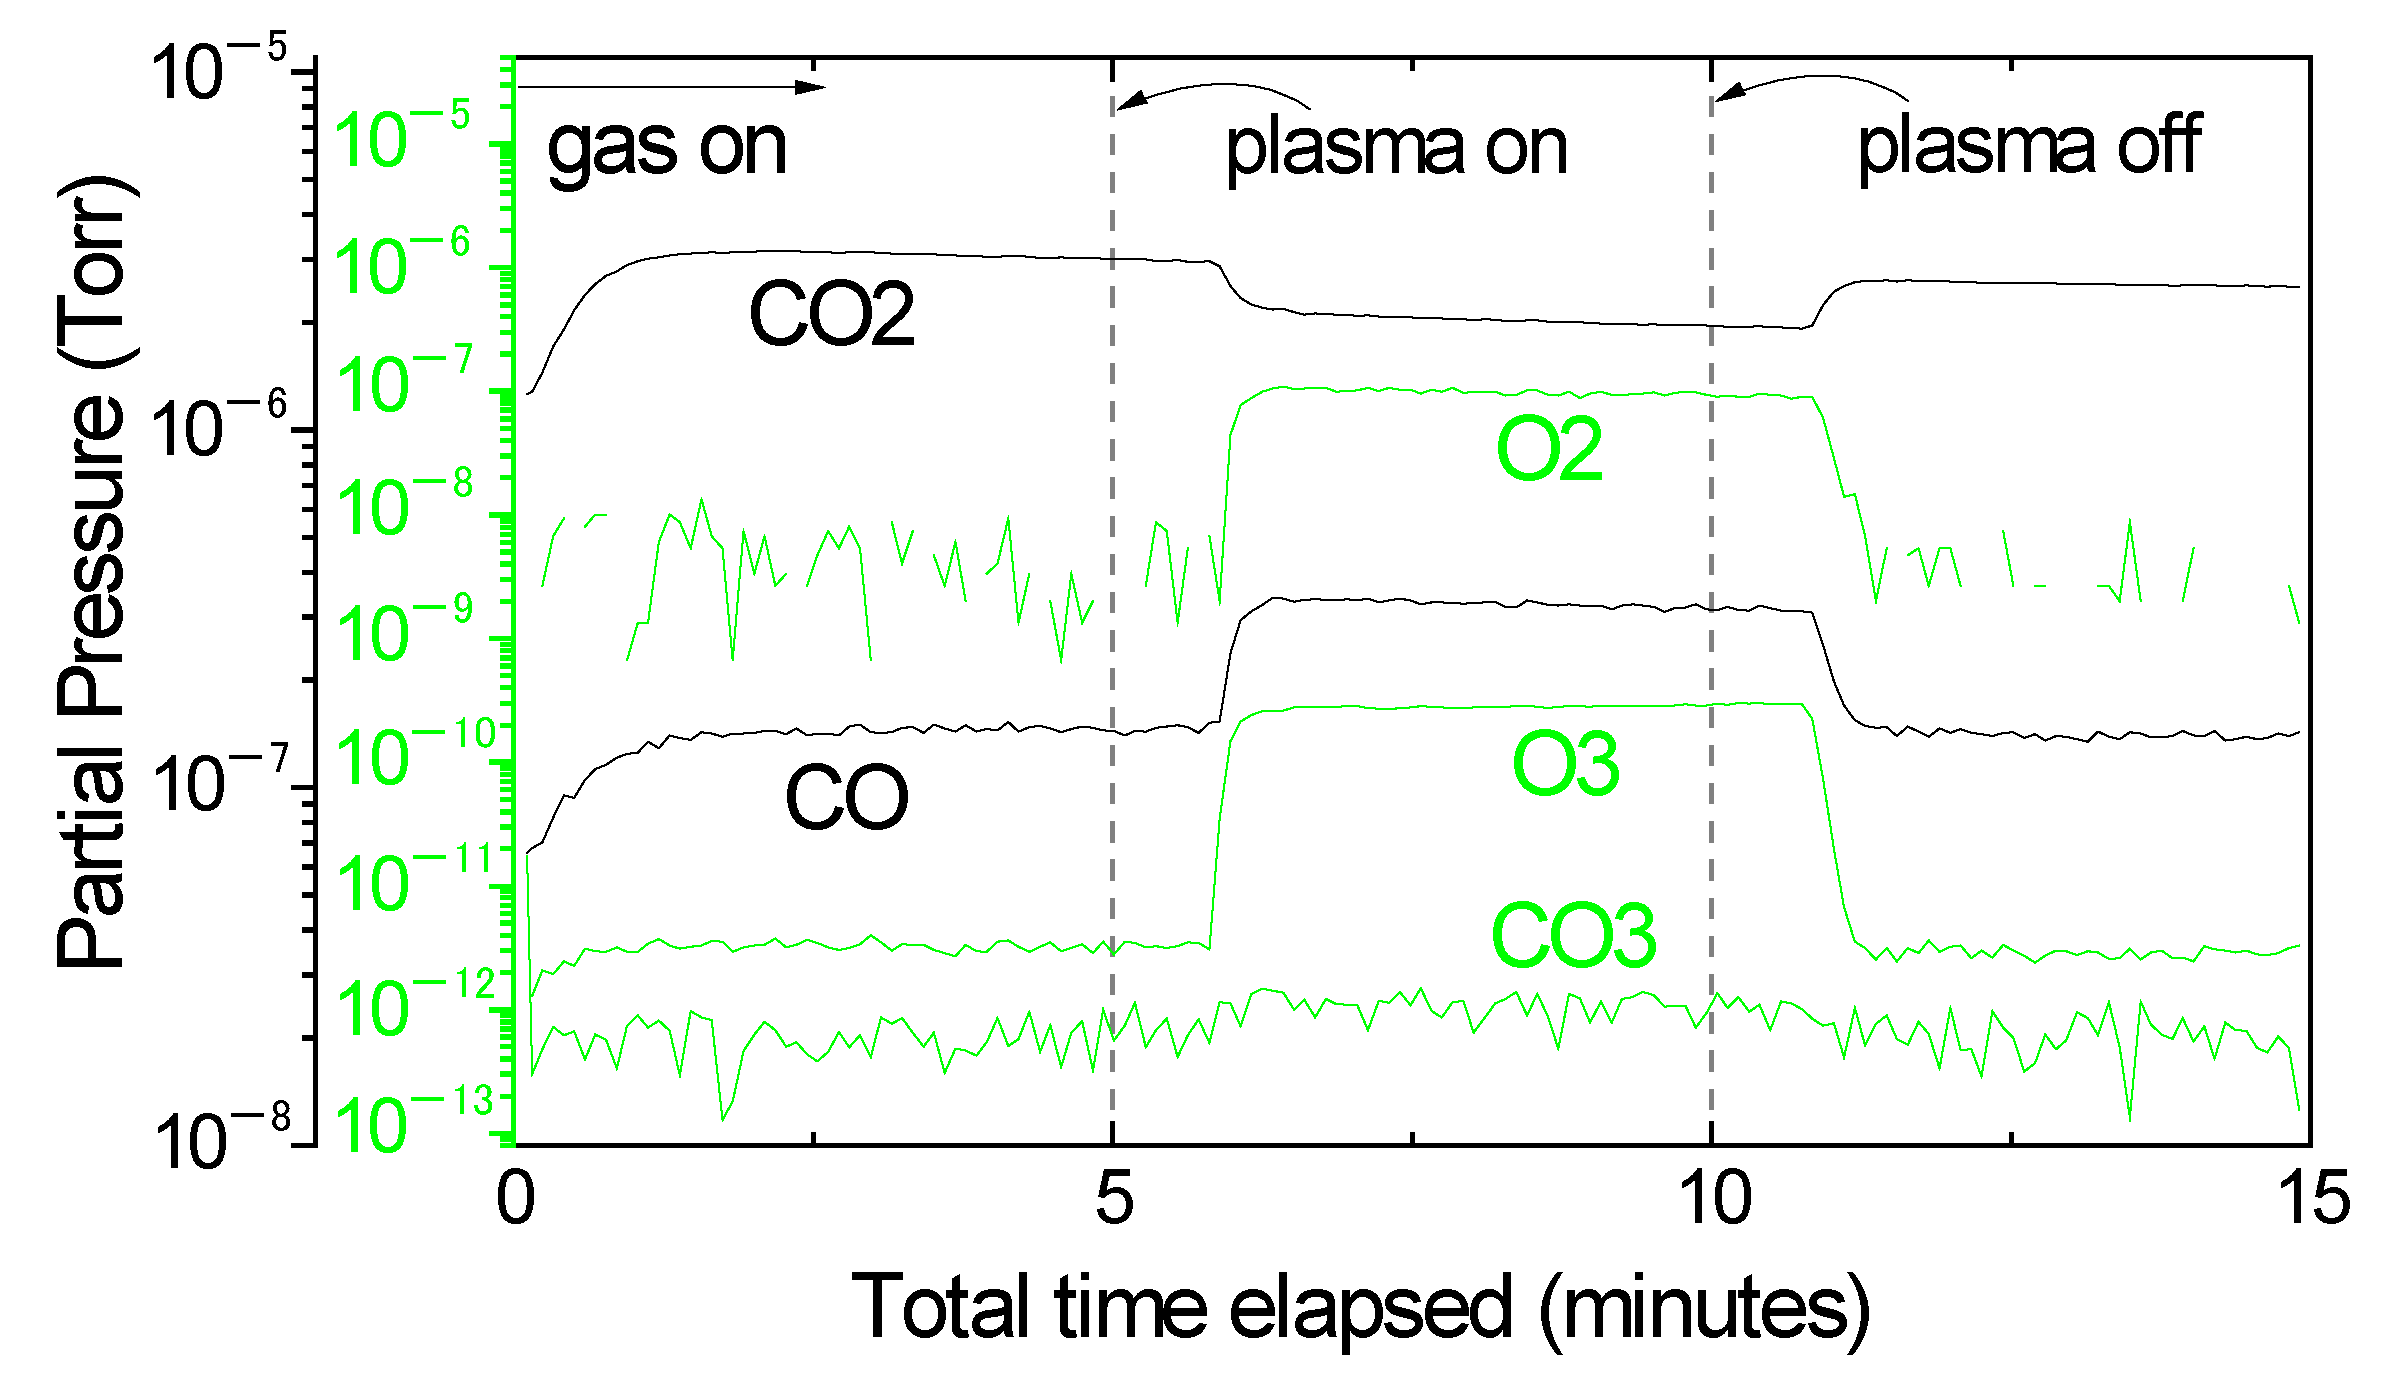
The same emission would occur even in DBD electrodes with a similar configuration. While the active species consisting of C and O generated from plasma passed through the tube, charged particles were immediately extinguished due to their short lifetime of a few microseconds or less. Active species that showed a long reaction time with the carbon powder were monitored by using a quadrupole mass spectrometer (QMS) from Hiden (HDR-20, Hiden analytical, Warrington, Cheshire, UK), where the measured data is presented in Figure 3.
After 5 min, plasma was generated with only the CO2 gas flowing. During this period, CO2 dissociates and its concentration decreased. On the other hand, the production of CO, O2, O3, and small levels of CO3 were detected. A delay time of approximately 1 min was observed due to the QMS sampling during the measurement process. When the plasma was turned off, the CO2 gas returned back to its original state.

3. Results and Discussion

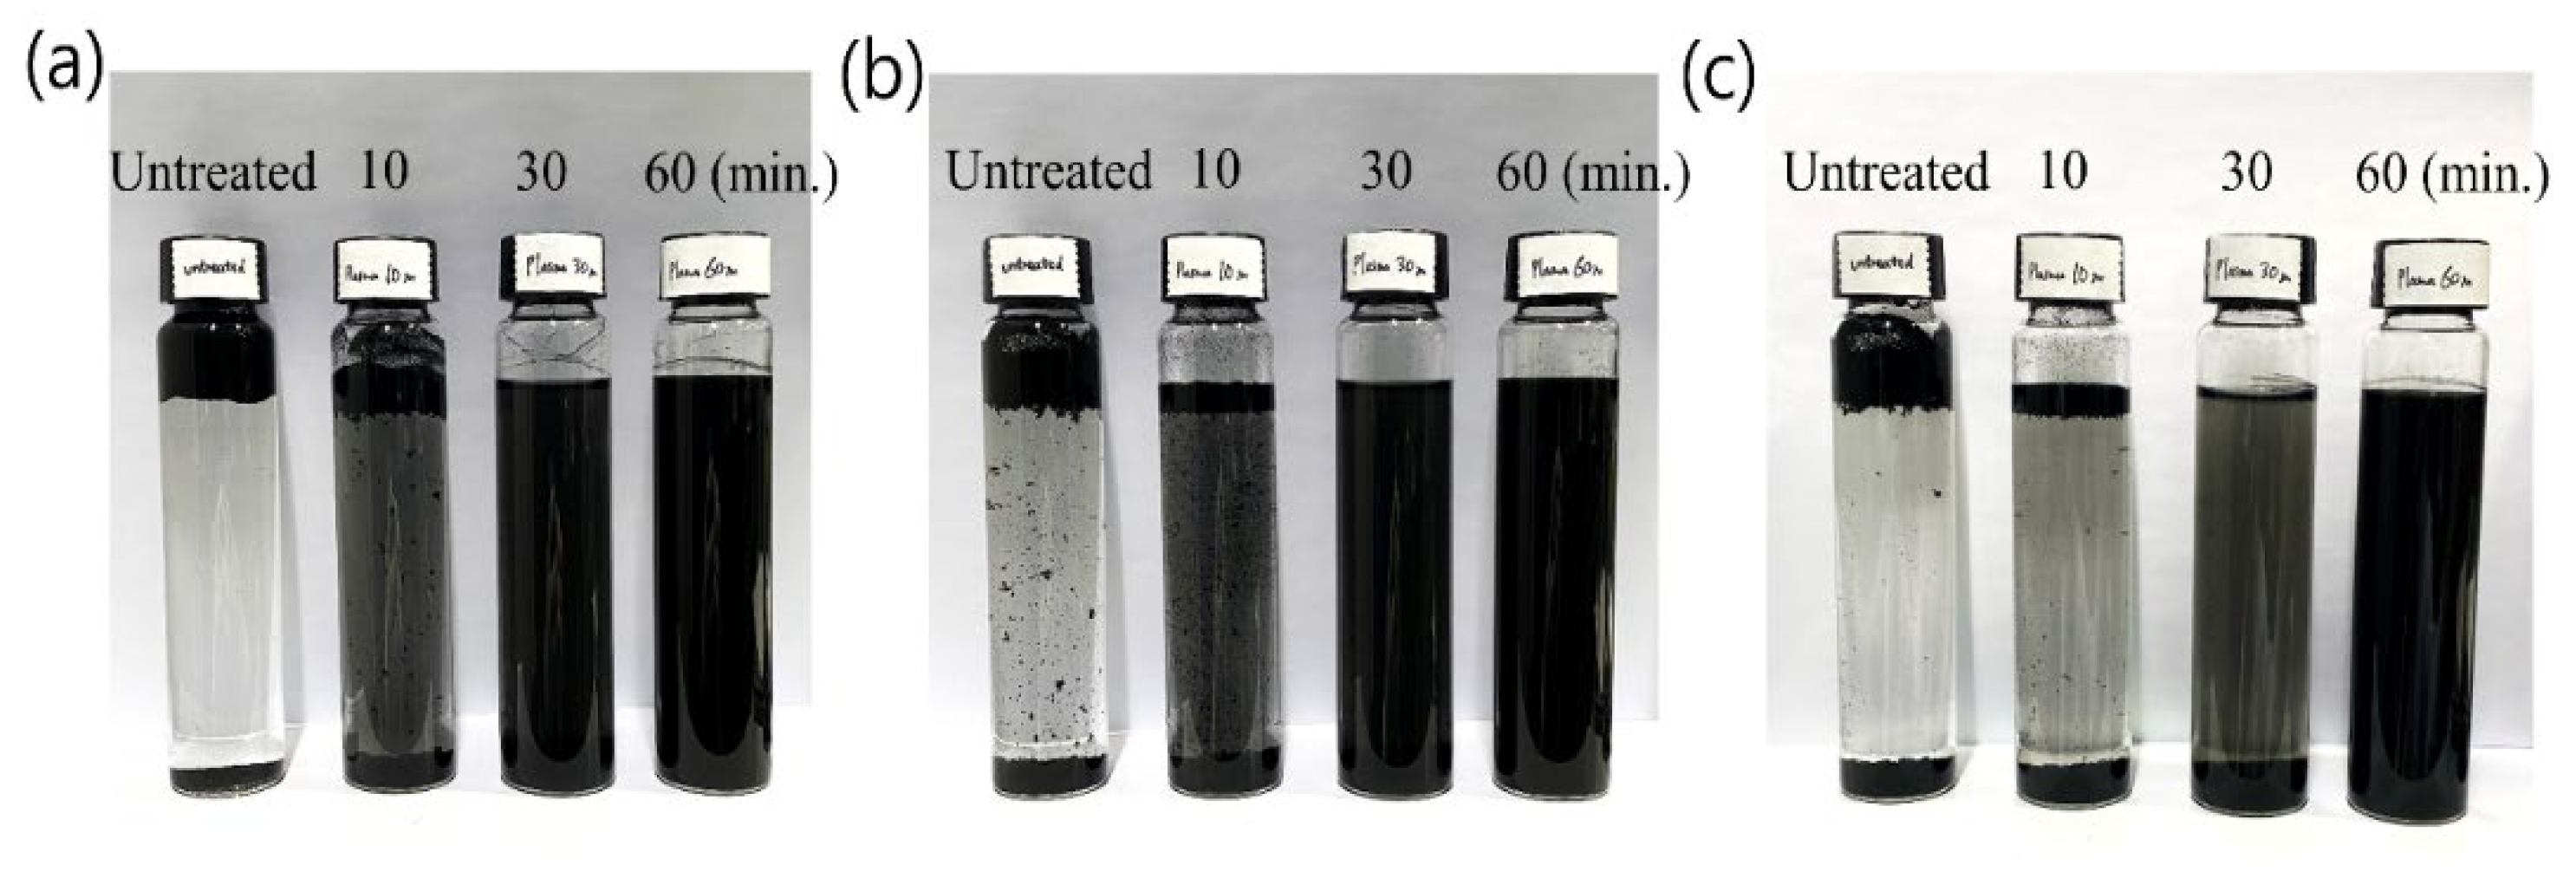
Figure 4 shows images of several dispersion tests, in which 50 mL of deionized (DI) water was added to 0.05 g of the carbon powder sample. From the left, the untreated sample is compared with the PAG treatment sample for 10 min, 30 min, and 60 min, respectively. As shown in the untreated sample, the carbon powder before treatment shows very little indication of being wetted and floats in water. It gradually becomes slightly moisturized naturally and is not completely dispersed.
The PAG-hydrophilized carbon powder momentarily suspends on top of the water, as it is immediately dissolved into the water. If the untreated sample was strongly shaken by hand (hand-shaking), it would become temporarily mixed, but the layer would eventually separate again within a few minutes. Gradually, the separated component would either float or sink into the water. The PAG-treated samples also show the separation of suspension over time. However, with longer treatment times, the precipitation time becomes longer. From the sample images, the sedimentation time is not accurately determined. Therefore, the samples were compared by transmitting light and measuring the output light intensity.
As shown in Figure 5a, a 60 mL vial sample bottle was placed on top to measure the suspension solution as it becomes less opaque over time. The visible light range, from 550 nm to 700 nm, of the light source, was selected using a tungsten-halogen lamp (HL-4000, Ocean optics inc., Orlando, FL, USA). For the OES (Ocean Optics, QEPro) measurement, integration time was fixed at 100 µs, where the scan was conducted over an average of 10 measurements at the center location. The measurement started immediately when the solution was suspended, after stirring with a magnetic stirrer for 1 min.
As shown in Figure 5b, the untreated sample gradually becomes clear as the transmitted light increases. In this case, suspended particles tend to stick to the wall or rise and fall, interfering with the measurement of light intensity. The PAG-treated samples, due to being wet, transmit less light as it becomes more opaque with more treatment time. The light intensity appears to have a linear trend, where it is possible to compare the differences in the dispersion of the suspended liquid. Especially for the 60 min treated sample, there seems to be very little difference in the dispersion. As plasma time increases, the sedimentation time becomes longer.
To identify if any surface deformation has taken place, the images of the samples before and after PAG treatment were measured using field emission scanning electron microscopes (FE-SEM) from Carl Zeiss microscopy (Gemini, Zeiss, Oberkochen, Gemany). From Figure 6a, spherical-shaped carbon powders having a size of 40 nm are observed. In Figure 6b, the sample treated by PAG for 60 min remains unchanged at the same size. From the images, there seems to be no apparent surface damage when comparing the size or differential shape due to the PAG treatment. As a result of the energy-dispersive X-ray spectroscopy (EDX, NORAN System 7, Thermo Fisher scientific, Waltham, MA, USA) elemental analysis, oxygen was 2.49%, with the rest of carbon and oxygen contents increasing during the PAG treatment time. This indicates that the oxygen content is 10 times higher for the 60 min treated sample. The oxygen content increases due to the formation of C–O and C=O functional groups on the surface of the carbon powder.
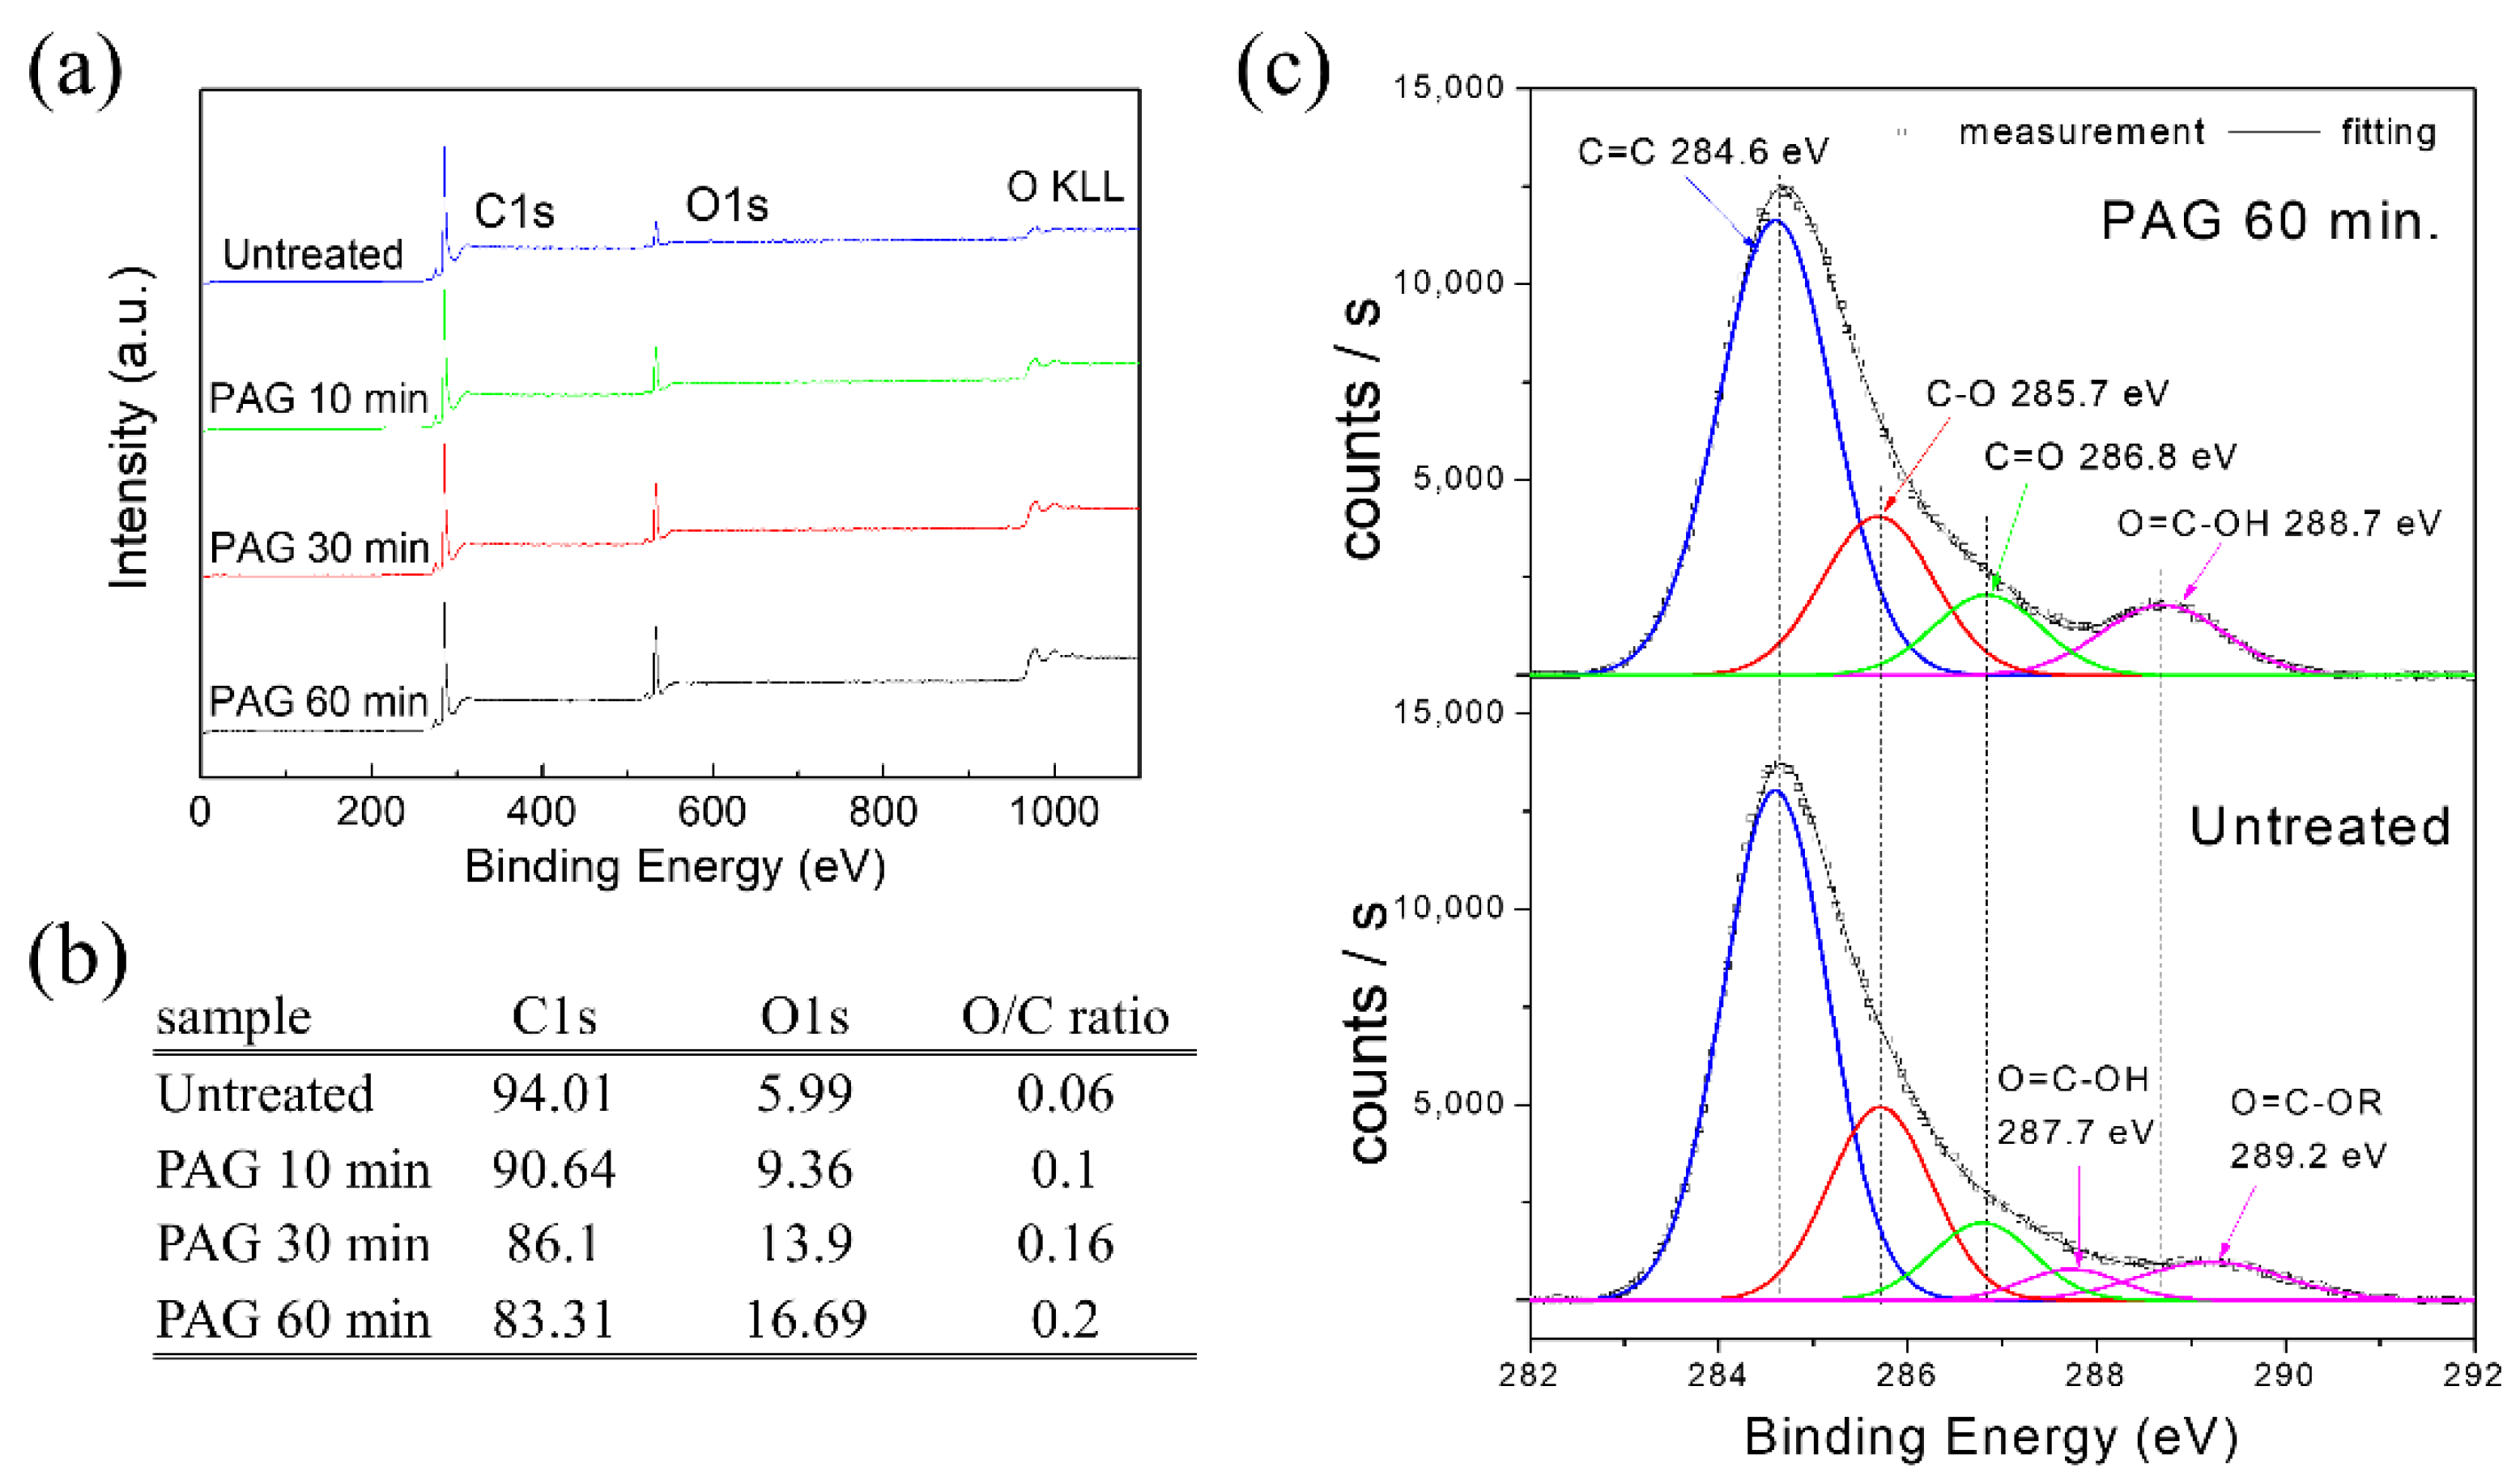
As shown in Figure 7a, only C and O were detected in the X-ray Photoelectron Spectroscopy (XPS) survey data. The spectra were taken with the ESCA 2000 spectrometer (VG microtech, London, UK) by Al Ka radiation of 1486.6 eV and Mg Ka radiation of 1253.6 eV. With more PAG treatment time, the oxygen content gradually increases as observed from the EDX elemental analysis. In Figure 7b, the O/C ratio is determined by the ratio of oxygen and carbon element content. Starting at 0.06 before treatment, the O/C ratio increases to 0.1 after 10 min of PAG treatment, and later up to 0.2 after 60 min. The increase of the O/C ratio is also observed when comparing the hydrophilicity of materials, such as polymer powders [24]. High-resolution spectra of C 1s in Figure 7c, indicate that the carbon bonding peak intensities of the plasma-treated carbon powder are similar to the untreated sample on three main components (284.6 eV, 285.7 eV, and 286.8 eV). The peak at 284.6 eV represents graphitic carbons (C–C), the peak at 285.7 eV represents alkoxy groups (C–O), and the peak at 286.8 eV represents carbonyl groups (C=O) [9,18,19]. On the tall peak at 288.7 eV, the PAG-treated 60 min sample shows a carboxyl group, which is a hydrophilic functional group, whereas the untreated sample is divided into 287.7 eV (–COOH) and 289.2 eV (–COOR). This shows that the 287.7 peak and the 289.2 eV ester groups were converted to carboxyl groups during the PAG treatment, leading to an increase in the peak of the 288.7 eV group.
The contact angle was measured using the Washburn method to confirm the surface hydrophilicity of the powder [6,25,26,27]. As shown in Figure 8a, when the carbon powder sample was placed in a compressed column having a size of 12 mm, it is contacted with the DI water solution, where the liquid is absorbed. The value of the contact angle could be obtained by measuring the weight of the liquid permeating into the carbon sample. The following modified Washburn equation is used to determine the weight of the liquid that penetrates into the packed carbon powder over time ( w 2 / t ).
c o s θ = w 2   t × η   ρ 2 × r × C ,
where η is viscosity, ρ is density, r is the surface tension of the liquid, C is a dimension constant of the sample, and c o s θ is the angle of contact. C is a material constant that measures a liquid having low surface tension, such as n-hexane (18 mN m−1).
As shown in Figure 8b, the contact angle for DI water on the carbon powder before treatment was 87°. Afterward, with very low absorption of water, the contact angle changes to 74° for 10 min, 63° for 30 min, and 30° for 60 min. When more PAG processing time is applied, the surface of the carbon powder becomes hydrophilic.

4. Conclusions

The carbon powder was hydrophilized using CO2 PAG. The experiments were conducted with a batch-type reactor that mixes the carbon powder with the CO2 discharge gas, which is generated by a plasma device employing DBD electrodes at atmospheric pressure. The PAG-treated carbon powder easily disperses in water when compared to the previous pre-treated samples. Especially for the treatment time at 60 min, by comparing transmitted light intensity, the dispersion appears to be nearly everlasting.
Through the analysis of OES and QMS, components of the CO2 PAG were identified as CO, O2, and O3 active species. In the XPS measurement, COOH carboxyl hydrophilic functional groups are shown to increase on the surface of the PAG-treated carbon powder. In addition, the O/C ratio, due to carbon oxidation has a maximum ratio of 0.2. With the Washburn method, the water contact angle of DI water is reduced from 90° to 30°. The wettability properties make PAG-treated carbon powder a useful product for water-based dispersion and water-based slurry production [28,29,30].

Author Contributions

Conceptualization, S.Y. and D.S.; methodology, S.Y. and D.S.; validation, S.Y. and D.S.; formal analysis, S.Y. and D.S.; investigation, S.Y., D.S, and Y.J.; data curation, S.Y. and D.S.; writing–original draft preparation, S.Y.; writing–review and editing, S.Y., D.S., Y.J. and K.L.; visualization, S.Y.; supervision, D.S. and Y.J.; project administration, D.S. and Y.J.; funding acquisition, D.S. and Y.J.; All authors have read and agreed to the published version of the manuscript.

Funding

This research was supported by R&D Program of “Plasma Convergence and Fundamental Research Project (code No. 1711124796)” through the Korea Institute of Fusion Energy (KFE) funded by the Government funds, Korea.

Institutional Review Board Statement

Not applicable.

Informed Consent Statement

Not applicable.

Data Availability Statement

Not applicable.

Conflicts of Interest

The authors declare no conflict of interest.

References

  1. Gao, J.-S.; Liu, Z.; Yan, Z.; He, Y. A novel slurry blending method for a uniform dispersion of carbon nanotubes in nature rubber composites. Results Phys. 2019, 15, 102720. [Google Scholar] [CrossRef]
  2. Konda, K.; Moodakare, S.B.; Kumar, P.L.; Battabyal, M.; Seth, J.R.; Juvekar, V.A.; Gopalan, R. Comprehensive effort on electrode slurry preparation for better electrochemical performance of LiFePO4 battery. J. Power Sources 2020, 480, 228837. [Google Scholar] [CrossRef]
  3. Sis, H.; Birinci, M. Effect of nonionic and ionic surfactants on zeta potential and dispersion properties of carbon black powders. Colloids Surf. A Physicochem. Eng. Aspects 2009, 341, 60–67. [Google Scholar] [CrossRef]
  4. Li, H.-Y.; Chen, H.-Z.; Xu, W.-J.; Yuan, F.; Wang, J.-R.; Wang, M. Polymer-encapsulated hydrophilic carbon black nanoparticles free from aggregation. Colloids Surf. A Physicochem. Eng. Aspects 2005, 254, 173–178. [Google Scholar] [CrossRef]
  5. Rosen, M.J. Surfactants and Interfacial Phenomena, 2nd ed.; John Wiley & Sons: New York, NY, USA, 1989; pp. 337–354. [Google Scholar]
  6. Arpagaus, C.; Oberbossel, G.; Rohr, P.R. Plasma treatment of polymer powders–from laboratory research to industrial application. Plasma Process. Polym. 2018, 15, 1800133. [Google Scholar] [CrossRef]
  7. Castilla, C.M.; García, M.A.F.; Joly, J.P.; Toledo, I.B.; Marín, F.C.; Utrilla, J.R. Activated carbon surface modifications by nitric acid, hydrogen peroxide, and ammonium peroxydisulfate treatments. Langmuir 1995, 11, 4386–4392. [Google Scholar] [CrossRef]
  8. Otake, Y.; Jenkins, R.G. Characterization of oxygen-containing surface complexes created on a microporous carbon by air and nitric acid treatment. Carbon 1993, 31, 109–121. [Google Scholar] [CrossRef]
  9. García, M.D.; Garzón, F.J.L.; Mendoza, M.P. Effect of some oxidation treatments on the textural characteristics and surface chemical nature of an activated carbon. J. Colloid Interface Sci. 2000, 222, 233–240. [Google Scholar] [CrossRef]
  10. Şahin, Ö.; Yardim, Y.; Baytar, O.; Saka, C. Enhanced electrochemical double-layer capacitive performance with CO2 plasma treatment on activated carbon prepared from pyrolysis of pistachio shells. Int. J. Hydrogen Energy 2020, 45, 8843–8852. [Google Scholar] [CrossRef]
  11. Kodama, S.; Habaki, H.; Sekiguchi, H.; Kawasaki, J. Surface modification of adsorbents by dielectric barrier discharge. Thin Solid Films 2002, 407, 151–155. [Google Scholar] [CrossRef]
  12. Lee, D.; Hong, S.-H.; Paek, K.-H.; Ju, W.-T. Adsorbability enhancement of activated carbon by dielectric barrier discharge plasma treatment. Surf. Coat. Technol. 2005, 200, 2277–2282. [Google Scholar] [CrossRef]
  13. García, A.B.; Alonso, A.M.; Leon, C.A.L.; Tascón, J.M.D. Modification of the surface properties of an activated carbon by oxygen plasma treatment. Fuel 1998, 77, 613–624. [Google Scholar] [CrossRef]
  14. Ciobanu, M.; Lepadatu, A.M.; Asaftei, S. Chemical and electrochemical studies of carbon black surface by treatment with ozone and nitrogen oxide. Mater. Today 2016, 3, 252–257. [Google Scholar] [CrossRef]
  15. Boudou, J.P.; Alonzo, A.M.; Tascon, J.M.D. Introduction of acidic groups at the surface of activated carbon by microwave-induced oxygen plasma at low pressure. Carbon 2000, 38, 1021–1029. [Google Scholar] [CrossRef]
  16. Torre, L.E.C.; Bottani, E.J.; Alonso, A.M.; Cuesta, A.; García, A.B.; Tascón, J.M.D. Effects of oxygen plasma treatment on the surface of graphitized carbon black. Carbon 1998, 36, 277–282. [Google Scholar] [CrossRef]
  17. Yoo, S.; Seok, D.C.; Lee, K.; Jung, Y.H. Enhancement of polymer powder wettability by using surface dielectric barrier discharge. IEEE Trans. Plasma Sci. 2019, 47, 1302–1308. [Google Scholar] [CrossRef]
  18. Sim, K.-B.; Baek, D.; Shin, J.H.; Shim, G.-S.; Jang, S.-W.; Kim, H.-J.; Hwang, J.-W.; Roh, J.U. Enhanced surface properties of carbon fiber reinforced plastic by epoxy modified primer with plasma for automotive applications. Polymers 2020, 12, 556. [Google Scholar] [CrossRef] [Green Version]
  19. Walther, F.; Davydovskaya, P.; Zürcher, S.; Kaiser, M.; Herberg, H.; Gigler, A.M.; Stark, R.W.J. Stability of the hydrophilic behavior of oxygen plasma activated SU-8. Micromech. Microeng. 2007, 17, 524–531. [Google Scholar] [CrossRef] [Green Version]
  20. Seok, D.C.; Jeong, H.Y.; Jung, Y.H.; Lho, T. Optimizing factors on high concentration of ozone production with dielectric barrier discharge. Ozone Sci. Eng. 2015, 37, 1–6. [Google Scholar] [CrossRef]
  21. Reyes, P.G.; Gómez, A.; Vergara, J.; Martínez, H.; Torres, C. Plasma diagnostics of glow discharges in mixtures of CO2 with noble gases. C. Rev. Mex. Fis. 2017, 63, 363–371. [Google Scholar]
  22. Liu, Y.; Rehman, F.; Zimmerman, W.B. Reaction engineering of carbon monoxide generation by treatment with atmospheric pressure, low power CO2 DBD plasma. Fuel 2017, 209, 117–126. [Google Scholar] [CrossRef]
  23. Khan, M.I.; Rehman, N.U.; Khan, S.; Ullah, N.; Masood, A.; Ullah, A. Spectroscopic study of CO2 and CO2-N2 mixture plasma using dielectric barrier discharge. AIP Adv. 2019, 9, 085015. [Google Scholar] [CrossRef] [Green Version]
  24. Oberbossel, G.; Probst, C.; Giampietro, V.R.; Rohr, P.R. Plasma afterglow treatment of polymer powders: Process parameters, wettability improvement, and aging effects. Plasma Process Polym. 2017, 14, 1600144. [Google Scholar] [CrossRef]
  25. Washburn, E.W. The dynamics of capillary flow. Phys. Rev. 1921, 17, 273. [Google Scholar] [CrossRef]
  26. Thakker, M.; Karde, V.; Shah, D.O.; Shukla, P.; Ghoroi, C. Wettability measurement apparatus for porous material using the modified washburn method. Meas. Sci. Technol. 2013, 24, 125902. [Google Scholar] [CrossRef]
  27. Meng, X.; Ning, P.; Xu, G.; Cao, H. Removal of coke powder from coking wastewater by extraction technology. Sep. Purif. Technol. 2017, 175, 506–511. [Google Scholar] [CrossRef]
  28. Liu, L.; Shen, Z.; Zhang, X.; Ma, H. Highly conductive graphene/carbon black screen printing inks for flexible electronics. J. Colloid Interface Sci. 2021, 582, 12–21. [Google Scholar] [CrossRef]
  29. Liao, Y.; Zhang, R.; Wang, H.; Ye, S.; Zhou, Y.; Ma, T.; Zhu, J.; Pfefferle, L.D.; Qian, J. Highly conductive carbon-based aqueous inks toward electroluminescent devices, printed capacitive sensors and flexible wearable electronics. RSC Adv. 2019, 9, 15184. [Google Scholar] [CrossRef] [Green Version]
  30. Liu, H.; Cheng, X.; Chong, Y.; Yuan, H.; Huang, J.-Q.; Zhang, Q. Advanced electrode processing of lithium ion batteries: A review of powder technology in battery fabrication. Particuology 2021, 57, 56–71. [Google Scholar] [CrossRef]
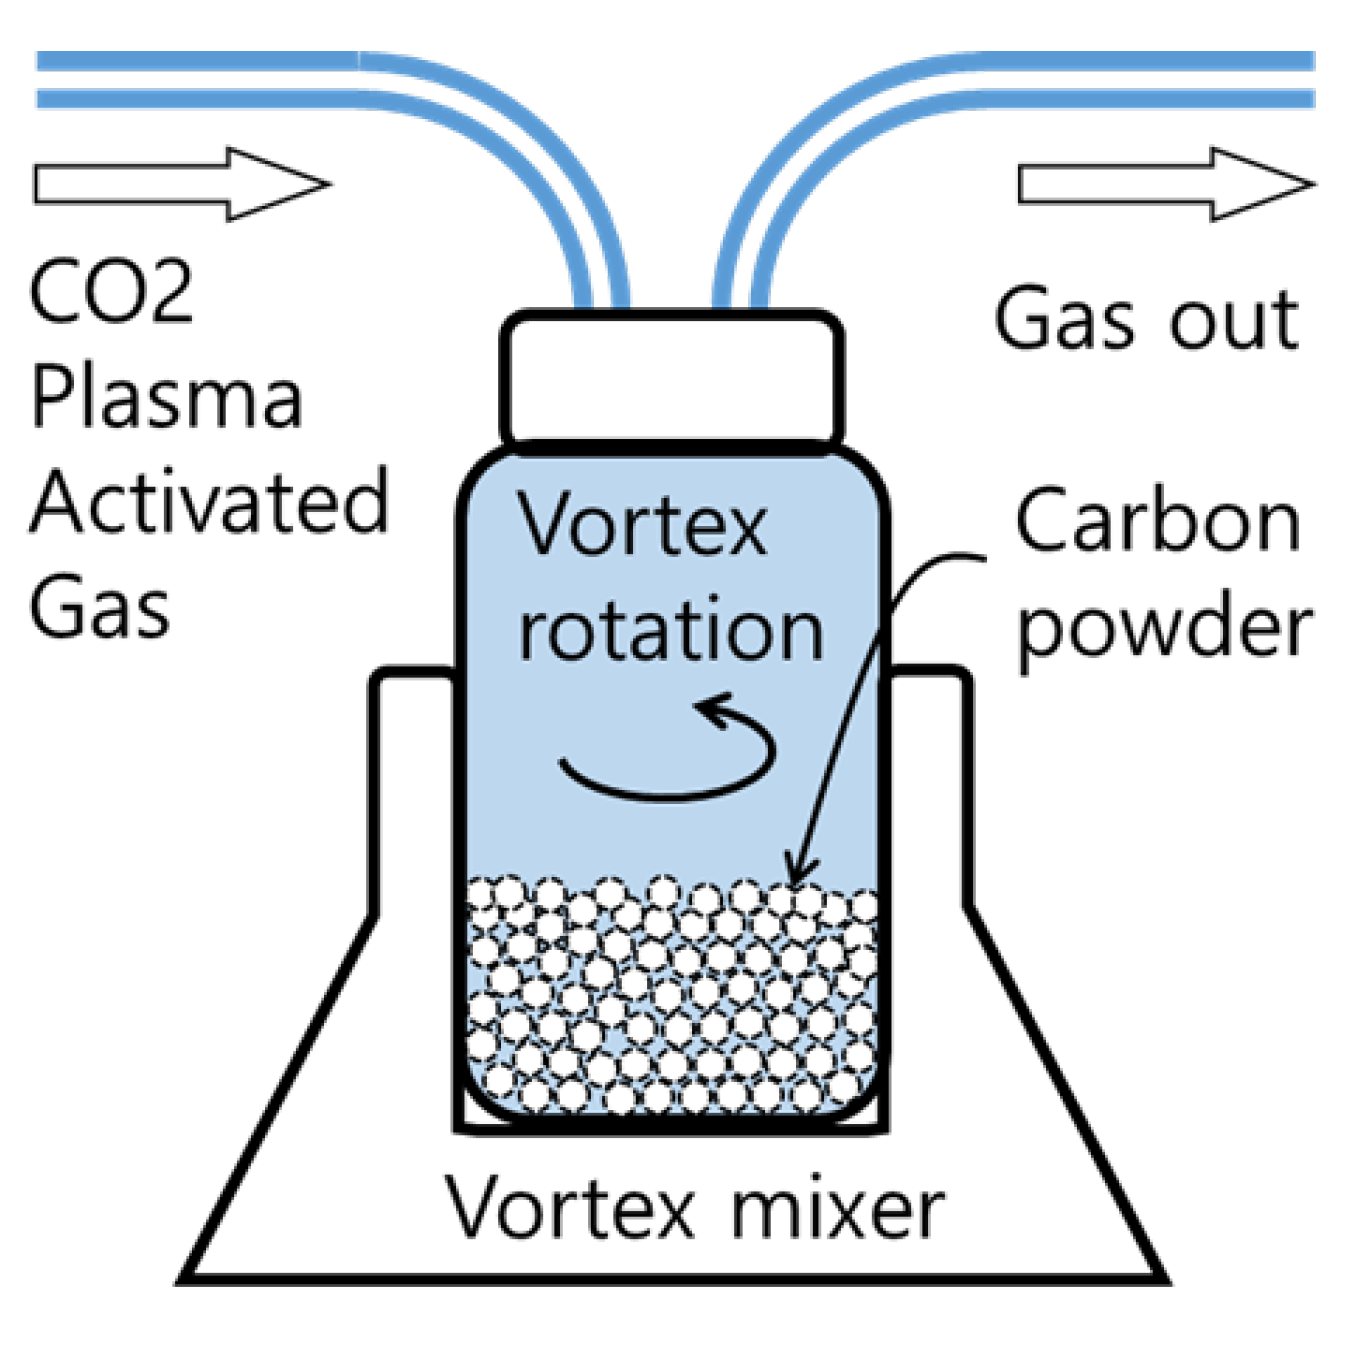
Figure 1. Schematic of a batch-type reactor for the carbon powder treatment with the CO2 plasma-activated gas (PAG).
Coatings 11 00925 g001
Figure 2. CO2 optical emission spectroscopy (OES): (a) Schematic of the electrode for measuring OES, (b) representative measured CO2 optical emission spectrum of the dielectric-barrier discharge (DBD) electrode at 11.5 kV peak to peak.
Coatings 11 00925 g002
Figure 3. Online monitoring data of CO2 PAG byproducts using QMS.
Coatings 11 00925 g003
Figure 4. Images of the water dispersion test at different experimental settings. Water is added immediately (a) after the PAG treatment, (b) after a minute of stirring and left alone for 30 min, and (c) when samples from (b) are left alone for 24 h.
Coatings 11 00925 g004
Figure 5. Quantitative evaluation of the dispersion by measuring transmittance light intensity. (a) Experimental setup for light intensity measurement, and (b) comparison of light intensity measurement at several PAG treatment times of 10, 30, and 60 min.
Coatings 11 00925 g005
Figure 6. Field emission scanning electron microscopes (FE-SEM) images and energy-dispersive X-ray spectroscopy (EDX) elemental analysis were taken for (a) untreated carbon powder, and (b) carbon powder treated for 60 min with PAG.
Coatings 11 00925 g006
Figure 7. Results of X-ray Photoelectron Spectroscopy (XPS) spectra analysis: (a) Full survey spectrum, (b) O/C ratio, and (c) high-resolution element carbon (C 1s) spectrum on the PAG-treated 60 min sample.
Coatings 11 00925 g007
Figure 8. Measurement of the powder contact angle using the Washburn method. (a) Schematic of the measuring device, (b) water contact angle results of plasma-treated carbon powder on water.
Coatings 11 00925 g008
Publisher’s Note: MDPI stays neutral with regard to jurisdictional claims in published maps and institutional affiliations.