1. Introduction
The riveted lap joint is an effective and important connection mode to permanently fasten aircraft structures. There are approximately 1,500,000–2,000,000 rivets and bolts in a modern large aircraft [
1]. A representative connection mode in pressurized aircraft fuselage is the three-row riveted lap joint [
2].
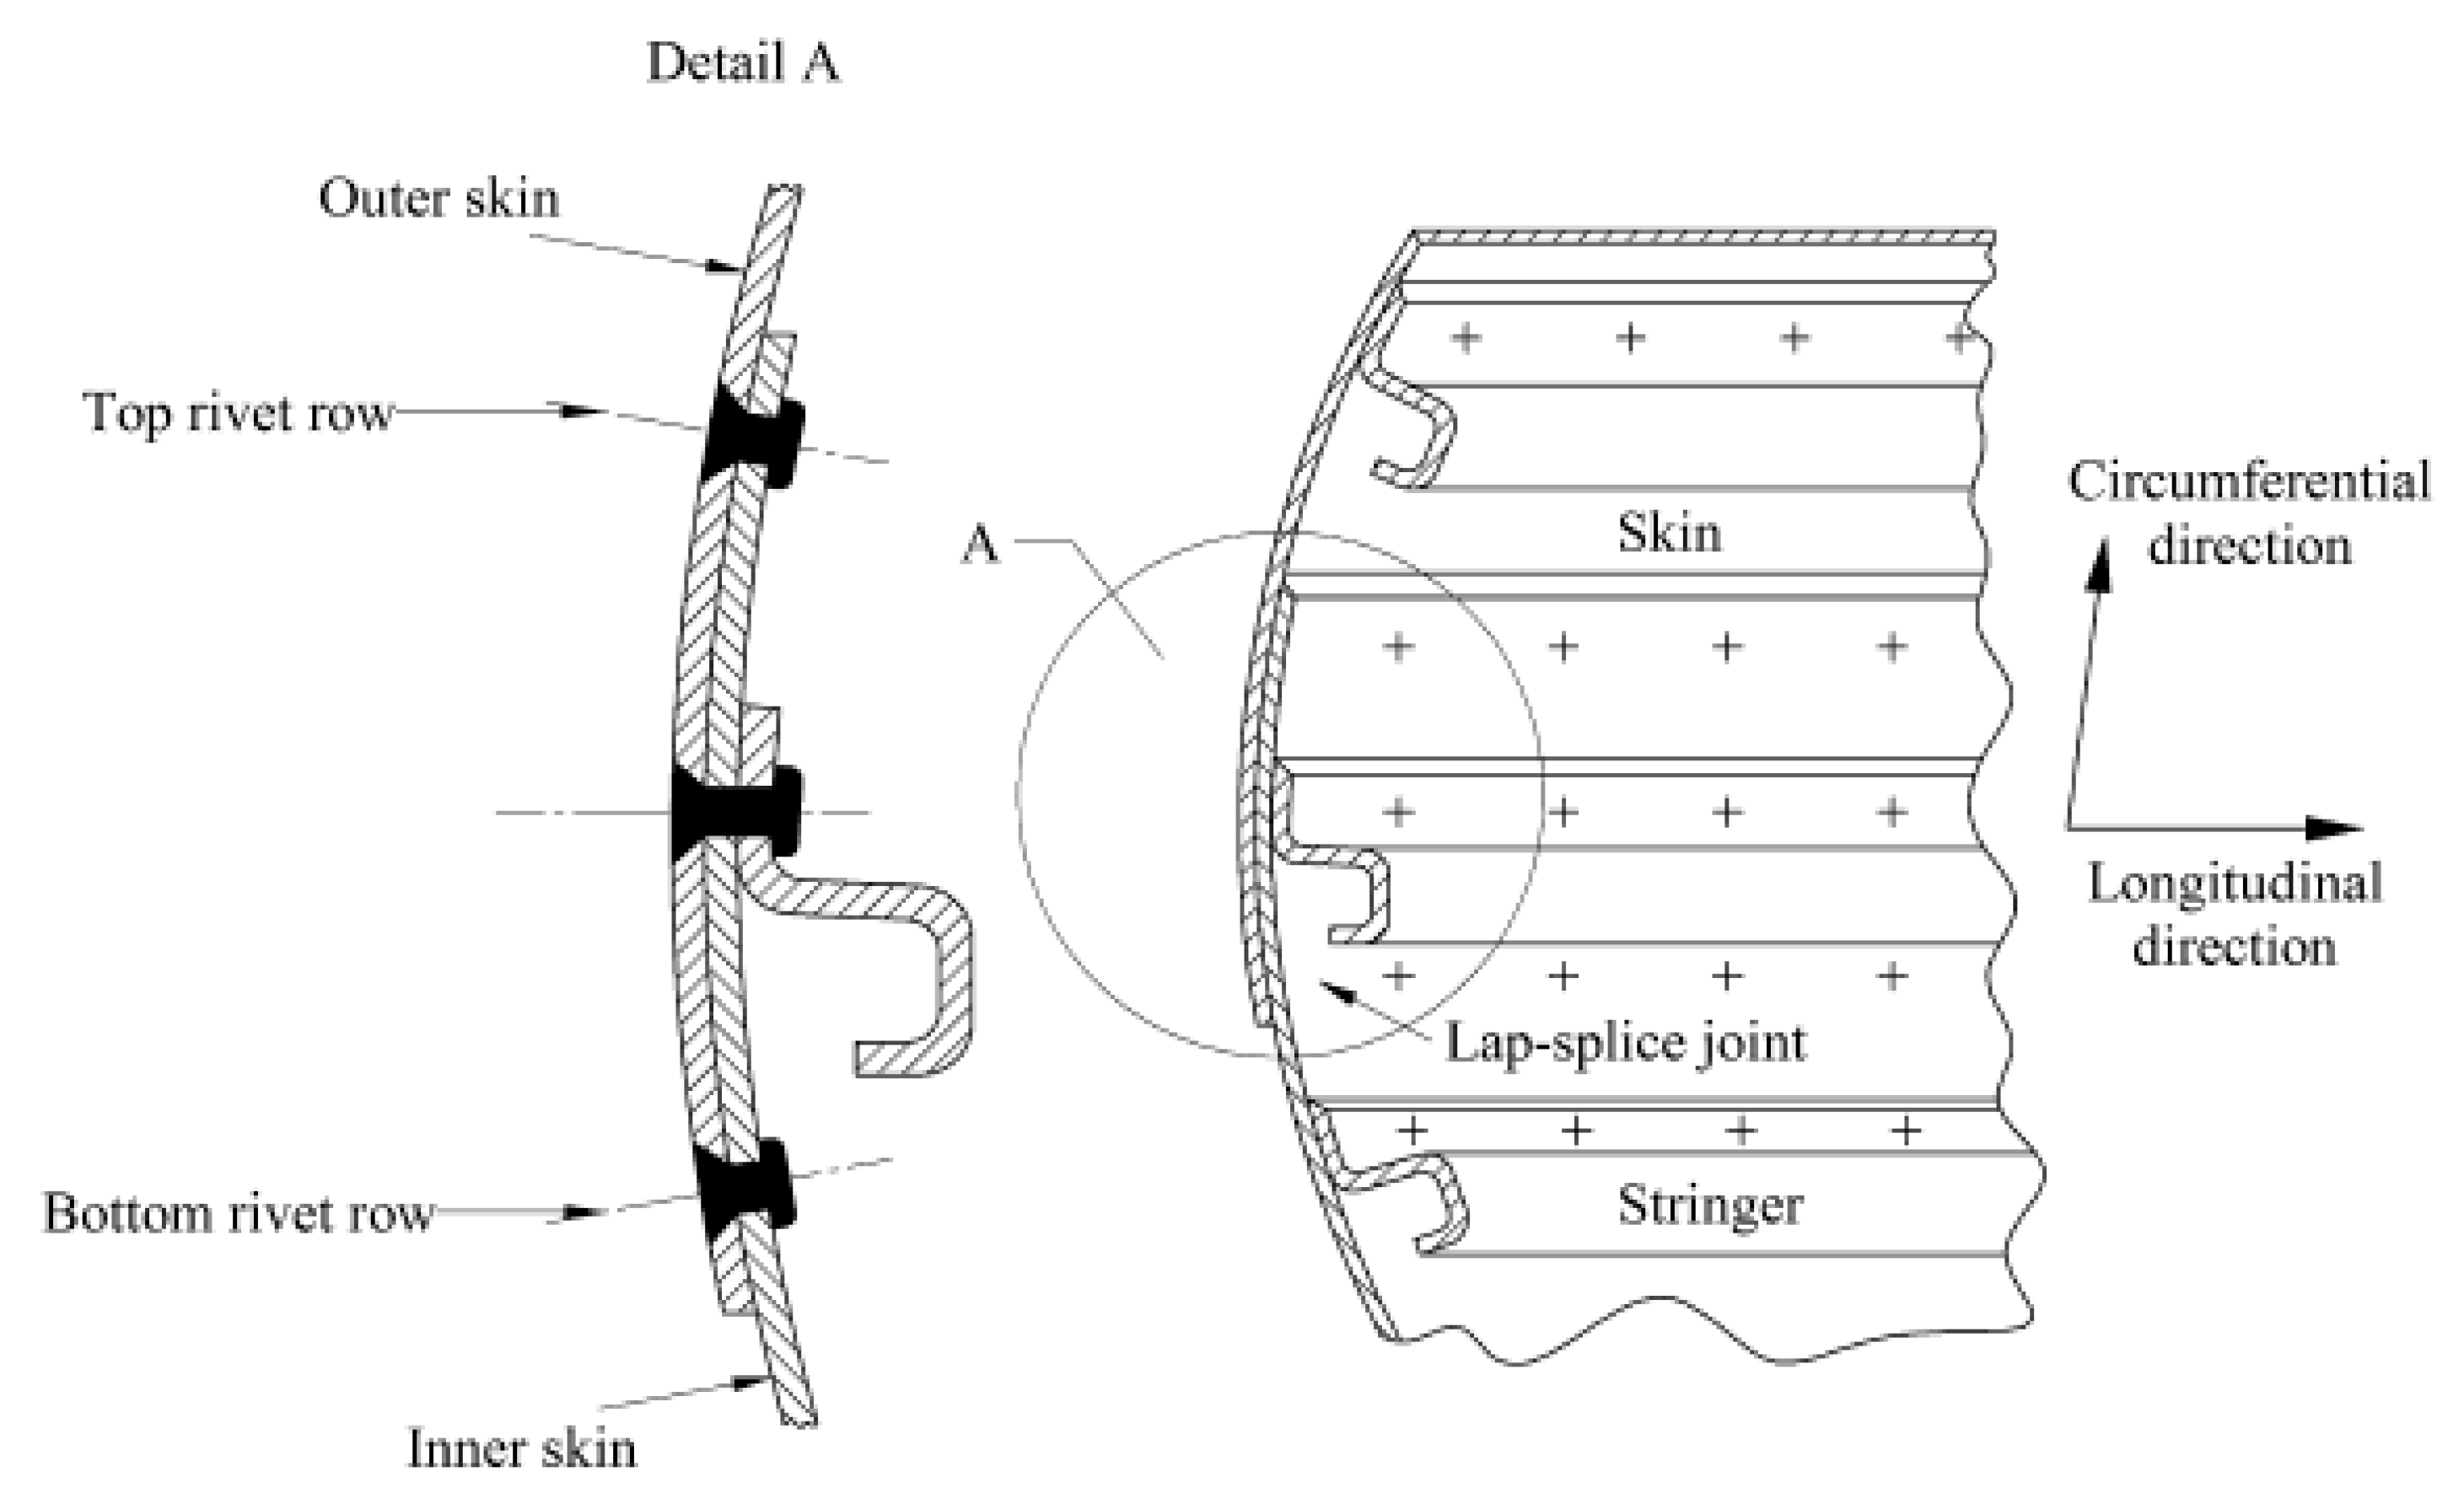
Figure 1 illustrates a typical fuselage longitudinal riveted lap joint. The rivets are not only used as fasteners, but also act as an indispensable medium for load transmission between different parts.
The Aloha Airlines accident in 1988 has warned aircraft manufacturers and researchers of the continuing need to improve the performance of a riveted lap joint. Many scholars have carried out detailed work to investigate the riveting parameters of a single-row rivet connection. Previous research has summarized the main structure parameters and procedure parameters of a single-row riveted lap joint [
3]. However, compared with single-row riveted lap joints, fewer studies focus on multi-row riveted lap joints.
A riveted lap joint mainly bears tensile load when in flight. The tensile load is almost transmitted by rivets. Generally, the tensile load distribution among rivet rows is not homogeneous, especially when a riveted lap joint has more than two rows. The outer rows usually transfer a larger part of the tensile load than the inner rows. Inhomogeneous tensile load transmission would make the outer rows more susceptible to fatigue damage [
4,
5]. Residual stress distribution after the tensile stage will be influenced as well [
6]. More stress concentration regions may appear. Moreover, the high stresses around the fastener holes will affect the performance of a multi-row riveted lap joint [
7,
8].
Aman [
9] attempted to find out the effects of some controllable process parameters on the quality of a riveted lap joint. Park [
10] investigated the influence of various parameters on the fatigue behavior of riveted lap joints. The relation between load transmission and the cracking behavior at countersunk fastener holes has been described. Atre and Johnson [
11] established a global three-rivet model of a fuselage lap joint. The residual stresses during rivet installation and the fuselage pressurization process had been taken into account. The results showed that the effects of underdriven rivets were critical to the stress state of a fuselage splice. Jiang [
12] analytically calculated the tensile load carried by each rivet based on a multi-rivet connection. Liu [
13] analyzed the effect of sheet bending on load distribution among different rivets.
Structural deformation happens during riveting and the tensile process. The sheet expands in the longitudinal and transverse directions. Abdelal [
14] found methods to control the dimensional growth through a series of numerical simulations and probabilistic analysis. Longitudinal and transverse deformation had significant effects on the performance of a riveted panel. Moreover, Yuan [
15] conducted fastener load-transferred experiments and fatigue tests based on scarfed lap joints with different lap angles. Both the test results and predicted data showed that the fatigue life of scarfed lap riveted lap joints was remarkably increased after introducing the lap angle into the faying surface.
Among studies, little attention has been paid to analyzing the influence of different squeezing displacement combinations on tensile load transmission of a multi-row riveted lap joint.
Squeezing displacement is one of the most important riveting parameters. On the one hand, squeezing displacement can reflect the magnitude of driven head dimension after riveting. Additionally, the driven head dimension is considered as an indication of the fatigue performance of a riveted lap joint [
16,
17]. A larger squeezing displacement can introduce a greater residual stress around a rivet. On the other hand, compared with other process parameters, squeezing displacement is a simple and easily controllable parameter. It can be applied in aircraft manufacturing without any additional equipment.
Hence, this paper proposes the development of a deep understanding of the internal relationship between different squeezing displacement combinations, tensile load distributions and the corresponding structural deformation. The aim is to find out the appropriate squeezing displacement combination to achieve a more homogeneous tensile load distribution. The other purpose is to improve the structural deformation of a riveted lap joint simultaneously. The research in this paper is helpful in effectively improving the performance of three-row riveted lap joints.
2. Load Transmission and Structural Deformation
Secondary bending and longitudinal deformation appear when a riveted lap joint sustains a tensile load.
Figure 2 illustrates the regional structure deformation of a riveted lap joint. The riveted lap joint can be considered as a symmetrical structure. The dimension and rivet hole layout of the outer sheet keep the same as the inner sheet.
In the tensile stage, the tension load is mainly transmitted by rivets 1#, 2# and 3#. The rest of the tensile load is delivered by the friction between the mating surfaces. Four parts can be divided for a three-row riveted lap joint: Part I, Part II, Part III and Part IV. For the inner sheet, the tensile load P is transferred from the outer side to Part III, and finally, to Part I. The average strains of parts I, II and III in the inner sheet are assumed to be , , and . For the outer sheet, the tensile load travel path is from the outer side to Part IV, Part I and Part II. The average strains of parts I, II and IV in the outer sheet are assumed to be , , and .
All rows take part in the load delivering from one sheet to the other sheet. The parts of tensile load
transmitted by the three rivets are assumed to be
,
, and
. Because of the symmetry,
, thus:
Obviously, and are the total strain caused by tensile load . and are the strain caused by . and are the strain caused by .
The deformation degree of the inner sheet is:
Similarly, the deformation degree of the inner sheet is:
Meanwhile, in Part I, ; in Part II, .
Structural deformation is a gradual process. In the outer sheet, the maximum deformation occurs in the vicinity of Rivet 1#. The minimum deformation appears at Rivet 3#. Conversely, in the inner sheet, the maximum deformation occurs in the vicinity of Rivet 3#. The minimum deformation appears at Rivet 1#. Therefore, the interface of Part IV and Part I in the outer sheet as well as the interface of Part II and Part III in the inner sheet are the most dangerous areas of a three-row riveted lap joint. Since the interfaces have the minimum section surface area, the interfaces suffer to the total tensile load P.
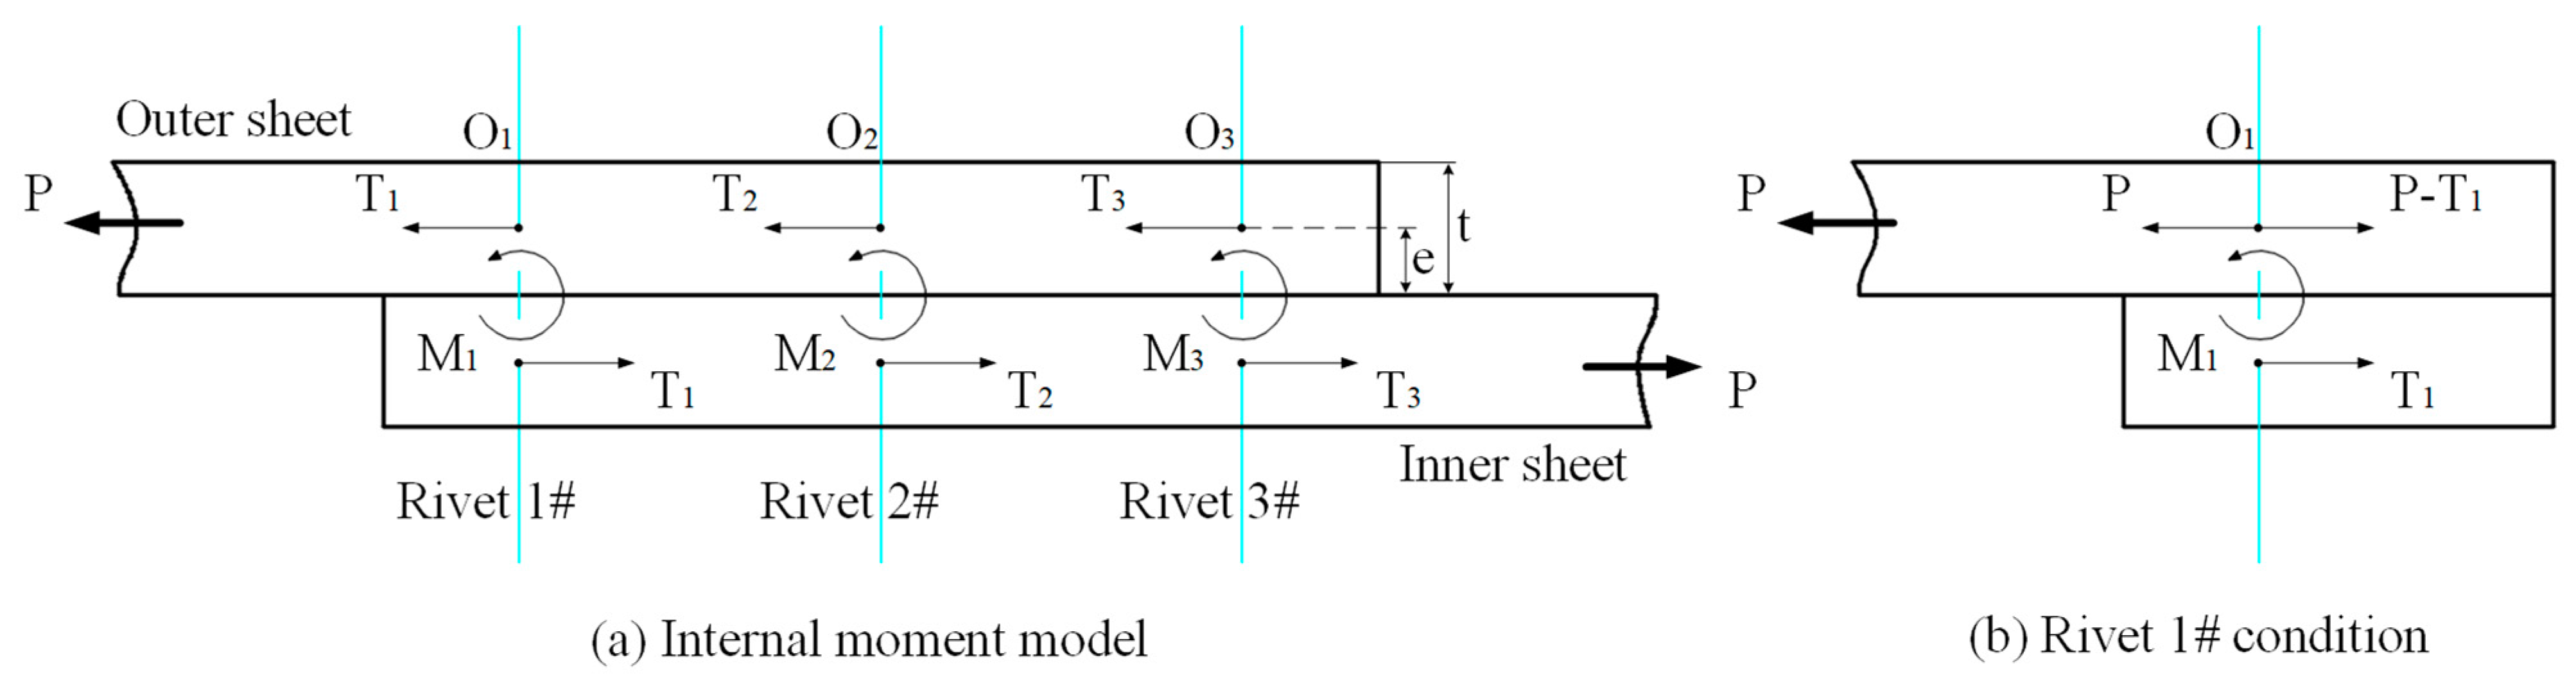
Different strain level can result in different elongations of each part, whether in the outer sheet or inner sheet. As a consequence, an internal moment will be introduced at the three fastener rows,
,
, and
, separately. The “internal moment model” can effectively explain the relationship between tensile load distribution and structural deformation [
8].
Figure 3 illustrates the internal moment model based on the three-row riveted lap joint.
In the model, the outer and inner sheets are subjected to secondary bending and longitudinal deformation because of the different elongations. For Rivet 1#, on the one hand,
and
are no longer equal according to Equation (1). On the other hand, the resultant force of tensile load transfer does not act at the neutral line of the overlap region, as shown in
Figure 3b. The internal moment
is introduced to account for this effect. The internal moment
is closely related to the tensile load distribution and geometric dimension of the joint. For a monolithic joint, the neutral line is located at the center of the joint.
is a constant. Thus, the internal moment mainly relies on tensile load distribution. The internal moment
, which acts on the point
of Rivet 1# in the clockwise direction, can be calculated as follows:
Likewise, the internal moments in the second and third rivet rows can be represented by Equations (7) and (8).
Obviously, tensile load distribution has a significant influence on structural deformation. Improving the distribution uniformity of the tensile load can significantly reduce the internal moment acting around Rivet 1# and Rivet 3#. The internal moments between the three rivets will become more homogenous. The gap of different elongations for each part will become smaller. The magnitude of structural deformation can be improved, especially at the outer rows. The assembly quality and fatigue performance of a three-row riveted lap joint can be greatly enhanced.
4. Results and Discussion
The driven head dimension is usually considered as an indicator of riveting quality. According to the riveting criterion [
17], the preferred height of a driven head is within 0.5–0.6 times of the original rivet diameter. Different squeezing displacements will produce different driven head dimensions. The relationship between squeezing displacement, tensile load transmission as well as structural deformation is the main point in numerical simulations.
Table 2 lists different squeezing displacement combinations.
4.1. Numerical Simulation
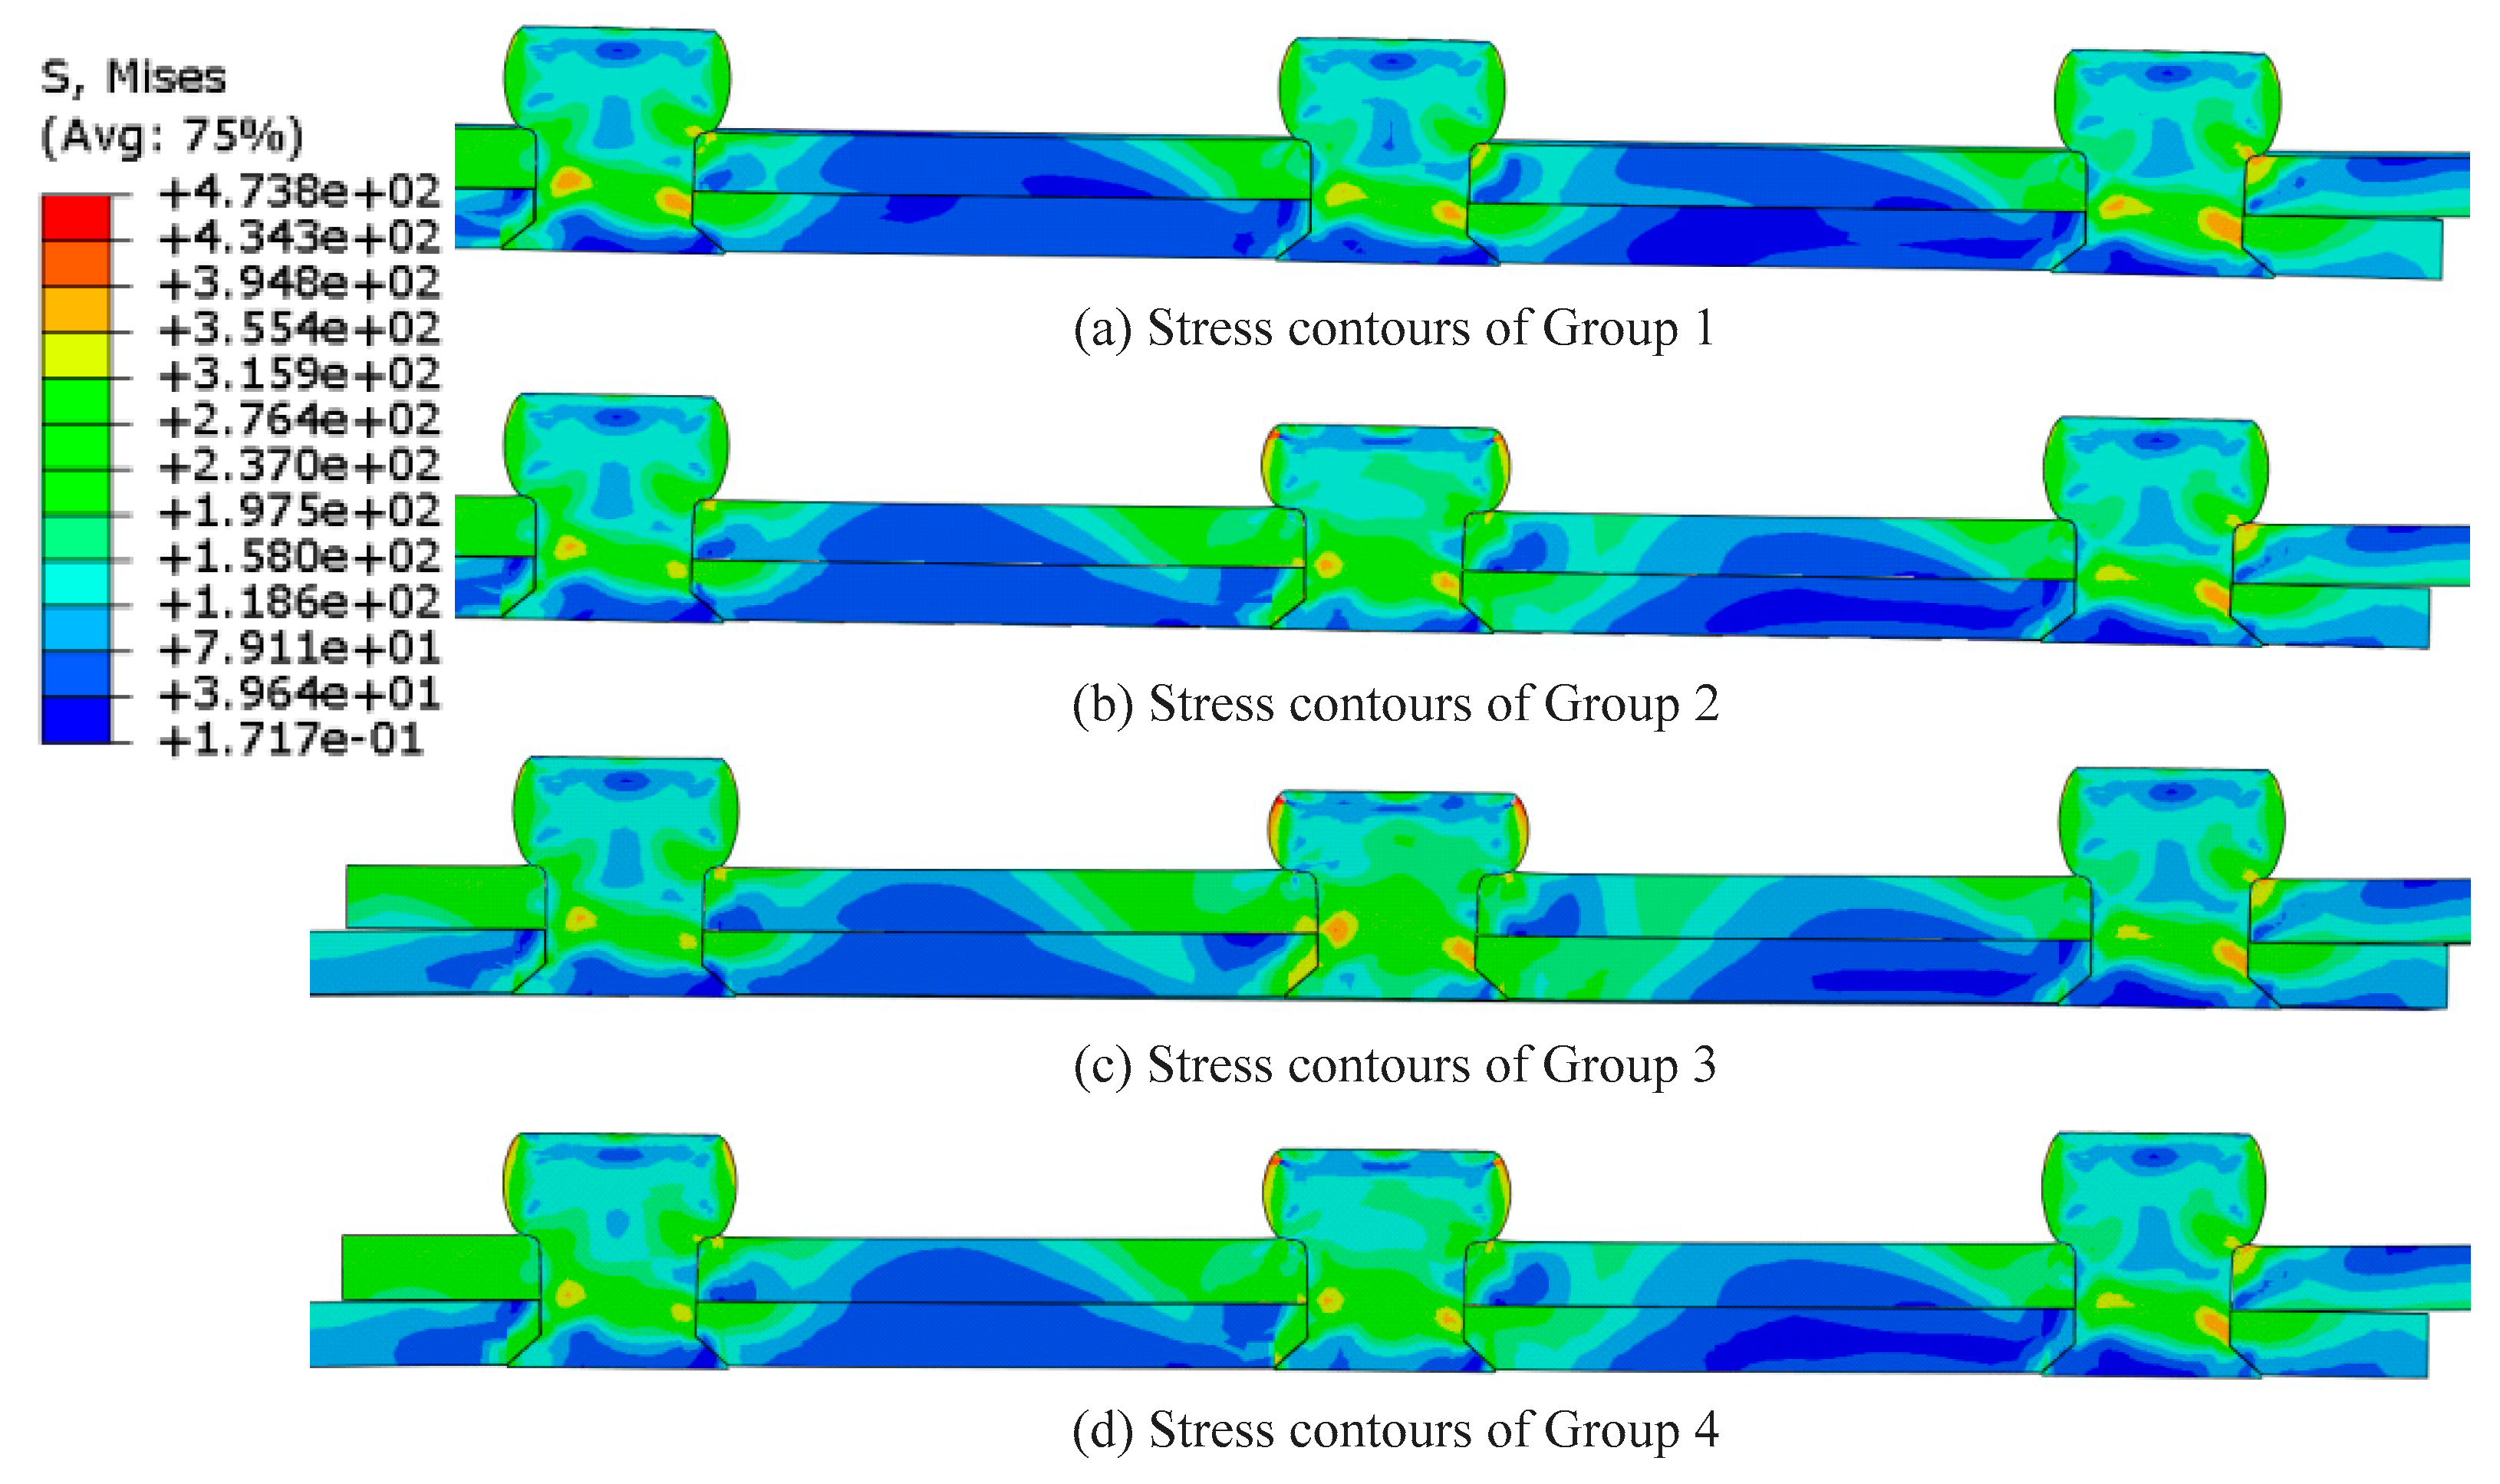
The Von Mises stress is usually used to analyze the stress status [
11].
Figure 8 illustrates the stress contours of the riveted lap joints after riveting and tension processes. As can be seen, the max stress of Rivet 2# is smaller than that of Rivets 1# and 3#. Additionally, at the same time, Rivet 2# in Group 1 carries minimum load compared with Rivet 2# in other groups. The stress concentration region of the outer rivets is highlighted in Group 1. The stresses of Rivet 2# in Group 2 and Group 4 become larger. Meanwhile, the stresses of Rivets 1# and 3# in Group 2 and Group 4 become smaller. The tension load distribution, in these cases, would tend to be more homogeneous. The stress of Rivet 2# in Group 3 is too big since the squeezing displacement of Rivet 2# is larger than any others. A new stress concentration region appears in Group 3.
The purpose of this paper is to make tensile load distribution more homogeneous. As a result, the region of stress concentration is reduced correspondingly. The stress value will become smaller as well. Hence, according to analysis of stress contours, the squeezing displacements of Group 2 and Group 4 are relatively better.
Earlier studies indicated that the tensile load transmission is unequal for a normal multi-row riveted lap joint. Moreover, when the squeezing displacement becomes smaller, the distribution situation becomes worse.
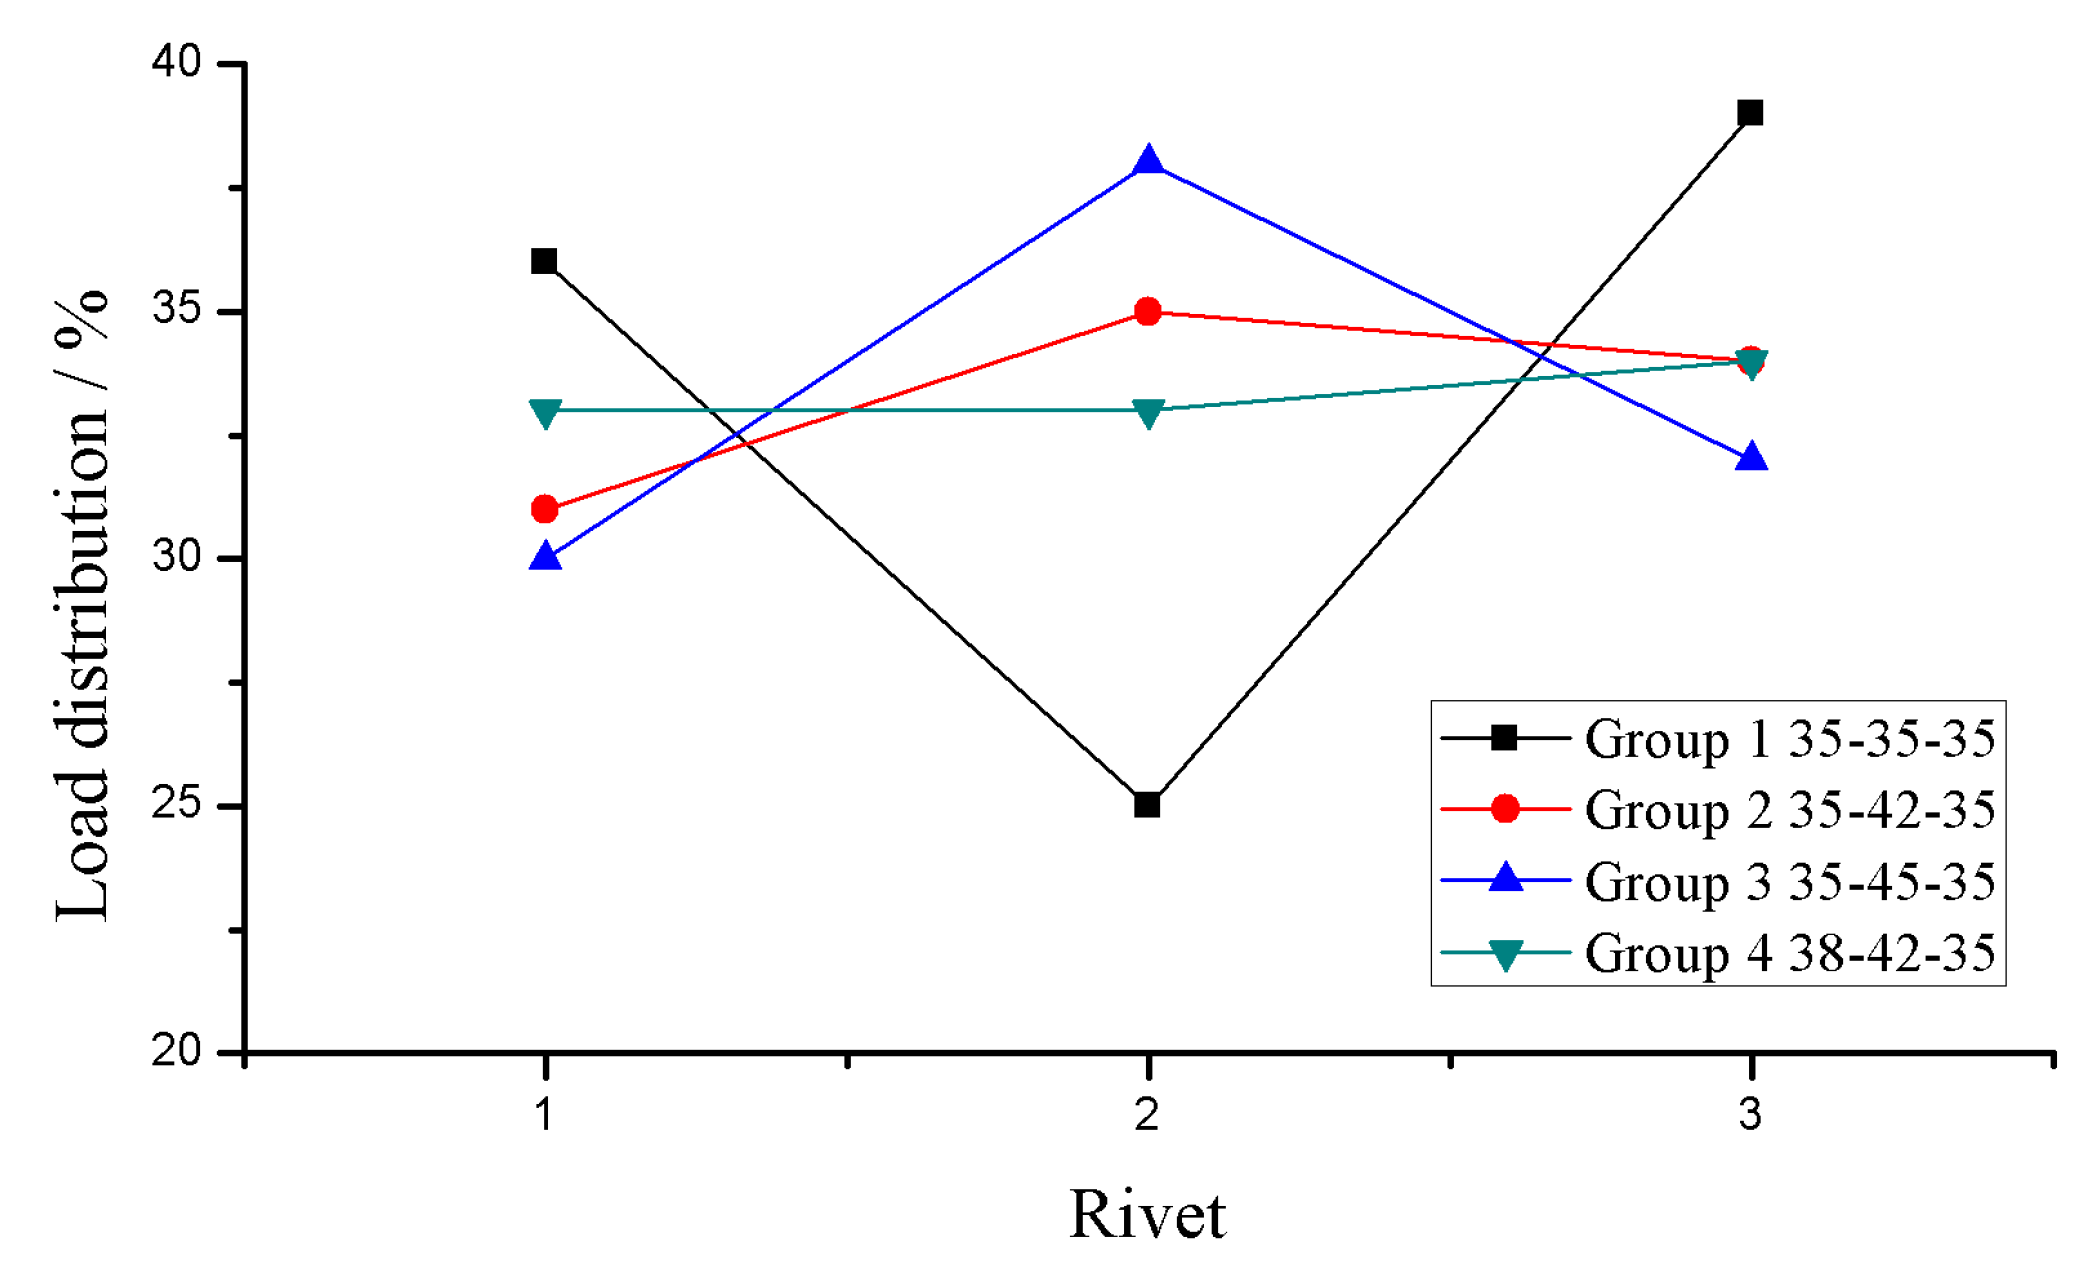
Figure 9 illustrates the tensile load distribution between three-row riveted lap joint.
The situation of tensile load transmission varies with different squeezing displacement combinations. When the squeezing displacement of these three rivets is kept the same and remains smaller (Group 1), the tensile load distribution is quite inhomogeneous. The outer sides take a larger part of tensile load than the middle. When the squeezing displacement of Rivet 2# become larger, Rivet 2# will gradually transfer a larger part of tensile load. The results of Group 2 and Group 4 achieve a relatively more homogeneous tensile load distribution. In Group 4 especially, each rivet takes approximately one-third of the tensile load. However, Rivet 2# in Group 3 takes a great part of tensile load, since the squeezing displacement exceeds the normal value.
As analyzed before, for the inner sheet, the region most sensitive to tensile load is the interface of Part II and Part III around Rivet 3#. Since the interface has the minimum cross-sectional area with the largest tensile load, the interface becomes the most critical part of a riveted lap joint during the tensile stage. The deformation condition may be the worst.
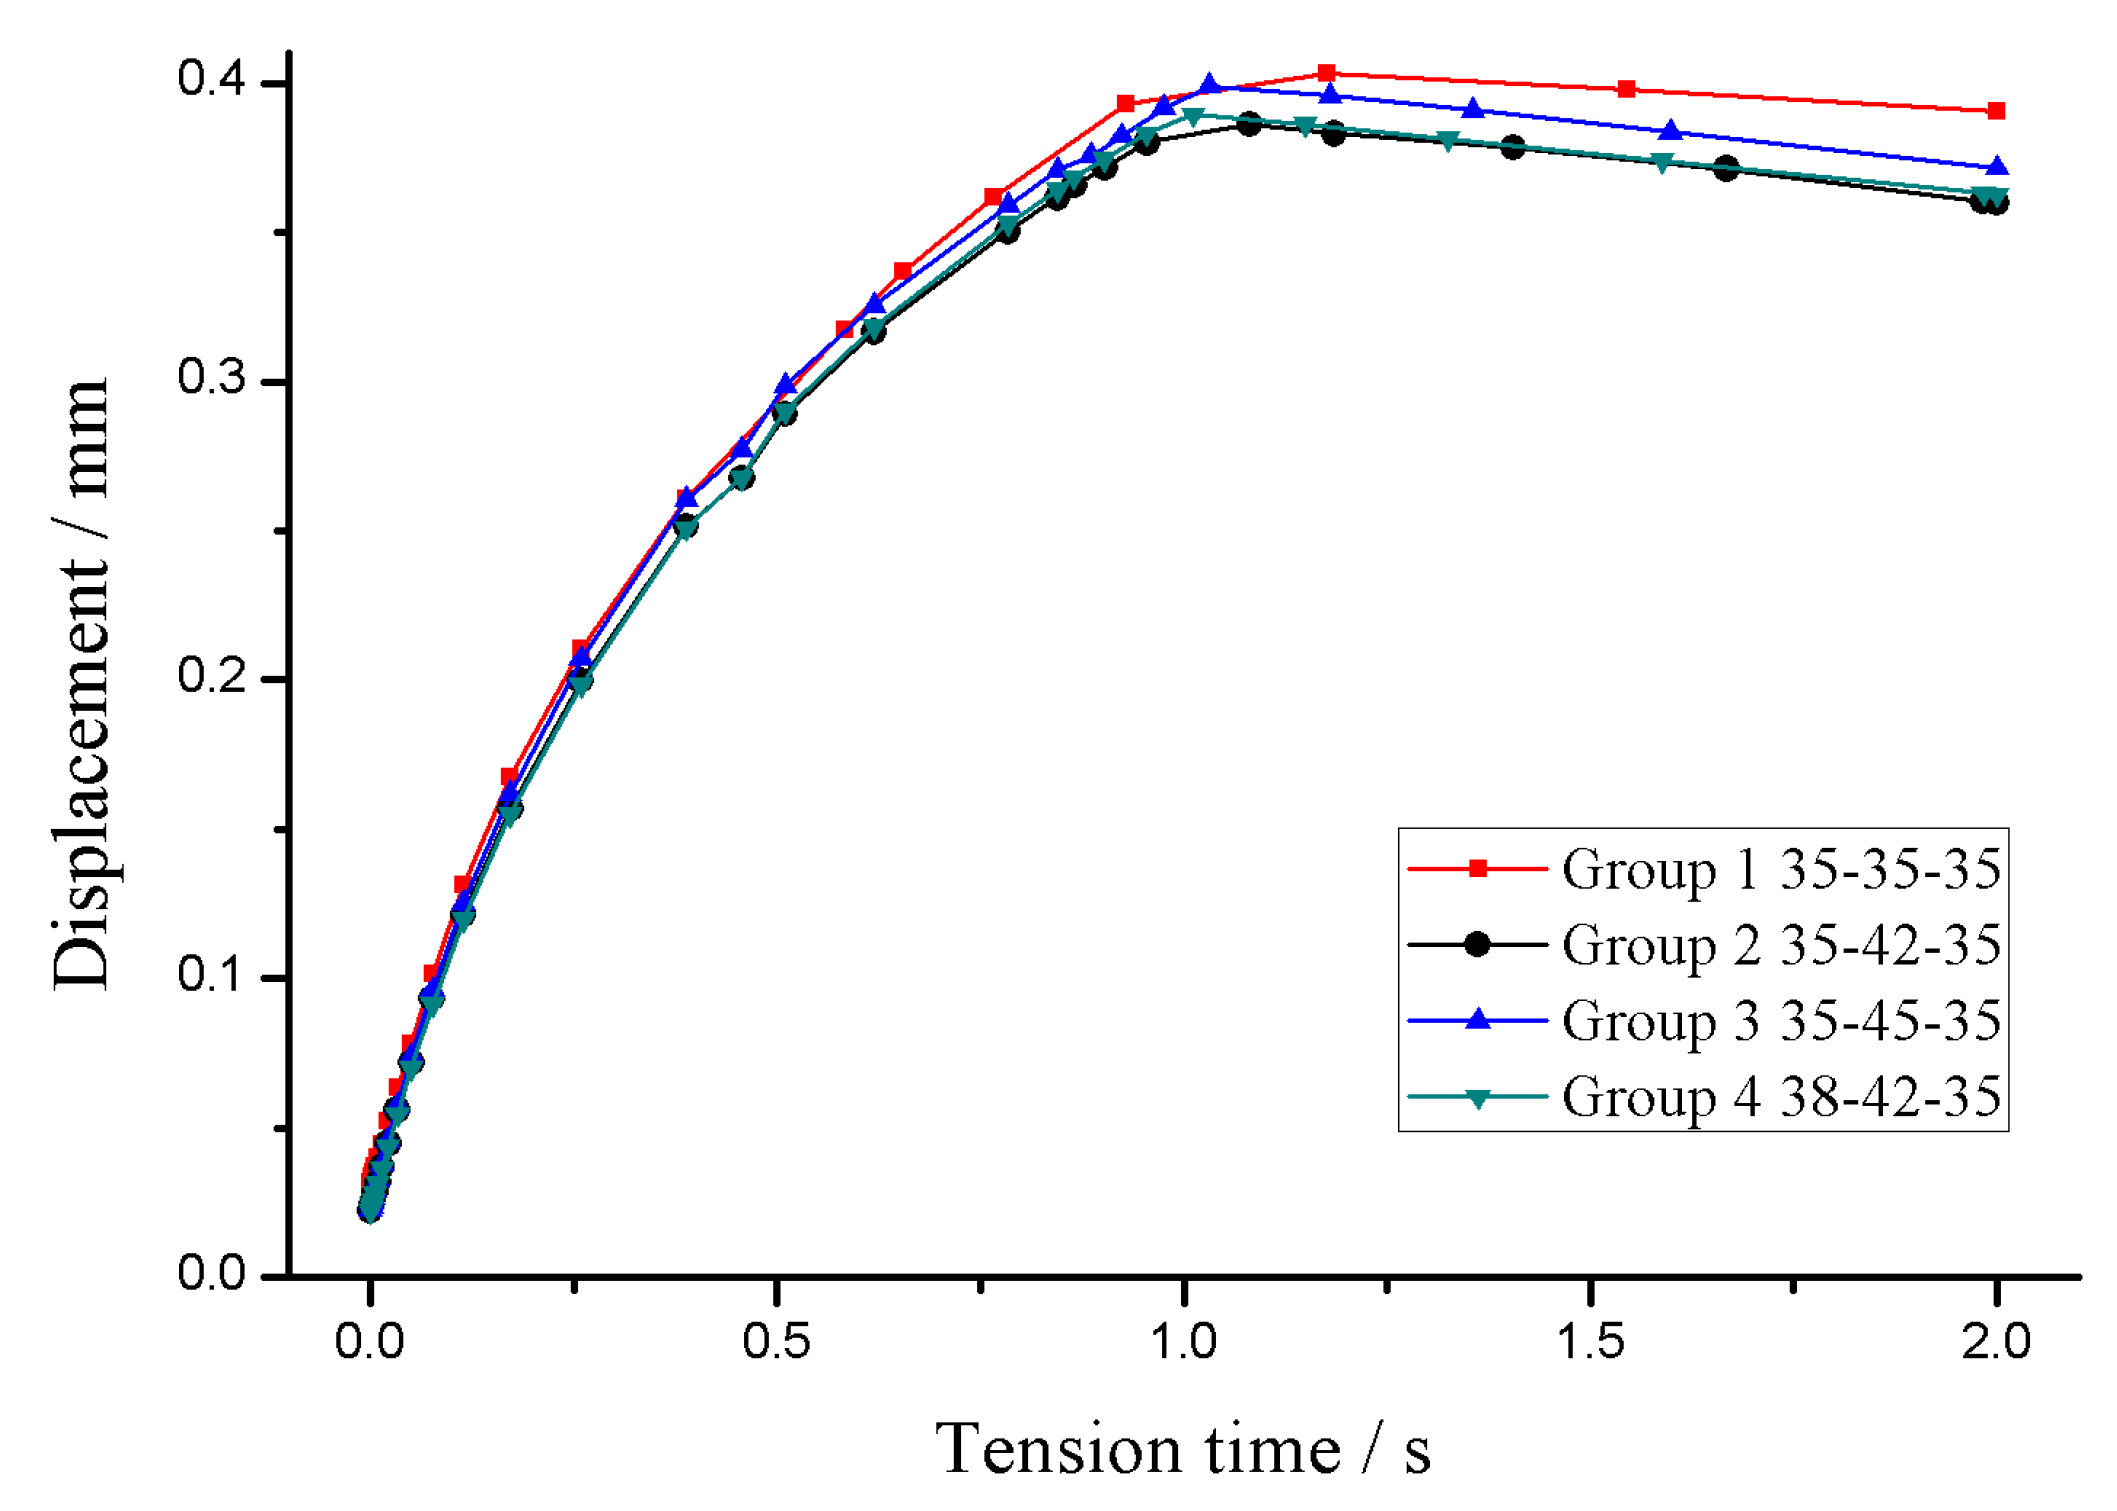
Figure 10 illustrates the structural deformation magnitude of the interface of Part II and Part III (G10 in
Figure 5). The X axis is the loading period of the tensile load. The Y axis is the deformation magnitude.
The magnitude is displayed in the form of measuring point displacement. The deformation of Group 1 is the worst due to its relatively small and equal squeezing displacement of the three rivets. The deformation of Group 2 and Group 4 achieves a better condition. Rivet 2# in Group 2 and Group 4 is installed with a larger squeezing displacement. The improvement of Group 3 is a little limited, since Rivet 2# in Group 3 is installed with the largest squeezing displacement. Clearly, the squeezing displacement combination has a remarkable effect on the structural deformation of a riveted lap joint. Compared with
Figure 9, when Rivet 2# takes a larger part of the tensile load, the structural deformation magnitude will be reduced as well.
4.2. Experimental Test and Discussion
The data of tensile load transmission as well as structural deformation can be easily and directly obtained with numerical simulation. However, the rivet and rivet hole would undergo a larger-scale plastic deformation during the riveting process. The outer and inner sheets form a tight junction with rivets. It is difficult to directly measure the data of tensile load transmission by experiments.
Therefore, except the driven head dimension, the tensile load distribution and structural deformation are measured by strain value, indirectly.
4.2.1. Comparison of Rivet Deformation
The comparison of driven head dimension gained from the numerical and experimental results is one of the useful methods to verify the validity of the FE model [
11].
Table 3 summarizes the comparison results. Different squeezing displacement results in different driven head diameter. The relative difference of D/d is controlled within 5%. A good agreement is obtained. The numerical model has the ability to simulate the riveting process well.
4.2.2. Analysis of Tensile Load Distribution
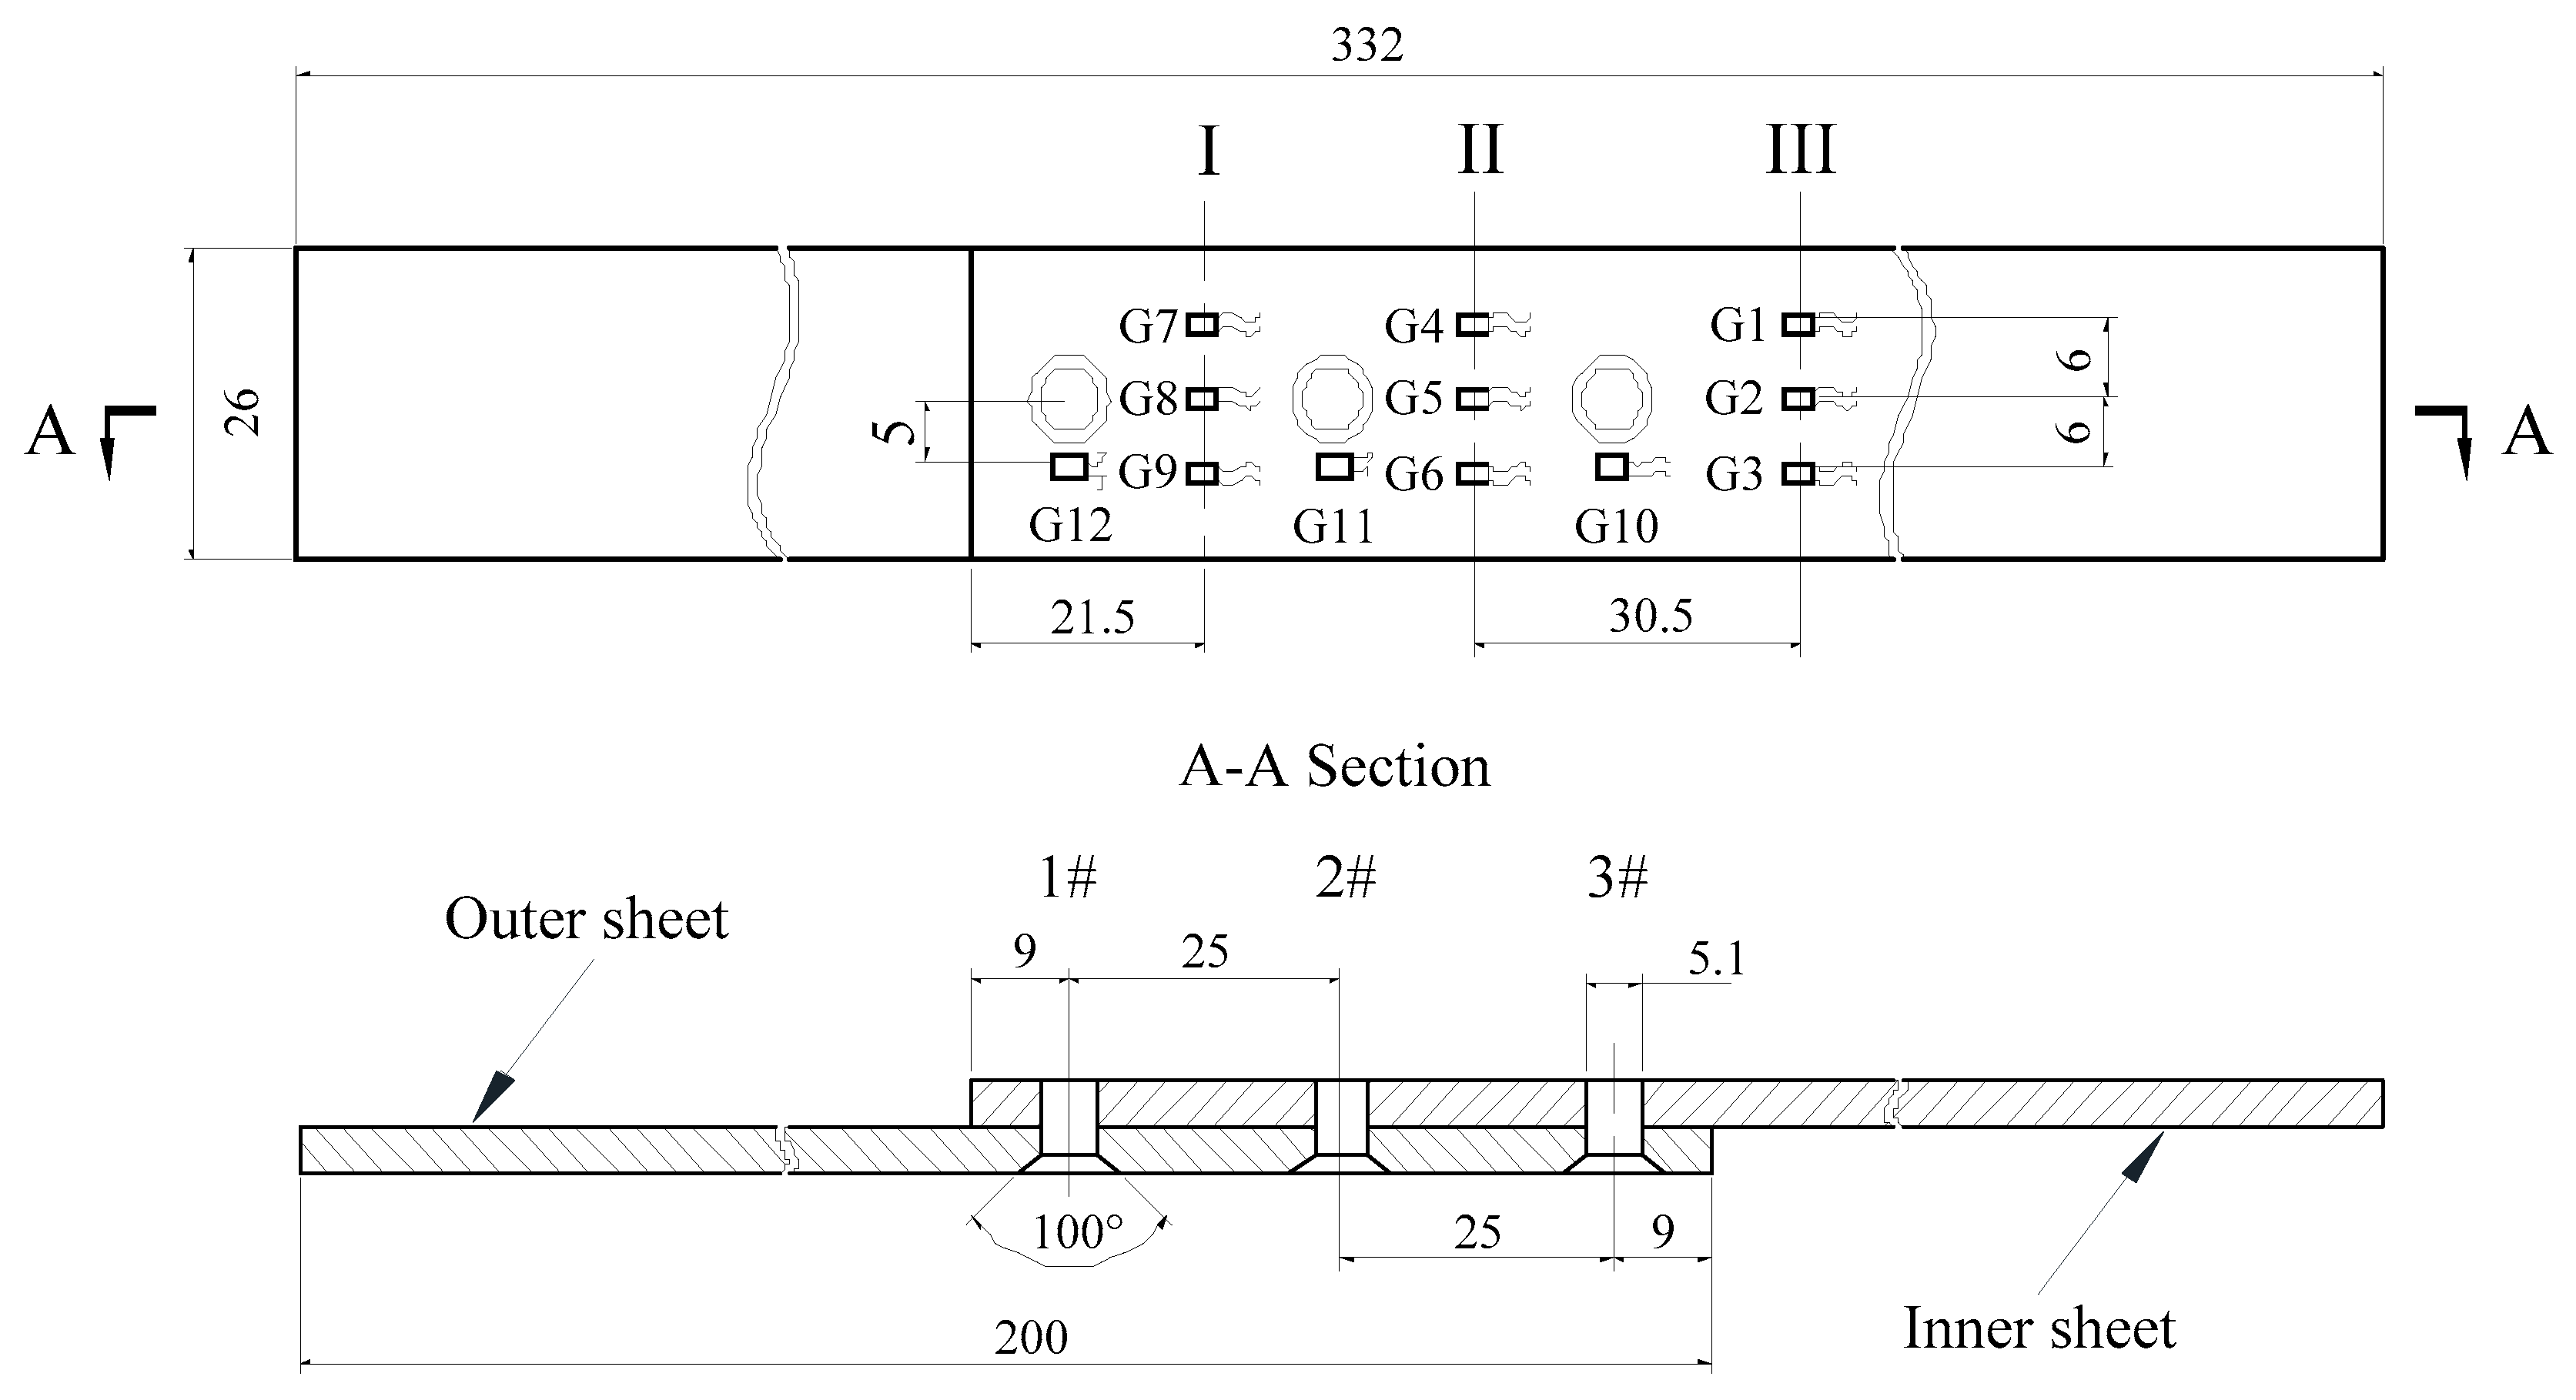
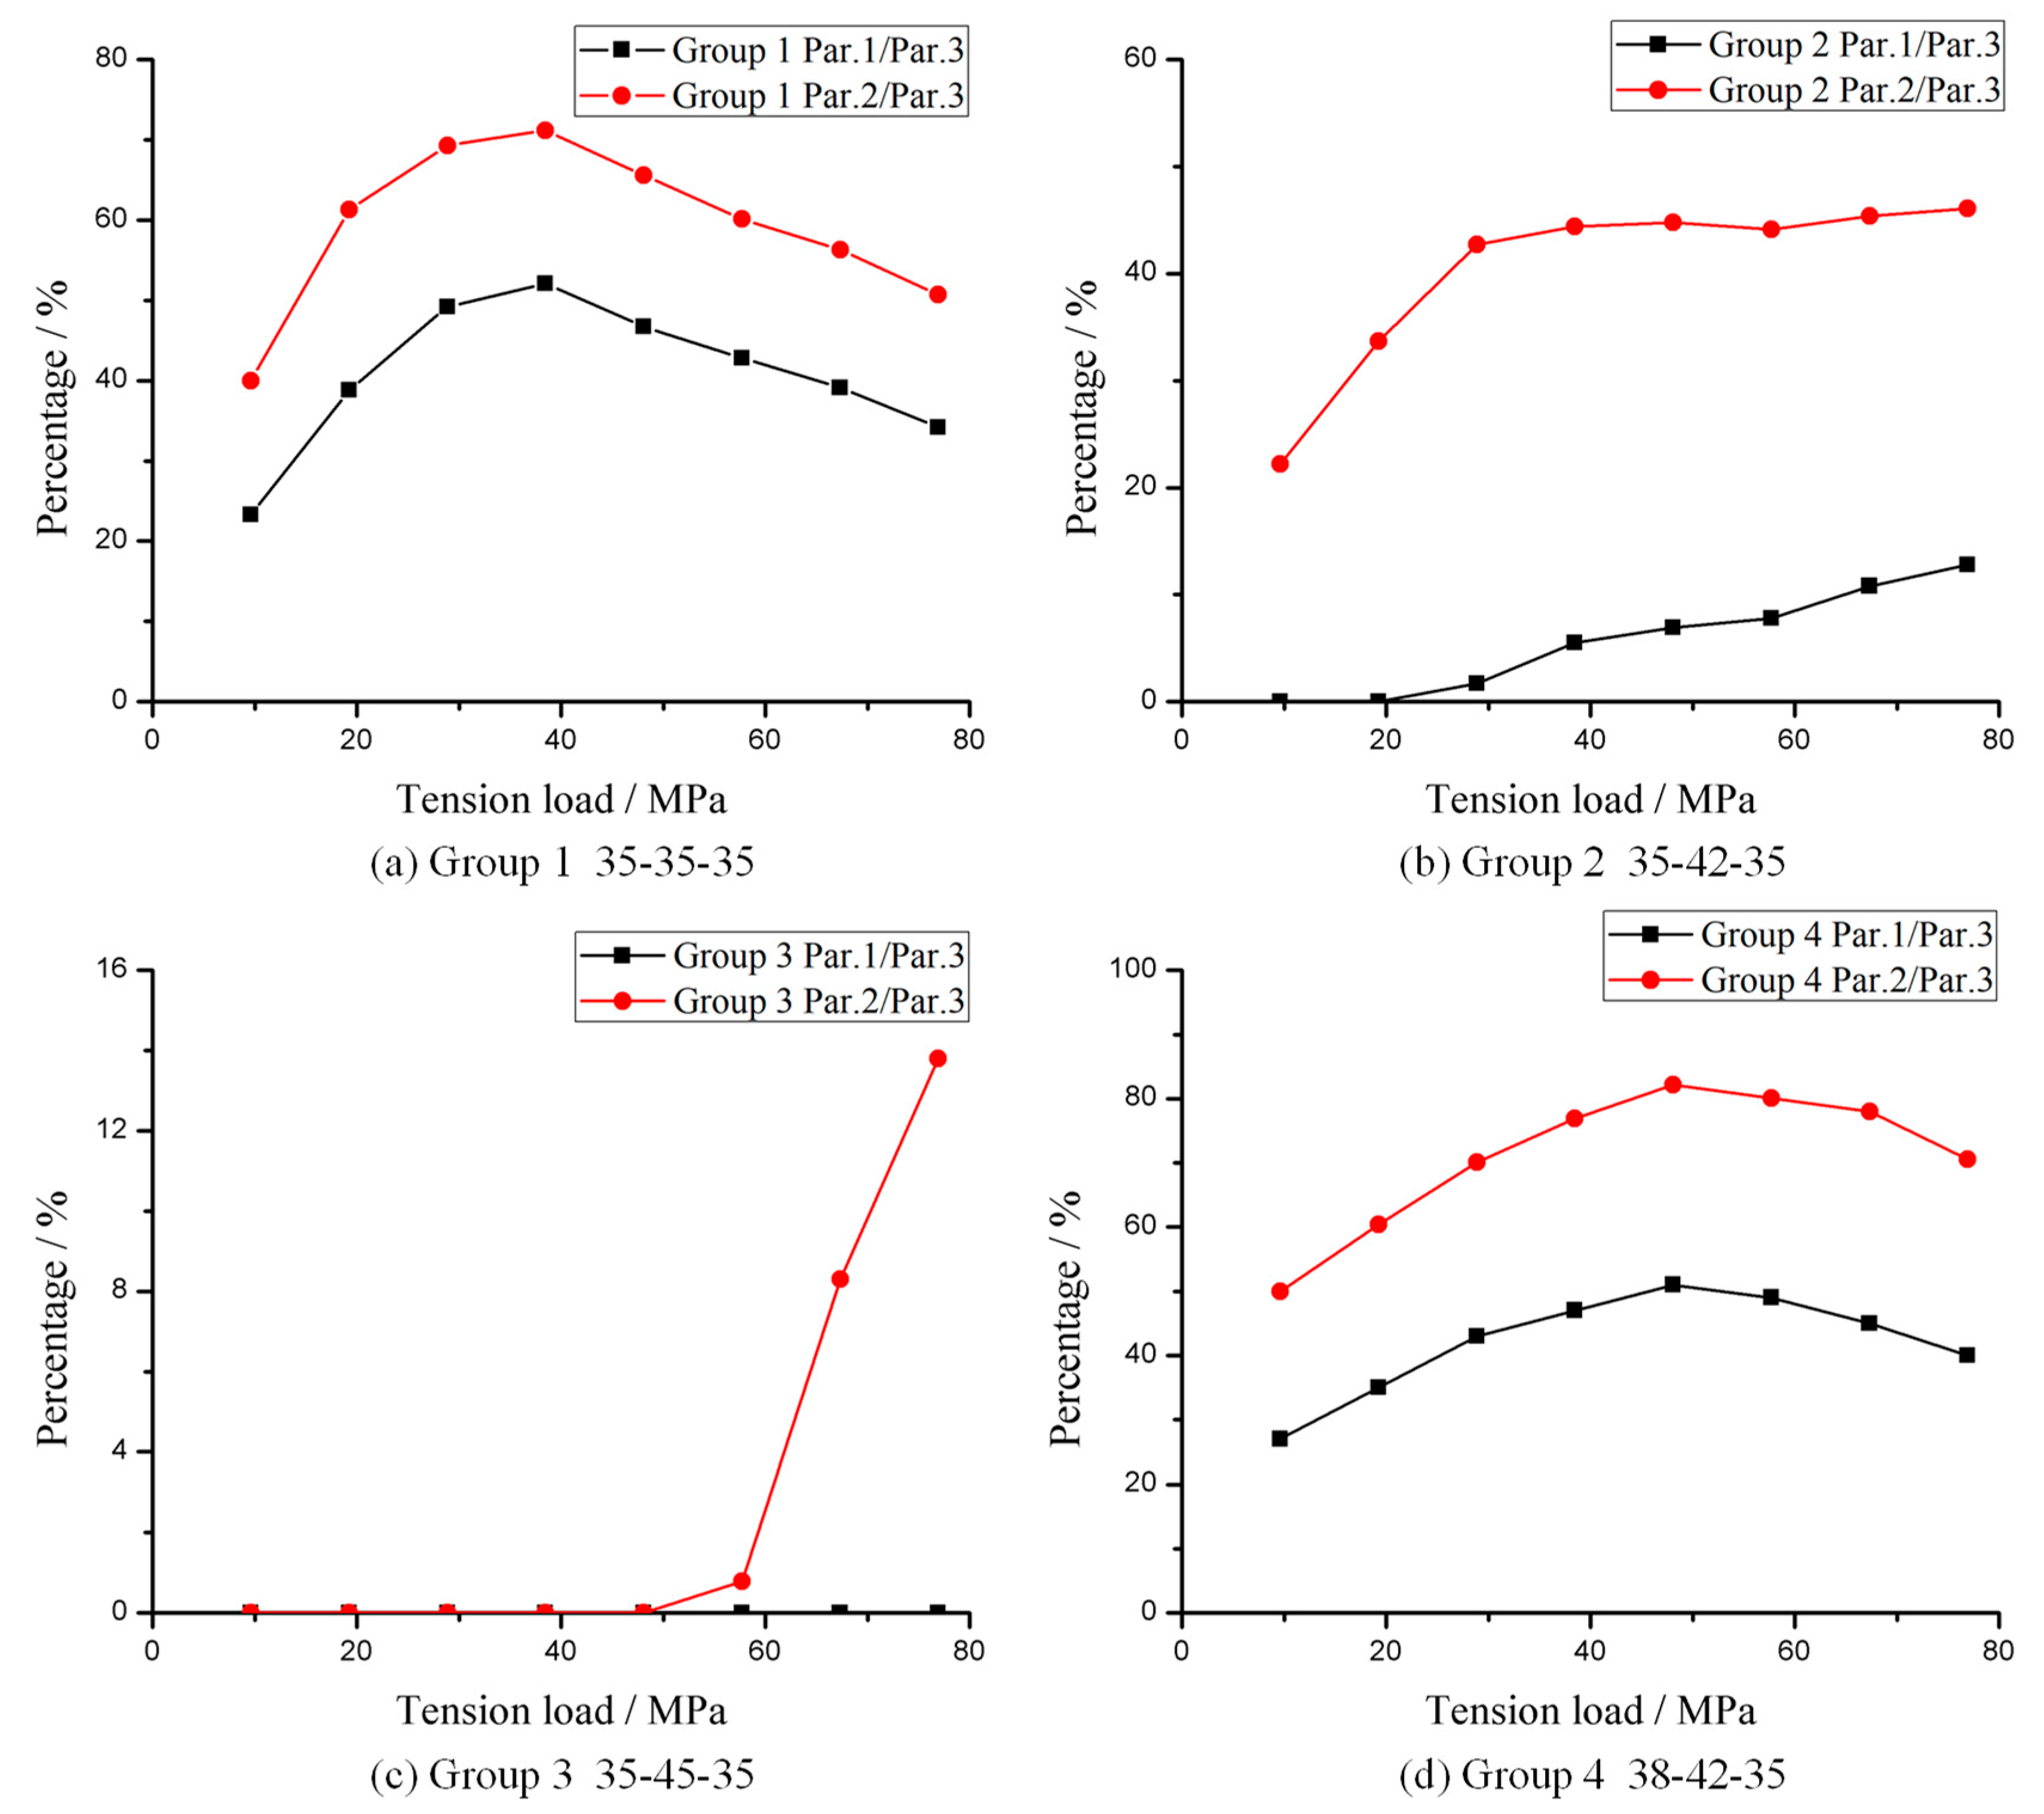
Figure 11 illustrates the strain ratio under the effects of different squeezing displacements. The data are obtained from the micro-strain gauges mounted on the inner sheet. The X axis is the magnitude of tensile load. The Y axis is the strain ratio. As shown in
Figure 2, the three-row riveted lap joint can be divided into four parts. Different parts suffer different proportions of tensile load. The proportion of tensile load transmitted by each part is closely related to the three rivets. The micro-strain gauges capture the strain variations of each part during the tensile test. The data shown in
Figure 11 are the indirect index of tensile load transmission in actual experiments.
As mentioned before, strains of
,
, and
are the average strains of
Section 1,
Section 2 and
Section 3, of which
is the total strain caused by tensile load
;
is the strain caused by
;
is the strain caused by
. In experiments,
is the average value of G7, G8 and G9;
is the average value of G4, G5 and G6. Additionally,
is the average value of G1, G2 and G3.
The strain ratios of and are regarded as indicators to evaluate the load distribution’s homogeneity during tensile stage.
Obviously, in Group 2, the tensile load gradually transfers to Part I until the tensile load exceeds 20 MPa. When the tensile load is smaller than 20 MPa, strain
in Part I is close to zero. The load distribution in Group 3 is even worse. There are few load transmits to Part I when the tensile load is under 80 MPa. Strain
in Part I is close to zero. The tensile load finally transfers to Part II (
) when the tensile load becomes larger than 50 MPa. This phenomenon can be explained, combined with
Figure 9. In Group 2 and Group 3, Rivet 2# and Rivet 3# carry the vast majority of tensile load. Tensile load transfers part by part will become harder when load distribution condition become more inhomogeneous.
In contrast, for Group 1 and Group 4, the strain ratio of is nearly double the strain ratio of , since the tensile load distribution becomes more homogeneous. Tensile load transfers part by part will become easier. In Group 4, in particular, the tensile load carried by the three rivets is approximately equal, . Hence, the load transferred by Part II () is almost twice over the load delivered by Part I (). The gap between the two strain ratio curves in Group 4 is larger than the gap in Group 1. This means the load distribution condition in Group 4 is better than in Group 1.
Both
Figure 9 and
Figure 11 discuss the homogeneity of tensile load distribution. No matter simulation or experiment, Group 3 is the worst situation. Compared with Group 1 and Group 2, the condition of Group 4 is even better. This phenomenon may be caused by structural deformation. The squeezing displacement of the outer rivets remains the same in Group 2, while the situation in Group 4 is different. The special squeezing displacement of each rivet may have a significant impact on tensile load distribution. The tensile load distribution can be more homogeneous with an appropriate squeezing displacement combination.
4.2.3. Analysis of Structural Deformation
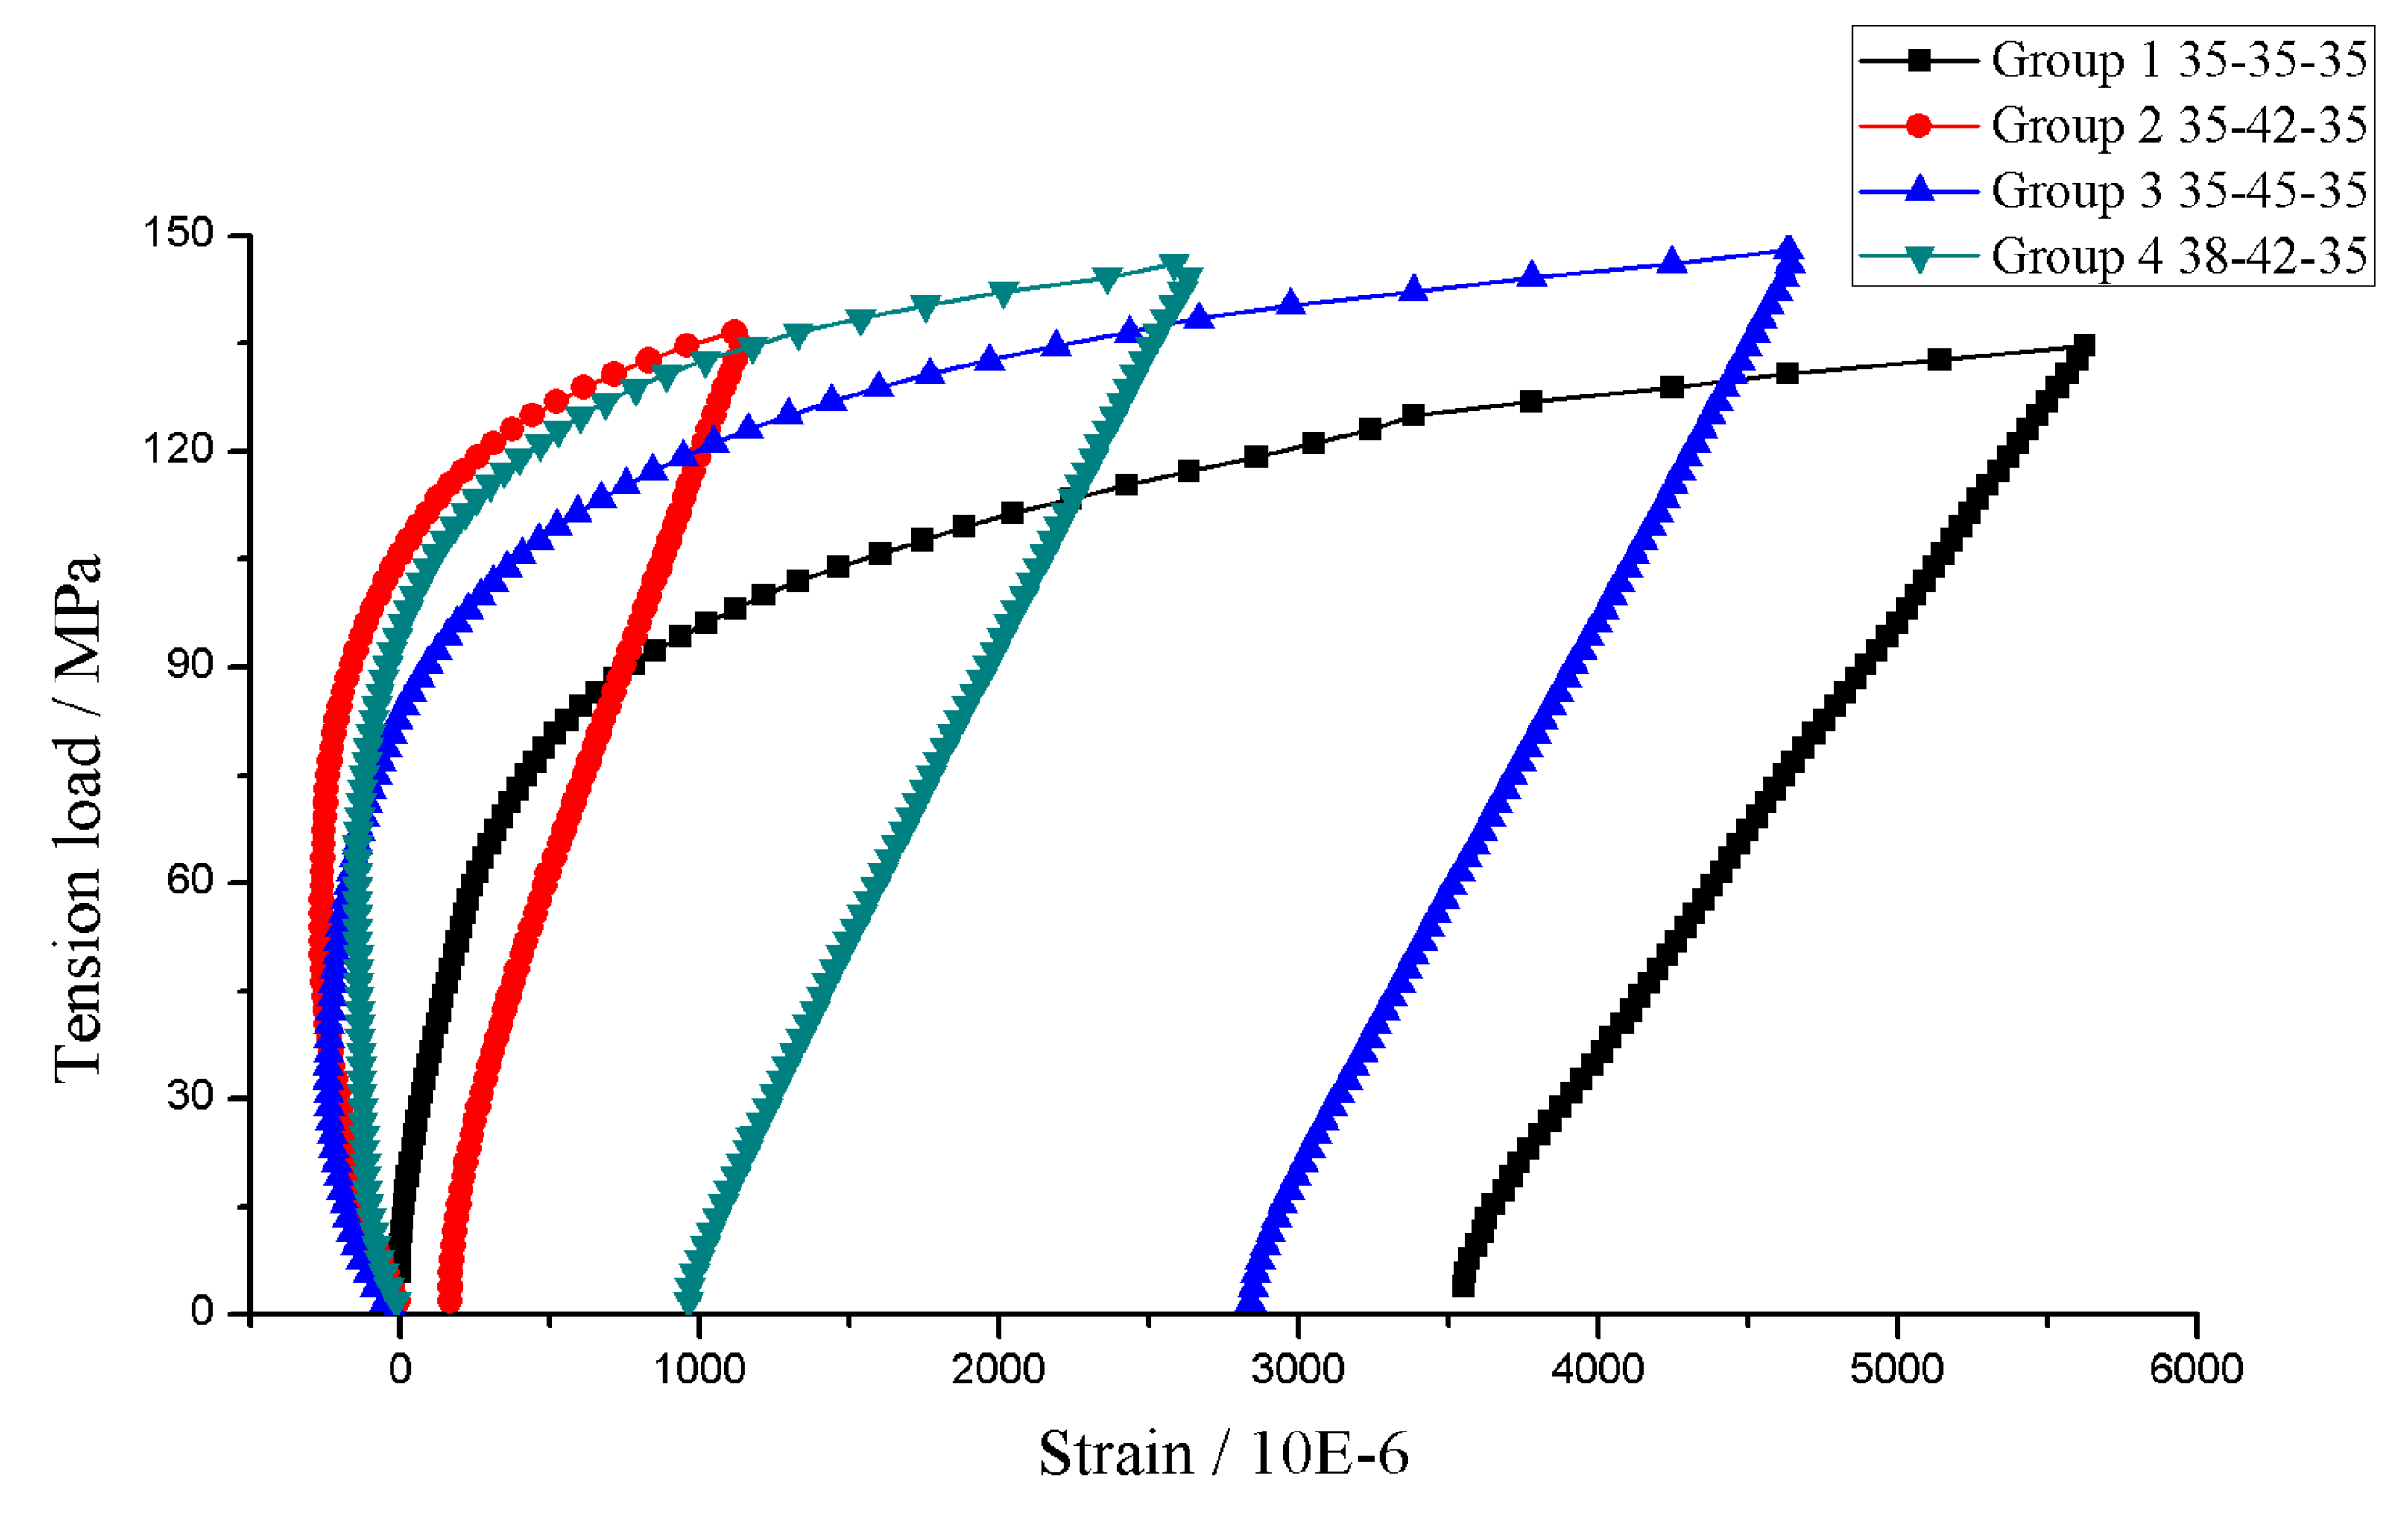
For the inner sheet, the region most sensitive to tensile load is the interface of Part II and Part III around Rivet 3#. The structural deformation at the interface around Rivet 3# is evaluated from the strain value of G10.
Figure 12 illustrates the strain value changing curve of G10. Since the rivet installation process will have some undesirable impacts on strain measurement, the strain value may be minus at the beginning when tensile load is transmitted to the corresponding section.
The strain values of Group 2 and Group 4 are much smaller than other groups. The conditions of structural deformation in Group 2 and Group 4 are relatively better. When tensile load transmitted by the three rivets becomes nearly equal, the elongations of the outer and inner sheets between the end rows will be uniform. Group 1 and Group 3 undergo huge deformation.
Both
Figure 10 and
Figure 12 discuss the condition of structural deformation. No matter simulation or experiment, Group 1 is the worst situation. The improvement of Group 3 is limited. The squeezing displacements of Group 2 and Group 4 are more desired. The structural deformation can be effectively controlled with an appropriate squeezing displacement combination.
5. Conclusions
The theoretical discussion introduces the internal moment model to account for the effect of the inhomogeneity of tensile load distribution. Numerical simulations and experimental tests are conducted. Four different squeezing displacement combinations are analyzed. A good agreement between theoretical analysis, numerical results and experimental tests is achieved.
The result of this paper indicates the squeezing displacement combination has a significant influence on the performance of a three-row riveted lap joint. An appropriate squeezing displacement combination can effectively make tensile load distribution more homogeneous. Each rivet can take approximately 33% tensile load. Structural deformation magnitude can be reduced as well. Compared with the worst situation, the max strain value at the region most sensitive to tensile load can reduce about 53.22–79.76%.
This study closely relates the squeezing displacement combination to tensile load distribution and structural deformation improvement. Squeezing displacement is not only an important riveting parameter, but is also easily controlled during the riveting process. The research of this work is of technological importance and is helpful to aircraft manufacturing practice.


