
Simulation Study on Centrifugal Spray Evaporation Characteristics and Process Optimization of Desulfurization Wastewater

Abstract
:1. Introduction
2. Numerical Method
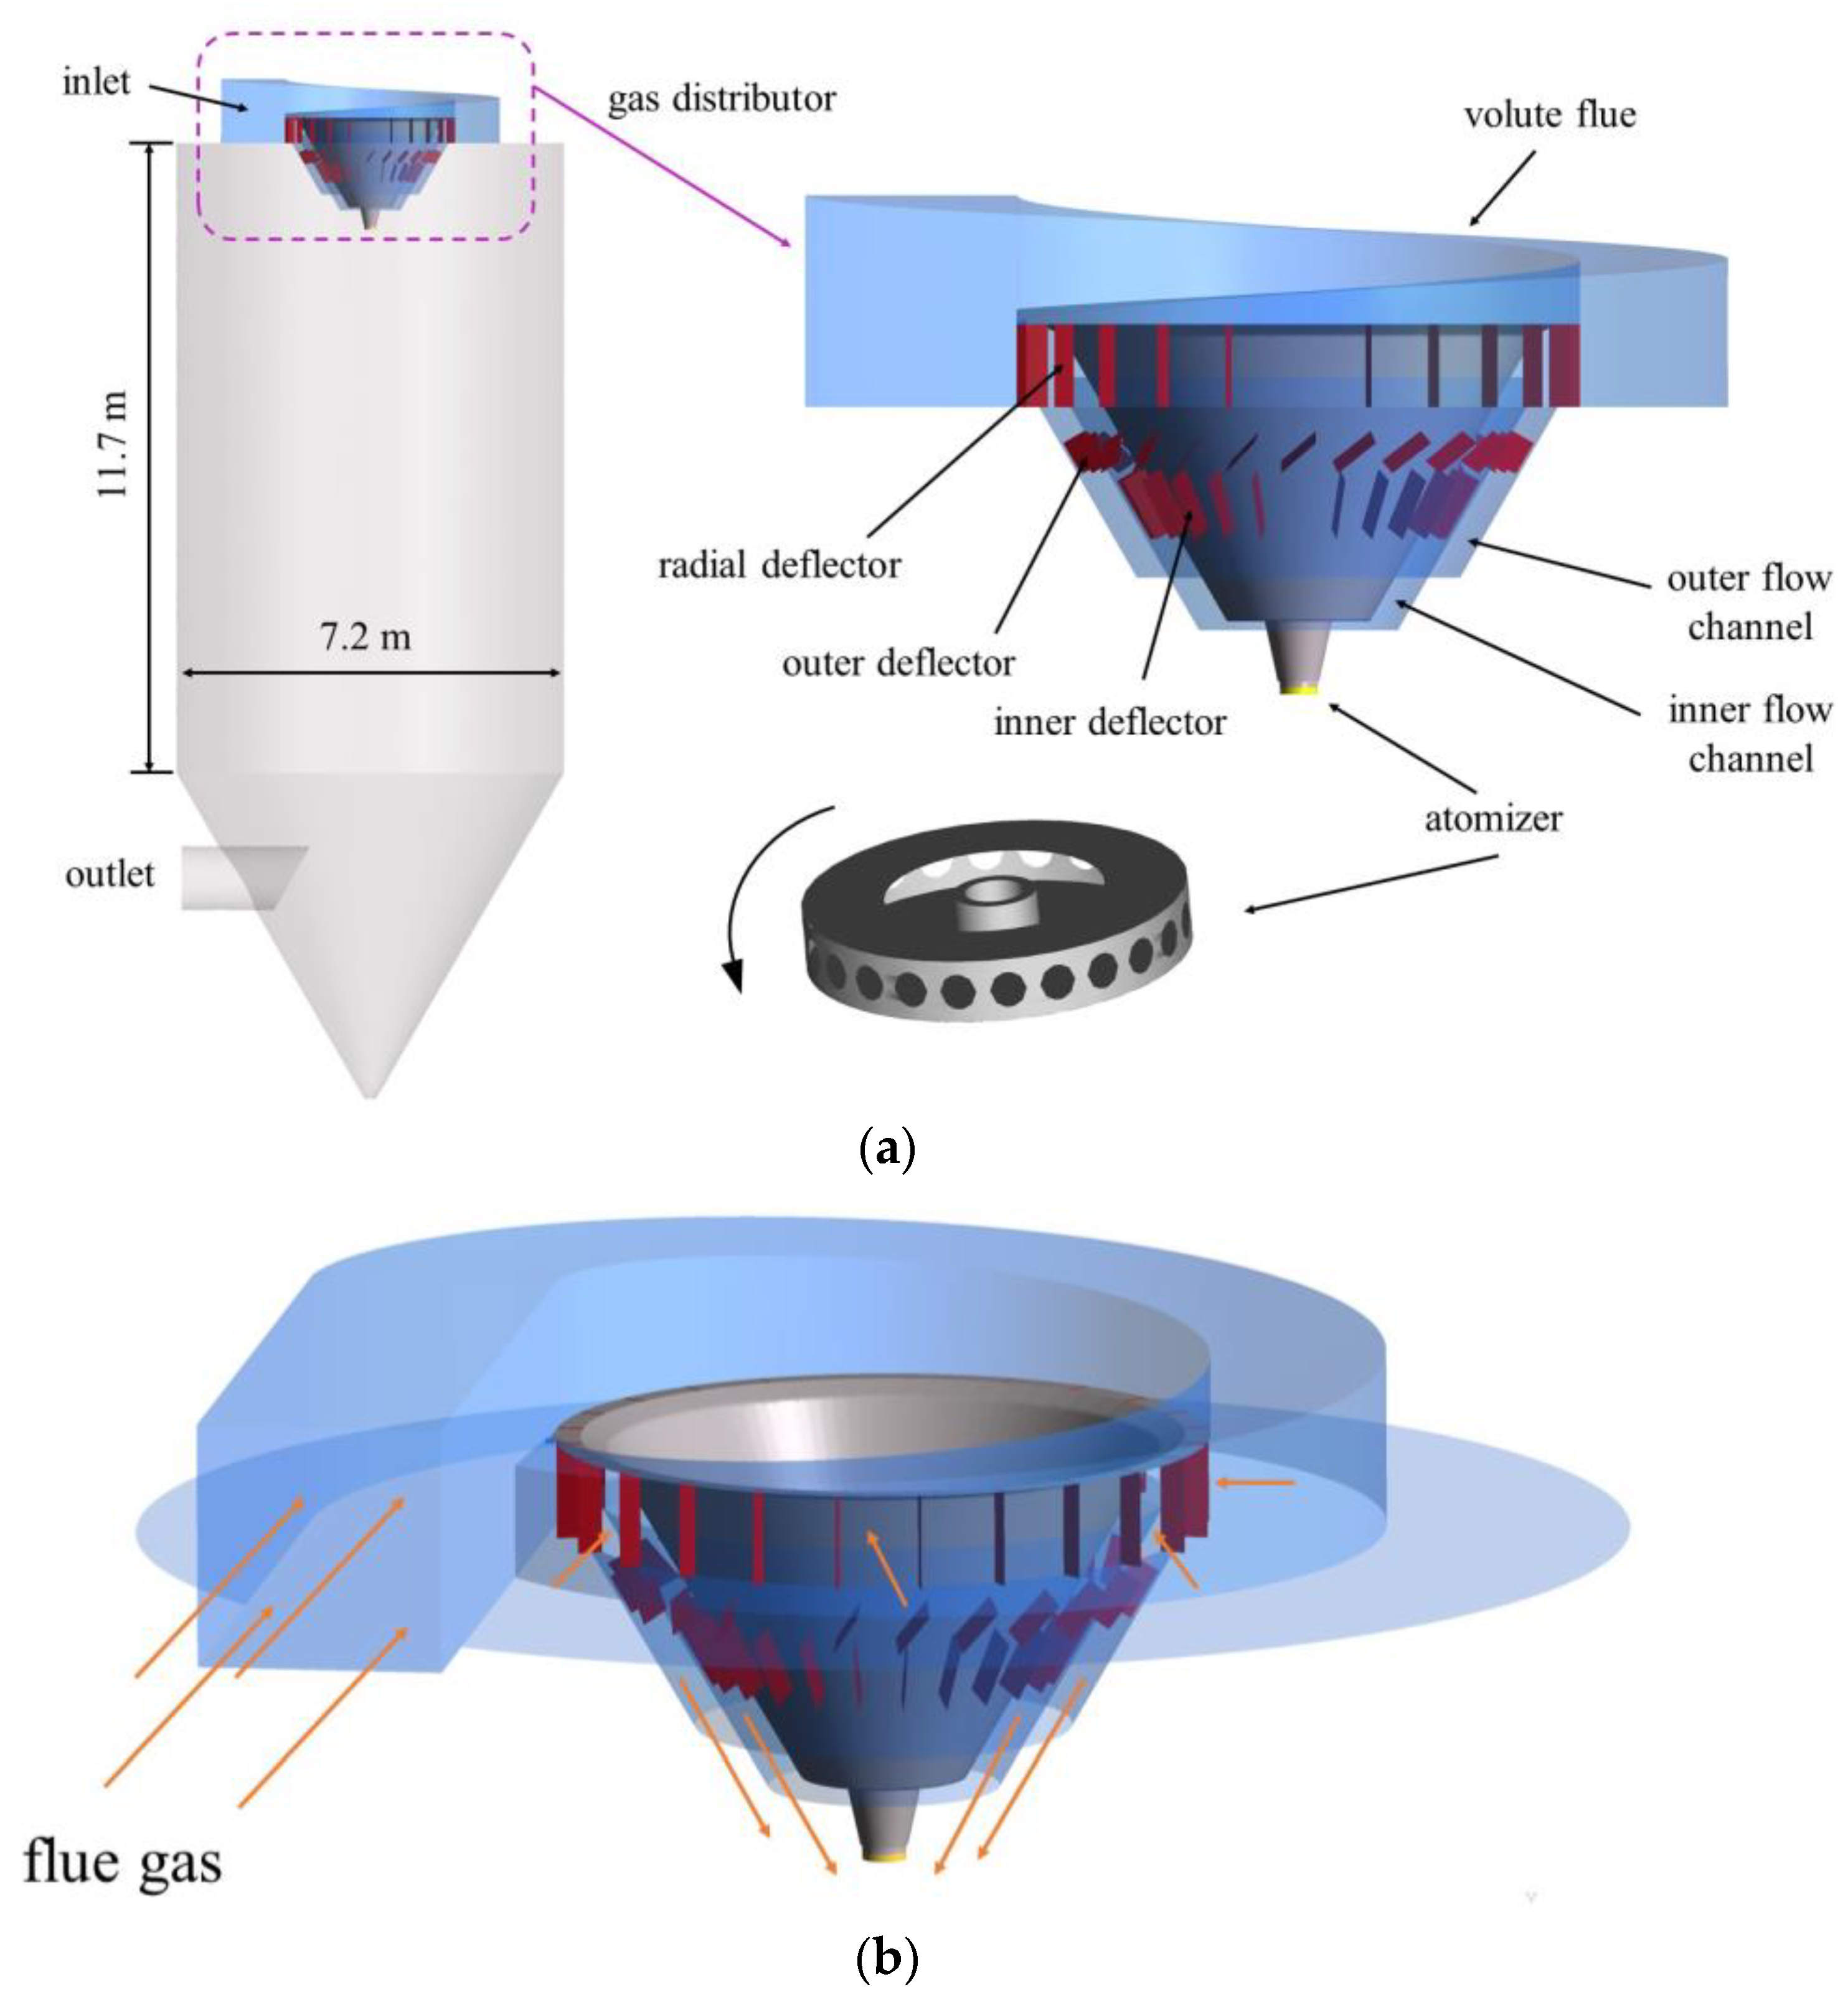
2.1. Study Object
2.2. Mathematical Model
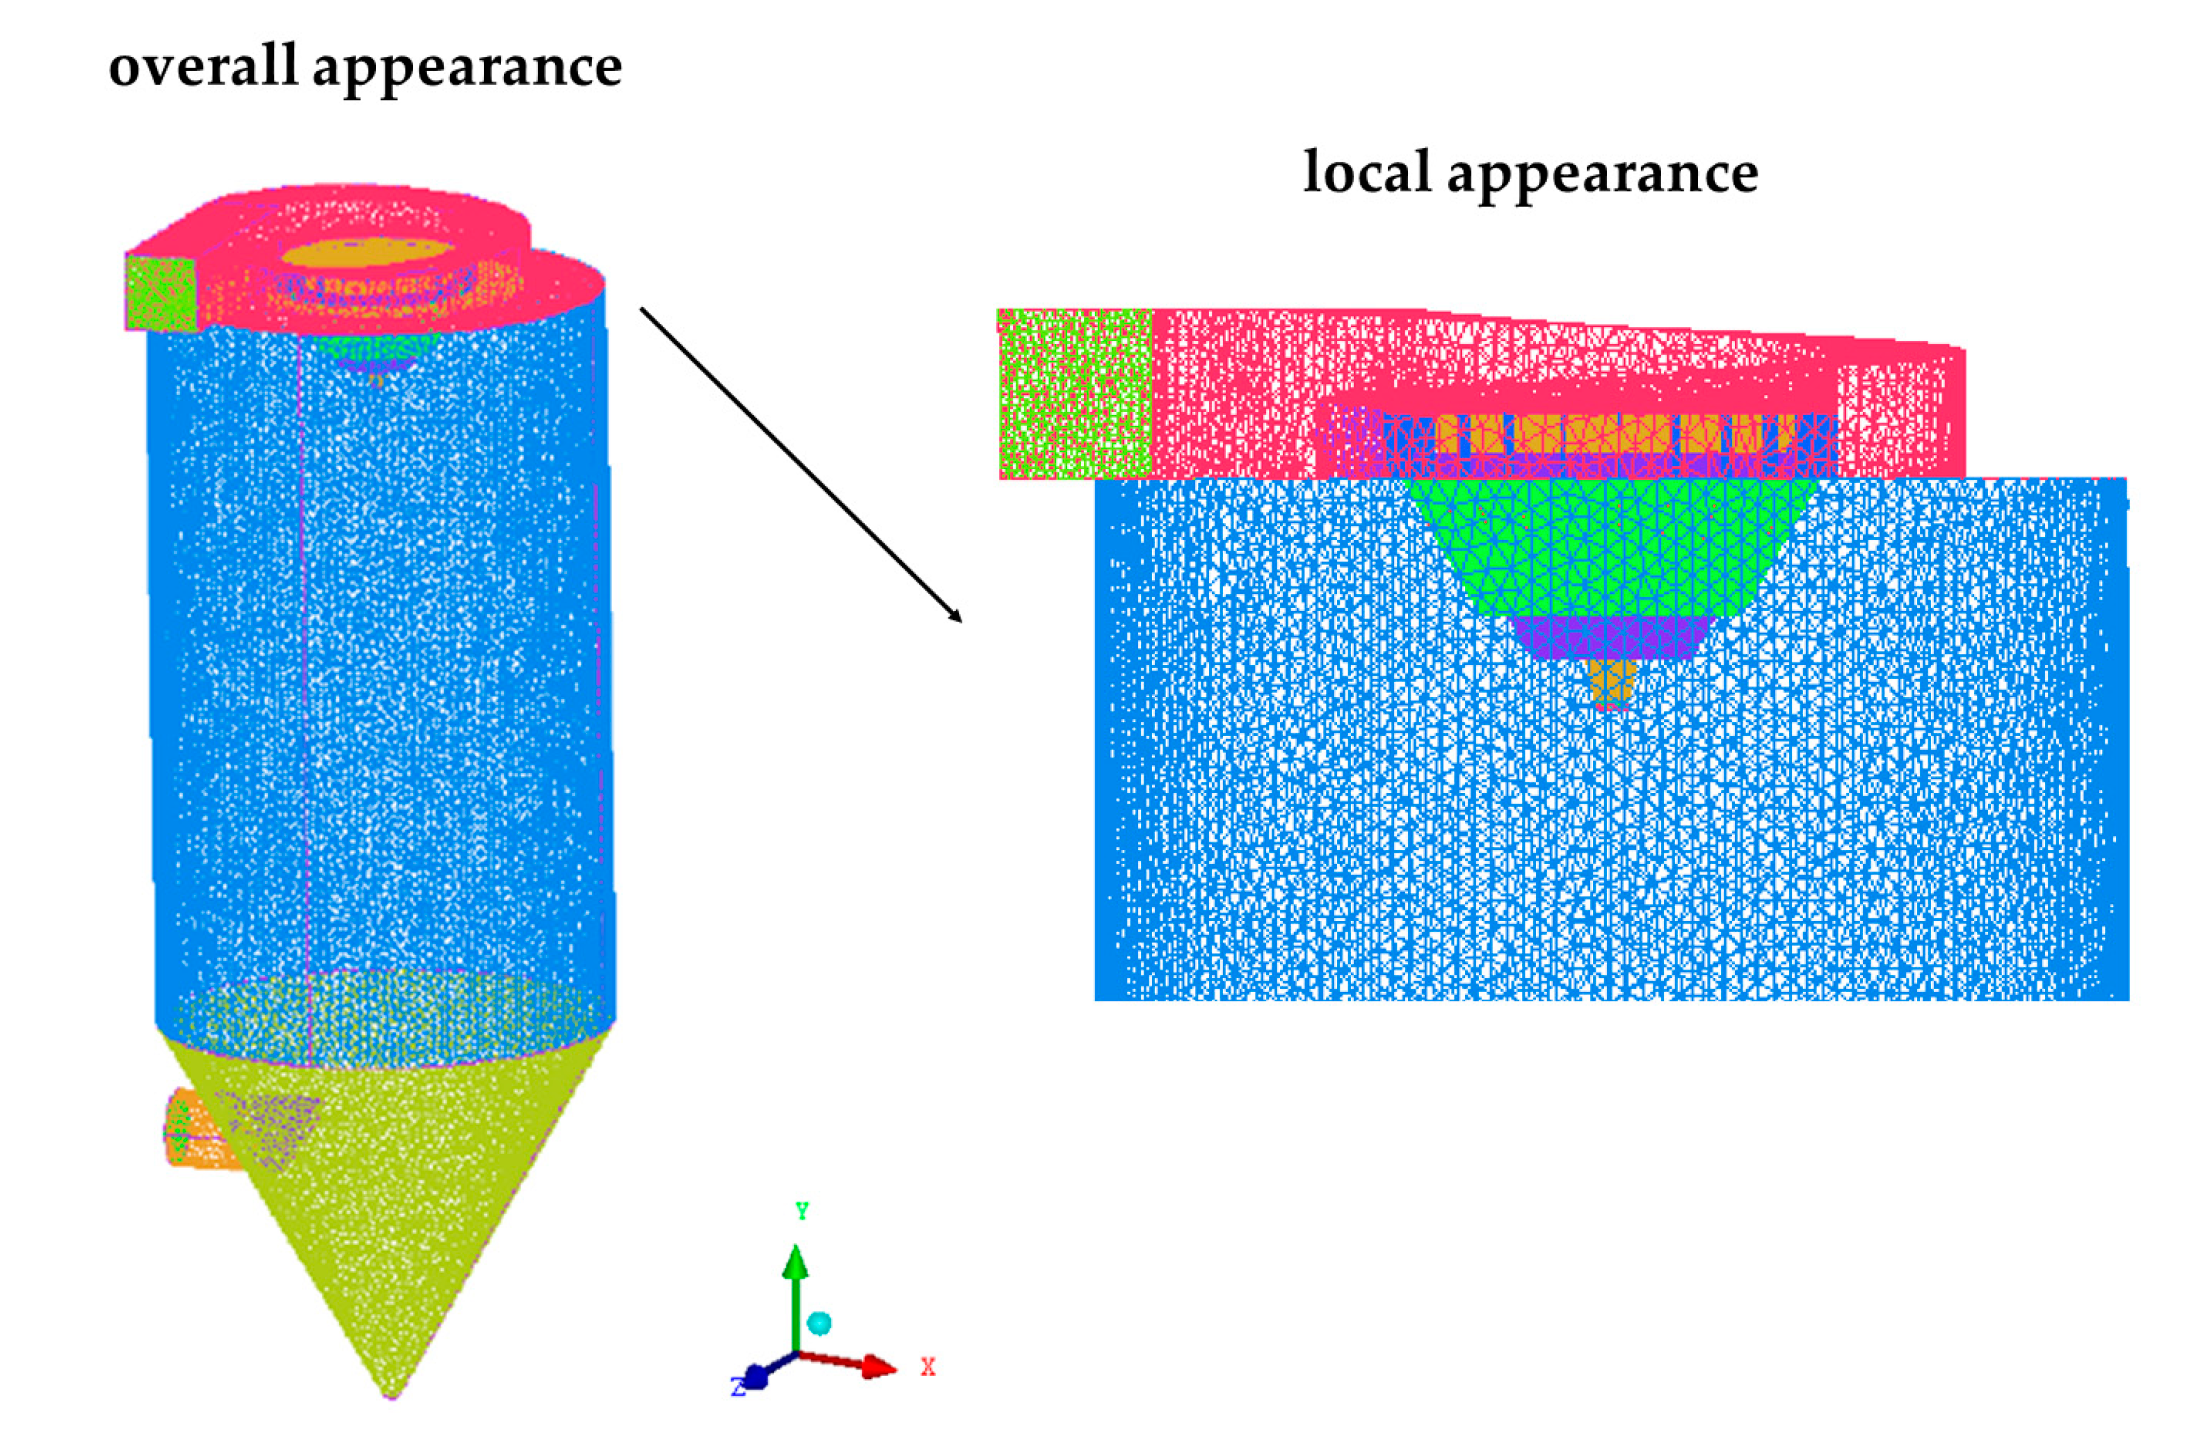
2.3. Numerical Procedures
3. Numerical Conditions
3.1. Boundary Conditions and Operating Parameters
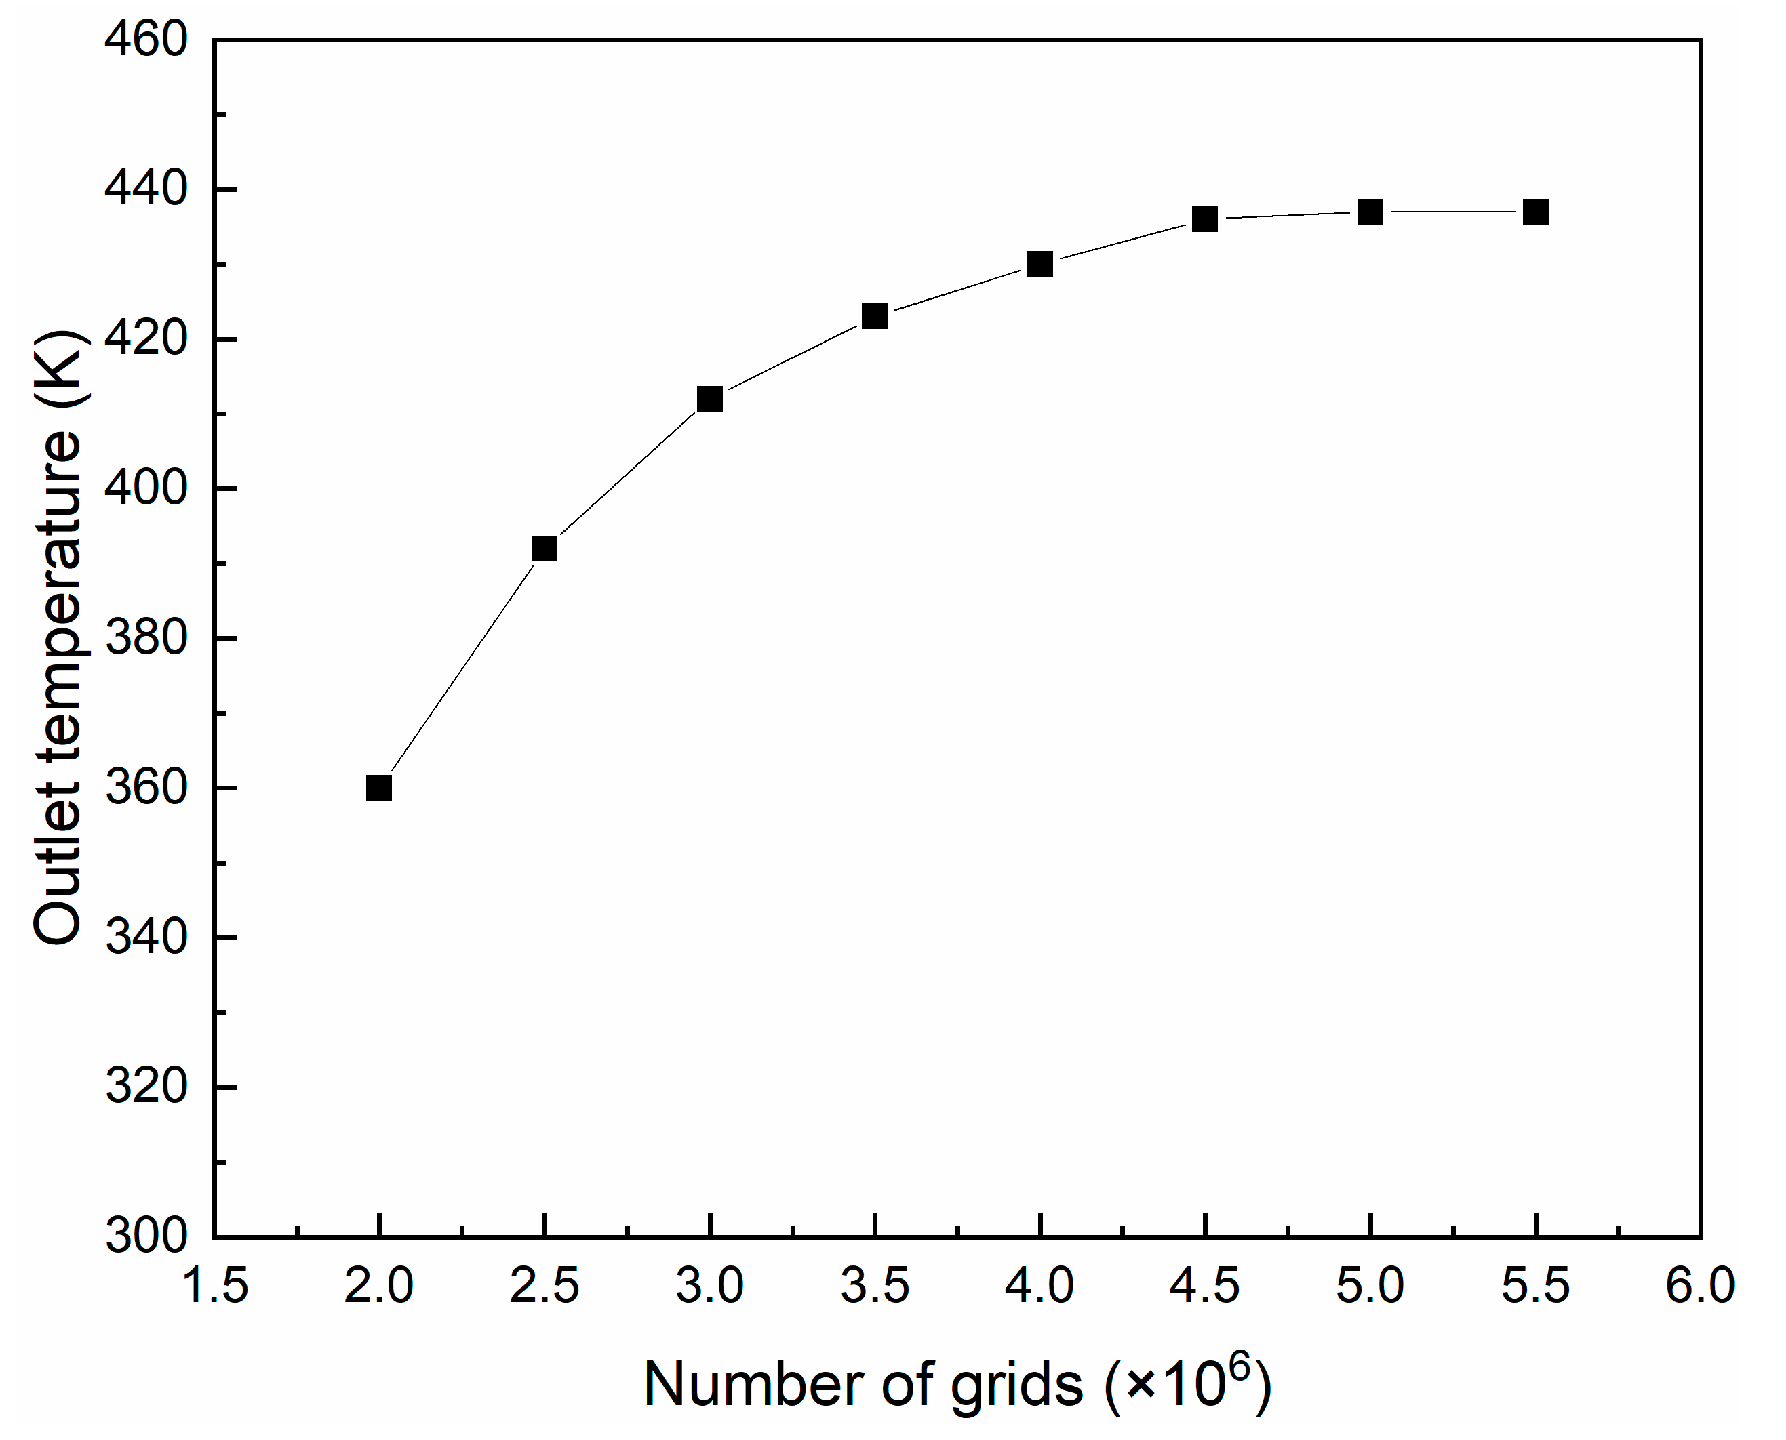
3.2. Reliability Verification to CFD Model
4. Results and Discussion
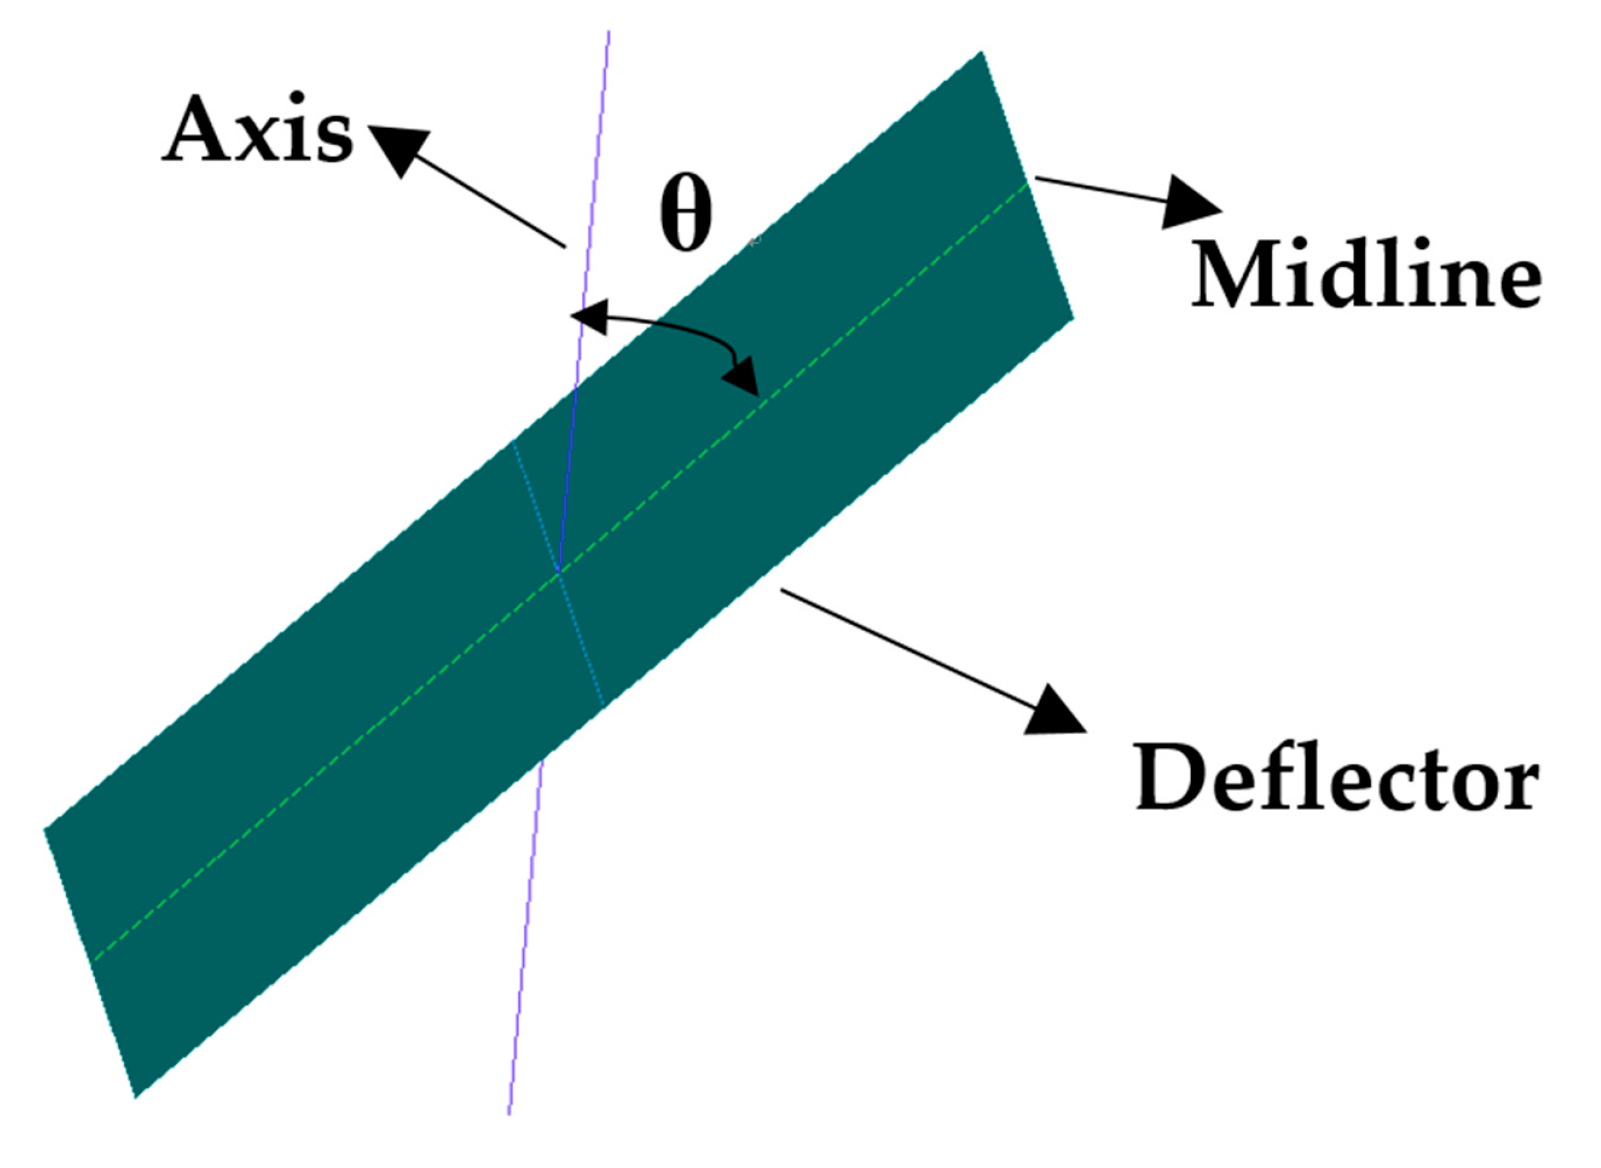
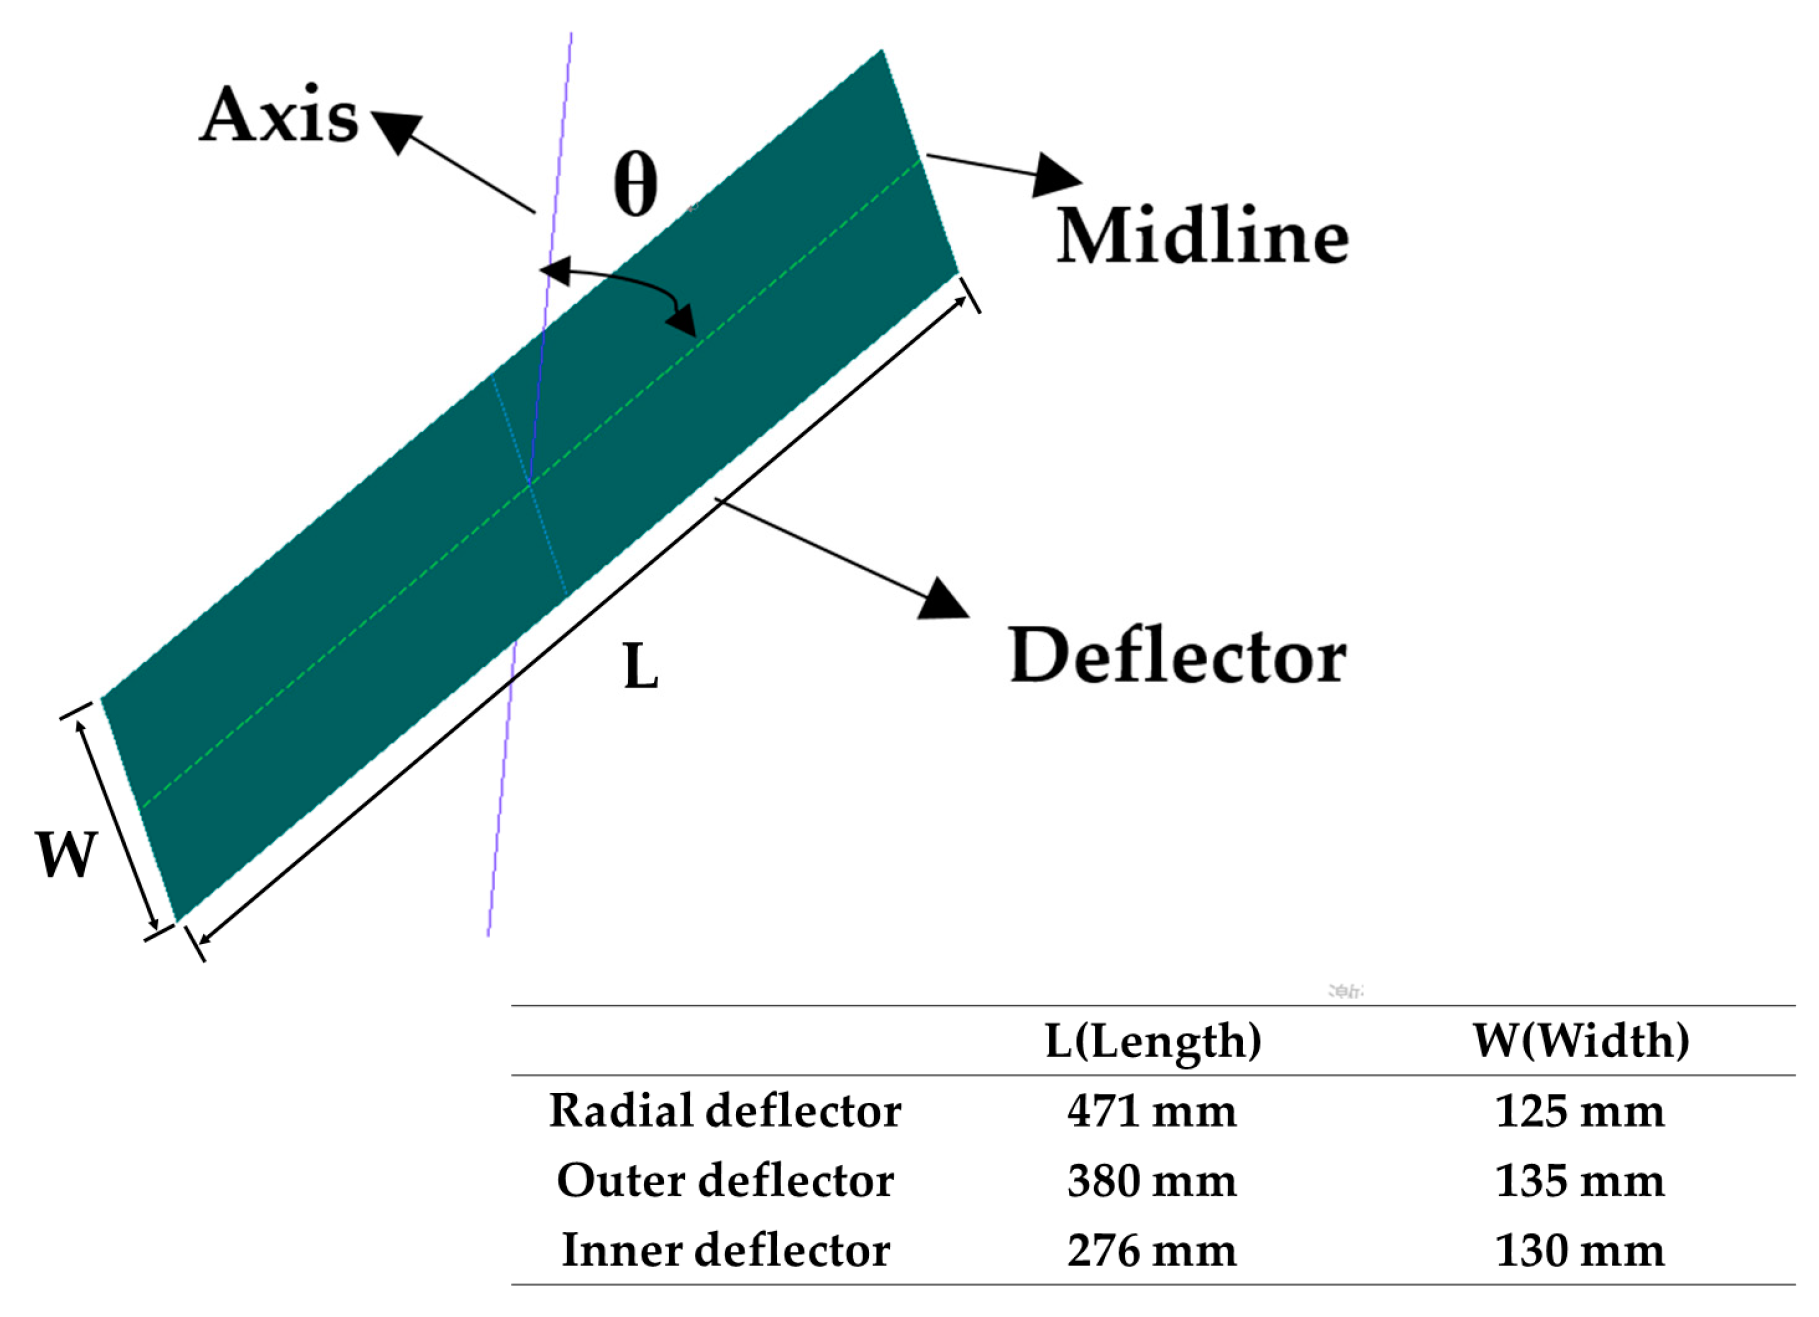
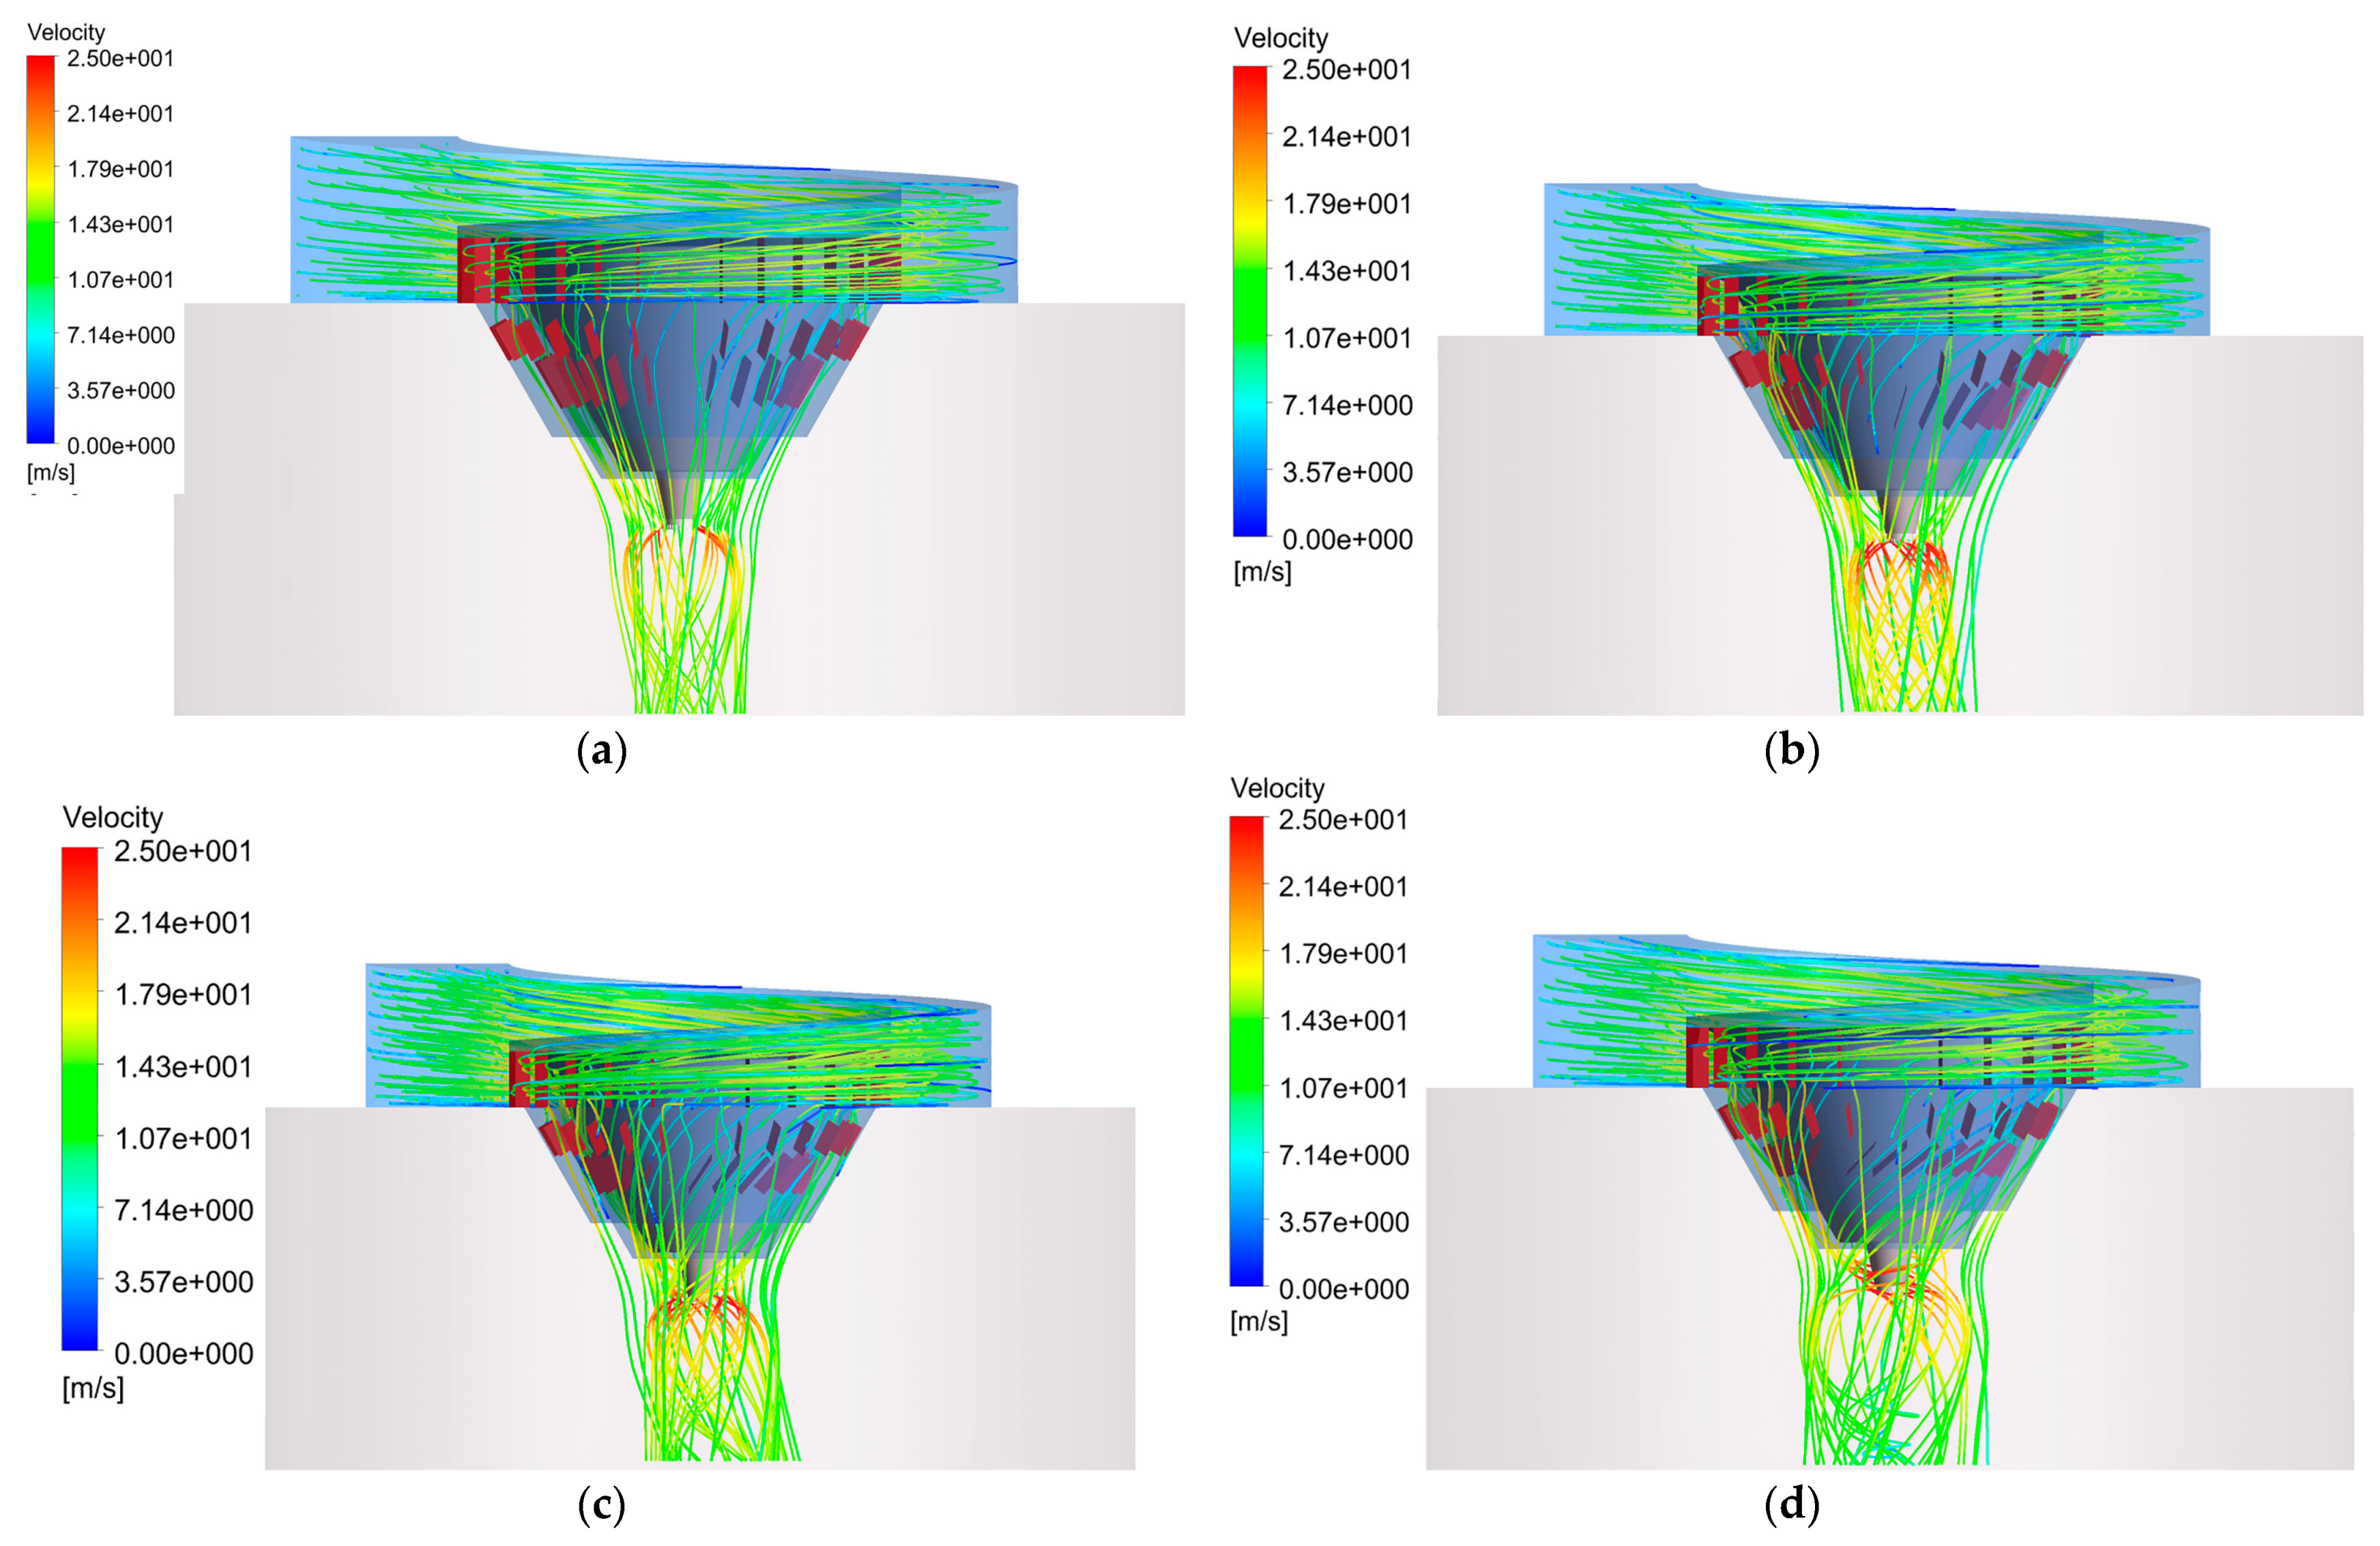
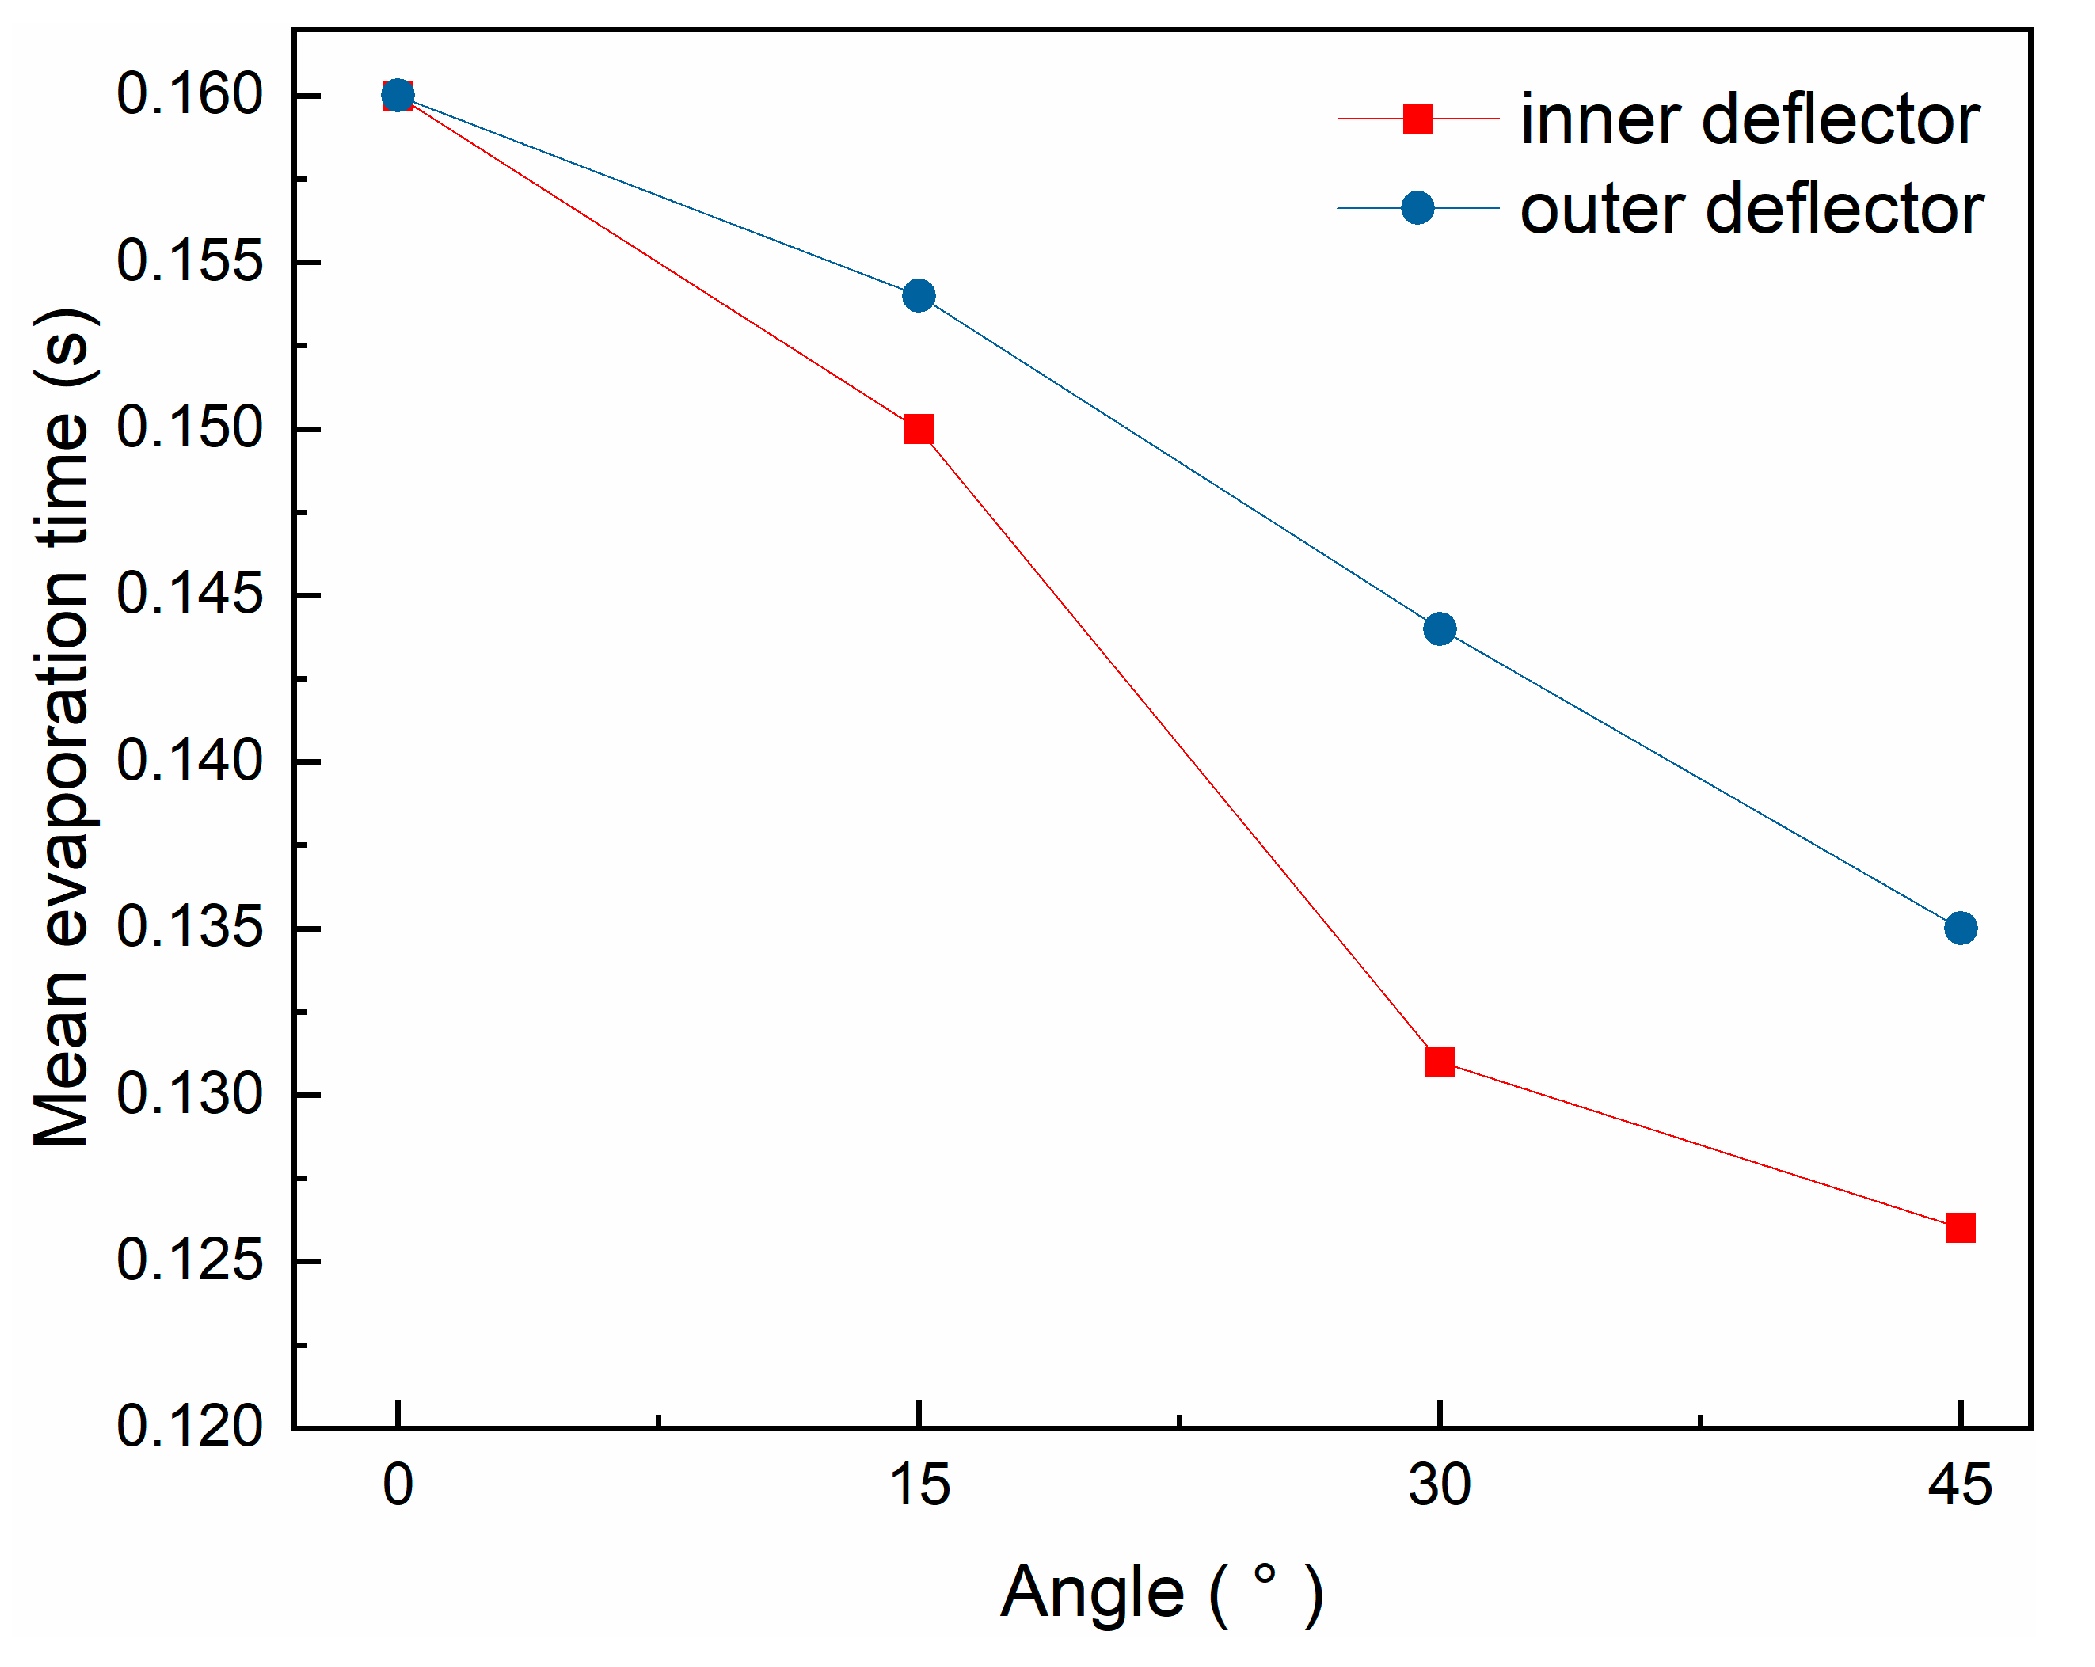
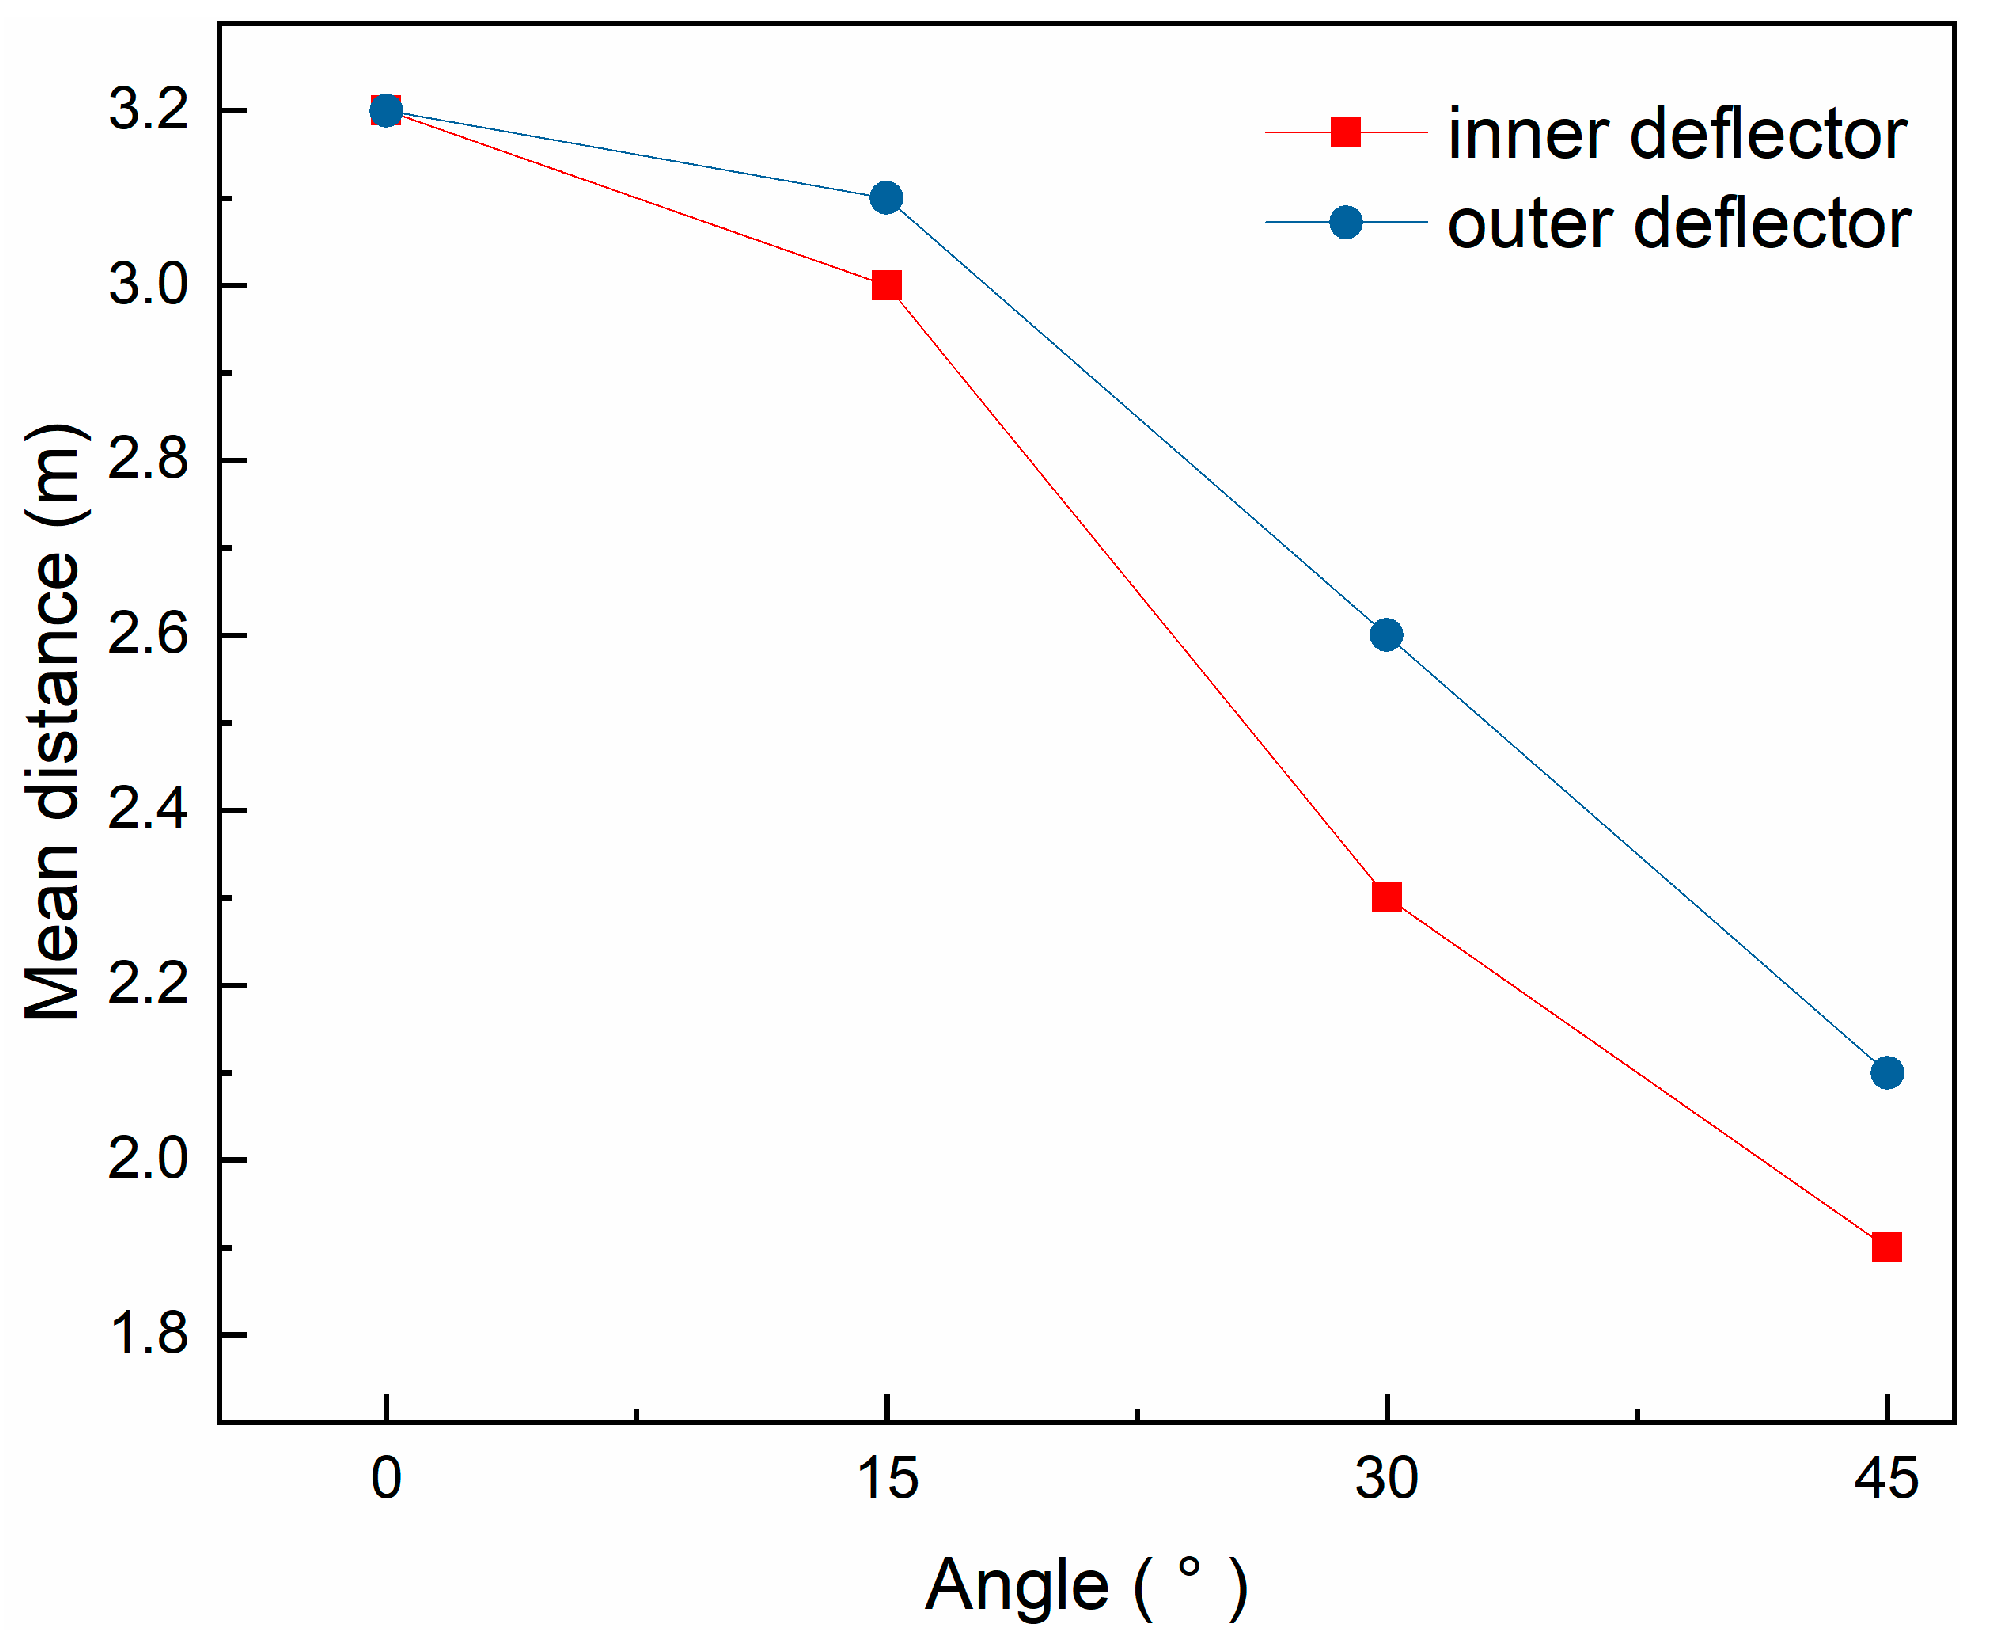
4.1. Effect of Angle of Deflector
4.2. Effect of Gas–Liquid Ratio
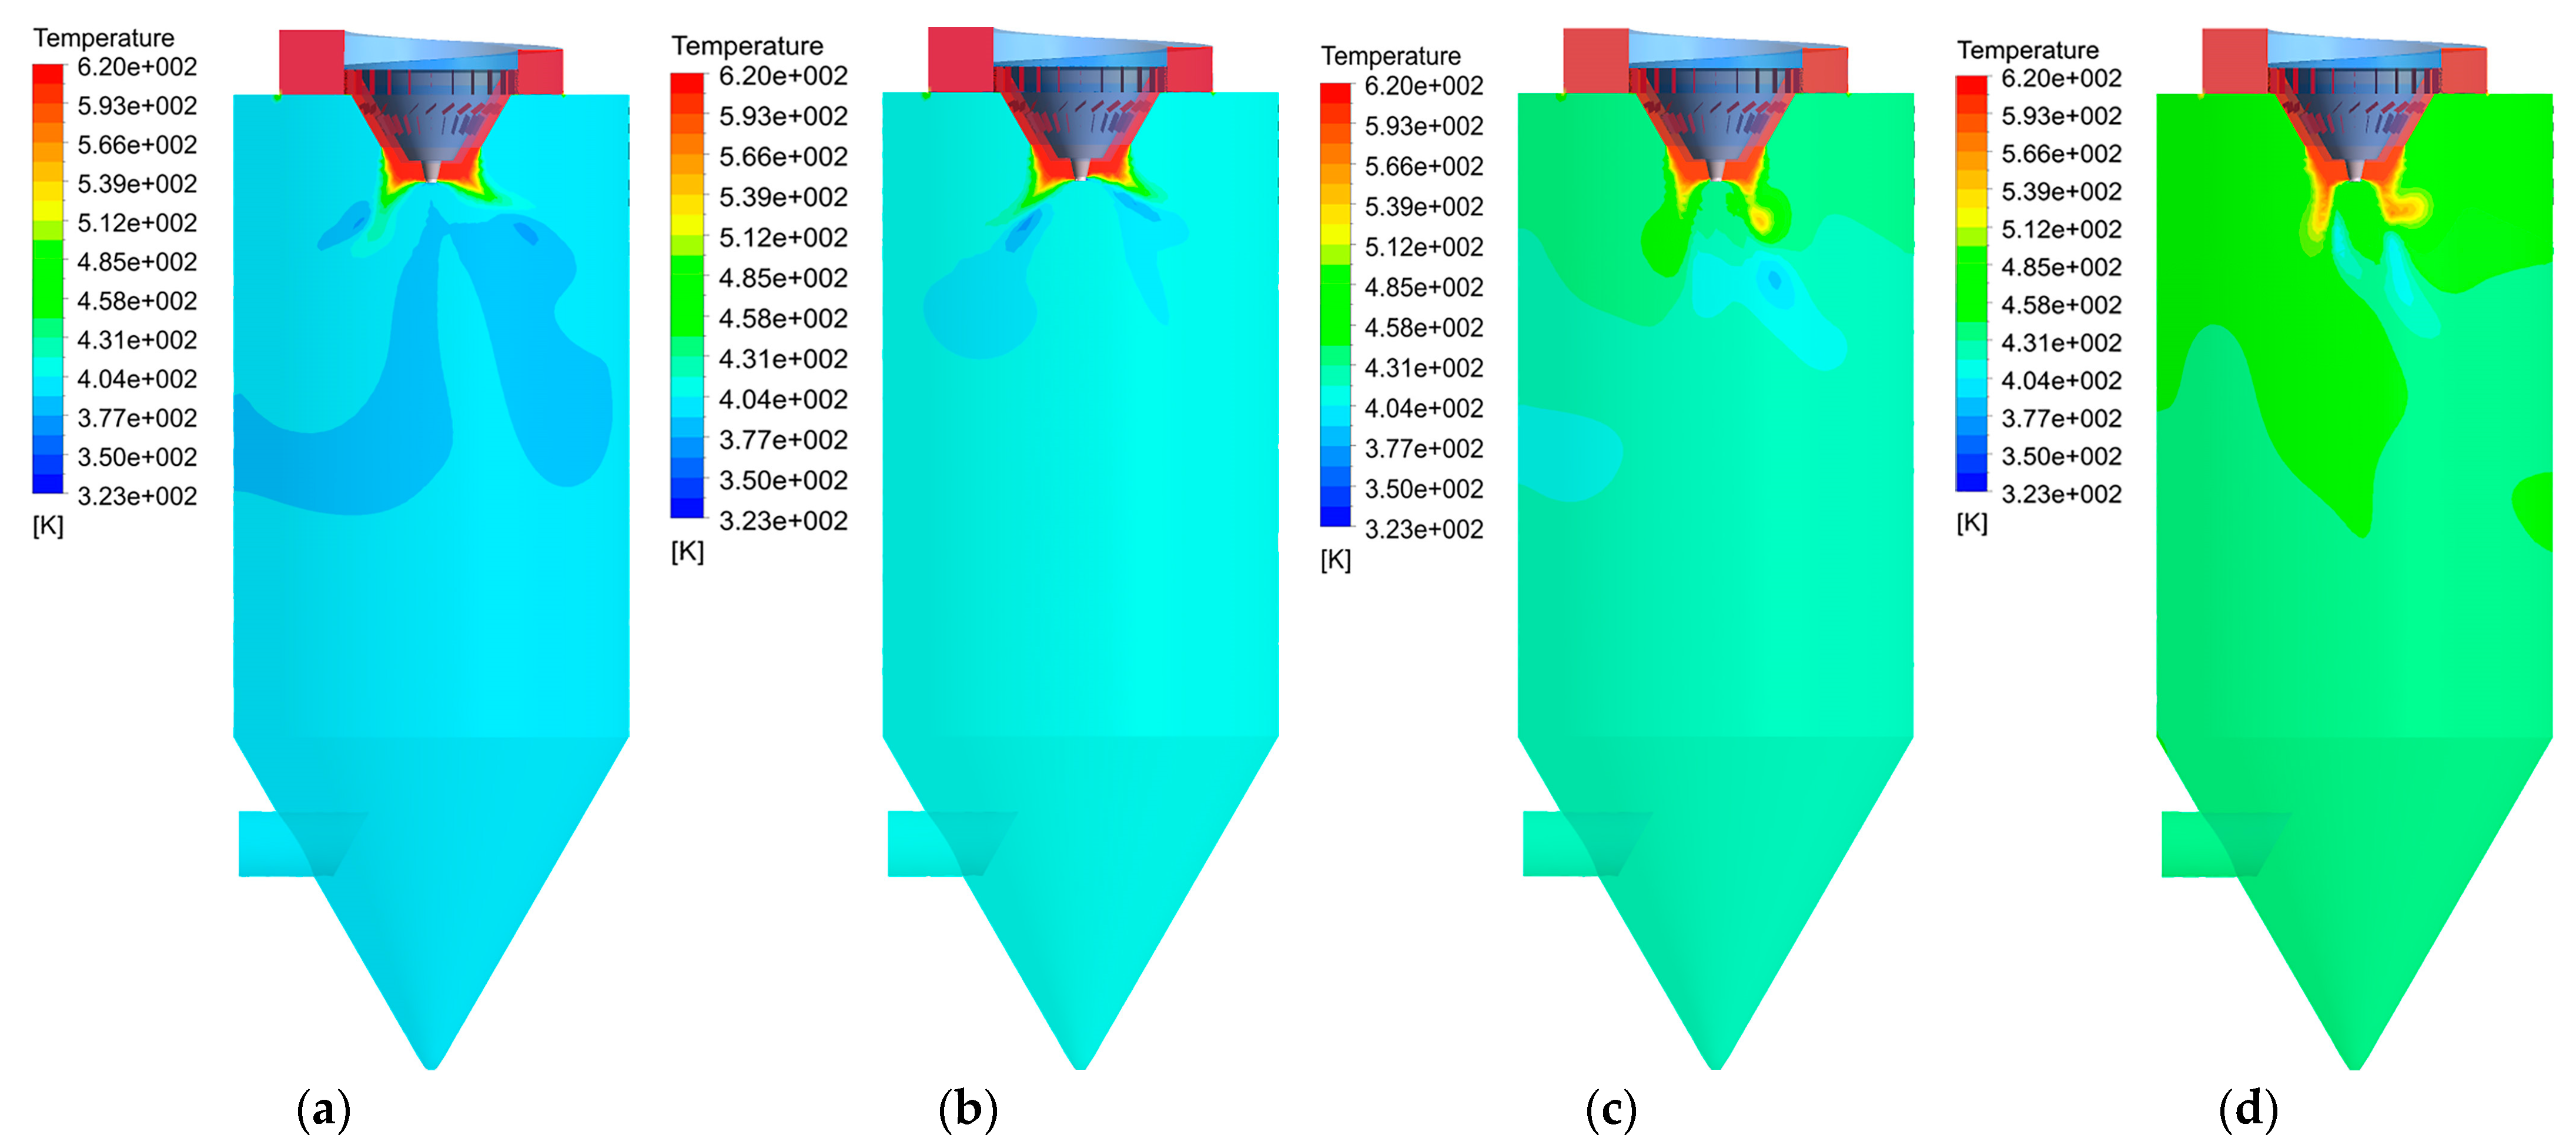
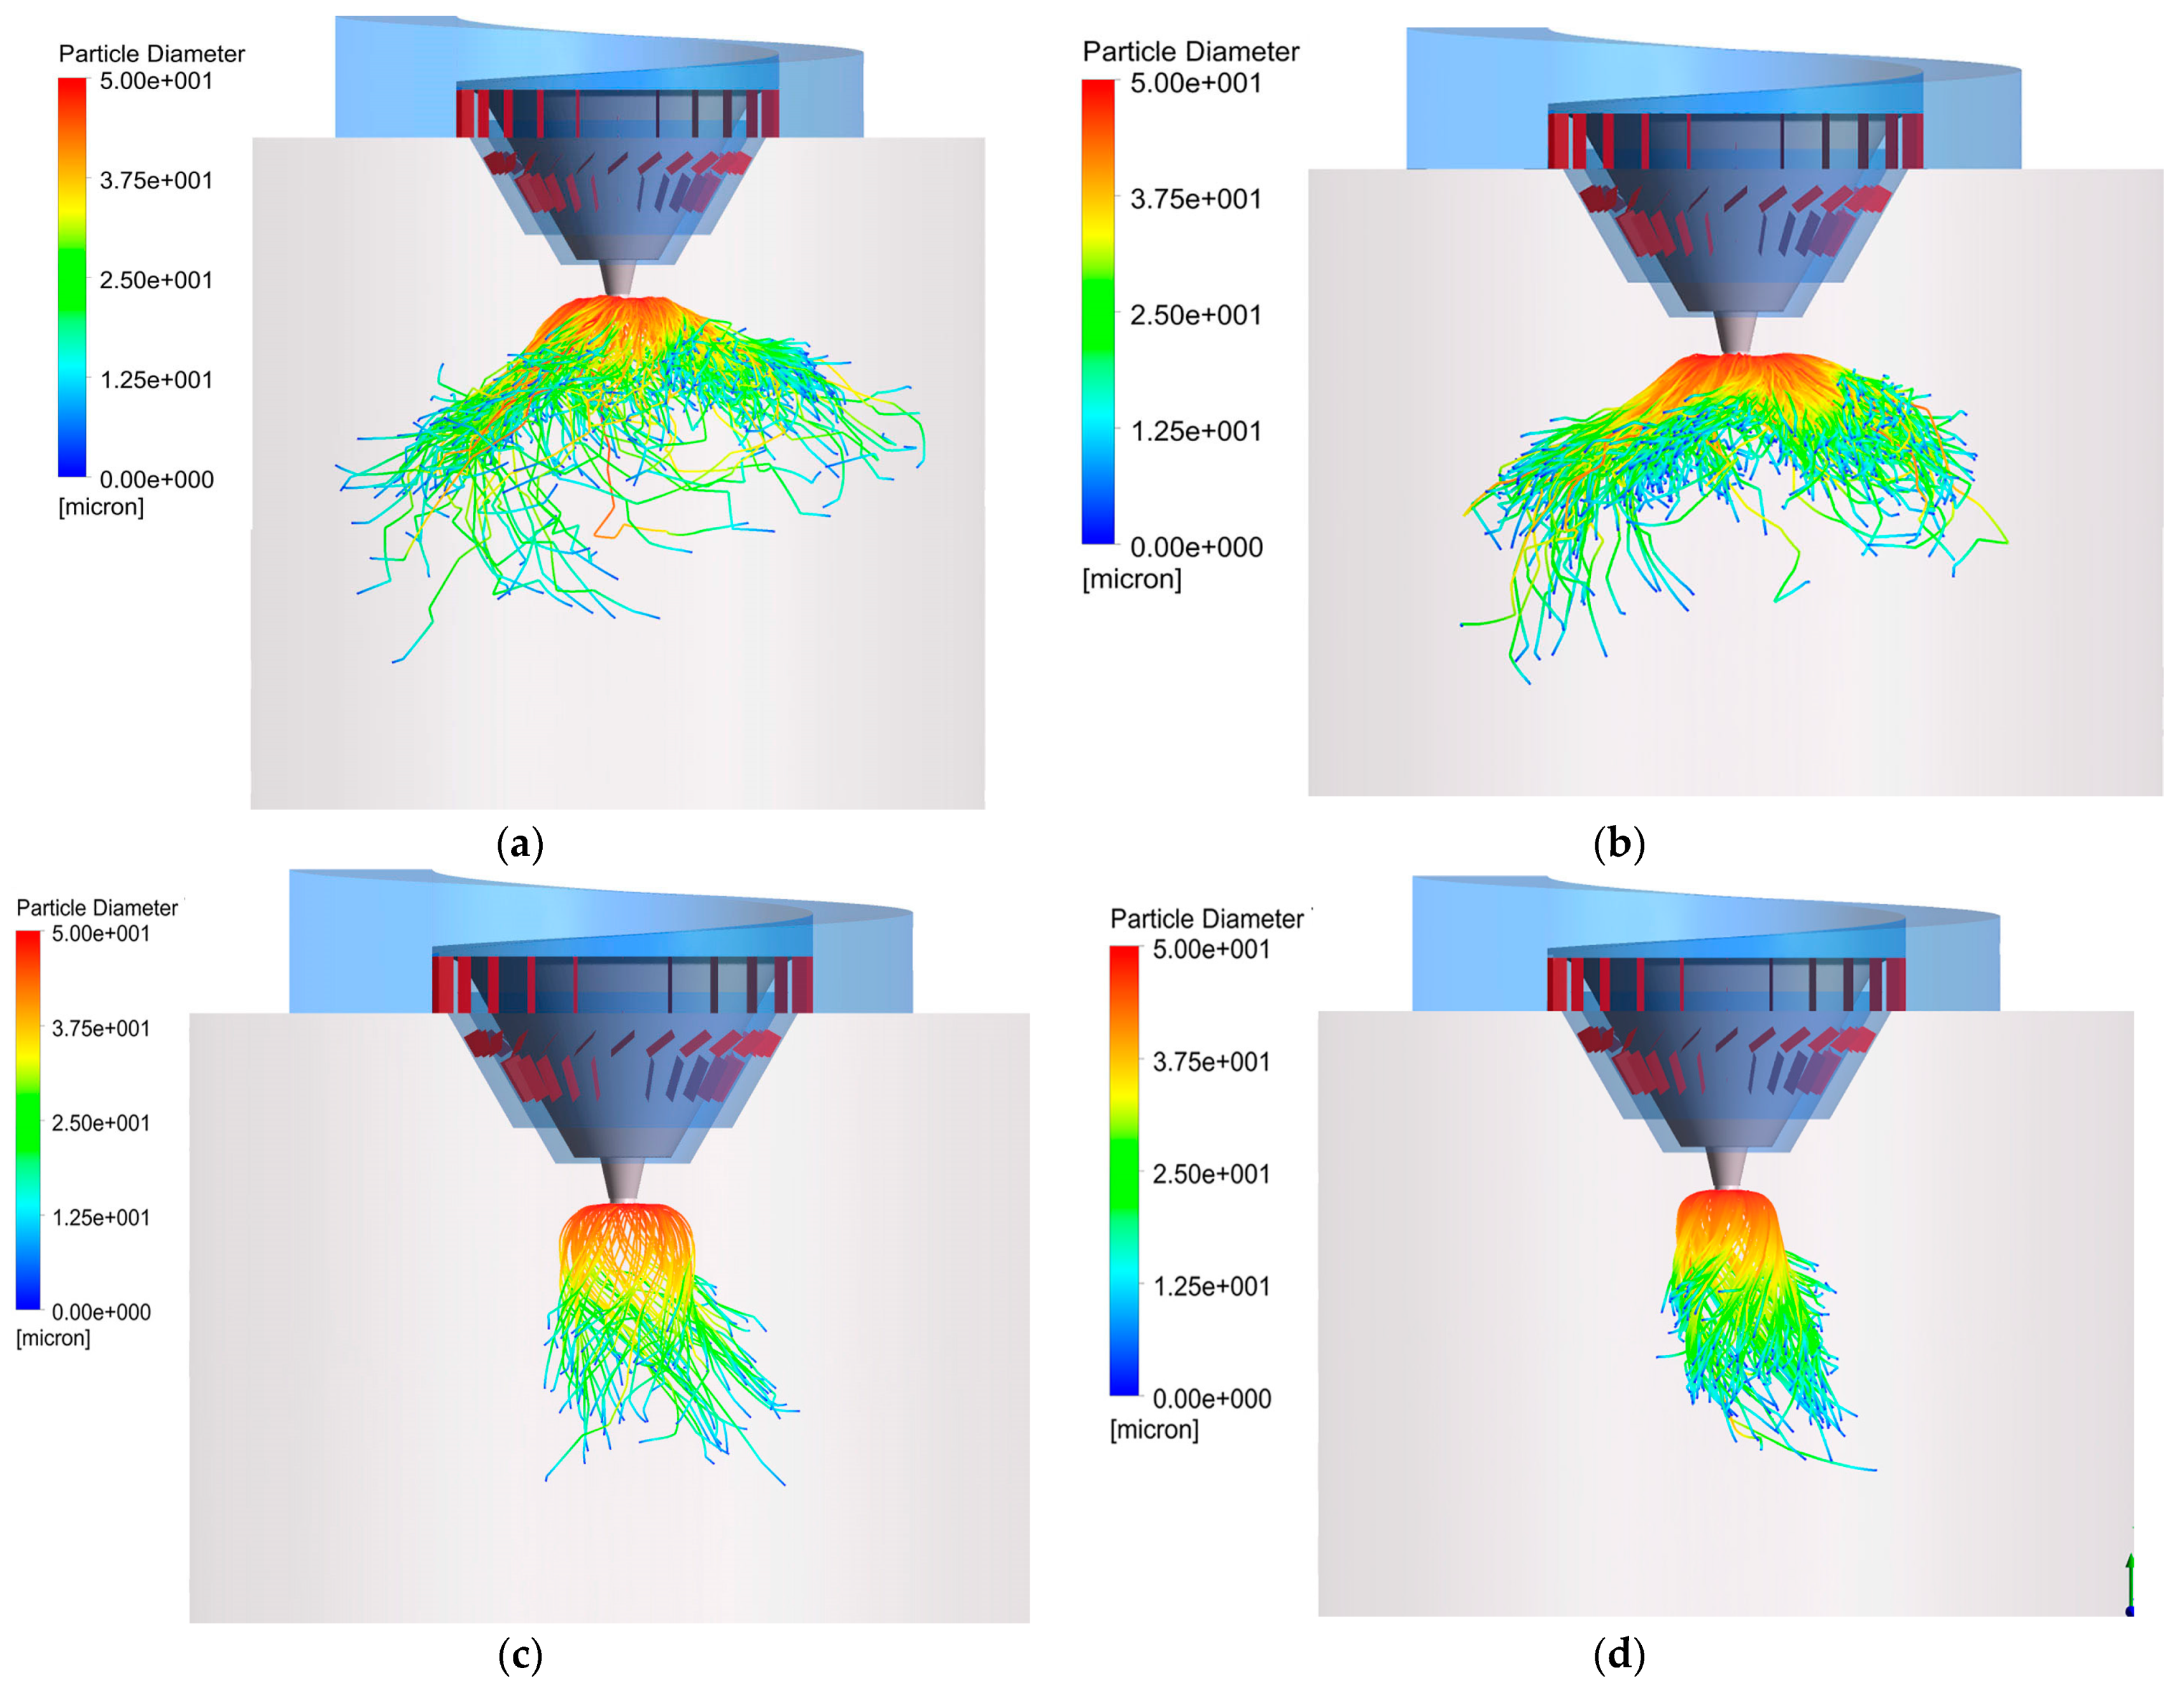
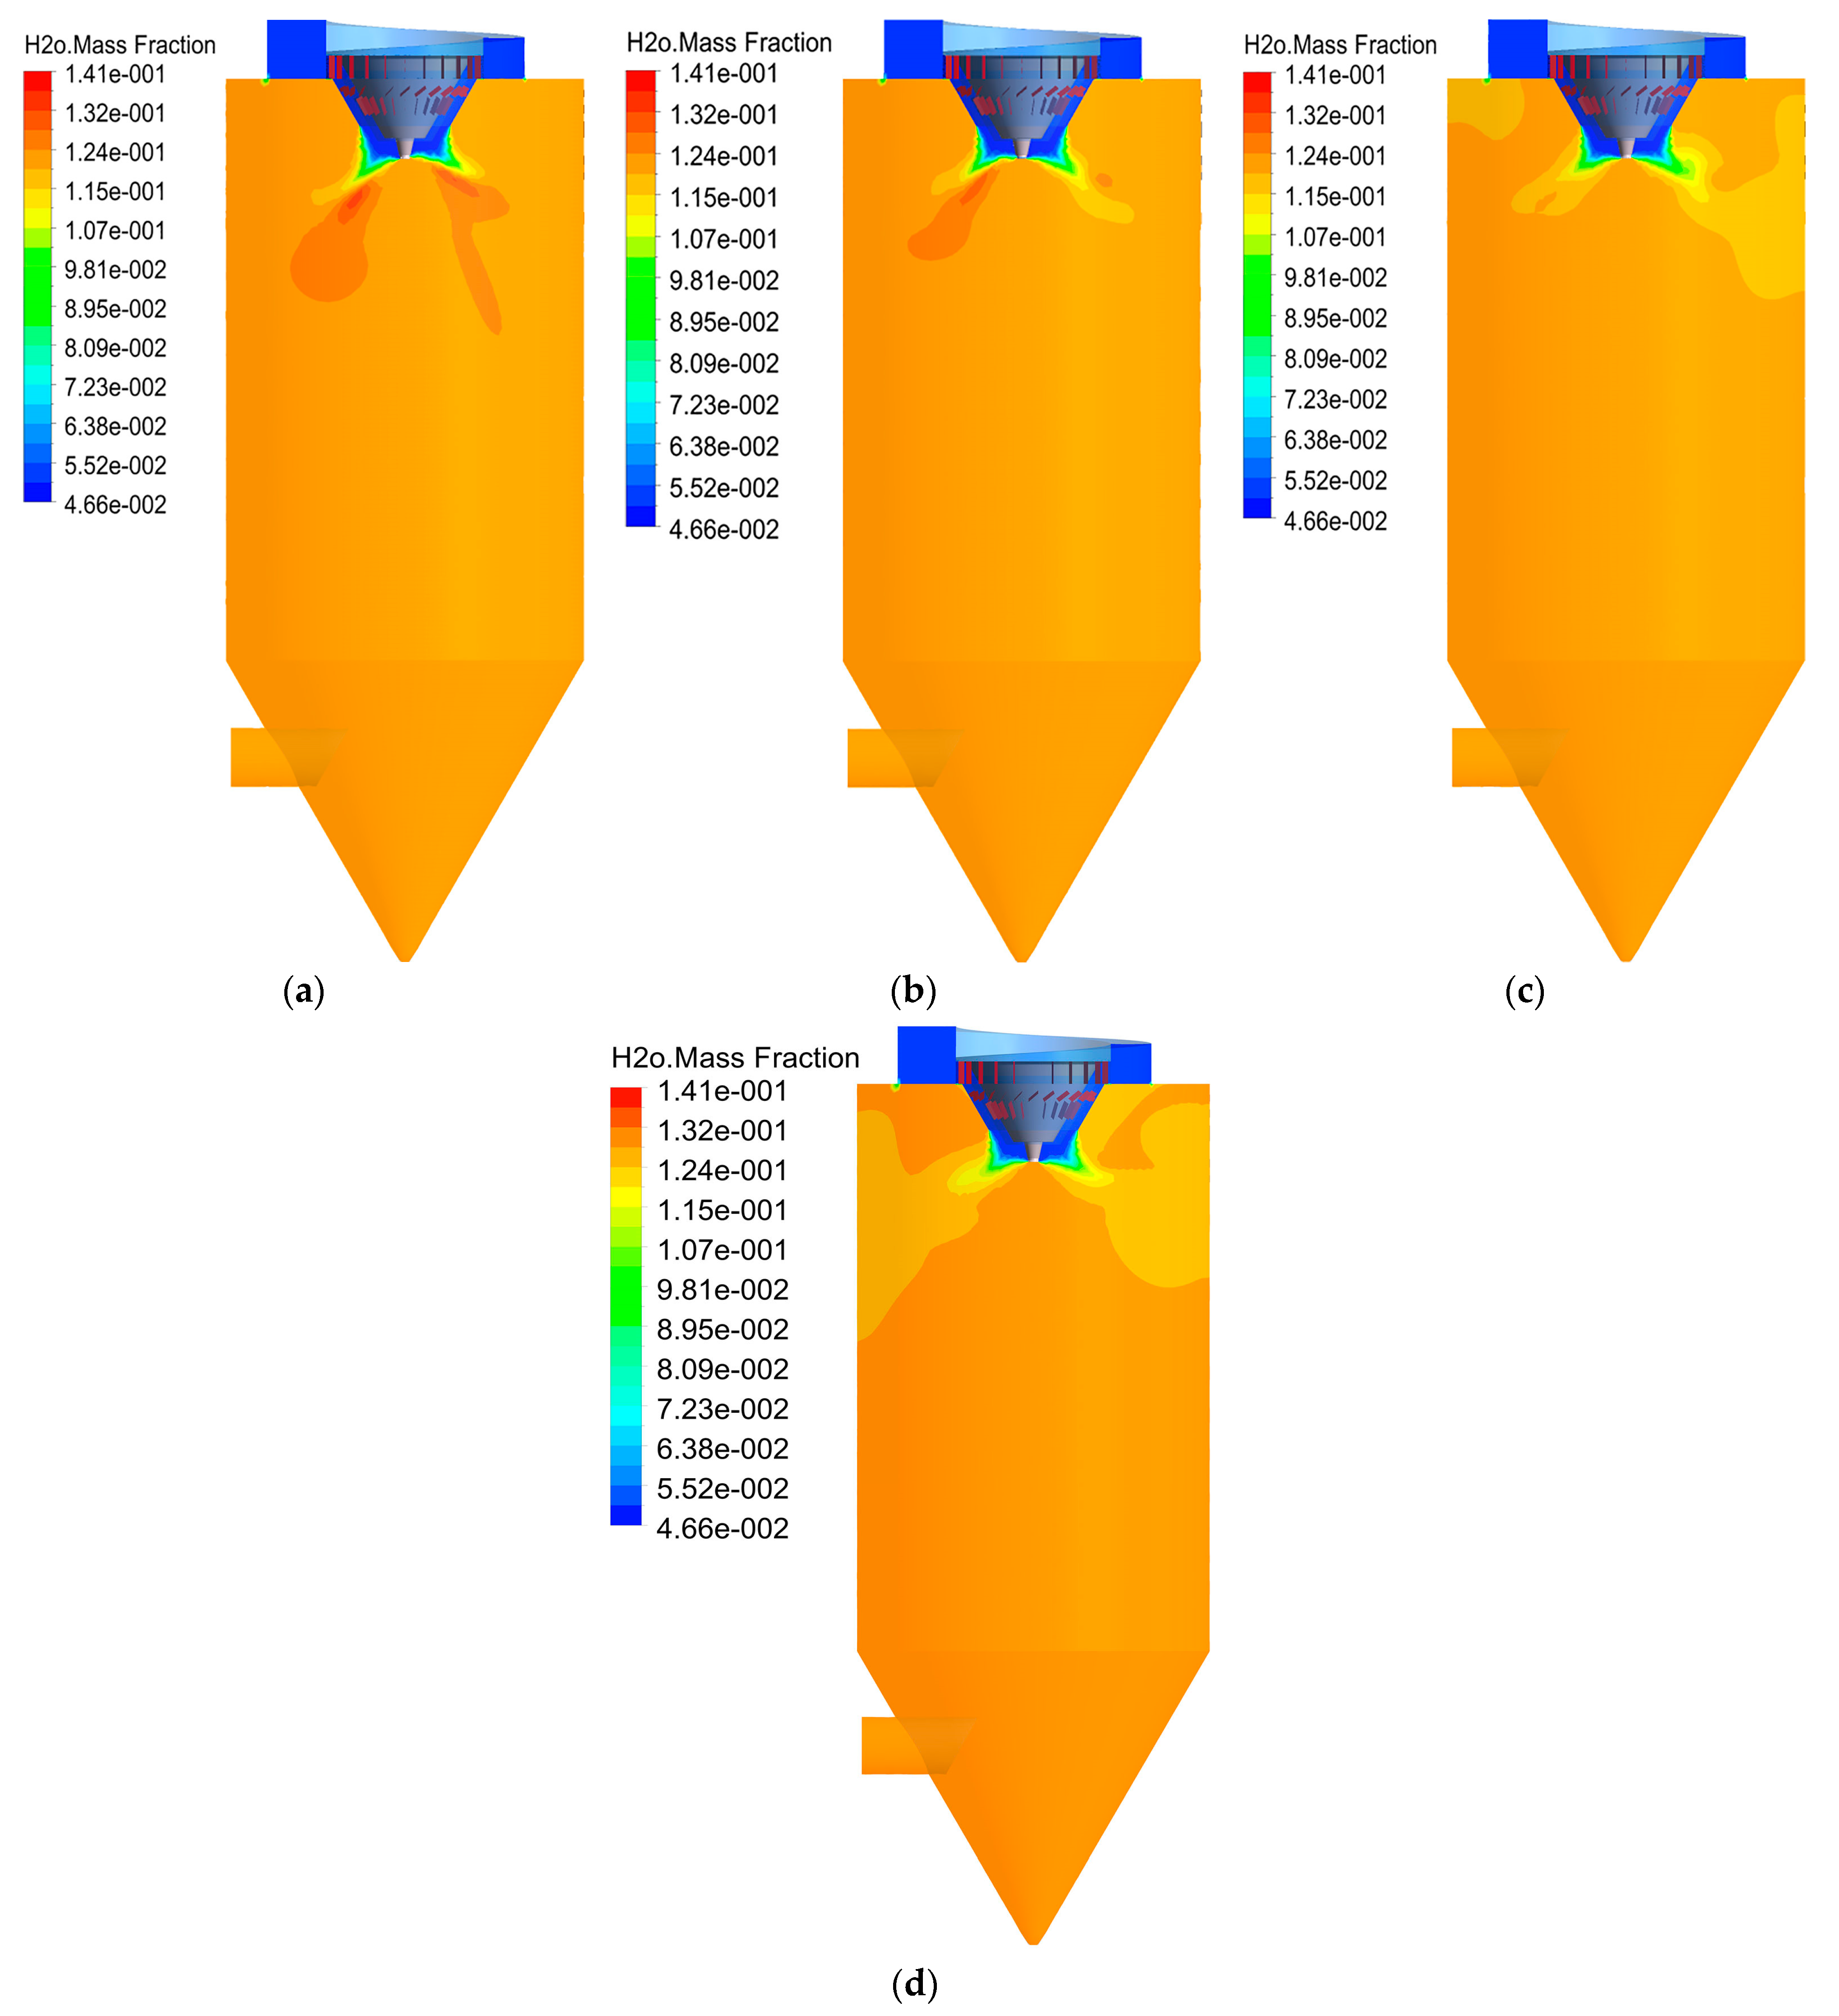
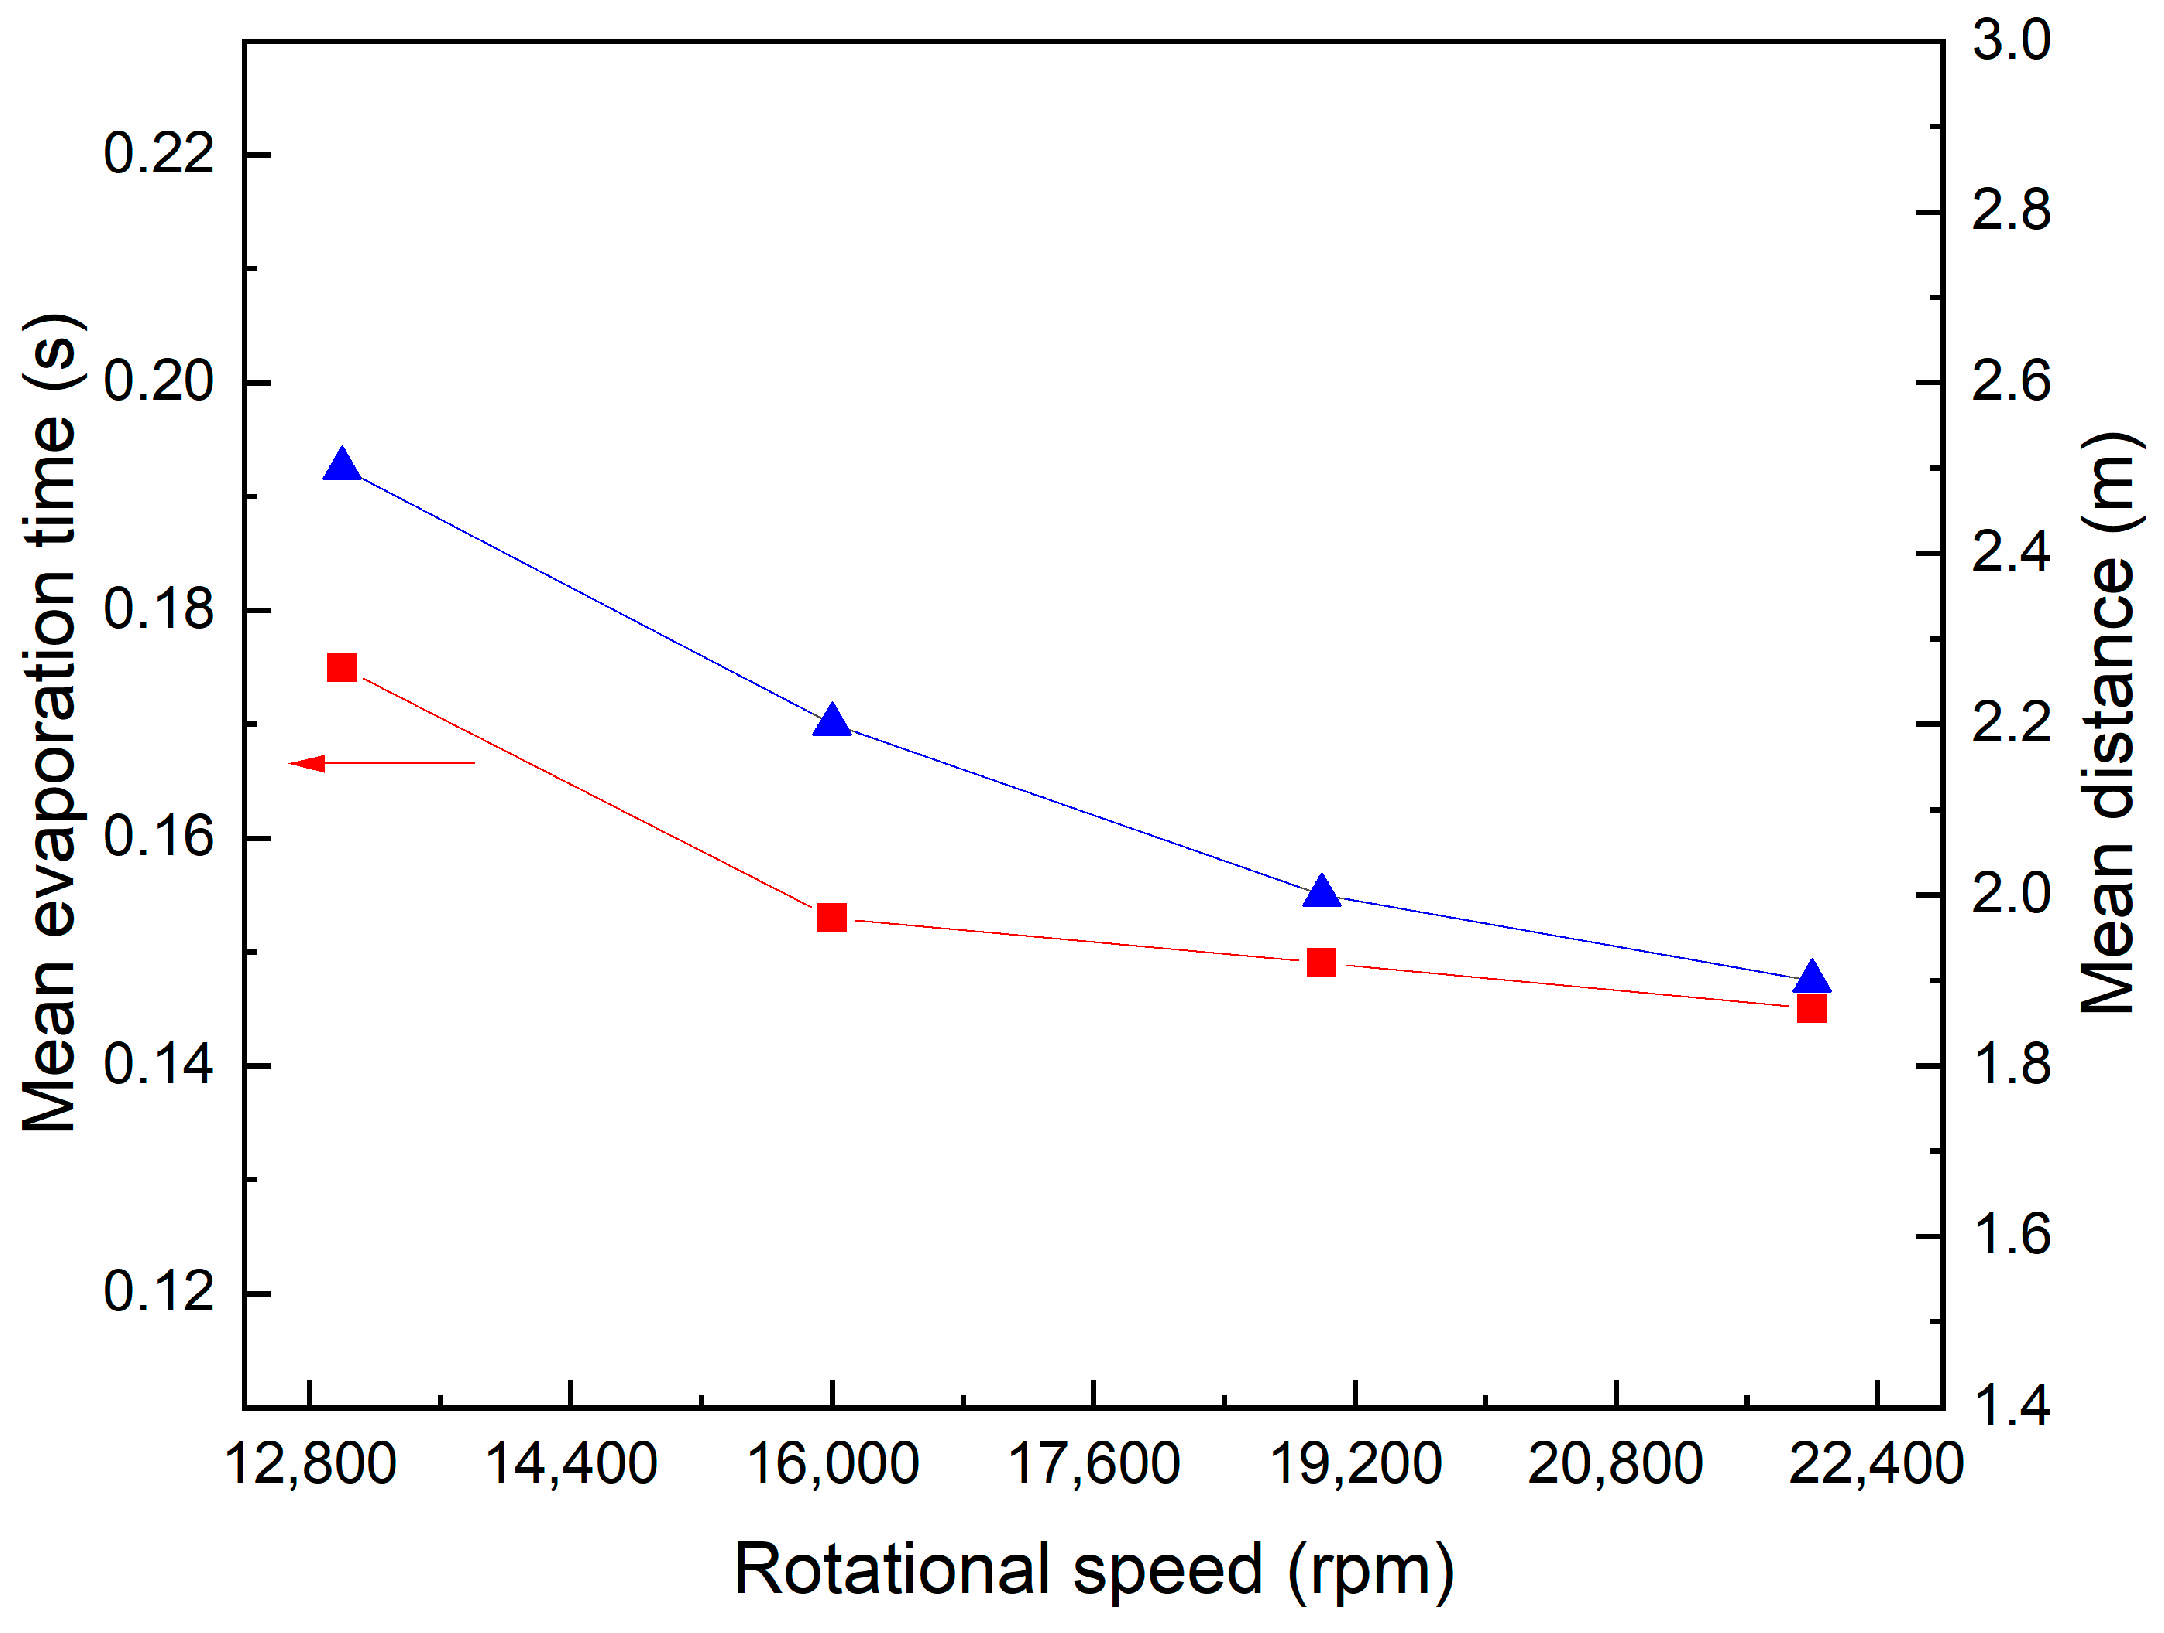
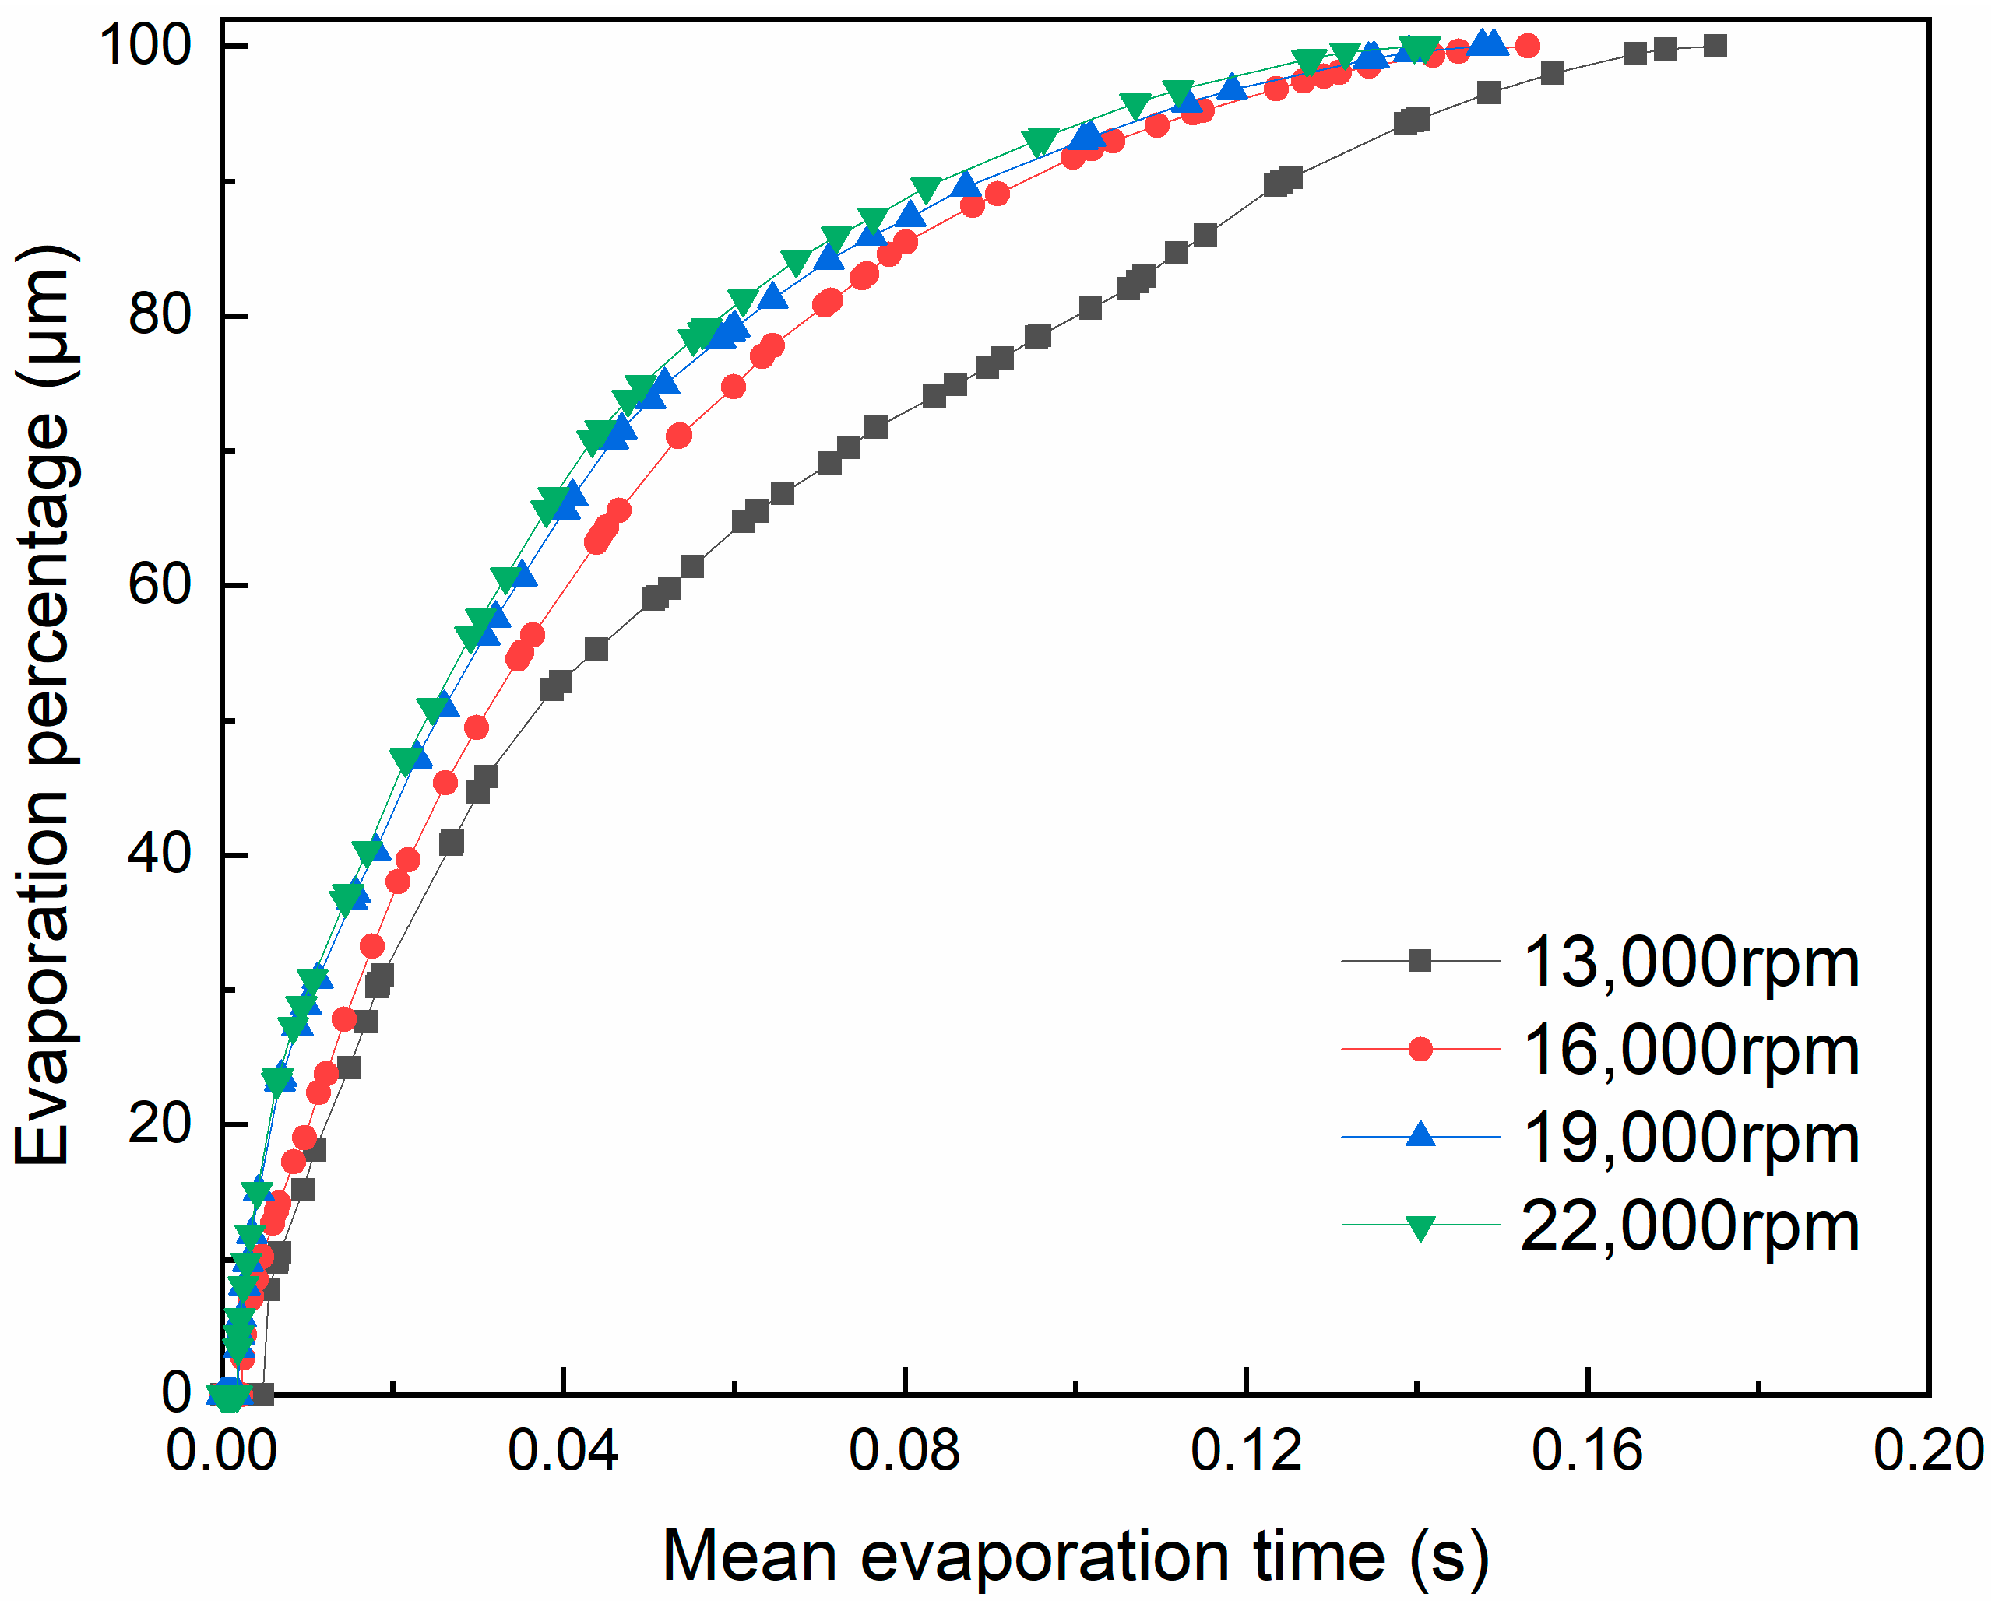
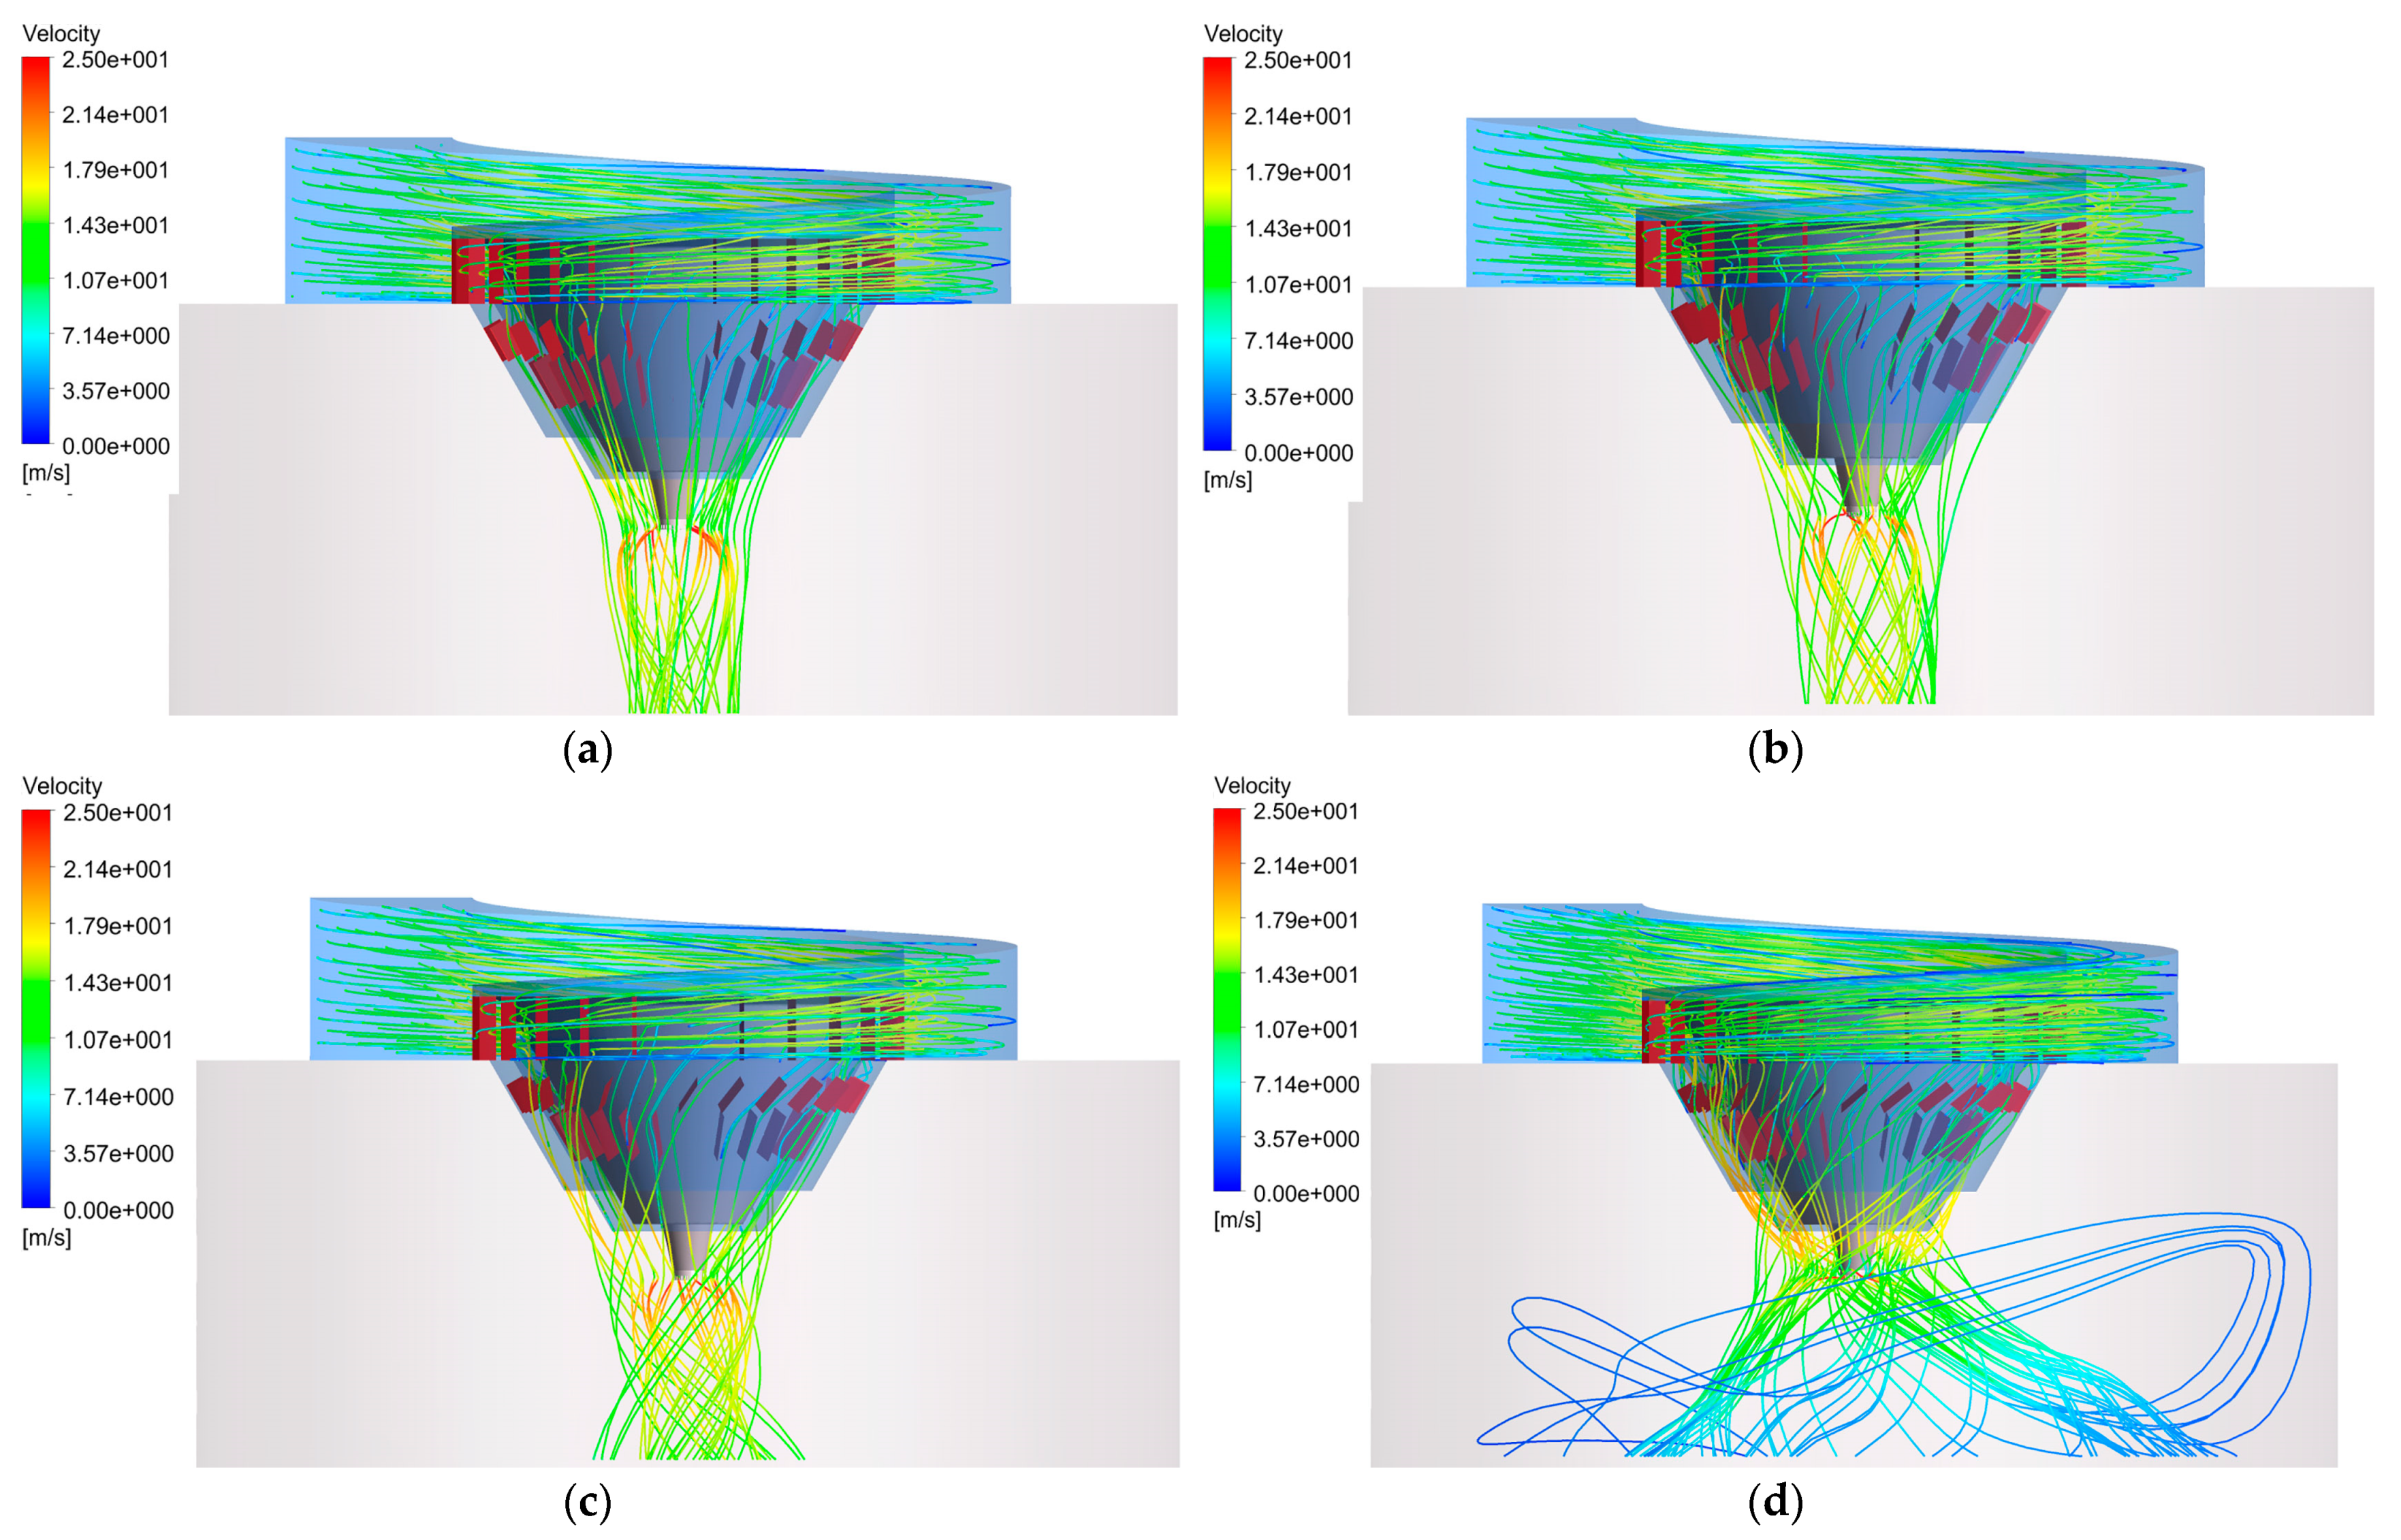
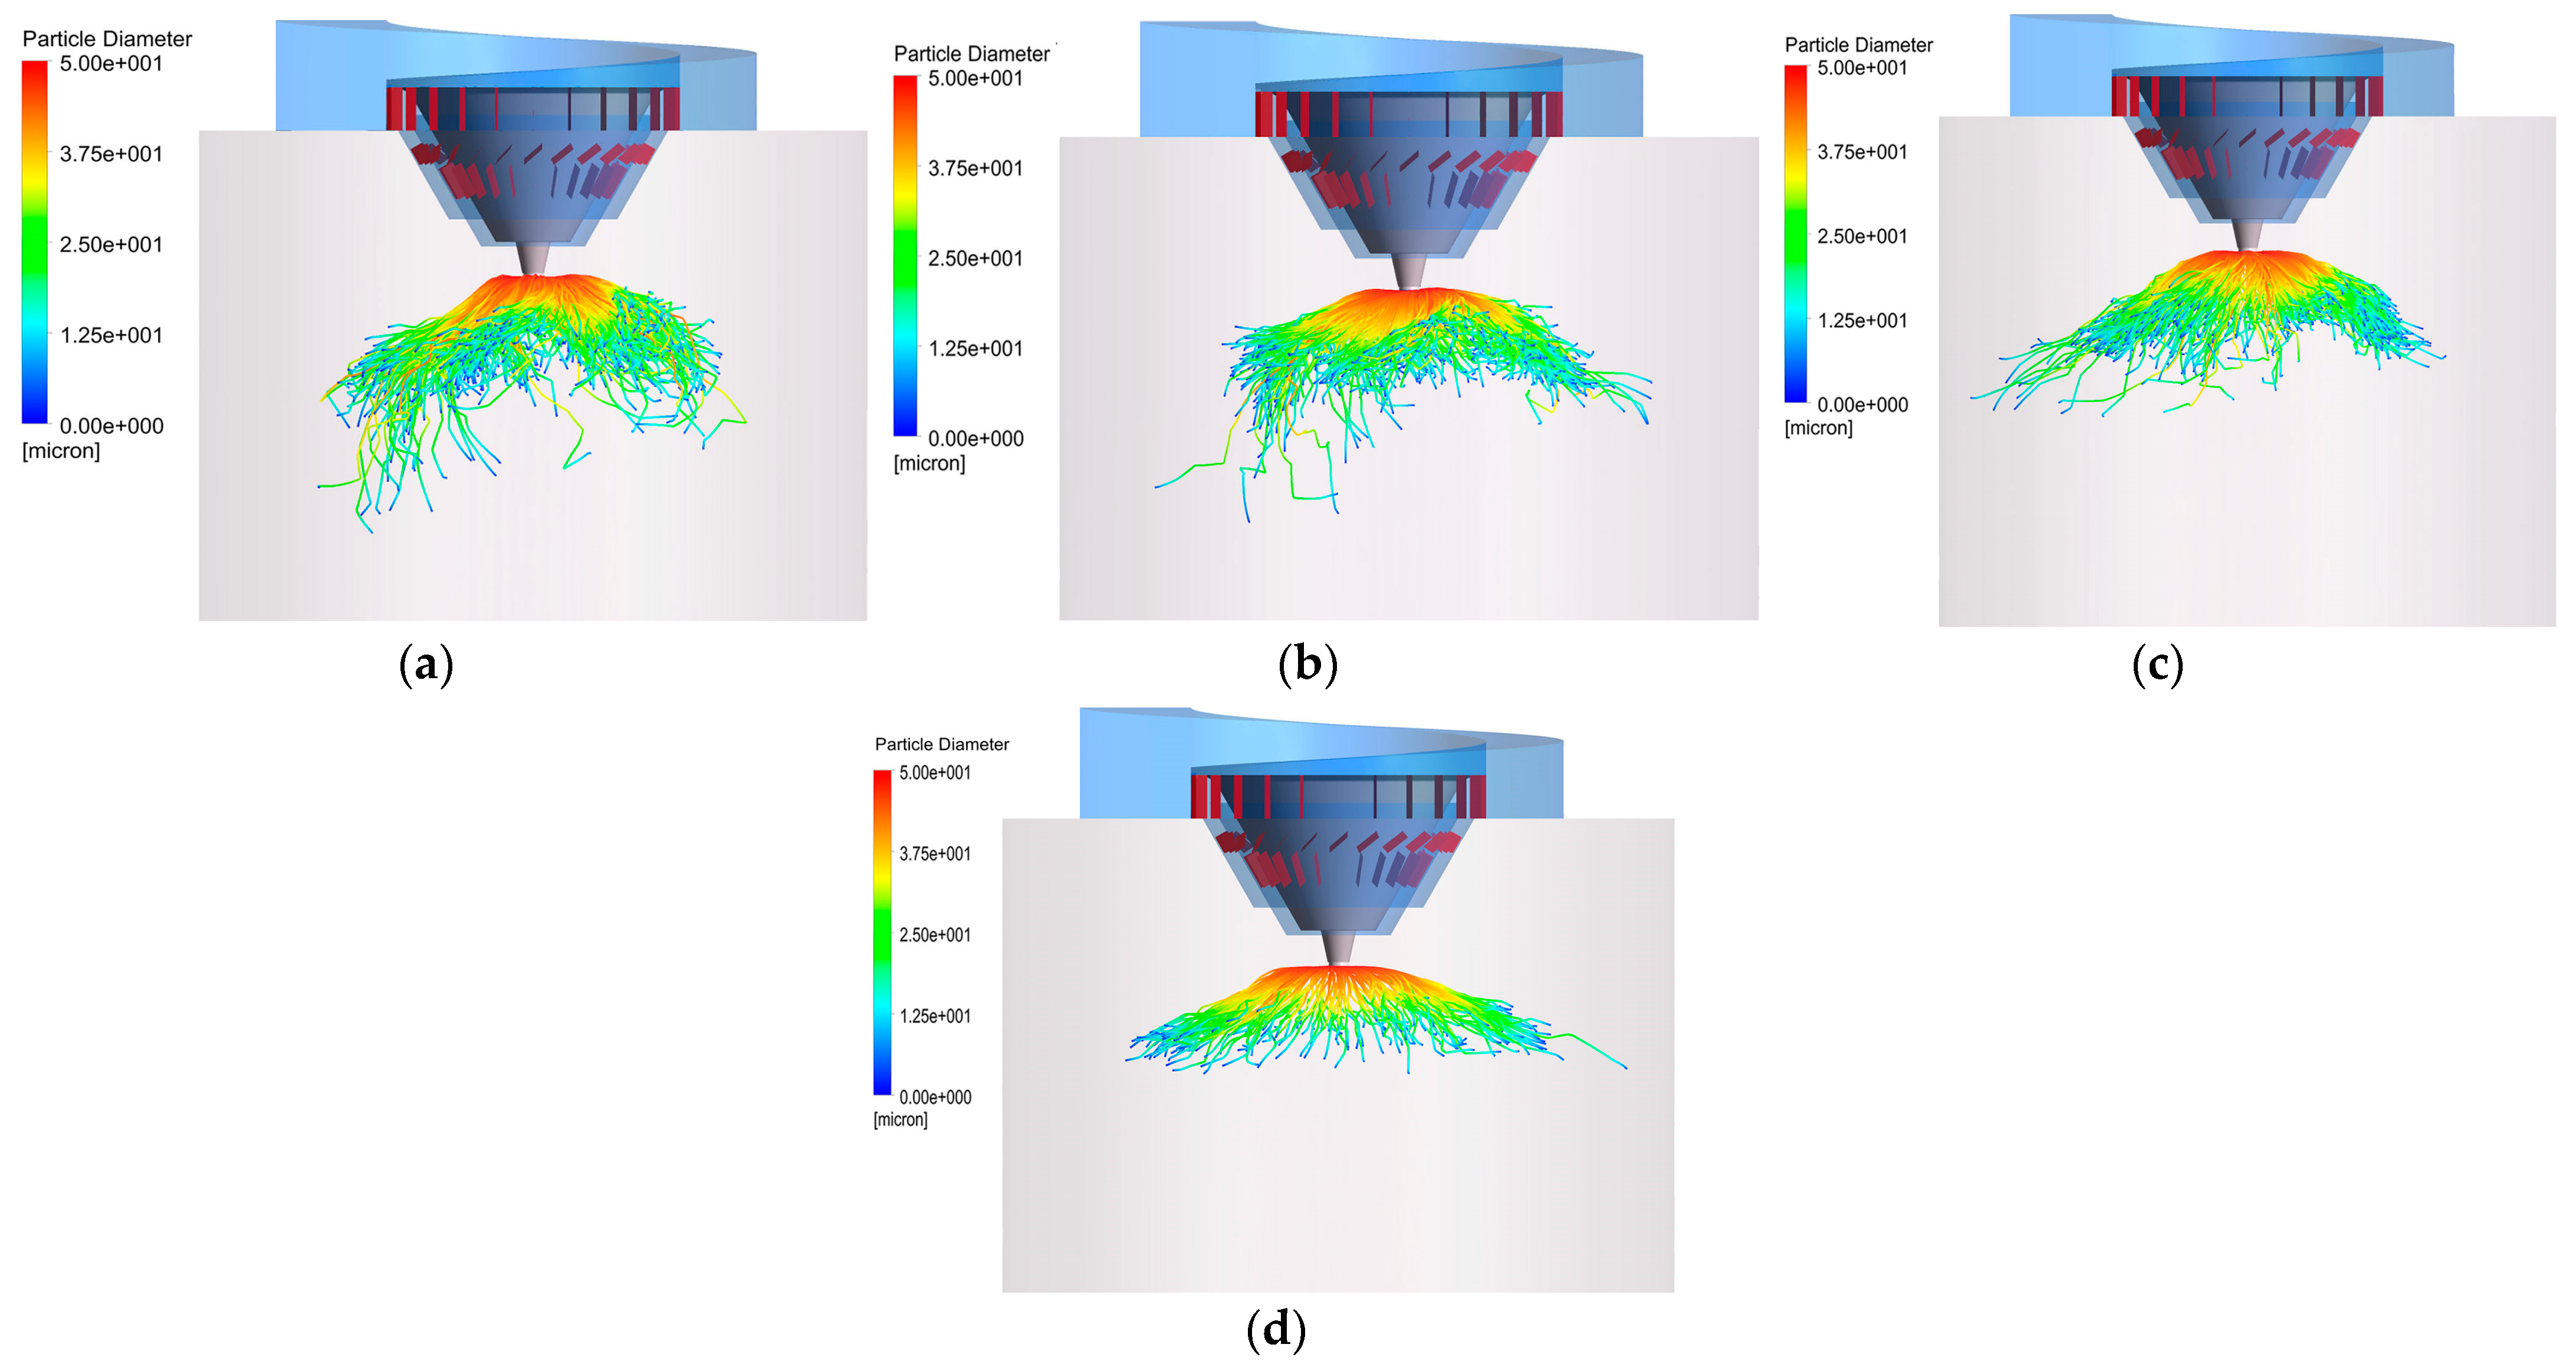
4.3. Effect of Rotational Speed
5. Conclusions
Author Contributions
Funding
Institutional Review Board Statement
Informed Consent Statement
Data Availability Statement
Acknowledgments
Conflicts of Interest
Nomenclature
| Roman symbols | |
| A | surface area of the particle (m2) |
| C | specific heat capacity (J·kg−1·K−1) |
| CD | drag coefficient |
| Ci,s | vapor concentration on the droplet surface (kmol·m−3) |
| Ci,g | vapor concentration in the main stream of gas (kmol·m−3) |
| d | diameter of the droplet (m) |
| D | diffusion coefficient (m2·s−1) |
| Di,m | diffusion coefficient of vapor (m2·s−1) |
| volume force (N) | |
| FD | drag force (N) |
| g | gravity acceleration (m·s−2) |
| h | convective heat transfer coefficient (J·m−2·K−1·s−1) |
| hlg | latent heat of vaporization (J·kg−1) |
| kc | mass transfer coefficient (m·s−1) |
| kg | thermal conductivity of gas (J·m−1·K−1·s−1) |
| m | mass of the droplet (kg) |
| Ni | molar flux (kmol·m−3·s−1) |
| Nu | Nusselt number (hdp/kg) |
| pij | gas pressure (Pa) |
| Rep | relative Reynolds number of gas and liquid () |
| Sc | Schmidt number |
| Sys | corresponding source (kg·m−3·s−1) |
| T | Temperature (K) |
| gas velocity (m·s−1) | |
| gas velocity vector (m·s−1) | |
| Ys | mass fraction of gas component s (%) |
| Greek symbols | |
| deflector angle (°) | |
| dynamic viscosity (mPa·s) | |
| density (kg·m−3) | |
| viscous dissipation function | |
| net mass production rate of component s (kg·m−3·s−1) | |
| Subscripts | |
| g | gas |
| p | droplets |
References
- Cui, W.; Li, J.; Xu, W.; Güneralp, B. Industrial electricity consumption and economic growth: A spatio-temporal analysis across prefecture-level cities in China from 1999 to 2014. Energy 2021, 222, 119932. [Google Scholar] [CrossRef]
- Suganthi, L.; Samuel, A.A. Energy models for demand forecasting—A review. Renew. Sustain. Energy Rev. 2012, 16, 1223–1240. [Google Scholar] [CrossRef]
- Wu, C.; Oh, K.; Long, X.; Zhang, J. Effect of installed capacity size on environmental efficiency across 528 thermal power stations in North China. Environ. Sci. Pollut. Res. 2019, 26, 29822–29833. [Google Scholar] [CrossRef]
- Chen, S.; Li, Y.; Yao, Q. The health costs of the industrial leap forward in China: Evidence from the sulfur dioxide emissions of coal-fired power stations. China Econ. Rev. 2018, 49, 68–83. [Google Scholar] [CrossRef]
- Han, L.; Zhou, W.; Li, W.; Qian, Y. Urbanization strategy and environmental changes: An insight with relationship between population change and fine particulate pollution. Sci. Total. Environ. 2018, 642, 789–799. [Google Scholar] [CrossRef]
- Iii, R.L.M.; Berndt, T.; Sipilä, M.; Paasonen, P.; Petäjä, T.; Kim, S.; Kurtén, T.; Stratmann, F.; Kerminen, V.-M.; Kulmala, M. A new atmospherically relevant oxidant of sulphur dioxide. Nat. Cell Biol. 2012, 488, 193–196. [Google Scholar] [CrossRef]
- Córdoba, P. Status of Flue Gas Desulphurisation (FGD) systems from coal-fired power plants: Overview of the physic-chemical control processes of wet limestone FGDs. Fuel 2015, 144, 274–286. [Google Scholar] [CrossRef]
- Córdoba, P. Partitioning and speciation of selenium in wet limestone flue gas desulphurisation systems: A review. Fuel 2017, 202, 184–195. [Google Scholar] [CrossRef] [Green Version]
- Shuangchen, M.; Jin, C.; Gongda, C.; Weijing, Y.; Sijie, Z. Research on desulfurization wastewater evaporation: Present and future perspectives. Renew. Sustain. Energy Rev. 2016, 58, 1143–1151. [Google Scholar] [CrossRef]
- Chen, S.-T.; Wickramasinghe, S.; Qian, X. High Performance Mixed-Matrix Electrospun Membranes for Ammonium Removal from Wastewaters. Membranes 2021, 11, 440. [Google Scholar] [CrossRef]
- Ng, S.M.; Idrus, S.; Ahsan, A.; Marzuki, T.T.M.; Mahat, S. Treatment of Wastewater from a Food and Beverage Industry Using Conventional Wastewater Treatment Integrated with Membrane Bioreactor System: A Pilot-Scale Case Study. Membranes 2021, 11, 456. [Google Scholar] [CrossRef]
- Shi, Y.; Wang, Z.; Du, X.; Gong, B.; Jegatheesan, V.; Haq, I. Recent Advances in the Prediction of Fouling in Membrane Bioreactors. Membranes 2021, 11, 381. [Google Scholar] [CrossRef] [PubMed]
- Higgins, T.E.; Sandy, A.T.; Givens, S.W. Flue Gas Desulfurization Wastewater Treatment Primer; OSTI: Oak Ridge, TN, USA, 2009. [Google Scholar]
- Wales, M.; Gebremichael, E.; Wang, X.; Perea, E.; Jayaweera, P.; Jayaweera, I. Flue Gas Desulfurization (FGD) Wastewater Treatment Using Polybenzimidazole (PBI) Hollow Fiber (HF) Membranes. Membranes 2021, 11, 430. [Google Scholar] [CrossRef]
- Ali, M. Nanofiltration Process for Enhanced Treatment of RO Brine Discharge. Membranes 2021, 11, 212. [Google Scholar] [CrossRef] [PubMed]
- Yang, F.; Huang, Z.; Huang, J.; Wu, C.; Zhou, R.; Jin, Y. Tanning Wastewater Treatment by Ultrafiltration: Process Efficiency and Fouling Behavior. Membranes 2021, 11, 461. [Google Scholar] [CrossRef] [PubMed]
- Beaulieu, M.; Perreault, V.; Mikhaylin, S.; Bazinet, L. How Overlimiting Current Condition Influences Lactic Acid Recovery and Demineralization by Electrodialysis with Nanofiltration Membrane: Comparison with Conventional Electrodialysis. Membranes 2020, 10, 113. [Google Scholar] [CrossRef]
- Jia, F.; Wang, J. Treatment of flue gas desulfurization wastewater with near-zero liquid discharge by nanofiltration-membrane distillation process. Sep. Sci. Technol. 2017, 53, 146–153. [Google Scholar] [CrossRef]
- Liang, Z.; Cheng, X.; Zhang, L.; Yang, Z.; Ran, J.; Ding, L. Study of Main Solutes on Evaporation and Crystallization Processes of the Desulfurization Wastewater Droplet. Energy Fuels 2018, 32, 6119–6129. [Google Scholar] [CrossRef]
- Teng, X. A Pilot Demonstration of Spray Dryer Evaporation as a Method to Treat Power Plant FGD Wastewater; Southern Company: Birmingham, UK, 2012. [Google Scholar]
- Ma, S.; Chai, J.; Wu, K.; Wan, Z.; Xiang, Y.; Zhang, J.; Fan, Z. Experimental and mechanism research on volatilization characteristics of HCl in desulfurization wastewater evaporation process using high temperature flue gas. J. Ind. Eng. Chem. 2018, 66, 311–317. [Google Scholar] [CrossRef]
- Ma, S.; Chai, J.; Wu, K.; Xiang, Y.; Jia, S.; Li, Q. Experimental research on bypass evaporation tower technology for zero liquid discharge of desulfurization wastewater. Environ. Technol. 2018, 40, 2715–2725. [Google Scholar] [CrossRef] [PubMed]
- Ceidk, P.; Flikova, I. Some Aspects of Spray Formation by Pneumatic Nozzles. Dry. Technol. 1985, 3, 101–118. [Google Scholar] [CrossRef]
- Liang, Z.; Zhang, L.; Yang, Z.; Qiang, T.; Pu, G.; Ran, J. Evaporation and crystallization of a droplet of desulfurization wastewater from a coal-fired power plant. Appl. Therm. Eng. 2017, 119, 52–62. [Google Scholar] [CrossRef]
- Kim, H.; Sung, N. The effect of ambient pressure on the evaporation of a single droplet and a spray. Combust. Flame 2003, 135, 261–270. [Google Scholar] [CrossRef]
- Huang, L.; Kumar, K.; Mujumdar, A.S. Use of Computational Fluid Dynamics to Evaluate Alternative Spray Dryer Chamber Configurations. Dry. Technol. 2003, 21, 385–412. [Google Scholar] [CrossRef]
- Huang, L.X.; Passos, M.L.; Kumar, K.; Mujumdar, A.S. A Three-Dimensional Simulation of a Spray Dryer Fitted with a Rotary Atomizer. Dry. Technol. 2005, 23, 1859–1873. [Google Scholar] [CrossRef]
- Zhang, S.; Liu, N.; Pan, Y.; Wang, W.; Li, Y.; Zhu, Y. Three-dimensional modelling of two-phase flow and transport in a pilot centrifugal spray dryer. Chem. Phys. Lett. 2021, 765, 138309. [Google Scholar] [CrossRef]
- Ye, X.; Zhang, C.; Wang, S.; Yang, D.; Guo, B.; An, X.; Yu, A. Simulation of desulphurization wastewater evaporation through flue gas. Powder Technol. 2020, 361, 462–472. [Google Scholar] [CrossRef]
- Gradinger, T.; Boulouchos, K. A zero-dimensional model for spray droplet vaporization at high pressures and temperatures. Int. J. Heat Mass Transf. 1998, 41, 2947–2959. [Google Scholar] [CrossRef]
- Ma, S.; Feng, C.; Wu, W.; Hua, J.; Yu, W.J.C.; Chemistry, A. The numerical simulation of flue gas desulphurization wastewater spray evaporation. Comput. Appl. Chem. 2016, 33, 47–53. [Google Scholar]
- Zhang, H. Numerical research on a vaporizing fuel droplet in a forced convective environment. Int. J. Multiph. Flow 2004, 30, 181–198. [Google Scholar] [CrossRef]
- Javed, K.; Mahmud, T.; Purba, E. Enhancement of Mass Transfer in a Spray Tower Using Swirling Gas Flow. Chem. Eng. Res. Des. 2006, 84, 465–477. [Google Scholar] [CrossRef]
- Wilson, M.; Pilbrow, R.; Owen, J.M. Flow and Heat Transfer in a Preswirl Rotor–Stator System. J. Turbomach. 1997, 119, 364–373. [Google Scholar] [CrossRef]
- Jubaer, H.; Afshar, S.; Le Maout, G.; Mejean, S.; Selomulya, C.; Xiao, J.; Chen, X.D.; Jeantet, R.; Woo, M.W. The impact of self-sustained oscillations on particle residence time in a commercial scale spray dryer. Powder Technol. 2020, 360, 1177–1191. [Google Scholar] [CrossRef]
- Wu, Y.H.; Yu, X.; Siew, P.F. Numerical Simulation of Fluid-Solid Two-Phase Flows at Particle Level. In Advances in Scientific Computing and Applications; Science Press: Beijing, China, 2004. [Google Scholar]
- Villars, P.; Cenzual, K.; Gladyshevskii, R. Handbook of Inorganic Substances; De Gruyter: Berlin, Germany, 2015; ISBN 101515/9783110311747. [Google Scholar]


| Fluid | Parameter | Value |
|---|---|---|
| Flue gas | Velocity (m/s) | 13.25 |
| Volume flow (Nm3/h) | 30,000 | |
| Temperature (K) | 613 | |
| Volume fraction of each component (%) | ||
| N2 | 3.00 | |
| O2 | 75.26 | |
| CO2 | 13.60 | |
| H2O | 8.14 | |
| Desulfurization wastewater | component | 8 wt% NaCl solution |
| Temperature (K) | 323 | |
| Gas–liquid ratio (m3/Nm3) | 10,000 | |
| Rotational speed (rpm) | 13,000 | |
| Average droplet size (μm) | 50 |
| Load/MW | Volume Flow of Flue Gas/(t/h) | Inlet Flue Gas Temperature/K | Volume Flow of Wastewater/(t/h) | Inlet Wastewater Temperature/K |
|---|---|---|---|---|
| 250 | 18.31 | 600 | 1.2 | 323 |
| 280 | 21.17 | 603 | 1.26 | 323 |
| 330 | 19.98 | 599 | 1.33 | 323 |
| 400 | 29.3 | 629 | 2.01 | 323 |
| Load/MW | Measurement T/K | Simulation T/K | Relative Error/% | Measurement W/% | Simulation W/% | Relative Error/% |
|---|---|---|---|---|---|---|
| 250 | 431 | 436 | −1.16 | 11.28 | 11.52 | −2.13 |
| 280 | 429 | 440 | −2.56 | 11.28 | 10.92 | 3.21 |
| 330 | 429 | 435 | −1.40 | 11.84 | 11.63 | 1.77 |
| 400 | 435 | 422 | 3 | 12.1 | 11.83 | 2.63 |
Publisher’s Note: MDPI stays neutral with regard to jurisdictional claims in published maps and institutional affiliations. |
© 2021 by the authors. Licensee MDPI, Basel, Switzerland. This article is an open access article distributed under the terms and conditions of the Creative Commons Attribution (CC BY) license (https://creativecommons.org/licenses/by/4.0/).
Share and Cite
Zhao, N.; Feng, Y.; Li, D.; Li, Z. Simulation Study on Centrifugal Spray Evaporation Characteristics and Process Optimization of Desulfurization Wastewater. Coatings 2021, 11, 837. https://doi.org/10.3390/coatings11070837
Zhao N, Feng Y, Li D, Li Z. Simulation Study on Centrifugal Spray Evaporation Characteristics and Process Optimization of Desulfurization Wastewater. Coatings. 2021; 11(7):837. https://doi.org/10.3390/coatings11070837
Chicago/Turabian StyleZhao, Ning, Yongxin Feng, Debo Li, and Zongkun Li. 2021. "Simulation Study on Centrifugal Spray Evaporation Characteristics and Process Optimization of Desulfurization Wastewater" Coatings 11, no. 7: 837. https://doi.org/10.3390/coatings11070837
APA StyleZhao, N., Feng, Y., Li, D., & Li, Z. (2021). Simulation Study on Centrifugal Spray Evaporation Characteristics and Process Optimization of Desulfurization Wastewater. Coatings, 11(7), 837. https://doi.org/10.3390/coatings11070837