Abstract
The low nitrogen utilization efficiency (NUE) of commercial fertilizers is one of the main hurdles in higher crop production and reduction of fertilizer N losses to the environment. However, interactions between most the macronutrients could have synergistic outcomes that affect crop NUE. The coating of urea with macronutrients and biopolymers may control N release and synergistically impact its crop NUE. In this study, urea was coated with 3% of different polymers, combined with 5% potassium iodide (KI) (i) Gum Arabica (GA + KI), (ii) polyvinyl alcohol (PVA + KI), and (iii) gelatin (Gelatin + KI) to control its N release, leaching, and increase of wheat NUE. Scanning electron microscopy, Fourier Transform Infrared spectroscopy (FTIR), and X-ray diffraction (XRD) analyses confirmed the successful coating of all KI and biopolymer combinations on urea granules. All coating combinations slowed down urea release in water and reduced its leaching from the soil, but the highest reduction in both parameters was observed with the GA + KI treatment, compared to the uncoated urea. After soil application, GA + KI decreased urea leaching by 26% than the uncoated urea in lysimeter. In the field, soil mineral N remained significantly high with the GA + KI and PVA + KI treatments at the wheat tillering, booting, grain filling and maturity stages, compared to the uncoated urea. However, K content was only high (28%) with the GA + KI treatment at final harvest. Likewise, microbial biomass N was only high with GA + KI at grain filling (20%) and maturity stages (24%) than the uncoated urea. Such synchronized N availability led to high wheat grain yield (28%), N (56%) uptake, and apparent N recovery (130%) with the GA + KI treatment, compared to the uncoated fertilizer. The increment in NUE with GA + KI could be due to the synergistic effect of K on N availability; therefore, we observed higher wheat yield and N utilization efficiency with this treatment. Hence, urea coated with macronutrient (K) plus biopolymer is recommended to improve wheat yield, NUE, and for reduction of environmental N losses.
1. Introduction
Improving nutrient use efficiency and decreasing nutrient losses from fertilizers are mandatory for increasing crop productivity and conserving environmental sustainability. Among the nutrients required for normal plant growth, nitrogen (N) is the most limiting nutrient worldwide [1]. Synthetic N fertilizers are used in agriculture to cope with this problem. According to an estimate, the use of synthetic N fertilizers enhanced global food production by 30–50% [2]. Consequently, N fertilizers’ demand increased globally by 6.67% from 2016 to 2022 [3]. Among N fertilizers, urea is predominantly used (73.4% of the N fertilizer) [4]. The dynamic nature of N in urea and other N fertilizers makes it susceptible to environmental losses; therefore, effective management is required to keep this nutrient in the soil–plant system. Under favorable conditions, more than 50% of the applied N from urea is volatilized [5], 30% can be leached down, runoff, or nitrified [6], and a further ˃30% is denitrified to the environment [7]. Hence, plants use only 30–60% of N applied through urea [6,8]; therefore, N use efficiency (NUE) of crops from conventional urea varies from 30–60%, which is very low [6,8] and could lead to economic losses for farmers.
The adoption of optimal management practices and new approaches can maximize NUE and crop productivity [9]. Therefore, researchers particularly engaged in businesses related to fertilizers are introducing new technologies for reducing N losses and improving NUE from applied urea [10]. Controlled N release from urea can increase the efficient use of fertilizer by plants, as well as reduce the negative effects that are damaging to the ecosystem [8,11,12]. A slow release urea fertilizer was purposely designed to release N in a controlled and delayed manner, one that could synchronize with plant N need [13]. By using the aforesaid fertilizers, expected crop yield can be achieved, even by reducing recommended fertilizer rate by 20–30% [14], which is economically beneficial by saving time, energy, and labor [15]. Thus, urea encapsulation (coating) can be suitable for minimizing N losses through NH3, N2O, and NO3 leaching and improving crop NUE [16].
Coating materials behave as a sealing agent since they form a physical barrier on the surface of the fertilizer granule, preventing water penetration into its center, and controlling the urea/N release from the fertilizer [17]. Therefore, various coating materials i.e., bio-based polyurethane [18], starch [17], cellulose [19], and lignin [20], are being utilized for coating on urea and other chemical fertilizers. However, due to poor thermo-physical and mechanical properties, the modification of these products with a suitable stabilizing or plasticizing agent is compulsory [21]. Polymer coating materials i.e., polystyrene [22], polyurethane [18], polyethylene [23], polyether sulfone [24], and polyacrylamide [25] are considered promising stabilizing or plasticizing agents and utilized for improving the controlled release of urea. However, decomposition of these plasticizing compounds in the soil is problematic; therefore, these compounds persist for a longer time period and become a source of soil pollution [26]. To avoid this problem, biopolymeric compounds like lignin [20], starch [17], cellulose [19], Gum Arabica, honey wax, and paraffin oil are being utilized as coating materials [10,11,21,27,28]. However, many of these compounds are costly, non-resilient, and do not offer any additional benefits to the soil or plants.
Inorganic materials such as sulfur and zinc are also being utilized for coating purposes [29,30]. Sulfur has the ability to decrease urea dissolution [30], is essential for crop growth, and can also decrease the alkalinity of the soil [10]. However, its non-uniform coating surface, low granular adhesion, wettability, and acidity causing nature makes it an ineffective coating material, prompting scientists to look for the alternative solutions to overcome sulfur coating associated problems [10,12]. Equally, the utilization of Zn as a coating material is also beneficial since this can also serve as a crop micronutrient and at the same time inhibit urease enzyme activity to slow release of N from urea fertilizer [29]. Like micronutrients, macronutrients can also be used as coating material for commercial fertilizers. This is because the interaction between two or more nutrients could have a synergistic (positive), antagonistic (negative), or no influence on the availability and crop uptake of the other nutrients [31,32]. Consequently, a coating macronutrient i.e., P or K, on urea may synergistically influence the availability of N in the soil and synchronize that with crop uptake. The macronutrient K is an essential nutrient required for crop growth and development, like micronutrients zinc and sulfur [33,34]. Therefore, like Zn and S [30,35], K can also be used as a coating agent to supply this macronutrient with urea. However, to the best of our knowledge, a macronutrient such as potassium (K) has not been tested as a coating agent for urea or other chemical fertilizers. Moreover, no single study has tested the development of the combination of bio-degradable polymer and macronutrient coating on N and K release rate and their plant uptake at the lab and field scales.
The objective of this study was to explore the effectiveness of the combination of cheap and eco-friendly new polymeric coating materials and macronutrients (K) in controlling N release from urea granules with the provision of macronutrients such as K to improve wheat NUE. The specific objectives are (i) to quantify the nutrient (N) release rate from a biopolymer plus K coated urea fertilizer, (ii) to investigate the role of a coated urea fertilizer on soil N, K release, microbial biomass C, N, and N uptake by wheat crops. We hypothesized that the polymer plus K coating makes a smooth surface layer on granules and fills their porous surfaces. Thereby, it can control the N release rate from urea and synchronize N release with the wheat crop’s N requirement. Hence, wheat N uptake and yield will be higher with coated than uncoated urea treatment. Controlled release urea fertilizers were prepared using the fluidized bed coating technique. The coated and uncoated urea was characterized by fourier transform infrared spectroscopy (FTIR), X-ray diffraction (XRD), and scanning electron microscopy (SEM). Release rate and soil leaching rate of urea from coated granules were evaluated by using a UV-visible spectrophotometer. NUE of coated and uncoated urea was tested on a wheat crop in the field study.
2. Material and Methods
2.1. Materials
Urea granules of commercial grade containing 46% nitrogen content were purchased from a local market (Fauji Fertilizer, Bin Qasim Limited, Karachi, Pakistan). Granular urea was sieved to attain uniformity (4 mm) in diameter. Analytical grade materials for the coating test i.e., Gum Arabica (GA), potassium iodide (KI), gelatin, and polyvinyl alcohol (PVA) were acquired from Daejung Chemicals and Metals Co.,Ltd., Shiheung-city, Korea. The molecular weight of PVA, gelatin, and Gum Arabica was 13,000–23,000, 10,000, and 250,000 g·mol−1, respectively.
2.1.1. Composition of the Coating Solution
The polymeric coating solution was prepared by mixing 15 g of potassium iodide with 200 mL of deionized water for 30 min at a constant temperature of 80 °C. After that, three different coating solutions were prepared by adding 9 g of GA, PVA, and gelatin. The temperature (80 °C) was retained for 24 h with constant stirring. A fluidized bed coater was used for coating. The same method was adopted for the preparation of other compositions of coating materials. The experimental design to make a biopolymer and K combination for coating solutions was carefully thought though, based on previous reported studies [8,11,21,36,37,38]. The coating combinations were (i) GA + KI: urea coated with 3% Gum Arabica and 5% KI, (ii) PVA + KI: urea coated with 3% Polyvinyl Alcohol and 5% KI, and (iii) Gelatin + KI: urea coated with 3% Gum Arabica and 5% KI.
2.1.2. Coating Apparatus
The synthesis of a novel urea-coating fertilizer with slow-release properties was carried out using a fluidized bed granulator. A mini spray granulator (model: YC-1000) manufactured by Shanghai Biotech Instrument and Equipment Company Limited, Shanghai, China, was used for coating of the urea granules. A spray nozzle was installed below the fluidized bed, where a batch of 300 g urea granules was placed and run at a time.
After fluidizing the granular urea by using hot fluidization air (quantity exceeding the minimum requirement), a peristaltic pump was used for the steady flow of hot solution at 5.0 rpm. Pressurized air (0.2 MPa) from an air compressor was used for atomization of the hot coating solution, then using a spray nozzle, an atomized coating solution was launched from the bottom at a pressure of 4-bar on the granular urea. The process of coating was initiated when steady temperature conditions were achieved and ended after 15 min of drying. Finally, the coated urea granules were removed from the bed and characterized using various techniques.
2.2. Characterization of the Prepared Urea Granules
2.2.1. Fourier Transform Infrared (FTIR) Spectroscopy
The bonding nature and chemical structure of the uncoated and coated urea was evaluated by utilizing Fourier Transform Infrared Spectroscopy (FTIR; 100 Spectrometer, Perkin Elmer, Shelton, CT, USA) absorption spectra. For this purpose, urea granules were converted into powder form by crushing and the powder was subjected to spectral analysis through an FTIR spectrometer in the wavelength range of 400–4000 cm−1.
2.2.2. Scanning Electron Microscopy (SEM)
The surface morphology of the uncoated and coated granules of urea was studied using a SEM (S-4700, Hitachi, Tokyo, Japan). For this purpose, a JEOL JFC-1500 ion sputtering machine (Jeol, Tokyo, Japan) was used for carrying out gold sputtering on urea granules before examination. Granules were coated with up to 250 angstroms. Analysis of the surface of the sample granules was carried out using a secondary electron detector utilizing accelerating voltage of 20 Kilovolts.
2.2.3. X-ray Diffraction (XRD) Characterization
To examine the crystallinity of the polymeric surface formed on the coated and uncoated urea granules, XRD analysis was conducted using equipment STOE from Darmstadt, Germany. Step time and step size for X-ray diffraction were taken as 1 s and 0.4°, respectively. The radiation used for characterization was Cu k α-1, while scan angle ranged from 20°–70°.
2.2.4. Crushing Strength
Crushing strength of the coated urea granules was carried out using AGX Plus (Shimadzu, Kyoto, Japan), a universal testing machine. The test was conducted to ensure that the coated granules are capable of withstanding any physical injury—from the manufacturing phase of the product to their sale (the urea dust (fines) formed by excessive physical impact is useless in agriculture). For this test, a random selection of coated granules was made from the sample batch. During the test, a metal plunger was used to apply stress on the coated urea granules. The force at which the granules cracked open was recorded as a measure of its strength.
2.2.5. Urea Release Rate
The release rate and efficiency of the coated urea was identified by the P-methyl amino benzaldehyde method. First, a GENSYS TM20 UV-visible spectrophotometer (Thermo Fisher Scientific, Waltham, MA, USA) was used to draw a calibration curve using urea granules of analytical grade (i.e., having 99.9% purity). To obtain the slope of the calibration curve, standardized solutions of urea (20, 40, 60, 80, and 100 ppm) were prearranged. Absorbance of the standard solution mentioned above was measured using UV-visible spectrophotometry. Subsequently, a calibration curve between two known variables (absorbance and urea concentration) was drawn. For this purpose, initially, 10 g urea was placed in a 500 mL beaker containing de-ionized water. Then, 10 mL sample aliquots were collected from the center of the beaker at time intervals of 3, 6, 9, 12, 15, 30, 60, and 120 min. After that, each sample was diluted to 50 mL for absorbance measurement using a UV-visible spectrophotometer. Before sample collection, the beaker was stirred for 15 s. A 10 mL sample was collected again from the diluted solution (50 mL), then transferred into another volumetric flask (50 mL) in which 5 mL p-dimethyl benzaldehyde solution and 1 mL HCl (1:1) were added and mixed. To bring the final volume to 50 mL, de-ionized water was used. Finally, absorbance was measured using a wavelength of 418 nm and an unknown concentration of the test batch (coated urea) was calculated using Equation (i). Then using Equation (ii), urea release efficiency was calculated.
Urea release efficiency (%) = (Cu − Cpcu/Cu) × 100
2.2.6. Urea Leaching Rate
A soil leaching column made of polytetrafluoroethylene (PTFE) with 150 mm height and 30 mm diameter was used to measure the urea leaching rate in soil. A soil column was filled with oven dried soil. One gram of urea (coated and uncoated) was placed in the center of the column (75 mm depth) in the soil. The bottom of the column was covered with cellulose acetate filter paper, which allows only water to pass through. In 1 L deionized water, 1 g copper sulphate was added to prevent the risk of nitrification by urea. This water was passed through the column from the top at flow rate of 3 mL minute−1 and collected in a beaker from the bottom. Water samples were collected from the beaker every 30 min for almost 8 h. Absorbance of leached urea was measured from the samples at wavelength of 430 nm using a GENSYS TM20 UV-visible spectrophotometer, after drawing a calibration curve.
2.3. Field Experiment
A field experiment was conducted at the University Research Farm at Koont (Chakwal), Pakistan (latitude: 33.68° N, longitude 73.03° E and altitude: 1643.7 feet), to study the effect of coated urea on the growth and yield of wheat crop. The soil in the field was clay loam [39] and belonged to Udic Haplustalf Alfisol (Rawal series) category (Govt. of Pakistan, 1974) [39]. Initial soil pH, electrical conductivity, total organic carbon, dissolved organic carbon, mineral N, and plant available P and K were 8.32 ± 0.02, 0.19 ± 0.01%, 0.61 ± 0.1 dSm−1, 0.0034 ± 0.0002%, 15.6 ± 0.97 kg ha−1, 5 ± 0.3 mg kg−1, and 94 ± 3.8 mg kg−1, respectively. Mean rainfall during the experimental period ranged between 0.5–29.5 mm/month (National Agriculture Research Center, Islamabad, Pakistan, metrological data observatory).
In total, five treatments with three replications (15 plots) were used in the experiment. The treatments were arranged in a randomized complete block design (RCBD). The size of each plot was 2 m × 3 m, where 8 rows of wheat were sown at a distance of 23 cm. The uncoated urea was applied at a rate of 130 g (recommended dose: 100 kg N ha−1) per plot while coating increased the quantity of the urea to 148 g. The treatments in this study were (i) C: Control (unfertilized soil), (ii) Un-U: Uncoated urea, (iii) GA + KI: urea coated with 3% Gum Arabica and 5% KI, iv) PVA + KI: urea coated with 3% Polyvinyl Alcohol and 5% KI, and, (v) Gelatin + KI: urea coated with 3% Gum Arabica and 5% KI. Wheat seeds (variety: Borlaug) purchased from NARC, Islamabad, Pakistan, were used in the experiment. Manual weeding was performed periodically to avoid wheat infestation.
2.3.1. Analysis of Soil Samples
Soil was sampled five times during this experiment. An initial sample was taken before application of the fertilizer and then sampling was done after 45 days of sowing at tillering, booting (120 days), grain filling (145 days), and maturity stages (200 days). The purpose of sampling five times was to study the mineral N, microbial biomass C, and N content of the soil with time. Each time, three soil samples (random) were collected at a standard soil sampling depth of 0–30 cm [8,38,39,40,41] from all plots, which were mixed properly to form a composite sample. Half of each soil sample (fresh) was used for the determination of microbial biomass C and N content of soil, while the remaining half was oven dried for 2 days at a temperature of 45 °C to analyze soil pH, EC (electrical conductivity), TOC (total organic carbon), available C, Nmin (mineral nitrogen) and plant available P and K.
Soil pH and EC was determined by preparing a soil-water suspension at ratio of 1:2.5. This suspension was shaken for one hour and left at room temperature for 30 min to homogenize. A pH-meter (inoLab pH meter level 1, WTW GmbH & Co. KG, Weilheim in Oberbayern, Germany) and multi-meter (Ino-Lab® Multi 9430 IDS, WTW, GmbH & Co. KG, Weilheim in Oberbayern, Germany) were used to measure pH and EC, respectively. Soil dissolved organic C was determined using the method described by Altaf and Rashid [42]. Mineral N of soil was determined using the AB-DTPA method as described in Aziz, Shah, and Rashid [40]. Plant available P and K in soil were determined using a procedure described by Houba et al. [43]. Soil bulk density was measured using the soil core method [44].
Microbial Biomass
The fumigation extraction method as described in Aziz, Shah, and Rashid [40] was used for measuring microbial biomass Nmb and Cmb of the soil [45,46]. A 10 g fresh soil sample was taken for this purpose. Half of it (5 g) was fumigated for 24 h using ethanol-free CHCl3 at 25 °C. The fumes from these samples were removed by placing them in a hot water bath (80 °C) for 2 h. An extract of fumigated and non-fumigated soil (remaining 5 g) was prepared by shaking them with 20 mL K2SO4 solution (0.5 M) for 30 min. Subsequently, this solution mixture was filtered out to obtain the extract. Total carbon (TC) was determined using a TOC Analyzer (TNM1; Shimadzu, Kyoto, Japan), while total nitrogen (TN) was measured through with the Kjeldahl digestion method.
where, TCfum and TCnfum represent total C in the fumigated and non-fumigated samples of soil, respectively, while TNfum and TNnfum indicate total N in the fumigated and non-fumigated soil samples, respectively. To calculate Cmb and Nmb, 0.45 [47] and 0.54 [45,48] were used as kExC and kExN coefficient, respectively.
2.3.2. Plant Analysis
Wheat crop growth and yield parameters such as plant height, number of tillers plant−1, number of leaves tiller−1, number of spikelets panicle−1, panicle length, number of grains panicle−1, 1000 grains weight, grain yield, biological yield, root biomass, and harvest index were determined.
Wheat was harvested from an area of 1 m2 at the physiological maturity stage. Biological yield was measured by weighing the above-ground parts of all the plants harvested, after drying the samples in an oven at 70 °C for 48 h. Ten plants from each plot were randomly selected to measure other parameters in the maturity stage. A meter rod was used to measure plant height and panicle length in cm. Besides, the number of tillers plant−1 was counted. Spikelets from the panicles of the selected plants were counted and crushed to record the number of grains per panicle. A digital balance was used to determine 1000 grain weight and total grain weight per m2 after crushing all the panicles obtained from the mentioned area.
2.3.3. Apparent N Recoveries
Plant N apparent recovery was calculated using Equation (2):
where, Ncu and Ncont are N content of wheat plant (g N 100 g−1 DM) in the fertilized and control treatments, respectively. DMcu and DMcont indicate the wheat DM yield (kg ha−1) in the above-mentioned treatments. TNapp is the total N applied (kg ha−1) per treatment.
2.3.4. Statistical Analysis
The plant and soil data were analyzed statistically through analysis of variance technique using IBM SPSS statistics 20 (New York, NY, USA). In case of significant difference among treatments, their means were compared with Tukey’s honest significance test (HSD) test at the 5% probability level.
3. Results
3.1. Morphological and Spectral Characterization of Uncoated and Coated Urea
The surface morphological analysis of the uncoated and coated urea granules indicated a significant difference among the treatments (Figure 1 and insets). Large crystals of potassium were visible on the surface of the coated granules in all potassium iodide (KI) and biopolymer combinations (Figure 1B–D). The use of biopolymers (i.e., Gum Arabica, polyvinyl alcohol, and gelatin) significantly reduced the gaps or pinholes present on the urea granule surface. The coating formulation i.e., KI and Gum Arabica was able to create a uniform surface layer on the granule and crystals of KI were visible on the surface compared to the surface of the granules coated with the PVA + KI and Gelatin + KI combinations (Figure 1B vs. Figure 1C,D; insets). The surface of granules coated with Gelatin + KI still had some small pores and PVA + KI had large KI crystals, making them non-uniform (Figure 1C,D and insets).
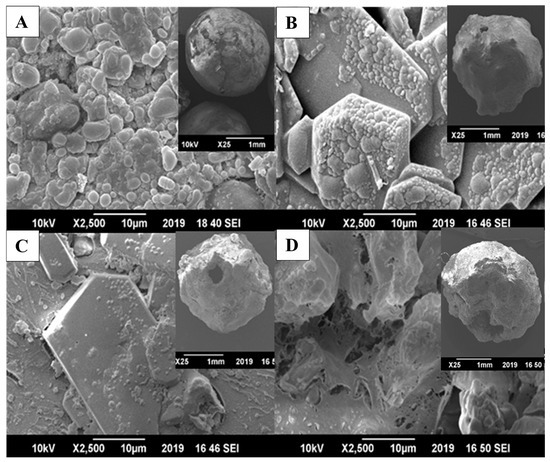
Figure 1.
Scanning electron microscopy micrographs of granular urea: (A) Un-U: Uncoated, and coated with (B) GA + KI: 3% Gum Arabica + 5% potassium iodide; (C) PVA + KI: 3% polyvinyl alcohol + 5% potassium iodide; (D) Gelatin + KI: 3% Gelatin + 5% potassium iodide. Inset shows the granular image of each treatment.
The Fourier Transform Infrared (FTIR) spectral analysis showed no significant differences in the peaks’ location or intensity between the uncoated and coated urea treatments (Figure 2A). All spectra showed transmittance peaks at 3450 cm−1, showing the presence of the amine (NH2) group. Similarly, a peak appeared at 2400 cm−1, displaying the stretching vibration of the O–H group. Likewise, the transmittance at 1600 cm−1 expressed the occurrence of the carbonyl (C=O) group; the peaks at 1650 cm−1 indicated N–H and C–H stretching vibrations, whereas the transmittance at 1450 cm−1 and 1260 cm−1 indicated C–N and C–C–C vibrational stretching. The carbonyl and C–H stretching indicated the presence of organic compounds i.e., PVA, starch, and gelatin in the coated urea treatment whereas N–H and C–N stretching showed the presence of N in the samples. Moreover, the O–H group signified the presence of water in the samples. These spectral analyses confirmed no great changes in the chemical and bonding structure of the coated and uncoated urea treatments.
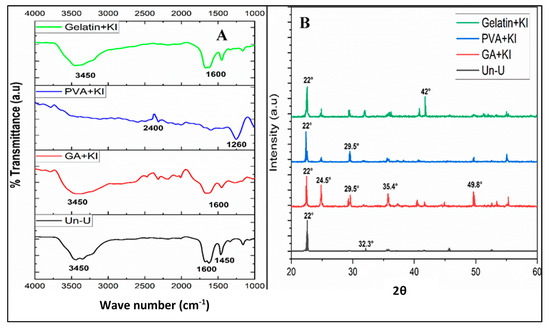
Figure 2.
FTIR spectra (A) and XRD pattern (B) of uncoated and coated urea formulations.
The X-ray diffraction analysis of the uncoated and coated urea treatments is presented in Figure 2B. This analysis indicated no major shifts in the location or strength of the diffractograms of the uncoated and coated urea treatments. However, a slight difference was observed in the intensities of the diffractogram peaks of the coated treatments, compared to the uncoated one. This advocates that the coating materials did change the structure of the urea granules and were able to make physical bonds with the granules; therefore, the granule structure was not changed greatly. The 2θ Braggs’ reflection was observed at 22°, 24.5°, 29.5°, 32.3°, 35.4°, 42.0°, and 49.8°. The XRD analysis shows the crystalline nature of the material. The well-defined peaks in all coated urea treatments indicated the presence of KI crystals, compared to uncoated urea granules. The KI exhibits a peak at 2θ = 23° [49]. In our study this peak appeared at 24.5° in all KI coated urea treatments (Figure 2B). The appearance of well-defined peaks in the aforesaid treatments are in line with the KI spectra observed by Singh et al. [50]. Interestingly, the GA peak is observed at 2θ = 22.29° with very low intensity, indicating its amorphous nature [51]. That is why we did not observe a visible peak in the GA + KI treatment (Figure 2B). The shoulder peak at 22.4° corresponds to PVA, showing the zig-zag nature of the crystals [51] on coated urea. Overall, all urea coating treatments had sharp peaks presenting high crystallinity of the urea granules and showing that the coating was successfully done on the granule surface.
3.2. Effect of Coating on Urea Release, Efficiency, Leaching Rate, and Crushing Strength
The highest urea release was observed with the uncoated urea treatment, where urea was released completely in water after 15 min. The lowest release was observed with GA + KI, which released 74% of urea in 15 min. On the other hand, urea release was found to be 78% and 82% with the PVA + KI and Gelatin + KI treatments after 15 min of water immersion. Therefore, urea release efficiency did not differ statistically among the coated urea treatments (Figure 3B). The urea leaching rate is presented in Figure 3C. It is obvious that 95% of the urea leached down from the soil after 120 min. However, in comparison, only 21%, 33%, and 36% urea was leached with the GA + KI, PVA + KI and Gelatin + KI treatments respectively. After 480 min, 100% of urea leached with the uncoated urea treatment, whereas it was 92%, 89%, and 79% for the Gelatin + KI, PVA + KI, and GA + KI treatments. This showed that GA + KI released the lowest amount of urea in this time duration (Figure 3C). Crushing strength is an important parameter that shows the stability/resistance of the urea granules to damage during transport or storage. The highest crushing strength (2.5 N mm−2) was observed with the GA + KI and PVA + KI treatments, followed by Gelatin + KI (2.1 N mm−2). The uncoated urea granules had a crushing strength of 1.9 N mm−2 (Figure 3D).
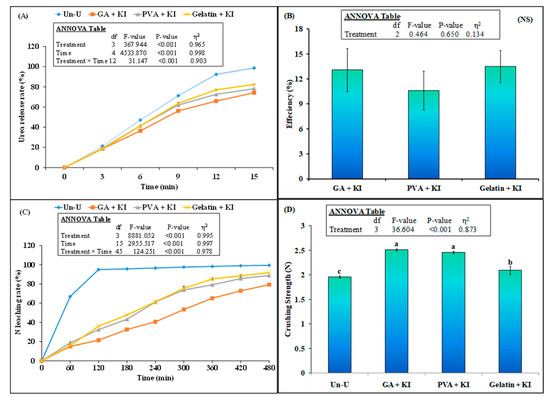
Figure 3.
Mean (n = 3) urea release (A), urea release efficiency (B), N leaching rate (C), and crushing strength (D) of granular urea. Abbreviations of fertilizer treatments are presented in Figure 1. Error bars show standard errors (±1 SE) of the mean. Different small letters in figure D illustrate significant differences among treatments at a 5% probability level after the Tukey-HSD test. The inset table representes the outcomes of the analysis of variance (ANOVA).
3.3. Effect of Coated and Uncoated Urea on Soil Properties
Soil pH was significantly affected by the treatments (Figure 4A). Coated urea treatments significantly decreased soil pH compared to uncoated or control treatment. Among the coated treatments, GA + KI decreased soil pH by 8%, whereas this decrease was 4% in the case of Gelatin + KI. The uncoated urea also decreased soil pH and this decrement was 2% compared to the control (unfertilized) treatment. Coated urea significantly increased dissolved organic carbon (DOC) content in the soil over the uncoated one or the control (p < 0.05; Figure 4B). This parameter was significantly higher with the GA + KI treatment (32% = 21.8 vs. 16.5 kg ha−1) than the control (p < 0.05) and 22% higher than the uncoated urea treatment. This parameter was 16% and 7% higher with the PVA + KI and Gelatin + KI treatments, respectively.
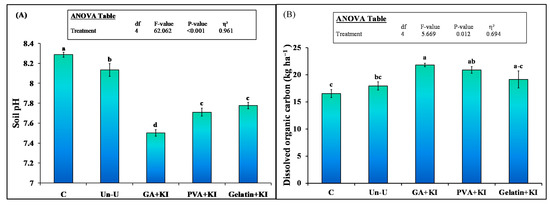
Figure 4.
Mean (n = 3) Soil pH (A) and dissolved organic carbon (B) after 200 days of the application of uncoated and coated urea fertilizers. Abbreviations of fertilizer treatments can be seen in Figure 1. Different small letters illustrated significant differences among treatments at a 5% probability level after the Tukey-HSD test. C stands for untreated control treatment. Error bars showed standard errors (±1 SE) of the mean. Inset table represented the outcomes of analysis of variance (ANOVA).
In general, uncoated and coated urea treatments significantly increased the mineral N content in soil (p < 0.05), compared to the control (Figure 5A). The effect of time on this parameter was also significant. The highest increment in mineral content was observed with the GA + KI treatment across all the time intervals. The highest increment in mineral N content was observed after 45 days when this parameter was 121% (38 vs.17 kg ha−1) with the GA + KI treatment, 89% (32 vs. 17 kg ha−1) with PVA + KI, 70% (29 vs.17 kg ha−1) with the Gelatin + KI, and 56% (26 vs.17 kg ha−1) with the Un-U treatment, compared to the control (p < 0.001). All urea treatments maintained this increment in soil mineral N content till the end of the experiment, compared to the the control (p < 0.001); however, higher increment was observed with coated treatments than the uncoated one. Among the coated treatments, mineral N in the GA + KI treatment was 30 and 17% higher than that of the Gelatin + KI and PVA + KI treatments, respectively, on day 45 (Figure 5A).
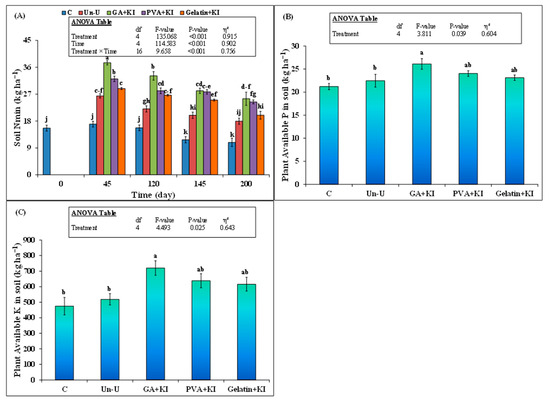
Figure 5.
Mean (n = 3) (A) soil mineral N on day 45, 120, 145, and 200 (B) plant available P and (C) K after 200 days of the application of uncoated and coated urea fertilizers. Abbreviations of fertilizer treatments can be seen in Figure 1. C stands for untreated control treatment. Error bars show standard errors (±1 SE) of the mean. Different small letters illustrate significant differences among treatments at a 5% probability level after the Tukey-HSD test. The inset table represents the outcomes of the analysis of variance (ANOVA).
Remarkably, the coated urea treatments showed significantly higher mineral N content in soil than the uncoated urea, except Gelatin + KI, from day 45 till end of the experiment. The latter was not significantly different from uncoated urea 200 days after the experiment. At the end, the increase in soil mineral N was 42% and 22% higher with GA + KI and PVA + KI, respectively, compared to the uncoated urea treatment. Soil available P in GA + KI was 23% higher than that of the control (p < 0.05; Figure 5B). However, the effect of other treatments on this parameter was not significant. Similarly, soil-available K also only increased with the GA + KI treatment, compared to the control (p < 0.05; Figure 5C).
The effect of time and treatment on soil microbial biomass carbon (MBC) was significant; however, their interaction did not differ significantly (Figure 6A). After 45 days, all coated urea treatments increased MBC and this parameter was 18% (306 vs. 260 mg kg−1), 12% (290 vs. 260 mg kg−1), and 6% (275 vs. 260 mg kg−1) higher than that of the uncoated urea. A continuous increase in soil MBC was observed in all uncoated and coated urea treatments during the experimental period. GA + KI increased the MBC compared to the uncoated urea and this increment remained till the end of experiment. The MBC in PVA + KI was only significantly higher than that of the uncoated urea 120 days after the experiment, whereas there was no difference in this parameter between the Gelatin + KI and uncoated urea treatments throughout the experiment. At the final soil sampling, the increment in soil MBC was 35% for GA + KI and 26% for PVA + KI, compared to the uncoated urea treatment (p < 0.05).
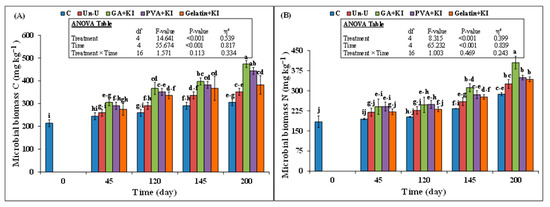
Figure 6.
Mean (n = 3) (A) Microbial biomass carbon (MBC) and (B) nitrogen (MBN) after application of uncoated and coated urea fertilizers at different time intervals during wheat growing season. Abbreviations of fertilizer treatments can be seen in Figure 1. Different capital or small letters illustrate significant differences among treatments at a 5% probability level after the Tukey-HSD test. The inset table represents the outcomes of analysis of the variance (ANOVA).
Similarly, microbial biomass nitrogen (MBN) was also significantly affected by the treatment and time; however, their interaction effect was not significant (Figure 6B). On the 45th day, there was no difference in soil MBN among the coated and uncoated urea treatments, but after 120 days, GA + KI and PVA + KI increased MBN by 9% and 10%, respectively, than the uncoated urea (p > 0.05; Figure 6B). The MBN only remained higher in the GA + KI treatment compared to the uncoated urea after 120, 145, and 200 days. However, there was no difference in MBN among PVA + KI, Gelatin + KI, and uncoated urea treatments during all sampling events. After 200 days, soil MBN was 24% higher in the GA + KI treatment compared to the uncoated urea, but the effect of the PVA + KI and Gelatin + KI treatments on soil MBN was not different from that of the Un-U treatment (Figure 6B).
3.4. Wheat Growth and Yield Parameters
Plant height was the highest with GA + KI, followed by PVA + KI, Gelatin + KI, Un-U, and the control. This parameter was 6% higher in GA + KI than the Un-U treatment (Table 1). However, the difference between the Gelatin + KI, PVA + KI, and Un-U treatments was not significant (p > 0.05). With respect to the number of tillers, only the GA + KI treatment performed best by showing a significant increase (27% = 14 vs. 11 no. plant−1), compared to the control. There was no difference in the number of leaves per tiller of the wheat crop among the coated and uncoated urea treatments (Table 1). Panicle length and number of spikelets plant−1 was not significantly affected by the treatments (p > 0.05). Among the coated urea treatments, only GA + KI significantly increased the number of grains plant−1 compared to the uncoated urea (p > 0.05; Table 1) and this increment was 17% (47.8 vs. 40.7 grains panicle−1). Likewise, 1000 grains weight was significantly affected by the treatments (p < 0.05). This parameter was 36% (55 vs. 40 g), 26% (51 vs. 40 g), and 14% (46 vs. 40 g) higher with the GA + KI, PVA + KI, and Gelatin + KI treatments, respectively. However, this parameter with the Un-U treatment was not significantly different than that of the control (Table 1).

Table 1.
Mean (n = 3) physiological and yield attributes of wheat crop as influenced by the control (unfertilized), uncoated urea (Un-U), and urea coated with Gum Arabica and potassium iodide (GA + KI), polyvinyl alcohol and potassium iodide (PVA + KI), and gelation and potassium iodide (Gelatin Gelatin + KI). Different small letters in a row illustrated significant differences among treatments at a 5% probability level after the Tukey-HSD test.
Root biomass was the highest with GA + KI and lowest in the control. A 70% (1584 vs. 932 kg ha−1) increase in root biomass was observed in the case of GA + KI treatment compared to the control and this increase was 47% (1367 vs. 932 kg ha−1), 37% (1272 vs. 932 kg ha−1), and 17% (1089 vs. 932 kg ha−1) for PVA + KI, Gelatin + KI, and Un-U treatments, respectively (Table 1). Biological yield was also significantly affected by the treatments; however, this parameter in the Un-U treatment was not significantly different from that of the control. The application of the GA + KI, PVA + KI, and Gelatin + KI treatments significantly increased this parameter by 28% (15087 vs. 11713 kg ha−1), 17% (13805 vs. 11713 kg ha−1), and 15% (13503 vs. 11713 kg ha−1), respectively, compared to the control (Table 1). Among the coated treatments, biological yield was 19% higher with GA + KI than the Un-U treatment; however, this parameter in other coated treatments was not different from that of Un-U. Harvest index was not significantly affected by the treatments (p > 0.05; Table 1).
The treatment effect on grain yield was also statistically significant. The highest grain yield was observed with the GA + KI treatment, which was 49% (6897 vs. 4622 kg ha−1) higher than that of the control. This was followed by PVA + KI and Gelatin + KI, which increased grain yield by 28% (5934 vs. 4622 kg ha−1) and 22% (5634 vs. 4622 kg ha−1), respectively, compared to the control. The grain yield was 28%, 10%, and 5% higher with GA + KI, PVA + KI, and Gelatin + KI treatments, compared to the Un-U treatment. The Un-U treatment also increased grain yield, but it was lower than the coated urea treatments (Table 1).
3.5. Shoot and Root N uptake
Both root and shoot N uptake was significantly affected by the treatments (Figure 7A). The highest wheat N uptake was observed with the GA + KI treatment, followed by PVA + KI. There was no difference in shoot N uptake between Gelatin + KI and Un-U. This parameter was 173% (99 vs. 36 kg ha−1), 142% (88 vs. 36 kg ha−1), 87% (68 vs. 36 kg ha−1), and 75% (63 vs. 36 kg ha−1) higher with the GA + KI, PVA + KI, Gelatin + KI, and Un-U treatments, as compared to the control (p < 0.001; Figure 7A).
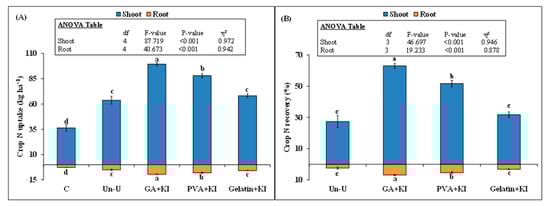
Figure 7.
Mean (n = 3) wheat plant N uptake (A), and apparent N recovery (ANR) (B) from uncoated and coated urea fertilizers. Abbreviations of fertilizer treatments can be seen in Figure 1. C stands for untreated control treatment. Error bars show standard errors (±1 SE) of the mean. Different capital or small letters illustrate significant differences among treatments at a 5% probability level after the Tukey-HSD test. The inset table represents the outcomes of the analysis of variance (ANOVA).
This parameter was 56% and 38% higher in GA + KI and PVA + KI, respectively, than the uncoated urea treatment. A similar trend was observed in root N uptake, where GA + KI treatment performed best, compared to the other treatments. Shoot and root N uptake did not differ between the Gelatin + KI and Un-U treatments (p > 0.05). Similarly, significant difference was observed in the case of plant ANR among the coated and uncoated urea treatments (p < 0.001; Figure 7B). This parameter was 130% (63% vs. 27%) higher for shoot and 184% (7% vs. 2%) for root with the GA + KI treatment, as compared to the Un-U treatment (Figure 7B).
4. Discussion
According to our expectation, we observed that all combinations of biopolymers (Gum Arabica, polyvinyl alcohol (PVA) and gelatin) and potassium iodide (KI) coating materials covered the granules’ surface and removed gaps or pinholes (Figure 1). Interestingly, Gum Arabica was able to homogeneously distribute the KI crystals on the granule surface (Figure 1B). However, in the case of PVA or gelatin, KI crystals were non-homogeneously distributed, making the granule surface rough; therefore, invisible small fractures appeared on the surface of the granules with these coating treatments (Figure 1C,D). The main reason for non-homogenous distribution of KI crystals might be the agglomeration of the material during the coating process. This could have taken place by the weak dispersal and local deposition of the coating liquid, which reduced the drying ability of the fluidizing gas [21,52]. This agglomeration can be decreased or avoided by decreasing the coating solution viscosity at higher temperatures [21]. Azeem, KuShaari, Naqvi, Kok Keong, Almesfer, Al-Qodah, Naqvi, and Elboughdiri [21] decreased the viscosity of citric acid/polyvinyl alcohol/starch solution from 500 to 300 µ(cp) when they increased the temperature of the solution from 50 to 110 °C. Liquids with low viscosity make fine droplets that uniformly spread the solution during the coating process and help in quick drying on the surface of the granule, hence, causing less material agglomeration. In our study, the starch or polyvinyl alcohol solution might have been more viscous [21] as we retained the temperature of the fluidized bed at 80 °C. Consequently, a high temperature during the coating produced a low viscous solution, which was important for uniform spraying of the coating solution; this resulted in non-homogenous distribution of KI crystals. In an earlier study, the combination of Gum Arabica and gelatin was unable to repair surface cracks when mixed with other polymers such as paraffin wax and molasses; however, PVA made a uniform coating layer when mixed with these polymers [11]. On the other hand, a combination of gelatin, molasses, and Gum Arabica was able to make a uniform coating layer on urea [11]. Similarly, in our study, Gum Arabica with KI formed a uniform coating layer on the granule surface. However, gelatin and PVA did not make a dense, compact, and uniform coating layer with KI, as also observed by Beig, Niazi, Jahan, Kakar, Shah, Shahid, Zia, Haq, and Rashid [11]. The FTIR analysis of the granules also confirmed that there was not much difference in the spectra of the coated and uncoated urea, except for slight differences in the location or intensity of peaks among these treatments (Figure 2A). In all the spectra of the coated and uncoated treatments, a transmittance peak was observed at 3450 cm−1 due to the amine (−NH2) groups in urea [11,29]. Similarly, the spectral peak of aldehyde observed at 2802 cm−1 indicated the presence of Gum Arabica [8,11]. The spectral peak observed at 1600 cm−1and 1260 cm−1 designated –CO and C–C–C vibrational stretching indicating the presence of carbonyl and alkyne groups that might be attributed to gelatin, Gum Arabica. In line with FTIR, XRD diffractograms showed no difference in peak intensity or location among the uncoated and coated urea treatments (Figure 2B). On the other hand, slight changes in the intensity of peaks in GA + KI, PVA + KI, and Gelatin + KI advocated that biopolymers were present on the granules. However, they were not able to modify the overall chemical characteristics of the granules. Sharp peaks appeared on the granules of the coated treatments, revealing the high crystalline nature of the coated urea and signifying the formation of a clear coating surface on the urea granules [8,11,29].
In line with our hypothesis, we observed that all coating treatments decreased N leaching from urea compared to the uncoated ones (Figure 3C). These results are in accordance with Yang et al. [53], who observed in a global meta-analysis study that controlled release urea reduces N leaching from urea by 24.3%. They explained that controlled release urea synchronizes N release that matched up with crop N demand; this decreased the ample amount of N in the soil and the N leaching risk [54]. Chen et al. [55] also observed a 28.6% decrease in N leaching from sulfur-coated urea, compared to normal chemical fertilizer treatment. They explained that the higher solubility of common fertilizers in water caused less absorption of large amounts of NH4+–N by crop rooting systems [55]. On the other hand, coated urea was more conducive to plant root absorption and hence utilization by plants, compared to uncoated urea treatment. Yang, Zhu, Bai, Sun, Zou, Fang, and Zhang [53] also indicated that coated urea hindered urea hydrolysis to NH4+; therefore, in their meta-analysis study, coated urea was found to decrease NH4+–N in the soil by 8.2%. The less availability of these ions leads to lower nitrification and controlling this process is a potential pathway to reduce NO3−–N leaching and improve crop NUE [56]. Therefore, in our study, controlling urea N release and lowering urea dissolution to NH4+ might be the pathways that reduce N leaching from coated (Figure 3C).
The results of N release kinetics confirmed our hypothesis that all coatings decrease N release rate after urea water dissolution (Figure 3A). Coating materials such as Gum Arabica, polyvinyl alcohol, and gelatin are known to make a good, smooth, and reliable coating surface on the granules [8,10,11]. Therefore, these biopolymer coatings have the ability to withstand water dissolution for longer periods and can decrease urea hydrolysis [10]. Among these, Gum Arabica made a uniform coating with KI on the urea granule surface since it possesses good properties of polymeric substance [57] and therefore controlled the N release better than all the other coated combinations. Beig, Niazi, Jahan, Kakar, Shah, Shahid, Zia, Haq, and Rashid [11] also observed that Gum Arabica, when mixed with molasses and paraffin wax was able to decrease the urea release rate, compared to uncoated urea. Consequently, we also observed controlled N release from all coated treatments, but the highest was observed in Gum Arabica plus KI (Figure 3A).
In accordance with our final hypothesis, we observed high mineral N content in the soil of the coated urea treatments at the tillering, booting, and maturity stages of wheat, compared to the uncoated urea treatment. Among the coated ones, GA + KI had higher mineral N content at all crop growth stages (Figure 5); therefore, we observed higher wheat grain yield, N uptake, and apparent crop N recovery from the coated treatments , compared to the uncoated urea treatments, especially GA + KI (Figure 6, Table 1). Our results show that there was plentiful concentration of N present in the soil with this treatment at each crop growth stage for optimum crop growth and N uptake. This was also confirmed by the controlled/slower N release from coated urea treatment in water (Figure 3A). Both N release observations in water and soil confirmed that coated urea treatments slowly release N, which was potentially available at each critical stage of the crop and hence it synchronized with plant N uptake. Therefore, we observed higher N uptake (Figure 7) and lower N leaching losses with the coated urea treatments (Figure 3C). These effects can also be explained by the presence of high microbial biomass C and N with the GA + KI treatment than the uncoated urea, signifying that high mineral N and DOC in the soil of this treatment (Figure 4B and Figure 5C) supports microbial growth (Figure 6). Microbial biomass N was only high with GA + KI at the grain filling (20%) and maturity stages (24%), compared to the uncoated urea. This increase in microbial biomass N could be related to ample availability of mineral N in the soil with GA + KI treatment, which was the highest after 120 days and remained higher than all other treatments after 145 and 200 days of crop sowing (Figure 5A). According to Zhu et al. [58], high N application rate/soil N availability increased bacterial abundance in the soil and root exudation in maize crop. Application of the C rich root exudate in soil enhanced microbial biomass compared to the N rich root exudate [59]. Consequently, soil C is the most limiting element affecting microbial biomass [60]. Therefore, the addition of labile C source in the soil offset the microbial C limitation and increased the microbial biomass [61]. In our study, the GA + KI treatment had higher DOC (Figure 4B) and mineral N (Figure 5A) compared to all the treatments, especially the uncoated urea at grain filling and maturity stages. Therefore, microbial biomass was not limited by soil DOC and N; hence, we observed higher microbial biomass N at these stages of crop growth. According to Montaño et al. [62], high soil dissolved organic N and C in the soil favored microbial biomass and activity. In fact, urea-induced changes in the microbial community are closely associated with soil DOC and nutrient cycling [63]. As a result, higher nutrient availability in the soil with GA + KI treatment (Figure 4B and Figure 5A–C) might have proliferated microbial biomass C and N (Figure 6) and therefore affected the nitrogen cycling [63] and crop yield in our study.
The higher N uptake with the GA + KI treatment, compared to the uncoated urea, can also be explained by nutrient synergism or antagonism interactions in the soil and plant N uptake. This is because these interactions influenced the crop yield and nutrient utilization efficiency of the applied fertilizer [32,64]. For instance, increment in K concentration in the nutrient solution enhanced the availability of N, P and Zn whereas it suppressed/decreased Ca and Zn availability for tomato uptake [64]. On the other hand, N fertilizer application decreased leaf K, P, and B contents, but K fertilization did not influence the N, P, or B content in the leaf of a cherry tree [65]. Similarly, in winter wheat, grain proportion of N was negatively correlated with grain K content; however, in vegetation parts, most macro and micronutrients increased with increasing N uptakes [66]. Thus, such K and N application influenced the nutrients in the soil that are available for plant nutrient uptake. In line with these studies, ample K availability during all growth stages of wheat crop with the GA + KI treatment may synergistically increase mineral N and P availability, which was the highest in the soil with this treatment, compared to the others (Figure 5), and therefore increase wheat N uptake in our study.
The increase in grain yield (Table 1) and N uptake (Figure 7) with the GA + KI treatment can be further explained by the expected high translocation of photosynthates to wheat grains. According to Hou et al. [67], the combined use of N and K increased grain yield, which was mainly explained by the higher number of spikelets per panicle. Similarly, in a literature review, Duncan et al. [68] found that nitrogen utilization efficiency of crops was significantly improved by N and K interaction and grain yield was usually increased by application of N + P + K or N + P + K + S nutrients. They suggested that the balanced availability of P and K in soil potentially reduces the N application rate in crops. The co-application of N and K significantly increases the seed yield of oilseed rape by increasing the pods per pods numbers per plant [69]. A similar synergistic effect might be observed with GA + KI treatment in our study, where controlled release of N synergistically increased P and K availability in the soil (Figure 5B,C) and such synergistic interactions led to high tillers plant−1, spikelets and grains per panicle, and ultimately grain yield (Table 1).
5. Conclusions
This is the first detailed study investigating the role of macronutrients (i.e., K) plus biopolymer coatings on slow release of N, N leaching, soil N, P and K content, and wheat N uptake from commercial urea in a field experiment. All coatings with biopolymer plus KI combinations significantly decreased the urea release rate after water dissolution and leaching in the lysimetric, compared to uncoated urea. However, the highest controlled release and lowest leaching was observed in urea coated with Gum Arabica plus potassium iodide. Gum Arabica plus KI coated urea controlled the N release from urea, decreased N leaching losses, and synchronized N with wheat N demand at its growth stages; therefore, higher wheat biomass, grain yield, and N uptake was observed with this treatment, compared to uncoated urea. This could be credited to Gum Arabica’ adhesion ability as a coating agent, which, in combination with KI, might cause urea hydrolysis, synergistically affecting soil N and P availability and wheat N uptake. Hence, fertilizer companies can utilize Gum Arabica and KI as a coating agent for urea to improve its N utilization efficiency, reduce N leaching, and meet crop N and K demand.
Author Contributions
Data curation, Q.-u.-A.N., and I.M.; Formal analysis, G.A.S., K.A., M.I.R., M.B.K.N. and Z.I.; APC Funding acquisition, Z.H.; Investigation, M.S., Z.H.; Methodology, A.B., K.A., Z.I. and M.I.R.; Project administration, G.A.S., N.A. and M.I.R. Writing manuscript, M.I.R. All authors have read and agreed to the published version of the manuscript.
Funding
This research received no external funding. The APC was funded by Z.H., Q.-u.-A.N., M.S. and I.M.
Institutional Review Board Statement
This study did not involve humans or animals.
Informed Consent Statement
Not applicable.
Data Availability Statement
All data is presented in the manuscript.
Conflicts of Interest
The authors declare no conflict of interest.
References
- Sharma, L.K.; Bali, S.K. A review of methods to improve nitrogen use efficiency in agriculture. Sustainability 2018, 10, 51. [Google Scholar] [CrossRef] [Green Version]
- Erisman, J.W.; Sutton, M.A.; Galloway, J.; Klimont, Z.; Winiwarter, W. How a century of ammonia synthesis changed the world. Nat. Geosci. 2008, 1, 636–639. [Google Scholar] [CrossRef]
- FAO. World Fertilizer Trends and Outlook to 2022; FAO: Rome, Italy, 2019. [Google Scholar]
- Sutton, M.A.; Oenema, O.; Erisman, J.W.; Leip, A.; Van Grinsven, H.; Winiwarter, W. Too much of a good thing. Nature 2011, 472, 159–161. [Google Scholar] [CrossRef] [Green Version]
- Martins, M.; Sant’Anna, S.; Zaman, M.; Santos, R.; Monteiro, R.; Alves, B.; Jantalia, C.; Boddey, R.; Urquiaga, S. Strategies for the use of urease and nitrification inhibitors with urea: Impact on N2O and NH3 emissions, fertilizer-15N recovery and maize yield in a tropical soil. Agric. Ecosyst. Environ. 2017, 247, 54–62. [Google Scholar] [CrossRef]
- Migliorati, M.D.A.; Parton, W.J.; Bell, M.J.; Wang, W.; Grace, P.R. Soybean fallow and nitrification inhibitors: Strategies to reduce N2O emission intensities and N losses in Australian sugarcane cropping systems. Agric. Ecosyst. Environ. 2021, 306, 107150. [Google Scholar] [CrossRef]
- Peng, W.; Lü, F.; Duan, H.; Zhang, H.; Shao, L.; He, P. Biological denitrification potential as an indicator for measuring digestate stability. Sci. Total Environ. 2021, 752, 142211. [Google Scholar] [CrossRef]
- Beig, B.; Niazi, M.B.K.; Jahan, Z.; Pervaiz, E.; Abbas Shah, G.; UI Haq, M.; Zafar, M.I.; Zia, M. Slow-release urea prills developed using organic and inorganic blends in fluidized bed coater and their effect on spinach productivity. Sustainability 2020, 12, 5944. [Google Scholar] [CrossRef]
- Salim, N.; Raza, A. Nutrient use efficiency (NUE) for sustainable wheat production: A review. J.Plant Nutr. 2020, 43, 297–315. [Google Scholar] [CrossRef]
- Beig, B.; Niazi, M.B.K.; Jahan, Z.; Hussain, A.; Zia, M.H.; Mehran, M.T. Coating materials for slow release of nitrogen from urea fertilizer: A review. J. Plant Nutr. 2020, 43, 1510–1533. [Google Scholar] [CrossRef]
- Beig, B.; Niazi, M.B.K.; Jahan, Z.; Kakar, S.J.; Shah, G.A.; Shahid, M.; Zia, M.; Haq, M.U.; Rashid, M.I. Biodegradable polymer coated granular urea slows down N release kinetics and improves spinach productivity. Polymers 2020, 12, 2623. [Google Scholar] [CrossRef]
- Fertahi, S.; Ilsouk, M.; Zeroual, Y.; Oukarroum, A.; Barakat, A. Recent trends in organic coating based on biopolymers and biomass for controlled and slow release fertilizers. J. Control. Release 2021, 330, 341–361. [Google Scholar] [CrossRef]
- Azeem, B.; KuShaari, K.; Man, Z.B.; Basit, A.; Thanh, T.H. Review on materials & methods to produce controlled release coated urea fertilizer. J. Control. Release 2014, 181, 11–21. [Google Scholar] [CrossRef] [PubMed]
- Gil-Ortiz, R.; Naranjo, M.Á.; Ruiz-Navarro, A.; Caballero-Molada, M.; Atares, S.; García, C.; Vicente, O. New eco-friendly polymeric-coated urea fertilizers enhanced crop yield in wheat. Agronomy 2020, 10, 438. [Google Scholar] [CrossRef] [Green Version]
- Lawrencia, D.; Wong, S.K.; Low, D.Y.S.; Goh, B.H.; Goh, J.K.; Ruktanonchai, U.R.; Soottitantawat, A.; Lee, L.H.; Tang, S.Y. Controlled release fertilizers: A review on coating materials and mechanism of release. Plants 2021, 10, 238. [Google Scholar] [CrossRef]
- Naz, M.Y.; Sulaiman, S.A. Slow release coating remedy for nitrogen loss from conventional urea: A review. J. Control. Release 2016, 225, 109–120. [Google Scholar] [CrossRef] [PubMed]
- Ibrahim, K.; Naz, M.; Shukrullah, S.; Sulaiman, S.; Ghaffar, A.; AbdEl-Salam, N. Nitrogen pollution impact and remediation through low cost starch based biodegradable polymers. Sci. Rep. 2020, 10, 1–10. [Google Scholar] [CrossRef] [Green Version]
- Liu, J.; Yang, Y.; Gao, B.; Li, Y.C.; Xie, J. Bio-based elastic polyurethane for controlled-release urea fertilizer: Fabrication, properties, swelling and nitrogen release characteristics. J. Clean. Prod. 2019, 209, 528–537. [Google Scholar] [CrossRef]
- Pang, L.; Gao, Z.; Feng, H.; Wang, S.; Wang, Q. Cellulose based materials for controlled release formulations of agrochemicals: A review of modifications and applications. J. Control. Release 2019, 316, 105–115. [Google Scholar] [CrossRef]
- Elhassani, C.E.; Essamlali, Y.; Aqlil, M.; Nzenguet, A.M.; Ganetri, I.; Zahouily, M. Urea-impregnated HAP encapsulated by lignocellulosic biomass-extruded composites: A novel slow-release fertilizer. Environ. Technol. Innov. 2019, 15, 100403. [Google Scholar] [CrossRef]
- Azeem, B.; KuShaari, K.; Naqvi, M.; Kok Keong, L.; Almesfer, M.K.; Al-Qodah, Z.; Naqvi, S.R.; Elboughdiri, N. Production and characterization of controlled release urea using biopolymer and geopolymer as coating materials. Polymers 2020, 12, 400. [Google Scholar] [CrossRef] [Green Version]
- Yang, Y.-C.; Zhang, M.; Li, Y.; Fan, X.-H.; Geng, Y.-Q. Improving the quality of polymer-coated urea with recycled plastic, proper additives, and large tablets. J. Agric. Food Chem. 2012, 60, 11229–11237. [Google Scholar] [CrossRef]
- Salman, O.A.; Hovakeemian, G.; Khraishi, N. Polyethylene-coated urea. 2. Urea release as affected by coating material, soil type and temperature. Ind. Eng. Chem. Res. 1989, 28, 633–638. [Google Scholar] [CrossRef]
- Emami, N.; Razmjou, A.; Noorisafa, F.; Korayem, A.H.; Zarrabi, A.; Ji, C. Fabrication of smart magnetic nanocomposite asymmetric membrane capsules for the controlled release of nitrate. Environ. Nanotechnol. Monit. Manag. 2017, 8, 233–243. [Google Scholar] [CrossRef]
- Abraham, J.; Rajasekharan Pillai, V. Membrane-encapsulated controlled-release urea fertilizers based on acrylamide copolymers. J. Appl. Polym. Sci. 1996, 60, 2347–2351. [Google Scholar] [CrossRef]
- Trenkel, M.E. Slow-and Controlled-Release and Stabilized Fertilizers: An Option for Enhancing Nutrient Use Efficiency in Agriculture; IFA, International Fertilizer Industry Association: Paris, France, 2010. [Google Scholar]
- Fernández-Pérez, M.; Garrido-Herrera, F.; González-Pradas, E.; Villafranca-Sánchez, M.; Flores-Céspedes, F. Lignin and ethylcellulose as polymers in controlled release formulations of urea. J. Appl. Polym. Sci. 2008, 108, 3796–3803. [Google Scholar] [CrossRef]
- Junejo, N.; Khanif, M.; Dharejo, K.; Abdu, A.; Abdul-Hamid, H. A field evaluation of coated urea with biodegradable materials and selected urease inhibitors. Afr. J. Biotechnol. 2011, 10, 19729–19736. [Google Scholar]
- Irfan, M.; Khan Niazi, M.B.; Hussain, A.; Farooq, W.; Zia, M.H. Synthesis and characterization of zinc-coated urea fertilizer. J. Plant Nutr. 2018, 41, 1625–1635. [Google Scholar] [CrossRef]
- Rindt, D.W.; Blouin, G.M.; Getsinger, J.G. Sulfur coating on nitrogen fertilizer to reduce dissolution rate. J. Agric. Food Chem. 1968, 16, 773–778. [Google Scholar] [CrossRef]
- Aulakh, M.S.; Malhi, S.S. Fertilizer nitrogen use efficiency as influenced by interactions with other nutrients. In Agriculture and the Nitrogen Cycle: Assessing the Impacts of Fertilizer Use on Food Production and the Environment; Island Press: Washington, DC, USA, 2004; pp. 181–192. [Google Scholar]
- Rietra, R.P.J.J.; Heinen, M.; Dimkpa, C.O.; Bindraban, P.S. Effects of Nutrient Antagonism and Synergism on Yield and Fertilizer Use Efficiency. Commun. Soil Sci. Plant Anal. 2017, 48, 1895–1920. [Google Scholar] [CrossRef] [Green Version]
- Jones, C.; Jacobsen, J. Plant nutrition and soil fertility. In Nutrient Management Module; Montana State University: Bozeman, Montana, 2005; pp. 1–11. [Google Scholar]
- Marschner, H. Mineral Nutrition of Higher Plants, 2nd ed.; Academic Press: Cambridge, MA, USA, 1995. [Google Scholar] [CrossRef]
- Shivay, Y.S.; Prasad, R. Zinc-coated urea improves productivity and quality of basmati rice (Oryza sativa L.) under zinc stress condition. J. Plant Nutr. 2012, 35, 928–951. [Google Scholar] [CrossRef]
- Naz, M.Y.; Sulaiman, S.A. Testing of starch-based carbohydrate polymer coatings for enhanced urea performance. J. Coat. Technol. Res. 2014, 11, 747–756. [Google Scholar] [CrossRef]
- Zafar, N.; Niazi, M.B.K.; Sher, F.; Khalid, U.; Jahan, Z.; Shah, G.A.; Zia, M. Starch and polyvinyl alcohol environment friendly biodegradable nanocomposites for slow releasing of urea fertilizers. Chem. Eng. J. Adv. 2021. [Google Scholar] [CrossRef]
- Akhter, M.; Shah, G.A.; Niazi, M.B.K.; Mir, S.; Jahan, Z.; Rashid, M.I. Novel water-soluble polymer coatings control NPK release rate, improve soil quality and maize productivity. J. Appl. Polym. Sci. 51239. [CrossRef]
- Sadaf, J.; Shah, G.A.; Shahzad, K.; Ali, N.; Shahid, M.; Ali, S.; Hussain, R.A.; Ahmed, Z.I.; Traore, B.; Ismail, I.M. Improvements in wheat productivity and soil quality can accomplish by co-application of biochars and chemical fertilizers. Sci. Total Environ. 2017, 607, 715–724. [Google Scholar] [CrossRef] [PubMed]
- Aziz, Y.; Shah, G.A.; Rashid, M.I. ZnO nanoparticles and zeolite influence soil nutrient availability but do not affect herbage nitrogen uptake from biogas slurry. Chemosphere 2019, 216, 564–575. [Google Scholar] [CrossRef] [PubMed]
- Shah, G.A.; Shah, G.M.; Rashid, M.I.; Groot, J.C.; Traore, B.; Lantinga, E.A. Bedding additives reduce ammonia emission and improve crop N uptake after soil application of solid cattle manure. J. Environ. Manag. 2018, 209, 195–204. [Google Scholar] [CrossRef] [PubMed]
- Altaf, B.A.S.; Rashid, M.I. Home field advantage describes the carbon and nitrogen dynamics of Cynodon dactylon and Phoenix dactylifera leaf litters in arid sandy soil. Appl. Soil Ecol. 2021, 157, 103728. [Google Scholar] [CrossRef]
- Houba, V.J.G.; Van Der Lee, J.J.; Novozamsky, I.; Walinga, I. Soil and Plant Analysis: A Series of Syllabi, Part 5; Wageningen Agricultural University, Department of Soil Science and Plant Nutrition: Wageningen, The Netherlands, 1989. [Google Scholar]
- Casanova, M.; Tapia, E.; Seguel, O.; Salazar, O. Direct measurement and prediction of bulk density on alluvial soils of central Chile. Chil. J. Agric. Res. 2016, 76, 105–113. [Google Scholar] [CrossRef] [Green Version]
- Brookes, P.; Landman, A.; Pruden, G.; Jenkinson, D. Chloroform fumigation and the release of soil nitrogen: A rapid direct extraction method to measure microbial biomass nitrogen in soil. Soil Biol. Biochem. 1985, 17, 837–842. [Google Scholar] [CrossRef]
- Vance, E.D.; Brookes, P.C.; Jenkinson, D.S. An extraction method for measuring soil microbial biomass C. Soil Biol. Biochem. 1987, 19, 703–707. [Google Scholar] [CrossRef]
- Jenkinson, D.S.; Brookes, P.C.; Powlson, D.S. Measuring soil microbial biomass. Soil Biol. Biochem. 2004, 36, 5–7. [Google Scholar] [CrossRef]
- Joergensen, R.G.; Mueller, T. The fumigation-extraction method to estimate soil microbial biomass: Calibration of the kEN value. Soil Biol. Biochem. 1996, 28, 33–37. [Google Scholar] [CrossRef]
- Bementa, E.; Jothi Rajan, M.A.; Gnanadass, E.S. Effect of prolonged duration of gelatinization in starch and incorporation with potassium iodide on the enhancement of ionic conductivity. Polym. Plast. Technol. Eng. 2017, 56, 1632–1645. [Google Scholar] [CrossRef]
- Singh, R.; Jadhav, N.A.; Majumder, S.; Bhattacharya, B.; Singh, P.K. Novel biopolymer gel electrolyte for dye-sensitized solar cell application. Carbohydr. Polym. 2013, 91, 682–685. [Google Scholar] [CrossRef] [PubMed]
- Eghbalifam, N.; Shojaosadati, S.A.; Hashemi-Najafabadi, S.; Khorasani, A.C. Synthesis and characterization of antimicrobial wound dressing material based on silver nanoparticles loaded gum Arabic nanofibers. Int. J. Biol. Macromol. 2020, 155, 119–130. [Google Scholar] [CrossRef]
- Dewettinck, K.; Messens, W.; Deroo, L.; Huyghebaert, A. Agglomeration tendency during top-spray fluidized bed coating with gelatin and starch hydrolysate. LWT Food Sci. Technol. 1999, 32, 102–106. [Google Scholar] [CrossRef]
- Yang, M.; Zhu, X.; Bai, Y.; Sun, D.; Zou, H.; Fang, Y.; Zhang, Y. Coated controlled-release urea creates a win-win scenario for producing more staple grains and resolving N loss dilemma worldwide. J. Clean. Prod. 2021, 288, 125660. [Google Scholar] [CrossRef]
- Geng, J.; Ma, Q.; Zhang, M.; Li, C.; Liu, Z.; Lyu, X.; Zheng, W. Synchronized relationships between nitrogen release of controlled release nitrogen fertilizers and nitrogen requirements of cotton. Field Crop. Res. 2015, 184, 9–16. [Google Scholar] [CrossRef]
- Chen, L.; Liu, X.; Hua, Z.; Xue, H.; Mei, S.; Wang, P.; Wang, S. Comparison of nitrogen loss weight in ammonia volatilization, runoff, and leaching between common and slow-release fertilizer in paddy field. Water Air Soil Pollut. 2021, 232, 132. [Google Scholar] [CrossRef]
- Ma, Y.; Jones, D.L.; Wang, J.; Cardenas, L.M.; Chadwick, D.R. Relative efficacy and stability of biological and synthetic nitrification inhibitors in a highly nitrifying soil: Evidence of apparent nitrification inhibition by linoleic acid and linolenic acid. Eur. J. Soil Sci. 2021. [Google Scholar] [CrossRef]
- Patel, S.; Goyal, A. Applications of natural polymer gum arabic: A review. Int. J. Food Prop. 2015, 18, 986–998. [Google Scholar] [CrossRef]
- Zhu, S.; Vivanco, J.M.; Manter, D.K. Nitrogen fertilizer rate affects root exudation, the rhizosphere microbiome and nitrogen-use-efficiency of maize. Appl. Soil Ecol. 2016, 107, 324–333. [Google Scholar] [CrossRef] [Green Version]
- Steinauer, K.; Chatzinotas, A.; Eisenhauer, N. Root exudate cocktails: The link between plant diversity and soil microorganisms? Ecol. Evol. 2016, 6, 7387–7396. [Google Scholar] [CrossRef] [Green Version]
- Eisenhauer, N.; Beßler, H.; Engels, C.; Gleixner, G.; Habekost, M.; Milcu, A.; Partsch, S.; Sabais, A.; Scherber, C.; Steinbeiss, S. Plant diversity effects on soil microorganisms support the singular hypothesis. Ecology 2010, 91, 485–496. [Google Scholar] [CrossRef]
- Kuzyakov, Y.; Blagodatskaya, E. Microbial hotspots and hot moments in soil: Concept & review. Soil Biol. Biochem. 2015, 83, 184–199. [Google Scholar] [CrossRef]
- Montaño, N.M.; García-Oliva, F.; Jaramillo, V.J. Dissolved organic carbon affects soil microbial activity and nitrogen dynamics in a Mexican tropical deciduous forest. Plant Soil 2007, 295, 265–277. [Google Scholar] [CrossRef]
- Li, Y.; Nie, C.; Liu, Y.; Du, W.; He, P. Soil microbial community composition closely associates with specific enzyme activities and soil carbon chemistry in a long-term nitrogen fertilized grassland. Sci. Total Environ. 2019, 654, 264–274. [Google Scholar] [CrossRef]
- Gunes, A.; Alpaslan, M.; Inal, A. Critical nutrient concentrations and antagonistic and synergistic relationships among the nutrients of NFT-grown young tomato plants. J. Plant Nutr. 1998, 21, 2035–2047. [Google Scholar] [CrossRef]
- Uçgun, K.; Altindal, M. Effects of increasing doses of nitrogen, phosphorus, and potassium on the uptake of other nutrients in sweet cherry trees. Commun. Soil Sci. Plant Anal. 2021, 1248–1255. [Google Scholar] [CrossRef]
- Hamnér, K.; Weih, M.; Eriksson, J.; Kirchmann, H. Influence of nitrogen supply on macro- and micronutrient accumulation during growth of winter wheat. Field Crop. Res. 2017, 213, 118–129. [Google Scholar] [CrossRef]
- Hou, W.; Xue, X.; Li, X.; Khan, M.R.; Yan, J.; Ren, T.; Cong, R.; Lu, J. Interactive effects of nitrogen and potassium on: Grain yield, nitrogen uptake and nitrogen use efficiency of rice in low potassium fertility soil in China. Field Crop. Res. 2019, 236, 14–23. [Google Scholar] [CrossRef]
- Duncan, E.G.; O’Sullivan, C.A.; Roper, M.M.; Biggs, J.S.; Peoples, M.B. Influence of co-application of nitrogen with phosphorus, potassium and sulphur on the apparent efficiency of nitrogen fertiliser use, grain yield and protein content of wheat: Review. Field Crop. Res. 2018, 226, 56–65. [Google Scholar] [CrossRef]
- Zhang, J.; Li, J.; Geng, G.; Hu, W.; Ren, T.; Cong, R.; Li, X.; Lu, J. Combined application of nitrogen and potassium reduces seed yield loss of oilseed rape caused by Sclerotinia stem rot disease. Agron. J. 2020, 112, 5143–5157. [Google Scholar] [CrossRef]
Publisher’s Note: MDPI stays neutral with regard to jurisdictional claims in published maps and institutional affiliations. |
© 2021 by the authors. Licensee MDPI, Basel, Switzerland. This article is an open access article distributed under the terms and conditions of the Creative Commons Attribution (CC BY) license (https://creativecommons.org/licenses/by/4.0/).